what characteristics of bullying, bullying victims, and ... · what characteristics of bullying,...
TRANSCRIPT
I S S U E S & A N S W E R S R E L 2 0 1 0 – N o . 0 9 2
At Education Development Center, Inc.
What characteristics of bullying, bullying victims, and schools are associated with increased reporting of bullying to school of ficials?

I S S U E S&ANSWERS R E L 2 0 1 0 – N o . 0 9 2
At Education Development Center, Inc.
What characteristics of bullying, bullying victims, and schools are
associated with increased reporting of bullying to school officials?
August 2010
Prepared by
Anthony PetrosinoLearning Innovations at WestEd
Sarah GuckenburgLearning Innovations at WestEd
Jill DeVoeAmerican Institutes of Research
Thomas HansonWestEd and Regional Educational Laboratory West
WA
OR
ID
MT
NV
CA
UT
AZ
WY
ND
SD
NE
KS CO
NM
TX
OK
CO
AR
LA
MS AL GA
SC
NC
VA WV
KY
TN
PA
NY
FL
AK
MN
WI
IA
IL IN
MI
OH
VT
NH
ME
CT RI
MA
MO
VI
PR At Education Development
Center, Inc.
Issues & Answers is an ongoing series of reports from short-term Fast Response Projects conducted by the regional educational laboratories on current education issues of importance at local, state, and regional levels. Fast Response Project topics change to reflect new issues, as identified through lab outreach and requests for assistance from policymakers and educators at state and local levels and from communities, businesses, parents, families, and youth. All Issues & Answers reports meet Institute of Education Sciences standards for scientifically valid research.
August 2010
This report was prepared for the Institute of Education Sciences (IES) under Contract ED-06-CO-0025 by Regional Educational Laboratory Northeast administered by Education Development Center, Inc. The content of the publication does not necessarily reflect the views or policies of IES or the U.S. Department of Education nor does mention of trade names, commercial products, or organizations imply endorsement by the U.S. Government.
This report is in the public domain. While permission to reprint this publication is not necessary, it should be cited as:
Petrosino, A., Guckenburg, S., DeVoe, J., and Hanson, T. (2010). What characteristics of bullying, bullying victims, and schools are associated with increased reporting of bullying to school officials? (Issues & Answers Report, REL 2010–No. 092). Washington, DC: U.S. Department of Education, Institute of Education Sciences, National Center for Education Evaluation and Regional Assistance, Regional Educational Laboratory Northeast and Islands. Retrieved from http://ies.ed.gov/ncee/ edlabs.
This report is available on the regional educational laboratory web site at http://ies.ed.gov/ncee/edlabs.
Summary REL 2010–No. 092
What characteristics of bullying, bullying victims, and schools are associated with increased reporting of bullying to school officials?
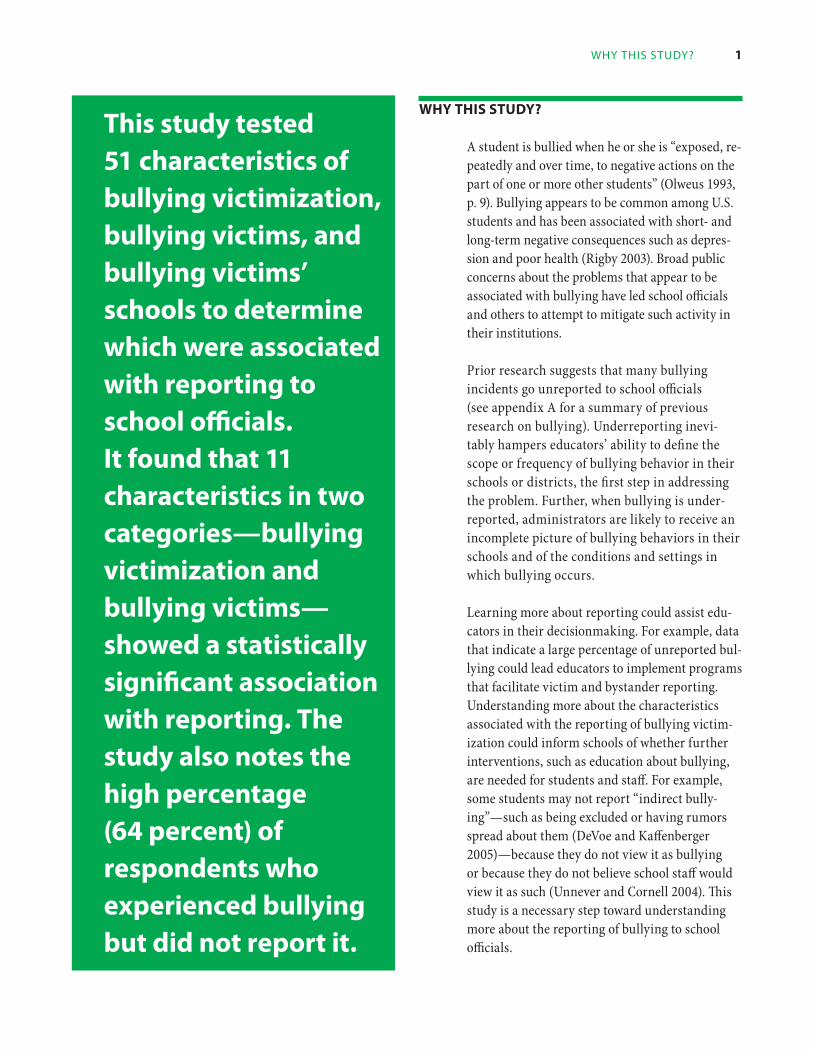
This study tested 51 characteristics of bullying victimization, bullying victims, and bullying victims’ schools to deter-mine which were associated with report-ing to school officials. It found that 11 characteristics in two categories—bully-ing victimization and bullying victims—showed a statistically significant asso-ciation with reporting. The study also notes the high percentage (64 percent) of respondents who experienced bullying but did not report it.
Bullying appears to be frequent among U.S. students and has been associated with several short- and long-term negative consequences such as depression and poor health. Research suggests that many bullying incidents are not reported to school officials, which ham-pers educators’ ability to define the scope or frequency of bullying behavior in their schools or districts, the first step in addressing the problem. Further, when bullying is under-reported, administrators are likely to receive an incomplete picture of bullying behaviors in their schools and of the conditions and set-tings in which bullying occurs.
This study used nationally representative data from the 2007 National Crime Victimization
Survey School Crime Supplement, a biennial survey of children ages 12–18 who attended school in the prior academic year, to examine which of 51 characteristics of bullying victim-ization, bullying victims, and bullying victims’ schools are associated with increased report-ing of bullying to a teacher or other adult at the school. The survey data show that 36 percent of bullying victims reported their vic-timization to a teacher or other adult at their school and that 64 percent of students did not.
Eleven characteristics were found to have a statistically significant association with re-porting of bullying victimization, specifically:
• Eight characteristics of bullying victim-ization were statistically associated with increased reporting: bullying involving injury, physical threats, destruction of property, actual physical contact (pushing, shoving, and the like), greater frequency, multiple types, more than one location, and at least one occurrence on a school bus.
Seven characteristics did not appear to be associated with reporting: bullying that involved making fun of the victim or call-ing the victim names, excluding the vic-tim, spreading rumors about the victim,
ii Summary
and forcing the victim to do things he or she did not want to do, and bullying that occurred in the school building, on school grounds, or somewhere else.
• Three characteristics of bullying victims were found to have statistically significant relationships with reporting. Grade level was significantly and negatively associated with reporting, and being involved in a fight during the school year and being afraid of attack and avoiding certain school areas or activities were significantly and positively associated with reporting.
Victim characteristics that did not appear to be associated with reporting included gender, race/ethnicity, household region, and academic performance.
• No characteristic of bullying victims’ schools—including general characteristics, school culture, and school security and safety—was found to have a statistically significant association with reporting.
The results should be interpreted as exploratory associations between the reporting of bullying and various student and school characteristics and not as confirmations of causal relationships.
Regional Education Laboratory (REL) Northeast and Islands conducted this study of the conditions under which bullying victimization is reported in response to the concerns about bullying expressed by Parent Information and Resource Centers and other stakeholders in the REL Northeast and Islands Region and elsewhere.
Further research could be undertaken to understand why bullying is or is not reported and to learn more about the aftermath of reporting, including school responses to reports and whether victims who report bullying suffer reprisals. Such projects could require entirely new data collection efforts or the addition of items to existing student surveys such as the National Crime Victimization Survey School Crime Supplement.
August 2010
Table of conTenTs iii
Table of conTenTs
Why this study? 1Regional relevance 2National relevance 3Research questions 4
What the study found 6Characteristics of bullying victimization 6Characteristics of bullying victims 8Characteristics of bullying victims’ schools 10Summary of findings 15
Directions for future research 15
Appendix A Previous research on bullying 17
Appendix B Data source and methodology 19
Notes 34
References 35
Box
1 Data source and methodology 4
Figures
B1 Point-biserial correlation between the student fear of attack and avoidance of school areas and activities scale and reporting 30
B2 Point-biserial correlation between the school crime and drug problem scale and reporting 30
Tables
1 Relationship between bullying characteristics and reporting of bullying, as indicated by students ages 12–18 during the 2007 school year 7
2 Relationship between sociodemographic characteristics and reporting of bullying, as indicated by students ages 12–18 during the 2007 school year 9
3 Relationship between student school-related experience and perception and reporting of bullying, as indicated by students ages 12–18 during the 2007 school year 11
4 Relationship between general school characteristics and reporting of bullying, as indicated by students ages 12–18 during the 2007 school year 12
5 Relationship between school culture characteristics and reporting of bullying, as indicated by students ages 12–18 during the 2007 school year 13
6 Relationship between school safety and security characteristics and reporting of bullying, as indicated by students ages 12–18 during the 2007 school year 14
7 Characteristics of bullying victimization and bullying victims that were statistically significant in analyses 15
iv Table of conTenTS
B1 Bullying victimization items from the 2007 School Crime Supplement to the National Crime Victimization Survey used, created, or recoded 20
B2 Bullying victim items from the 2007 National Crime Victimization Survey and the School Crime Supplement used, created, or recoded 21
B3 Schools of bullying victim items from the 2007 School Crime Supplement to the National Crime Victimization Survey used, created, or recoded 22
B4 Unused items from the 2007 School Crime Supplement to the National Crime Victimization Survey 23
B6 Relationship between bullying characteristics and reporting of bullying, as indicated by students ages 12–18
B7 Kuder-Richardson coefficient of reliability for the student fear of attack and avoidance of school areas and
B5 Survey items with less than 95 percent response rate 26
during the 2007 school year, without proxy interviews 27
activities scale 30
B8 Kuder-Richardson coefficient of reliability for the school crime and drug problem scale 31
1 Why ThiS STudy?
This study tested 51 characteristics of bullying victimization, bullying victims, and bullying victims’ schools to determine which were associated with reporting to school officials. It found that 11 characteristics in two categories—bullying victimization and bullying victims— showed a statistically significant association with reporting. The study also notes the high percentage (64 percent) of respondents who experienced bullying but did not report it.
Why ThIs sTudy?
A student is bullied when he or she is “exposed, repeatedly and over time, to negative actions on the part of one or more other students” (Olweus 1993, p. 9). Bullying appears to be common among U.S. students and has been associated with short- and long-term negative consequences such as depression and poor health (Rigby 2003). Broad public concerns about the problems that appear to be associated with bullying have led school officials and others to attempt to mitigate such activity in their institutions.
Prior research suggests that many bullying incidents go unreported to school officials (see appendix A for a summary of previous research on bullying). Underreporting inevitably hampers educators’ ability to define the scope or frequency of bullying behavior in their schools or districts, the first step in addressing the problem. Further, when bullying is under-reported, administrators are likely to receive an incomplete picture of bullying behaviors in their schools and of the conditions and settings in which bullying occurs.
Learning more about reporting could assist educators in their decisionmaking. For example, data that indicate a large percentage of unreported bullying could lead educators to implement programs that facilitate victim and bystander reporting. Understanding more about the characteristics associated with the reporting of bullying victimization could inform schools of whether further interventions, such as education about bullying, are needed for students and staff. For example, some students may not report “indirect bullying”—such as being excluded or having rumors spread about them (DeVoe and Kaffenberger 2005)—because they do not view it as bullying or because they do not believe school staff would view it as such (Unnever and Cornell 2004). This study is a necessary step toward understanding more about the reporting of bullying to school officials.
2 characTeriSTicS of bullying, bullying vicTimS, and SchoolS aSSociaTed WiTh reporTing of bullying
Regional relevance
The implication of bullying as a factor in the suicides of students in the Northeast and Islands Region has drawn further attention to the problem of bullying in schools (see, for example, Associated Press 2009; Halligan 2005; King and Hendricks 2010; Marshall 2010; Vaznis 2009).
According to estimates from the states participating in the Centers for Disease Control and Prevention’s Youth Risk Behavior Survey in 2007, bullying affects a substantial share of the region’s students—from 17 percent in Vermont to 22 percent in Massachusetts to 29 percent in Connecticut. In addition, a recent school district survey in Newburyport, Massachusetts, found that 9–24 percent of students in grades 5 and 6 were victims of “frequent and persistent bullying” (Hendricks 2008). A 2007 statewide survey of elementary through high school girls in Vermont found that 17–30 percent self-reported victimization by bullies who used the Internet, cell phones, or other electronic means to inflict pain or embarrassment, a phenomenon known as cyber-bullying (Larkin 2007).
Many parent-based and other youth advocacy groups have been outspoken about the need to address bullying, and state legislatures have also taken considerable action in recent years. A majority of states have passed anti-bullying laws (Associated Press 2009), most of which mandate that schools or districts develop conduct codes that specifi
cally prohibit bullying, implement Within the northeast
and Islands Region,
antibullying laws have
been passed in new
hampshire (2000),
connecticut (2002),
Rhode Island (2003),
Vermont (2004), Maine
(2006), Puerto Rico (2008),
and Massachusetts
(2010) and are under
consideration in new york
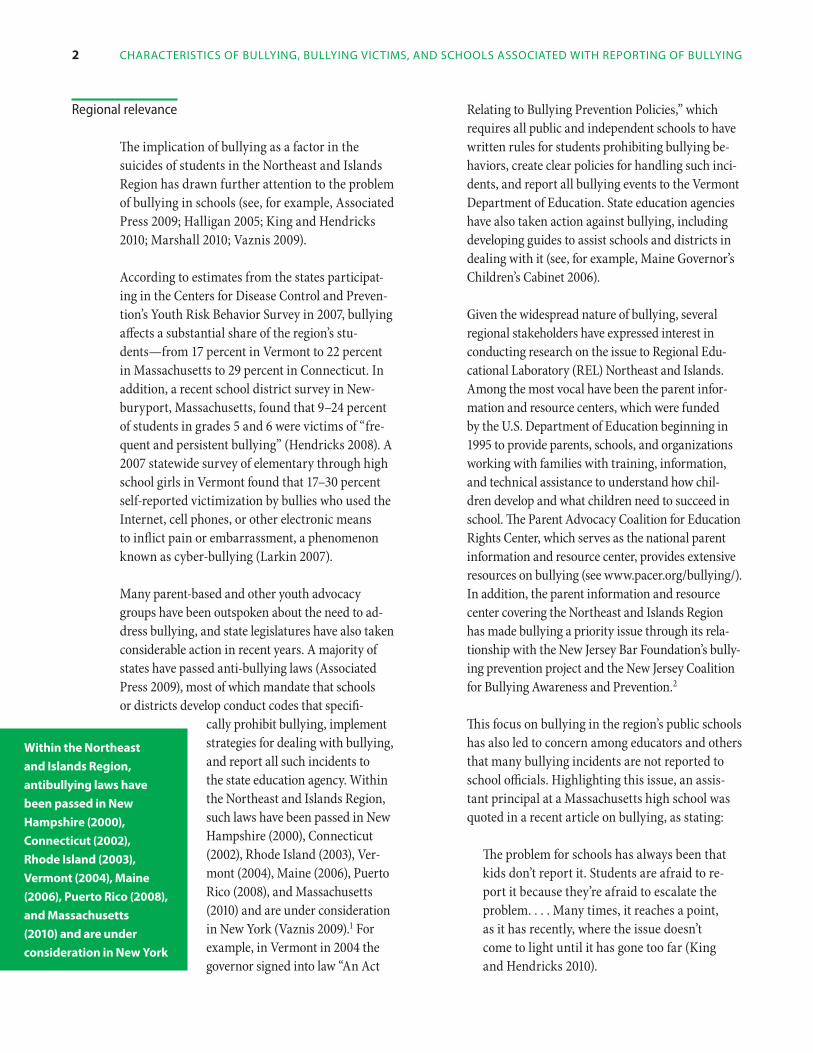
strategies for dealing with bullying, and report all such incidents to the state education agency. Within the Northeast and Islands Region, such laws have been passed in New Hampshire (2000), Connecticut (2002), Rhode Island (2003), Ver-mont (2004), Maine (2006), Puerto Rico (2008), and Massachusetts (2010) and are under consideration in New York (Vaznis 2009).1 For example, in Vermont in 2004 the governor signed into law “An Act
Relating to Bullying Prevention Policies,” which requires all public and independent schools to have written rules for students prohibiting bullying behaviors, create clear policies for handling such incidents, and report all bullying events to the Vermont Department of Education. State education agencies have also taken action against bullying, including developing guides to assist schools and districts in dealing with it (see, for example, Maine Governor’s Children’s Cabinet 2006).
Given the widespread nature of bullying, several regional stakeholders have expressed interest in conducting research on the issue to Regional Educational Laboratory (REL) Northeast and Islands. Among the most vocal have been the parent information and resource centers, which were funded by the U.S. Department of Education beginning in 1995 to provide parents, schools, and organizations working with families with training, information, and technical assistance to understand how children develop and what children need to succeed in school. The Parent Advocacy Coalition for Education Rights Center, which serves as the national parent information and resource center, provides extensive resources on bullying (see www.pacer.org/bullying/). In addition, the parent information and resource center covering the Northeast and Islands Region has made bullying a priority issue through its relationship with the New Jersey Bar Foundation’s bullying prevention project and the New Jersey Coalition for Bullying Awareness and Prevention.2
This focus on bullying in the region’s public schools has also led to concern among educators and others that many bullying incidents are not reported to school officials. Highlighting this issue, an assistant principal at a Massachusetts high school was quoted in a recent article on bullying, as stating:
The problem for schools has always been that kids don’t report it. Students are afraid to report it because they’re afraid to escalate the problem. . . . Many times, it reaches a point, as it has recently, where the issue doesn’t come to light until it has gone too far (King and Hendricks 2010).
Why ThiS STudy? 3
Because most bullying occurs away from school officials, they depend on victim, bystander, and parent reports for incidents to come to their attention (Kazdin and Rotella 2009). The Massachusetts report, Direct from the Field: A Guide to Bullying Prevention, also underscores the concern about reporting:
The majority of bullying incidents happen outside of the eyes and ears of school personnel—on buses, on sidewalks on the way home, at sporting events, and in bathrooms and locker rooms. Complicity among young people not to share knowledge of incidents of bullying with adults is common, often due to fear of retaliation (Parker-Roerdon, Rudewick, and Gorton 2007, p. 6).
The regional parent information and resource center and United We Stand, a parent advocacy group for disabled students, also expressed considerable interest in the issue. The director of the regional center stated, “This is a very important issue for us. . . . Understand[ing] the most effective ways to encourage students to report bullying and harassment rather than seeing it as ‘tattletaling’ is critical.”3 The executive director of United We Stand, who is also a member of the REL Northeast and Islands Governing Board, encouraged the proposed project and stated that the findings would be of interest to her stakeholders.
National relevance
Maintaining safe schools is also a priority of the U.S. government, as underscored by federal legislation. For example, Title IV of the No Child Left Behind Act specifies funding for state education agencies to support school safety in the country’s schools. The law (20 USC 7131, Section 4121) reads:
(a) PROGRAM AUTHORIZED.—From funds made available to carry out this subpart under section 4003(2), the Secretary, in consultation with the Secretary of Health and Human Services, the Director of the Office of National Drug Control Policy, and
the Attorney General, shall carry out pro-grams to prevent the illegal use of drugs and violence among, and promote safety and discipline for, students. [emphasis added]
In addition, President Barack Obama, in his 2009 “Back to School” speech, stated:
Maybe you’ll decide to stand up for kids who are being teased or bullied because of who they are or how they look, because you believe, like I do, that all kids deserve a safe environment to study and learn (The White House 2009).
The National Safe Schools Partnership, a coalition of nearly 30 education, health, and other organizations promoting federal legislation to advance safe schools, has described bullying and harassment as a “prevalent and profound” problem (2007, p. 1).4
National estimates of bullying vary, but Dinkes, Kemp, and Baum (2009) found that some 32 percent of school children ages 12–18 self-reported having been bullied during the previous school year.
And although the relationship between bullying and school performance is complex (see, for example, Pepler and Craig 2008), the widespread nature of bullying counters emphasis on school safety and discipline by the U.S. Department of Education and the No Child Left Behind Act and may be a roadblock to some students’ adequate academic achievement (Srabstein and Piazza 2008; Glew et al. 2005; Juvonen, Graham, and Schuster 2003). A wide range of stakeholders outside education have also taken up the issue, including the American Academy of Pediatrics (Klass 2009), the U.S. Department of Justice’s Office of Community Oriented Policing Services (Sampson 2004), and the Canadian Psychological Association (2009).
although the
relationship between
bullying and school
performance is complex,
the widespread nature
of bullying counters
emphasis on school
safety and discipline by
the u.s. department of
education and the no
child left behind act and
may be a roadblock to
some students’ adequate
academic achievement
4 characTeriSTicS of bullying, bullying vicTimS, and SchoolS aSSociaTed WiTh reporTing of bullying
The national attention on bullying includes concern about whether incidents get reported to school officials. Many students do not report that they have been bullied (Unnever and Cornell 2004), and officials are unable to take action to address individual incidents to protect victims (Pepler and Craig 2008). Moreover, educators are often unaware of the scope of the bullying problem, hindering efforts to base policies and programs on sound data (Unnever and Cornell 2004). Concern about reporting is evidenced by the number of school districts that have moved to an anonymous hotline reporting system, hoping that such a mechanism would remove student fear of reprisal and encourage more reporting (Teicher 2006; Peterson 2009).
Research questions
Based on bullying victims’ reports of whether their victimization was reported to school officials and based on REL Northeast and Islands
stakeholders’ interest in understanding under-reporting of bullying, the following research questions were addressed:
• What characteristics of bullying victimization are associated with increased reporting of bullying to a teacher or other adult at the school?
• What characteristics of bullying victims are associated with increased reporting of bullying to a teacher or other adult at the school?
• What characteristics of bullying victims’ schools are associated with increased reporting of bullying to a teacher or other adult at the school?
Data sources and methodology are described briefly in box 1 and detailed in appendix B. The study was informed by a review of the current literature (see appendix A).
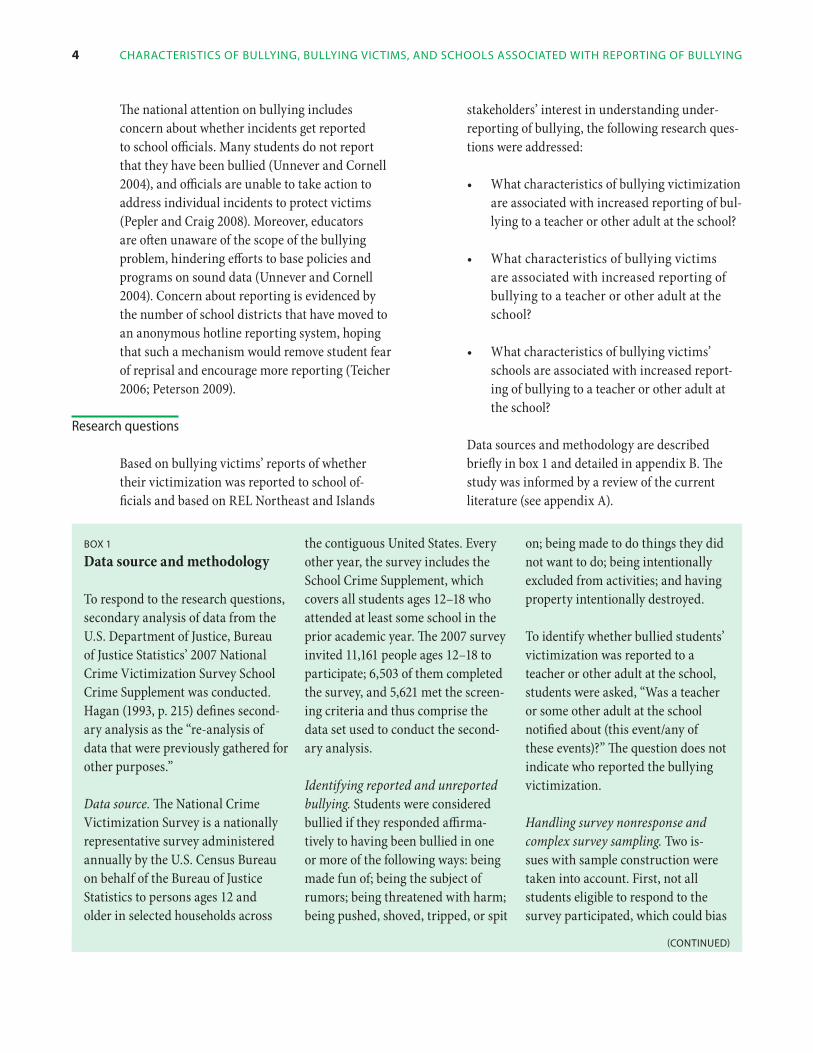
box 1
Data source and methodology
To respond to the research questions, secondary analysis of data from the U.S. Department of Justice, Bureau of Justice Statistics’ 2007 National Crime Victimization Survey School Crime Supplement was conducted. Hagan (1993, p. 215) defines secondary analysis as the “re-analysis of data that were previously gathered for other purposes.”
Data source. The National Crime Victimization Survey is a nationally representative survey administered annually by the U.S. Census Bureau on behalf of the Bureau of Justice Statistics to persons ages 12 and older in selected households across
the contiguous United States. Every other year, the survey includes the School Crime Supplement, which covers all students ages 12–18 who attended at least some school in the prior academic year. The 2007 survey invited 11,161 people ages 12–18 to participate; 6,503 of them completed the survey, and 5,621 met the screening criteria and thus comprise the data set used to conduct the secondary analysis.
Identifying reported and unreported bullying. Students were considered bullied if they responded affirmatively to having been bullied in one or more of the following ways: being made fun of; being the subject of rumors; being threatened with harm; being pushed, shoved, tripped, or spit
on; being made to do things they did not want to do; being intentionally excluded from activities; and having property intentionally destroyed.
To identify whether bullied students’ victimization was reported to a teacher or other adult at the school, students were asked, “Was a teacher or some other adult at the school notified about (this event/any of these events)?” The question does not indicate who reported the bullying victimization.
Handling survey nonresponse and complex survey sampling. Two issues with sample construction were taken into account. First, not all students eligible to respond to the survey participated, which could bias
(conTinued)
5
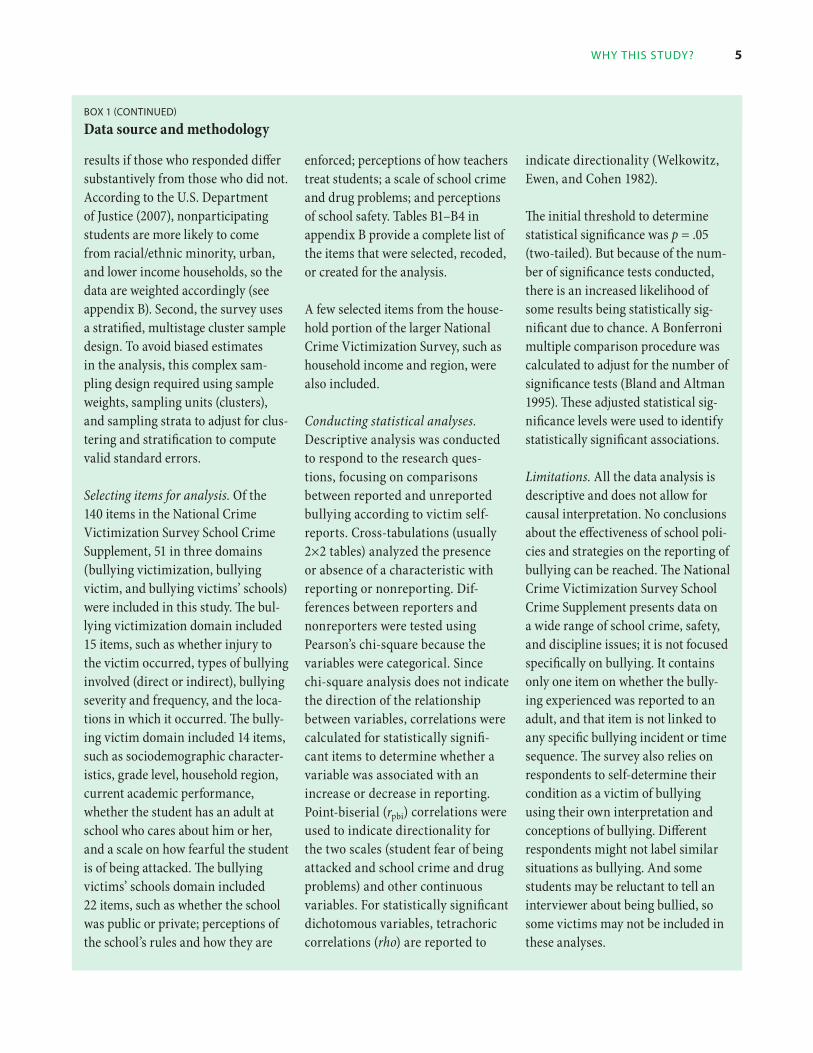
box 1 (conTinued)
Data source and methodology
results if those who responded differ substantively from those who did not. According to the U.S. Department of Justice (2007), nonparticipating students are more likely to come from racial/ethnic minority, urban, and lower income households, so the data are weighted accordingly (see appendix B). Second, the survey uses a stratified, multistage cluster sample design. To avoid biased estimates in the analysis, this complex sampling design required using sample weights, sampling units (clusters), and sampling strata to adjust for clustering and stratification to compute valid standard errors.
Selecting items for analysis. Of the 140 items in the National Crime Victimization Survey School Crime Supplement, 51 in three domains (bullying victimization, bullying victim, and bullying victims’ schools) were included in this study. The bullying victimization domain included 15 items, such as whether injury to the victim occurred, types of bullying involved (direct or indirect), bullying severity and frequency, and the locations in which it occurred. The bullying victim domain included 14 items, such as sociodemographic characteristics, grade level, household region, current academic performance, whether the student has an adult at school who cares about him or her, and a scale on how fearful the student is of being attacked. The bullying victims’ schools domain included 22 items, such as whether the school was public or private; perceptions of the school’s rules and how they are
enforced; perceptions of how teachers treat students; a scale of school crime and drug problems; and perceptions of school safety. Tables B1–B4 in appendix B provide a complete list of the items that were selected, recoded, or created for the analysis.
A few selected items from the household portion of the larger National Crime Victimization Survey, such as household income and region, were also included.
Conducting statistical analyses. Descriptive analysis was conducted to respond to the research questions, focusing on comparisons between reported and unreported bullying according to victim self-reports. Cross-tabulations (usually 2×2 tables) analyzed the presence or absence of a characteristic with reporting or nonreporting. Differences between reporters and nonreporters were tested using Pearson’s chi-square because the variables were categorical. Since chi-square analysis does not indicate the direction of the relationship between variables, correlations were calculated for statistically significant items to determine whether a variable was associated with an increase or decrease in reporting. Point-biserial (rpbi) correlations were used to indicate directionality for the two scales (student fear of being attacked and school crime and drug problems) and other continuous variables. For statistically significant dichotomous variables, tetrachoric correlations (rho) are reported to
Why ThiS STudy?
indicate directionality (Welkowitz, Ewen, and Cohen 1982).
The initial threshold to determine statistical significance was p = .05 (two-tailed). But because of the number of significance tests conducted, there is an increased likelihood of some results being statistically significant due to chance. A Bonferroni multiple comparison procedure was calculated to adjust for the number of significance tests (Bland and Altman 1995). These adjusted statistical significance levels were used to identify statistically significant associations.
Limitations. All the data analysis is descriptive and does not allow for causal interpretation. No conclusions about the effectiveness of school policies and strategies on the reporting of bullying can be reached. The National Crime Victimization Survey School Crime Supplement presents data on a wide range of school crime, safety, and discipline issues; it is not focused specifically on bullying. It contains only one item on whether the bullying experienced was reported to an adult, and that item is not linked to any specific bullying incident or time sequence. The survey also relies on respondents to self-determine their condition as a victim of bullying using their own interpretation and conceptions of bullying. Different respondents might not label similar situations as bullying. And some students may be reluctant to tell an interviewer about being bullied, so some victims may not be included in these analyses.
6 characTeriSTicS of bullying, bullying vicTimS, and SchoolS aSSociaTed WiTh reporTing of bullying
WhaT The sTudy found
Findings are organized into three sections (characteristics of bullying victimization, characteristics of bullying victims, and characteristics of bullying victims’ schools) to respond directly to the three research questions. The survey data show that 36 percent of bullying victims reported their victimization to a teacher or other adult at their school and that 64 percent of students did not.
Characteristics of bullying victimization
This section presents the analysis of the relationship between characteristics of bullying victimization and reporting. The bullying characteristics included in the analysis were:
• Whether the bullying caused injury to the victim.
• The type of bullying that occurred (threats, destroyed property, physical violence, victim being made fun of or called names, victim being excluded, victim having rumors spread about him or her, and victim being made to do things he or she did not want to do).
• How many types of bullying the victim experienced.
• The frequency of the bullying.
• The location where the bullying occurred (school building, outside school grounds, school bus, and somewhere else).
• The number of different locations where the bullying took place.
Eight characteristics showed a statistically significant relationship with reporting; seven did not. Table 1 provides data on overall reporting of bullying and on reporting across the six types of
bullying captured by the National Crime Victimization Survey School Crime Supplement. The categories are not mutually exclusive, as bullying victimization over the year may include several types. The reporting item is not linked to any specific incident or point in time, so these data represent reporting of bullying that involves, at the very least, that particular type.
The severity of victimization showed a statistically significant and positive association with reporting, meaning that the presence of this type of bullying was associated with increased reporting (tetrachoric rho = .33, p < .001). When bullying resulted in physical injury, 60.5 percent of bullying victims indicated that their victimization was reported. Bullying that involved a physical threat was reported 55.3 percent of the time, bullying that involved destroyed property was reported 51.3 percent of the time, and bullying that involved being physically touched (pushed, shoved, or tripped) was reported 46.0 percent of the time. Such direct types of bullying (DeVoe and Kaffenberger 2005) also showed a statistically significant and positive association with reporting, meaning that the presence of each of these types of bullying was associated with increased reporting (tetrachoric rho = .35 for threats, .23 for destroyed property, and .25 for being pushed, shoved, or tripped).
The number of types of bullying experienced and reporting showed a statistically significant and positive relationship, meaning that a higher number of types of bullying experienced was associated with increased reporting (rpbi = .20, p < .001). Reporting rates ranged from 25.7 percent for students who indicated that they were victims of one type of bullying to 59.4 percent for students who indicated that they were victims of six types of bullying.
The relationship between bullying frequency and reporting was also statistically significant and positive, meaning that increased frequency of bullying was associated with increased reporting (rpbi =.19, p < .001). For example, 44.9 percent of victims who were bullied once or twice a week said the bullying was reported to school officials, and
eight characteristics of
bullying victimization
showed a statistically
significant relationship
with reporting;
seven did not
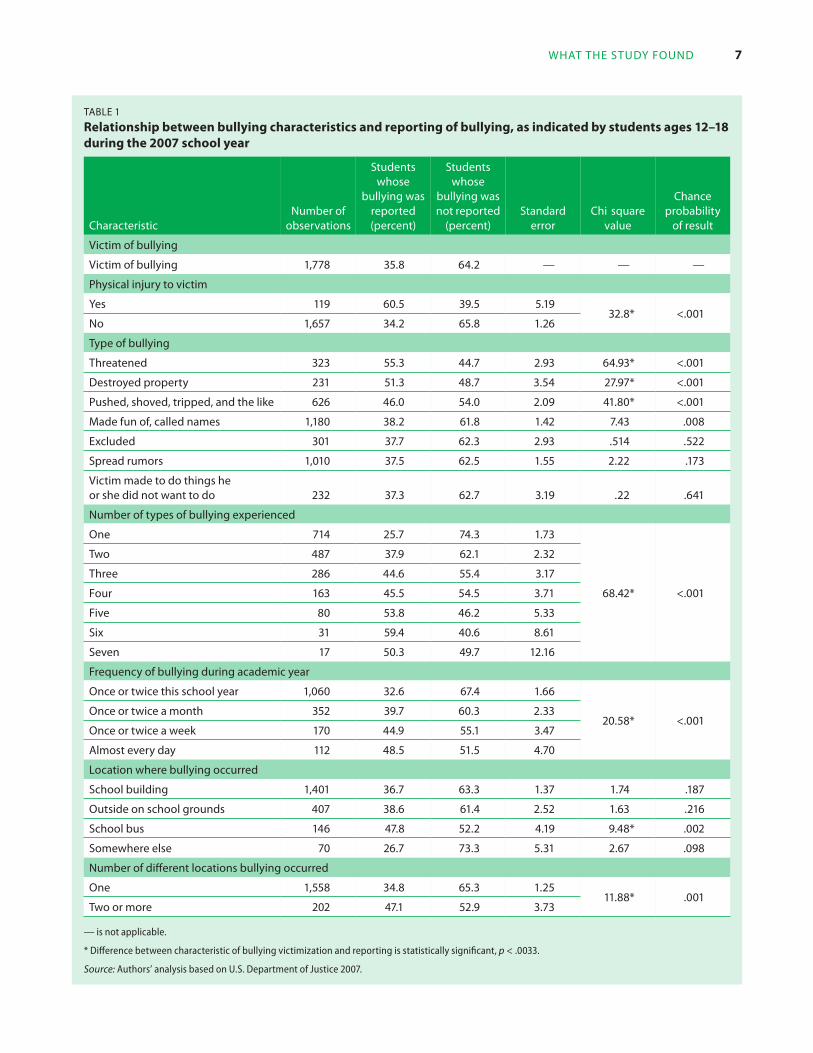
Table 1
Relationship between bullying characteristics and reporting of bullyingduring the 2007 school year
, as indicated by students ages 12–18
Students Students whose whose
bullying was bullying was number of reported not reported
characteristic observations (percent) (percent) Standard
error -chi square
value
chance probability
of result
victim of bullying
victim of bullying 1,778 35.8 64.2 — — —
physical injury to victim
yes 119 60.5 39.5 5.19 32.8* <.001
no 1,657 34.2 65.8 1.26
Type of bullying
Threatened 323 55.3 44.7 2.93 64.93* <.001
destroyed property 231 51.3 48.7 3.54 27.97* <.001
pushed, shoved, tripped, and the like 626 46.0 54.0 2.09 41.80* <.001
made fun of, called names 1,180 38.2 61.8 1.42 7.43 .008
excluded 301 37.7 62.3 2.93 .514 .522
Spread rumors 1,010 37.5 62.5 1.55 2.22 .173
victim made to do things he or she did not want to do 232 37.3 62.7 3.19 .22 .641
number of types of bullying experienced
one 714 25.7 74.3 1.73
68.42* <.001
Two 487 37.9 62.1 2.32
Three 286 44.6 55.4 3.17
four 163 45.5 54.5 3.71
five 80 53.8 46.2 5.33
Six 31 59.4 40.6 8.61
Seven 17 50.3 49.7 12.16
frequency of bullying during academic year
once or twice this school year 1,060 32.6 67.4 1.66
20.58* <.001 once or twice a month 352 39.7 60.3 2.33
once or twice a week 170 44.9 55.1 3.47
almost every day 112 48.5 51.5 4.70
location where bullying occurred
School building 1,401 36.7 63.3 1.37 1.74 .187
outside on school grounds 407 38.6 61.4 2.52 1.63 .216
School bus 146 47.8 52.2 4.19 9.48* .002
Somewhere else 70 26.7 73.3 5.31 2.67 .098
number of different locations bullying occurred
one 1,558 34.8 65.3 1.25 11.88* .001
Two or more 202 47.1 52.9 3.73
— is not applicable.
* Difference between characteristic of bullying victimization and reporting is statistically significant, p < .0033.
Source: Authors’ analysis based on U.S. Department of Justice 2007.
7 WhaT The STudy found
8 characTeriSTicS of bullying, bullying vicTimS, and SchoolS aSSociaTed WiTh reporTing of bullying
one sociodemographic
characteristic of
bullying victims
showed a statistically
significant correlation
with reporting; four
did not. Two school-
related experience
and perception
characteristics showed
a statistically significant
relationship with
reporting; seven did not
48.5 percent of victims who were bullied almost every day said the bullying was reported to school officials.
The relationship between location and reporting was also statistically significant. Bullying victimization that included at least one occur-rence on a school bus (tetrachoric rho = .18, p =.002) or occurred in multiple locations (rpbi = .08, p =.001) was associated with increased reporting.
Bullying that involved the victim being made fun of or called names, the victim being excluded, the victim having rumors spread about him or her, or the victim being made to do things that he or she did not want to do were not associated with increased reporting.
Characteristics of bullying victims
This section presents the analysis of the relationship between characteristics of bullying victims and reporting. Two types of victim characteristics were included: sociodemographic characteristics and student school-related experiences and perceptions.
Sociodemographic characteristics. Victim sociodemographic characteristics included in the analysis were:
• Gender.
• Race/ethnicity.
• Grade level.
• Household region.
• Household income.
One characteristic showed a statistically significant correlation with reporting; four did not.
Reporting by grade level ranges from 52.9 percent for students in grade 6 to 27.0 percent for students in grade 12. The relationship between grade level and reporting of bullying is statistically significant and negative, meaning that higher grade levels are associated with less reporting (rpbi = –.18, p < .001).
Male and female bullying victims did not differ in the prevalence of reporting (table 2)—that is, the percentage of girls who indicated that their bullying victimization was reported to a teacher or other adult at the school did not statistically differ from the percentage of boys who indicated that their victimization was reported. Moreover, reporting did not statistically differ across racial/ ethnic groups.
The region of the country (as defined by the Census Bureau) where the student’s household is located did not affect reporting. Students from households in the Northeast and students from all other regions indicated that similar percentages of bullying victimization were reported to school officials (35.7 percent compared with 36.0 percent).
No statistically significant association was found between household income and reporting. This is one of the few variables in the data set used in the analyses that had an item response rate lower than 95 percent (see table B1 in appendix B), so the results for household income should be interpreted with caution.
School-related experiences and perceptions. Student school-related experiences and perceptions included in the analysis were:
• Victim’s academic performance.
• Whether the victim skipped classes during the academic year.
• Whether the victim has an adult at school who cares about him or her.
• Whether the victim’s school has an adult who helps him or her with problems.
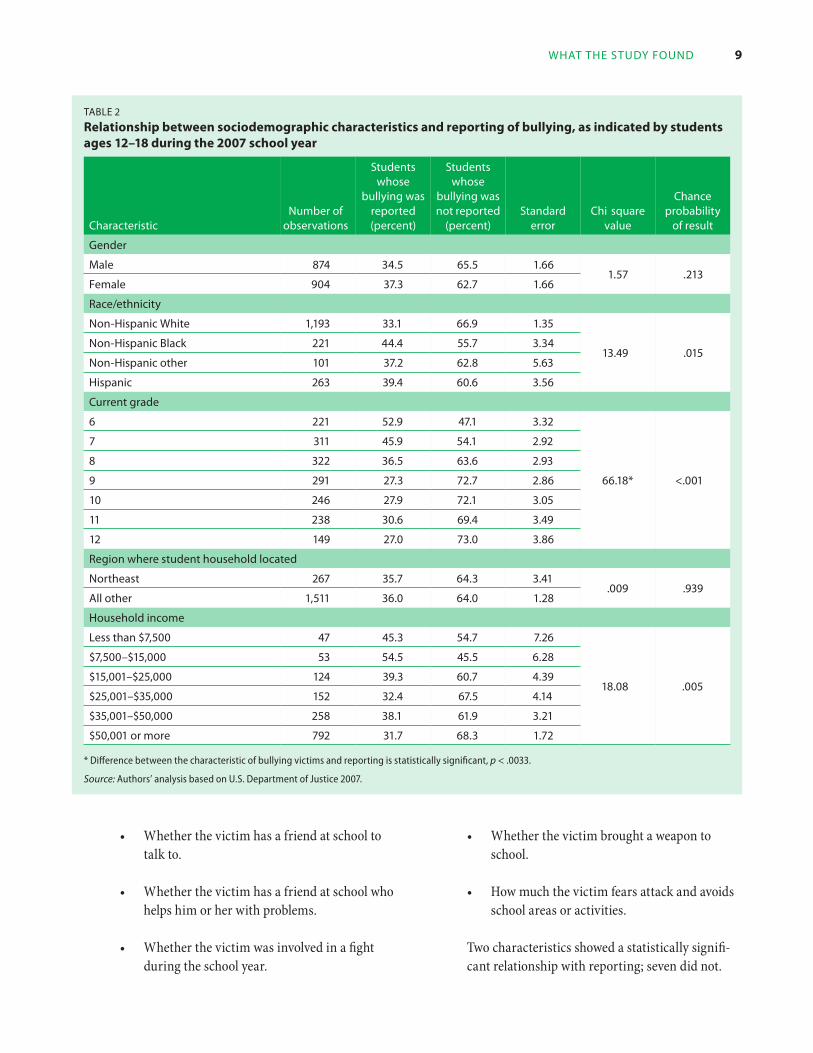
Table 2
Relationship between sociodemographic characteristics and reporting ages 12–18 during the 2007 school year
of bullying, as indicated by students
Students Students whose whose
bullying was bullying was number of reported not reported
characteristic observations (percent) (percent) Standard
error -chi square
value
chance probability
of result
gender
male 874 34.5 65.5 1.66 1.57 .213
female 904 37.3 62.7 1.66
race/ethnicity
non-hispanic White 1,193 33.1 66.9 1.35
13.49 .015 non-hispanic black 221 44.4 55.7 3.34
non-hispanic other 101 37.2 62.8 5.63
hispanic 263 39.4 60.6 3.56
current grade
6 221 52.9 47.1 3.32
66.18* <.001
7 311 45.9 54.1 2.92
8 322 36.5 63.6 2.93
9 291 27.3 72.7 2.86
10 246 27.9 72.1 3.05
11 238 30.6 69.4 3.49
12 149 27.0 73.0 3.86
region where student household located
northeast 267 35.7 64.3 3.41 .009 .939
all other 1,511 36.0 64.0 1.28
household income
less than $7,500 47 45.3 54.7 7.26
18.08 .005
$7,500–$15,000 53 54.5 45.5 6.28
$15,001–$25,000 124 39.3 60.7 4.39
$25,001–$35,000 152 32.4 67.5 4.14
$35,001–$50,000 258 38.1 61.9 3.21
$50,001 or more 792 31.7 68.3 1.72
* Difference between the characteristic of bullying victims and reporting is statistically significant, p < .0033.
Source: Authors’ analysis based on U.S. Department of Justice 2007.
9 WhaT The STudy found
• Whether the victim has a friend at school to talk to.
• Whether the victim has a friend at school who helps him or her with problems.
• Whether the victim was involved in a fight during the school year.
• Whether the victim brought a weapon to school.
• How much the victim fears attack and avoids school areas or activities.
Two characteristics showed a statistically significant relationship with reporting; seven did not.
10 characTeriSTicS of bullying, bullying vicTimS, and SchoolS aSSociaTed WiTh reporTing of bullying
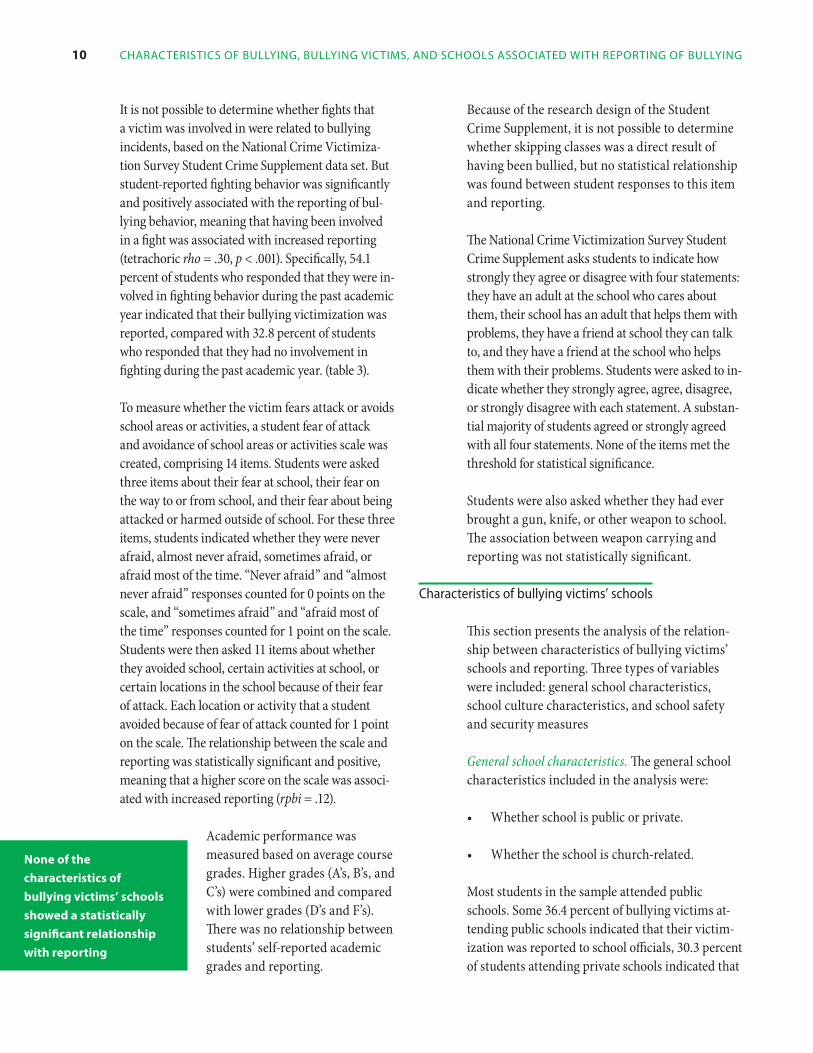
It is not possible to determine whether fights that a victim was involved in were related to bullying incidents, based on the National Crime Victimization Survey Student Crime Supplement data set. But student-reported fighting behavior was significantly and positively associated with the reporting of bullying behavior, meaning that having been involved in a fight was associated with increased reporting (tetrachoric rho = .30, p < .001). Specifically, 54.1 percent of students who responded that they were involved in fighting behavior during the past academic year indicated that their bullying victimization was reported, compared with 32.8 percent of students who responded that they had no involvement in fighting during the past academic year. (table 3).
To measure whether the victim fears attack or avoids school areas or activities, a student fear of attack and avoidance of school areas or activities scale was created, comprising 14 items. Students were asked three items about their fear at school, their fear on the way to or from school, and their fear about being attacked or harmed outside of school. For these three items, students indicated whether they were never afraid, almost never afraid, sometimes afraid, or afraid most of the time. “Never afraid” and “almost never afraid” responses counted for 0 points on the scale, and “sometimes afraid” and “afraid most of the time” responses counted for 1 point on the scale. Students were then asked 11 items about whether they avoided school, certain activities at school, or certain locations in the school because of their fear of attack. Each location or activity that a student avoided because of fear of attack counted for 1 point on the scale. The relationship between the scale and reporting was statistically significant and positive, meaning that a higher score on the scale was associated with increased reporting (rpbi = .12).
Academic performance was measured based on average course grades. Higher grades (A’s, B’s, and C’s) were combined and compared with lower grades (D’s and F’s). There was no relationship between students’ self-reported academic grades and reporting.
Because of the research design of the Student Crime Supplement, it is not possible to determine whether skipping classes was a direct result of having been bullied, but no statistical relationship was found between student responses to this item and reporting.
The National Crime Victimization Survey Student Crime Supplement asks students to indicate how strongly they agree or disagree with four statements: they have an adult at the school who cares about them, their school has an adult that helps them with problems, they have a friend at school they can talk to, and they have a friend at the school who helps them with their problems. Students were asked to indicate whether they strongly agree, agree, disagree, or strongly disagree with each statement. A substantial majority of students agreed or strongly agreed with all four statements. None of the items met the threshold for statistical significance.
Students were also asked whether they had ever brought a gun, knife, or other weapon to school. The association between weapon carrying and reporting was not statistically significant.
Characteristics of bullying victims’ schools
This section presents the analysis of the relationship between characteristics of bullying victims’ schools and reporting. Three types of variables were included: general school characteristics, school culture characteristics, and school safety and security measures
General school characteristics. The general school characteristics included in the analysis were:
• Whether school is public or private.
• Whether the school is church-related.
Most students in the sample attended public schools. Some 36.4 percent of bullying victims attending public schools indicated that their victimization was reported to school officials, 30.3 percent of students attending private schools indicated that
none of the
characteristics of
bullying victims’ schools
showed a statistically
significant relationship
with reporting
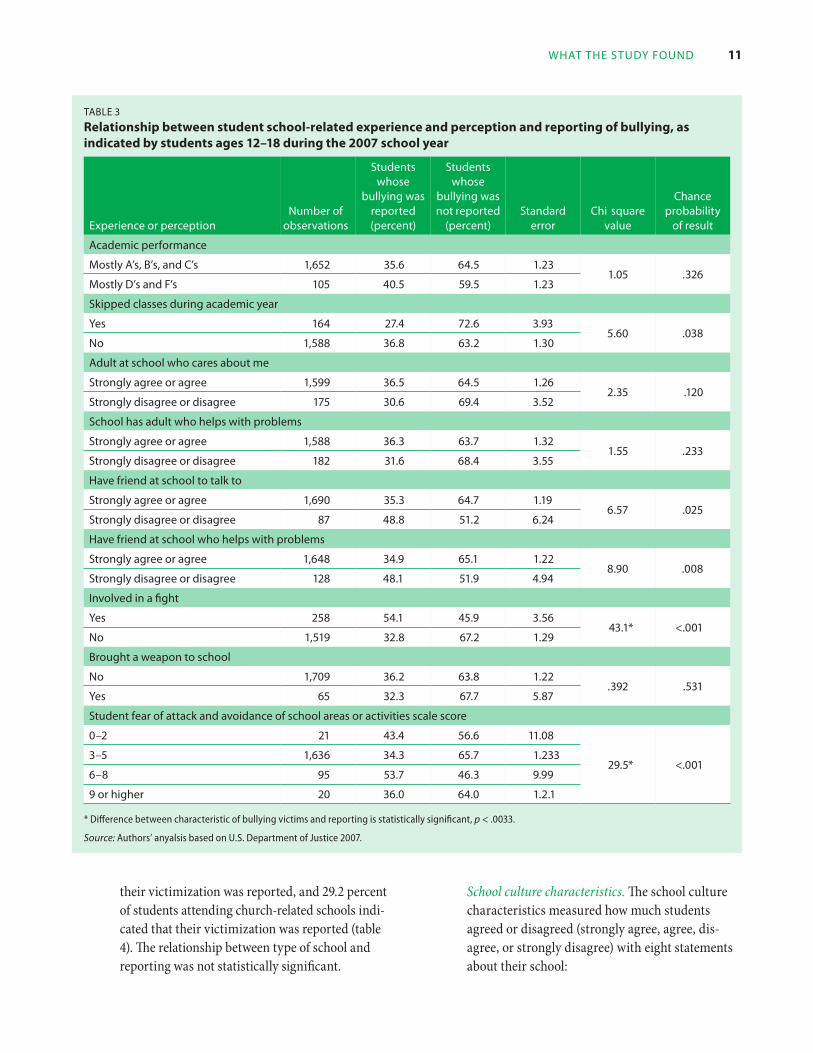
Table 3
Relationship between student school-related experience and perception and reporting of bullying, as indicated by students ages 12–18 during the 2007 school year
Students Students whose whose
bullying was bullying was chance number of reported not reported Standard -chi square probability
experience or perception observations (percent) (percent) error value of result
academic performance
mostly a’s, b’s, and c’s 1,652 35.6 64.5 1.23 1.05 .326
mostly d’s and f’s 105 40.5 59.5 1.23
Skipped classes during academic year
yes 164 27.4 72.6 3.93 5.60 .038
no 1,588 36.8 63.2 1.30
adult at school who cares about me
Strongly agree or agree 1,599 36.5 64.5 1.26 2.35 .120
Strongly disagree or disagree 175 30.6 69.4 3.52
School has adult who helps with problems
Strongly agree or agree 1,588 36.3 63.7 1.32 1.55 .233
Strongly disagree or disagree 182 31.6 68.4 3.55
have friend at school to talk to
Strongly agree or agree 1,690 35.3 64.7 1.19 6.57 .025
Strongly disagree or disagree 87 48.8 51.2 6.24
have friend at school who helps with problems
Strongly agree or agree 1,648 34.9 65.1 1.22 8.90 .008
Strongly disagree or disagree 128 48.1 51.9 4.94
involved in a fight
yes 258 54.1 45.9 3.56 43.1* <.001
no 1,519 32.8 67.2 1.29
brought a weapon to school
no 1,709 36.2 63.8 1.22 .392 .531
yes 65 32.3 67.7 5.87
Student fear of attack and avoidance of school areas or activities scale score
0–2 21 43.4 56.6 11.08
29.5* <.001 3–5 1,636 34.3 65.7 1.233
6–8 95 53.7 46.3 9.99
9 or higher 20 36.0 64.0 1.2.1
* Difference between characteristic of bullying victims and reporting is statistically significant, p < .0033.
Source: Authors’ anyalsis based on U.S. Department of Justice 2007.
11 WhaT The STudy found
their victimization was reported, and 29.2 percent of students attending church-related schools indicated that their victimization was reported (table 4). The relationship between type of school and reporting was not statistically significant.
School culture characteristics. The school culture characteristics measured how much students agreed or disagreed (strongly agree, agree, disagree, or strongly disagree) with eight statements about their school:
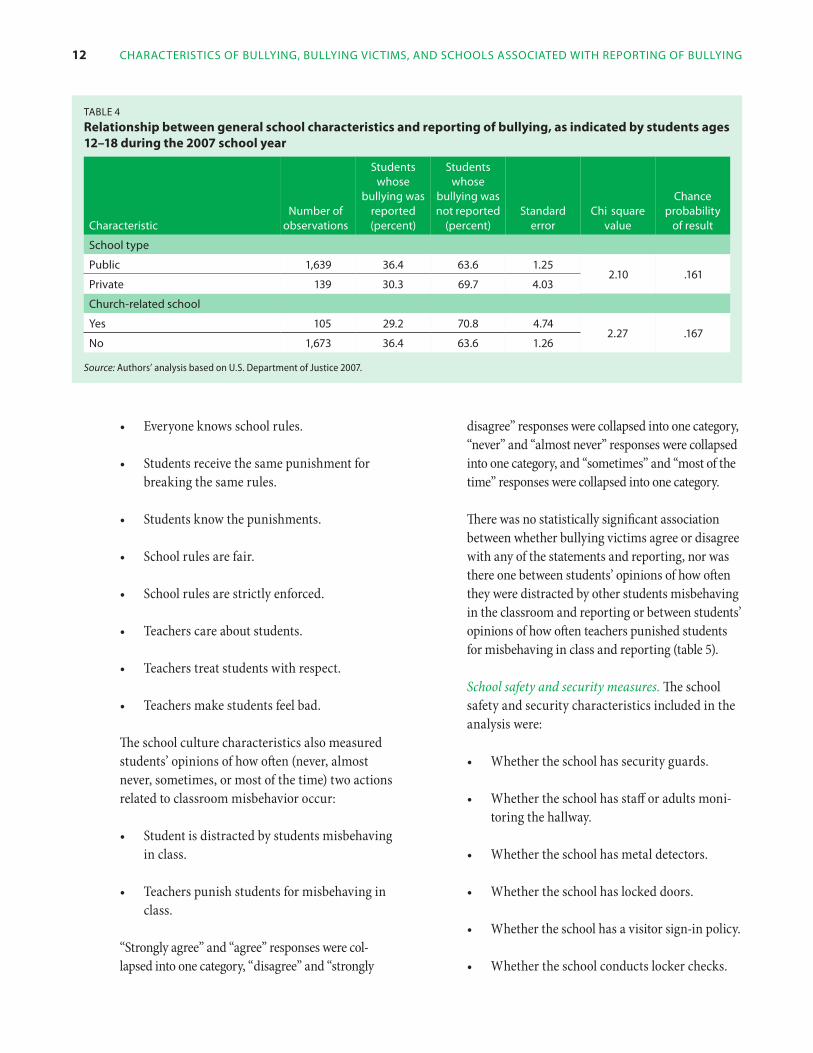
Table 4
Relationship between general school characteristics and reporting of bullying, as indicated by students ages 12–18 during the 2007 school year
Students Students whose whose
bullying was bullying was chance number of reported not reported Standard -chi square probability
characteristic observations (percent) (percent) error value of result
School type
public 1,639 36.4 63.6 1.25 2.10 .161
private 139 30.3 69.7 4.03
church-related school
yes 105 29.2 70.8 4.74 2.27 .167
no 1,673 36.4 63.6 1.26
Source: Authors’ analysis based on U.S. Department of Justice 2007.
12 characTeriSTicS of bullying, bullying vicTimS, and SchoolS aSSociaTed WiTh reporTing of bullying
• Everyone knows school rules.
• Students receive the same punishment for breaking the same rules.
• Students know the punishments.
• School rules are fair.
• School rules are strictly enforced.
• Teachers care about students.
• Teachers treat students with respect.
• Teachers make students feel bad.
The school culture characteristics also measured students’ opinions of how often (never, almost never, sometimes, or most of the time) two actions related to classroom misbehavior occur:
• Student is distracted by students misbehaving in class.
• Teachers punish students for misbehaving in class.
“Strongly agree” and “agree” responses were collapsed into one category, “disagree” and “strongly
disagree” responses were collapsed into one category, “never” and “almost never” responses were collapsed into one category, and “sometimes” and “most of the time” responses were collapsed into one category.
There was no statistically significant association between whether bullying victims agree or disagree with any of the statements and reporting, nor was there one between students’ opinions of how often they were distracted by other students misbehaving in the classroom and reporting or between students’ opinions of how often teachers punished students for misbehaving in class and reporting (table 5).
School safety and security measures. The school safety and security characteristics included in the analysis were:
• Whether the school has security guards.
• Whether the school has staff or adults monitoring the hallway.
• Whether the school has metal detectors.
• Whether the school has locked doors.
• Whether the school has a visitor sign-in policy.
• Whether the school conducts locker checks.
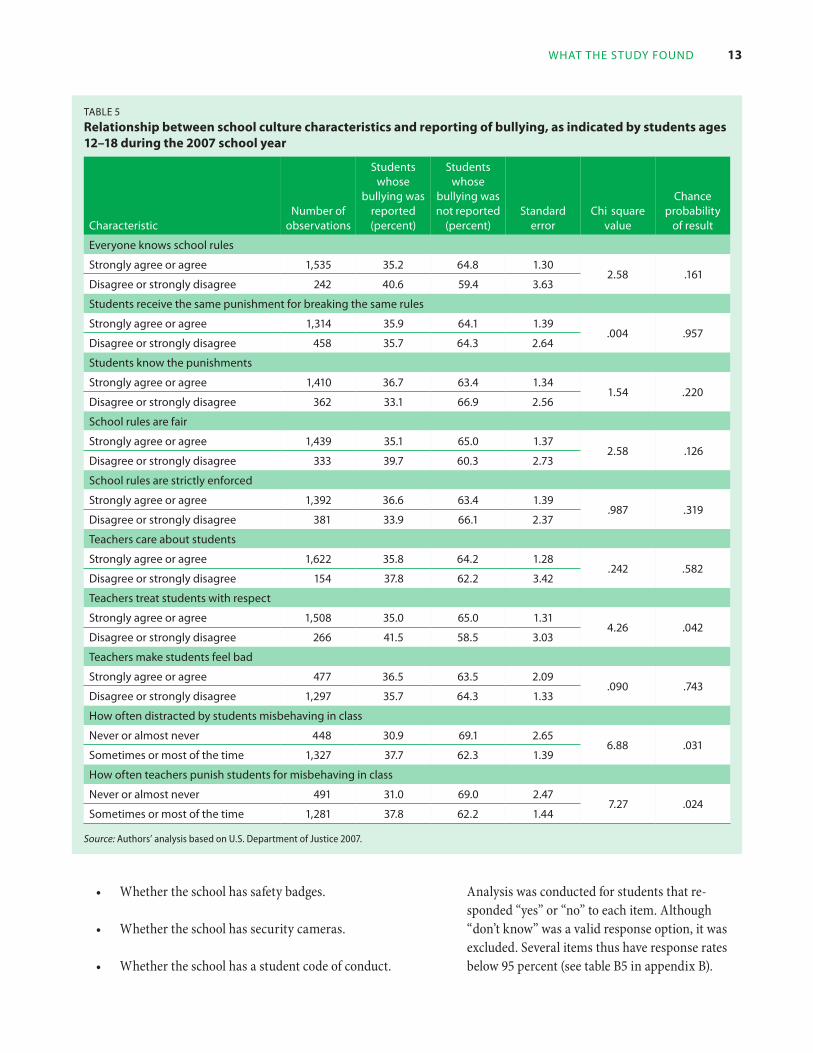
Table 5
Relationship between school culture characteristics and reporting of bullying, as indicated by students ages 12–18 during the 2007 school year
Students Students whose whose
bullying was bullying was chance number of reported not reported Standard -chi square probability
characteristic observations (percent) (percent) error value of result
everyone knows school rules
Strongly agree or agree 1,535 35.2 64.8 1.30 2.58 .161
disagree or strongly disagree 242 40.6 59.4 3.63
Students receive the same punishment for breaking the same rules
Strongly agree or agree 1,314 35.9 64.1 1.39 .004 .957
disagree or strongly disagree 458 35.7 64.3 2.64
Students know the punishments
Strongly agree or agree 1,410 36.7 63.4 1.34 1.54 .220
disagree or strongly disagree 362 33.1 66.9 2.56
School rules are fair
Strongly agree or agree 1,439 35.1 65.0 1.37 2.58 .126
disagree or strongly disagree 333 39.7 60.3 2.73
School rules are strictly enforced
Strongly agree or agree 1,392 36.6 63.4 1.39 .987 .319
disagree or strongly disagree 381 33.9 66.1 2.37
Teachers care about students
Strongly agree or agree 1,622 35.8 64.2 1.28 .242 .582
disagree or strongly disagree 154 37.8 62.2 3.42
Teachers treat students with respect
Strongly agree or agree 1,508 35.0 65.0 1.31 4.26 .042
disagree or strongly disagree 266 41.5 58.5 3.03
Teachers make students feel bad
Strongly agree or agree 477 36.5 63.5 2.09 .090 .743
disagree or strongly disagree 1,297 35.7 64.3 1.33
how often distracted by students misbehaving in class
never or almost never 448 30.9 69.1 2.65 6.88 .031
Sometimes or most of the time 1,327 37.7 62.3 1.39
how often teachers punish students for misbehaving in class
never or almost never 491 31.0 69.0 2.47 7.27 .024
Sometimes or most of the time 1,281 37.8 62.2 1.44
Source: Authors’ analysis based on U.S. Department of Justice 2007.
13 WhaT The STudy found
• Whether the school has safety badges. Analysis was conducted for students that responded “yes” or “no” to each item. Although
• Whether the school has security cameras. “don’t know” was a valid response option, it was excluded. Several items thus have response rates
• Whether the school has a student code of conduct. below 95 percent (see table B5 in appendix B).
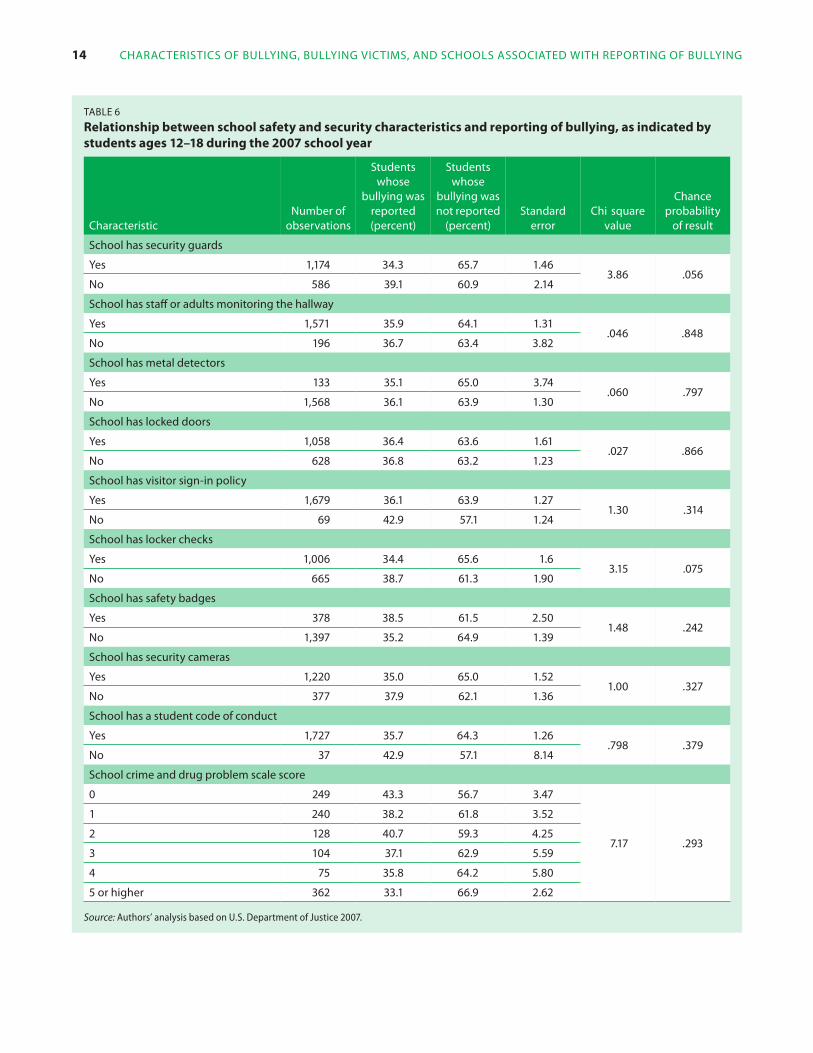
Table 6
Relationship between school safety and security charactestudents ages 12–18 during the 2007 school year
ristics and reporting of bullying, as indicated by
Students whose
bullying was number of reported
characteristic observations (percent)
Students whose
bullying was not reported
(percent) Standard
error -chi square
value
chance probability
of result
School has security guards
yes 1,174 34.3 65.7 1.46 3.86 .056
no 586 39.1 60.9 2.14
School has staff or adults monitoring the hallway
yes 1,571 35.9 64.1 1.31 .046 .848
no 196 36.7 63.4 3.82
School has metal detectors
yes 133 35.1 65.0 3.74 .060 .797
no 1,568 36.1 63.9 1.30
School has locked doors
yes 1,058 36.4 63.6 1.61 .027 .866
no 628 36.8 63.2 1.23
School has visitor sign-in policy
yes 1,679 36.1 63.9 1.27 1.30 .314
no 69 42.9 57.1 1.24
School has locker checks
yes 1,006 34.4 65.6 1.6 3.15 .075
no 665 38.7 61.3 1.90
School has safety badges
yes 378 38.5 61.5 2.50 1.48 .242
no 1,397 35.2 64.9 1.39
School has security cameras
yes 1,220 35.0 65.0 1.52 1.00 .327
no 377 37.9 62.1 1.36
School has a student code of conduct
yes 1,727 35.7 64.3 1.26 .798 .379
no 37 42.9 57.1 8.14
School crime and drug problem scale score
0 249 43.3 56.7 3.47
7.17 .293
1 240 38.2 61.8 3.52
2 128 40.7 59.3 4.25
3 104 37.1 62.9 5.59
4 75 35.8 64.2 5.80
5 or higher 362 33.1 66.9 2.62
Source: Authors’ analysis based on U.S. Department of Justice 2007.
14 characTeriSTicS of bullying, bullying vicTimS, and SchoolS aSSociaTed WiTh reporTing of bullying
direcTionS for fuTure reSearch 15
The school safety and security characteristics also include a measure of students’ perception of crime and drug problems at their school. The school crime and drug problem scale comprises 13 items: whether the student knew other students who brought a loaded gun to school, whether he or she had seen another student with a loaded gun at school, whether he or she could have gotten a loaded gun at school, whether gangs were at the school, whether gangs were involved in selling drugs at school, whether gangs at school were involved in fights and violence, whether he or she had seen hate-related words and symbols at school, whether he or she was offered drugs or alcohol during the academic year, whether he or she knew other students on drugs or alcohol, whether it was possible to get alcohol at school, whether it was possible to get marijuana at school, whether it was possible to get prescription drugs at school, and whether it was possible to get crack, cocaine or other drugs at school. Each “yes” response counted for 1 point on the scale.
None of the school safety and security measures showed a statistically significant relationship with reporting (table 6).
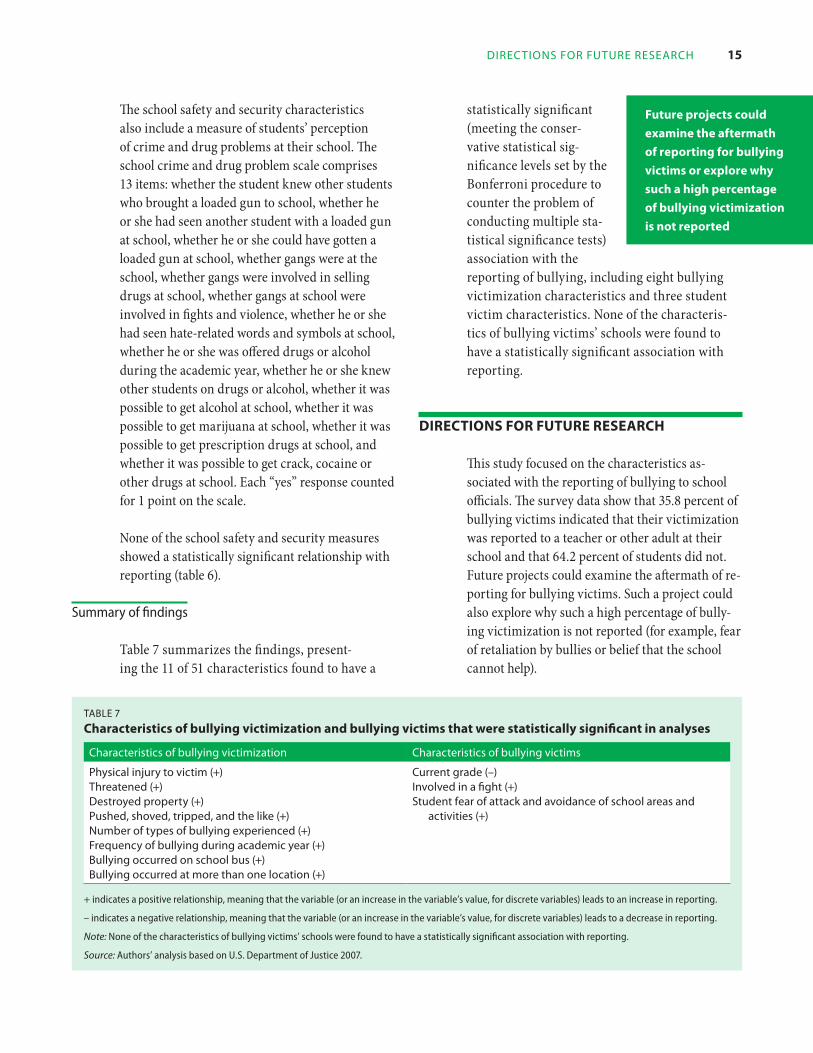
Summary of findings
Table 7 summarizes the findings, presenting the 11 of 51 characteristics found to have a
statistically significant (meeting the conservative statistical significance levels set by the Bonferroni procedure to counter the problem of conducting multiple statistical significance tests) association with the reporting of bullying, including eight bullying victimization characteristics and three student victim characteristics. None of the characteristics of bullying victims’ schools were found to have a statistically significant association with reporting.
future projects could
examine the aftermath
of reporting for bullying
victims or explore why
such a high percentage
of bullying victimization
is not reported
dIRecTIons foR fuTuRe ReseaRch
This study focused on the characteristics associated with the reporting of bullying to school officials. The survey data show that 35.8 percent of bullying victims indicated that their victimization was reported to a teacher or other adult at their school and that 64.2 percent of students did not. Future projects could examine the aftermath of reporting for bullying victims. Such a project could also explore why such a high percentage of bullying victimization is not reported (for example, fear of retaliation by bullies or belief that the school cannot help).
Table 7
characteristics of bullying victimization and bullying victims that were statistically significant in analyses
characteristics of bullying victimization characteristics of bullying victims
physical injury to victim (+) current grade (–) Threatened (+) involved in a fight (+) destroyed property (+) Student fear of attack and avoidance of school areas and pushed, shoved, tripped, and the like (+) activities (+) number of types of bullying experienced (+) frequency of bullying during academic year (+) bullying occurred on school bus (+) bullying occurred at more than one location (+)
+ indicates a positive relationship, meaning that the variable (or an increase in the variable’s value, for discrete variables) leads to an increase in reporting.
– indicates a negative relationship, meaning that the variable (or an increase in the variable’s value, for discrete variables) leads to a decrease in reporting.
Note: None of the characteristics of bullying victims’ schools were found to have a statistically significant association with reporting.
Source: Authors’ analysis based on U.S. Department of Justice 2007.
16 characTeriSTicS of bullying, bullying vicTimS, and SchoolS aSSociaTed WiTh reporTing of bullying
Items could also be added to the National Crime Victimization Survey School Crime Supplement or other national surveys (such as the Youth Risk Behavior Surveillance System) to probe deeper into what happens following the reporting of bullying to school officials. For example, what did the school do in response? Did the victim suffer reprisals? Items that distinguish who actually reported the bullying to a school official (the victim, bystander, or parent), that identify whether students told their parents and what the parental response was, and that list the reasons bullying victims have for reporting or
not reporting to school officials would also be useful, as would items that ask students whether they witnessed bullying and what they did about it. These data could improve the research evidence relevant to bystander behavior and school bullying.
The 2009 National Crime Victimization Survey School Crime Supplement data should be available in 2011. Repeating the analysis of bullying, victim, and school characteristics with the 2009 data would provide information about how the findings replicate or change over time.
17
aPPendIx a PReVIous ReseaRch on bullyIng
Agreement on how to define bullying is elusive (Griffin and Gross 2004). Olweus (1993, p .9) defines bullying as being “exposed, repeatedly and over time, to negative actions on the part of one or more other students,” a definition adopted by DeVoe and Kaffenberger in their National Center for Education Statistics report (2005, p. v). In another National Center for Education Statistics document, Dinkes, Kemp, and Baum (2009, p. 40) state that bullying includes “being made fun of; being the subject of rumors; being threatened with harm; being pushed, shoved, tripped, or spit on; being pressured into doing things did not want to do; [being] excluded; and having property destroyed on purpose.”
National estimates of bullying vary. Some 16 percent of students participating in a National Institute of Child Health and Development survey in 1998 stated that they had been bullied in their current school term (National Institutes of Health 2001). The 2008 Indicators of School Crime and Safety Report (Dinkes, Kemp, and Baum 2009), however, estimates that 32 percent of children nationwide were victims of bullying in 2007, and that 24 percent of public schools reported that student bullying was a daily or weekly problem during the 2005/06 school year. A 2003 national survey of parents indicated that 35 percent were worried about their child being bullied and 24 percent reported that their own child bullies or is cruel to other children (Sidorowicz, Hair, and Milot 2009). In a Kaiser Family Foundation (2001) survey of more than 800 students, bullying, teasing, and “put downs” were rated together as the number one problem in school (Boorstein 2004; CNN 2001).
Research suggests a number of potential negative consequences of bullying. Rigby’s (2003) review of this work summarizes the harms by type of research. For example, in cross-sectional surveys, victims of bullying report higher levels of depression and poor health than do nonvictims
appendix a. previouS reSearch on bullying
(Srabstein and Piazza 2008; Fekkes, Pijpers, and Verloove-Vanhorick 2004). Retrospective interview and questionnaire studies suggest that bullying contributes to victims’ difficulties with physical and psychological health, even into adulthood (Fosse and Holen 2002). These effects are more strongly substantiated in longitudinal studies that have reported bullying as a significant factor in students’ negative health and well-being and suggest that the consequences of bullying can be long term (Sourander et al. 2000). Longitudinal studies also identify that being a bully is a predictor of later involvement in antisocial and criminal behavior (Sourander et al. 2007). As mentioned, the relationship between bullying and academic achievement is complex, but some studies report negative academic performance for both victims and bullies (Olweus 1993; Farrington and Ttofi 2009).
Some studies have also suggested a link between bullying victimization and suicide and homicide. One study found that boys and girls who are bullied are four to eight times more likely to kill themselves than are nonvictims (Fox et al. 2003). Moreover, the Secret Service documented bullying victimization in the backgrounds of approximately two-thirds of attempted or completed school shooting attackers (Vossekull et al. 2002). Lawsuits have been brought against schools and districts for not doing enough to keep bullied children safe (Dawson 2006; Martindale 2009).
Though once considered by many adults as a normal adolescent rite of passage (Garbarino and DeLara 2003), the potential short- and long-term consequences of bullying have raised concern among administrators, teachers, parents, pediatricians, police, and others (National Crime Prevention Council 2008; National Safe Schools Partnership 2007). Such concern includes the aforementioned legislation in at least 44 states mandating that schools track incidents of bullying and take measures to address it (Associated Press 2009).
One major problem for concerned adults, however, is that bullying often goes unreported to teachers
18 characTeriSTicS of bullying, bullying vicTimS, and SchoolS aSSociaTed WiTh reporTing of bullying
or other school officials. Only 35.8 percent of bullied students in the 2007 National Crime Victimization Survey School Crime Supplement indicated that their bullying victimization was reported to school officials (Dinkes, Kemp, and Baum 2009). In a survey of more than 2,000 Dutch elementary school students, 16 percent reported having been bullied during a six month period; 53 percent of these victims reported the bullying to their teacher and 67 percent to parents (Fekkes, Pijpers, and Verloove-Vanhorick 2005). A survey administered by the Oklahoma Department of Health reported that 67 percent of students in grade 3, 47 percent of students in grade 5, and 20 percent of students in grade 7 who were bullied told an adult at the school (Middleton 2008).
Reporting is an important precursor to school response to bullying. Kazdin and Rotella (2009) note that teachers observe only the most flagrant and frequent bullying, and estimate that teacher observation occurs in only about 4 percent of incidents. Along with victim reluctance, bystanders who witness bullying also tend not to report it, even though 85 percent of incidents occur in front of others, usually peers (Kazdin and Rotella 2009).
Underreporting of bullying makes it difficult for school officials, parents, and other concerned adults to learn about and deal effectively with victimization (Education Development Center 2008).
Oliver and Candappa (2007) found that students are reluctant to tell adults about bullying and that this reluctance increases with age.
Little research on the reporting of bullying to school officials is available to guide stakeholders in the Northeast and Islands Region and elsewhere, particularly research conducted in the United States. REL Northeast and Islands researchers found one study that examined the differences between reported and nonreported incidents. Unnever and Cornell (2004) surveyed six middle schools (grades 6–8) in Roanoke, Virginia. Of the 2,437 students who participated, 898 (37 percent) were identified as bullying victims. Of the bullying victims, 25 percent did not report their victimization to anyone and 40 percent did not report it to an adult. Unnever and Cornell (2004) then analyzed which factors influenced victim reporting and found that victims who were bullied more frequently and by a larger number of bullies, who were female, who perceived that their school would not tolerate bullying, and who were from the lower grade levels were more likely to report. To better inform education decisionmakers in the region and elsewhere, further studies like this are needed. This REL Northeast and Islands project expands on the Roanoke study to empirically study differences between reported and nonreported bullying victimization, using a nationally representative data set.
19 appendix b. daTa Source and meThodology
aPPendIx b daTa souRce and MeThodology
This appendix provides more detail on the data source and methodology used for this study. To respond to the research questions, secondary analysis of data from the U.S. Department of Justice, Bureau of Justice Statistics’ 2007 National Crime Victimization Survey School Crime Supplement was conducted. Hagan (1993, p. 215) defines secondary analysis as the “re-analysis of data that were previously gathered for other purposes.”
Data source
The National Crime Victimization Survey is a nationally representative survey administered annually by the U.S. Census Bureau on behalf of the Bureau of Justice Statistics to persons ages 12 and older in selected households across the contiguous United States. The purpose of the survey is to get at the “hidden figure” of crime. Many crimes go unreported to the police, so relying on such reports to establish crime rates (as is done when using the Federal Bureau of Investigation’s summaries of “reports to the police,” known as the Uniform Crime Reports) provides a limited picture of criminal victimization (Hagan 1993).
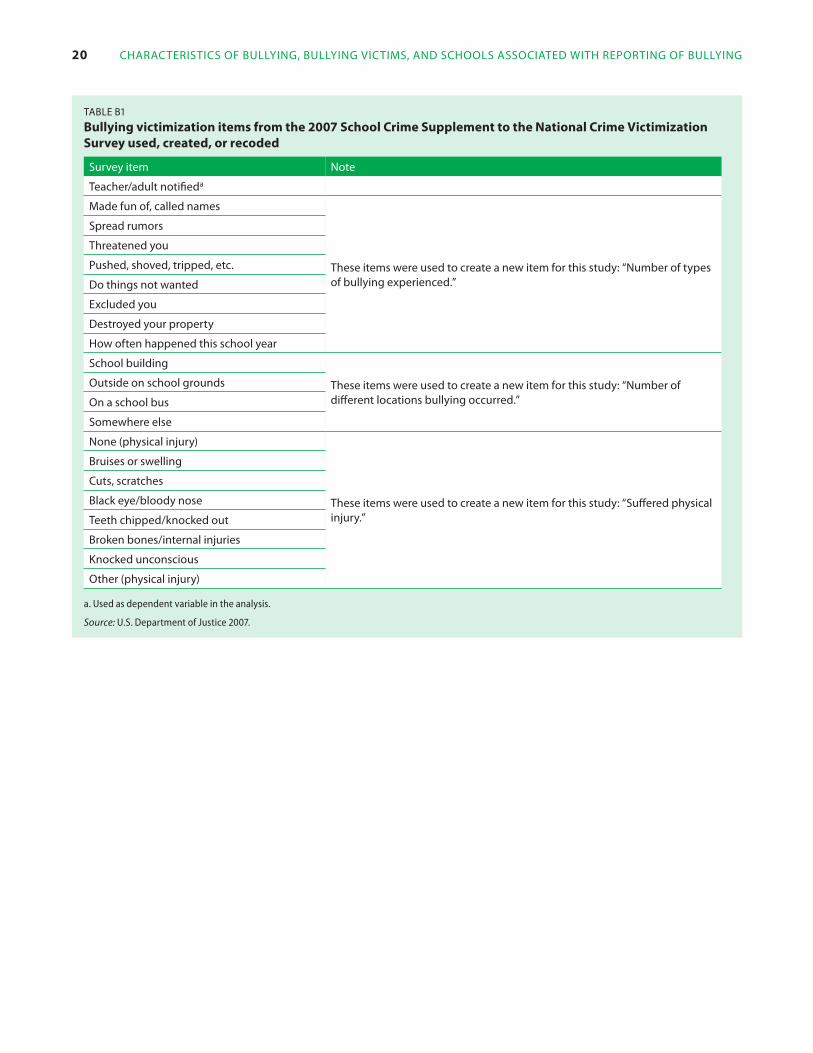
Every other year the School Crime Supplement is added to the National Crime Victimization Survey on behalf of the U.S. Departments of Justice and Education. The supplement covers all students ages 12–18 who attended at least some school in the prior academic year. The 2007 survey invited 11,161 people ages 12–18 to participate; 6,503 of them completed the survey, and 5,621 met the screening criteria and thus comprise the data set used to conduct the secondary analysis. The purpose of the supplement is to provide a fuller picture of victimization beyond that captured by official reports to police of crimes at school. It asks approximately 140 items on a wide range of school behaviors and student perceptions, several of which deal specifically with bullying. Tables B1–B4 list the survey items used for the analysis in this study by category of characteristic. A full
copy of the survey instrument can be found in the supplement’s codebook (U.S. Department of Justice 2009).
The 2007 National Crime Victimization Survey is the best available source of data to examine reporting of bullying. Other possible data sources do not include enough information on bullying to adequately respond to the research questions. For example, each state in the Northeast and Islands Region participates in the Youth Risk Behavior Surveillance program overseen by the U.S. Centers for Disease Control and Prevention. But its core survey instrument did not include any items about bullying until 2009. States are free to add their own additional items, and three states in the region have added two items on bullying (“Have you been bullied in the past six months?” and “Have you bullied someone in the past six months?”). But no items about reporting bullying to school officials are included in the core or individual state Youth Risk Behavior Surveillance instruments.
Several states in the region have passed anti-bullying legislation that requires schools to collect information on bullying and transmit the data to the state department of education. Disciplinary files may also capture reports to school officials about bullying behavior. But even if these data files were accessible and contained reliable and comprehensive data on reporting of bullying, they would seriously underrepresent bullying, given that most bullying incidents are not reported to officials (at least 64 percent according to the 2007 National Crime Victimization Survey). These data files also provide no opportunity to contrast students reporting victimization with students who did not report their victimization to school officials.
Summary statistics on bullying using previous years’ National Crime Victimization Survey School Crime Supplement data are produced annually for the National Center for Education Statistics Indicators of School Crime and Safety publication (Dinkes, Cataldi, and Lin-Kelly 2008). In addition, general bullying statistics are made available using the “quick tables” function on the National
20 characTeriSTicS of bullying, bullying vicTimS, and SchoolS aSSociaTed WiTh reporTing of bullying
Table b1
bullying victimization items from the 2007 school crime supplement to the national crime Victimization survey used, created, or recoded
Survey item note
Teacher/adult notifieda
made fun of, called names
These items were used to create a new item for this study: “number of types of bullying experienced.”
Spread rumors
Threatened you
pushed, shoved, tripped, etc.
do things not wanted
excluded you
destroyed your property
how often happened this school year
School building
These items were used to create a new item for this study: “number of different locations bullying occurred.”
outside on school grounds
on a school bus
Somewhere else
none (physical injury)
These items were used to create a new item for this study: “Suffered physical injury.”
bruises or swelling
cuts, scratches
black eye/bloody nose
Teeth chipped/knocked out
broken bones/internal injuries
Knocked unconscious
other (physical injury)
a. Used as dependent variable in the analysis.
Source: U.S. Department of Justice 2007.
21 appendix b. daTa Source and meThodology
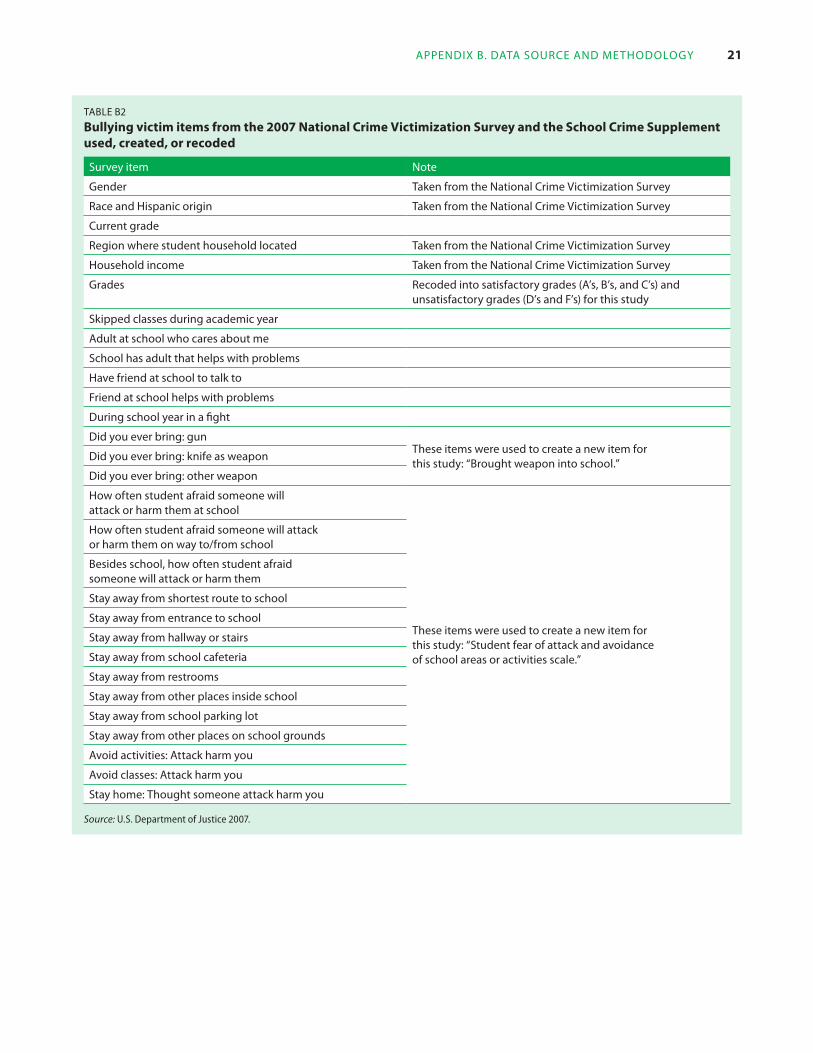
Table b2
bullying victim items from the 2007 national crime Victimization survey and the school crime supplement used, created, or recoded
Survey item note
gender Taken from the national crime victimization Survey
race and hispanic origin Taken from the national crime victimization Survey
current grade
region where student household located Taken from the national crime victimization Survey
household income Taken from the national crime victimization Survey
grades recoded into satisfactory grades (a’s, b’s, and c’s) and unsatisfactory grades (d’s and f’s) for this study
Skipped classes during academic year
adult at school who cares about me
School has adult that helps with problems
have friend at school to talk to
friend at school helps with problems
during school year in a fight
did you ever bring: gun
did you ever bring: knife as weapon These items were used to create a new item for this study: “brought weapon into school.”
did you ever bring: other weapon
how often student afraid someone will attack or harm them at school
how often student afraid someone will attack or harm them on way to/from school
besides school, how often student afraid someone will attack or harm them
Stay away from shortest route to school
Stay away from entrance to school
Stay away from hallway or stairs These items were used to create a new item for this study: “Student fear of attack and avoidance
Stay away from school cafeteria of school areas or activities scale.”
Stay away from restrooms
Stay away from other places inside school
Stay away from school parking lot
Stay away from other places on school grounds
avoid activities: attack harm you
avoid classes: attack harm you
Stay home: Thought someone attack harm you
Source: U.S. Department of Justice 2007.
22 characTeriSTicS of bullying, bullying vicTimS, and SchoolS aSSociaTed WiTh reporTing of bullying
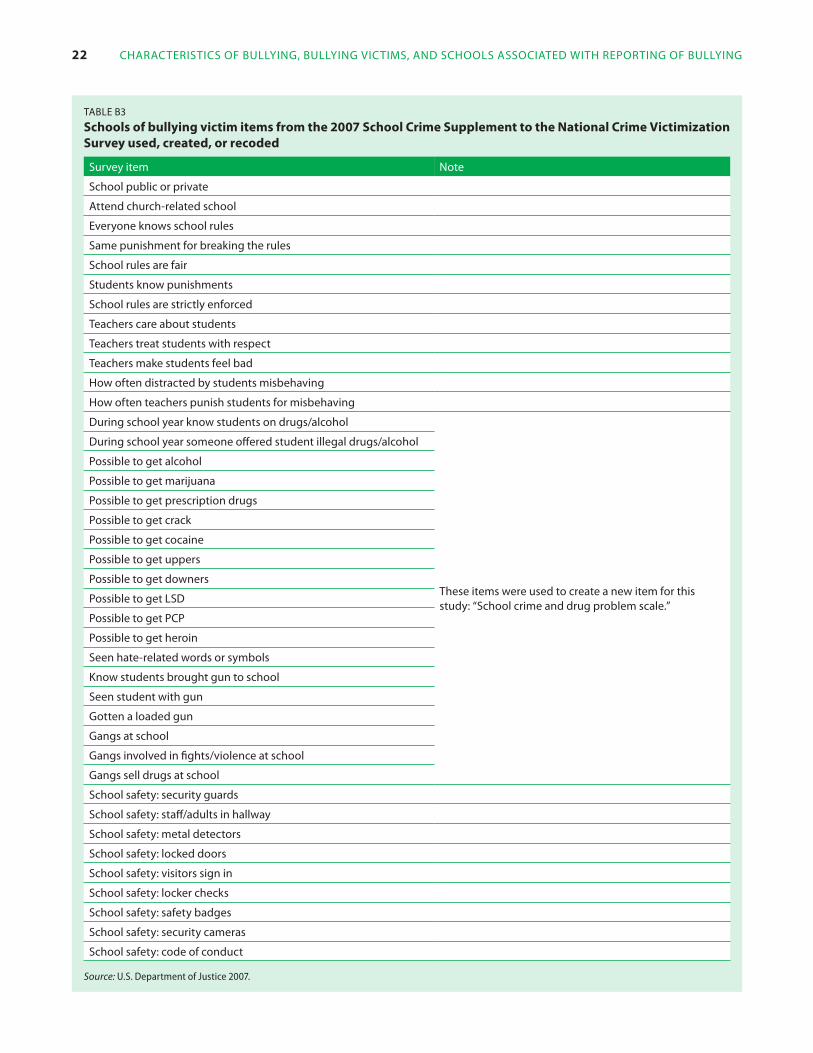
Table b3
schools of bullying victim items from the 2007 school crime supplement to the national crime Victimization survey used, created, or recoded
Survey item note
School public or private
attend church-related school
everyone knows school rules
Same punishment for breaking the rules
School rules are fair
Students know punishments
School rules are strictly enforced
Teachers care about students
Teachers treat students with respect
Teachers make students feel bad
how often distracted by students misbehaving
how often teachers punish students for misbehaving
during school year know students on drugs/alcohol
during school year someone offered student illegal drugs/alcohol
possible to get alcohol
possible to get marijuana
possible to get prescription drugs
possible to get crack
possible to get cocaine
possible to get uppers
possible to get downers
possible to get lSd These items were used to create a new item for this study: “School crime and drug problem scale.”
possible to get pcp
possible to get heroin
Seen hate-related words or symbols
Know students brought gun to school
Seen student with gun
gotten a loaded gun
gangs at school
gangs involved in fights/violence at school
gangs sell drugs at school
School safety: security guards
School safety: staff/adults in hallway
School safety: metal detectors
School safety: locked doors
School safety: visitors sign in
School safety: locker checks
School safety: safety badges
School safety: security cameras
School safety: code of conduct
Source: U.S. Department of Justice 2007.
23 appendix b. daTa Source and meThodology
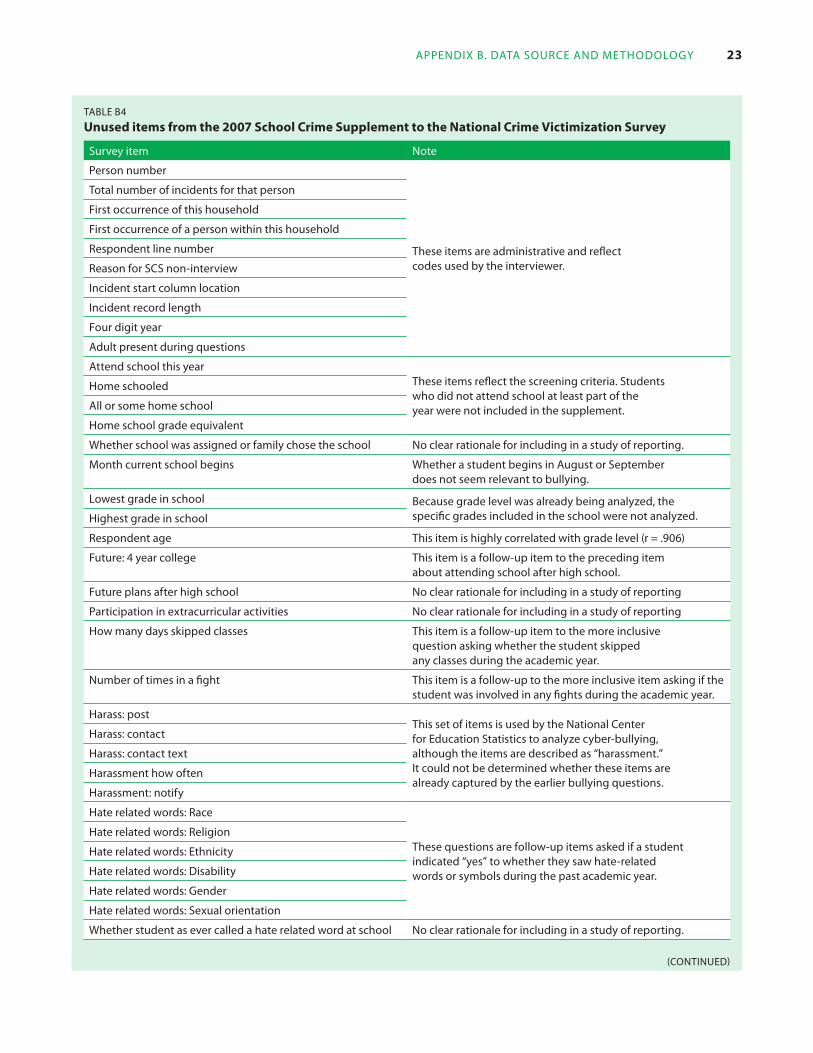
Table b4
unused items from the 2007 school crime supplement to the national crime Victimization survey
Survey item note
person number
These items are administrative and reflect
Total number of incidents for that person
first occurrence of this household
first occurrence of a person within this household
respondent line number
reason for ScS non-interview codes used by the interviewer.
incident start column location
incident record length
four digit year
adult present during questions
attend school this year These items reflect the screening criteria. Students home schooled who did not attend school at least part of the year were not included in the supplement. all or some home school
home school grade equivalent
Whether school was assigned or family chose the school no clear rationale for including in a study of reporting.
month current school begins Whether a student begins in august or September does not seem relevant to bullying.
lowest grade in school because grade level was already being analyzed, the specific grades included in the school were not analyzed. highest grade in school
respondent age This item is highly correlated with grade level (r = .906)
future: 4 year college This item is a follow-up item to the preceding item about attending school after high school.
future plans after high school no clear rationale for including in a study of reporting
participation in extracurricular activities no clear rationale for including in a study of reporting
how many days skipped classes This item is a follow-up item to the more inclusive question asking whether the student skipped any classes during the academic year.
number of times in a fight This item is a follow-up to the more inclusive item asking if the student was involved in any fights during the academic year.
harass: post This set of items is used by the national center for education Statistics to analyze cyber-bullying, harass: contact
harass: contact text although the items are described as “harassment.” it could not be determined whether these items are harassment how often already captured by the earlier bullying questions.
harassment: notify
hate related words: race
These questions are follow-up items asked if a student indicated “yes” to whether they saw hate-related words or symbols during the past academic year.
hate related words: religion
hate related words: ethnicity
hate related words: disability
hate related words: gender
hate related words: Sexual orientation
Whether student as ever called a hate related word at school no clear rationale for including in a study of reporting.
(conTinued)
24 characTeriSTicS of bullying, bullying vicTimS, and SchoolS aSSociaTed WiTh reporTing of bullying
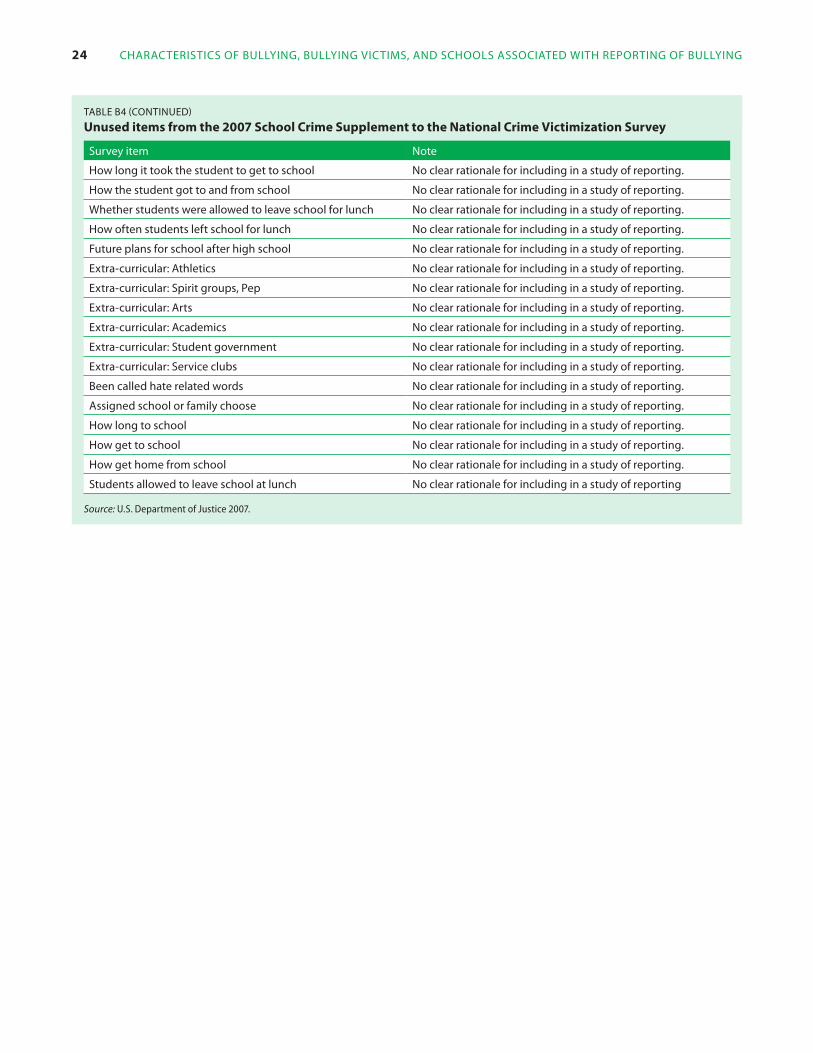
Table b4 (conTinued)
unused items from the 2007 school crime supplement to the national crime Victimization survey
Survey item note
how long it took the student to get to school no clear rationale for including in a study of reporting.
how the student got to and from school no clear rationale for including in a study of reporting.
Whether students were allowed to leave school for lunch no clear rationale for including in a study of reporting.
how often students left school for lunch no clear rationale for including in a study of reporting.
future plans for school after high school no clear rationale for including in a study of reporting.
extra-curricular: athletics no clear rationale for including in a study of reporting.
extra-curricular: Spirit groups, pep no clear rationale for including in a study of reporting.
extra-curricular: arts no clear rationale for including in a study of reporting.
extra-curricular: academics no clear rationale for including in a study of reporting.
extra-curricular: Student government no clear rationale for including in a study of reporting.
extra-curricular: Service clubs no clear rationale for including in a study of reporting.
been called hate related words no clear rationale for including in a study of reporting.
assigned school or family choose no clear rationale for including in a study of reporting.
how long to school no clear rationale for including in a study of reporting.
how get to school no clear rationale for including in a study of reporting.
how get home from school no clear rationale for including in a study of reporting.
Students allowed to leave school at lunch no clear rationale for including in a study of reporting
Source: U.S. Department of Justice 2007.
25 appendix b. daTa Source and meThodology
Center for Education Statistics website (www.nces. ed.gov/quicktables) following each survey data release. The survey data have been used extensively in research studies and reports. For example, DeVoe and Kaffenberger (2005) used survey data to examine victim and school characteristics of students who were victims of direct and indirect bullying behaviors. However, to date, no National Center for Education Statistics publications have used the survey to specifically examine the reporting of bullying victimization to school officials.
Identifying reported and unreported bullying
To first identify whether students responding to the National Crime Victimization Survey School Crime Supplement were bullied, interviewers stated the following: “Now I have some questions about what students do at school that make you feel bad or are hurtful to you. We often refer to this as being bullied” (U.S. Department of Justice 2009). Students were considered bullied if they responded affirmatively to questions that probed whether they were bullied in one or more of the following ways: being made fun of; being the subject of rumors; being threatened with harm; being pushed, shoved, tripped, or spit on; being made to do things they did not want to do; being excluded from activities on purpose; and having property destroyed on purpose. About 32 percent of students in the 2007 survey indicated they had been the victims of at least one type of bullying behavior during the last academic year.
To identify whether bullied students indicated whether their victimization was reported to a teacher or other adult at the school, students were asked, “Was a teacher or some other adult at the school notified about (this event/any of these events)?” Of the roughly 32 percent of students who reported at least one bullying incident on the survey, 36 percent reported that their victimization was reported to a school official and 64 percent did not.5 The question does not permit the researchers to identify who reported the bullying victimization, be it the student, a parent, or someone else (such as a bystander).
Handling survey nonresponse and complex survey sampling
Two major issues about the way the sample was constructed were taken into account. First, not all students eligible to respond to the survey participated, which could bias results if those who responded are different in substantive ways from those who did not. According to the Bureau of Justice Statistics (U.S. Department of Justice 2007), nonparticipating students are more likely to come from non-White, urban, and lower income households. Therefore, a person weight is used to take nonresponse into account and to provide more accurate estimates of population parameters.6
Weighting helps account for potential biases due to nonresponse and permits inferences from these data to the national population of student bullying victims. The Bureau of Justice Statistics (2007, p. 172) concludes that, “although the extent of non-response bias cannot be determined, weighting adjustments, which corrected for differential response rates, should have reduced the problem.”
All tests of statistical significance were based on unweighted sample sizes, but the descriptive results (the percentages of reported and nonreported bullying victimization) were weighted to provide national population estimates. So although 1,778 students indicated that they were bullied during the previous academic year (the total number of observations), the weighted estimates reported are based on 7,775,000 students and represent a national estimate of student bullying victims, a procedure the National Center for Education Statistics follows when reporting these and other nationally representative survey data (Bauer et al. 2008; Dinkes, Kemp, and Baum 2009).
Second, the survey uses a stratified, multistage cluster sample design. Analyzing such data without taking this complexity of sampling into account could result in biased estimates. The Bureau of Justice Statistics (2007) recommends that standard errors be computed in a manner that takes this type of sampling into account. The complex sampling design used for the survey
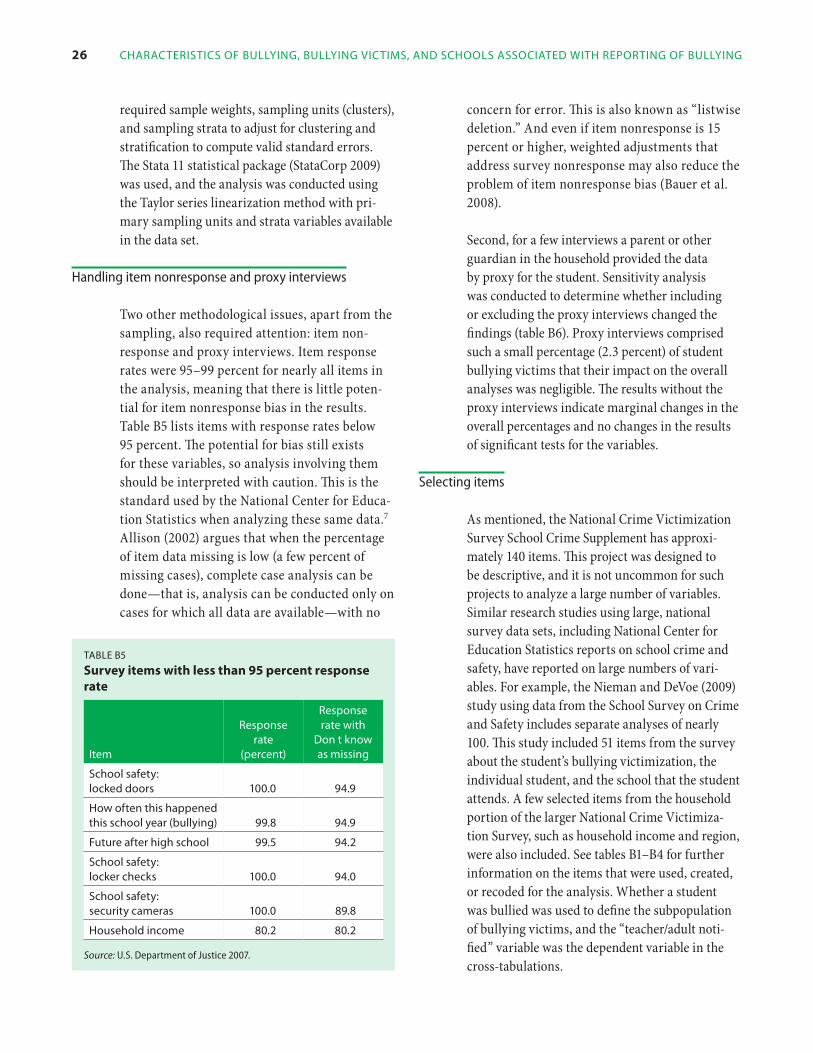
26 characTeriSTicS of bullying, bullying vicTimS, and SchoolS aSSociaTed WiTh reporTing of bullying
required sample weights, sampling units (clusters), and sampling strata to adjust for clustering and stratification to compute valid standard errors. The Stata 11 statistical package (StataCorp 2009) was used, and the analysis was conducted using the Taylor series linearization method with primary sampling units and strata variables available in the data set.
Handling item nonresponse and proxy interviews
Two other methodological issues, apart from the sampling, also required attention: item non-response and proxy interviews. Item response rates were 95–99 percent for nearly all items in the analysis, meaning that there is little potential for item nonresponse bias in the results. Table B5 lists items with response rates below 95 percent. The potential for bias still exists for these variables, so analysis involving them should be interpreted with caution. This is the standard used by the National Center for Education Statistics when analyzing these same data.7
Allison (2002) argues that when the percentage of item data missing is low (a few percent of missing cases), complete case analysis can be done—that is, analysis can be conducted only on cases for which all data are available—with no
concern for error. This is also known as “listwise deletion.” And even if item nonresponse is 15 percent or higher, weighted adjustments that address survey nonresponse may also reduce the problem of item nonresponse bias (Bauer et al. 2008).
Second, for a few interviews a parent or other guardian in the household provided the data by proxy for the student. Sensitivity analysis was conducted to determine whether including or excluding the proxy interviews changed the findings (table B6). Proxy interviews comprised such a small percentage (2.3 percent) of student bullying victims that their impact on the overall analyses was negligible. The results without the proxy interviews indicate marginal changes in the overall percentages and no changes in the results of significant tests for the variables.
“ ’ ”
Table b5
survey items with less than 95 percent response rate
item
response rate
(percent)
response rate with
don t know as missing
School safety: locked doors 100.0 94.9
how often this happened this school year (bullying) 99.8 94.9
future after high school 99.5 94.2
School safety: locker checks 100.0 94.0
School safety: security cameras 100.0 89.8
household income 80.2 80.2
Source: U.S. Department of Justice 2007.
Selecting items
As mentioned, the National Crime Victimization Survey School Crime Supplement has approximately 140 items. This project was designed to be descriptive, and it is not uncommon for such projects to analyze a large number of variables. Similar research studies using large, national survey data sets, including National Center for Education Statistics reports on school crime and safety, have reported on large numbers of variables. For example, the Nieman and DeVoe (2009) study using data from the School Survey on Crime and Safety includes separate analyses of nearly 100. This study included 51 items from the survey about the student’s bullying victimization, the individual student, and the school that the student attends. A few selected items from the household portion of the larger National Crime Victimization Survey, such as household income and region, were also included. See tables B1–B4 for further information on the items that were used, created, or recoded for the analysis. Whether a student was bullied was used to define the subpopulation of bullying victims, and the “teacher/adult notified” variable was the dependent variable in the cross-tabulations.
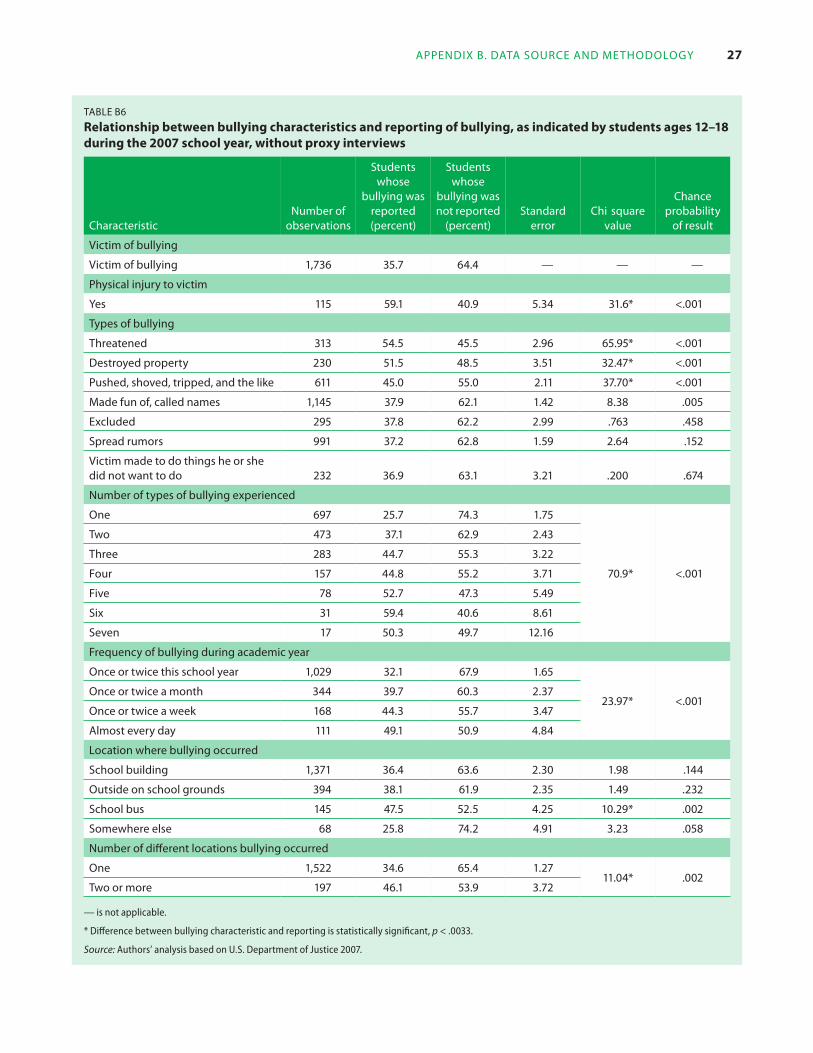
Table b6
Relationship between bullying characteristics and reporting of bullying,during the 2007 school year, without proxy interviews
as indicated by students ages 12–18
Students Students whose whose
bullying was bullying was number of reported not reported
characteristic observations (percent) (percent) Standard
error -chi square
value
chance probability
of result
victim of bullying
victim of bullying 1,736 35.7 64.4 — — —
physical injury to victim
yes 115 59.1 40.9 5.34 31.6* <.001
Types of bullying
Threatened 313 54.5 45.5 2.96 65.95* <.001
destroyed property 230 51.5 48.5 3.51 32.47* <.001
pushed, shoved, tripped, and the like 611 45.0 55.0 2.11 37.70* <.001
made fun of, called names 1,145 37.9 62.1 1.42 8.38 .005
excluded 295 37.8 62.2 2.99 .763 .458
Spread rumors 991 37.2 62.8 1.59 2.64 .152
victim made to do things he or she did not want to do 232 36.9 63.1 3.21 .200 .674
number of types of bullying experienced
one 697 25.7 74.3 1.75
70.9* <.001
Two 473 37.1 62.9 2.43
Three 283 44.7 55.3 3.22
four 157 44.8 55.2 3.71
five 78 52.7 47.3 5.49
Six 31 59.4 40.6 8.61
Seven 17 50.3 49.7 12.16
frequency of bullying during academic year
once or twice this school year 1,029 32.1 67.9 1.65
23.97* <.001 once or twice a month 344 39.7 60.3 2.37
once or twice a week 168 44.3 55.7 3.47
almost every day 111 49.1 50.9 4.84
location where bullying occurred
School building 1,371 36.4 63.6 2.30 1.98 .144
outside on school grounds 394 38.1 61.9 2.35 1.49 .232
School bus 145 47.5 52.5 4.25 10.29* .002
Somewhere else 68 25.8 74.2 4.91 3.23 .058
number of different locations bullying occurred
one 1,522 34.6 65.4 1.27 11.04* .002
Two or more 197 46.1 53.9 3.72
— is not applicable.
* Difference between bullying characteristic and reporting is statistically significant, p < .0033.
Source: Authors’ analysis based on U.S. Department of Justice 2007.
27 appendix b. daTa Source and meThodology
28 characTeriSTicS of bullying, bullying vicTimS, and SchoolS aSSociaTed WiTh reporTing of bullying
There are 15 items within the bullying victimization domain. Because of the small number of bullying victims that experienced each type of physical injury, a single injury item was created by collapsing all physical injury responses (for example, “cuts, scratches,” “bruises, swelling”) together. All seven types of bullying (for example, “being excluded” or “being called names”) were analyzed and used to create an item indicating how many different types of bullying a victim experienced (ranging from one to seven). The frequency and location variables were taken from the Student Crime Supplement, and the location variables were also used to create a new item indicating whether a student was victimized in one or multiple locations. According to Unnever and Cornell (2004), items focused on the severity and frequency of bullying are most relevant to whether bullying is reported.
There are 14 items within the student victim domain. Sociodemographic characteristics (gender, race/ethnicity, and household income) are included because they are routinely analyzed in studies with national survey data (for example, Dinkes, Cataldi, and Lin-Kelly 2008). Because the National Crime Victimization Survey School Crime Supplement is a national survey, an item indicating the region of the country in which the student’s household is located is included to determine whether there are differences between the Census’ Northeast region (which overlaps substantially with Regional Educational Laboratory Northeast and Islands) and other regions of the United States. Prior research (for example, Middleton 2008) indicates the negative relationship of grade level to reporting, so this variable is also included. DeVoe and Kaffenberger (2005) have studied the relationship between academic performance and bullying itself but not between academic performance and reporting of bullying, so academic performance and whether the student has skipped school are included. Four items relevant to “protective factors”—namely relationships with adults and friends at the school—are also included. Students that have an adult at school who cares about them (Benard
2004) or who helps them solve problems may be more likely to disclose being bullied. Students that have a friend whom they can talk to or who helps them solve problems may be less likely to report to a school official. Because the frequency of weapon carrying is very low, the survey items whether a student brought a gun, knife as weapon, or other weapon to school were collapsed into a single item “brought weapon to school.” Whether students were involved in a fight or brought a weapon to school may reflect students’ willingness to protect themselves physically or to personally “settle the score” and not report their victimization to a school official. Finally, the student victim domain also includes a scale based on how fearful the student was of being attacked and on whether the student avoids certain school areas or activities. As fear and avoidance increase, bullying victims may be more reluctant to come forward to report their victimization (Oliver and Candappa 2007).
There are 22 items in the school domain. Items that indicated whether the school was public or private, or church-affiliated, were analyzed to determine whether the reporting of bullying varied by the school’s structural characteristics. Ten items examine school culture and classroom environment. Unnever and Cornell (2004) found that students were more likely to report their bullying if they perceived that the school’s culture was not tolerant of bullying. Other research indicates that schools in which students feel positive toward their school and teachers and schools in which classrooms have few disruptions due to behavioral issues are less likely to have a bullying problem (Swearer et al. 2010). Crime, drug, and bias incidents may signal to students that their school is dangerous and disorderly, which could affect reporting. The school crime and drug problem scale was created by combining 13 items related to those factors. Schools are implementing a variety of security measures (such as metal detectors), so nine items related to security measures in the school were also included.
Some items were not used because they did not have clear, justifiable rationale for inclusion in
29
a project about the reporting of bullying (see table B4). Others that were not analyzed included administrative variables used by Census Bureau interviewers (such as respondent line number) or screening variables used to remove ineligible household members from the School Crime Supplement (such as whether the respondent attended school this year). In a few instances, only the first in a series of items was analyzed. For example, whether the student skipped school during the academic year was analyzed, but the number of days school was skipped was not. In another instance, age was found to be highly correlated with grade level (r = .906) for a sample that only involves students, ages 12–18 and in grades 6–12, so the age variable was not included.
For some items, response categories were collapsed for the analysis. For the most part, this involved items that asked students questions about their level of agreement with a statement. For example, students were provided a statement “School rules are fair,” and asked whether they “agree,” “strongly agree,” “disagree,” or “strongly disagree” with the statement. “Agree” and “strongly agree” responses were combined, as were “disagree” and “strongly disagree” responses.
Scaled items
As mentioned in the previous section, two scales—a student fear of attack and avoidance of school areas or activities scale and a school crime and drug problem scale—were created to simplify the analysis because several items in the National Crime Victimization Survey School Crime Supplement ask about the same underlying construct, and there appeared to be limited value to analyzing and presenting results for the individual items comprising the scales.
For the student fear of attack and avoidance of school areas or activities scale, students were asked three items about their fear at school, their fear on the way to or from school, and their fear about being attacked or harmed outside of school. For these three items, students indicated whether
appendix b. daTa Source and meThodology
they were never afraid, almost never afraid, sometimes afraid, and afraid most of the time. “Never afraid” and “almost never afraid” responses counted for 0 points on the scale, and “sometimes afraid” and “afraid most of the time” responses counted for 1 point on the scale. Students were then asked 11 items about whether they avoided school, certain activities at school, or certain locations in the school because of their fear of attack. Each location or activity that a student avoided because of fear of attack counted for 1 point on the scale.
The school crime and drug problem scale measured whether the student knew other students who brought a loaded gun to school, whether he or she had seen another student with a loaded gun at school, whether he or she could have acquired a loaded gun at school, whether gangs were at school, whether gangs were involved in selling drugs at school, whether gangs at school were involved in fights and violence, whether he or she had seen hate-related words and symbols at school, whether he or she was offered drugs or alcohol during the academic year, whether he or she knew other students on drugs or alcohol, whether it was possible to get alcohol at school, whether it was possible to get marijuana at school, whether it was possible to get prescription drugs at school, and whether it was possible to get crack, cocaine, or other drugs at school. Each “yes” response counted for 1 point on the scale.
Because both scales comprised yes or no (0 or 1) responses to individual items, the Kuder-Richardson coefficient of reliability of the individual items was computed. Some researchers advocate minimum reliability coefficients with dichotomous data between .70 and .80 (Netemeyer, Bearden, and Sharma 2003; Robinson, Shaver, and Wrightsman 1991). When rounded, both reliability coefficients are .80 or higher. The reliability coefficients were computed on the sample of bullying victims rather than the entire sample. A pointbiserial correlation was calculated between each scale and reporting of bullying. The student fear of attack and avoidance of school areas and activities
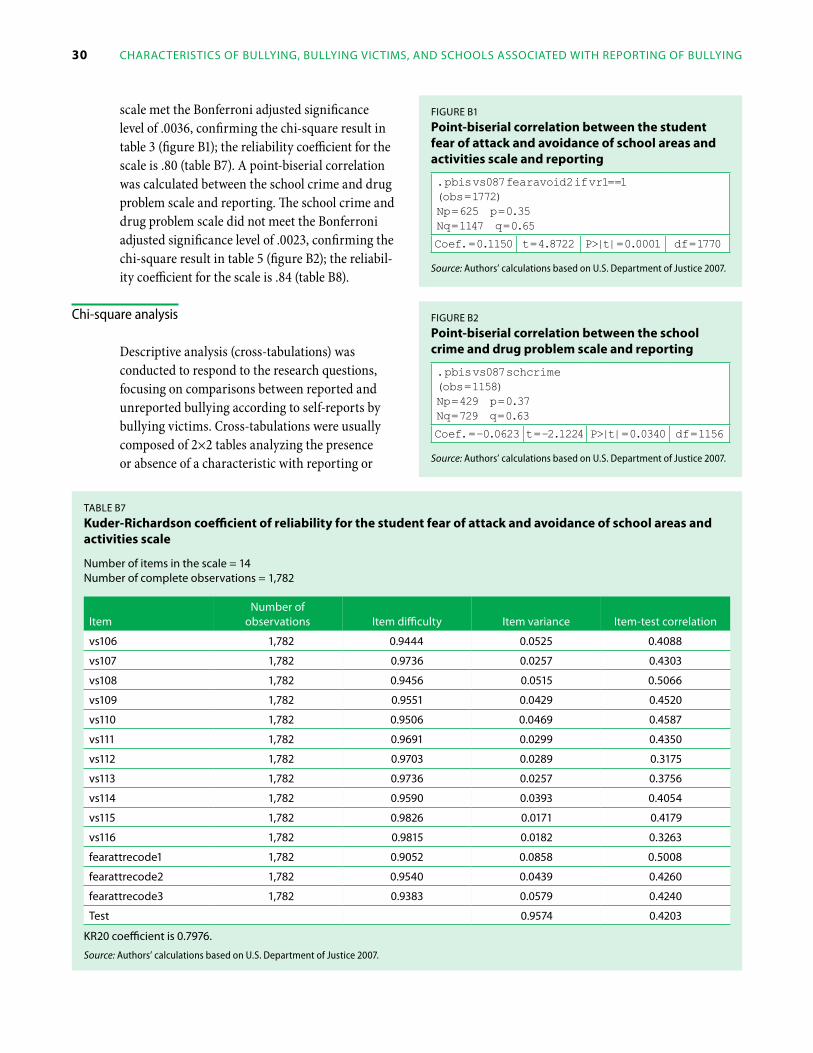
30 characteristics of bullying, bullying victims, and schools associated with reporting of bullying
scale met the Bonferroni adjusted significance level of .0036, confirming the chi-square result in table 3 (figure B1); the reliability coefficient for the scale is .80 (table B7). A point-biserial correlation was calculated between the school crime and drug problem scale and reporting. The school crime anddrug problem scale did not meet the Bonferroni adjusted significance level of .0023, confirming the chi-square result in table 5 (figure B2); the reliabil-ity coefficient for the scale is .84 (table B8).
Chi-square analysis
Descriptive analysis (cross-tabulations) was conducted to respond to the research questions, focusing on comparisons between reported and unreported bullying according to self-reports by bullying victims. Cross-tabulations were usually composed of 2×2 tables analyzing the presence or absence of a characteristic with reporting or
figure b1 Point-biserial correlation between the student fear of attack and avoidance of school areas and activities scale and reporting
. pbis vs087 fearavoid2 if vr1==1(obs = 1772)Np = 625 p = 0.35Nq = 1147 q = 0.65
Coef. = 0.1150 t = 4.8722 P>|t| = 0.0001 df = 1770
Source: Authors’ calculations based on U.S. Department of Justice 2007.
figure b2 Point-biserial correlation between the school crime and drug problem scale and reporting
. pbis vs087 schcrime(obs = 1158)Np = 429 p = 0.37Nq = 729 q = 0.63
Coef. = –0.0623 t = –2.1224 P>|t| = 0.0340 df = 1156
Source: Authors’ calculations based on U.S. Department of Justice 2007.
table b7 Kuder-Richardson coefficient of reliability factivities scale
or the student fear of attack and avoidance of school areas and
number of items in the scale = 14number of complete observations = 1,782
number of item observations item difficulty item variance item-test correlation
vs106 1,782 0.9444 0.0525 0.4088
vs107 1,782 0.9736 0.0257 0.4303
vs108 1,782 0.9456 0.0515 0.5066
vs109 1,782 0.9551 0.0429 0.4520
vs110 1,782 0.9506 0.0469 0.4587
vs111 1,782 0.9691 0.0299 0.4350
vs112 1,782 0.9703 0.0289 0.3175
vs113 1,782 0.9736 0.0257 0.3756
vs114 1,782 0.9590 0.0393 0.4054
vs115 1,782 0.9826 0.0171 0.4179
vs116 1,782 0.9815 0.0182 0.3263
fearattrecode1 1,782 0.9052 0.0858 0.5008
fearattrecode2 1,782 0.9540 0.0439 0.4260
fearattrecode3 1,782 0.9383 0.0579 0.4240
test 0.9574 0.4203
Kr20 coefficient is 0.7976.
Source: Authors’ calculations based on U.S. Department of Justice 2007.
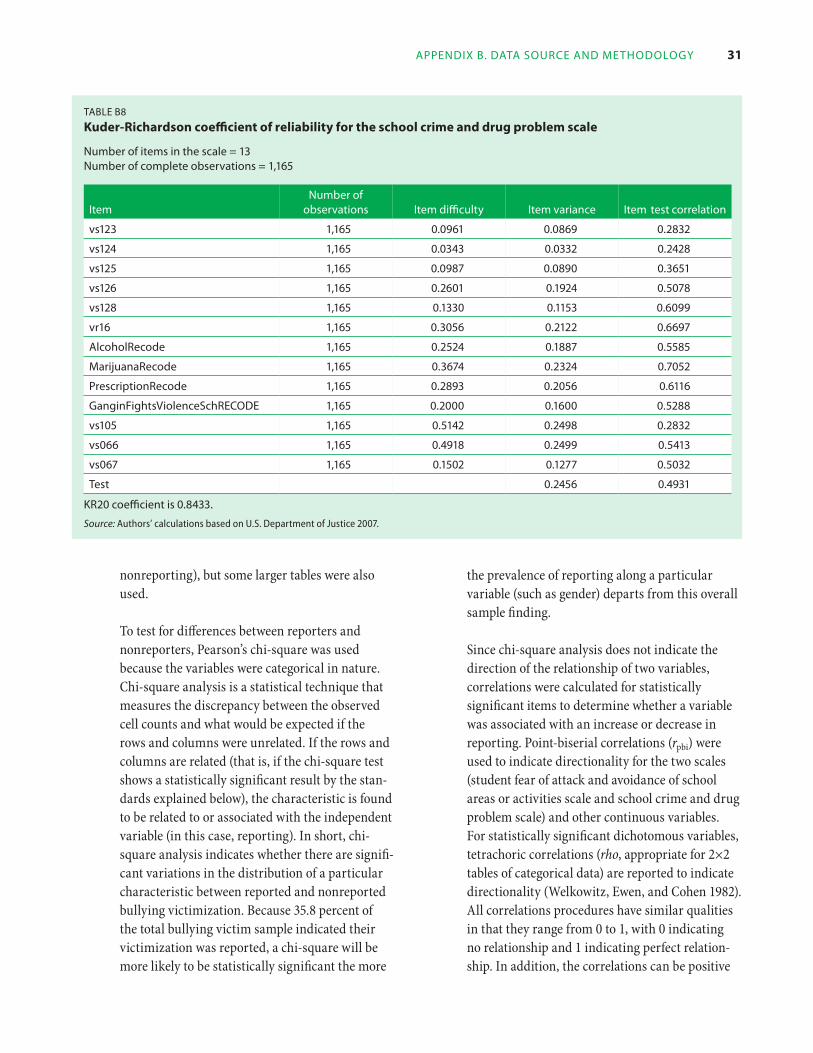
Table b8
Kuder-Richardson coefficient of reliability for the school crime and drug problem scale
number of items in the scale = 13 number of complete observations = 1,165
number of item observations item difficulty item variance -item test correlation
vs123 1,165 0.0961 0.0869 0.2832
vs124 1,165 0.0343 0.0332 0.2428
vs125 1,165 0.0987 0.0890 0.3651
vs126 1,165 0.2601 0.1924 0.5078
vs128 1,165 0.1330 0.1153 0.6099
vr16 1,165 0.3056 0.2122 0.6697
alcoholrecode 1,165 0.2524 0.1887 0.5585
marijuanarecode 1,165 0.3674 0.2324 0.7052
prescriptionrecode 1,165 0.2893 0.2056 0.6116
ganginfightsviolenceSchrecode 1,165 0.2000 0.1600 0.5288
vs105 1,165 0.5142 0.2498 0.2832
vs066 1,165 0.4918 0.2499 0.5413
vs067 1,165 0.1502 0.1277 0.5032
Test 0.2456 0.4931
Kr20 coefficient is 0.8433.
Source: Authors’ calculations based on U.S. Department of Justice 2007.
31 appendix b. daTa Source and meThodology
nonreporting), but some larger tables were also used.
To test for differences between reporters and nonreporters, Pearson’s chi-square was used because the variables were categorical in nature. Chi-square analysis is a statistical technique that measures the discrepancy between the observed cell counts and what would be expected if the rows and columns were unrelated. If the rows and columns are related (that is, if the chi-square test shows a statistically significant result by the standards explained below), the characteristic is found to be related to or associated with the independent variable (in this case, reporting). In short, chi-square analysis indicates whether there are significant variations in the distribution of a particular characteristic between reported and nonreported bullying victimization. Because 35.8 percent of the total bullying victim sample indicated their victimization was reported, a chi-square will be more likely to be statistically significant the more
the prevalence of reporting along a particular variable (such as gender) departs from this overall sample finding.
Since chi-square analysis does not indicate the direction of the relationship of two variables, correlations were calculated for statistically significant items to determine whether a variable was associated with an increase or decrease in reporting. Point-biserial correlations (rpbi) were used to indicate directionality for the two scales (student fear of attack and avoidance of school areas or activities scale and school crime and drug problem scale) and other continuous variables. For statistically significant dichotomous variables, tetrachoric correlations (rho, appropriate for 2×2 tables of categorical data) are reported to indicate directionality (Welkowitz, Ewen, and Cohen 1982). All correlations procedures have similar qualities in that they range from 0 to 1, with 0 indicating no relationship and 1 indicating perfect relationship. In addition, the correlations can be positive
32 characTeriSTicS of bullying, bullying vicTimS, and SchoolS aSSociaTed WiTh reporTing of bullying
or negative to indicate the directionality of the relationship (Welkowitz, Ewen, and Cohen 1982).
The initial threshold to determine statistical significance was set at p = .05 (two-tailed). But because of the number of significance tests conducted, there is an increased likelihood of some results being statistically significant due to chance. To guard against this, a Bonferroni multiple comparison procedure was calculated to adjust for the number of significance tests (Bland and Altman 1995). Specifically, the critical value of the significance test (0.05) was divided by the number of statistical tests calculated within each of the three research domains: 15 analyses were conducted in the characteristics of bullying victimization domain (research question 1), 14 analyses in the characteristics of bullying victims domain (research question 2), and 22 analyses in the characteristics of bullying victims’ schools domain (research question 3). The Bonferroni procedure yields adjusted statistical significance levels of 0.0033 for characteristics of bullying victimization, 0.0036 for characteristics of bullying victims, and 0.0023 for characteristics of bullying victims’ schools. These adjusted levels are used to identify statistically significant associations.
Regardless of whether the findings are statistically significant, it is important to note that all the data analysis is descriptive and does not allow for causal interpretation. No conclusions about the effectiveness of school policies and strategies on the reporting of bullying can be reached.
Further limitations of the study
The National Crime Victimization Survey School Crime Supplement was designed to present data on a wide range of crime, safety, and discipline issues in schools; it is not focused specifically on bullying. It contains only one item on whether the bullying experienced was reported to an adult, and that item is not linked to any specific bullying incident or time sequence, so it cannot be determined whether reporting occurred after a specific type of bullying or after a specific amount of time.
The survey also relies on respondents to self-determine their condition as a victim of bullying using their own interpretation and conceptions to define a situation as bullying. Although this is considered an improvement over official reports because bullying victims are often reluctant to report victimization to school officials, self-reports are susceptible to other biases (Unnever and Cornell 2004). Similar situations may not be labeled as bullying by different respondents. The survey does not specifically mention how often victimization has to be repeated to be defined as bullying. Students are asked how persistent the bullying has been, and responses can range from “once or twice this school year” to “nearly every day.” The National Center for Education Statistics includes all students who have experienced bullying as bullying victims regardless of how often the bullying occurred, a position also taken for this study. Some students may be reluctant to tell an interviewer about being bullied, so some victims may not be reported as such. Although research conducted across 14 countries by Smith et al. (2002) indicates that children are able to differentiate bullying from teasing and other behaviors, the extent of bullying misspecification in the National Crime Victimization Survey School Crime Supplement is unknown. Ideally, other measures related to bullying status and whether it was reported would be derived from independent observation or other means. But having variables that represent students’ interpretation of their surroundings that may influence reporting, which is of primary interest to this investigation, may be viewed as a strength. No attempt was made by the survey researchers or by the research team to determine whether students correctly self-reported their bullying victimization, their reporting to school officials, or any other information they provided interviewers.
The states in which students reside are not identified in the publicly available survey data, so it is not possible to provide more fine-grained analysis by jurisdiction. However, analysis conducted using the national sample take advantage of the statistical power provided by the increased sample size. The data do permit classification by Census region
33 appendix b. daTa Source and meThodology
(“Northeast” comprises the seven Regional Educational Laboratory Northeast and Islands states— Connecticut, Maine, Massachusetts, New Hampshire, New York, Rhode Island, and Vermont—as well as Pennsylvania and New Jersey, but does not include the U.S. Virgin Islands or Puerto Rico. Table 2 shows the results of one analysis that compares the Northeast region with other regions.
The survey results obtained from these data would have more credibility if validated by other research. The data on whether bullying victims reported their victimization to school officials cannot be verified independently to determine the accuracy of the estimates, but another way to validate survey findings is to determine whether the estimates reported in this project are “reasonable.” To do this, other U.S. national survey results that include items on bullying and reporting to school officials are needed. Although there are a few national surveys that include an item about bullying (such as the Youth Risk Behavior Surveillance System), none that includes an item about the reporting of bullying victimization by student victims to school officials could be found. Middleton (2008) included a question on reporting, but that study covered Oklahoma only and did not indicate the time frame for which students were asked to recall their victimization (the School Crime Supplement asks students to indicate whether they were victimized during the past academic year). The age groups covered by the survey are also different (the School Crime Supplement does not cover students in grades 3 and 5, so only students in grade 7 could be compared). The Unnever and Cornell (2004) study, which was a more intensive investigation of reporting, includes only middle schools (grades 6–8) in Roanoke, Virginia.
The cross-tabulations conducted for this study consist of descriptive analysis of the relationship of one variable (within the three domains of bullying victimization, bullying victim, or bullying victims’ schools) with another (reporting or nonreporting). Such simple cross-tabulations do not control for additional variables, as could be done, for example, in a more advanced multivariate statistical analysis.
The data analysis is also limited to the variables available in the data set. Other unmeasured variables that may influence reporting behavior cannot be accounted or controlled for. Moreover, the instrument does not ask students whether they witnessed bullying and reported it. Bystander nonreporting in bullying is considered a critical ingredient to the “culture of silence” in schools (see, for example, Hendricks 2008). There are also no data on bullying perpetrators, and victims are not asked about the characteristics of their victimizers in the National Crime Victimization Survey School Crime Supplement. Unnever and Cornell (2004) were able to analyze the “perceived toleration of bullying at the school” in their analysis of reporting versus unreported bullying in Roanoke, Virginia, but the National Crime Victimization Survey School Crime Supplement does not include such items in its questionnaire.
Finally, sampling error presents another limitation. Because the sample of students selected for each administration of the School Crime Supplement is just one of many possible samples that could have been selected, it is possible that estimates from a given sample may differ from estimates that would have been produced from other randomly drawn student samples.
34 characTeriSTicS of bullying, bullying vicTimS, and SchoolS aSSociaTed WiTh reporTing of bullying
noTes Psychologists, the National Association of Secondary School Principals, Fight Crime: Invest
The authors thank the following people for their in Kids, the Learning Disabilities Association comments and assistance at various stages of the of America, and the National PTA. project: Candice Bocala, Rebecca Carey, Katie Culp, David Farrington, Craig Hoyle, Kevin 5. Approximately 0.6 percent of students who Huang, Jo Louie, Susan Mundry, Laura O’Dwyer, were bullied did not respond to the item about Dan Oleweus, OK-Choon Park, David Perda, Jan whether the bullying incident was reported to Phlegar, Mary Stenson, Maria Ttofi, Jill Weber, a teacher or some other adult at the school. and the ATS peer reviewers.
6. Weights are numbers added or accumulated 1. It could not be determined whether the U.S. to obtain universe estimates of particular
Virgin Islands is considering anti-bullying events. The final weight is a multiplier that legislation at the time of writing. indicates how many times a particular sample
record is to be counted (U.S. Department of 2. Personal correspondence, Lourdes Rivera- Justice, Office of Justice Programs, Bureau of
Putz, December 2, 2008. Justice Statistics 2007).
3. Personal correspondence, Lourdes Rivera 7. National Center for Education Statistics (2010) Putz, December 2, 2008. Statistical Standard 2-2-2-4 states that, “If the
item response rate is below 85 percent for any 4. Organizations that are part of the coalition items used in a report, a nonresponse bias
include the American Federation of Teach- analysis is also required for each of those items ers, the National Association of School (this does not include individual test items).”
35 referenceS
RefeRences
Allison, P.D. (2002). Missing data. Thousand Oaks, CA: Sage.
Associated Press. (2009, September 14). School bullying laws give scant protection. USA Today. Retrieved from http://www.usatoday.com/news/education/2009-09-14 -bullying-laws_N.htm
Bauer, L., Guerino, P., Nolie, K.L., Tang, S.W., and Chandler, K. (2008). Student victimization in U.S. schools: results from the 2005 school crime supplement to the National Crime Victimization Survey. Washington, DC: U.S. Department of Education, Institute of Education Sciences.
Benard, B. (2004). Resiliency: what have we learned. San Francisco, CA: WestEd.
Bland, J.M. and Altman, D. (1995). Multiple significance tests: the Bonferroni method. Statistics Notes. British Medical Journal, 310, 170.
Boorstein, M. (2004, November 7). In suit, VA teen accuses schoolmates of bullying. The Washington Post, p. C1.
Canadian Psychological Association. (2009). Policy statements: bullying in children and youth. Retrieved from http://www.cpa.ca/aboutcpa/policystatements/#Bullying.
CNN (2001, March 8). Study: kids rate bullying and teasing as big problem. Retrieved from http://archives.cnn. com/2001/US/03/08/violence.survey/.
Dawson, D. (2006, July 31). Girls take school to court, saying it ignored bullying. Retrieved from http://abcnews. go.com/US/LegalCenter/story?id=2256089andpage=1.
DeVoe, J.F., and Kaffenberger, S.K. (2005). Student reports of bullying: results from the 2001 School Crime Supplement to the National Crime Victimization Survey (NCES 2005-310). Washington, DC: U.S. Department of Education.
Dinkes, R., Cataldi, E.F., and Lin-Kelly, W. (2008). Indicators of school crime and school safety: 2007. Washington, DC: U.S. Department of Education, Institute of
Education Sciences, National Center for Education Statistics.
Dinkes, R., Kemp, J., and Baum, K. (2009). Indicators of school crime and safety: 2008 (NCES 2009–022/NCJ 226343). Washington, DC: U.S. Department of Education, Institute of Education Sciences, National Center for Education Statistics, and U.S. Department of Justice, Office of Justice Programs, Bureau of Justice Statistics.
Education Development Center (2008). Changing the rules of the game. EDC Update Spring, 3–4.
Farrington, D.P., and Ttofi, M.M. (2009). Reducing school bullying: evidence-based implications for policy. Crime and Justice: An Annual Review of Research, 38, 281–345.
Fekkes, M., Pijpers, F., and Verloove-Vanhorick, S. (2004). Bullying behavior and associations with psychosomatic complaints and depression in victims. Journal of Pediatrics, 144(1), 17–22.
Fekkes, M., Pijpers, F., and Verloove-Vanhorick, S. (2005). Bullying: who does what, when and where? Involvement of children, teachers and parents in bullying behavior. Health Education Research, 20(1), 81–91.
Fosse, G.K., and Holen, A. (2002). Childhood environment of adult psychiatric outpatients in Norway having been bullied in school. Child Abuse and Neglect, 26(2), 129–137.
Fox, J. A., Elliot, D., Kerlikowske, R.G., Newman, S., and Christeson, W. (2003). Bullying prevention is crime prevention. Washington, DC: Fight Crime: Invest in Kids.
Garbarino, J., and DeLara, E. (2003). And words can hurt forever: how to protect adolescents from bullying, harassment and emotional violence. New York: Simon and Schuster.
Glew, G.M., Fan, M.Y., Keaton, W., Rivera, F.P., and Kernic, M.A. (2005). Bullying, psychosocial adjustment, and academic performance in elementary school. Archives of Pediatric and Adolescent Medicine, 159(11), 1026–1031.
36 characTeriSTicS of bullying, bullying vicTimS, and SchoolS aSSociaTed WiTh reporTing of bullying
Griffin, R.S., and Gross, A.M. (2004). Childhood bullying: current empirical findings and future directions for research. Aggression and Violent Behavior 9, 379–400.
Hagan, F.E. (1993). Research methods in criminal justice and criminology. Third edition. New York: MacMillan.
Halligan, J. (2005, August 17). Death by cyber-bully. Boston Globe. Retrieved from http://www.boston.com/news/ globe/editorial_opinion/oped/articles/2005/08/17/ death_by_cyber_bully/.
Hendricks, L. (2008, December 22). Schools target bullies. The Daily News (Newburyport, MA). Retrieved from http://www.newburyportnews.com/punews/local_ story_356234448.html.
Hergert, L. (2004). Bullying and students with disabilities: summary report of parent focus groups. Newton, MA: Education Development Center. Retrieved from http:// www.urbancollaborative.org/pdfs/Bullying.pdf.
Juvonen, J., Graham, S., and Schuster, M.A. (2003). Bullying among young adolescents: the strong, the weak, and the troubled. Pediatrics 112(6), 1231–1237.
Kaiser Family Foundation. (2001). Talking with kids about tough issues: a national survey of parents and kids. Retrieved June 3, 2010, from http://www.talkwithkids. org/nickelodeon/details.pdf.
Kazdin, A. and Rotella, C. (2009, August 11). Bullies: they can be stopped, but it takes a village. Slate. Retrieved March 3, 2010, from http://www.slate.com/id/2249424.
King, L., and Hendricks, L. (2010, February 8). Local schools work to combat bullying: recent incidents serve to highlight ongoing issue. The Daily News (Newburyport, MA). Retrieved from http://www.newburyportnews. com/punews/local_story_038222912.html.
Klass, P. (2009, June 9). At last, facing down bullies (and their enablers). New York Times, p. D-5.
Larkin, D. (2007). Vermont girls report facing bullying, harassment. Retrieved from http://www.timesargus.com/apps/ pbcs.dll/article?AID=/20070321/NEWS01/703210355/1002.
Maine Governor’s Children’s Cabinet. (2006). Maine’s best practices bullying and harassment prevention: a guide for schools and communities. Augusta, ME: Maine Governor’s Children’s Cabinet.
Marshall, M.P. (2010, March 9). Students get a message: no bullying at Pine Grove. The Daily News (Newburyport, MA). Retrieved from http://www.newburyportnews. com/punews/local_story_067232804.html/ resources_etp_mobile_story.
Martindale, S. (2009, June 1). Parents of teen who shot himself file $3 million claim against district. OC [Orange County] Register. Retrieved from http://articles.latimes.com/2009/jun/04/local/ me-suicide-bully4.
Middleton, K. (2008). Bullying perceptions of third, fifth and seventh grade students in Oklahoma public schools, 2005. Oklahoma City: Oklahoma Department of Health.
National Crime Prevention Council. (2008). Bullying. Retrieved from http://www.ncpc.org/topics/bullying.
National Institutes of Health. (2001, April 24). Bullying widespread in U.S. schools, survey finds. NIH News Release. Retrieved from http://www.nichd.nih.gov/news/ releases/bullying.cfm.
National Safe Schools Partnership. (2007). Bridging the gap in federal law: promoting safe schools and improved student achievement by preventing bullying and harassment in our schools. Washington, DC: National Safe Schools Partnership. Retrieved from https://sites.nea. org/schoolsafety/images/bridginggap.pdf.
Neiman, S., and DeVoe, J.F. (2009). Crime, violence, discipline, and safety in U.S. public schools: findings from the school survey on crime and safety: 2007–08 (NCES 2009-326). Washington, DC: U.S. Department of Education, Institute of Education Sciences, National Center for Education Statistics.
Netemeyer, R.G., Bearden, W.O., and Sharma, S. (2003). Scaling procedures: issues and applications. Thousand Oaks, CA: Sage Publications.
37 referenceS
Oliver, C., and Candappa, M. (2007). Bullying and the politics of telling. Oxford Review of Education, 33(1), 71–86.
Olweus, D. (1993). Bullying at school: what we know and what we can do. New York: Blackwell.
Parker-Roerdon, L., Rudewick, D., and Gorton, D. (2007). Direct from the field: a guide to bullying prevention. Boston, MA: Commonwealth of Massachusetts, Department of Public Health.
Pepler, D., and Craig, W. (Eds.). (2008). Understanding and addressing bullying: an international perspective. Bloomington, IN: Authorhouse.
Peterson, L. (2009, June 10). Officials hope anonymous online reports will reduce bullying. The Tampa Tribune. Retrieved from http://www2.tbo.com/content/2009/jun/10/ school-officials-hope-anonymous-online-reports-wil/.
Rigby, K. (2003). Consequences of bullying in schools. Canadian Journal of Psychiatry, 48(9), 583–590.
Robinson, J. P., Shaver, P. R., and Wrightsman, L. S. (1991). Criteria for scale selection and evaluation. In J. P. Robinson, P. R. Shaver, and L. S. Wrightsman (Eds.), Measures of personality and social psychological attitudes (pp. 1–15). San Diego, CA: Academic Press.
Sampson, R. (2004). Bullying in schools: problem-oriented guides for police. Problem-Specific Guides Series. Guide No. 12. Washington, DC: Office of Community-Oriented Policing Services, U.S. Department of Justice.
Sidorowicz, K., Hair, E.C., and Milot, A. (2009). Assessing bullying: a guide for out-of-school program practitioners. Research-to-Results Brief, Publication No. 2009–42. Washington, DC: Child Trends.
Smith, P.K., Cowie, H., Olafsson, R.F., and Liefooghe, A. (2002). Definitions of bullying: a comparison of terms used, and age and gender differences, in a fourteen country international comparison. Child Development, 73, 1119–1133.
Sourander, A., Helstelä, L, Helenius, H., and Piha, J. (2000). Persistence of bullying from childhood to
adolescence—a longitudinal 8-year follow-up study. Child Abuse and Neglect 24(7), 873–881.
Sourander A., Jensen P, Ronning J.A., Elonheimo, H., Niemela, S., Helenius, H., et al. (2007) Childhood bullies and victims and their risk of criminality in late adolescence: the Finnish From a Boy to a Man study. Archives of Pediatric and Adolescent Medicine. 161, 546–552.
Srabstein, J., and Piazza, T. (2008). Public health, safety, and educational risks associated with bullying behaviors in American adolescents. International Journal of Adolescent Medicine and Health, 20(2), 223–233.
StataCorp. (2009). Stata users guide: release 11. College Station, TX: StataCorp LP.
Swearer, S.M., Espelage, D.L., Valliancourt, T., and Hymel, S. (2010). What can be done about school bullying? Linking research to educational practice. Educational Researcher 39(1), 38–48.
Teicher, S.A. (2006, October 19). How students can break the ‘code of silence.’ Christian Science Monitor, p. 15.
Unnever, J.D., and Cornell, D.G. (2004). Middle school victims of bullying: who reports being bullied? Aggressive Behavior 30, 373–388.
U.S. Department of Education, Institute of Education Sciences, National Center for Education Statistics. (2010). Statistical standards: planning and design of surveys. (NCES Standard 2-2). Retrieved from http://nces. ed.gov/statprog/2002/std2_2.asp.
U.S. Department of Justice, Office of Justice Programs, Bureau of Justice Statistics. (2007). National Crime Victimization Survey, School Crime Supplement, 2005 [Codebook]. Ann Arbor, MI: Interuniversity Consortium for Political and Social Research.
U.S. Department of Justice, Office of Justice Programs, Bureau of Justice Statistics. (2009). National Crime Victimization Survey, School Crime Supplement, 2007 [Codebook]. Ann Arbor, MI: Interuniversity Consortium for Political and Social Research.
38 characTeriSTicS of bullying, bullying vicTimS, and SchoolS aSSociaTed WiTh reporTing of bullying
Vaznis, J. (2009, November 15). Support swells for anti-bullying legislation. Boston Globe. Retrieved from http://www.boston.com/ news/education/k_12/articles/2009/11/15/ support_swells_for_anti_bully_legislation/?page=1.
Vossekull, B., Fein, R., Reddy, M., Borum, R., and Modzeleski, W. (2002). The final report and findings of the safe school initiative: implications for prevention of school attacks in the United States. Washington, DC: U.S. Secret Service and U.S. Department of Education.
Welkowitz, J., Ewen, R.B., and Cohen, J. (1982). Introductory statistics for the behavioral sciences. Third edition. San Diego, CA: Harcourt Brace Jovanovich.
The White House. (2009). Prepared remarks of President Barack Obama: Back to School Event, September 8, 2009, Arlington, Virginia. Retrieved December 17, 2009, from http://www.whitehouse.gov/ MediaResources/PreparedSchoolRemarks/