wepp—a process-based hydrology and erosion model for watershed assessment and restoration
DESCRIPTION
WEPP—A Process-Based Hydrology and Erosion Model for Watershed Assessment and Restoration. Joan Wu, Markus Flury, and Shuhui Dun Washington State University, Pullman, WA Don McCool USDA ARS PWA, Pullman, WA Bill Elliot USDA FS RMRS, Moscow, ID Dennis Flanagan - PowerPoint PPT PresentationTRANSCRIPT

WEPP—A Process-Based Hydrology WEPP—A Process-Based Hydrology and Erosion Model for Watershed and Erosion Model for Watershed
Assessment and RestorationAssessment and Restoration
Joan Wu, Markus Flury, and Shuhui DunJoan Wu, Markus Flury, and Shuhui Dun
Washington State University, Pullman, WAWashington State University, Pullman, WA
Don McCoolDon McCool
USDA ARS PWA, Pullman, WAUSDA ARS PWA, Pullman, WA
Bill ElliotBill Elliot
USDA FS RMRS, Moscow, IDUSDA FS RMRS, Moscow, ID
Dennis FlanaganDennis Flanagan
USDA ARS NSERL, West Lafayette, INUSDA ARS NSERL, West Lafayette, IN

The NeedsThe Needs Protecting and improving water quality in agricultural
watersheds are major goals of numerous federal, state and local agencies. For many watersheds, sediment is the greatest pollutant
In watershed assessment, it is crucial to understand sedimentation processes and their impacts on water quality
To successfully implement erosion control practices, it is necessary to determine the spatio-temporal distribution of sediment sources and potential long-term effectiveness of sediment reduction by these practices

Surface runoff and erosion from undisturbed forests are negligible
Stream formed due to subsurface flow has low sediment

Both surface runoff and erosion can increase dramatically due to disturbances
Models are needed as a tool for forest resource management

The WEPP ModelThe WEPP Model
WEPP: Water Erosion Prediction Project a process-based erosion prediction model developed by the USDA
ARS to replace the functional model USLE
built on fundamentals of hydrology, plant science, hydraulics, and erosion mechanics
WEPP uses observed or stochastically-generated climate inputs to predict spatial and temporal distributions of soil detachment and deposition on an event or continuous basis, along a hillslope or across a watershed
Equipped with a geospatial processing interface, WEPP is a promising tool in watershed assessment and management

The WEPP Model cont’d
WEPP Windows Interface
WEPP Internet Interface
GeoWEPP

Long-term Research EffortsLong-term Research Efforts
Goal Continuously develop, refine and apply the WEPP model for
watershed assessment and restoration under different land-use, climatic and hydrologic conditions
Objectives Improve the subsurface hydrology routines so that WEPP can be
used under both infiltration-excess and saturation-excess runoff conditions in crop-, range- and forestlands
Improve the winter hydrology and erosion routines through combined experimentation and modeling so that WEPP can be used for quantifying water erosion in the US PNW and other cold regions where winter hydrology is important
Continually test the suitability of WEPP using data available from different localities within and outside the US

Progresses MadeProgresses Made
Numerous modifications to WEPP have been made to Correct the hydraulic structure routines
Improve the water balance algorithms
Incorporate the Penman-Monteith ET method (UN FAO standard)
Improve the subsurface lateral flow routines
Expand and improve winter hydrology routines to better simulate
Freeze-thaw processes
Snow redistribution processes
WEPP new releases accessible at NSERL’s website http://topsoil.nserl.purdue.edu/nserlweb/index.html

WEPP Applications

DEM Effects on WEPPErosion Modeling
Paradise Creek Watershed, ID
Zhang et al. (2008) Int. J. Geogr. Info. Sci.

Erosion Effect of Cropping Systems Experimental plots, University of Bologna, Italy
Cooperative Graduate Exchange program and collaborative researchCooperative Graduate Exchange program and collaborative research State-of-the-science research facilityState-of-the-science research facility
Pieri et al. (2006) J. Hydrol

WEPP Applicationsfor Watershed Erosion Modeling
Reeder Experimental Watershed at the USDA ARS CPCRC, Pendleton, OR (Dr. John Williams)
Mica Creek Watershed, ID (Dr. Katy Kavanagh)
Centonara Watershed, Bologna, Italy (Drs. Marco Bitteli and Paola Rossi)
http://www.cnr.uidaho.edu/micacreek/ Courtesy of D. Mantovani
Forest Hydrologic Modeling: Predominance of Subsurface Lateral Flow
Dun, S., J.Q. Wu, W.J Elliot, P.R. Robichaud, D.C. Flanagan, J.R. Frankenberger, R.E. Brown, A.C. Xu, 2008. J. Hydrol (in review)

Comparison of ProcessesComparison of Processes
* Earlier versions of WEPP typically overestimated Dp

RedistributionRedistributionof Infiltration Water in WEPPof Infiltration Water in WEPP
E v a p o ra tio na n d
T ra n sp ira tio n
D e e pP e rc o la tio n
S u b su rfa c eL a te ra l
F lo w
In filtra ted W a ter
22 3311

Study Site: Hermada WatershedStudy Site: Hermada Watershed

Physical SettingPhysical Setting
Located in the Boise National Forest, SE Lowman, ID
Instrumented during 1995−2000 to collect whether, runoff, and erosion data
5-yr observed data showing an average annual precipitation of 954 mm, among which nearly 30% was runoff

Watershed DiscretizationWatershed Discretization

Model InputsModel Inputs
TopographyTopography Derived from 30-m DEMs using GeoWEPPDerived from 30-m DEMs using GeoWEPP 10-ha in area, 3 hillslopes and 1 channel10-ha in area, 3 hillslopes and 1 channel 40−60% slope40−60% slope
SoilSoil Typic Cryumbrept loamy sand 500 mm in depthTypic Cryumbrept loamy sand 500 mm in depth
underlying weathered graniteunderlying weathered granite
ManagementManagement 1992 cable-yarding harvest1992 cable-yarding harvest 1995 prescribed fire1995 prescribed fire
West and North slopes with low-severity burnWest and North slopes with low-severity burn South slope and channel unburnedSouth slope and channel unburned
ClimateClimate 11/1995−09/2000 observed data11/1995−09/2000 observed data

Results

* (a) and (b) unburned S slope; (c) and (d) burned W slope
Living Biomass and Ground Cover(WEPP v2006.5)
(a)
Liv
ing
Bio
mas
s (k
g m
-2)
0
1
2
3
4
5
(c)
O J A J O J A J O J A J O J A J O J A J O
Liv
ing
Bio
mas
s (k
g m
-2)
0
1
2
3
4
5
(b)
Gro
un
d C
ove
r (%
)
70
80
90
100
(d)
O J A J O J A J O J A J O J A J O J A J O
Gro
un
d C
ove
r (%
)
70
80
90
100
PredictedObserved
1996 1997 1998 1999 2000 1996 1997 1998 1999 2000

Runoff and Erosion: Obs. vs Pre.Runoff and Erosion: Obs. vs Pre.(WEPP v2004.7 vs v2006.5)(WEPP v2004.7 vs v2006.5)
Water Year
Precipitation (mm)
Observed Watershed Discharge
(mm)
Observed Sediment
(t/ha)
Simulated Hillslope Runoff (mm)
Simulated Hillslope
Lateral Flow (mm)
Simulated Watershed Discharge
(mm)
Simulated Watershed Sediment
(t/ha)1995–1996 1106 321 0 31 0 11 01996–1997 1200 421 0 0 0 10 0.21997–1998 919 224 0 0 0 0 01998–1999 809 237 0 0 0 0 01999–2000 737 174 0 0 0 0 0
Average 954 275 0 6 0 4 0.0
Water Year
Precipitation (mm)
Observed Watershed Discharge
(mm)
Observed Sediment
(t/ha)
Simulated Hillslope Runoff (mm)
Simulated Hillslope
Lateral Flow (mm)
Simulated Watershed Discharge
(mm)
Simulated Watershed Sediment
(t/ha)1995–1996 1106 321 0 0 414 398 01996–1997 1200 421 0 0 419 403 0.21997–1998 919 224 0 6 132 126 01998–1999 809 237 0 0 222 214 01999–2000 737 174 0 0 182 175 0
Average 954 275 0 2 274 263 0.0

Current EffortsCurrent Efforts Improvements have been continually made to the WEPP
model
Current WEPP has seen broad applicability in watershed assessment, restoration and management
A recently initiated study supported by the US Forest Service Pacific Southwest Research Station is aimed at development of a process-based tool For objectively evaluating the impact of specific management practices on
erosion in the Lake Tahoe basin; and
For assisting in the design and evaluation of erosion control management practices
Through this study, we will continue to better the WEPP model so that it can be used as a reliable and cost-efficient tool under different hydrologic and climatic conditions

Thank You!
Questions?
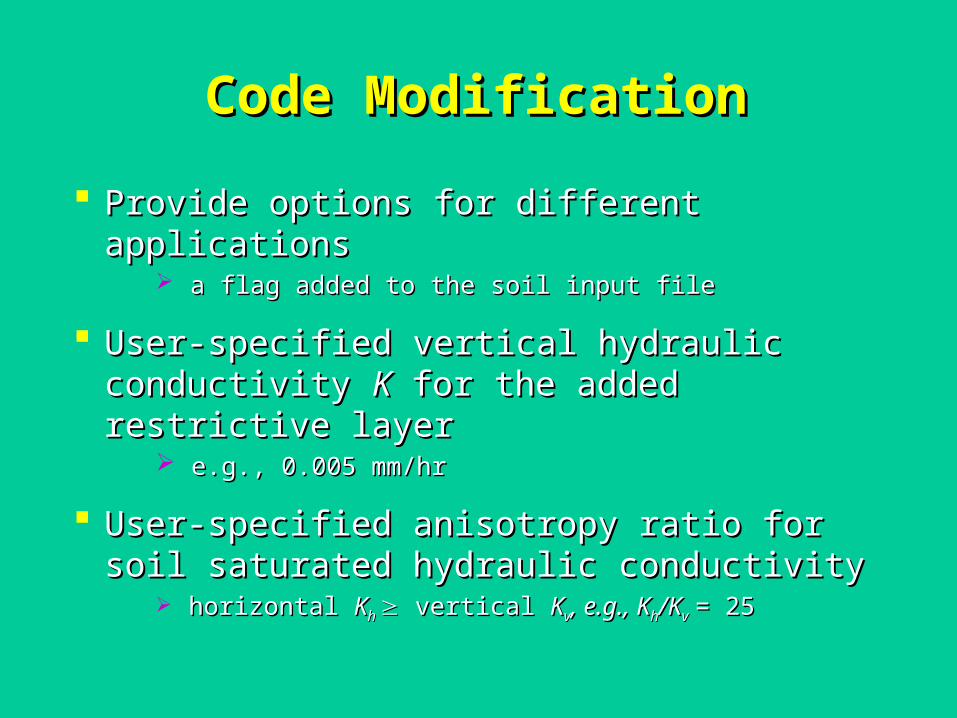
Code ModificationCode Modification
Provide options for different applicationsProvide options for different applications a flag added to the soil input filea flag added to the soil input file
User-specified vertical hydraulic conductivity User-specified vertical hydraulic conductivity KK for the added restrictive layer for the added restrictive layer
e.g., 0.005 mm/hre.g., 0.005 mm/hr
User-specified anisotropy ratio for soil User-specified anisotropy ratio for soil saturated hydraulic conductivitysaturated hydraulic conductivity
horizontal horizontal KKh h vertical vertical KKvv, e.g., K, e.g., Khh/K/Kvv = 25= 25

Code ModificationCode Modification cont’dcont’d
Subroutines modified to properly write the “pass” filesWEPP’s approach to passing outputsSubsurface flow not “passed” previously
Simplified hillslope-channel relationAll subsurface runoff from hillslopes assumed to enter
the channelFlow added and sediment neglected