wells fargo energy symposium -...
TRANSCRIPT
Wells Fargo
Energy Symposium December 9, 2014
1 Strong. Innovative. Growing.
Forward-Looking Statements
This presentation contains forward-looking statements within the meaning of the federal securities laws. Forward-looking
statements are not guarantees of performance. They involve risks, uncertainties and assumptions. The future results of
EnLink Midstream, LLC, EnLink Midstream Partners, LP and their respective affiliates (collectively known as “EnLink
Midstream”) may differ materially from those expressed in the forward-looking statements contained throughout this
presentation and in documents filed with the Securities and Exchange Commission (“SEC”). Many of the factors that will
determine these results are beyond EnLink Midstream’s ability to control or predict. These statements are necessarily
based upon various assumptions involving judgments with respect to the future, including, among others, drilling levels;
the dependence on Devon Energy Corporation for a substantial portion of the natural gas that EnLink Midstream
gathers, processes and transports; EnLink Midstream’s lack of asset diversification; EnLink Midstream’s vulnerability to
having a significant portion of its operations concentrated in the Barnett Shale; the amount of hydrocarbons transported
in EnLink Midstream’s gathering and transmission lines and the level of its processing and fractionation operations;
fluctuations in oil, natural gas and natural gas liquids (NGL) prices; construction risks in its major development projects;
changes in EnLink Midstream’s credit rating; its ability to consummate future acquisitions, successfully integrate any
acquired businesses, realize any cost savings and other synergies from any acquisition; changes in the availability and
cost of capital; competitive conditions in EnLink Midstream’s industry and their impact on its ability to connect
hydrocarbon supplies to its assets; operating hazards, natural disasters, weather-related delays, casualty losses and
other matters beyond its control; and the effects of existing and future laws and governmental regulations, including
environmental and climate change requirements and other uncertainties and other factors discussed in EnLink
Midstream’s Annual Reports on Form 10-K for the year ended December 31, 2013, and in EnLink Midstream’s other
filings with the SEC. You are cautioned not to put undue reliance on any forward-looking statement. EnLink Midstream
has no obligation to publicly update or revise any forward-looking statement, whether as a result of new information,
future events or otherwise.
2
Non-GAAP Financial Information
This presentation contains non-generally accepted accounting principle financial measureS that EnLink Midstream
refers to as adjusted EBITDA, gross operating margin and segment cash flows. Adjusted EBITDA is defined as net
income plus interest expense, provision for income taxes, depreciation and amortization expense, stock-based
compensation, (gain) loss on noncash derivatives, transaction costs, distribution of equity investment and non-
controlling interest; and income (loss) on equity investment. Gross operating margin is defined as revenue less the cost
of purchased gas, NGLs, condensate and crude oil. Segment cash flows is defined as revenue less the cost of
purchased gas, NGLs, condensate, crude oil and operating and maintenance expenditures. The amounts included in the
calculation of these measures are computed in accordance with generally accepted accounting principles (GAAP).
EnLink Midstream believes these measures is useful to investors because it may provide users of this financial
information with meaningful comparisons between current results and prior-reported results and a meaningful measure
of EnLink Midstream’s cash flow after it has satisfied the capital and related requirements of its operations.
Adjusted EBITDA, gross operating margin and segment cash flows, as defined above, are not measures of financial
performance or liquidity under GAAP. They should not be considered in isolation or as an indicator of EnLink
Midstream’s performance. Furthermore, they should not be seen as measures of liquidity or a substitute for metrics
prepared in accordance with GAAP.
3

4
Our Strategy: Stability Plus Growth
Stability of cash flows ~95% fee-based contracts
~50% of gross operating margin from long-term Devon contracts
Top tier midstream energy service for our customers
Leverage Devon Energy sponsorship for growth Potential additional adjusted EBITDA from dropdowns: ~$375 MM by 2017
Serve Devon E&P portfolio in its growth areas
Strong organic growth South Louisiana, West Texas and Ohio River Valley (ORV) expansion projects
Top tier balance sheet Investment grade credit rating at ENLK since inception
Note: Adjusted EBITDA and gross operating margin are non-GAAP financial measures and are explained on page 3.
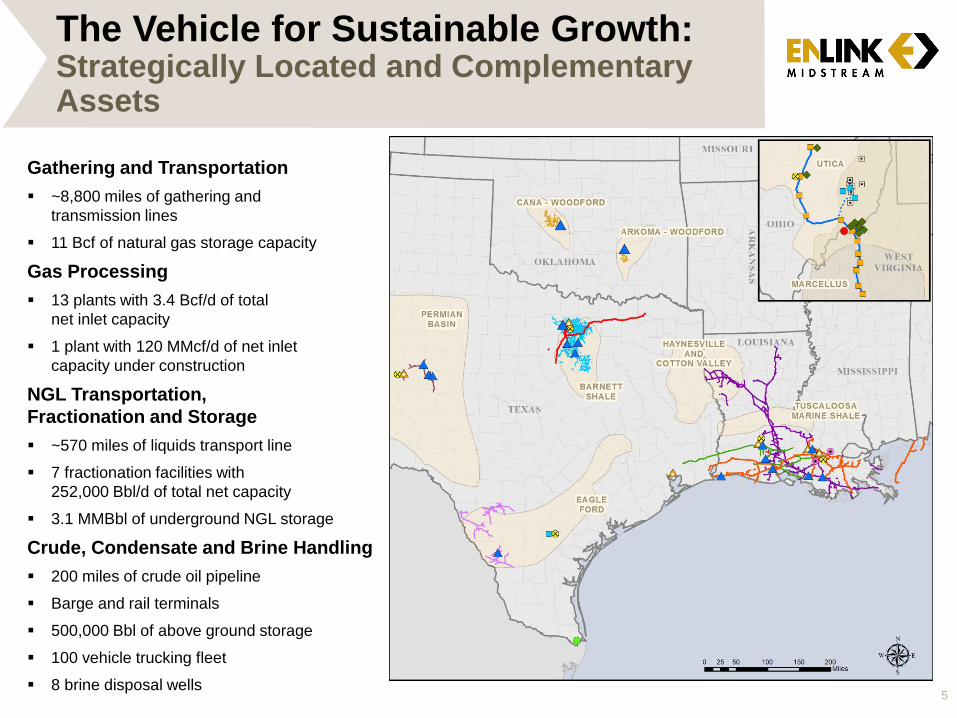
The Vehicle for Sustainable Growth: Strategically Located and Complementary Assets
Gathering and Transportation
~8,800 miles of gathering and
transmission lines
11 Bcf of natural gas storage capacity
Gas Processing
13 plants with 3.4 Bcf/d of total
net inlet capacity
1 plant with 120 MMcf/d of net inlet
capacity under construction
NGL Transportation,
Fractionation and Storage
~570 miles of liquids transport line
7 fractionation facilities with
252,000 Bbl/d of total net capacity
3.1 MMBbl of underground NGL storage
Crude, Condensate and Brine Handling
200 miles of crude oil pipeline
Barge and rail terminals
500,000 Bbl of above ground storage
100 vehicle trucking fleet
8 brine disposal wells
5
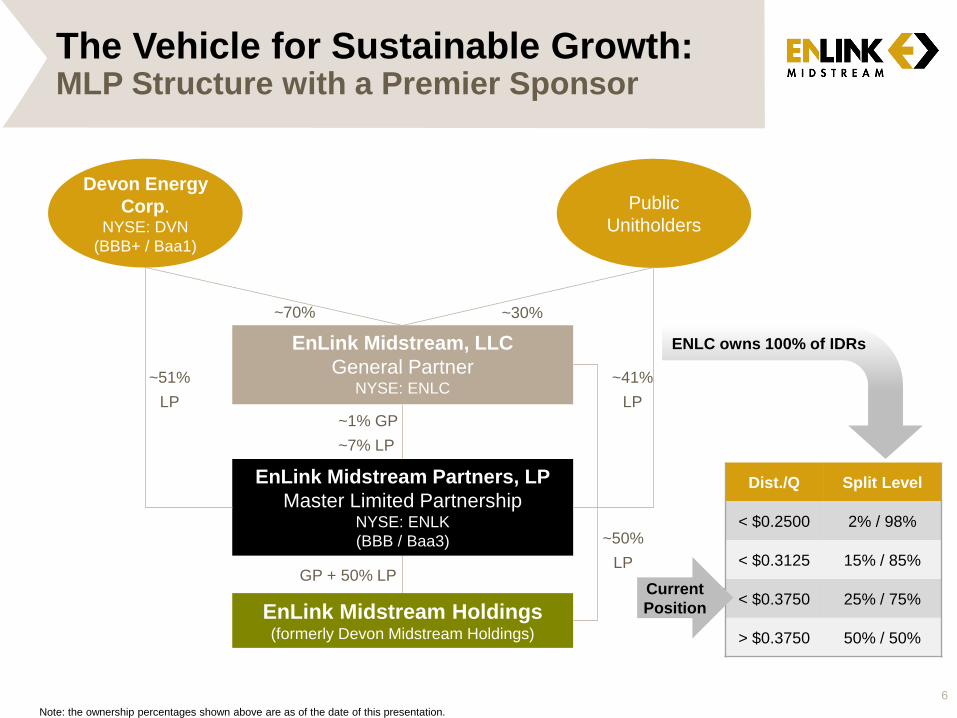
EnLink Midstream Partners, LP
Master Limited Partnership NYSE: ENLK
(BBB / Baa3)
EnLink Midstream, LLC
General Partner NYSE: ENLC
Public
Unitholders
~70% ~30%
~1% GP
~7% LP
EnLink Midstream Holdings (formerly Devon Midstream Holdings)
~51%
LP
~41%
LP
50% LP
Devon Energy
Corp. NYSE: DVN
(BBB+ / Baa1)
GP + 50% LP
The Vehicle for Sustainable Growth: MLP Structure with a Premier Sponsor
6
Dist./Q Split Level
< $0.2500 2% / 98%
< $0.3125 15% / 85%
< $0.3750 25% / 75%
> $0.3750 50% / 50%
Current
Position
ENLC owns 100% of IDRs
~50%
LP
Note: the ownership percentages shown above are as of the date of this presentation.
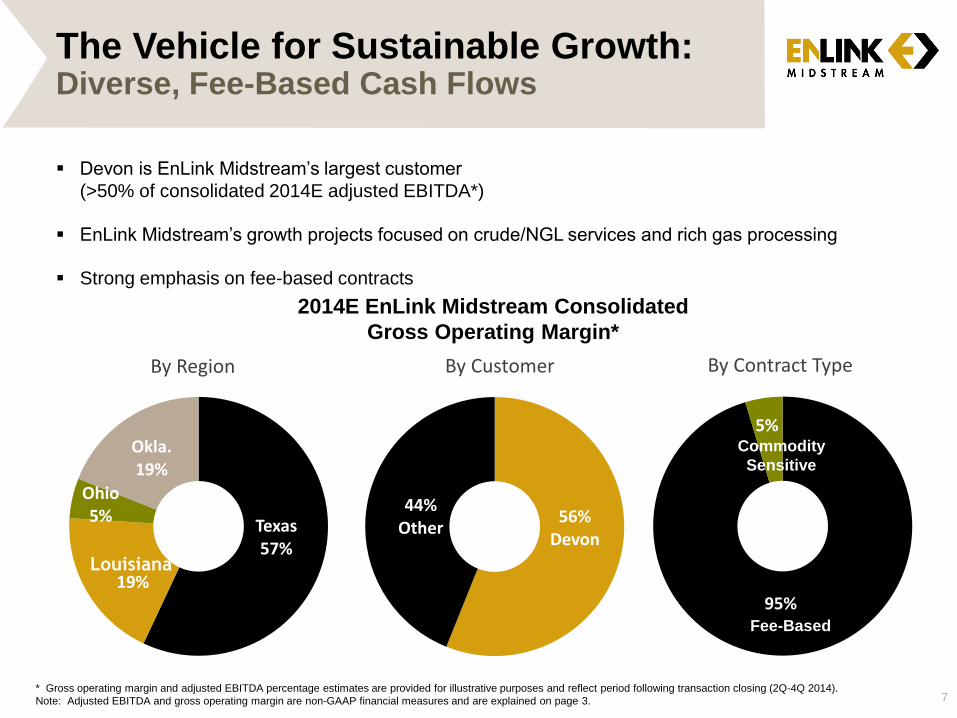
The Vehicle for Sustainable Growth: Diverse, Fee-Based Cash Flows
Devon is EnLink Midstream’s largest customer
(>50% of consolidated 2014E adjusted EBITDA*)
EnLink Midstream’s growth projects focused on crude/NGL services and rich gas processing
Strong emphasis on fee-based contracts
2014E EnLink Midstream Consolidated
Gross Operating Margin*
95%
5%
By Contract Type
Texas 57%
19%
Ohio 5%
Okla. 19%
By Region
56% Devon
44% Other
By Customer
Fee-Based
Commodity
Sensitive
* Gross operating margin and adjusted EBITDA percentage estimates are provided for illustrative purposes and reflect period following transaction closing (2Q-4Q 2014).
Note: Adjusted EBITDA and gross operating margin are non-GAAP financial measures and are explained on page 3.
Louisiana
7
The Four Avenues for Growth
8
9
Avenue 1:
Drop Downs
Organic Growth
Projects
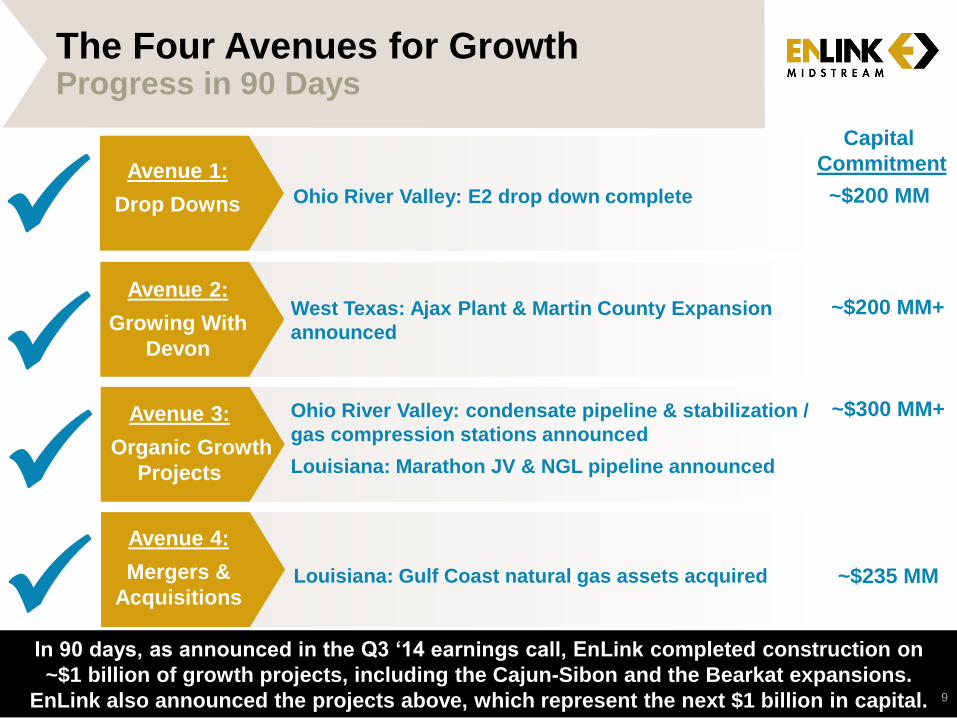
The Four Avenues for Growth Progress in 90 Days
Ohio River Valley: E2 drop down complete
Avenue 2:
Growing With
Devon
West Texas: Ajax Plant & Martin County Expansion
announced
Avenue 3:
Organic Growth
Projects
Ohio River Valley: condensate pipeline & stabilization /
gas compression stations announced
Louisiana: Marathon JV & NGL pipeline announced Avenue 4:
Mergers &
Acquisitions Louisiana: Gulf Coast natural gas assets acquired
~$200 MM
~$200 MM+
~$300 MM+
~$235 MM
In 90 days, as announced in the Q3 ‘14 earnings call, EnLink completed construction on
~$1 billion of growth projects, including the Cajun-Sibon and the Bearkat expansions.
EnLink also announced the projects above, which represent the next $1 billion in capital. 9
Capital
Commitment
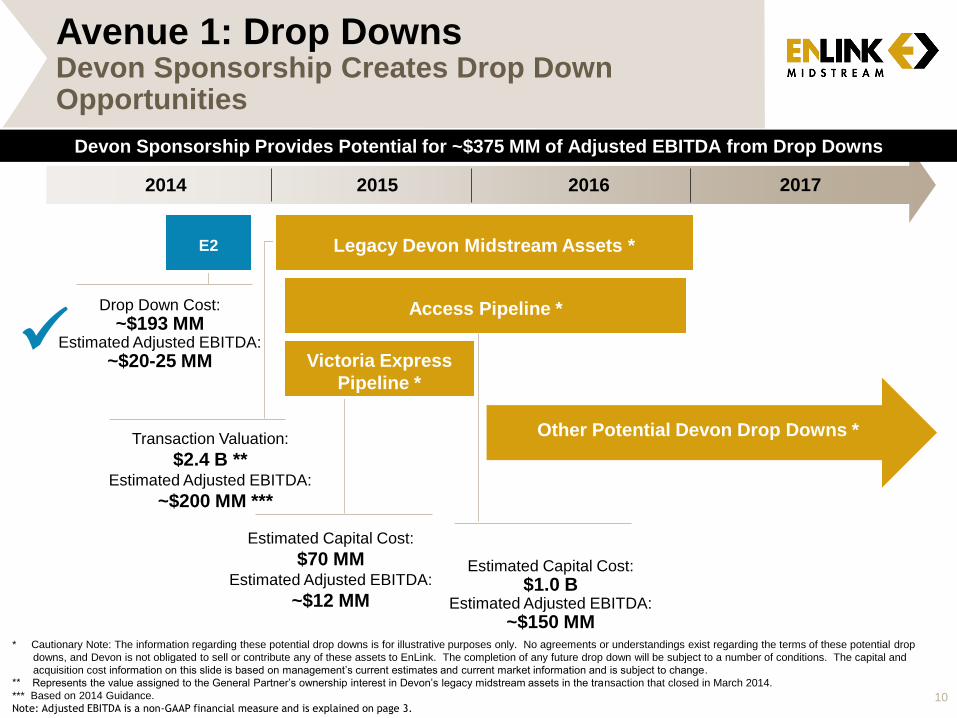
Avenue 1: Drop Downs Devon Sponsorship Creates Drop Down Opportunities
10
2014 2015 2016 2017
Devon Sponsorship Provides Potential for ~$375 MM of Adjusted EBITDA from Drop Downs
Other Potential Devon Drop Downs *
E2 Legacy Devon Midstream Assets *
Access Pipeline *
Victoria Express
Pipeline *
* Cautionary Note: The information regarding these potential drop downs is for illustrative purposes only. No agreements or understandings exist regarding the terms of these potential drop
downs, and Devon is not obligated to sell or contribute any of these assets to EnLink. The completion of any future drop down will be subject to a number of conditions. The capital and
acquisition cost information on this slide is based on management’s current estimates and current market information and is subject to change.
** Represents the value assigned to the General Partner’s ownership interest in Devon’s legacy midstream assets in the transaction that closed in March 2014.
*** Based on 2014 Guidance.
Note: Adjusted EBITDA is a non-GAAP financial measure and is explained on page 3.
Drop Down Cost:
~$193 MM Estimated Adjusted EBITDA:
~$20-25 MM
Estimated Capital Cost:
$1.0 B Estimated Adjusted EBITDA:
~$150 MM
Transaction Valuation:
$2.4 B ** Estimated Adjusted EBITDA:
~$200 MM ***
Estimated Capital Cost:
$70 MM Estimated Adjusted EBITDA:
~$12 MM
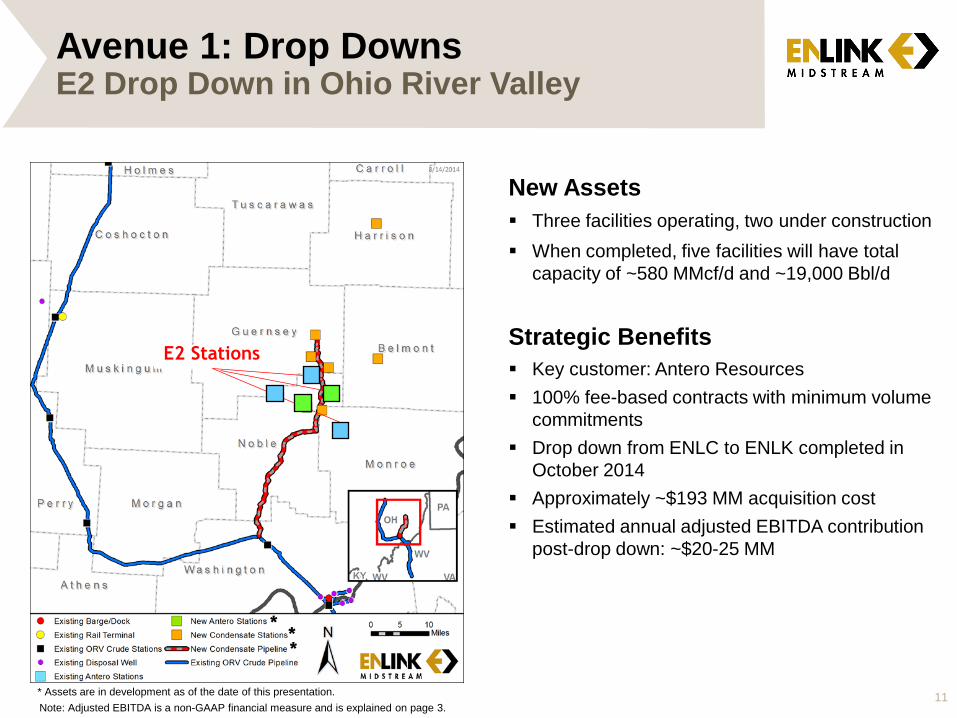
Avenue 1: Drop Downs E2 Drop Down in Ohio River Valley
11
New Assets
Three facilities operating, two under construction
When completed, five facilities will have total
capacity of ~580 MMcf/d and ~19,000 Bbl/d
Strategic Benefits
Key customer: Antero Resources
100% fee-based contracts with minimum volume
commitments
Drop down from ENLC to ENLK completed in
October 2014
Approximately ~$193 MM acquisition cost
Estimated annual adjusted EBITDA contribution
post-drop down: ~$20-25 MM
E2 Stations
* * *
* Assets are in development as of the date of this presentation.
Note: Adjusted EBITDA is a non-GAAP financial measure and is explained on page 3.
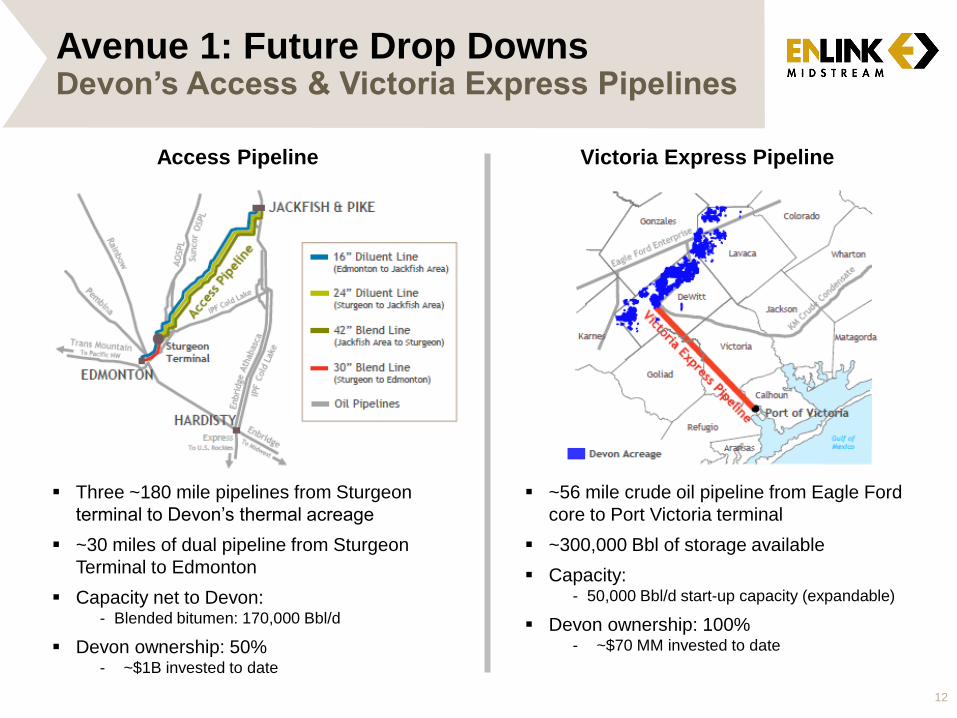
Avenue 1: Future Drop Downs Devon’s Access & Victoria Express Pipelines
12
Three ~180 mile pipelines from Sturgeon
terminal to Devon’s thermal acreage
~30 miles of dual pipeline from Sturgeon
Terminal to Edmonton
Capacity net to Devon: - Blended bitumen: 170,000 Bbl/d
Devon ownership: 50% - ~$1B invested to date
~56 mile crude oil pipeline from Eagle Ford
core to Port Victoria terminal
~300,000 Bbl of storage available
Capacity: - 50,000 Bbl/d start-up capacity (expandable)
Devon ownership: 100% - ~$70 MM invested to date
Access Pipeline Victoria Express Pipeline
13
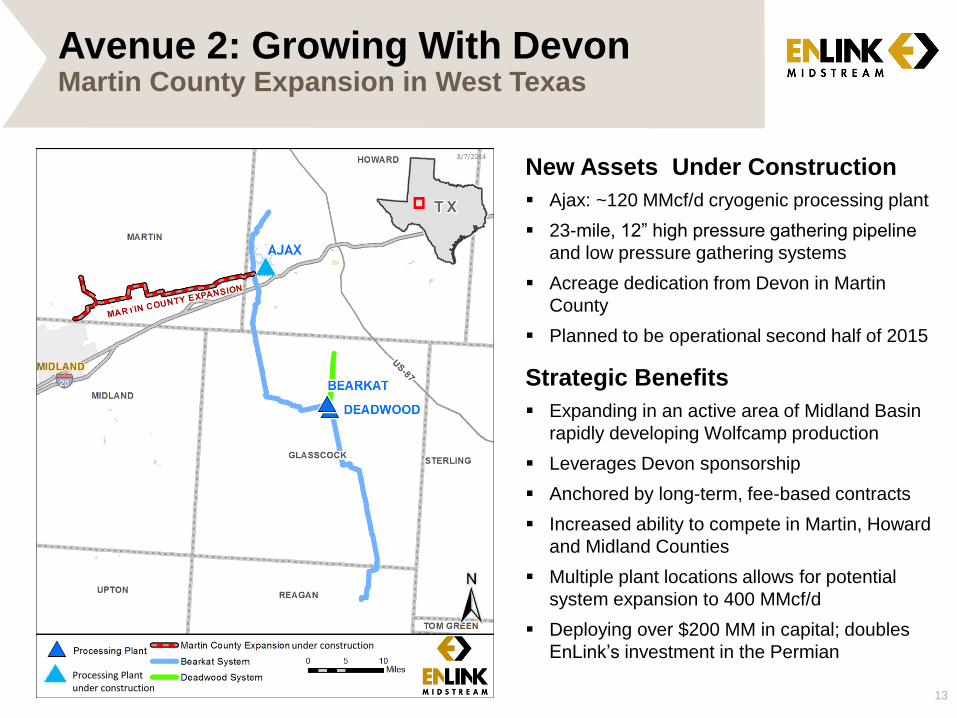
Avenue 2: Growing With Devon Martin County Expansion in West Texas
under construction
Processing Plant under construction
AJAX
New Assets Under Construction
Ajax: ~120 MMcf/d cryogenic processing plant
23-mile, 12” high pressure gathering pipeline
and low pressure gathering systems
Acreage dedication from Devon in Martin
County
Planned to be operational second half of 2015
Strategic Benefits
Expanding in an active area of Midland Basin
rapidly developing Wolfcamp production
Leverages Devon sponsorship
Anchored by long-term, fee-based contracts
Increased ability to compete in Martin, Howard
and Midland Counties
Multiple plant locations allows for potential
system expansion to 400 MMcf/d
Deploying over $200 MM in capital; doubles
EnLink’s investment in the Permian
Avenue 2: Growing With Devon Significant Production Growth in Cana-Woodford
Devon Assets in the Cana-Woodford
Devon Rigs in Cana
Q3 ‘14: 1 rig
Expected by Q1 2015: 10+ rigs
Acreage: ~280,000 net acres
Acquired 50,000 net acres in June ‘14
Workover activity yielding excellent
results
Acid treatments performed on 200+ wells
Avg. rates per well increased 1-2+ MMCFE/d
Payback period <3 months
Identified >100 additional future locations
Significant undrilled well inventory
Total Cana risked locations: >5,000
14
EnLink Assets in the Cana-Woodford
Pipeline: 410 miles, 530 MMcf/d capacity
Processing: one plant with 350 MMcf/d capacity
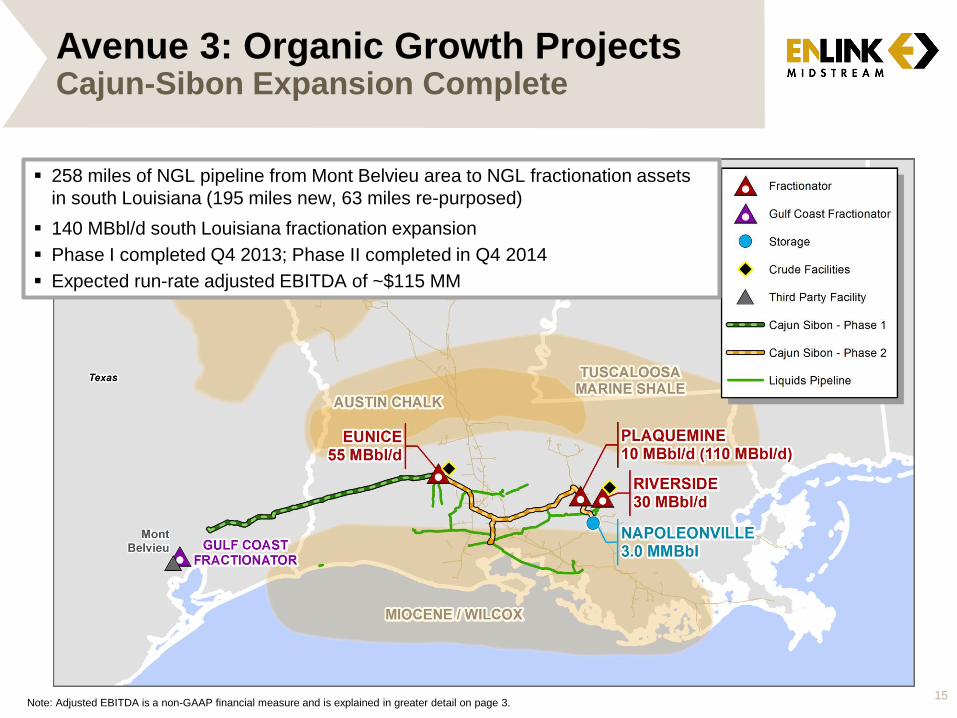
Avenue 3: Organic Growth Projects Cajun-Sibon Expansion Complete
258 miles of NGL pipeline from Mont Belvieu area to NGL fractionation assets
in south Louisiana (195 miles new, 63 miles re-purposed)
140 MBbl/d south Louisiana fractionation expansion
Phase I completed Q4 2013; Phase II completed in Q4 2014
Expected run-rate adjusted EBITDA of ~$115 MM
15 Note: Adjusted EBITDA is a non-GAAP financial measure and is explained in greater detail on page 3.
16
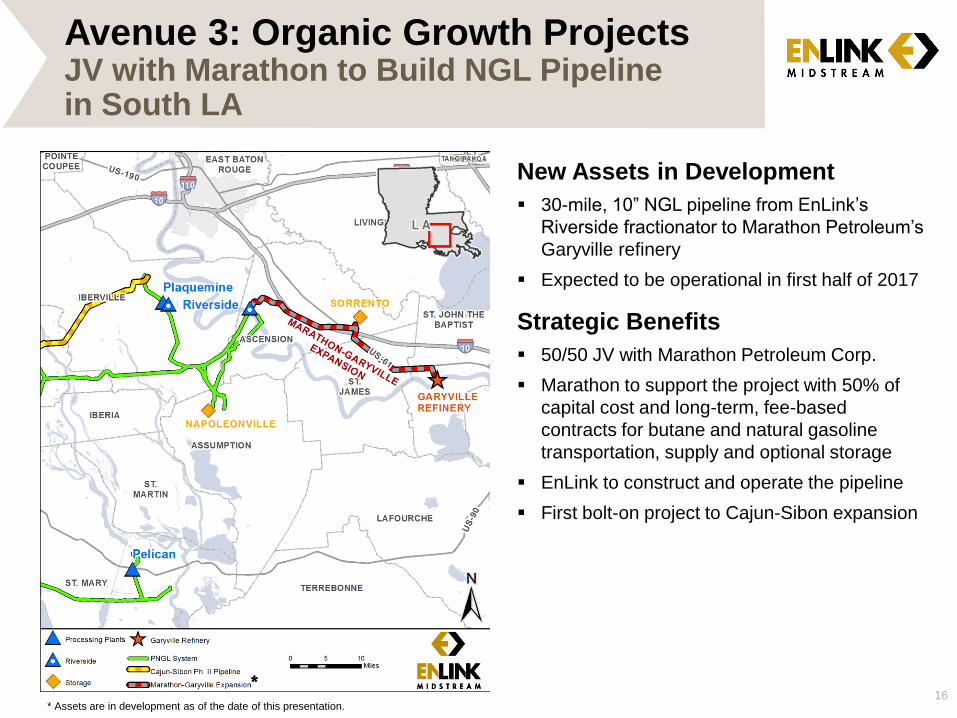
New Assets in Development
30-mile, 10” NGL pipeline from EnLink’s
Riverside fractionator to Marathon Petroleum’s
Garyville refinery
Expected to be operational in first half of 2017
Strategic Benefits
50/50 JV with Marathon Petroleum Corp.
Marathon to support the project with 50% of
capital cost and long-term, fee-based
contracts for butane and natural gasoline
transportation, supply and optional storage
EnLink to construct and operate the pipeline
First bolt-on project to Cajun-Sibon expansion
Avenue 3: Organic Growth Projects JV with Marathon to Build NGL Pipeline in South LA
* * Assets are in development as of the date of this presentation.
17
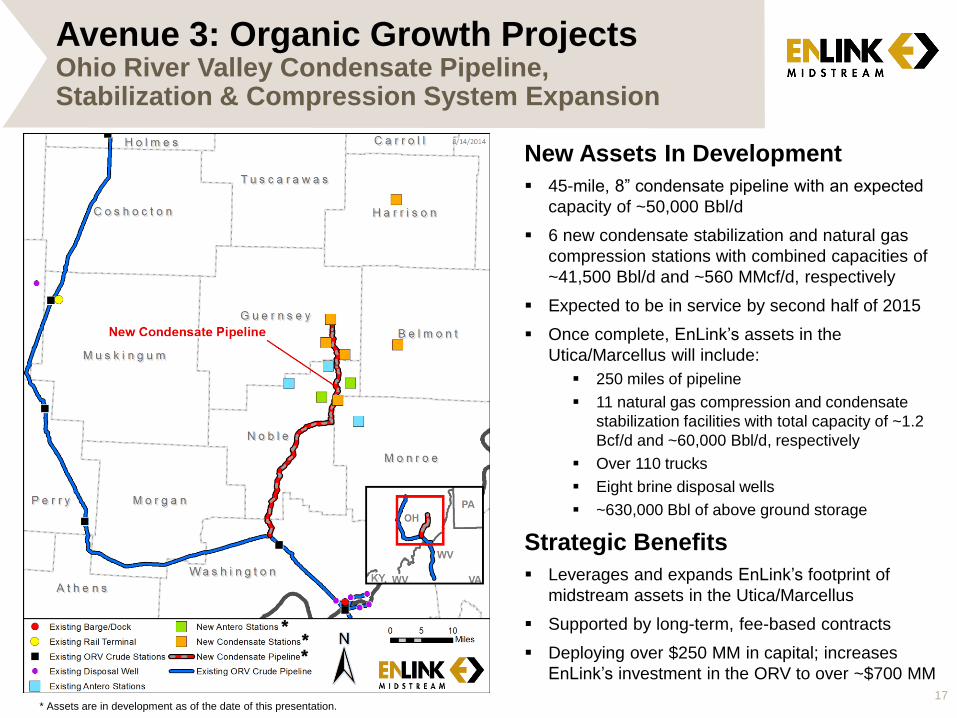
Avenue 3: Organic Growth Projects Ohio River Valley Condensate Pipeline, Stabilization & Compression System Expansion
New Assets In Development
45-mile, 8” condensate pipeline with an expected
capacity of ~50,000 Bbl/d
6 new condensate stabilization and natural gas
compression stations with combined capacities of
~41,500 Bbl/d and ~560 MMcf/d, respectively
Expected to be in service by second half of 2015
Once complete, EnLink’s assets in the
Utica/Marcellus will include:
250 miles of pipeline
11 natural gas compression and condensate
stabilization facilities with total capacity of ~1.2
Bcf/d and ~60,000 Bbl/d, respectively
Over 110 trucks
Eight brine disposal wells
~630,000 Bbl of above ground storage
Strategic Benefits
Leverages and expands EnLink’s footprint of
midstream assets in the Utica/Marcellus
Supported by long-term, fee-based contracts
Deploying over $250 MM in capital; increases
EnLink’s investment in the ORV to over ~$700 MM
* Assets are in development as of the date of this presentation.
* * *
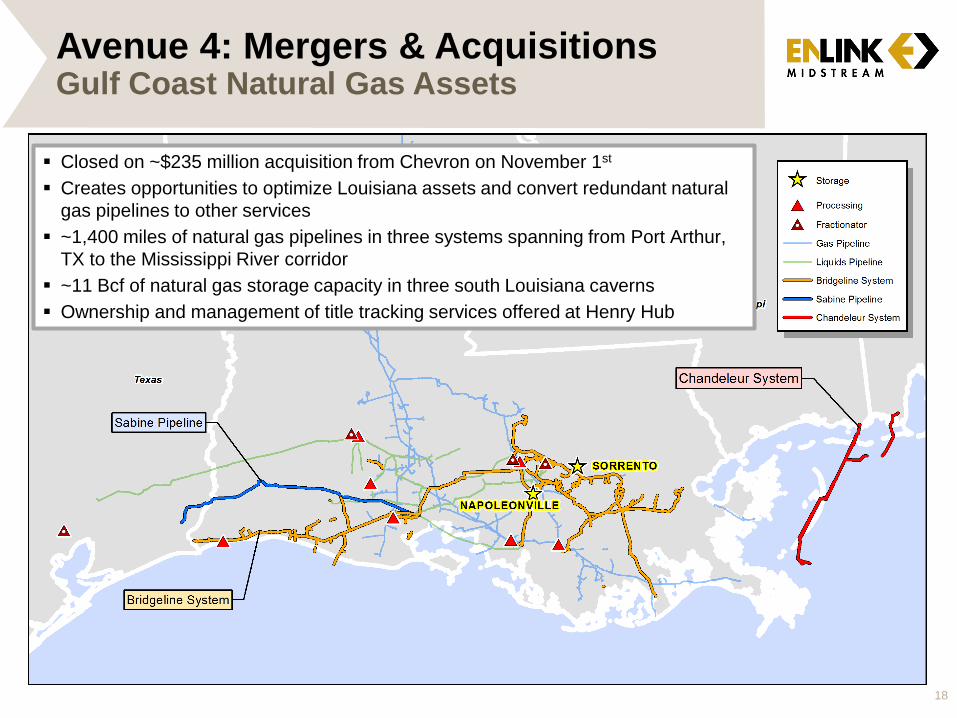
Avenue 4: Mergers & Acquisitions Gulf Coast Natural Gas Assets
Closed on ~$235 million acquisition from Chevron on November 1st
Creates opportunities to optimize Louisiana assets and convert redundant natural
gas pipelines to other services
~1,400 miles of natural gas pipelines in three systems spanning from Port Arthur,
TX to the Mississippi River corridor
~11 Bcf of natural gas storage capacity in three south Louisiana caverns
Ownership and management of title tracking services offered at Henry Hub
18
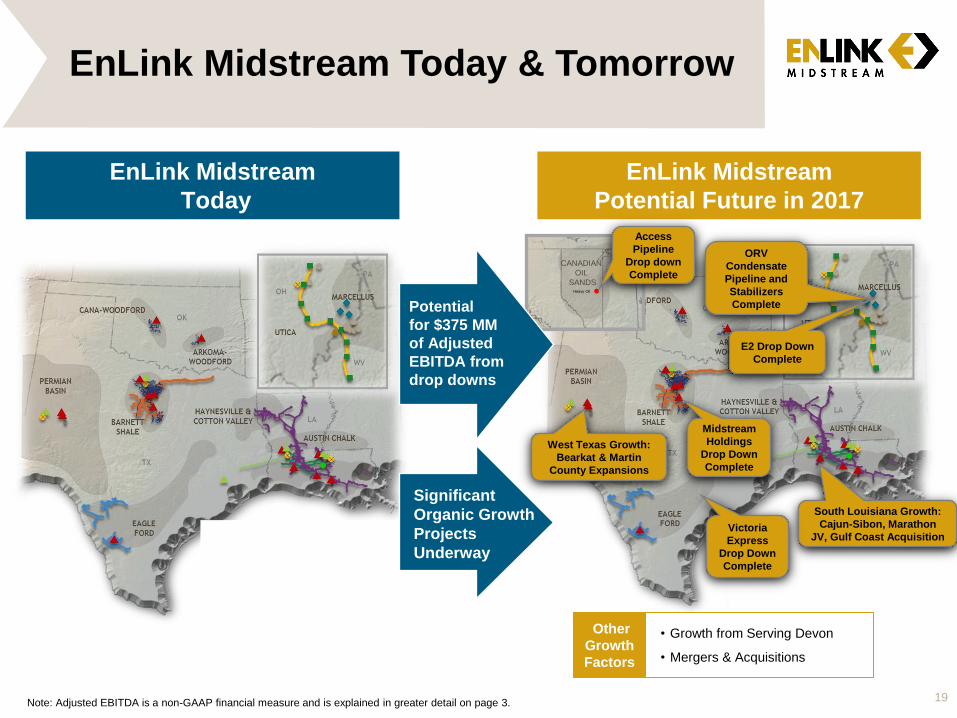
EnLink Midstream Today & Tomorrow
EnLink Midstream
Today
EnLink Midstream
Potential Future in 2017
19
South Louisiana Growth:
Cajun-Sibon, Marathon
JV, Gulf Coast Acquisition
West Texas Growth:
Bearkat & Martin
County Expansions
Victoria
Express
Drop Down
Complete
ORV
Condensate
Pipeline and
Stabilizers
Complete
Other Potential Step Changes
Other
Growth
Factors
• Growth from Serving Devon
• Mergers & Acquisitions
Potential
for $375 MM
of Adjusted
EBITDA from
drop downs
Heavy Oil
Access
Pipeline
Drop down
Complete CANADIAN
OIL
SANDS
Significant
Organic Growth
Projects
Underway
Midstream
Holdings
Drop Down
Complete
E2 Drop Down
Complete
Note: Adjusted EBITDA is a non-GAAP financial measure and is explained in greater detail on page 3.

Financial Outlook
20
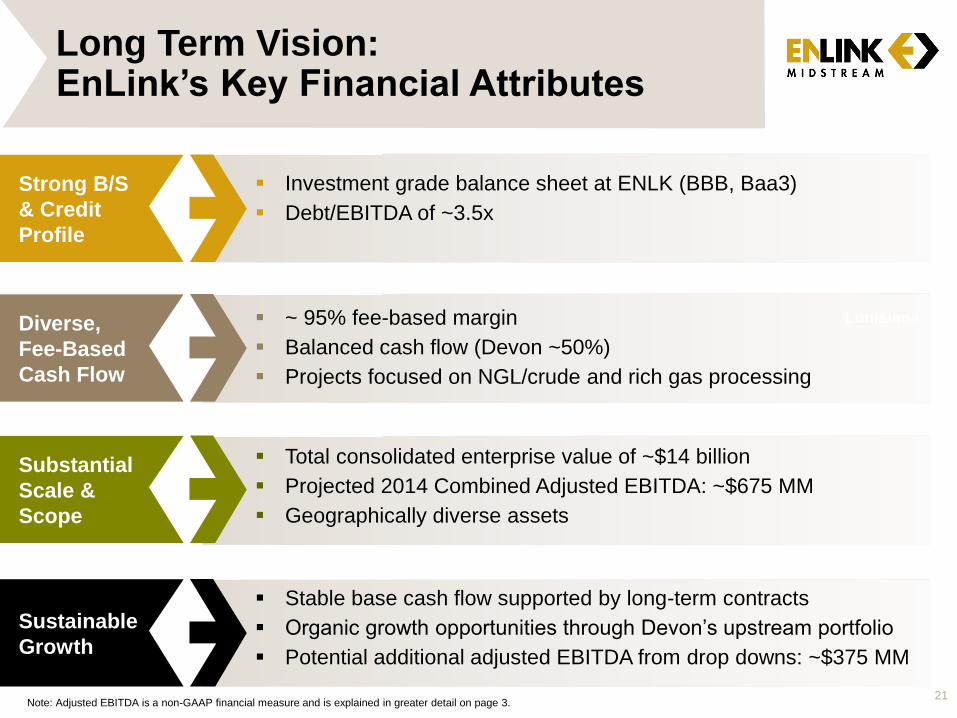
Sustainable
Growth
Substantial
Scale &
Scope
Diverse,
Fee-Based
Cash Flow
Strong B/S
& Credit
Profile
21
Investment grade balance sheet at ENLK (BBB, Baa3)
Debt/EBITDA of ~3.5x
~ 95% fee-based margin
Balanced cash flow (Devon ~50%)
Projects focused on NGL/crude and rich gas processing
Total consolidated enterprise value of ~$14 billion
Projected 2014 Combined Adjusted EBITDA: ~$675 MM
Geographically diverse assets
Stable base cash flow supported by long-term contracts
Organic growth opportunities through Devon’s upstream portfolio
Potential additional adjusted EBITDA from drop downs: ~$375 MM
Louisiana
Long Term Vision: EnLink’s Key Financial Attributes
Note: Adjusted EBITDA is a non-GAAP financial measure and is explained in greater detail on page 3.
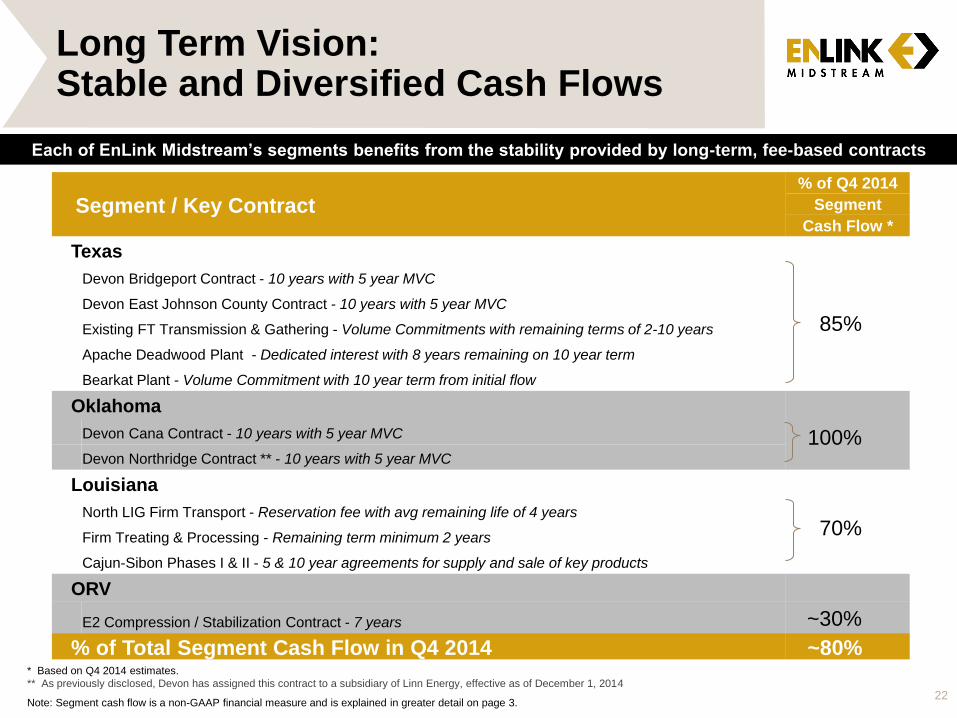
Long Term Vision: Stable and Diversified Cash Flows
22
Each of EnLink Midstream’s segments benefits from the stability provided by long-term, fee-based contracts
Segment / Key Contract % of Q4 2014
Segment
Cash Flow *
Texas
Devon Bridgeport Contract - 10 years with 5 year MVC
85%
Devon East Johnson County Contract - 10 years with 5 year MVC
Existing FT Transmission & Gathering - Volume Commitments with remaining terms of 2-10 years
Apache Deadwood Plant - Dedicated interest with 8 years remaining on 10 year term
Bearkat Plant - Volume Commitment with 10 year term from initial flow
Oklahoma
Devon Cana Contract - 10 years with 5 year MVC 100% Devon Northridge Contract ** - 10 years with 5 year MVC
Louisiana
North LIG Firm Transport - Reservation fee with avg remaining life of 4 years
70%
Firm Treating & Processing - Remaining term minimum 2 years
Cajun-Sibon Phases I & II - 5 & 10 year agreements for supply and sale of key products
ORV
E2 Compression / Stabilization Contract - 7 years ~30%
% of Total Segment Cash Flow in Q4 2014 ~80% * Based on Q4 2014 estimates.
** As previously disclosed, Devon has assigned this contract to a subsidiary of Linn Energy, effective as of December 1, 2014
Note: Segment cash flow is a non-GAAP financial measure and is explained in greater detail on page 3.
23
Our Strategy: Stability Plus Growth
Stability of cash flows ~95% fee-based contracts
~50% of gross operating margin from long-term Devon contracts
Top tier midstream energy service for our customers
Leverage Devon Energy sponsorship for growth Potential additional adjusted EBITDA from dropdowns: ~$375 MM by 2017
Serve Devon E&P portfolio in its growth areas
Strong organic growth South Louisiana, West Texas and Ohio River Valley (ORV) expansion projects
Top tier balance sheet Investment grade credit rating at ENLK since inception
Note: Adjusted EBITDA and gross operating margin are non-GAAP financial measures and are explained on page 3.