welfare implications of animal diseaserelated trade ... · welfare implications of ... export bans...
TRANSCRIPT

1
Welfare Implications of Animal DiseaseRelated Trade Restrictions:
Case of BSERelated Export Bans on Cattle and Beef
Jeevika Weerahewa Senior Lecturer
Department of Agricultural Economics and Business Management Faculty of Agriculture University of Peradeniya Peradeniya, Sri Lanka
Maury Bredahl Professor
Department of Food, Agricultural and Resource Economics University of Guelph
Guelph Ontario N1G 2W1, Canada
Randall Wigle 1 Professor
Economics Department Wilfrid Laurier University
Waterloo Ontario N2L 3C5, Canada
April 2007
1 Authors gratefully acknowledge the financial assistance provided by the Ontario Cattlemen Asso ciation to conduct this study.
2
Welfare Implications of Animal DiseaseRelated Trade Restrictions:
Case of BSERelated Export Bans on Cattle and Beef
Abstract
Trade restrictions are sometimes necessary to ensure food safety and animal and plant health protection. Between 2003 and 2006, Canada faced a series of trade restrictions re lated to BSE. Some refer to the events as a crisis for the Canadian cattle and beef sector, and some estimates placed the loss for Canada s high as $5 billion. This paper examines the impacts of BSE related trade bans on cattle and beef on economic welfare and trade flows. While our analysis is global, the discussion focuses somewhat on Canada. The analysis was performed using GTAP and the GTAP data aggregated to 15 sectors and 10 regions. Four policy experiments simulated actual trade bans placed on Canadian and the US products soon after the BSE crisis were simulated. The results suggest a Canadian welfare loss of between $70 and $700 million depending on the extent of the export ban. The US, Canada and Japan were the most adversely affected. Australia and New Zealand acquired welfare gains. Not surprisingly (given the huge volume of bilateral trade) Can ada's welfare is very sensitive to access to the US market, especially for cattle trade. Price and trade impacts were visible on grain and other agricultural markets as well.
Key Words: BSE, Welfare, GTAP
Introduction
The objective of this study is to quantify the welfare impacts of BSE related trade restric
tions paying special emphasis on Canadian welfare and the distribution of welfare effects
among major cattle and beef importing and exporting countries. It investigates the im
pacts of such trade restrictions, not only on cattle and beef markets, but also on other re
lated markets such as grains, other primary agriculture, other meat products etc. To best
of our knowledge, this study will provide the first quantitative assessment of the impacts
of BSE crisis on the world market prices, quantities produced, consumed and traded and
welfare.
The paper is organized as follows. The next section gives a brief background to the stu
dies of BSE trade restrictions faced by Canada. The next section shows method and data.
We then present the policy experiments considered. The fifth and sixth sections provide

3
welfare and detailed price and trade impacts respectively. The paper ends with a sum
mary and conclusion.
1. Background
Amid growing concern on food safety and animal and plant health protection issues
around the world, there is concern that the application of sanitary and phytosanitary
(SPS) measures may become a more common barrier to trade in food. For countries with
heavily export oriented sectors, such trade restrictions cause greater concern. Among the
SPS measures, trade bans are the most stringent and provide absolute protection from
disease infestations. During the past decade, trade restrictions on live animals and meat
products due to animal disease outbreaks have been prominent in this regard (Blayney et
al., 2006). Export bans on poultry, chicken meat and meat products, and eggs have been
used to protect birds and human from Avian Influenza and Exotic Newcastle Disease, and
export bans on live ruminant animals and their meat products have been used to protect
ruminants and humans from FoodandMouth (FMD) disease and Bovine Spongiform
Encephalopathy (BSE). FMD related restrictions were applied to swine and pork trade as
well.
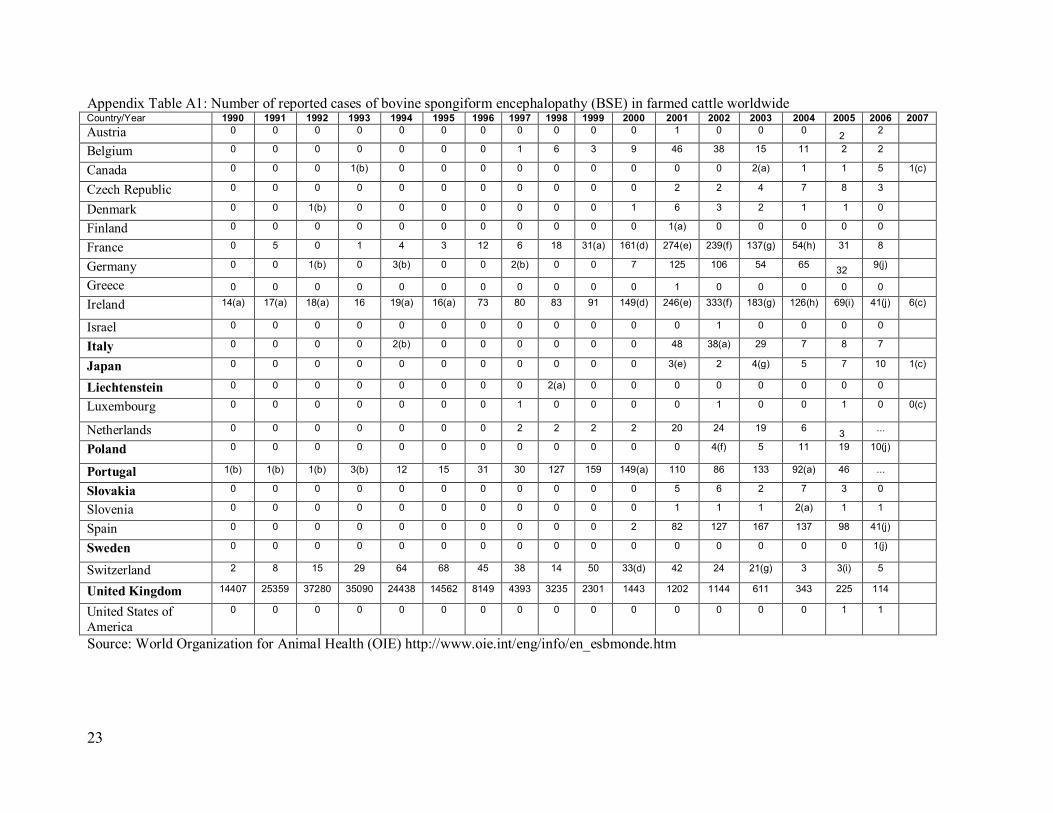
BSE, a neurological disease of cattle, is thought to be spread primarily through consump
tion of animal feed containing protein from ruminants infected with BSE. Appendix ta
ble A1 shows the extent to which BSE was infected in different countries since 1990.
Even though the threat of BSE on humans is considered to be small, a number of export
bans on cattle and beef was imposed with diagnosis of BSE cases in the United Kingdom
(in 1986), Canada (May 2003) and the United States (November 2003). While such regu
lations helped to minimize the risk of diseases to birds, animals and humans, they have
caused substantial financial hardships on the producers and exporters in disease affected
countries that relied on trade as a significant outlet for their products. In the case of BSE,
the perceived risk and the fear of the disease appear to far outweigh the actual risk and
trade disruptions due to this disease have been significant.

4
The estimates of losses due to BSE related trade restrictions in Canada vary widely de
pending upon thet assumptions underlying the calculations. According to Mitura and Di
Pitro (2004) losses to a singleunincorporated beef cattle farm would be $20,000 indicat
ing an economywide loss of net farm operating income of $0.22 million. By contrast,
other estimates are dramatically higher. Calberg and Brewin (2005) suggested that the
direct industry losses would be around $5.5 billion. According to Le Roy.et.al, (2006)
they would be around $4.9 billion when loss due to reduced exports, imports and extra
processing and redistribution costs are considered. These estimates focus on lost earn
ings, but do not account for changes in input prices or prices in other export markets.
Samarajeewa et al (2006) use Statistics Canada's Input Output model and estimate an
economywide loss of $51.2 million due to an export ban. Weerahewa, Meilke and Le
Roy (2007) estimate a loss of gross revenue by $1100 million when the economy moves
from free trade in cattle and beef in to autarky.
However, none of the above studies considered price adjustments in the other markets in
Canada and/or other countries due to the recent BSE related export bans, when the losses
were estimated. The changes happened to the equilibrium in other countries should not
be considered small as some of the affected countries, such as Canada and the US, were
significant trading partners. Even with reductions in exports from BSE affected coun
tries, the global beef trade levels have not significantly declined after the BSE events,
suggesting an increase in exports by BSE free exporters such as Australia, Brazil, New
Zealand and Argentina to meet the demand. This study uses a general equilibrium model
that captures changes in all the markets. The estimates from such models are normally
smaller as demand and supply curves are considered to be imperfectly elastic.
2. Method and Data

5
The global trade model of the Global Trade Analysis Project (GTAP) is used to quantify
the impacts of trade actions on the world market. The GTAP model is a wellknown
CGE model of world trade and production with an associated highly disaggregated data
set (Hertel, 2006). Products are treated as Armington substitutes. We aggregate the
GTAP (version 6 with base data reflecting 2001 equilibrium) data to identify major play
ers in the beef market (Canada, United States, Japan, South Korea, Argentina, Brazil,
Australia, New Zealand, European Union and Rest of the World) and focus on 16 sectors
(including cattle and other ruminant animals, beef and other ruminant meat, grains, other
primary agriculture, other meat products, processed food etc.) for this study. Table 1
shows the sectoral aggregation.
3. Policy Experiments
BSEbased import restrictions imposed by beef importing countries were implemented
within “cattle and other ruminants” and “beef and other ruminant meat”. The closure
condition of the standard GTAP model was modified to make export levels of beef and
cattle exogenous. Consequently, export taxes became endogenous in the model. Four
policy experiments were developed to represent selected past episodes of trade restric
tions based on the actual trade restrictions (Table 2).
NoCanEx: No exports from Canada are allowed
The first experiment was to simulate the situation with bans of exports of cattle and beef
from Canada by all the importing countries including the US. It reflects the environment
soon after a BSE infected cow was found in Canada. This experiment depicts a situation
where a small exporting country is subjected to restrictive SPS regulation.
Cattle and beef exports from Canada are among the exogenous variables in the model.
Exports of all other products by all the countries are endogenous.
NoExCaUS: No exports from Canada and US are allowed
The second experiment was to simulate bans on cattle and beef exports from both the US
and Canada (including one another’s border). It reflects the environment with the identi

6
fication of BSE infected cow in the US. This experiment depicts a situation where two
of the major exporters are subjected to restrictive SPS regulation.
Cattle and beef exports from Canada and US are among the exogenous variables in the
model. Exports of all other products by all the countries are endogenous.
BeefCanUS: Beef trade is almost free between Canada and US
The third experiment was to reduce restrictions on trade of cattle between Canada and US
and to reduce restrictions on beef trade. It closely reflects the current situation in the cat
tle and beef markets which are characterized by export bans on cattle over 30 months and
beef produced from cattle over 30 months. This experiment depicts a situation where two
affected exporting countries relax the restrictions on the value added product.
Cattle and beef exports from Canada and US are among the exogenous variables in the
model. Exports of all other products by all the countries are endogenous.
FreeCaUS: Canada and US freely trades cattle and beef
The fourth experiment was to reduce restrictions on trade of cattle and beef between Can
ada and US. It reflects the situation in the cattle and beef markets in the end of 2004
which is characterized by export bans on cattle over 30 months and beef produced from
cattle over 30 months. This experiment depicts a situation where gains from trade can be
achieved when affected countries get together and freely trade with each other.
Cattle and beef exports from Canada and US to the rest of the world are among the ex
ogenous variables in the model. Exports of all other products by all the countries includ
ing cattle and beef exports between Canada and US are endogenous.
4. Results of the Welfare Analysis under Alternative Scenarios
The alternative policy scenarios were simulated to assess the economic impacts of trade
bans and comparisons were made between the equilibrium in 2001. In the baseline equi
librium, Canada and the US freely trade with each other. While Japan, Korea, Argentina,
Brazil and EU are having import tariffs on beef and Japan, Korea and EU are having im
port tariffs on cattle. Tables 36 show the bilateral trade flows and tariff rates for cattle
and beef.

7
The results of the analysis indicate that there are significant global welfare losses due to
BSE related trade restrictions. Table 7 shows the loss in welfare levels under alternative
scenarios. The global welfare losses amounted to $1177, 3479 and 3196 and 2222 mil
lion under first, second, third and forth scenarios respectively. The US occupied 20% of
the global beef trade and 12% of the global cattle trade in the base year and export re
strictions both on the US and Canada created the biggest global welfare losses as shown
by the second policy experiment. Even though Canada was the biggest exporter of live
cattle in 2001 occupying 19% of the market, restrictions on Canadian cattle and beef ex
ports alone created relatively smaller global welfare losses (little over one third of the
global welfare loss in the second scenario). The third scenario shows that resumption of
beef trade between Canada and the US only marginally helps to reduce welfare losses. In
contrast, the forth scenario shows that by resuming cattle and beef trade between the two
key trading partners, Canada and the US, the global welfare loss can be reduced.
The distribution of welfare differs across regions. The BSE export restrictions were on
the exports from Canada and US hence they incurred the biggest losses among the ex
porting countries. Japan, the biggest importer of US beef, also suffered significant losses
due to the missing opportunity to trade. Losses were incurred by other importers such as
EU and ROW. Among the scenarios, Canada incurred the greatest loss when the exports
from US were also banned since Canada was not only an exporter, but also an importer of
cattle and beef from the US. With the resumption of cattle and beef trade between Cana
da and US, which used to trade heavily with each other prior to BSE crisis, the welfare
status of the former recovered substantially. This improvement was visible when Cana
daUS border was opened only for beef. The winners of the trade restrictions were BSE
free exporters such as Australia, New Zealand, Brazil and Argentina under all the scena
rios
Table 7 also shows the decomposition of welfare losses to assess how much of the trade
restriction are attributable to given commodity and given region. The region specific

8
changes in allocative efficiency are further decomposed into commodity classes Huff and
Hertel, 2001).
The results show that under all the scenarios investigated, the loss in welfare is mainly
due to drop in allocative efficiency in the economy. The contribution of terms of trade
effect and IS effect for the welfare loss is rather small. Furthermore, among the com
modities, allocative inefficiency is prominent in cattle and beef sectors.
5. Price and Trade effects under alternative scenarios
With an export ban, the prices in the infected countries will be determined internally,
hence local prices in such countries will go down. Prices in the importing countries will
go up as the quantities to trade will reduce. The fob prices in the remaining exporting
countries will go up and subsequently prices facing the producers in such countries will
go up.
The prices determined in the above manner influence trade flows. The higher the prices,
the lower the imports and higher the exports are. Of course, policy experiments impose
the restrictions on trade as they are exogenous under certain scenarios.
NoCanEx: No exports from Canada are allowed
In this scenario, exports of beef and cattle from Canada to the rest of countries in the
world are prohibited. The percentage changes in exports from Canada, the US, supply
prices in the regions and aggregate imports by regions are presented in table 8. The re
duction in exports of beef and cattle increases exports of grains and other agricultural
products by Canada to all other countries by approximately 7 percent and 9 percent re
spectively. Recall, both Canada and the US both exporters and importers of cattle and
beef to each other. With the imposition of this trade ban, the exports of beef and cattle
from the US to Canada decreases. It increases exports of US beef to Japan but reduces
the same to all of other the countries. There is a small increase in cattle exports from the
US to Japan, Korea, Australia and New Zealand, along with a small decrease in US cattle
exports to Argentina, Brazil, EU and ROW.

9
The prices of beef, cattle, grains and other agricultural products decrease by 2.77, 4.72,
1.38 and 1.87 percent in Canada. There is a sharp drop in land prices (by 19.52 percent)
along with small reductions in wage rates of skilled and unskilled labor. The prices of
cattle, beef and related sectors rise by less than one percent in other countries.
Aggregate imports of cattle and beef into Canada, the US, Japan and Korea decrease.
While both cattle and beef imports by Canada decreases by 18 percent, cattle and beef
imports by the US decreases by 42.63 and 19.32 percent. Imports into the major beef
importing countries such as Japan and Korea decrease only by 3.45 and 2.04 percent re
spectively. There are very small increases in imports of the same products into Australia
and New Zealand.
NoExCaUS: No exports from Canada and US are allowed
In this scenario, exports of beef and cattle from Canada and the US to the rest of coun
tries in the world are prohibited, including the trade between the two countries. The per
centage changes in exports from Canada, the US, supply prices in the regions and aggre
gate imports by regions are presented in table 9. The reduction in exports of beef and cat
tle significantly increases exports of grains and other agricultural products from Canada
to all other countries. The exports of grains and other agricultural products from the US
to Canada decrease by 4.78 and 0.75 percent respectively. The exports of the same from
the US to other countries increase slightly.
The prices of beef, cattle, grains and other agricultural products decrease in Canada, larg
est reduction being the cattle price by 4.23 percent. There is a sharp drop in land price by
17.90 percent along with small reductions in wage rates of skilled and unskilled labor.
The prices of cattle, beef and related sectors decrease in the US and increase in other
countries by less than one percent.

10
Aggregate imports of cattle into Canada, the US, Japan, Korea and Argentina decrease by
58.22, 46.32, 40.21, 19.38 and 11.86 percent respectively. Aggregate imports of beef in
to Canada, the US, Japan, Korea and Argentina decrease by 37.90, 22.83, 34.56, 27.83
and 6.73 percent respectively. There is an increase in imports of the same product into
Australia and New Zealand by 3.24 and 1.18 percent respectively.
BeefCanUS: Beef trade is almost free between Canada and US
In this scenario, exports of cattle and beef from Canada and the US to the rest of coun
tries in the world are prohibited but beef is freely traded between Canada and the US.
The percentage changes in exports from Canada, the US, supply prices in the regions and
aggregate imports by regions are presented in table 10. The reduction in exports of beef
and cattle due to the ban increases exports of grains and other agricultural products from
Canada to the US and other countries. Grain and other agricultural products exports from
the US to Canada decreases by 3.33% but they increase to other countries, especially to
Australia.
The prices of beef, cattle, grains and other agricultural products decrease in Canada by
0.78, 3.05, 0.95 and 1.28 percent respectively. There is a sharp drop in land prices, by
13.61 percent, along with small reductions in wage rates of skilled and unskilled labor by
less than one percent. The prices of cattle, beef and related sectors drops marginally in
the US and they rise in other countries.
Aggregate imports of cattle into Canada, the US, Japan and Korea decrease by 56.76,
46.55, 40.20 and 19.25 percent respectively. Beef imports into all the countries decrease,
except for Australia which shows a small rise by 1.41 percent.
FreeCaUS: Canada and US freely trades cattle and beef
In this scenario, exports of beef and cattle from Canada to the rest of countries in the
world are prohibited yet trade in cattle and beef between Canada and US is free. The

11
percentage changes in exports from Canada, the US, supply prices in the regions and ag
gregate imports by regions are presented in table 11.
Exports of cattle from Canada to the US go down by 3.74 percent but exports of beef
from Canada to the US increases by 3.23 percent compared to free trade scenario. The
exports of cattle from the US to Canada go down by 3.76 percent and exports of beef
from the US to Canada decreases by 0.94 percent compared to free trade scenario.
Land prices in Canada and the US go down only by 3.67 and 1.56 respectively. Almost
all the prices in Canada and the US go down, but prices in other countries go up margi
nally.
Cattle and beef imports to Japan go down by 40.18 and 34.02 percent respectively and to
Korea go down by 19.16 and 27.48 percent respectively. Aggregate imports of cattle and
beef into the US and Canada decrease by around 5 percent.
6. Summary and Conclusion
In summary, BSE related trade restrictions caused significant welfare losses to BSE af
fected exporting regions and their traditional importers. Japan, in particular faces signifi
cant welfare losses in most scearios as a result of terms of trade deterioration and alloca
tive efficiency losses. Japan suffers as they produce more cattle and beef domestically.
The restrictions on Canadian and/or US exports benefited the welfare of their export
competitors but caused a net welfare loss at the global level. Canada and the US recover,
to a significant extent, with the resumption of the bilateral trade.
7. Extensions
Two additional questions interest us. First, this paper uses a standard long run closure of
GTAP. This implies fluid movement of factors between sectors, and doesn't reflect the
challenge faced when an unexpected export ban comes about. We would also like to
compare our welfare losses from the trade barriers to estimates of the benefits (from risk
reduction) associated with the trade bans.

12
References
Blayney Don P; John Dyck; David Harvey (2006) Economic Effects of Animal Diseases Linked to Trade Dependency. Amber Waves, April 2006.
Carlberg Jared G. & Brewin Derek G.. (2005). Managing an Industry in Crisis: BSE in Canada. Selected Paper prepared for presentation at the Southern Agricultural Economics Association Annual Meetings, Little Rock, Arkansas, February 59, 2005. http://agecon.lib.umn.edu/cgibin/pdf_view.pl?paperid=15710&ftype=.pdf
Hertel, T., GTAP 6 Data Base Documentation, Purdue University, March, 2006 https://www.gtap.agecon.purdue.edu/resources/download/2415.pdf
Huff, Karen and Thomas Hertel (2001) Decomposing Welfare Changes in the GTAP model. GTAP Technical Paper No. 5. https://www.gtap.agecon.purdue.edu/resources/download/2365.pdf
Le Roy.Danny G, Kurt Klein and Tatiana Klvacek. (2006). The losses from BSE in Can ada. Paper presented at the Canadian Agricultural Trade Policy Research Network. http://www.uoguelph.ca/~catprn/PDF/Workshop_2006_LeRoy.pdf.
Mitura, V. and Lina Di Pietro (2005) “Canada’s Beef Cattle Sector and the Impact of BSE on Farm Family Income: 20002003” Statistics Canada. Agriculture and Rural Working Paper Series. Cat No. 21601MIENo 069.
Samarajeewa, Sudarma, Jeevika Weerahewa, Maury Bredahl and Randall Wigle (2006). Impacts of BSE crisis on the Canadian Economy: An InputOutput Analysis. Paper submitted to AgEcon Search. http://agecon.lib.umn.edu/cgibin/pdf_view.pl?paperid=21029&ftype=.pdf
Weerahewa, Jeevika, Danny LeRoy and Karl Meilke (2007) An Economic Assessment of the BSE Crisis in Canada: Impacts of Border Closure and BSE Recovery Programs. Working Paper 2007_01. Canadian Agricultural Trade Policy Network (CATPRN). http://www.uoguelph.ca/~catprn/PDF/Working%20Paper%2020071a.pdf

13
Table 1: Sectoral Aggregation
Number Code Description 1 CCF Cattle,sheep,goats,horses 2 BFM Meat: cattle,sheep,goats,horse 3 GRA Paddy rice, Wheat, Cereal grains nec., Oil seeds 4 OAG Vegetables, fruit, nuts, Sugar cane, sugar beet, Plantbased fibers, Crops nec,
Sugar 5 PRI Wool, silkworm cocoons, Forestry, Fishing, Minerals nec. 6 MFD Animal products nec., Raw milk, Meat products nec., Dairy products 7 PFD Vegetable oils and fats, Processed rice, Food products nec., Beverages and
tobacco products 8 TCL Textiles, Wearing apparel 9 FUEL Coal, Oil, Gas, Petroleum, coal products 10 MF1 Leather products, Wood products, Paper products, publishing, Chemical, rub
ber, plastic products, Mineral products nec, Ferrous metals, Metals nec, Metal products
11 MF2 Motor vehicles and parts, Transport equipment nec, Electronic equipment, Machinery and equipment nec., Manufactures nec.
12 CON Construction 13 TUC Electricity, Gas manufacture, distribution, Water, Transport nec., Sea trans
port, Air transport, Communication 14 BSV Trade, Financial services nec, Insurance, Business service nec., Dwellings 15 PUB PubAdmin/Defence/Health/Educat 16 AME Recreation and other services

14
Table 2: BSE Trade restrictions: Chronological Order
Month and year BSE Trade Restrictions Other BSE Events May 20, 2003 International borders were closed
for all bovine products, live animals and beef from Canada
Canadian official announced that a BSE infected cow was discovered.
August 08, 2003 US relaxed its ban on imports of Canadian beef from cattle less than 30 months age.
December 23, 2003
All the beef importing countries banned U.S. cattle and beef prod ucts.
Second BSE case hit in Washington (the cow was born in a Canadian farm)
October, 2004 U.S. and Japan negotiated a new threshold for beef: Beef from cattle under 20 months of age
December 01, 2004
Hong Kong has agreed to resume trade in Canadian beef from cattle under 30 months.
December 14, 2004
Cuba has agreed to reopen its bor der for Canadian beef products
December 29, 2004
US recognized Canada as a low BSE risk country
January, 2005 Two more BSE cases were confirmed in Canada
May, 2005 New country categories were announced by OIE:
• Negligible BSE Risk • Controlled BSE Risk • Undertermined BSE
Risk July 08, 2005 New Zealand agreed to lift its re
maining BSE related restrictions on Canadian beef
July, 2005 US border opened for Canadian cat tle under 30 months.
December 11, 2005
Japan agreed to reopen its border for Canadian beef from cattle under 20 months.
February 01, 2006 Mexico has announced its decision to access to a wide range of Cana dian beef products.
August 24, 2006 Another BSE infected cow in Canada

15
Table 3: Exports of cattle in 2001 (export sales of commodity cattle from r to region s)in $US million From—To 1 Canada 2 US 3 Japan 4 Korea 5 Argentina 6 Australia 7 NewZealand 8 Brazil 9 EU 10 ROW Total 1 Canada 0 1287.52 5.8 0.24 0 0.15 0.01 0.08 1.67 23.62 1319.1 2 US 209.4 0 95.8 3.6 0.9 7.26 0.51 0.63 188.59 270.62 777.31 3 Japan 0 11.67 0 0.04 0 0.5 0.05 0 16.74 1.36 30.37 4 Korea 0 0 0 0 0 0 0 0 0.09 0.01 0.11 5 Argentina 0.02 11.94 0 0 0 0 0 0.36 6.07 2.76 21.14 6 Australia 0.09 24.56 21.85 2.84 0.07 0 17.26 0 0.77 776.69 844.12 7 NewZealand 3.88 5.93 3.04 0.16 0.15 23.94 0 0.02 4.96 23.03 65.1 8 Brazil 0 4.38 0 0 0.08 0 0 0 0.72 0.56 5.74 9 EU 4.08 278.3 28.39 1.65 0.56 4.92 0.31 1.28 1697.09 330.85 2347.43 10 ROW 5.69 522.96 11.29 2.55 3.09 2.23 0.46 7.54 615.69 783.93 1955.4 Total 223.16 2147.26 166.17 11.08 4.84 39 18.61 9.9 2532.38 2213.42 7365.83 Source: GTAP database
Table 4: Exports of beef in 2001 (export sales of commodity beef from r to region s)in in $US million S$
From—To 1 Canada 2 US 3 Japan 4 Korea 5 Argentina 6 Australia 7 NewZealand 8 Brazil 9 EU 10 ROW Total 1 Canada 0 1201.35 219.75 27.7 0.26 0.3 0.64 0.2 63.76 297.5 1811.44 2 US 310.07 0 2833.48 617.08 4.89 3.22 0.7 1.51 162.16 1442.38 5375.49 3 Japan 0.11 6.49 0 7.87 0.02 0.27 0.01 0.11 7.83 7.11 29.82 4 Korea 0.14 2.07 3.1 0 0.05 0.06 0.01 0.04 2 4.92 12.39 5 Argentina 13.8 96.78 7.16 0.33 0 0.11 0.03 24.11 237.3 103.92 483.53 6 Australia 160.47 1233.25 1621.06 225.53 0.06 0 22.87 0.11 131.54 986.64 4381.53 7 NewZeal and
164.19 676.24 134.27 45.44 0.1 6.82 0 0.07 751.69 519.37 2298.18
8 Brazil 3.25 109.49 6.92 0.22 7.08 0.27 0.22 0 1360.49 539.17 2027.1 9 EU 10.65 80.23 58.6 7.25 4.75 5.65 1.18 5.45 5965.03 1203.42 7342.21 10 ROW 97.91 195.75 84.14 16.89 20.71 9.02 2.08 50.59 874.1 1515.94 2867.13 Total 760.6 3601.63 4968.46 948.3 37.92 25.72 27.75 82.18 9555.88 6620.37 26628.81 Source: GTAP database

16
Table 5: Bilateral Import Tariffs on Cattle in 2001
rTMS 1 Canada 2 US 3 Japan 4 Korea 5 Argentina 6 Australia 7 NewZealand 8 Brazil 9 EU 10 ROW 1 Canada 0 0 23.78 0.08 0 0 0 0.03 0.57 6.13 2 US 0 0 15.68 5.91 0.76 0 0 0.34 0.73 0.25 3 Japan 0 0 0 8.12 0 0 0 0 0.33 0 4 Korea 0 0 6.28 0 0 0 0 0 3.43 1.38 5 Argentina 0 0 0 0 0 0 0 0 5.35 5.34 6 Australia 0 0 52.29 13.17 0.29 0 0 0 3.78 2.88 7 NewZealand 0 0 44.03 8 0.56 0 0 0.53 1.46 1.38 8 Brazil 0 0 0 0 0 0 0 0 2.1 2.86 9 EU 0 0 13.64 7.04 3.46 0 0 1.7 0 2.47 10 ROW 0 0 5.19 1.08 0.95 0 0 0.07 15.93 5.91 Source: GTAP database
Table 6: Bilateral Import Tariffs on Beef in 2001
rTMS 1 Canada 2 US 3 Japan 4 Korea 5 Argentina 6 Australia 7 NewZealand 8 Brazil 9 EU 10 ROW 1 Canada 0 0 40.56 33.64 10.19 0 0 11.58 9.85 9.12 2 US 0.01 0 43.25 38 10.86 0 0.06 11.25 19.81 9.07 3 Japan 0 1.43 0 10.35 0 0 5 8.5 7.83 10.96 4 Korea 6.54 0.38 26.18 0 0 0 0 0 0 20.16 5 Argentina 13.22 4.89 0.07 40.9 0 0 0 0 29.59 16.78 6 Australia 11.7 4.51 45.55 37.77 0 0 0 11.5 10.99 13.82 7 NewZealand 9.66 4.48 28.68 35.38 13.5 0 0 11.5 2.61 14.16 8 Brazil 2.81 4.09 6.6 40.9 0 0 0 0 112.91 10.08 9 EU 1.92 1.38 80.61 8.31 4.6 0 0.64 10.23 0 26.08 10 ROW 17.11 2.56 22.07 16.1 0.61 0 0.15 0.51 51.15 16.72 Source: GTAP database

17
Table 7: Results of the Welfare Analysis (Equivalent Variation in $US million)
Experiment Region EV Allocative efficiency effect
Terms of trade ef fect
IS effect Allocative efficiency breakdown by commodity CCF BFM GRA OAG MFD
NoCanEx: Canadian exports are restricted
Canada 535.57 855.12 268.86 50.7 574.86 307.79 3.32 11.7 12.67 US 357.69 11.29 304.38 42.02 7.15 29.48 8.78 2.96 0.16 Japan 90.38 36.62 53.38 0.39 3.13 47.28 17.22 2.62 5.6 Korea 23.38 7.17 18.5 2.3 0.01 4.85 1.46 0.66 0.18 Argentina 9.09 2.49 7.38 0.78 2.22 1.33 0.44 0.34 0.07 Australia 87.4 3.43 85.36 1.39 0.08 0 0.12 0.25 0.04 NewZealand 35.49 2.18 37.28 3.96 0.04 0.01 0.01 0 0 Brazil 11.97 1.25 11.11 0.39 0.39 1.8 0.11 0.03 0.01 EU 196.41 221 31.92 7.32 2.47 60.32 0.74 2.24 7.73 ROW 117.02 54.92 65.43 3.32 8.87 9.93 5.51 4.69 1.5 Total 1176.5 1176.78 0.21 0.07 577.03 397.58 3.83 14.59 16.37
NoExCaUS: Both Canadian and US exports are restricted
Canada 713.65 844.45 59.45 71.35 557.24 294.51 2.77 10.45 14.75 US 1278.93 1233.38 240.1 285.65 423.47 769.51 9.71 6.5 2.32 Japan 999.21 570.86 468.98 40.63 30.05 553.53 69.57 13.31 30.25 Korea 159.57 36.24 139.74 16.41 0.1 93.42 62.01 3.8 0.05 Argentina 22.37 5.95 16.37 0.05 3.85 2.52 0.7 0.57 0.07 Australia 397.4 17 381.73 1.32 0.32 0 0.48 0.98 0.09 NewZealand 98.39 6.45 102.08 10.13 0.11 0.04 0.02 0.01 0 Brazil 54.81 7.42 44.26 3.13 1.07 5.42 0.2 0.08 0.11 EU 576.34 675.53 49.42 49.77 2.39 277.48 2.54 4.16 25.83 ROW 324.67 154.74 285.71 115.78 27.82 39.64 16.85 5.99 1.52 Total 3479.4 3478.38 1.02 0.02 983.07 2020.2 158.33 5.22 14.18

18
Table 7 (ctd): Results of the Welfare Analysis (Equivalent Variation in $US million)
Experiment Region EV Allocative efficiency effect
Terms of trade ef fect
IS effect Allocative efficiency breakdown by commodity CCF BFM GRA OAG MFD
BfCanUS: US relaxes restric tions on Canadian beef
Canada 471.39 650.72 126.24 53.1 553.46 98.48 1.83 7.46 10.71 US 1233.26 1202.53 242.82 273.55 425.93 742.51 9.46 6.52 1.89 Japan 980.04 564.63 456.2 40.78 29.65 547.03 66.6 11.11 29 Korea 153.98 35.62 134.22 15.85 0.1 92.45 61.36 3.5 0.23 Argentina 15.52 3.71 11.11 0.7 2.62 1.14 0.44 0.38 0.05 Australia 332.96 13.96 319.52 0.52 0.27 0.01 0.39 0.84 0.07 NewZealand 63.37 4.27 65.38 6.28 0.07 0.04 0.02 0.01 0.01 Brazil 48.38 6.52 38.77 3.09 0.89 4.42 0.14 0.05 0.1 EU 528.48 629.97 49.51 51.98 2.24 250.87 2.71 3.54 21 ROW 289.28 140.61 263.47 114.8 27.16 38.72 18.63 5.34 0.6 Total 3196.2 3195.61 0.54 0.04 982.83 1764.55 155.24 6.05 3.78
FreeCaUS: US and Canada freely trades with each other
Canada 61.8 100.19 14.2 24.19 7.45 95.18 0.35 1.67 2.78 US 748.09 959.8 432.21 220.5 185.41 760.39 17.86 8.52 2.36 Japan 976.49 568.64 442.69 34.84 29.03 544.72 59.69 10.55 28.01 Korea 145.8 31.28 127.17 12.66 0.09 92.13 65.08 3.32 0.04 Argentina 11.54 3.22 7.64 0.68 1.59 1.09 0.29 0.22 0 Australia 316.16 13.7 302.81 0.34 0.25 0.01 0.36 0.78 0.05 NewZealand 46.45 3.18 48.43 5.17 0.05 0.03 0.01 0 0.01 Brazil 45.05 6.5 35 3.55 0.79 4.17 0.13 0.06 0.11 EU 414.24 472.69 6.82 51.63 0.44 246.42 1.12 1.71 15.62 ROW 294.59 115.29 277.7 98.4 17.53 38.07 20.65 2.19 1.5 Total 2221.81 2221.29 0.45 0.06 203.52 1771.69 162.72 14.53 8.87

19
Table 8: The percentage changes in exports from Canada, the US, supply prices in the regions and aggregate imports by regions: Expe riment ‘NoCanEX’ (No exports from Canada are allowed)
Variable Sector Canada US Japan Korea Argentina Australia NewZealand Brazil EU ROW Exports from Cana da
CCF 0.00 100.00 100.00 100.00 100.00 100.00 100.00 100.00 100.00 100.00 BFM 0.00 100.00 100.00 100.00 100.00 100.00 100.00 100.00 100.00 100.00 GRA 2.34 6.72 7.29 8.08 8.10 9.43 9.14 7.89 7.72 7.64 OAG 8.68 8.88 8.08 8.31 8.87 9.70 9.51 8.89 8.93 9.01 PRI 0.59 0.01 0.03 0.06 0.01 0.20 0.19 0.01 0.01 0.01 MFD 4.31 4.64 5.32 5.61 5.49 5.89 6.02 5.53 5.28 5.45
Exports from US CCF 18.18 88.49 2.68 0.87 1.00 0.96 3.26 0.50 1.23 0.13 BFM 20.56 24.47 0.05 0.03 4.89 1.80 0.86 5.67 5.47 1.99 GRA 6.01 1.83 1.01 0.33 0.46 0.88 0.65 0.50 0.66 0.75 OAG 1.50 0.70 0.25 0.20 0.31 0.18 0.21 0.33 0.34 0.34 PRI 0.59 0.00 0.02 0.06 0.00 0.19 0.20 0.02 0.00 0.00 MFD 2.02 1.63 0.85 0.53 0.68 0.33 0.20 0.60 0.85 0.70
Supply prices Land 19.52 0.87 0.08 0.14 0.33 1.60 2.53 0.26 0.25 0.12 UnSkLab 0.30 0.01 0.00 0.01 0.03 0.16 0.28 0.02 0.00 0.00 SkLab 0.21 0.00 0.00 0.01 0.03 0.14 0.21 0.02 0.00 0.00 Capital 0.32 0.01 0.00 0.01 0.03 0.12 0.19 0.02 0.01 0.00 NatRes 1.12 0.02 0.04 0.07 0.09 0.38 0.69 0.06 0.01 0.02 CCF 4.72 0.53 0.05 0.07 0.20 0.63 0.54 0.08 0.08 0.10 BFM 2.77 0.89 0.04 0.05 0.13 0.32 0.39 0.05 0.03 0.06 GRA 1.38 0.13 0.00 0.06 0.05 0.21 0.37 0.03 0.02 0.02 OAG 1.87 0.09 0.01 0.04 0.06 0.25 0.29 0.03 0.02 0.02 PRI 0.00 0.01 0.01 0.01 0.02 0.08 0.13 0.01 0.01 0.00 MFD 0.74 0.14 0.04 0.03 0.05 0.22 0.25 0.03 0.01 0.02
Aggregate Imports CCF 18.12 42.63 1.37 1.61 0.23 0.76 2.88 0.08 0.27 0.66 BFM 18.41 19.32 3.45 2.04 0.41 1.66 0.84 0.16 0.48 3.28 GRA 5.95 3.55 0.39 0.10 0.00 1.21 2.11 0.00 0.06 0.30 OAG 1.41 0.48 0.01 0.03 0.09 0.42 0.15 0.04 0.02 0.03 PRI 0.58 0.00 0.01 0.02 0.01 0.15 0.21 0.02 0.01 0.02 MFD 1.88 1.32 0.04 0.07 0.08 0.69 0.55 0.04 0.00 0.09

20
Table 9: The percentage changes in exports from Canada, the US, supply prices in the regions and aggregate imports by regions: Expe riment ‘NoExCaUS’ (No exports from Canada and US are allowed)
Variable Sector Canada US Japan Korea Argentina Australia NewZealand Brazil EU ROW Exports from Cana da
CCF 0.00 100.00 100.00 100.00 100.00 100.00 100.00 100.00 100.00 100.00 BFM 0.00 100.00 100.00 100.00 100.00 100.00 100.00 100.00 100.00 100.00 GRA 1.45 4.48 8.48 8.15 7.74 13.81 14.33 7.79 7.35 7.22 OAG 7.66 7.94 8.27 8.49 8.55 11.06 10.60 8.59 8.53 8.68 PRI 0.60 0.01 0.23 0.30 0.11 0.90 0.35 0.03 0.15 0.15 MFD 3.91 4.06 6.55 6.13 5.75 8.82 8.83 5.98 5.38 5.81
Exports from US CCF 100.00 0.00 100.00 100.00 100.00 100.00 100.00 100.00 100.00 100.00 BFM 100.00 0.00 100.00 100.00 100.00 100.00 100.00 100.00 100.00 100.00 GRA 4.78 1.74 2.22 1.87 1.34 7.16 7.69 1.53 1.12 0.99 OAG 0.75 0.20 1.43 1.53 1.04 3.10 2.82 1.06 0.96 1.03 PRI 0.62 0.03 0.25 0.32 0.14 0.93 0.33 0.05 0.17 0.17 MFD 1.40 1.15 1.31 0.95 0.57 3.44 3.47 0.82 0.23 0.64
Supply prices Land 17.90 0.88 1.72 1.09 0.67 7.25 8.20 0.81 0.74 0.35 UnSkLab 0.33 0.05 0.02 0.04 0.08 0.72 0.78 0.07 0.02 0.03 SkLab 0.24 0.04 0.01 0.05 0.07 0.63 0.58 0.07 0.01 0.01 Capital 0.34 0.05 0.02 0.04 0.07 0.55 0.53 0.08 0.03 0.02 NatRes 1.20 0.12 0.20 0.45 0.16 1.56 1.76 0.16 0.02 0.02 CCF 4.23 0.18 1.05 0.63 0.38 2.72 1.62 0.26 0.24 0.25 BFM 1.17 0.61 0.70 0.48 0.26 1.40 1.15 0.17 0.17 0.32 GRA 1.29 0.17 0.18 0.38 0.13 0.98 1.12 0.12 0.06 0.09 OAG 1.74 0.14 0.18 0.31 0.14 1.13 0.86 0.12 0.06 0.08 PRI 0.01 0.02 0.06 0.06 0.07 0.36 0.39 0.06 0.03 0.03 MFD 0.71 0.03 0.47 0.27 0.11 0.96 0.75 0.12 0.04 0.07
Aggregate Imports CCF 58.22 46.32 40.21 19.38 11.86 6.93 3.82 2.77 3.31 9.03 BFM 37.90 22.83 34.56 27.83 6.73 3.24 1.18 1.08 1.30 16.33 GRA 4.94 1.31 2.41 0.76 0.28 6.22 4.91 0.07 0.15 0.53 OAG 1.30 0.12 0.37 0.20 0.15 2.01 0.32 0.12 0.04 0.05 PRI 0.54 0.12 0.05 0.11 0.03 0.69 0.50 0.06 0.02 0.09 MFD 1.80 0.49 0.96 0.45 0.11 2.36 0.55 0.30 0.01 0.19
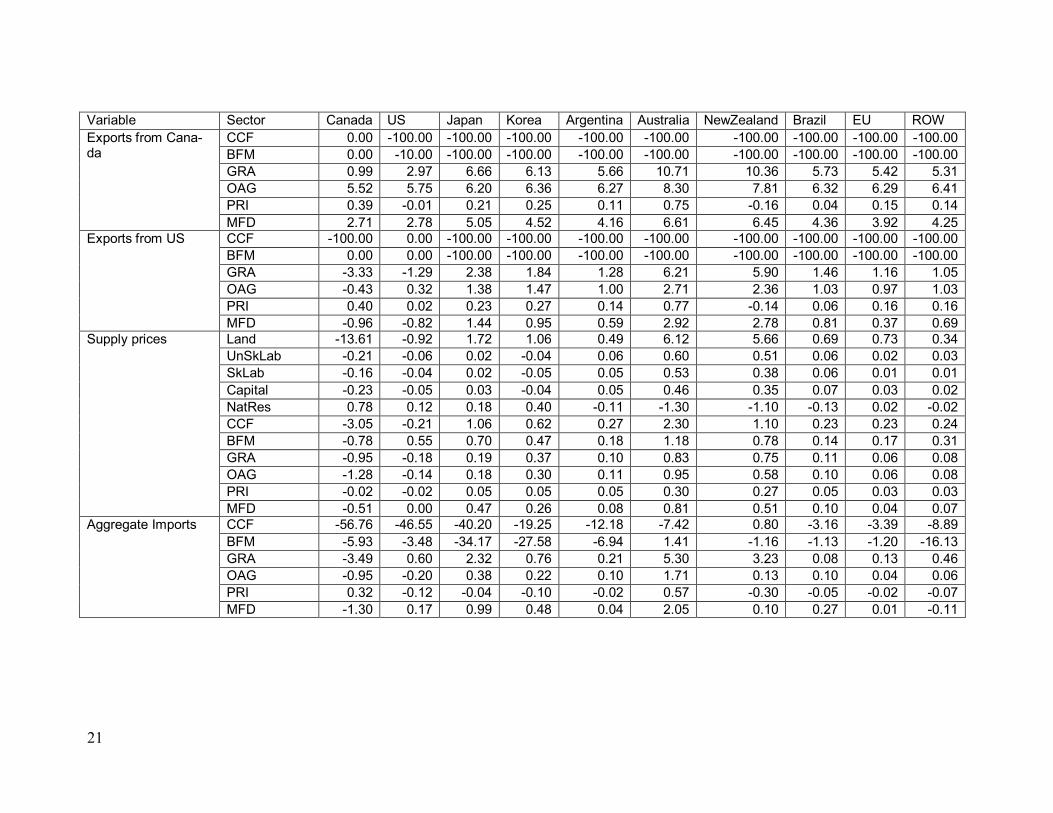
Table 10: The percentage changes in exports from Canada, the US, supply prices in the regions and aggregate imports by regions: Experiment ‘BeefCanUS’ (Beef trade is almost free between Canada and US)
21
Variable Sector Canada US Japan Korea Argentina Australia NewZealand Brazil EU ROW Exports from Cana da
CCF 0.00 100.00 100.00 100.00 100.00 100.00 100.00 100.00 100.00 100.00 BFM 0.00 10.00 100.00 100.00 100.00 100.00 100.00 100.00 100.00 100.00 GRA 0.99 2.97 6.66 6.13 5.66 10.71 10.36 5.73 5.42 5.31 OAG 5.52 5.75 6.20 6.36 6.27 8.30 7.81 6.32 6.29 6.41 PRI 0.39 0.01 0.21 0.25 0.11 0.75 0.16 0.04 0.15 0.14 MFD 2.71 2.78 5.05 4.52 4.16 6.61 6.45 4.36 3.92 4.25
Exports from US CCF 100.00 0.00 100.00 100.00 100.00 100.00 100.00 100.00 100.00 100.00 BFM 0.00 0.00 100.00 100.00 100.00 100.00 100.00 100.00 100.00 100.00 GRA 3.33 1.29 2.38 1.84 1.28 6.21 5.90 1.46 1.16 1.05 OAG 0.43 0.32 1.38 1.47 1.00 2.71 2.36 1.03 0.97 1.03 PRI 0.40 0.02 0.23 0.27 0.14 0.77 0.14 0.06 0.16 0.16 MFD 0.96 0.82 1.44 0.95 0.59 2.92 2.78 0.81 0.37 0.69
Supply prices Land 13.61 0.92 1.72 1.06 0.49 6.12 5.66 0.69 0.73 0.34 UnSkLab 0.21 0.06 0.02 0.04 0.06 0.60 0.51 0.06 0.02 0.03 SkLab 0.16 0.04 0.02 0.05 0.05 0.53 0.38 0.06 0.01 0.01 Capital 0.23 0.05 0.03 0.04 0.05 0.46 0.35 0.07 0.03 0.02 NatRes 0.78 0.12 0.18 0.40 0.11 1.30 1.10 0.13 0.02 0.02 CCF 3.05 0.21 1.06 0.62 0.27 2.30 1.10 0.23 0.23 0.24 BFM 0.78 0.55 0.70 0.47 0.18 1.18 0.78 0.14 0.17 0.31 GRA 0.95 0.18 0.19 0.37 0.10 0.83 0.75 0.11 0.06 0.08 OAG 1.28 0.14 0.18 0.30 0.11 0.95 0.58 0.10 0.06 0.08 PRI 0.02 0.02 0.05 0.05 0.05 0.30 0.27 0.05 0.03 0.03 MFD 0.51 0.00 0.47 0.26 0.08 0.81 0.51 0.10 0.04 0.07
Aggregate Imports CCF 56.76 46.55 40.20 19.25 12.18 7.42 0.80 3.16 3.39 8.89 BFM 5.93 3.48 34.17 27.58 6.94 1.41 1.16 1.13 1.20 16.13 GRA 3.49 0.60 2.32 0.76 0.21 5.30 3.23 0.08 0.13 0.46 OAG 0.95 0.20 0.38 0.22 0.10 1.71 0.13 0.10 0.04 0.06 PRI 0.32 0.12 0.04 0.10 0.02 0.57 0.30 0.05 0.02 0.07 MFD 1.30 0.17 0.99 0.48 0.04 2.05 0.10 0.27 0.01 0.11

22
Table 11: The percentage changes in exports from Canada, the US, supply prices in the regions and aggregate imports by regions: Experiment ‘FreeCaUS’ (Canada and US freely trades cattle and beef)
Variable Sector Canada US Japan Korea Argentina Australia NewZealand Brazil EU ROW Exports from Cana da
CCF 2.79 3.74 100.00 100.00 100.00 100.00 100.00 100.00 100.00 100.00 BFM 0.72 3.23 100.00 100.00 100.00 100.00 100.00 100.00 100.00 100.00 GRA 0.35 0.56 2.93 1.98 1.51 6.09 5.41 1.73 1.45 1.37 OAG 1.15 1.21 2.09 2.12 1.75 3.42 2.98 1.81 1.72 1.80 PRI 0.09 0.05 0.15 0.18 0.06 0.66 0.16 0.00 0.09 0.09 MFD 0.55 0.34 2.29 1.55 1.34 3.70 3.55 1.53 1.17 1.40
Exports from US CCF 3.76 3.97 100.00 100.00 100.00 100.00 100.00 100.00 100.00 100.00 BFM 0.94 1.66 100.00 100.00 100.00 100.00 100.00 100.00 100.00 100.00 GRA 0.24 0.38 3.08 2.13 1.62 6.23 5.55 1.87 1.59 1.52 OAG 0.41 0.71 1.59 1.65 1.22 2.80 2.36 1.27 1.19 1.24 PRI 0.16 0.03 0.22 0.25 0.13 0.73 0.09 0.06 0.16 0.16 MFD 0.37 0.20 2.13 1.39 1.18 3.53 3.38 1.37 1.01 1.25
Supply prices Land 3.67 1.56 1.71 1.00 0.30 5.63 3.59 0.58 0.43 0.21 UnSkLab 0.05 0.06 0.02 0.03 0.04 0.57 0.40 0.06 0.02 0.02 SkLab 0.03 0.04 0.02 0.05 0.04 0.50 0.30 0.06 0.01 0.01 Capital 0.05 0.05 0.03 0.04 0.04 0.43 0.28 0.07 0.02 0.02 NatRes 0.23 0.13 0.16 0.39 0.07 1.22 0.87 0.11 0.03 0.00 CCF 0.80 0.63 1.05 0.60 0.17 2.14 0.77 0.20 0.16 0.15 BFM 0.47 0.26 0.70 0.45 0.12 1.11 0.57 0.13 0.14 0.28 GRA 0.24 0.27 0.19 0.34 0.07 0.77 0.56 0.09 0.04 0.06 OAG 0.33 0.21 0.18 0.28 0.07 0.89 0.43 0.09 0.04 0.05 PRI 0.00 0.02 0.05 0.05 0.04 0.28 0.21 0.05 0.03 0.02 MFD 0.13 0.11 0.47 0.25 0.06 0.75 0.38 0.09 0.03 0.05
Aggregate Imports CCF 3.95 5.10 40.18 19.16 12.23 7.33 0.42 3.17 3.55 8.94 BFM 4.60 2.62 34.02 27.48 7.06 1.16 1.73 1.06 1.14 16.06 GRA 0.45 1.33 2.21 0.73 0.24 5.10 1.83 0.10 0.09 0.29 OAG 0.19 0.46 0.40 0.24 0.05 1.64 0.00 0.10 0.03 0.03 PRI 0.09 0.12 0.04 0.09 0.02 0.56 0.25 0.04 0.01 0.06 MFD 0.12 0.56 1.03 0.56 0.01 1.89 0.16 0.31 0.01 0.08
23
Appendix Table A1: Number of reported cases of bovine spongiform encephalopathy (BSE) in farmed cattle worldwide Country/Year 1990 1991 1992 1993 1994 1995 1996 1997 1998 1999 2000 2001 2002 2003 2004 2005 2006 2007 Austria 0 0 0 0 0 0 0 0 0 0 0 1 0 0 0 2 2
Belgium 0 0 0 0 0 0 0 1 6 3 9 46 38 15 11 2 2
Canada 0 0 0 1(b) 0 0 0 0 0 0 0 0 0 2(a) 1 1 5 1(c)
Czech Republic 0 0 0 0 0 0 0 0 0 0 0 2 2 4 7 8 3
Denmark 0 0 1(b) 0 0 0 0 0 0 0 1 6 3 2 1 1 0
Finland 0 0 0 0 0 0 0 0 0 0 0 1(a) 0 0 0 0 0
France 0 5 0 1 4 3 12 6 18 31(a) 161(d) 274(e) 239(f) 137(g) 54(h) 31 8
Germany 0 0 1(b) 0 3(b) 0 0 2(b) 0 0 7 125 106 54 65 32 9(j)
Greece 0 0 0 0 0 0 0 0 0 0 0 1 0 0 0 0 0
Ireland 14(a) 17(a) 18(a) 16 19(a) 16(a) 73 80 83 91 149(d) 246(e) 333(f) 183(g) 126(h) 69(i) 41(j) 6(c)
Israel 0 0 0 0 0 0 0 0 0 0 0 0 1 0 0 0 0
Italy 0 0 0 0 2(b) 0 0 0 0 0 0 48 38(a) 29 7 8 7
Japan 0 0 0 0 0 0 0 0 0 0 0 3(e) 2 4(g) 5 7 10 1(c)
Liechtenstein 0 0 0 0 0 0 0 0 2(a) 0 0 0 0 0 0 0 0
Luxembourg 0 0 0 0 0 0 0 1 0 0 0 0 1 0 0 1 0 0(c)
Netherlands 0 0 0 0 0 0 0 2 2 2 2 20 24 19 6 3 ...
Poland 0 0 0 0 0 0 0 0 0 0 0 0 4(f) 5 11 19 10(j)
Portugal 1(b) 1(b) 1(b) 3(b) 12 15 31 30 127 159 149(a) 110 86 133 92(a) 46 ...
Slovakia 0 0 0 0 0 0 0 0 0 0 0 5 6 2 7 3 0
Slovenia 0 0 0 0 0 0 0 0 0 0 0 1 1 1 2(a) 1 1
Spain 0 0 0 0 0 0 0 0 0 0 2 82 127 167 137 98 41(j)
Sweden 0 0 0 0 0 0 0 0 0 0 0 0 0 0 0 0 1(j)
Switzerland 2 8 15 29 64 68 45 38 14 50 33(d) 42 24 21(g) 3 3(i) 5
United Kingdom 14407 25359 37280 35090 24438 14562 8149 4393 3235 2301 1443 1202 1144 611 343 225 114
United States of America
0 0 0 0 0 0 0 0 0 0 0 0 0 0 0 1 1
Source: World Organization for Animal Health (OIE) http://www.oie.int/eng/info/en_esbmonde.htm