we deliver what we promise! - siemens global website · we deliver what we promise! roland fischer...
TRANSCRIPT

© Siemens AG 2012. All rights reserved.© Siemens AG 2012. All rights reserved.
We deliver what we promise!
Roland FischerCEO Fossil Power Generation Division
Capital Market Day Siemens EnergyCharlotte, December 11, 2012

© Siemens AG 2012. All rights reserved.CEO Fossil Power Generation DivisionDecember 11, 2012 Capital Market Day EnergyPage 1
Safe Harbour Statement
This document includes supplemental financial measures that are or may be non-GAAP financial measures. New orders and order backlog; adjusted or organic growth rates of revenue and new orders; book-to-bill ratio; Total Sectors profit; return on equity (after tax), or ROE (after tax); return on capital employed (adjusted), or ROCE (adjusted); Free cash flow, or FCF; cash conversion rate, or CCR; adjusted EBITDA; adjusted EBIT; adjusted EBITDA margins, earnings effects from purchase price allocation, or PPA effects; net debt and adjusted industrial net debt are or may be such non-GAAP financial measures. These supplemental financial measures should not be viewed in isolation as alternatives to measures of Siemens’ financial condition, results of operations or cash flows as presented in accordance with IFRS in its Consolidated Financial Statements. Other companies that report or describe similarly titled financial measures may calculate them differently. Definitions of these supplemental financial measures, a discussion of the most directly comparable IFRS financial measures, information regarding the usefulness of Siemens’ supplemental financial measures, the limitations associated with these measures and reconciliations to the most comparable IFRS financial measures are available on Siemens’ Investor Relations website at www.siemens.com/nonGAAP. For additional information, see supplemental financial measures and the related discussion in Siemens’ most recent annual report on Form 20-F, which can be found on our Investor Relations website or via the EDGAR system on the website of the United States Securities and Exchange Commission.
This document contains statements related to our future business and financial performance and future events or developments involving Siemens that may constitute forward-looking statements. These statements may be identified by words such as “expects,” “looks forward to,” “anticipates,” “intends,” “plans,” “believes,” “seeks,” “estimates,” “will,”“project” or words of similar meaning. We may also make forward-looking statements in other reports, in presentations, in material delivered to stockholders and in press releases. In addition, our representatives may from time to time make oral forward-looking statements. Such statements are based on the current expectations and certain assumptions of Siemens’ management, and are, therefore, subject to certain risks and uncertainties. A variety of factors, many of which are beyond Siemens’ control, affect Siemens’ operations, performance, business strategy and results and could cause the actual results, performance or achievements of Siemens to be materially different from any future results, performance or achievements that may be expressed or implied by such forward-looking statements or anticipated on the basis of historical trends. These factors include in particular, but are not limited to, the matters described in Item 3: Risk factors of our most recent annual report on Form 20-F filed with the SEC, in the chapter “Risks” of our most recent annual report prepared in accordance with the German Commercial Code, and in the chapter “Report on risks and opportunities” of our most recent interim report.
Further information about risks and uncertainties affecting Siemens is included throughout our most recent annual and interim reports, as well as our most recent earnings release, which are available on the Siemens website, www.siemens.com, and throughout our most recent annual report on Form 20-F and in our other filings with the SEC, which are available on the Siemens website, www.siemens.com, and on the SEC’s website, www.sec.gov. Should one or more of these risks or uncertainties materialize, or should underlying assumptions prove incorrect, actual results, performance or achievements of Siemens may vary materially from those described in the relevant forward-looking statement as being expected, anticipated, intended, planned, believed, sought, estimated or projected. Siemens neither intends, nor assumes any obligation, to update or revise these forward-looking statements in light of developments which differ from those anticipated.
Due to rounding, numbers presented throughout this and other documents may not add up precisely to the totals provided and percentages may not precisely reflect the absolute figures.

© Siemens AG 2012. All rights reserved.CEO Fossil Power Generation DivisionDecember 11, 2012 Capital Market Day EnergyPage 2
Siemens Fossil Power Generation Leading portfolio and market position
Instrumentation and Electrical
No. 1in advanced GT frames (#)
No. 1in GT solution business (GW)
Energy Solutions
ProductsFossil PowerGeneration
Large-scale gas turbines,
steam turbines,
generators
Power plant solutions
Instrumentation and
Controls
Roland Fischer
Gas turbines
Steam turbines
Generators
Gasifiers
All solutions through to
complete power plants:
CCPP, GTPP
STPP
Instrumentation and
electrical control systems
for all types of power plants
IT solutions
Service
No. 1
Service

© Siemens AG 2012. All rights reserved.CEO Fossil Power Generation DivisionDecember 11, 2012 Capital Market Day EnergyPage 3
Solid revenue and leading margin
Orders Revenue
+26%-17%-20%
FY 2012
11.1
FY 2011
12.5
FY 2010
9.9
FY 2009
12.1
+8%+5%
-3%
FY 2012
11.2
FY 2011
10.2
FY 2010
9.6
FY 2009
9.8
Profit Free Cash Flow and Cash Conversion Rate
FY 2012
1,933
FY 2011
1,999
FY 2010
1,449
FY 2009
1,206882
FY 2012
1,619
FY 2011
1,769
FY 2010
2,196
FY 2009
12.3% 15.2% 17.3%19.6%
CCR
book-
to-bill 1.04 1.22 1.001.24
in %
of Rev.
€m
€m 18.1%20.7%
15.6%
12.3%
Underlying Margin
€bnGrowth1)
€bnGrowth1)
1) year-on-year on a comparable basis, i.e. excluding currency translation and portfolio effects
2) Profit w/o Impact AREVA disposal gain and AREVA arbitration result
2)
1.5 0.9 0.80.7
2)

© Siemens AG 2012. All rights reserved.CEO Fossil Power Generation DivisionDecember 11, 2012 Capital Market Day EnergyPage 4
Excellent long term market perspective
Over the next 20 years about today’s existing Large Fossil1) capacity will be added
More than 70% thereof will
be added in USA, Europe, China,
India and Middle East
USA, Europe
Replacements - Gas power plants the ideal fit
Middle East
Growth and Efficiency - Gas as backbone
China, India
Growth - Demand for cheap power
Installed Large Fossil1) power generation market capacity – Worldin GW
1) GT>60MW, ST>250MW
>70%>70%
USA
India
Middle East
RoW
2030
4,516
Europe
China1,207
495
785
1,186
929
2011
2,803
556
90
761
418
326
144
672
2,643
359
492
240
494
760
312
730
21
258
23843
30213
New capacityadditions
Retirements
418
325
672
556
90
761
144
1,206
495
784
1,178
>70%>70%

© Siemens AG 2012. All rights reserved.CEO Fossil Power Generation DivisionDecember 11, 2012 Capital Market Day EnergyPage 5
Gas - The fuel of choice
Reserves are substantially increasing due to new unconventional gas reserves
Sources: IEA, HIS CERA, indexmundi
1) figures may vary depending on source; 2) still to be explored
proved reserves
shale gas[quadrillion cubic feet 1)]
2)
potential net exporter
USA
Potential net exporter of gas by more than tripling its reserves driven by shale gas
China
Increasing the exploitation of shale gas via auctioning drilling licenses
Abundant resources lead to
moderate price development within
the next decades!
0.4
South Africa 0.5
Algeria
Australia 0.5
Mexico 0.7
Europe 0.7
Argentina 0.8
United States 1.1
China 1.4
Russia 2.0
Middle East 2.7
World gas reserves
Enough to supply more than 3500
SGT6-8000H in CCPP for 20 years
[5000 h/a]
© Siemens AG 2012. All rights reserved.CEO Fossil Power Generation DivisionDecember 11, 2012 Capital Market Day EnergyPage 6
22
2013
62
12
8
9
7
27
2012
60
90
8
22
17
9
35
2020
84
7
22
15
10
30
2015
72
13
10
14
7
28
2014
65
13
8
16
China
USA
Middle East
Europe
RoW
2030
6
11
7
17
3
22
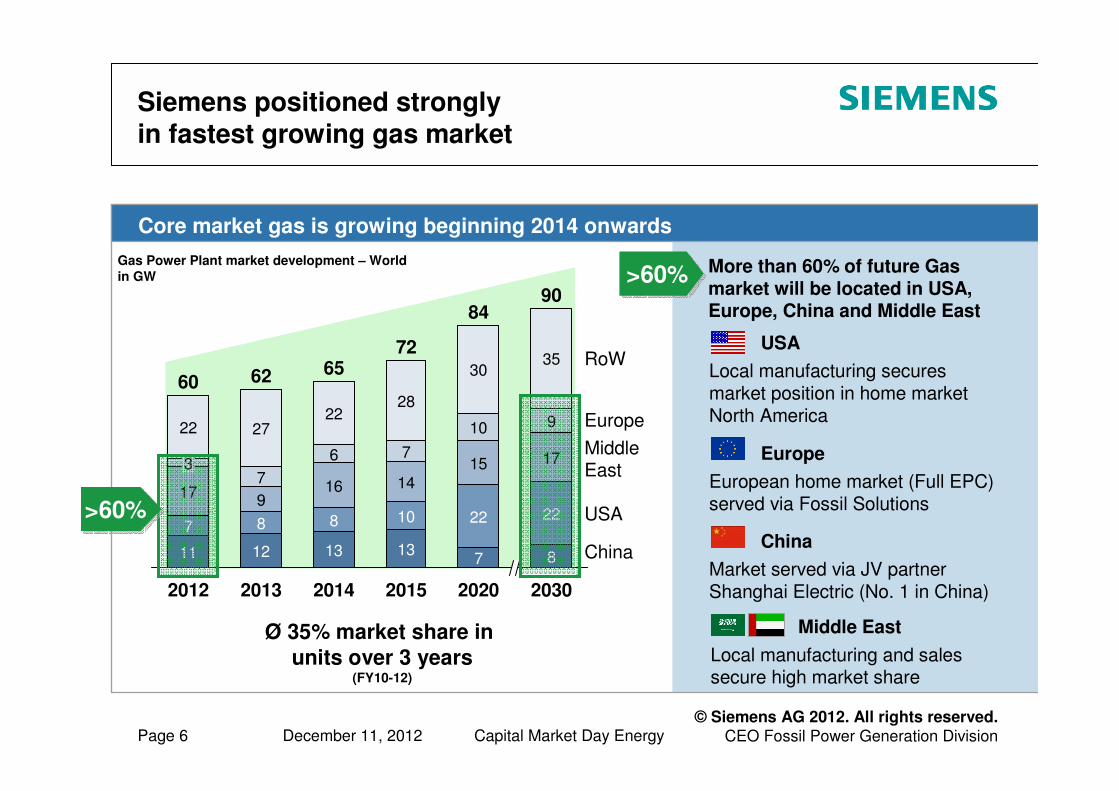
Siemens positioned stronglyin fastest growing gas market
USA
Local manufacturing secures market position in home market North America
Europe
European home market (Full EPC) served via Fossil Solutions
China
Market served via JV partner Shanghai Electric (No. 1 in China)
Middle East
Local manufacturing and sales secure high market share
Gas Power Plant market development – Worldin GW
Ø 35% market share in
units over 3 years(FY10-12)
Core market gas is growing beginning 2014 onwards
More than 60% of future Gas market will be located in USA, Europe, China and Middle East
>60%>60%
>60%>60%

© Siemens AG 2012. All rights reserved.CEO Fossil Power Generation DivisionDecember 11, 2012 Capital Market Day EnergyPage 7
Steam – a robust market
Steam - Second pillar served indirectly via JV and licenses
China, India
Biggest SPP markets served indirectly via JV SEC and license partnership BHEL
Rest of World
Europe and Middle East - Selective direct business
Around 70% of Future Steam Power Plant market are located in India and China
~70%~70%Steam Power Plant market development – Worldin GW
~70%~70%
Ø 39% market share in
MW over 3 years(FY 09-11, incl. JV and license partner)
China
India
RoW
2030
59
25
17
18
2020
47
16
13
18
2015
61
25
20
15
2014
52
26
14
11
2013
53
26
10
17
2012
50
28
9
13

© Siemens AG 2012. All rights reserved.CEO Fossil Power Generation DivisionDecember 11, 2012 Capital Market Day EnergyPage 8
The right footprint …
Footprint Extension
St. PetersburgRussia
DammamSaudi Arabia
Focus on gas Focus on Gas
+
Existing Footprint / Lead factories
Berlin Germany
CharlotteUSA
MülheimGermany
Gas turbines
EngineeringService
Steam turbines
GeneratorsEngineering
Service
Gas turbines
Steam turbinesGenerators
EngineeringService
Major JV location / strategic partner
Shanghai ElectricChina
BHELIndia
Gas turbines
Steam turbinesGenerators
Gas turbine parts
Steam turbines
Generators
… to exploit themarket potential
+

© Siemens AG 2012. All rights reserved.CEO Fossil Power Generation DivisionDecember 11, 2012 Capital Market Day EnergyPage 9
Fossil is the only full scope supplier
FLEXIBILITY
Lodi Energy Center California (USA)
Flex-Plant
F-Class
Full load in ~30 min
LauswardGermany
Full turnkey
H-Class
CCPP efficiency
>60%
CHP efficiency >84%
ChangxingChina
Product business
Localized F-Class
low specific price
request ~400 EUR/kW
QurayyahSaudi Arabia
Product business
World largest CCPP
F-Class (12 units)
EFFICIENCY CAPEX PLANT FITREQUIREMENT
Regionalexample /Customer
Siemensanswer
Markets are becoming more diversified due to different customer and regional requirements:
Flexibility, Efficiency, CAPEX, Plant fit, OPEX, ROI, Reliability, Products & Solutions
Fossil is the only full scope supplier to fulfill all changing market and customer requirements
based on its unique business portfolio

© Siemens AG 2012. All rights reserved.CEO Fossil Power Generation DivisionDecember 11, 2012 Capital Market Day EnergyPage 10
Innovation leadership secures our future competitiveness
Unique and sustainable business model
Continuous and strong investment in R&D of €350 - 400m/p.a.
Extend installed base through new products in all frames
Provide additional service business (mods and upgrades)
5-4000F(7)
Return
Invest
Service BusinessService Business
Invest
6-4000F(4)IntroductionIntroduction 6-5000F(3)5-4000F(4)5-2000E(1-3) 6-2000E(1-3)
6-5000F(4)5-2000E(8)
6-5000F(5)5-4000F(8)5-4000F(x)
5-4000F(9) 5-8000H(1.4)6-8000H(1.4)6-5000F(5ee)
Basetechnologyprogram
Further development
ongoing
>10 years >30 years

© Siemens AG 2012. All rights reserved.CEO Fossil Power Generation DivisionDecember 11, 2012 Capital Market Day EnergyPage 11
4Turbines in operationincl. commissioning
20Turbines sold
>18,000Operating hours
<30 minRamp-up timeCCPP single shaft
60.75%Net efficiency
Customer
Up to 5% higher return on investment compared to F-class engine
Technology leader in H-Class seriesProven in commercial operation

© Siemens AG 2012. All rights reserved.CEO Fossil Power Generation DivisionDecember 11, 2012 Capital Market Day EnergyPage 12
Cost Reduction Examples: Fossil Power Generation Division
Standardization of 50 and
60Hz frames
Acceleration of feeder plant
concept
(Hungary, Indonesia)
€250m productivity
improvement until 2014
Stringent Modularization
Approach
Increased Efficiency at
lower cost (Blade design)
€50m productivity
improvement until 2014
Market-screening for
components and suppliers in
focus countries
Adaption of sourcing models
on suppliers capabilities
€75m cost reduction
until 2014
Enable Global Value
Sourcing
Bundling of erection
packages
Reduction of project costs
€3m until 2014
Design to Cost in Fossil Frames Cost Optimization of Steam Turbine for Combined Cycle Applications
Global Value Sourcing Splitting and Bundling of Supply- and Erection Contracts
Examples

© Siemens AG 2012. All rights reserved.CEO Fossil Power Generation DivisionDecember 11, 2012 Capital Market Day EnergyPage 13
We deliver what we promise
Grafik Jochen

© Siemens AG 2012. All rights reserved.CEO Fossil Power Generation DivisionDecember 11, 2012 Capital Market Day EnergyPage 14
Reconciliation and Definitions forNon-GAAP Measures
This document includes supplemental financial measures that are or may be non-GAAP financial measures.
New orders and order backlog; adjusted or organic growth rates of revenue and new orders; book-to-bill ratio; Total Sectors profit; return on equity (after tax), or ROE (after tax); return on capital employed (adjusted), or ROCE (adjusted); Free cash flow, or FCF; cash conversion rate, or CCR; adjusted EBITDA; adjusted EBIT; adjusted EBITDA margins,
earnings effects from purchase price allocation, or PPA effects; net debt and adjusted industrial net debt are or may be such non-GAAP financial measures.
These supplemental financial measures should not be viewed in isolation as alternatives to measures of Siemens’ financial condition, results of operations or cash flows as presented in accordance with IFRS in its Consolidated Financial Statements. Other companies that report or describe similarly titled financial measures may calculate them differently.
Definitions of these supplemental financial measures, a discussion of the most directly comparable IFRS financial measures, information regarding the usefulness of Siemens’supplemental financial measures, the limitations associated with these measures and reconciliations to the most comparable IFRS financial measures are available on Siemens’Investor Relations website at www.siemens.com/nonGAAP. For additional information, see supplemental financial measures and the related discussion in Siemens’ most recent annual report on Form 20-F, which can be found on our Investor Relations website or via the EDGAR system on the website of the United States Securities and Exchange commission.