wccusd grade 7 math benchmark 3 study guide · wccusd grade 7 math benchmark 3 study guide page 2...
TRANSCRIPT

WCCUSD Grade 7 Math Benchmark 3 Study Guide
Page 1 of 17 MCC@WCCUSD (WCCUSD) 01/19/16
1 A scale drawing of a letter L sculpture is shown below where 1 centimeter represents 2 feet of the actual sculpture. The drawing of the L is divided into two separate rectangles. What is the area of the real life sculpture?
7.G.1
1´ Ezra made a large E statue for a recent school project. Each 1 inch on the scale drawing below represents 4 ft of the statue. He divided the E into 4 rectangles and labeled them. Which of the following statements are true about the drawing below?
7.G.1
How would you find the real life length of the 6 cm side?
Use the proportion
Real life length of the 6 cm side is 12 feet. How would you find the real life length of the 2 cm side?
Use the proportion
Real life length of the 2 cm side is 4 feet. How would you find the real life length of the 8 cm side?
Use the proportion
Real life length of the 8 cm side is 16 feet.
What is the scale? 1 cm = 2 ft
Mark all correct answers.
A) The length of the longest side of R4 in real life is 11 ft. B) The area of R4 in real life is 336 ft2. C) The length of the shortest side of R2 in real life is 12 ft. D) The area of R2 in real life is 18 ft2. E) The length of the longest side of R1 in real life is 16 ft. F) The areas of R1 and R4 in real life are equal. G) The sum of the areas of R2 and R3 in the scale drawing is 22 in2. H) The combined area of R2 and R3 in real life is smaller than the area of R4.

WCCUSD Grade 7 Math Benchmark 3 Study Guide
Page 2 of 17 MCC@WCCUSD (WCCUSD) 01/19/16
2 The side length of a triangle is 11 cm. Which group of line segments could form the other 2 sides of the triangle? Triangle Inequality Theorem: to form a triangle, the sum of any two sides must be greater than the length of the third side.
7.G.2
2a´ A triangle has two sides that are 4 in. and 10 in. What could be the length of the third side of the triangle? 7.G.2
2b´ A triangle has two sides that are 8 cm and
13 cm. What could be the length of triangle’s third side? 7.G.2
Select all that apply.
A) 4 cm and 4 cm
B) 5 cm and 5 cm
C) 5 cm and 6 cm
D) 6 cm and 6 cm
E) 7 cm and 8 cm
F) 9 cm and 10 cm
Select all that apply.
A) 4 in. B) 6 in. C) 8 in. D) 11 in. E) 12 in. F) 14 in.
Select all that apply.
A) 5 cm B) 10 cm C) 17 cm D) 20 cm E) 21 cm F) 24 cm

WCCUSD Grade 7 Math Benchmark 3 Study Guide
Page 3 of 17 MCC@WCCUSD (WCCUSD) 01/19/16
3 Find the area of the circle below. Use 3.14 as an approximation for π. Estimate the answer to check for reasonableness later. 3 • 4 • 4 = 48
Does the answer make sense? Yes. 50.24 ≈ 48 Final answer? The area of the circle is approximately 50.24 in2. Find the area of the semicircle below (the shaded region). Use 3.14 as an approximation for π. Round to the nearest tenth if necessary. Estimate the answer to check for reasonableness later.
Does the answer make sense? Yes. 56.52 ≈ 54 Final answer? The area of the semicircle is approximately 56.5 cm2. 7.G.4
3´ Tommy helped paint a basketball key on the neighborhood playground. Which of the following statements are true about the figure below?
7.G.4
A = πr2 Area of a circleA ≈ 3.14 • 42 Substitution of valuesA ≈ 3.14 •16 SimplifyA ≈ 50.24 Simplify
12• 3• 6 • 6 = 54
The area of a circle is equal to the product of π and the square of its radius. A = πr2
Is the radius or diameter given? Diameter. What value should be used for r? 6
A = 12πr2 Area of a semicircle
A ≈ 12• 3.14 • 62 Substitution of values
A ≈ 0.5 3.14( ) • 36 SimplifyA ≈ 56.52 Simplify
Select all that apply.
A) The area of the semicircle is 18π ft2. B) The perimeter of the key (including the semicircle) is approximately 70 ft. (circumference of a circle = 2πr) C) The perimeter of the key (including the semicircle) is approximately 60 ft. (circumference of a circle = 2πr) D) The area of the rectangular portion of the key is 31 ft2. E) The area of the rectangular portion of the key is 228 ft2. F) The area of the entire key is approximately 285 ft2.

WCCUSD Grade 7 Math Benchmark 3 Study Guide
Page 4 of 17 MCC@WCCUSD (WCCUSD) 01/19/16
4 What is the value of x?
7.G.5
4´ Which of the following statements are true about the figure below? (Note: Not drawn to scale)
7.G.5
What is the sum of the angle measures in a triangle? 180º What are the measures of the known angles? 40º and 90º What equation can be used to find the measure of the unknown angle in the triangle?
Solution: xº is supplementary to 50º. Subtract 50 from 180 to get a value of 130 for x.
A) ∠ABE and ∠CBD are complementary angles. B) ∠ABE and ∠CBD are supplementary angles. C) ∠EBD and ∠DBC are adjacent angles. D) The measure of ∠EBD is 80º. E) The measure of ∠EBD is 90º. F) The equation x + 43 + 47 = 180 could be used to find the measure of ∠EBD. G) The sum of the measures of ∠BED and ∠EBD is 130º. H) The measure of ∠BED is 43º.
Mark all correct answers.

WCCUSD Grade 7 Math Benchmark 3 Study Guide
Page 5 of 17 MCC@WCCUSD (WCCUSD) 01/19/16
5 Use two different methods to find the area of the trapezoid below. Method 1: Break into smaller figures Method 2: Area of a Trapezoid Formula 7.G.6
5´ Use two different methods to find the area of the trapezoid below. 7.G.6

WCCUSD Grade 7 Math Benchmark 3 Study Guide
Page 6 of 17 MCC@WCCUSD (WCCUSD) 01/19/16
6 The students in Ms. Floe’s class wrote essays about their spring break. The table below shows how many students wrote about each location. 7.SP.2
6 cont’d 7.SP.2
6´ Using the same table in example 6, identify
which of the following statements are true. 7.SP.2
Example 1: What percent of the students wrote about staying home? How many students wrote essays? 40 How many students wrote about staying home? 7 What number should go in the numerator? 7 (it represents a part of the whole) What number should go in the denominator? 40 (it represents the whole)
Convert to a decimal.
Final answer? 17.5% of the students wrote about staying home during their spring break. Example 2: There are 320 7th grade students at the school where Ms. Floe teaches. Predict how many students would write about staying home. What ratio do we know?
What should go in the numerator of the new ratio? The number of students (school wide) who would write about staying home for spring break. Do you know this information? If not, how can you represent it? Don’t know; with a variable.
What should go in the denominator of the ratio? The total number of students, 320. Let x represent the number of students who write about staying home. Solve for x.
Final answer? Of the 320 students, about 56 of them will write about staying home. Note: NOT an exact answer. A prediction is an estimate of what you might expect.
Mark all correct answers.
A) Four times as many students wrote essays about the movies than about the beach. B) 15% of surveyed students wrote essays about the skate park. C) In a group of 20 students, it is expected that 11 of the students wrote essays about the mall. D) More students wrote essays about the skate park and home than about the mall and beach. E) In a group of 200 students, it is expected that 20 of the students will write essays about going to a theme park.

WCCUSD Grade 7 Math Benchmark 3 Study Guide
Page 7 of 17 MCC@WCCUSD (WCCUSD) 01/19/16
7 Find the minimum, maximum, median, lower quartile, and upper quartile for the data set below. Then use the values to make a box plot. 17, 19, 31, 20, 12, 8, 24, 13, 15 Organize the data from least to greatest. 8, 12, 13, 15, 17, 19, 20, 24, 31 6.SP.4
7´ The following data set below represents the test scores of 10 students. Find the minimum, maximum, median, lower quartile, and upper quartile for the data set. Then use the values to make a box plot. 81, 90, 65, 77, 70, 100, 65, 75, 95, 82
6.SP.4
Minimum: the lowest value in the data set. Maximum: the highest value in the data set. Median: the middle value of a data set. Lower Quartile: the median of the lower half of a data set. Upper Quartile: the median of the upper half of a data set.
median maximum minimum
When making a box-and-whisker plot, sometimes it is helpful to plot the values above the number line first before drawing the plot.
minimum (8)
maximum (31)
median (17)
upper quartile (22)
lower quartile (12.5)
minimum: _______ maximum: _______ median: _______ lower quartile: _______ upper quartile: _______

WCCUSD Grade 7 Math Benchmark 3 Study Guide
Page 8 of 17 MCC@WCCUSD (WCCUSD) 01/19/16
8 The double box plot below shows the daily participants for grade 7 and 8 in the after school program of a local school.
7.SP.4
8´ The double box plot below shows the speed of cars recorded on two different roads in Alameda County.
7.SP.4
What does the double box plot show? Daily level of participants for two grades. Is either plot symmetric? Grade 8 is symmetric, but grade 7 is not. Which grade had more total participants? Grade 7. Which grade had a greater variation of participants? Grade 7. The range for grade 7 is 80 and the range for grade 8 is 40. What is the difference between the ranges of the two data sets? The difference between the two ranges is 40. What is the difference between the interquartile ranges of the two data sets? The interquartile range for grade 7 is 30 and the interquartile range for grade 8 is 20, so the difference between the interquartile ranges is 10. What are the medians for each set of data? The median for grade 7 is 170 and the median for grade 8 is 150. Describe how the data is skewed or symmetric for each sample. The data for grade 7 is skewed right and the data for grade 8 is symmetric.
Which of the following statements are true?
A) The difference between the medians of the two data sets is 10. B) The median for Frontage Road is 52.5. C) The interquartile range for Highway 80 is 5 and the interquartile range for Frontage Road is 10. D) Highway 80 has less variation so its speeds are more consistent. E) Frontage Road has less variation so its speeds are more consistent. F) The average speed of cars is higher on Highway 80. G) The average speed of cars is higher on Frontage Road.
Select all that apply.

WCCUSD Grade 7 Math Benchmark 3 Study Guide
Page 9 of 17 MCC@WCCUSD (WCCUSD) 01/19/16
9 The double dot plot shows the daily number of smoothies sold to two different grade levels during a two-week period.
7.SP.4
9´ The double dot plot below shows the daily high temperatures for two cities in 12 days. 7.SP.4
What does the double dot plot show? The number of smoothies sold for two grades over a two week period. Is either plot symmetric? No. Which grade level generally sold more smoothies per day? Grade 7. Which grade had a greater variation of smoothies sold? Grade 7. The range for grade 7 is 40 and the range for grade 8 is 25. What is the difference between the means of the two data sets? The mean for grade 7 is 70.7 and the mean for grade 8 is 66.1 so the difference between them is approximately 5. What is the difference between the medians of the two data sets? The median for grade 7 is 70 and median for grade 8 is 65, so the difference between the medians is 5. Which grade had more consistent numbers sold? Grade 8 had more consistent numbers sold per day.
Which of the following statements are true?
A) The mean for Richmond is approximately 75. B) The median for Richmond is 76. C) The mean for Oakland is greater than the mean for Richmond. D) The difference between the means of the two cities is approximately 5. E) The difference between the medians of the two cities is approximately 8. F) If you prefer warmer temperatures, based on the data above, you probably would choose Oakland. G) In the 12 days data was collected, only one of the cities had a high of 72º.
Select all that apply.

WCCUSD Grade 7 Math Benchmark 3 Study Guide
Page 10 of 17 MCC@WCCUSD (WCCUSD) 01/19/16
10 The spinner below has 10 equal-sized wedges, each labeled A-J. 7.SP.5
10´
7.SP.5
Example 1: The spinner is spun one time. Find the probability or P(E) of landing on the E. How many E’s are on the spinner? One. How many outcomes are possible when spinning the spinner one time? Ten.
The probability of the spinner landing on the E
is
Example 2: The spinner is spun one time. Find the probability of landing on the D or G. The word or indicates that the number of favorable outcomes needs to include the letters D and G.
The probability of the spinner landing on the D or G
is
Using the spinner to the left (question 10) and the graphic above, indicate whether each statement correctly describes the probability of the outcome. The spinner is only spun once for each statement.
A) The probability of landing on the A is less than .
B) The probability of landing on the C, D, E, or F is less than 50%. C) The probability of landing on a vowel is more than 0.4. D) It is likely that the spinner will land on a vowel. E) It is impossible that the spinner will land on a Z. F) If one of your favorite letters is on the spinner, it is unlikely that the spinner will land on that letter. G) The probability of not landing on the J is less than 80%. H) The probability of not landing on the F, G, or H
is greater than .
Mark all correct answers.

WCCUSD Grade 7 Math Benchmark 3 Study Guide
Page 11 of 17 MCC@WCCUSD (WCCUSD) 01/19/16
11 Use a ruler and protractor to create and label a triangle with the given conditions. Example 1: Given: The measure of ∠A is 90 degrees. The length of side AB is 2 cm. The measure of ∠B is 50 degrees. Example 2: Given: The length of side LM is 1 cm. The length of side MN is 5 cm. The length of side NL is 2 cm. This is a trick question. You cannot create a triangle with the given conditions. 7.G.2
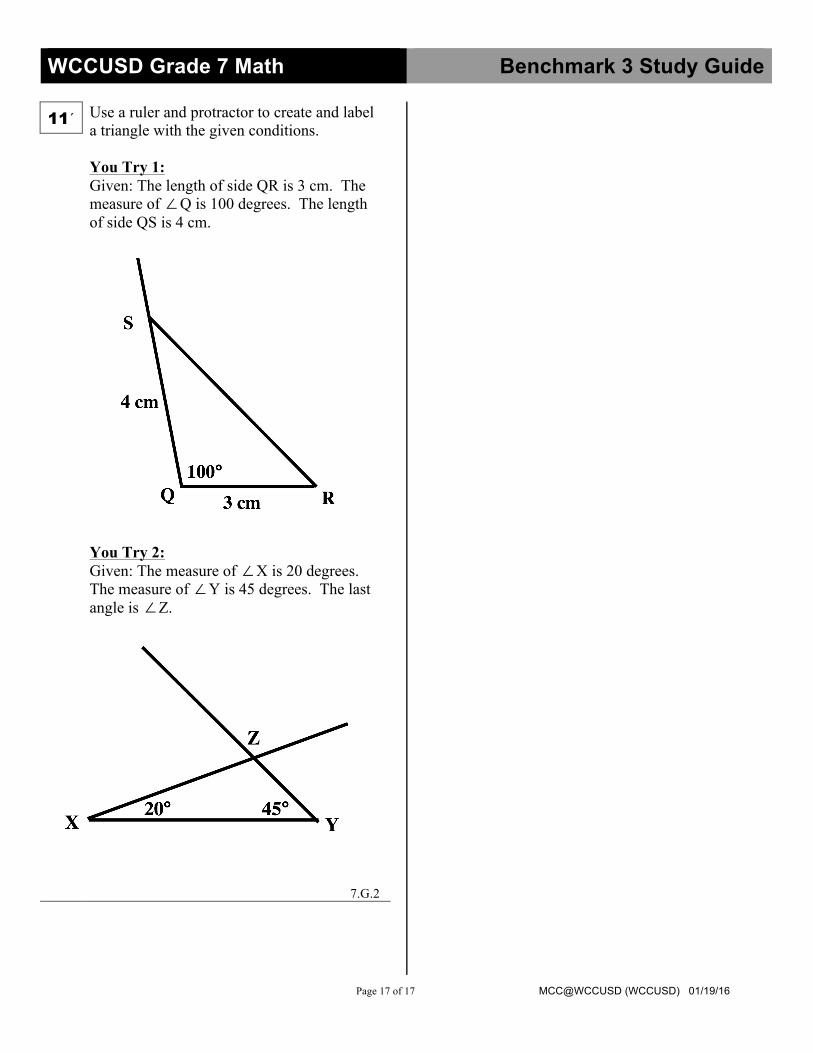
11´ Use a ruler and protractor to create and label a triangle with the given conditions. You Try 1: Given: The length of side QR is 3 cm. The measure of ∠Q is 100 degrees. The length of side QS is 4 cm. You Try 2: Given: The measure of ∠X is 20 degrees. The measure of ∠Y is 45 degrees. The last angle is ∠Z. 7.G.2
End of Study Guide

WCCUSD Grade 7 Math Benchmark 3 Study Guide
Page 12 of 17 MCC@WCCUSD (WCCUSD) 01/19/16
You Try Solutions:
1´ Ezra made a large E statue for a recent school project. Each 1 inch on the scale drawing below represents 4 ft of the statue. He divided the E into 4 rectangles and labeled them. Which of the following statements are true about the drawing below?
7.G.1
2a´ A triangle has two sides that are 4 in. and 10 in. What could be the length of the third side of the triangle? 7.G.2
2b´ A triangle has two sides that are 8 cm and
13 cm. What could be the length of triangle’s third side? 7.G.2
Mark all correct answers.
A) The length of the longest side of R4 in real life is 11 ft. B) The area of R4 in real life is 336 ft2. C) The length of the shortest side of R2 in real life is 12 ft. D) The area of R2 in real life is 18 ft2. E) The length of the longest side of R1 in real life is 16 ft. F) The areas of R1 and R4 are equal. G) The sum of the areas of R2 and R3 in the scale drawing is 22 in2. H) The combined area of R2 and R3 is smaller than the area of R4.
Select all that apply.
A) 4 in. B) 6 in. C) 8 in. D) 11 in. E) 12 in. F) 14 in.
Select all that apply.
A) 5 cm B) 10 cm C) 17 cm D) 20 cm E) 21 cm F) 24 cm

WCCUSD Grade 7 Math Benchmark 3 Study Guide
Page 13 of 17 MCC@WCCUSD (WCCUSD) 01/19/16
3´ Tommy helped paint a basketball key on the neighborhood playground. Which of the following statements are true about the figure below?
7.G.4
4´ Which of the following statements are true about the figure below? (Note: Not drawn to scale)
7.G.5
Select all that apply.
A) The area of the semicircle is 18π ft2. B) The perimeter of the key (including the semicircle) is approximately 70 ft. (circumference of a circle = 2πr) C) The perimeter of the key (including the semicircle) is approximately 60 ft. (circumference of a circle = 2πr) D) The area of the rectangular portion of the key is 31 ft2. E) The area of the rectangular portion of the key is 228 ft2. F) The area of the entire key is approximately 285 ft2.
Mark all correct answers.
A) ∠ABE and ∠CBD are complementary angles. B) ∠ABE and ∠CBD are supplementary angles. C) ∠EBD and ∠DBC are adjacent angles. D) The measure of ∠EBD is 80º. E) The measure of ∠EBD is 90º. F) The equation x + 43 + 47 = 180 could be used to find the measure of ∠EBD. G) The sum of the measures of ∠BED and ∠EBD is 130º. H) The measure of ∠BED is 43º.

WCCUSD Grade 7 Math Benchmark 3 Study Guide
Page 14 of 17 MCC@WCCUSD (WCCUSD) 01/19/16
5´ Use two different methods to find the area of the trapezoid below. Method 1: Break into smaller figures Method 2: Area of a Trapezoid Formula 7.G.6
6´ Using the same table in example 6, identify which of the following statements are true. 7.SP.2
Mark all correct answers.
A) Four times as many students wrote essays about the movies than about the beach. B) 15% of surveyed students wrote essays about the skate park. C) In a group of 20 students, it is expected that 11 of the students wrote essays about the mall. D) More students wrote essays about the skate park and home than about the mall and beach. E) In a group of 200 students, it is expected that 20 of the students will write essays about going to a theme park.

WCCUSD Grade 7 Math Benchmark 3 Study Guide
Page 15 of 17 MCC@WCCUSD (WCCUSD) 01/19/16
7´ The following data set below represents the test scores of 10 students. Find the minimum, maximum, median, lower quartile, and upper quartile for the data set. Then use the values to make a box plot. 81, 90, 65, 77, 70, 100, 65, 75, 95, 82 Put in order from least to greatest: 65, 65, 70, 75, 77, 81, 82, 90, 95, 100 Box-and-Whisker Plot: 6.SP.4
8´ The double box plot below shows the speed of cars recorded on two different roads in Alameda County.
7.SP.4
minimum: 65 maximum: 100 median: 79 lower quartile: 70 upper quartile: 90
upper quartile
maximum minimum
lower quartile
79
Which of the following statements are true?
Select all that apply.
A) The difference between the medians of the two data sets is 10. B) The median for Frontage Road is 52.5. C) The interquartile range for Highway 80 is 5 and the interquartile range for Frontage Road is 10. D) Highway 80 has less variation so its speeds are more consistent. E) Frontage Road has less variation so its speeds are more consistent. F) The average speed of cars is higher on Highway 80. G) The average speed of cars is higher on Frontage Road.

WCCUSD Grade 7 Math Benchmark 3 Study Guide
Page 16 of 17 MCC@WCCUSD (WCCUSD) 01/19/16
9´ The double dot plot below shows the daily high temperatures for two cities in 12 days. 7.SP.4
10´
7.SP.5
Which of the following statements are true?
A) The mean for Richmond is approximately 75. B) The median for Richmond is 76. C) The mean for Oakland is greater than the mean for Richmond. D) The difference between the means of the two cities is approximately 5. E) The difference between the medians of the two cities is approximately 8. F) If you prefer warmer temperatures, based on the data above, you probably would choose Oakland. G) In the 12 days data was collected, only one of the cities had a high of 72º.
Select all that apply.
Using the spinner to the left (question 9) and the graphic above, indicate whether each statement correctly describes the probability of the outcome. The spinner is only spun once for each statement.
A) The probability of landing on the A is less than .
B) The probability of landing on the C, D, E, or F is less than 50%. C) The probability of landing on a vowel is more than 0.4. D) It is likely that the spinner will land on a vowel. E) It is impossible that the spinner will land on a Z. F) If one of your favorite letters is on the spinner, it is unlikely that the spinner will land on that letter. G) The probability of not landing on the J is less than 80%. H) The probability of not landing on the F, G, or H
is greater than .
Mark all correct answers.
WCCUSD Grade 7 Math Benchmark 3 Study Guide
Page 17 of 17 MCC@WCCUSD (WCCUSD) 01/19/16
11´ Use a ruler and protractor to create and label a triangle with the given conditions. You Try 1: Given: The length of side QR is 3 cm. The measure of ∠Q is 100 degrees. The length of side QS is 4 cm. You Try 2: Given: The measure of ∠X is 20 degrees. The measure of ∠Y is 45 degrees. The last angle is ∠Z. 7.G.2