wavelength calibrations in the far infrared (30 to 1000 ... · *thc ohio sta.te university, ......
TRANSCRIPT
>
TOURNAL OF RESEARCH of the National Bureau of Standards- A, Physics and Chemistry Vol. 67A, No, 4, Tuly- August 1963
Wavelength Calibrations In the Far Infrared (30 to f'I 1000 Microns)
K. Narahari Rao, * R. V. de Vore, * and Earle K. Plyler
(April 3, J 963)
A di scussion is prcscntcd of ce rta in cal ib ration p rocedu res cmployed in thc region 30 Lo 1000 m icrons. Calcu lated pos il ions for the pun' I'olationa l absorp t ion lines of the CO, HCN, and N 20 molecu les a rC' g iH' n, an d a map of the pure roLationa l absorption lim' s of t he H 20 molec ule as recorded with a Perkin-Elmer model :301 s pec t rophotol11('tcr is s hown,
1. Introduction
During the r ecent meetings of the Triple Co mmission fo[" Spectroscopy, there hlwe been discussions about th e need for systematizing the wavelength standard s a nd the wavelength calibration techniques for the infraredl'egion. To par tially m eet this need, a r eport [il' has been co mp iled co ns isLing of ll1f1pS a nd the spectral posit ions of several vi bration rotation bands occu],ring in the regioll 2,5 to 15j..L. Evidcntly, it is ill1pOJ'tan t to provide such datl1 for use in the far infrared at wH.velengths longer than 15/L and extending into the millim eter r egion of the electroIllagnetic spectruill . Furthermore, it is of interest to examine critically all th e currently available wavelength calibration techniques because of the impossibility of devising one procedure thaL can be adopted for the entire spectral region betwecn 30 Lo 1000/L.
2. Experimental Procedure
In the far infrf1l'ed region we observe m ostly th e pure rotational spectra of molecules. It is possible to calculate the positions of t he pure rotational lines of a diatomic molecule like CO and linear triatomic molecules like HCN and NzO by employing the rotational cons tants derived from studies of the microwave and neal' infrared H,bsorption spectra of Lhese m olecules. One m a \T conceive of three different wars in which Lhe purc' rotational lines of simple molcculcs suc h as CO, N 20 , lwd HCN can be used for thc cali brati on of [ai' in frared grating spectromeLcrs : (i) In the case of spectrometers facilitated to ci e termin e Lhc anguhl.l' rotation of the grating, it is
*Thc Ohio Sta.te U n iverSity, ColuJIl bus, Ohio .
IFigurcs in hrackets indicate th e litera ture references a.t th e end orthi s paper.
possible to employ Lhe grating eq uaLion
v = nl{ coscc fJ,
n being the specLral order , l{ the gratin g cO ll sLn,n t (expressed in cm - I ) , and fJ the lingle beLween Lhe cen tral image and Lhe spcctral lillc 10cl1.ted at j) cm- I . Obscrvat ions on the pure rotational lines of CO, H CN, and NzO can lead Lo a value for the grating co nstant l{. This value for l{ Cfl.n then be used in the su bseq uen t measurements of t he far infrfl.l'cd lines. Evidentl.\r, we should llssurne that th c value for l{ does not change b etween the time Lh c stl1.ndal'ds (viz, CO , HCN , and N zO) are recorded and the t im e when t he angular positions of t he far i nfmred lines fl.l'e mcasured. If several repetitive r ecords are obta,ined, it is possiblc to m inimize the e1'1'ors arising 1'1'0111 cha nges in the grating constant. The accul'ac,' of the m efl.suremcnts m ade with Lhis m ethod depends on the accuracy with wllich the angular 1'0Ll1.tions of Lhe grating can be determined. (ii ) In commercia.linstruments, like the PerkinElmer model 301 far infrared spectrop hotometer, the recorded data are considered to be linear j n wave number units . This is accomplished by using [2]a "cosecant drive" for rotating t he grating. "Pip" marks ar e recorded periodicall.v on the chart. It has been our experience that, for a particulal' installation of the grating, the locfl.tions of these marks with respect to far infrared spectra are reproducible to accuracies of about ± 0,03 cm- 1 at 100j..L . WiLh these limi tations in mind, it should be possible to calibra te these " pip" m arks by Jnfl.king observations on the pure rotational lines of the abovc s imple molecules. (ii i) A techniqu e which has been extensi vel~T em.plo~Ted in the neal' i nfrarcd specLral r egions cons ists in the simul taneous observation, by use of double-pen recorders, of two bcams of radiation passing through the spectrometer at the
351
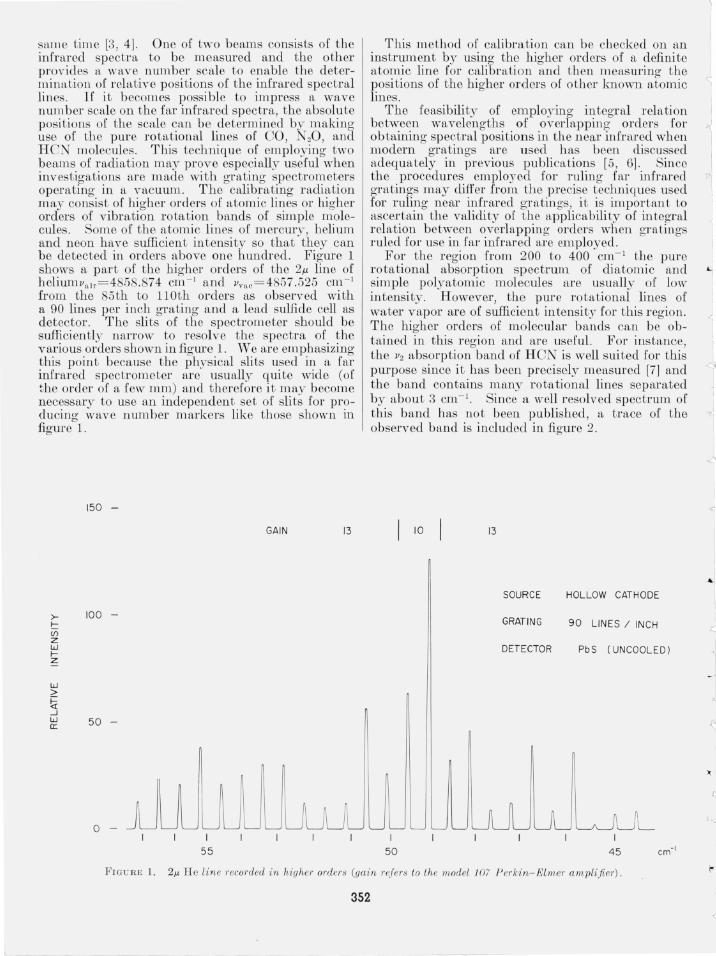
same time [3 , 4]. One of two beams consists of the infrared spectra to be measured and the other provides a wave number scale to enable the determination of relative positions of the infrared spectral lines. If it becomes possible to impress a wave nUJIl bel' scale on the far infrared spectra, the absolute positions of the scale can be determined by making use of the pure rotational lines of CO, N 20, and HON molecules. This technique of employing two beams of radiation may prove especially useful when investigations are made with grating spectrometers operating in a vacuum. The calibrating radiation may consist of higher orders of atomic lines or higher orders of vibration rotation bands of simple molecules. Some of the atomic lines of mercury, helium and neon have sufficient intensity so that they can be detected in orders above one hundred. Figure 1 shows a part of the higher orders of the 2J.l line of heliumlla lr= 4858.874 cm - 1 and IIvac= 4857.525 cm- 1
from the 85th to 1l0th orders as observed with a 90 lines per inch grating and a lead sulfide cell as detector. The sli ts of the spectrometer should be sufficiently narrow to resolve the spectra of the various orders shown in figure 1. We are emphasizing this point because the physical slits used in a far infrared spectrometer are usually quite wide (of the order of a few mm) and therefore it may become necessary to use an independent set of slits for producing wave number markers like those shown in figUl'e 1.
>-t:: en z w l-z
w > ti ....J W 0:
150 -
100 -
50 -
o -I
55
GAIN 13
This method of calibration can be checked on an instrument by using the higher orders of a definite atomic line for calibration and then measuring the positions of the higher orders of other known atomic lines.
The feasibility of employing integral relation between wavelengths of overlapping orders for obtaining spectral positions in the near infrared when modern gratings are used has been discussed adequately in previous publications [5, 6]. Since the procedures employed for ruling far infrared gratings may differ from the precise techniques used for ruling neal' infrared gratings, it is important to ascertain the validity of the applicabili ty of integral relation between overlapping orders when gratings ruled for use in far infrared are employed.
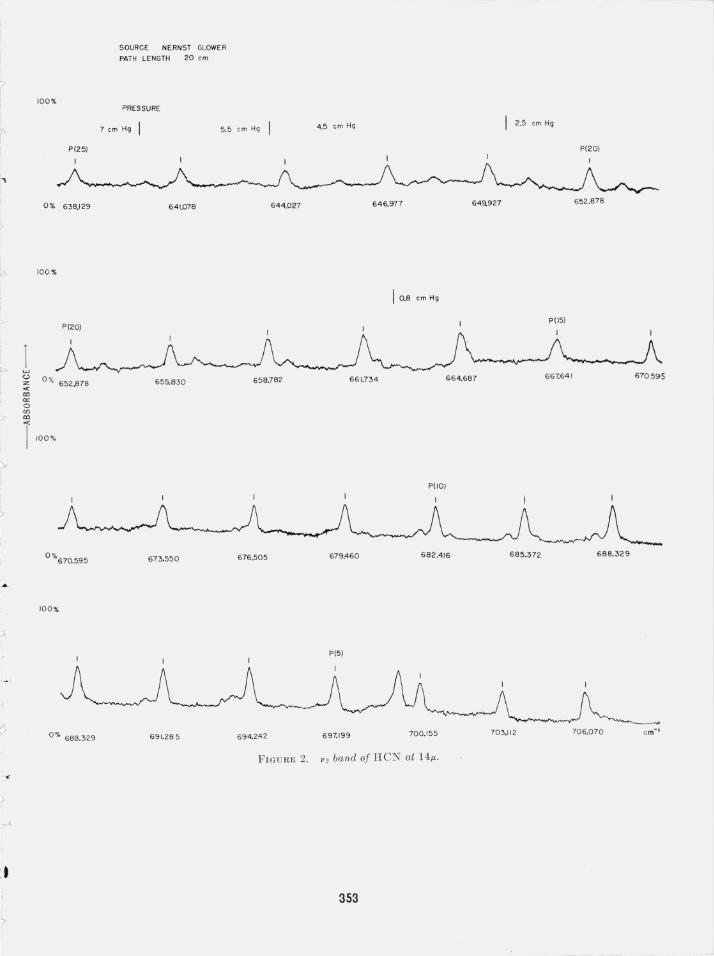
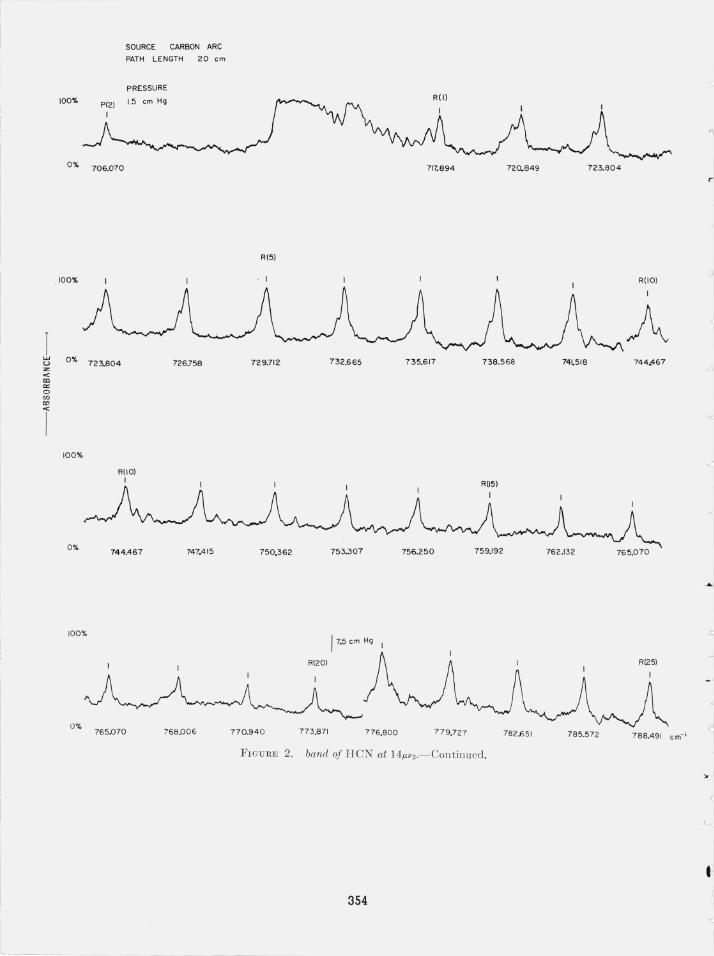
For the region from 200 to 400 cm- I the pure rotational absorption spectrum of diatomic and simple polyatomic molecules are usually of low intensity. However, the pure rotational lines of water vapor are of sufficient intensity for this region. The higher orders of molecular bands can be obtained in this region and are useful. For instance, the 112 absorption band of HCN is well suited for this purpose since it has been precisely measured [7] and the band contains many rotational lines separated by about 3 cm- I . Since a well resolved spectrum of this band has not been published, a trace of the observed band is included in figure 2.
1
50
10 13
SOURCE
GRATING
DETECTOR
HOLLOW CATHODE
90 LINES / INCH
PbS (UNCOOLED)
45
FIGU RE 1. 2", lIe li n e reco1'ded i n hi gher orders (gain refe1's to the m odel 107 P erkin- Elmer am pli.fier).
352
------ - -
1 1
I
.f-
, .' ~
I I
I
"I 1
(;
<
I r r ~
a:l a:: o (/)
,'or co
?
I
~ I
L..:
;t
I
100%
P(25)
0% 638.1 29
100%
P(20)
0 % 652.878
100 %
0 %670.595
100 %
0% 688.329
SOURCE NERNST GLOWER
PATH LENGTH 20 em
PRESSURE
7 em Hg I 5.5 em Hg I 4.5 em Hg I 2.5 em Hg
P(20)
641.078 64 4.027 646.977 649.927 652.878
I 0.8 em Hg
P(l5)
655.830 658.782 661.734 664.687 667.641 670 .595
POOl
673.55 0 676.505 679.460 682.416 685.372 688.329
P(5)
691.285 694.242 697.199 700.155 703.11 2 70 6.0 70
F IGURE 2. > 2 band of H eN at 14/i.
353
100%
0%
100%
r
706.070
SOURCE CARBON ARC
PATH LENGTH 20 em
PRESSURE
t! 0% 723.804 726.758 z <:
'" cr o U) al
r 100%
0 %
100%
0 %
R(lO) I
744.467
765.070
747.415
758.006
717.894 720.849
R(5)
729.712 732.665 735.617 738 .568
750,362 753.307 756.250
17.5 em Hg I
R(20)
770.940 773.871 776.800 779.727 782.651
FI GUR E 2. band of HC~ at 14JlV2.- Continued.
354
723.804
R(lO)
A 74L518 744.467
762.132 765.070
R(25)
785.572 788.491 em-I
r
I I
~
" .
> I
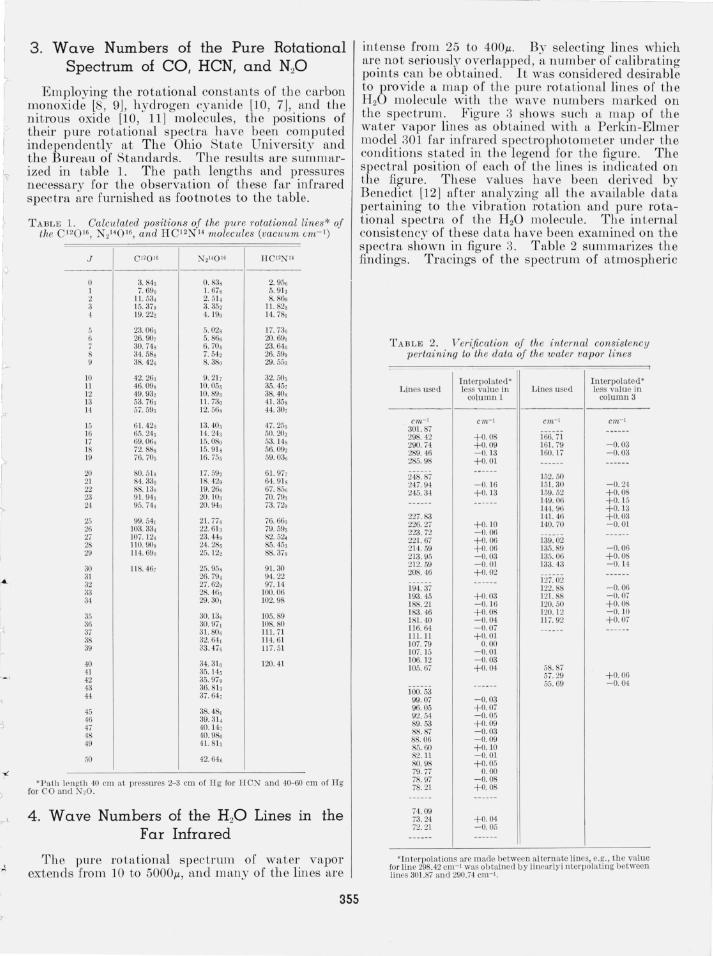
3 . Wave Numbers of the Pure Rotational Spectrum of CO, HCN, and N20
Employing the rotational constants of the carbon n~onoxide [8, 9], hydrogen cyanide [10, 7], and the m tl'OUS oXlde [10 , 11] molecules, the positions of ~heir pure rotational spectra have been computed mdependently at The Ohio State University and the Bureau of Standards. The results are summarized in table 1. The path lengths and pressures necessary for the observation of th ese far infrared spec tra are furnished as footnotes to the tabl e.
T ABLE 1. Calculated positions of the pUTe rotationallines* of the C I 20I6, N 214 016, and H0 2N14 molecules (vacuum on-I) .
J 0 120 16 )J2HQ16 n CI'N"
0 3.84, 0. 83, 2.95, 1 7.690 I. 67, 5.913 2 It. 53, 2.5 1, 8.86, 3 15.37, 3.35, 11. 82, 4 J9.22, 'I. J90 J4. 781
5 23.06, 5.02, 17. 73, 6 26.90, 5.86, 20.691 7 30.74 , 6.70, 23.64, 8 34.58, 7.54, 26.59. 9 38.426 8.380 29.553
JO 42.26, 9.21, 32.50, Jl 46.09, 10.05, 35. ,15, J2 49. 93, 10.89, 38.40, J3 53. 76, J I. 730 41. 35, 14 57.59, 12.56, 44 .30,
J5 61. 420 13. 40, 47.25, 16 65.24, 14.24, 50.20, 17 69. 06s J5.08o 53. 14, J8 72.88, 15.9 1, 56.09, 19 76.70, 10.755 59.03,
20 80.5 1, J7.59, 61. 97, 21 84.330 18. 42, 64.9 \ , 22 88. J3s 19.26, 67.85, 23 9 1. 94, 20. \0, 70.79, 2,\ 95.74 1 20.940 73.72.
25 99.541 21. 77, 76.66, 26 \03.33, 22.6J, 79.59, 27 107. J2, 23.44 , 82.524 28 J1 0.90, 24.28, 85.45, 29 114.69, 25. 12, 88.37.
30 J \8. 46, 25.9.) , 91. 30 31 26.79, 94.22 32 27.62, 97. J4 33 28.46, 100.06 34 29.301 102.98
35 30. \36 105. 89 36 30.971 108. 80 37 3t. SO, Ill. 71 38 32.641 1\4.61 39 33. 47, 117. 51
40 34.3 \0 120.41 4\ 35. J4 , 42 35.97, 43 36.8J, 44 37.647
45 38.481 46 39.31, 47 40.14, 48 40.980 49 41. 813
50 42.64 6
'Path lellgth 40 em at pressures 2-3 elll of IIg for lICN ancl 40- 60 em of lIg for CO and :-< ,0.
4 . Wave Numbers of the H20 Lines in the For Infrared
The pure rotational spectrum of water vapor extends from 10 to 5000Jl, and many of the lines are
355
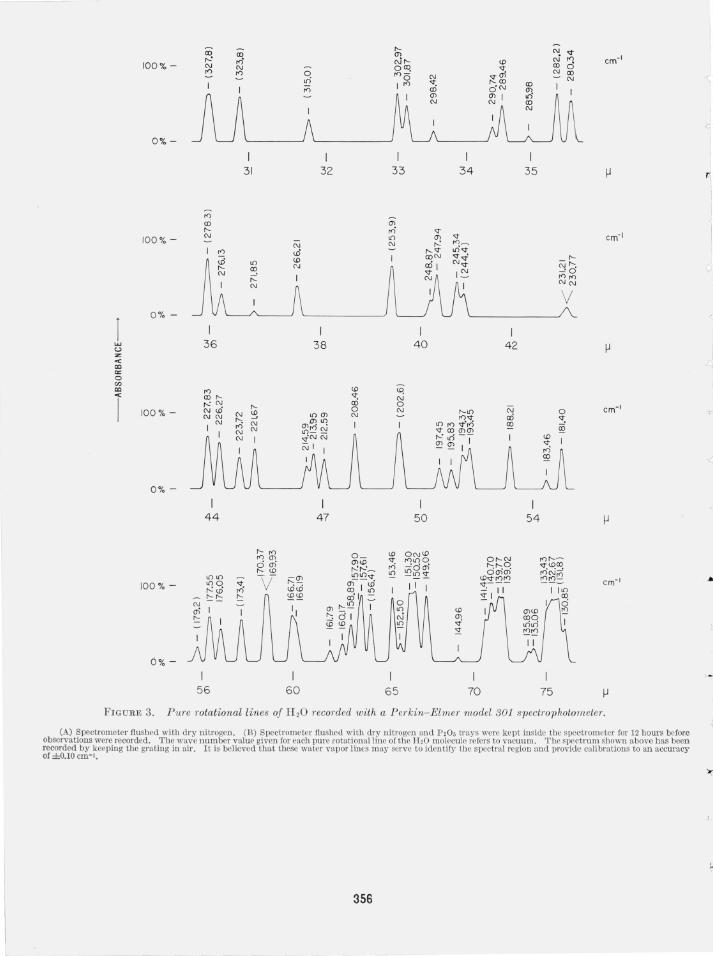
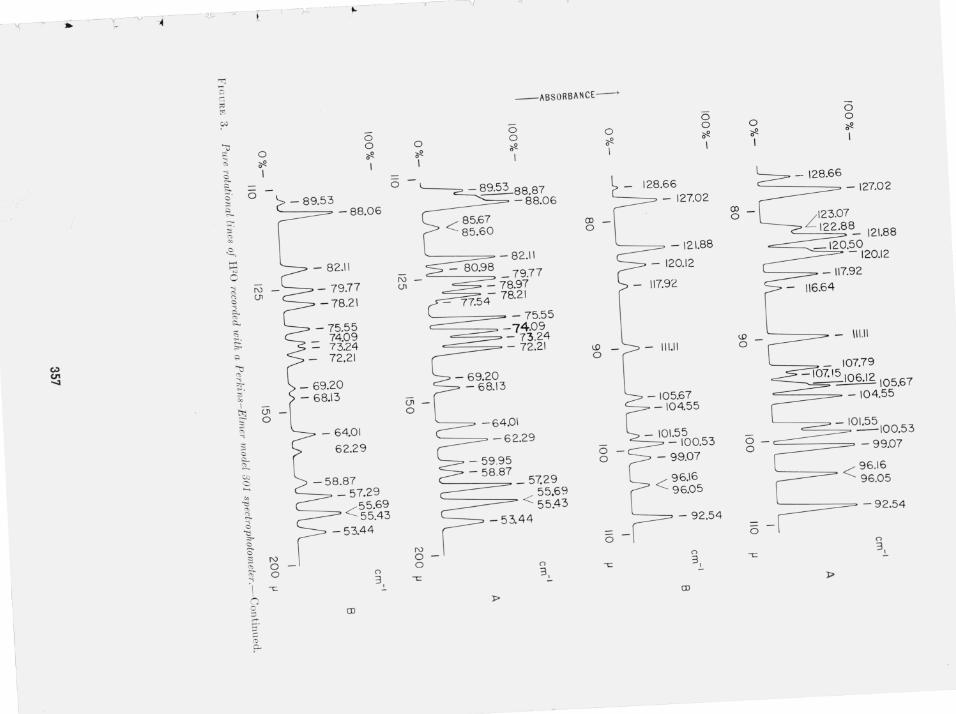
in tense fro.m 25 to 400Jl . By selecting lines which al' ~ not senously overlapped, a number of calibrating pomts can b e obtamed. It was considered desirable to provide a map of the pure rotational lines of the H 20 molecule with the wave numbers marked on the spectrum.. Figure 3 ~hows such a map of the water vapor hnes as obtamed wILh a Perkin-Elmer mod~I.301 far infr.ared spectropho to meter under the condltlOns stated m the legend for the fi O'ure. The spectral position of each of the lines is i;dicated on the fi!j\'ure. TI~ese valu e~ h ave b een ~erived by BenedlCt [12 ] after analyzmg all the available data ~ertaining to the vibration rotation and pure l'otatlOnal spectra of the H 20 molecule. The internal consistency of these data have been examined on th e spectra shown in figure 3. Table 2 summarizes the findings. Tracings of the spectrum of atmospheric
*1!1 tcrpolations arc rnacle between altern ate lines, C.g., Lbo value fo r llll e 29S.42 em-I was obtained by liucarlyi nterpolating between lines 301.87 and 290.74 eill- I .
0% -
44 47 50 54
f'-- r<l <D ON<D r<l en <t; r<llf)O Of'--N r<lf'---0 0) r<l --'00) d:;;~ <;t.~cq f'-- <D lQ ~~~ 8~~ If)lf) \l tOo;;;tr<>r<> em- I
100% - If)O <;t. I I <;t---r---:0 r<l I ~ III ~!::: t:
<D a: <;t
~
0% -
56 60 65 70 75 ~
FIGURE 3. Pure rotational lines of H 20 recorded with a Perkin-ElmeT model 301 spectl·o photometer.
(A) Spectrometer flushed with dry nitrogcn. (B) Spectrometer flushed with dry nitrogen and P,O, trays werc kept inside the spectrometer for 12 hours before observations were recorded. 'rhe wave number value given for each pure fotationallinc of the H20 molecule refers to vacuum. rr'hc spectrum shown above has been recorded by keeping the grating in air. It is believed that tbese watcr vapor lines may serve to identify the spectral region and provide calibrations to an accuracy of ±O.10 cm-I •
356
''{ .. '(. -v-~ l.C l
y j..
~-
c. ~ :-"
0 J' 0
0 ~ o-!!
o-!!
;i.. I a c' 0 ;l - 89.53 ~ - 88.06 :;. '" co
2, ..... >-j - 82.11 0 ,,; N - 79.77 " U1 c -78.21 ~
'" :;:,..
~ - 75.55
~ _ 74.09 ;=' - 73.24 I'l - 72.21
(.,) ~
'" ~ '" ;. _ 69.20 0". ;; co - 68.13 I
~ U1
~ 0
'" ""' - 64.01
~ 62.29 c
~ C.() co - 58.87 ~
co _ 57.29
.",
'" < 55.69 " 55.43 ;; .", - 53.44 ;=' c 0-;l N
'" 0 6' 0 "'l
()
3 \
-c: .:. 0 0 ~ OJ s:-. ~
" 0.
-y-- ----v 'K !). ..1'--
__ AB SO RBANCE-
0 0
0 0
0 0
o-!! o-!! o-!!
o-!!
I I
I
0 -~88.87 -88.06 - 127.02
< 85.67 OJ
85.60 0
-121.88 -82.11
- 80.98 N _ 79.77 U1 -78.97
77.54 78.21 - 75.55
-74.09 - 73.24
is -~ - 111.11 - 72.21
- 69.20 - 68.13
U1 0
-64.01 -62.29
0 - 59 ,95 0
- 5887 _ 57.29 < 96.16 < 55.69 96.05
55.43
- 53.44 - 92.54
0 N 0 0
()
() 3,
--c 3,
-c:
OJ J;>
A . - ' -" ~
(3 0
0 o-!! o-!!
I
:::-= - 128.66 = -127.02
OJ 0 L 123.07
122.88_ 121.88 _120.50
-120.12
-117.92
1\6.64
<.0 =- - \\\.1\ 0
e '55
0- - 100.53 o - 99.07
< 96.16 96.05
= -92.54
0 ()
-c 3,
J;>
I .-J
water vapor obtained with a small grating spectrometer in the region 600 to 166 cm- i have been published by Plyler et al. [13]. Also, the paper by Rao et al. [14] gives a map and measurements (to an accuracy of ± 0.02 cm- i ) of the pure rotational lines of the H 20 molecule, in the region 550 to 270 cm- i as obtained with a 1000 lines per inch Bausch and Lomb plane replica grating installed in a Pfundtype vacuum spectrometer.
One of us (KNR) wishes to express his deep gratitude to the U.S. Army Research Office (Durham, N.C.) and to the National Science Foundation for their finan cial support through con tracts with the Ohio State University Research Fo undation. Our thanks are also due to Dr. W . S. Benedict for supplying us with his analysis of the presently available data pertaining to the infrared rotational lin es of the H 20 molecule.
(Paper 67 A4- 225)
5. References
[1] Calibrating Wave Numbers for t he Calibration of Infrared Spectrometers, published by t he International Union of Pure and Applied Chemistry, Butterworths, London (1961).
[2] C. C. Helms and R. E. Anacreon, J. Opt. Soc. Am. 50, 511 (1960).
[3] Earle K. Plyler, L. R. Blaine, and E. D. Tidwell, J . Research N BS 55, 279 (1955).
[4] K. Narahari Rao, L . R . Ryan , and Harald H . N ielsen, J. Opt. Soc. Am. 49, 216 (1959).
[5] K. Narahari Rao, T. J. Coburn , J. S. Garin g, K. Rossmann, and H. H. Nielsen, J . Opt. Soc . Am. 49, 221 (1959) .
[6] D. H. Rank, J . Opt. Soc. Am. 50, 657 (1960) . [7] K. Narahari Rao, W. W. Brim, and J . M. Hoffman, J .
Opt. Soc. Am. 50, 228 (19()0) . [8] D. H . Rank, A. H. Ge un t her, G. D . Saksena, J . N.
Shearer, and T. A. 'Wiggins, J. Opt. Soc . Am. 47, 686 (1957) .
[9] Earle K. Plyler, L. R. Bla in e, and W. S . Connor, J . Opt. Soc. Am. 45, 102 (1955).
[10] D. H. Rank , D. P. Eastman, B. S. Rao, and T. A. Wiggins, J. Opt. Soc. Am. 51, 929 (1961).
[11 ] E. D. Tidwell , E . K. Plyler, and W. S. Benedict, J. Opt. Soc. Am. 50, 1243 (1960).
[12] W. S. Benedict (private communication). [13] L . R. Blaine, E. K. Ply ler, and W. S. Benedict, J. Re
search NBS 66A (Phys. and Chem.) No. 3,223 (1962) . [14] K. Na rahari Rao, W. W. Brim , V. L. Sin nett, and R . H .
Wilson, J. Opt . Soc. Am. 52, 862 (1962).
358
.J
!
1
' I
- I
(
I J.