watershed management plan for silver creek … management plan for . silver creek watershed ......
TRANSCRIPT

Watershed Management Plan for Silver Creek Watershed
“Our creek. Our watershed. Our future.”
Neil M. Shaffer
Project Coordinator
Howard Soil & Water Conservation District
September 2012

1
Table of Contents
1. General Purpose and Vision Statement……………….…..….….2
2. Watershed Introduction……………………………..………………3 2.1. Watershed Map and Boundries………………….…......….3
2.2. Location Narrative and History…………………….……....4
2.3. Physical Characterisitics……………………….……….….4
2.4. Public Opinion Survey……………………………...….…..16
3. Pollutants and Causes……………….……………………..……..…..17
3.1 Impaired Designation……………..……………...….……..17
3.2 Water Quality Data…………………………………………..18
3.3 Pollutant Sources and Loads…………………………........29
4. Identifying Pollutant Sources……………………………………..…...36
4.1 Bacteria Data Analysis…………….……………..…………36
5. Project Goals and Objectives………………………………...…....….40
5.1 Statement of Goals………….…...……………………….…..40
5.2 Project Objectives…………………………………….………41
5.3 Project Activities……………………………………….…..….42
5.4 Information and Education Camapign………………..….…44
5.5 Best Management Practices………………………………..52
5.6 Implementaion Schedule……………………………………57
5.7 Target Load Reductions……………………………..…....….59
5.8 Implementation Annalysis……………………….…………...60
5.9 Bacteria Reduction Milestones………………...………….…63
5.10 Resource Needs……………………………………..……......66
5.11 Implementation Startegy………………………..……....……69
5.12 Outreach Plan………………………………………...….….…71
6. Supporting Information ……….……………….…………….…....…...77
6.1 Quality Assurance Project Plan (QAPP)……….…..……..….77
6.2 Karst Study of Silver Creek……………………………….....108
6.3 Public Opinion Survey Results............................................112
6.4 RASCAL Assessment…………………………………......…125
Appendix Works Sited…………….………………………………...…...132
2
1.
The Silver Creek Watershed is a complex and diversified watershed. It is both urban and rural, land cover is both cultivated and natural. Livestock prodution is abundant throughout the watershed including goats, beef and dairy. Both open lot and confinement livestock production produce manure runoff and nutrient application issues. Urban development has produced habitat alteration and a drastic increase in the rate and volume of stormwater discharge.
General Purpose and Vision Statement
The Silver Creek Watershed is on the Iowa Department of Natural Resources 303(d) impaired water bodies list due to bacteria levels at 5.5 times the state criterion and therefore can no longer support primary contact recreation.
Goal 1 of this project is to create an environment of watershed awareness, implement management practices and install conservation practices to reduce the bacteria levels within Silver Creek. The water quality goal for bacteria in Silver Creek is for 100% of the samples taken during April through October to be below the water quality criterion of 235 CFUs/100 ml. The implementation of BMPs that address sources of bacteria are expected to result in attainment of these goals over the course of the implementation of this plan, as we will discussed in subsequent sections. Goal 2 of the project is to install conservation practices that will reduce sediment delivery to Silver Creek. Goal 3 of the project will be to reduce nitrate loading from the Silver Creek to the Upper Iowa River. Better management of stormwater runoff, nutrient management, handling and application of manure and reducing sediment delivery to the stream will help us reach these goals.
Given the high demand for practices this awareness and promotion campaign will increase education of the local stockholders, and will be an integral part of the project to ensure the best mangement practices are promoted and implemented. We will work closely with our partners in the watershed to accomplish our goals. This will play an important role in the Silver Creek Watershed information and education program and will be vital to the sustained health of the creek.
Although the Silver Creek Watershed is complex and diversified in both land forms and residents, the opportunities to improve the water quality is tremendous. Working with the stakeholders to achieve these goals will allow us to not only address the damage that has been done but also to work to avoid its return.
Vision Statement:
“Our creek. Our watershed. Our future.”

3
2.2.1 Watershed Map and Boundary
Watershed Introduction

4
2.2 Location Narrative and History
The Silver Creek Watershed is located in Howard and Winneshiek Counties in northeast Iowa. Silver Creek Watershed consists of row crops and grassland and also includes the city of Cresco (pop. 3,905). Cresco is the main social hub for the watershed; it has ample businesses and community activities to support the Silver Creek Watershed project. Silver Creek Watershed’s land area is 22,410 acres (13,104 acres in Howard County and 9,306 acres in Winneshiek County) and empties into the Upper Iowa River.
“The Upper Iowa River and its tributaries contribute greatly to the economic health of the region, diversifying the opportunities for business and tourism development in the region. The waters of Northeast Iowa are a major attraction for anglers and other water recreationists. …In 1998 the Iowa DNR estimated over 314,000 angler trips per year are made to the Upper Iowa River Watershed, stimulating over $29 million dollars of economic activity each year. The Iowa DNR estimates canoeists enjoying the Upper Iowa River generate another $5 million yearly.” (Upper Iowa River Watershed Project: http://www.northeastiowarcd.org/uirw/about.htm). Furthermore, National Geographic Adventure magazine lists canoeing the Upper Iowa River as one of the Top 100 Adventures in the United States: (http://www.nationalgeographic.com/adventure/0003/100adventures_new.html). The overall health of the Upper Iowa River Watershed and its fish populations are greatly impacted by its tributaries, including Silver Creek. While many people visit this area from around the state (and country), this watershed project seeks to inspire greater appreciation and awareness of water quality issues on the part of Silver Creek’s own local watershed residents.
The Silver Creek Watershed is on the Iowa Department of Natural Resources 303(d) impaired water list due to bacteria levels at 5.5 times the state criterion and therefore can no longer support primary contact recreation. A land assessment of the watershed has been completed.
Silver creek has had a long history of water monitoring and comprehensive studies. Beginning in the 1960’s Silver Creek along with the other sub watersheds of the Upper Iowa River have under gone study of the aquatic life and water quality. In 2010 the Howard Soil and Water Conservation District was awarded a watershed planning grant by the Iowa DNR. This grant was a step in the direction of not only assessing the watershed, but the intent of the District to put into action a plan to improve the water quality and overall health of The Silver Creek Watershed.
2.3 Physical Characteristics
Silver Creek originates in Vernon Springs Township, Howard County (S12 T99N R11W), meanders into Orleans Township, Winneshiek County (S2 T99N R10W) and flows into the Upper Iowa River. The watershed is 22,410 acres (35 sq. miles) and 8.2 miles of segment is classified as a Class A1, Class B (WW-2) river. The HUC number is 070600020303 with a water code IA 01-UIA-0403_0.
Geologic mapping of bedrock units in northeast Iowa (Liu and others, 2008) shows Silver Creek watershed is underlain by Cedar Valley Limestone in the Cresco area, which overlies the Spillville Formation of the Wapsipinicon Group. These rocks in turn overlie the Maquoketa Fm and finally rocks of the Galena Group. Past erosion has removed younger, overlaying rocks from the lower elevations of the watershed. This has resulted in thinning or complete removal of the younger units as the Upper Iowa River valley is approached.

5
Hydrologically, the Cedar Valley and Galena rocks are aquifers – they will readily transmit and yield
groundwater to wells. These units are also subject to karst development. The Spillville Formation is an aquifer but with lesser potential for karst. The Maquokata Formation contains significant low-permeability shale, and acts as an aquitard (does not readily transmit or yield significant water) in the overall sense; however, parts of the Maquokata contain interbedded carbonate layers which will transmit water. This is particularly true in the lowermost part of the formation which is a silty, shaly carbonate. Where most of the Maquoketa has been removed by erosion, and the unit is thin, karst may develop within the carbonate portion and into the underlaying Galena rocks.
Interpretation of LiDAR and aerial photography (Figure 1) indicates sinkholes occur commonly in
the Cedar Valley around Cresco, but considerably less so within the Spillville in the surrounding area. Sinkhole inputs in the Cresco area are likely transmitted mainly via the Cedar Valley rocks. Groundwater likely flows from the Cedar Valley rocks into the underlaying Spillville rock; however, the lack of sinkholes formed in the Spillville suggests it is unlikely to have extensive “concentrated” flow in pipes, conduits, or cavernous-type zones.
Figure 1: Aerial Location Map

6
These factors indicate water entering Cedar Valley Group sinkholes in the upper part of the watershed is likely not transmitted in a “regional” karst system. In addition, the Maquoketa Formation separates the upper units from the highly karst-prone Galena. Water entering the ground via sinkholes in the Cedar Valley at Cresco won’t be surfacing from a Galena spring.
Although the majority of the watershed is in row crops and grassland, the City of Cresco (population 3,905) is included in the watershed boundaries. With this in mind, this Plan includes both urban and rural Best Management Practices (BMP’s) to meet the goals and objectives. A TMDL has not been completed, nor has one been scheduled.
Figure 2: Monitoring Sites
Another valuable tool for attaining information about the health of the watershed is to introduce additional water monitoring sites (Figure 2). We have included an additional five locations for monitoring. The first two sites are located just above and below the Cresco Wastewater Treatment Plant. The WWTP is permitted in pursuant to the authority of the 402(b) of the Clean Water Act and is required to discharge pollutants in accordance with the effluent limitations. The purpose of monitoring upstream and downstream of the WWTP is to identify any potential issues within the treatment plant, and if so, what those issues are. The third site is a tributary (Minors Creek) that meanders into the

7
main channel of Silver Creek. The fourth site is located at the historical monitoring site on the main channel of Silver Creek. The fifth site is located near the Upper Iowa River, and below where all the tributaries of Silver Creek merge.
One of the known impairments of Silver Creek is bacteria. The Upper Iowa Watershed Alliance (UIRW) has been monitoring Silver Creek to identify contaminants in the water and the potential source of these contaminants, with the goal to improve the water. Because Silver Creek is a tributary of the Upper Iowa River, the UIRW Alliance realized that some questions needed to be answered. Samples were collected in 2002 through 2003 and analyzed by the University of Iowa Hygienic Laboratory. Bacterial DNA studies were conducted as a joint project between the IDNR, Iowa Geological Survey Bureau, the University of Iowa Hygienic Laboratory and the Upper Iowa River Watershed Alliance, through the Northeast Iowa RC&D in Postville Iowa. The findings of this research found a variety of sources for possible contamination including humans, livestock, and wildlife. The bacteria may come from a variety of paths including malfunctioning septic systems, manure runoff of fields after application and even storm water runoff from land with wildlife, livestock and pet waste. The UIRW plans to utilize these findings to support projects that will assist in the long-term health of the tributaries that flow into the Upper Iowa River.
As Silver Creek is impaired for bacteria, of prime importance are “open” sinkholes that allow free entry of runoff into the groundwater. These are the most likely to input large volumes of water with high concentrations of bacteria. The very shallow rock Spillville area and shallow soil-filled depressions allow significant infiltration to groundwater, but do provide filtration that will decrease bacteria concentrations; however, the shallow rock – shallow aquifer nature of most of the watershed does indicate a high potential for leaching on nitrogen, soluble herbicides, and some level of bacterial constituents. In order to confirm the geologic interpretations and assure that watershed improvement activities will lead to positive results in the Silver Creek itself, the IDNR and NE Iowa RC&D will continue to study this watershed
When addressing nonpoint source contributions to surface water bodies, an understanding of watershed hydrology is required to identify critical areas where water interacts with and mobilizes contaminants, such as nutrients, sediment, bacteria, or pesticides; and to identify the pathways by which mobilized contaminants reach the surface water of interest. This allows for targeting best management practices to locations where the greatest water quality benefits will accrue.
A similar understanding of the subsurface hydrology, or hydrogeology, allows better identification of sources, pathways, and delivery points for groundwater and contaminants transported through the watershed’s subsurface geological “plumbing system.”

8
Figure 3:Elevation Relief Map
A watershed is typically defined and mapped as the topographic area (Figure 3) contributing runoff to a stream above some point of interest. A more complete delineation incorporates the subsurface zone that contributes actively circulating groundwater to the stream and requires considering a watershed as a three-dimensional hydrologic package.
Groundwater in any Iowa watershed is fed by recharge from precipitation and snowmelt, moves laterally and horizontally through the subsurface, and discharges back to the surface into the watershed’s stream and its tributaries. This groundwater contribution is commonly referred to as base flow. The depth from which actively circulating groundwater contributes to stream flow is dependent on watershed relief and the permeability of the underlying geologic materials. Low relief watersheds underlain by slowly permeable materials typically have relatively shallow depths of actively circulating groundwater and relatively small groundwater-derived base flow contributions. In contrast, in high relief watersheds underlain by highly permeable materials, groundwater may circulate to considerably greater depths and provide significant base flow contributions to the receiving stream. Between these conceptual relief and permeability “end members” lay watersheds with a gradation of circulation depths and base flow contribution volumes.

9
Figure 4: Slope Map
The abundance of HEL (Figure 4) in the area indicates a need for additional conservation planning. The NRCS program Conservation Stewadship Program (CSP) is a conservation program that rewards farmers for manageing their land in a way that soil loss is kept to a minimum and application of fertilizer, herbicides and pesticides are done in an ecologically friendly way while allowing for peak crop yeild performance. A major requirement of this program is to reduce tillage and use fertilizer application rates according to Iowa State University recommended levels. Promotion of this program to all those operators in the watershed who do not currently have a CSP contract will be a high priority.

10
Figure 4: Sheet & Rill Erosion
Sediment Delivery Calculations
The Silver Creek Watershed is spit unevenly between 2 landform regions: the Iowan Surface (19,341 acres) and the Paleozoic Plateau (3,249 acres). Therefore, the Sediment Delivery Rates for the Iowan Surface (11.7%) and the Paleozoic Plateau (22.6%) were weighted to arrive at the 14.3% Sediment Delivery Rate utilized. Sediment delivery estimates are based upon NRCS; erosion and sediment delivery worksheet (1996). Russle C and P factor information were gathered by local NRCS office staff. Total Sediment delivery was calculated at 4,097 tons per year with an average sediment delivery of .2 ton per acre per year across the watershed.
Total sheet and rill erosion (Figure 4) as calculated from the land use survey completed in 2011 is estimated at 28,756 tons per year which transltes to an average sheet and rill erosion of 1.3 tons per acre per year.

11
Figure 5 Tillage Survey Map
From our experience with our annual tillage survey (Figure 5), we feel that no-till/strip-till has been used but is still under utilized. Fall application of manure has also led to greater potential for soil erosion. Other conservation practices such as contours and terrraces have had limited application here. The farms are relatively average in size and fields are commonly under 40 acres in size. There are a few operations that have exceeded 2000 acres in size. This size of farm is atypical, but the trend to bigger farm size is escalating and large-scale farming doesn’t lend itself to contouring and limits it’s acceptance to that practice.

12
Figure 6: Land Use Map
An intensive land use survey was completed by the Howard SWCD in 2011 (Figure 6) and GIS mapping was done in the project area. Crop covers 79.3% of the area (corn, soybeans, CRP, alfalfa, oats). Historically Silver Creek watershed had 3,361 acres of timber, today it is 1,018 acres a 66.9% loss of forest. A compilation of of the records of crop year 2011 indicate the following land use:
Land Use Acres % of Total Corn 8,518 37.70%
Soybeans 5,696 25.20% CRP 2,202 9.70%
Alfalfa 1,287 5.70% Oats 203 1%
Total Potential Crop 17,906 79.30%
Of 146 building sites in the watershed 86% are occupied. During the 2011 crop season, we found 2,204 acres of CRP (9.7%). There is pressure from landowners not to renew expiring General CRP contracts because of high cash rent. Higher commodity prices have translated into higher cash rent exceding $300 per acre. The key is to put into place conservation practices which includes Continuous

13
CRP. Farm the best and buffer the rest has been a good selling tool to ensure marginal crop land and areas suseptible to erosion are enrolled into CRP and not brought back into production. We have had a good response from landowners who do not re-enroll General CRP (whole farm) to do buffer strips, contour buffers, and grassed waterways.
Figure 7: Soils Map
Silver Creek Watershed Soils (Figure 7)
The Rockton and Winneshiek soils are shallow to limestone bedrock and can indicate potential groundwater concerns from leaching of water-soluable products. There are 4,823.4 acres of these soils or 15.1% of the Silver Creek watershed. The Silver Creek Watershed has few remaining natural wetlands, however those that do exist are in riverine pasture or timber. Although there are 4,387 acres (13.6%) of the area are hydric soils, all of the wetlands in crop fileds have been drained for increased production. Wetlands are a natural filter for contaminanats, and the Howard SWCD has identified sites to restore or create artificial wetlands.
Major Soils SMU Acres % of Total Rockton Loam 814B 3325.6 10.4%
Winneshiek Loam 914B 1497.8 4.7% Floyd Loam 198B 1451.7 4.5%
Bassett Loam 171B 1405.5 4.4% Racine Loam 482B 1276.3 4.0% Marlean Loam 512C 953.2 3.0%

14
Across the eastern three quarters of the UIRW the topography of the bedrock surface closely resembles the topography of the land surface. In this eastern region the ridge tops are typically capped by less than 50 feet of Quaternary sediment, the valley walls are mantled by thin sediment, and the valley floors usually are underlain by 10 to 70 feet of alluvium. The lowest elevation of the bedrock surface, slightly less than 550 feet above sea level, is at the confluence of the Upper Iowa River Bedrock topography, Upper Iowa River watershed. and the Mississippi River. The highest elevations of the bedrock surface, in excess of 1,300 feet above sea level, occur along several uplands in the central and western parts of the watershed. The configuration of the bedrock surface in the far western region departs significantly from surface topography. In this area bedrock valleys incised to elevations of 1,000 feet above sea level trend to the south and southwest, while surface drainage trends northeast towards the Upper Iowa River. These bedrock valleys, such as the one beneath Hayden Prairie State Preserve, contain as much as 300 feet of Quaternary sediment.
Figure 8: Geologic Features Map

15
Geological Information
The majority of the Upper Iowa River transects a portion of the state bypassed by the last continental glacier, accountiong for the more rugged topography of the area when compared to other sections of Iowa (Figure 8). The limestone bedrock of this driftless region (including The Silver Creek Watershed) is subject to being disolved by slightly acidic rain water and an intricate network of solution chambers, caves, springs and sinkholes have formed in this karst region. Karst is a Yugoslavian word used to describe an assemblage of geomorphic features related to carbonate rock formations and hydrology. The karst topography of the Silver Creek Watershed results in a fairly constant supply of groundwater being discharged through springs and seeps in the streambed. These ground water discharges into the streams of this basin help maintain summer water temperatures cool enough so that 29 streams are designated as coldwater streams, and 23 of these streams are part of the DNR’s trout stocking program. However, it is also true that in areas of Karst topography the surface waters and the contaminates they carry may reach the groundwater without being filtered or diluted. As a consequence, carbonate sinkholes represent direct pathways for surface runoff water to enter aquifers without the benefit of filtration through the soil. Sinkholes are formed when the underlying soluble carbonate bedrock has been dissolved through time by percolating groundwater, creating voids in the subsurface. When the overlying materials can no longer bridge the void(s), collapse occurs. Sinkholes are often connected to enhanced zones of fractures and conduits which allow the relatively rapid movement of water and contaminants from sinkholes through the subsurface. Conduits may be relatively minor pipe-like features, or enlarged into caverns. In either event they represent highly preferred pathways for groundwater. While sinkholes represent direct points of groundwater recharge, springs and seeps represent direct points of groundwater discharge back to the land surface. Springs and seeps occur where the water table intersects the land surface, typically in stream valleys. Where a karst aquifer is underlain by an aquitard, groundwater moves laterally above the aquitard, and springs and seeps typically are concentrated where the contact between the units intersects the land surface. Sinkholes connected to springs via transmissive conduit zones are termed the “conduit-flow” part of a karst aquifer (White, 1969). While conditions vary widely, in many karst-fractured rock aquifers permeable pathways within the bulk of the aquifer are formed by fractures and bedding plane partings that have only been modestly enlarged by dissolution. Recharge occurs by infiltration (as is does in non-karst aquifers) “between the sinkholes.” The fracture-bedding plane zones of these aquifers were referred to by White (1969) as the “diffuse-flow” parts of the aquifer. Groundwater in the diffuse-flow parts of the aquifer tends to move towards and discharge to the more transmissive conduits, which functions as drains that feed springs. Losing streams occur where the local water table has dropped below the level of a stream bed, allowing water to flow downward. Karst areas are commonly typified by losing streams, as the development of conduit-flow systems tends to lower the water table in the aquifer, and the fractured and dissolved nature of the aquifer allows for ready downward leakage of surface water. In areas of karst development, some losing streams end in clearly visible sinkholes, while others tend to lose water more diffusely into the stream bed. Under relatively low flow conditions in many karst settings, total loss of stream flow occurs. The varying ways water enters and travels through karst groundwater systems has a profound effect on the quality of the recharge water, and hence on the quality of groundwater discharging back to the surface. Following rainfall or snowmelt, runoff to sinkholes and losing streams deliver recharge water with relatively high concentrations of sediment, sediment-attached nutrients such as phosphorus and ammonia-nitrogen, herbicides, organic matter, and bacteria. In contrast, infiltration recharge to the

16
aquifer, passing through the relatively thin cover of soil and surficial materials, delivers relatively high concentrations of soluble, non-adsorbing contaminants, in particular nitrate. Aquifers are highly susceptible to contamination by infiltration of soluble mobile chemicals (including nitrates), bacteria, surface runoff from agricultural land, and waste disposal or surface spills of various kinds.
Climatic Characteristics of the Silver Creek Watershed
Temperature Annual mean temperature of 46.7 degrees F in Cresco
All-time high of 104 degrees F, extreme low of -43 degrees F
Precipitation 33.4” of precipitation per year average
39.8” of snow per year average Average # of days with >1.0” of precipitation: 7.3
Average # of days with >0.5” of precipitation: 21.9 Average # of days with >0.1” of precipitation: 65.6
Growing Season
Average growing season (temps above 32 degrees F) is 152 days
2.4 Public Opinion Survey
Introduction This document reports the results of a survey conducted for the Community Assessments: Key Components to Successful Community-based Watershed Improvement Project. This project is collaboration between Iowa State University Extension and the Silver Creek Watershed group.
The public opinion survey is funded by Silver Creek Watershed planning group and Iowa Department of Natural Resources Section 319 funds, the purpose of this project is to develop and test a community assessment tool that can be used by watershed action teams and coordinators to enhance community understanding of watersheds. Effective community assessments will allow watershed groups to develop goals, outreach and education regarding water quality challenges based on the values of the people living in the watershed.
The Silver Creek Watershed survey was based on a water issues survey administered to the four states in the Heartland Region in 2007. Using a similar survey allows local watershed groups to compare their findings to the statewide findings. Silver Creek Watershed has approximately 6,900 residents if you include the whole city of Cresco, which is only partially in the watershed. We chose to include the entire city because of drainage issues, etc. We completed a mailing list for the watershed by compiling landowner lists from Howard and Winneshiek counties and a mailing list from the city of Cresco. Due to the large size of the Cresco mailing list it was decided that every fifth resident should be entered into our survey mailing list. The list was still very large, so the final list was determined using every other entry and equates to approximately 10 percent of the watershed population plus entire city of Cresco, or 690 residents.
The survey was conducted using a modified Dillman Tailored Design Method. A three-step process was followed consisting of 1) a first mailing of survey and cover letter explaining the purpose of the survey; 2) a reminder postcard two weeks later sent to non-respondents; and 3) a second mailing of the

17
survey to remaining non-respondents.
Of the 690 surveys that were mailed, 12 were undeliverable and 219 were completed and returned. As a result, the overall response rate was 32 percent. While this rate of response is lower than what was hoped for, the sample size is large enough to facilitate statistical analyses. Response rates are more important when the purpose of the survey is to measure effects or make generalizations to a larger population. However, it is less important if the purpose is to gain insight and direction for outreach and education as in the case in the community assessment survey.
Some of the highlights of the survey included: Most people understood what a watershed is and where their drinking water comes from. Most respondents believe their drinking water is safe to drink but a majority felt that the groundwater quality was only fair or poor. A majority of those responding did not know there is bacteria impairment on Silver Creek or where the source of the bacteria comes from. Most of the respondents wanted more information on water quality. Agriculture production both livestock and crops were believed to be most responsible for pollution problems in the watershed.
The results of the survey in its entirety are included at the end of this report on page 107 in Section 6.4 “Results of Survey”.
Public Meetings
Public meetings have been held to inform the stockholders about the watershed project. On November 26th, 2011 a public meeting was held to announce the results of the social survey conducted by the Iowa Learning Farm and Iowa State University. Those in attendance from the community included Howard County Supervisors, Howard County economic director and the Cresco public works director. Also in attendance to the November meeting were IA DNR, IDALS, NRCS and Howard SWCD commissioners. Silver Creek Watershed presentations have also been given at a Howard County Supervisor meeting, Cresco city council meeting, the Iowa Water Conference in Ames Iowa and a local Kiwanis group.
3. Pollutants and Causes
3.1 Impairment Designation
Silver Creek is on the 303 (d) List of Impaired Waters for excessive bacteria. This impairment is based on results of monitoring for indicator bacteria conducted on Silver Creek (Site 8) of the Upper Iowa River Watershed (UIRW) project from April 2004 through October 2006. The presumptive Class A1 (primary contact recreation) uses were assessed (monitored) as “not supported” due to levels of indicator bacteria that exceeded the state water quality criteria. The geometric mean of E. coli in the 21 samples collected in Silver Creek (UIRW Site 8) during the recreational seasons of 2004 through 2006 was 707 orgs/100ml. Eighteen of the 21 samples (86%) exceeded Iowa’s single-sample maximum criterion of 235 orgs/100ml. The EPA guidelines for Section 305(b) reporting and IDNR’s assessment/listing methodology states that if the geometric mean of E. coli is greater than the state criterion of 126 org/100ml, the primary contact recreation uses should be assessed as “not supported”. The study also shows an E. coli value of 30,000 cfu.

18
Figure 9: Bacteria Impairment Location Map
3.2 Water Quality Data
The total amount of phosphate, including dissolved and particulate forms, is reported as Total Phosphate. While not all forms of phosphorus are as readily available for uptake by plants as others, the measurement of total phosphate is useful in the interpretation of the nutrient availability in a water body. Currently, the State of Iowa does not have a Total Phosphate (TP) water quality standard, but a general rule of thumb is that total phosphate levels no greater than 0.1 milligrams per liter (mg/L) or part per million (ppm) is desirable for Iowa’s aquatic systems. Based on a network of stream sites statewide that have been sampled on a monthly basis since 2000, the median total phosphate statewide is 0.2 mg/L (Water Quality Summary 2000-2010).
Total Phosphate

19
Figure 3. Total phosphate concentrations for the Silver Creek monitoring sites.
Figure 3 shows that for the Silver Creek sites, TP exceeded 0.1 mg/L several times during 2011 for sites 2, 4, and 5. Site 2 had the highest TP levels with peak TP levels near 3 mg/L, which is roughly 30 times the desired level. Site 2 is impacted by outfall from the city of Cresco’s wastewater treatment plant which uses an activated sludge treatment process. TP concentrations downstream of the outfall are 10 to 200 times higher than at site 1 located upstream of the outfall. By the time the water reaches site 4 which is ~ 5 miles downstream of site 2, TP levels have declined to 10-20% of concentrations measured at Site 2. Site 4 showed a steady increase in TP concentrations over time. Site 1 located upstream of the Cresco outfall was the only site that consistently had TP concentrations less than 0.1 mg/L. Also included in Figure 3 are data collected from the Upper Iowa River Watershed project for Site 8 on Silver Creek. Site 8 is sampled as part of the Upper Iowa River Watershed project and is the same as Site 4 for the Silver Creek project.
The box and whisker diagrams (or box plots) in Figure 4 provide a comparison of the typical levels of TP at each of the 5 sites. The box plots show that Site 2 has the highest median level of TP (the median is equivalent to the 50th percentile and is where 50% of the values fall above and below this value). By comparison, both sites 1 and 3 show levels that are consistently below 0.1 mg/L (more than 75% of the values are below 0.1 mg/L). Statewide, the median concentration for all ambient stream sites is 0.20 mg/L. Only Sites 1, 3, and 5 had median concentrations less than the statewide median.

20
Figure 4. Box plots for data collected from the Silver Creek monitoring sites.

21
The box plots also provide an indication of the “spread of the data”, in other words – where the boxes are smaller from top to bottom, the data shows less variability than when the boxes are larger. For example, Site 2 shows the highest median concentration of TP. Sites 3 and 5 display a fairly consistent level of TP, likely caused by fewer samples being collected. Both of these sites went dry the middle of the summer.
Nitrate plus Nitrite represents the oxidized, inorganic forms of nitrogen in water which result from the biochemical process of nitrification. Nitrite is an intermediate product which is typically present only in minute quantities in surface waters. For laboratory measurement purposes, all the nitrite in a sample is first converted to nitrate and then measured – therefore these compounds are reported together. Sources include fertilizer, sewage and animal wastes. The MCL (Maximum Contaminant Level) is 10 mg/L for nitrate (as expressed as Nitrogen); however the MCL is only relevant for those streams used as a drinking water source. The State of Iowa does not currently have an ambient stream water quality standard for nitrate or nitrite, although levels lower than 3 mg/L are desirable. Based on a network of stream sites statewide, the median nitrate+nitrite-N level statewide is 5.7 mg/L (Water Quality Summary 2000-2010).
Nitrate+Nitrite Nitrogen
Figure 5. Nitrate+nitrite-N concentrations for the Silver Creek monitoring sites.

22
Figure 5 shows that nitrate+nitrite-N concentrations for sites 4 and 5 began the monitoring season near 10 mg/L and showed a steady decline throughout the season, a pattern not uncommon for many streams across Iowa. Site 1 showed the least variability while Site 2 had the greatest variability (Figure 4) Site 2 was the only site that had a significant increase in concentration late in the year, with nitrate+nitrite-N concentrations reached their highest levels in November. Some of the increase may have been caused by inputs from the Cresco outfall.
Ammonia is the measured concentration of ionized and un-ionized ammonia in water. Ionized (NH4+) and un-ionized (NH3) forms are products of the decomposition of organic matter. Water quality standards for ammonia-N are based on the temperature and pH of water. Based on a network of stream sites statewide, the median ammonia nitrogen statewide is <0.1 mg/L (Water Quality Summary 2000-2010). The ammonia concentrations in Silver Creek are very low except for Site 2 where the median concentration is 0.08 mg/L (Figures 4 and 6). Concentrations for this site were highest in August, September, and October when stream levels were at their lowest. Low-flow conditions are when point source impacts are the most apparent in streams statewide. In addition to elevated ammonia-N concentrations at Site 2, elevated total phosphate and chloride as well as lower pH levels also indicate impacts to the stream from the Cresco outfall.
Ammonia
Based on available ammonia-N, water temperature, and pH data collected from Silver Creek watershed, none of the results violate the acute or chronic criteria for ammonia-N.
Figure 6. Ammonia-N concentrations for the Silver Creek monitoring sites.

23
E. coli is a type of coliform bacteria present in the gastrointestinal tract of warm-blooded animals. The concentration of E. coli bacteria is an indicator of the probability of contamination of surface water by microbial pathogens. Iowa’s water quality standard for E. coli bacteria applies to Class A water bodies. Silver Creek is designated as a Class A1 stream. The one-time maximum E. coli bacteria standard for Class A1 (primary contact recreational use – i.e., swimming) is 235 MPN/100 ml (MPN = Most Probable Unit per 100 milliliters of water) or a geometric mean of 126 MPN/100 ml. Based on a network of stream sites statewide, the median E. coli bacteria statewide is 120 MPN/100 ml (Water Quality Summary 2000-2010).
E. coli Bacteria
The overall median E. coli bacteria levels for the samples collected as part of this project was 440 MPN/100 ml. A total of 67% of the samples exceeded the one-time maximum level of 235 MPN/100 ml, with Site 4 exceeding the one-time maximum 81% of the time. In addition to the greatest exceedance rate, Site 4 also had the highest median level of 1,650 MPN/100 ml (Figures 4 and 7). All five sites had median bacteria levels greater than 235 MPN/100 ml. Site 4 is the same site where data were collected as part of the Upper Iowa River Watershed project that initially placed Silver Creek on the 2010 Impaired Waters List for exceeding indicator bacteria standards. Except for a spike in bacteria levels for Site 2 in May, Sites 1 and 2 tracked similarly through time.
Figure 7. E. coli bacteria concentrations for the Silver Creek monitoring sites.

24
pH is a measure of a water's acid/base content and is measured in pH units on a scale of zero to 14. A pH of seven is neutral (distilled water), while a pH greater than seven is basic/alkaline and a pH less than seven is acidic. Low pH levels can directly harm aquatic life and can also allow toxic substances, such as ammonia and heavy metals, to leach from soils and possibly be taken up by aquatic plants and animals (bioaccumulation). Even with the natural inputs of acidic water, the pH of Iowa surface waters generally range from 8.0 to 8.4. The presence of alkaline (basic) soils and limestone bedrock in many areas of the state help neutralize the effect acidic precipitation might have on Iowa's streams and lakes. Most aquatic organisms require habitats with a pH of 6.5 to 9.0. Based on a network of stream sites statewide, the median pH statewide is 8.2 (Water Quality Summary 2000-2010).
Field pH
Site 2 had the lowest overall pH levels (Figures 4 and 8). Sites 1 through 4 showed minor fluctuations in pH through time. Site 5 had the greatest variability (Figure 4) and showed a steady decline from April through July when the site went dry. Median pH levels for all sites except site 2 were similar to the statewide median of 8.2. It’s unclear why site 5 showed a decline in pH through time.
Figure 8. Field pH levels for the Silver Creek monitoring sites.
Many of the chemical, physical, and biological characteristics of a stream are directly affected by water temperature. Water temperatures can fluctuate seasonally, daily, and even hourly. Water temperature impacts the amount of oxygen dissolved in water; the rate of photosynthesis by algae and aquatic plants, and the metabolic rates of aquatic animals.
Water Temperature

25
Figures 4 and 9 show the water temperatures measured at the five sites. Keep in mind that Sites 3 and 5 were sampled part of the year, as both sites went dry during the summer. Sites 2 and 5 had the overall highest median water temperature at 14 and 14.1 degrees Celsius. Site 4 showed a greater fluctuation in temperature during the months of August and September compared to the other sites.
Figure 9. Water temperature for the Silver Creek monitoring sites.
Chloride is a component of salt and is a measure of human or animal waste inputs to a stream. Potential sources of chloride to a stream include direct input from livestock, septic system inputs, and/or discharge from municipal wastewater facilities. During winter months, elevated chloride levels in streams may occur as a result of road salt runoff to nearby streams. Typical concentrations of chloride in Iowa streams range from 20 to 30 mg/L. Higher concentrations tend to occur during winter months or under lower flow stream conditions. Based on a network of stream sites statewide, the median chloride statewide is 21 mg/L (Water Quality Summary 2000-2010).
Chloride
Figures 4 and 10 show the chloride results. Site 2, located downstream of the Cresco outfall, had the highest median chloride concentration of 134 mg/L, with chloride concentrations ranging from 59 to 185 mg/L. Elevated chloride concentrations downstream from wastewater outfalls are not unusual, as the wastewater treatment process does not remove chloride. The site with the next highest median chloride was Site 4, which is located ~ 5 miles downstream of Site 2. Site 4 had a median of 36 mg/L.

26
All other sites had chloride concentrations below the detection limit of 33 mg/L. On August 24, the chloride concentration at Site 4 spiked to 122 mg/L followed by a decline to levels ranging from 39 to 53 mg/L for the remainder of the monitoring season. The spike in chloride at this site may have been caused by the low-flow conditions and the elevated chloride from Site 2 located upstream. There may also have been the appearance of a more localized source of chloride in the vicinity of Site 4.
Figure 10. Chloride concentrations for the Silver Creek monitoring sites.
Dissolved oxygen measures the amount of oxygen in the water that is available for fish and aquatic insects. Dissolved oxygen levels in a stream can be affected by a number of variables, including water temperature, season of the year, time of day, stream flow, presence of aquatic plants, dissolved or suspended solids, and human impacts. Iowa has a water quality standard minimum of 5 mg/L of dissolved oxygen for warm water streams and 7 mg/L for cold water streams. Silver Creek is designated as a warm water stream so the 5 mg/L standard applies. Based on a network of stream sites statewide, the median dissolved oxygen statewide is 10.7 mg/L (Water Quality Summary 2000-2010).
Dissolved Oxygen
Except for two instances, the dissolved oxygen levels for all sites were above the warm water standard of 5 mg/L (Figures 4 and 11). Dissolved oxygen levels for both Sites 3 and 5 declined to below 5 mg/L just prior to going dry. The combination of warm water temperatures and very low stream flow likely contributed to the low dissolved oxygen levels at these sites. In general, dissolved oxygen levels for streams statewide tend to be at their lowest during the summer months followed by an increase going into the fall. The Silver Creek Watershed sites show a different pattern, with dissolved

27
oxygen levels initially increasing from summer into the early fall, however levels then declined during the month of October before increasing for the last sampling event which was collected November 16.
Figure 11. Dissolved oxygen concentrations for the Silver Creek monitoring sites.
Turbidity is a measure of the water clarity and the ability of light to pass through a water sample. Turbidity is affected by the amount of suspended material, such as sediment, algae, plankton, and microbes, in water. Higher turbidity indicates greater amount of suspended material in the water. Turbidity is measured in Nephelometric Turbidity Units (NTUs). As the suspended material associated with elevated turbidity settle in the water, it can clog the gills of fish and aquatic organisms, destroy habitat, and reduce the availability of food, as well as promote solar heating of the water and reduce light penetration. Sources of suspended particles can include soil erosion, waste discharge, urban runoff, eroding stream banks, disturbance of bottom sediments by bottom feeding fish, and excess algal growth. Based on a network of stream sites statewide that have been sampled on a monthly basis since 2000, the median turbidity statewide is 17 NTU (Water Quality Summary 2000-2010).
Turbidity
Figures 4 and 12 show the turbidity results for the sites in the Silver Creek watershed. Turbidity was low for the sites compared to levels seen statewide. Part of this may be due to the unusually dry conditions in 2011, or perhaps levels tend to be lower for this watershed or this part of the Iowa relative to other parts of the state. Another year of monitoring will provide clarification on turbidity levels. Turbidity for Sites 1 and 2 tracked similarly. Site 4 had the highest overall median turbidity at 7.7 NTU.

28
All five sites had median turbidity levels well below the statewide average of 18 NTU.
Figure 12. Turbidity for the Silver Creek monitoring site

29
Nitrate Levels in Silver Creek Nitrate levels for Silver Creek are the highest among the tributaries of the Upper Iowa River. Howard SWCD has had tremendous success from a previous funded project for Staff and Beaver Creek in lowering the nitrate levels by over 45% over a six year period of time. Although Nitrate reduction is not the impairment designation of Silver Creek it will react positively to the practices installed within the watershed.
3.3 Pollutant Sources and Loads
Assessments
The land use assessments and water quality data indicate the primary pollutants needing to be addressed are sediment, bacteria and nitrate levels.
Figure 10: Sediment Delivery Map

30
Sedimentation
Sediment is delivered to Silver Creek in three basic methods 1) Sheet and rill erosion 2) Gully erosion and 3) Stream bank erosion (Figure10). Soil loss from crop ground and eroding stream banks are the two largest sources of sedimentaion in the watershed. Total sheet and rill erosion is estimated at 28,756 tons per year. Average sheet and rill erosion is estimates at 1.3 tons per acre per year. Erosion estimates are based on the NRCS Revised Universal Soil and Loss Equation (RUSLE). Land cover, management, and tillage information was collected by the District project coordinator during the spring of 2011 via a windshield survey of the watershed. Sediment delivery was calculated at 4,097 tons per year. The average sediment delivery is calculated at .2 ton per acre per year. The sediment delivery ratio is 14.3%. The Silver Creek Watershed is split unevenly between 2 landform regions: the Iowan Surface (19,341 acres) and the Paleozoic Plateau (3,249 acres). Therefore, the SDR’s for the Iowan Surface is (11.7%) and the Paleozoic Plateau (22.6%) were weighted by acreage to arrive at the 14.3% SDR utilized. Sediment delivery estimates are based upon NRCS; Erosion and Sediment Delivery worksheet (1996). RUSLE C and P factor information were gathered by the District project coordinator.
Bacteria
Failing and outdated septic systems, livestock access to streams and lack of open lot manure storage and manure management are the three largest sources of fecal contamination. The watershed assessment has identified 6.7 miles of unlimited access to Silver creek and it’s tributaries by livestock. Also identified were 35 open lot beef operations and 8 dairy operations most of which are located in very close proximity of Silver Creek or it’s tributaries. Of the 146 septic systems surveyed only 33 were installed after 1990. Those outdated septic systems located in close proximity to a stream will be assessed for potential failure. Water monitoring results collected from site #4 showed elevated bacteria levels greater than those recorded at Site #2 (City Waste Water Treatment Facility) indicating that it may be caused by a faulty septic system or unlimited livestock access to the stream. Additional testing will be conducted during the 2013 monitoring season to determine the source.
Nitrate Levels
This watershed as mentioned, has 35 open lots with beef operations and 8 dairy operations. Most of the manure produced on these operations will be utilized as fertilizer and applied to the land within the watershed. We estimate that the total nitrogen contained in the manure produced by the livestock in the watershed at approximately 650,000 pounds per year. This is enough nitrogen to fertilize more than 5,000 acres of corn following soybeans or 58% of the crop. Additional commercial fertilizer applied to the 8,500 acres of corn planted in the watershed is estimated at 1.1 million pounds (135 lbs./acre) for a total nitrogen application of 1.8 million pounds annually. Nitrogen use efficiency is only 70% of what is applied. The remaining nitrogen has volatilized, is attached to the soil, or moves into water supplies. At 11% delivery rate, our estimate is that nearly 59,400 pounds of nitrate that reaches the Upper Iowa River (UIR) each year is contributed from the Silver Creek wtaershed.

31
1,800,000 total lbs. x 30% efficiency x 11% delivery = 59,400 lbs. = 162 lbs./day
We know that this is highly variable and dependant on weather and management factors, but it does show the potential for nitrate to enter the water resource. Nitrate from organic matter from sediment deliverd to the UIR is another additional source. Nitrate concentrations averaged 7.5 ml/l on the geometric means for 2009. This was the highest nitrate loading of any tributary within the Upper Iowa River watershed. The city of Decorah has been monitoring its water supplies from wells located near the UIR for nitrates and has found a high correlation between the river nitrate levels and their wells. The Iowa DNR and the City of Decorah have concluded that improvements to the quality of the UIR will have a positive effect on their water supply.
Livestock
Most of the livestock raises within the watershed are cattle. There are 35 beef cow operations with an average size herd of 75 head. There are 2 dairy goat herds numbering 300 head each. There are 6 dairy cow herds averaging 175 head each. Two of the lager dairies have adequate storage while the other 4 have limited if any storage. Cattle manure that is accumulated or stored is spread over the crop fields from fall to spring or on pasture during the summer. Spreading manure on frozen ground is of particular concern because the manure is not incorporated timely and runoff is likely.
Producer and Livestock Numbers
Producers Beef Cattle Dairy Cows Dairy Goats
35 2675
2 600
6 1075
Total: 43 2675 1075 600
Bacteria Loads, Pollutant Allocation, and Summary
The Silver Creek (IA 01-UIA-0403_0) classified segment runs southwest 8.2 miles upstream from its confluence with the Upper Iowa River. There is one permitted source, the Cresco wastewater treatment plant, that discharges to this segment and it is required by its NPDES permit to disinfect its effluent. The stream flow used in the development of this segment analysis is derived from an area ratio flow based on the Bluffton USGS gage data. Load duration curves were also used to evaluate the five flow conditions for Silver Creek. The load duration curve is shown in Figure 1-2. In the figure, the lower curve shows the maximum E. coli count for the GM criteria and the upper curve shows the maximum E. coli count for the SSM criteria at a continuum of flow recurrence percentage. The individual points are the observed (monitored) E. coli concentrations converted to loads based on daily flow for the day they were collected. Points above the load duration curves are violations of the WQS criteria and exceed the loading capacity.

32
Table 1-5 Silver Creek existing loads Flow condition, percent recurrence
Recurrence interval range (mid %)
Associated median flow, cfs
Existing 90th percentile E. coli conc., org/100ml
Estimated existing load, E. coli org/day
High flows 0 to 10% (5) 108.8 4700 1.25E+13
Moist conditions 10% to 40% (25) 34.9 1920 1.64E+12
Mid-range 40% to 60% (50) 17.7 1940 8.38E+11
Dry conditions 60% to 90% (75) 10.1 2340 5.79E+11
Low flow 90% to 100% (95) 4.7 276 3.16E+10
Identification of pollutant sources. The sources of bacteria in the Silver Creek basin are nonpoint sources. These include failed septic tank systems, pastured cattle, cattle in the stream, wildlife, and manure applied to fields from animal confinement operations. The loads from these sources are incorporated into the BIT spreadsheet and are listed in Tables 1-6 to 1-11. EPA Bacteria Indicator Tool EPA’s Bacteria Indicator Tool (BIT) is a spreadsheet that estimates watershed bacteria accumulation available for washoff when it rains and sources that continuously discharge. It estimates bacteria contributions to streams from multiple sources based on land use, livestock and wildlife populations, septic tanks, and built up areas contributions. There are four consolidated landuses incorporated into the BIT and these are shown in Table 1-6.
Silver Creek E. coli load duration curve
1.00E+07
1.00E+08
1.00E+09
1.00E+10
1.00E+11
1.00E+12
1.00E+13
1.00E+14
1.00E+15
0% 10% 20% 30% 40% 50% 60% 70% 80% 90% 100%
Flow recurrence interval, percent
E. coli
load, orgs/day
GM criteria load SSM criteria load E.coli sample loads

33
Table 1-6 Landuse consolidated for BIT application BIT landuse Area, acres built up 2310.6 cropland 14453.9 pastureland 1876.3 forest, CRP, grass 3654.5 Non functional septic tank systems
. There are an estimated 146 onsite septic tank systems in the basin (2.5 persons/household). IDNR estimates that 50 percent are not functioning properly. It is assumed that these are continuous year round discharges. Septic tank loads are in the BIT as a continuous source.
Table 1-7 Silver Creek septic tank system E. coli orgs/day Rural population of Silver Creek subbasin 365 Total initial E.coli, orgs/day 1 7.30E+11 Septic tank flow, m3/day 2 96.7 E. coli delivered to stream, orgs/day 3 4.84E+09 1. Assumes 1.25E+09 E. coli orgs/day per capita 2. Assumes 70 gallons/day/capita 3. Assumes septic system discharge concentration reaching stream is 1000 orgs/100 ml Cattle in stream
. Of the 3,475 cattle in pastures (includes 800 grazing dairy cows), one to three percent (35 to 104 cattle) of those are assumed to be in the stream on a given day. The number on pasture and the fraction in the stream varies by month. Cattle in the stream have a high potential to deliver bacteria since bacteria are deposited directly in the stream with or without rainfall. Subbasin cattle in the stream bacteria have been input in the BIT as a continuous source varying by month.
Table 1-8 Silver Creek Cattle in the stream E. coli orgs/day Cattle in basin (includes 800 dairy cows) 3,475 Number of cattle in stream (1% of total) 35 Number of cattle in stream (2% of total) 70 Number of cattle in stream (3% of total) 104 Dry manure at 3% CIS, kg/day 1 646 E. coli load at 3% CIS, orgs/day 2 4.27E+12 1. The number of cattle in the subbasin is estimated from basin assessments and is 3,475.
2. It is estimated that cattle spend 3% of their time in streams in June, July and August, 2% in May and September, and 1% in April, October, November, and December. The loads shown in this table are for months with 3% CIS since this is the worst case scenario.
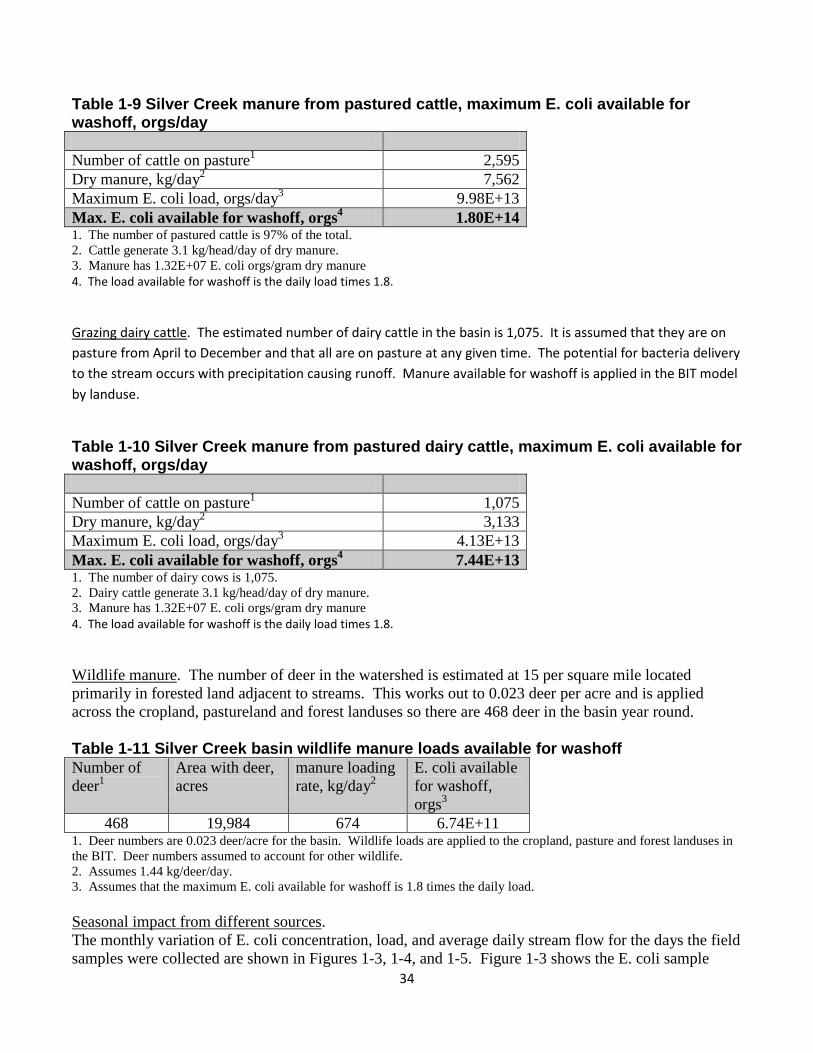
3. Cattle generate 3.1 kg/head/day of dry manure. 4. Manure has 1.32E+07 E coli orgs/gram dry manure. Grazing cattle. The estimated number of cattle in the basin is 2,675. It is assumed that they are pastured April to December and that 97 percent (2,595) are pastured (less the 3% in streams). The bacteria delivery potential to the stream occurs with precipitation causing runoff. Manure available for washoff is applied in the BIT model by landuse.
34
Table 1-9 Silver Creek manure from pastured cattle, maximum E. coli available for washoff, orgs/day Number of cattle on pasture1 2,595 Dry manure, kg/day2 7,562 Maximum E. coli load, orgs/day3 9.98E+13 Max. E. coli available for washoff, orgs4 1.80E+14 1. The number of pastured cattle is 97% of the total. 2. Cattle generate 3.1 kg/head/day of dry manure. 3. Manure has 1.32E+07 E. coli orgs/gram dry manure 4. The load available for washoff is the daily load times 1.8.
Grazing dairy cattle
. The estimated number of dairy cattle in the basin is 1,075. It is assumed that they are on pasture from April to December and that all are on pasture at any given time. The potential for bacteria delivery to the stream occurs with precipitation causing runoff. Manure available for washoff is applied in the BIT model by landuse.
Table 1-10 Silver Creek manure from pastured dairy cattle, maximum E. coli available for washoff, orgs/day Number of cattle on pasture1 1,075 Dry manure, kg/day2 3,133 Maximum E. coli load, orgs/day3 4.13E+13 Max. E. coli available for washoff, orgs4 7.44E+13 1. The number of dairy cows is 1,075. 2. Dairy cattle generate 3.1 kg/head/day of dry manure. 3. Manure has 1.32E+07 E. coli orgs/gram dry manure 4. The load available for washoff is the daily load times 1.8.
Wildlife manure
. The number of deer in the watershed is estimated at 15 per square mile located primarily in forested land adjacent to streams. This works out to 0.023 deer per acre and is applied across the cropland, pastureland and forest landuses so there are 468 deer in the basin year round.
Table 1-11 Silver Creek basin wildlife manure loads available for washoff Number of deer1
Area with deer, acres
manure loading rate, kg/day2
E. coli available for washoff, orgs3
468 19,984 674 6.74E+11 1. Deer numbers are 0.023 deer/acre for the basin. Wildlife loads are applied to the cropland, pasture and forest landuses in the BIT. Deer numbers assumed to account for other wildlife. 2. Assumes 1.44 kg/deer/day. 3. Assumes that the maximum E. coli available for washoff is 1.8 times the daily load. Seasonal impact from different sourcesThe monthly variation of E. coli concentration, load, and average daily stream flow for the days the field samples were collected are shown in Figures 1-3, 1-4, and 1-5. Figure 1-3 shows the E. coli sample
.
35
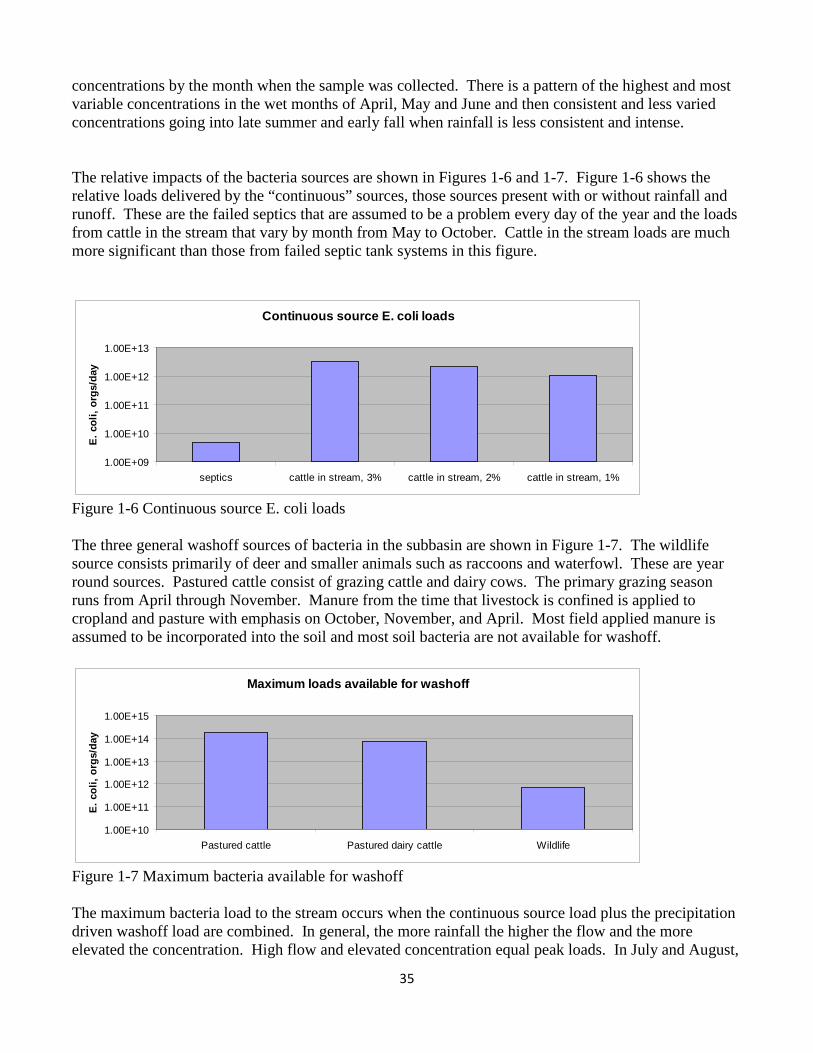
concentrations by the month when the sample was collected. There is a pattern of the highest and most variable concentrations in the wet months of April, May and June and then consistent and less varied concentrations going into late summer and early fall when rainfall is less consistent and intense. The relative impacts of the bacteria sources are shown in Figures 1-6 and 1-7. Figure 1-6 shows the relative loads delivered by the “continuous” sources, those sources present with or without rainfall and runoff. These are the failed septics that are assumed to be a problem every day of the year and the loads from cattle in the stream that vary by month from May to October. Cattle in the stream loads are much more significant than those from failed septic tank systems in this figure.
Figure 1-6 Continuous source E. coli loads The three general washoff sources of bacteria in the subbasin are shown in Figure 1-7. The wildlife source consists primarily of deer and smaller animals such as raccoons and waterfowl. These are year round sources. Pastured cattle consist of grazing cattle and dairy cows. The primary grazing season runs from April through November. Manure from the time that livestock is confined is applied to cropland and pasture with emphasis on October, November, and April. Most field applied manure is assumed to be incorporated into the soil and most soil bacteria are not available for washoff.
Figure 1-7 Maximum bacteria available for washoff The maximum bacteria load to the stream occurs when the continuous source load plus the precipitation driven washoff load are combined. In general, the more rainfall the higher the flow and the more elevated the concentration. High flow and elevated concentration equal peak loads. In July and August,
Continuous source E. coli loads
1.00E+09
1.00E+10
1.00E+11
1.00E+12
1.00E+13
septics cattle in stream, 3% cattle in stream, 2% cattle in stream, 1%
E. c
oli,
orgs
/day
Maximum loads available for washoff
1.00E+10
1.00E+11
1.00E+12
1.00E+13
1.00E+14
1.00E+15
Pastured cattle Pastured dairy cattle Wildlife
E. c
oli,
orgs
/day

36
the potential maximum load based on this analysis is 2.55E+14 orgs/day available for washoff plus the continuous load of 3.30E+12 orgs/day for a total of 2.58E+14 orgs/day. Flow interval load source analysis
. Based on the load duration curve analysis the maximum existing load occurring during the zero to forty percent recurrence interval runoff conditions, is 2.52E+12 orgs/day and the total available load based on the potential sources is 2.58E+14 orgs/day. Generally, the maximum load in the stream, delivered in April when runoff is occurring, is approximately one percent of the bacteria available for washoff. At the zero to ten percent high flow interval, the maximum existing load is 1.25E+13 orgs/day. With the same load available for washoff, the delivered stream load is five percent of the available load.
4. Identifying Pollutant Sources
4.1 Bacteria Data Analysis
Elevated fecal indicator bacteria levels in Iowa’s surface waters are of concern to recreational users because these bacteria indicate the presence of fecal material in the water. Monitoring by Iowa’s Ambient Water Monitoring Program has shown the prevalence of fecal indicator bacteria in surface waters, but has not been able to determine the source(s) of these bacteria. New technologies called source tracking methods have the possibility of scientifically determining the source of fecal contamination in water. However, these technologies are in early stages of development and are expensive and time consuming. Thus, few projects have been undertaken at this time using these methods.
1
10
100
1000
10000
100000
A-99 M-00 O-00 A-01 N-01 M-02 D-02
E. c
oil (
cfu
/10
0m
l)
Date
Silver Creek E. coli 2003-2006
265

37
The Water Monitoring Program and the University of Iowa Hygienic Laboratory have been involved with two projects focused on exploring these different methods of bacterial and chemical source tracking. Each source tracking method provides only one line of evidence in determining the source(s) of fecal contamination in a watershed. Caution should be exercised in a watershed based on data from one type of source tracking method. A toolbox approach with many “tools” or lines of evidence (i.e., watershed evaluation, bacterial and chemical source tracking methods) are necessary to accurately determine the animal or human source of fecal contamination in a watershed. DNA ribotyping involves comparing DNA patterns or “fingerprints” of E. coli bacteria from affected waters to DNA fingerprints of E. coli from known sources of fecal material in the watershed. Researchers believe that the DNA of bacteria taken from fecal matter may vary substantially from one watershed to the next. Therefore, the collection of known sources of fecal material in a particular watershed is necessary to generate a DNA fingerprint database or library for the watershed for comparison with unknown bacteria in the water. Figure 12: Livestock Operation Location Map

38
At the University of Iowa Hygienic Laboratory, DNA ribotyping is performed using the Riboprinter® Microbial Characterization System (Qualicon, Wilmington, DE). Once the E.coli bacteria are isolated from other types of bacteria, restriction enzymes cut the cell’s DNA into pieces and a process called electrophoresis separates the pieces by size through a gel. The DNA fragments are then transferred
Figure 13: Septic System Location Map
onto a membrane and specific fragments are detected by using a labeled piece of DNA as a probe. The resulting banding pattern of DNA fragments corresponding to the relevant rRNA is known as a ribotype. The ribotype patterns of the DNA fingerprint are imported into a statistical analysis software program called BioNumerics® (Applied Maths). Patterns for each bacterium coming from the animal or human category are grouped into libraries for comparison and identification purposes. By comparing DNA patterns or ribotypes of E. coli from unknown sample sources with E. coli DNA patterns or ribotypes of E. coli from known sources, it is possible to determine the most probable fecal source.

39
Multiple antibiotic resistance analysis uses several common antibiotics to determine the probable source of bacteria. Human E. coli bacteria can be distinguished because they typically have the greatest resistance to antibiotics when compared with domestic and wildlife fecal bacteria. While domestic and wildlife E. coli bacteria have significantly less resistance to antibiotics, the type of animal can often be determined by analyzing the type of antibiotic resistance and the concentration of antibiotic necessary to cause resistance. This method also uses E. coli from known fecal samples for comparison with unknown E. coli bacteria in water samples. To determine the particular resistance profile, the E. coli bacteria is exposed to numerous antibiotics at different concentrations and its susceptibility (growth or lack of growth) to the antibiotic is noted and a resistance pattern emerges that can be used to identify the source.

40
The Upper Iowa River and its watershed are valuable natural and economic resources located in extreme northeast Iowa and southeast Minnesota. The Upper Iowa River watershed is a 1,005 square mile watershed recognized by the U.S. Environmental Protection Agency and the State of Iowa as a priority watershed for water quality protection. This river system is heavily utilized for swimming, tubing, and canoeing. The Upper Iowa River Watershed Alliance has monitored 39 stream sites throughout the Upper Iowa River Watershed since 1999 in an effort to identify sub-watersheds that are contributing elevated levels of fecal indicator bacteria to the Upper Iowa River. The water quality monitoring identified six sub-watershed tributaries that had elevated bacteria levels. Three of the six tributaries were selected for a bacteria source tracking project; Coldwater Creek, Silver Creek near Cresco, and Silver Creek near Waukon. Potential bacteria sources in these sub-watersheds include runoff from feedlot and manure amended agricultural lands, inadequate septic systems, and wildlife. The Upper Iowa Bacteria Source Tracking Project, begun in 2002, used DNA ribotyping to identify sources in the Upper Iowa River Watershed and initiated the establishment of a statewide E. coli bacteria DNA database. A total of 259 E. coli strains from known manure sources (e.g., hog, cattle, sheep, goose, raccoon, deer, and human) were collected and analyzed to build a statewide ribotyping library with patterns from known Iowa strains. After obvious outliers were removed, the following E. coli strains were used in the identification of sources in the three Upper Iowa sub-watersheds: cattle (88), deer (35), human (27), geese (26), and swine (24). DNA ribotyping was performed on 50 E. coli strains from water samples taken from the three sub-watersheds in Coldwater Creek, Silver Creek near Cresco and Silver Creek near Waukon. DNA ribotyping successfully discriminated between human and cattle bacterial sources. However, the number of E. coli strains was insufficient to distinguish between the other animal sources.

41
5. Project Goals and Objectives
5.1 Statement of Goals
Goal 1: The water quality goal for the bacteria impairment in Silver Creek is for at least 90% of the samples taken April through October to be below the water quality criterion of 235 CFUs/100 ml. The implementations of BMPs that address sources of bacteria are expected to result in attainment of this goal over the course of the implementation of this plan.
Goal 2: The second goal of this project is to reduce sediment delivery to Silver Creek by 4,500 t/y. The implementation of erosion prevention and sediment control practices and stream bank stabilization techniques that address sediment delivery to Silver Creek are expected to result in attainment of this goal over the course of the implementation of this plan.
Goal 3: The third goal of the project is to reduce nitrate loading to the Upper Iowa River by 45%. The implementation of de-nitrifying wetland creations, development of urban landscape practices and enrollment of 4,000 acres into the Conservation Stewardship Program that address nutrient management within the watershed are expected to result in attainment of this goal over the course of the implementation of this plan.
Figure 14: Unlimited Cattle Access Map

42
5.2 Project Objectives
1: Reduce livestock access (approximately 6.7 miles) to Silver Creek and its tributaries by:
• Controlling access on all 6.7 miles (see Figure14). • Holding 1 educational workshops/field days/yr on grazing systems including demonstrations on
fencing & watering systems. • Installing 4 alternative watering systems for cattle on pasture to limit access.
2: Reduce bacteria loading by breaking the delivery network on the most critical areas by:
• Installing 100 acres of marginal pastureland buffers to stop bacteria and sediment movement. • Implementing manure testing program with ISU extension/project partners and 1 workshop/yr to
improve manure management and application methods. • Constructing 10 Ag waste structures to eliminate open lot runoff and improve management of
manure application. • Improving grazing efficiency on 626 acres.
3: Reduce sediment loading by 4,500 t/y on the most critical cropland by:
• Installing 50 acres of buffers on crop ground to stop sediment movement (reducing 500t/y). • Controlling soil loss through the use of 8,000 ft of terrace (reducing 1,000t/y). • Constructing 12 water and sediment control basins (reducing 1,000t/y). • Constructing 75 acres of grassed waterways to control ephemeral gully erosion (reducing
2,000t/y). 4: Eliminate bacteria loading from failing septic systems by:
• Providing 50 vouchers for households needing septic inspection / clean-outs. • Providing an incentive payment for new septic installations on 3 of the highest priority sources
and for use as demonstration sites during field days. • Holding information & educational meetings / field days each year on septic systems.
5: Reduce Nitrate Loading from Silver Creek to the Upper Iowa River by 45% by:
• Developing urban landscape practices on 50 locations within city limits of Cresco. • Completing Comprehensive Nutrient Management Plans (CNMPs) for 10 livestock operations. • Constructing 15 wetland creations to intercept high nitrate water coming from field drainage tile
before it reaches Silver Creek. • Enrolling operators within the watershed into the Conservation Stewardship Program (CSP)
emphasizing nutrient management systems for 4,000 acres. 5.3 Project Activities The water quality goals for the bacteria impairments in Silver Creek are for 100% of the samples taken during April through October to be below the water quality criterion of 235 CFUs/100 ml. The implementation of BMPs that address sources of bacteria are expected to result in attainment of these goals over the course of the implementation of this plan, as we will discussed in subsequent sections.
As Silver Creek is impaired for bacteria, of secondary importance are “open” sinkholes that allow free entry of runoff into the groundwater. These recharge points are the most likely to input large volumes of

43
water with a high concentration of bacteria. The area of very shallow Spillville formation and shallow soil-filled depressions allow significant infiltration to groundwater, but do provide filtration that will decrease bacteria concentrations. However, the shallow rock – shallow aquifer nature of most of the watershed does indicate a high potential for leaching of nitrogen, soluble herbicides, and some level of bacterial constituents. Silver Creek has had a history of fishing and other recreational activities for the community of Cresco. Since Silver Creek empties into the Upper Iowa River the health of this watershed is of considerable interest to the thousands of area residents and visitors that enjoy the waters of the river each year. Howard Soil and Water Conservation District will be the lead agency and provide most of the necessary data needed for the planning grant Watershed Management Plan. Winneshiek Soil and Water Conservation District will support Howard County when necessary, and provide assistance for the success of the project. Howard County Conservation Board will have a vital role in gaining the community support needed to move forward with the project. The RC&D Postville will provide information on past water monitoring data The RC&D will be a valuable partner in addressing other watershed concerns in Cresco as well as rural areas. The IDNR fisheries will also provide assistance in the tributaries within the watershed. The IDNR will continue to study and provide assistance with geologic interpretations. The data that they will provide can be a valuable tool in the implementation of watershed practices. A valuable tool for attaining information about the health of the watershed is to continue water monitoring at the five locations. The first two sites are located just above and below the Cresco Waste Water Treatment Plant. The purpose of this is to identify any potential issues within the treatment plant and if so, what those issues are. The third site is and tributary (Minors Creek) flowing into Silver Creek. The fourth site is located on the main channel of Silver Creek near the historical monitoring site. The fifth site is located near the Upper Iowa River, and below where all of the tributaries of the Silver Creek have merged.
One of the known impairments of Silver Creek is bacteria. The Upper Iowa Watershed Alliance (UIRW) has been monitoring Silver Creek since 1998 to identify contaminants in the water and the potential source of these contaminants, with the goal to improve the water. Because Silver Creek is a tributary of the Upper Iowa River, the UIRW Alliance realized that some questions needed to be answered. Samples have been collected monthly and are analyzed by the Upper Iowa University Hygienic Laboratory. The bacterial DNA studies were conducted as a joint project between the IDNR, Iowa Geological Survey Bureau, the University of Iowa Hygienic Laboratory and the Upper Iowa River Watershed Alliance, through the Northeast Iowa RC&D. The findings of this research found that there were a variety of sources for possible contamination including humans, livestock and other wildlife. The bacteria may come from a variety of paths including malfunctioning septic systems, manure spill runoff of fields after manure application and even storm water runoff from land with wildlife, livestock and pet droppings. The UIRW plans to utilize these findings to support practice implementation that will assist in the long-term health of the tributaries that flow into the Upper Iowa River.

44
The goals and objectives stated in this Water Management Plan are to develop a strategy to attain the necessary information to provide a road map for a successful watershed project.
5.4 Information and Education Campaign We will conduct public outreach and gain support from the community through information and education efforts. We will develop an advisory committee for group facilitation and update the community on watershed developments through periodicals. The advisory committee will incorporate both urban and rural landowners to provide for needs of the entire watershed community. Communication has been established with the Cresco City Council to keep the council informed of the Watershed Management Plan development and the activities of the planning grant for Silver Creek. Stakeholder Meetings
The following is a list of those individuals who have attended the information meetings during the planning grant phase of the Silver Creek Watershed.
Names Affiliation & Title Rod Friedohf City of Cresco Public Works Spiff Slifka Howard County Economic Committee Director Mick Gamez Chair, Howard County Supervisors Jan McGovern Howard County Supervisor Don Burnikel Howard County Supervisor Harold Chapman Howard County Conservation Director Mike Natvig Chair, Howard County SWCD Bart Wilson Howard County SWCD Commissioner Mike Lewis Howard County SWCD Commissioner Harlan Hickle Howard County SWCD Commissioner Glen Pietan Howard County SWCD Commissioner John Olds Winneshiek County SWCD Commissioner Rex Kleckner Asst. Howard County SWCD Commissioner Irene Lund Asst. Howard County SWCD Commissioner Jeff Korsmo Turkey River Pheasants Forever Chapter Mark Bohle Mayor Cresco Mike Adams Crestwood High School FFA Advisor Steve Hopkins Iowa DNR Water Quality Division Kyle Ament Iowa DNR Water Quality Division Jeff Tisl IDALS Regional Basin Coordinator David Strom IDALS Field Services Kurt Hoeft District Conservationist, Howard County Todd Duncan District Conservationist, Winneshiek County Curt Goetsch CED Farm Service Agency Howard County Lynette Siegley Iowa DNR Water Monitoring Division Mary Skopec Iowa DNR Water Monitoring Division Wayne Peterson Urban Conservationist IDALS Bill Kalishek Iowa DNR Fisheries

45
Teresa Shay Iowa DNR Fisheries Jackie Comito Iowa Learning Farms / Iowa State University Ann Staudt Iowa Learning Farms / Iowa State University Casey Hovey Silver Creek Watershed Landowner Tim Huhe Silver Creek Watershed Landowner Winki Reis Silver Creek Watershed Landowner Seth Church Silver Creek Watershed Landowner Brad Crawford NE Iowa RC&D Postville
Website
A website will be created and dedicated solely to the watershed project. The website will be referenced in all other outreach material and should contain an overview of the project goals and information on what has been done thus far to understand the bacterial issues in the area. Information on conservation management practices and other best management practices for improving water quality should be included as well. The website should also contain a resource page for obtaining further information on rural and urban conservation practices ranging from no-till farming to instructions on creating a rain barrel.
Brochures
An informational brochure will be developed to generate interest about the watershed, the project and its goals. The language and images used in the brochure, and all appropriate materials, will emphasize the importance of water quality for residents, their children and grandchildren—the future. The brochure will be available at Howard and Winneshiek SWCD/NRCS and Extension offices, Prairie’s Edge Nature Center, Cresco Area Chamber of Commerce, Cresco Public Library, and in local retail sites, particularly Cresco businesses.
Press Releases
Regular press releases will be sent to the Cresco Times newspaper and website, as well as local radio stations, to support all of the materials and events below. A weekly radio segment that discusses conservation could be aired on the Cresco radio station, KCZQ – 102.3 FM, featuring watershed coordinator Neil Shaffer, or a local radio personality. This supports survey responses of information received via news coverage media being a significant motivating factor in changing opinions on environment issues.
Fact Sheets
A series of fact sheets will be created and inserted into utility bills of the entire watershed every three months so that residents receive updated information about the project. Quarterly fact sheets can also be made specific to the seasonal fluctuations in water quality and how practices contribute differently during different times of the year.
In addition to specific information about water quality, the fact sheets should contain information about the watershed project in general, including the impairments of the watershed and any findings

46
from the land and RASCAL assessments. The fact sheets will be easy to read and will contain information on where to go to learn more. They will contain ideas for how community members can change their behaviors to improve their water quality and establish a successful watershed project in their area. Also included will be short profiles of a watershed resident who is making changes to their land for future generations.
By placing the fact sheet in a utility bill, residents will have more opportunity to read it and create a connection between their water bill and water quality. This connection can solidify the message of the project, reaching all households in the watershed community.
Suggested topics for quarterly fact sheets:
Quarter 1: • Opportunities for involvement in the Silver Creek Watershed project
o Information on becoming an IOWATER volunteer o Upcoming watershed project events
• Watershed project goals to be met • Resident feature/profile
Quarter 2: • Bacteria
o General facts about bacteria, i.e. their rate of growth o Bacterial threats to human health o Sources of high bacteria levels within the Silver Creek Watershed and proposed
solutions • Progress made thus far and watershed project goals • Resident feature/profile
Quarter 3: • Urban Conservation
o Problems caused by storm water runoff and possibilities for urban conservation o Information on permeable pavers, native landscapes, rain gardens
• Progress made thus far and watershed project goals • Resident feature/profile
Quarter 4: • Public recreation opportunities in Silver Creek Watershed
o How outdoor recreation activities in the Silver Creek Watershed can generate economic benefits
o Information on wildlife in Silver Creek (things to discover) • Overview of project goals which have been met • Goals for the future of the Silver Creek Watershed project • Resident feature/profile
A local stream-labeling project, in which roadside signs were placed at stream crossings, has proven quite successful. Building upon that successful signage campaign, signs should be placed on roads as

47
people enter the watershed, which read, “Now entering/exiting Silver Creek Watershed” and will contain the logo, slogan and website.
These will mark the boundaries of the watershed, as they exist on the landscape. They will offer a different view of the area for those who are familiar with the concept of watersheds and introduce the concept to those who are not, creating conversation pieces for those living in the watershed as well as those who are visiting.
Watershed Boundary Signs A local stream-labeling project, in which roadside signs were placed at stream crossings, has proven quite successful. Building upon that successful signage campaign, signs should be placed on roads as people enter the watershed, which read, “Now entering/exiting Silver Creek Watershed” and will contain the logo, slogan and website.
These will mark the boundaries of the watershed, as they exist on the landscape. They will offer a different view of the area for those who are familiar with the concept of watersheds and introduce the concept to those who are not, creating conversation pieces for those living in the watershed as well as those who are visiting.
Yard Signs
As community members become aware and involved with the project, they should be positively reinforced for any changes that they make in their practices. Signs will be created for people to put in their yards so that they can be recognized as good conservationists.
The signs can read:
I installed (conservation practice) to help restore Silver Creek.
“Our creek. Our watershed. Our future.”
Find out more at website.com
These signs will be brief so that the message is transferred as travelers pass by. The goal is to motivate people to practice conservation on their land, with the signs sparking interest and curiosity about what is happening within the watershed. In addition to yard signs, watershed residents who are practicing conservation will be recognized on the “community page” of the Silver Creek Watershed

48
website which will showcase photos of conservation in action. This will encourage watershed residents to network with one another and strengthen their community around the watershed project.
Watershed Resident Involvement
Cresco Farmer’s Market The Cresco Farmer’s Market is a popular semi-weekly event in a visible location and receives heavy traffic. Those involved with the watershed project can have a booth with information about the project and tips for community members to improve water quality in their area.
Handouts at the booth can include the general informational brochure and additional fact cards about water quality and what can be done to improve it (e.g. What is a watershed? What watershed do you live in? What are some of the issues that your community is facing with its water quality/impairments?). The booth should appeal to all ages. Kids can take home a picture to color or a worksheet regarding pollution and water quality.
The handout and kids’ activities distributed at the farmer’s market booth can be compiled into a workbook and made available through the Cresco Area Chamber of Commerce as a resource when the farmer’s market is not open.
Bronze Statue Tags
The bronze statues placed throughout the city of Cresco create a unique opportunity for outreach. To raise awareness of the Silver Creek Watershed project, tags with brightly colored ribbons will be tied onto each statue (with permission of the city of Cresco). The tags will contain brief facts about water quality issues in Iowa, specifically in the Silver Creek Watershed.
An example would be:
Bacteria double? That's quite a rate!
They multiply so that 4 million become 8!
Our creek. Our watershed. Our future. Silver Creek Watershed
The tag information will be written so most ages can understand the facts presented. The tags will list the project’s website, logo and slogan.
A Combined Effort The farmer’s market and the statue ribbons can be connected through a scavenger hunt activity. On each statue tag, there will be a trivia question along with a date when the watershed project booth will be at the Cresco Farmer’s Market. The answers to the trivia questions can be brought to the farmer’s market booth on the corresponding date in exchange for a small prize (e.g. a pencil with the watershed project information).

49
A Silver Creek Watershed scavenger hunt could also be combined with geocaching, an outdoor treasure hunt in which participants use GPS-enabled devices to locate hidden containers (called geocaches) and then share their experiences online. There are over 1.5 million active geocaches and over 5 million geocachers worldwide (http://www.geocaching.com/), and local residents indicated this is a popular activity in northeast Iowa.
Area Churches and Service Groups
Fifty-two percent of survey respondents indicated that they are very active within their local church. People often use their church for idea exchange and discussion on a variety of topics, religious and nonreligious. Clean water is a human right and discussing within the church community why and how to clean up local waters would be appropriate. Water quality activities could be part of social justice activities on the part of local churches. Watershed project leaders should approach church members who are also watershed residents to see if they would speak to the issue at a church event.
The utility fact sheets will be adapted for inserting into church bulletins in Cresco area churches including, but not limited to: Assembly of God, Cresco Community Chapel, United Methodist Church, First Congregational Church, First Lutheran Church, Immanuel Lutheran Church, and Notre Dame Catholic Church.
Involving youth groups, such as Boy and Girl Scouts or 4-H, in the watershed project help bring awareness to the issues involving the Silver Creek Watershed to new, younger audiences. This will help engage the next generation who will be taking care of the water quality. The groups can plan service projects that help the watershed such as trash pickup days, painting picnic tables or restrooms in an area park, etc. Furthermore, these service-oriented groups can also help with door-to-door promotion and distribution of print materials within the watershed, as well as the Cresco statue campaign and farmer’s market booth.
Another opportunity for youth involvement would be possible through a partnership with one or more instructors at Crestwood High School, Crestwood Alternative High School or Northeast Iowa Community College (Cresco Center). Design and creation of a Silver Creek Watershed website could become a class project for these students, in which the watershed coordinator and/or advisory board would serve as the client and consult with the teacher(s) and student group(s) regularly. In addition to raising students’ awareness of local environmental issues, this partnership would be a great learning opportunity for the students and would benefit the watershed project by utilizing students’ computer and design skills.
The watershed advisory board could also sponsor a video contest for high school/community college students, in which teams of students create 60-second video ads promoting local water quality and the Silver Creek Watershed project. All entries could be posted on YouTube, generating widespread interest in the watershed project and efforts towards improving water quality in and around Silver Creek. Winners could be chosen by the advisory board as well as by popular vote.
Town Festivals and County Fairs Annual town festivals and county fairs (e.g. Mighty Howard County Fair, Old Settlers Day in Chester, Sweet Corn Days in Lime Springs, Round House Days in Elma, Czech Days in Protivin, Cresco’s

50
Norman Borlaug Harvest Fest), provide a unique opportunity for education and promotion of the Silver Creek Watershed project. These events already promote pride in the local community, so expanding that sentiment to include pride in local water quality would be very appropriate. The Silver Creek Watershed project could participate through numerous means, including event sponsorship and/or setting up a booth to distribute print materials and visit with local residents.
Community Watershed Events and Field Day Survey respondents answered “concern about the future for your children/ grandchildren” (49%, n=108) and “firsthand observation” (37%, n=81) as to how they were most likely to change their minds about local water quality. The campaign will utilize these responses to plan three community events offering opportunities for watershed residents to gather together and discuss the challenges with the area’s water quality issues.
• A general awareness event “kick off” event for all watershed residents will be held at the Prairie’s Edge Nature Center just outside of Cresco and hosted by watershed coordinator Neil Shaffer and other local community members who are familiar to area residents. This will be the first step in creating a network for residents to gather together and discuss the challenges with the area’s water quality.
• An Iowa Learning Farms field day will be held on a watershed resident’s farm who is demonstrating conservation practices. The field day is an opportunity for farmers and watershed residents to visit a farm and learn about different conservation practices that support healthy soils, healthy water bodies and minimize transport of bacteria into waterways. The field day can offer simultaneous tracks addressing no-till/strip-till, cover crops, nutrient and manure management, rain barrels, organic gardening, etc. so that there are topics for both urban and rural residents.
• A 5K/10K fun run can be held within the watershed or Cresco community. T-shirts with the watershed logo and project info (website) can be given away to participants. The fun run engages a new audience about the watershed project.
• A “closing” event should be held to celebrate the progress made in education and outreach of the Silver Creek Watershed campaign. This could be a ceremony to award certificates of recognition to those who aided in the campaign. All of the events provide opportunities for watershed residents to network and learn from one another and unite as a watershed community.
As part of the campaign, an IOWATER volunteer water quality monitoring workshop could be held locally. Watershed residents should be encouraged to participate in the workshop with their children or grandchildren of appropriate ages. Then volunteers can conduct the monitoring together, so ownership of the watershed and pride in water quality can be nurtured through multiple generations. The IOWATER program also offers a subsequent workshop on bacteria monitoring, and this workshop could be offered locally if enough interest is generated.
The Iowa Learning Farms Conservation Station should be included at the opening event and the field day. The Conservation Station is an effective tool for demonstrating how conservation practices benefit water and soil quality and for bringing people together around conservation issues. The rainfall

51
simulator component of the Conservation Station has an effective visual display, which demonstrates how different land practices (urban and rural) affect surface and subsurface water quality. The Conservation Station also contains a learning lab with various lessons that can be changed depending on the targeted message and audience at the event. A specific educational module could be created that focuses on the Silver Creek Watershed community, its water quality challenges, especially bacterial impairment, and the impacts of land management decisions.
Youth Outdoor Classroom Iowa Learning Farms will coordinate and host a youth outdoor classroom day for the 4th and 5th grade students of Crestwood Elementary School and Notre Dame Catholic School. A park or nature area within the watershed would be an ideal location for such an event. Alternatively, a landowner in the watershed could host the youth outdoor classroom on his/her property. The event should be held in a location adjacent to Silver Creek to allow students to see and experience the water body in an up-close setting.
The Conservation Station will be a key component of this youth outdoor classroom day. Through fun, engaging hands-on activities, students will experience educational lessons on watersheds and the impacts of land management choices on soil and water quality. The outdoor classroom should have a bacteria component as well. This event will utilize the educational materials developed for Silver Creek, raising an appreciation for the watershed and local communities, while also raising awareness of water quality challenges faced in the watershed.
Ideally, there would be 5-6 different learning stations, each with its own presenter or team of presenters. Iowa Learning Farms will work with watershed coordinator Neil Shaffer to identify conservation-minded individuals or groups to lead other learning stations/group sessions during the daylong event. Examples of such partners may include Winneshiek and/or Howard Co. Conservation Boards, local ISU Extension and Outreach personnel, local DNR/NRCS staff, local SWCD commissioners and local Farm Bureau personnel. Students would be bused to the field site then divided into groups to experience the many different learning stations. Student groups would rotate to each of the different learning stations, spending approximately 40 minutes at each stop, participating in such activities as nature hikes/scavenger hunts, fish species identification, birds and furs, geo caching, and water quality monitoring.
5.5 Best Management Practices
Construct Ag Waste Storage Structures
Open cattle lots in the watershed comprise the majority of livestock operations within the watershed. A high priority will be given to containing runoff from these open lots. Another factor to be considered is the untimely spreading of manure during less than ideal weather conditions. Due to a shortage of manure storage on most of the operations (less than 6 months) manure is spread during winter months ansd that can lead to runoff over frozen ground reaching the creek. It also is a loss of nutrients because the manure cannot be incorporated while the soil is frozen. This resource concern can be addressed by constructing manure storage structures on those operations that have cattle. These structures will address both concerns by having 6 months storage. Manure is less likely to be spread on frozen ground and be spread instead during fall and spring when it can be incorporated in a timely manner.
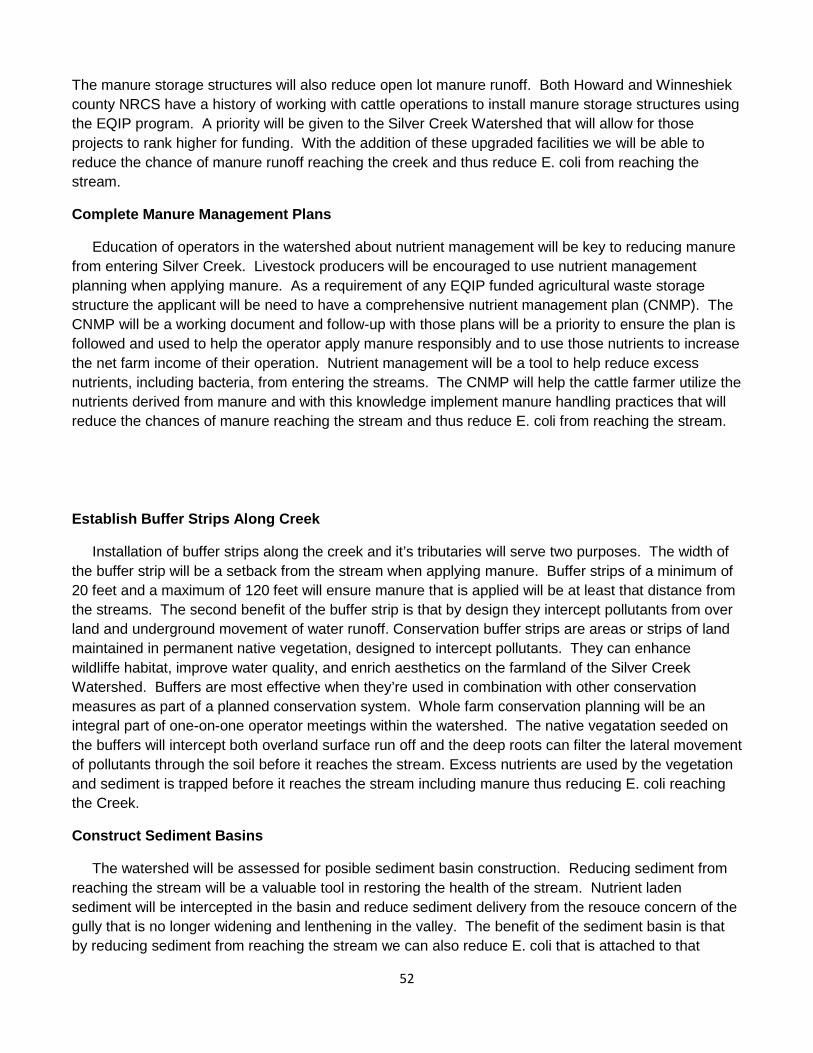
52
The manure storage structures will also reduce open lot manure runoff. Both Howard and Winneshiek county NRCS have a history of working with cattle operations to install manure storage structures using the EQIP program. A priority will be given to the Silver Creek Watershed that will allow for those projects to rank higher for funding. With the addition of these upgraded facilities we will be able to reduce the chance of manure runoff reaching the creek and thus reduce E. coli from reaching the stream.
Complete Manure Management Plans
Education of operators in the watershed about nutrient management will be key to reducing manure from entering Silver Creek. Livestock producers will be encouraged to use nutrient management planning when applying manure. As a requirement of any EQIP funded agricultural waste storage structure the applicant will be need to have a comprehensive nutrient management plan (CNMP). The CNMP will be a working document and follow-up with those plans will be a priority to ensure the plan is followed and used to help the operator apply manure responsibly and to use those nutrients to increase the net farm income of their operation. Nutrient management will be a tool to help reduce excess nutrients, including bacteria, from entering the streams. The CNMP will help the cattle farmer utilize the nutrients derived from manure and with this knowledge implement manure handling practices that will reduce the chances of manure reaching the stream and thus reduce E. coli from reaching the stream.
Establish Buffer Strips Along Creek
Installation of buffer strips along the creek and it’s tributaries will serve two purposes. The width of the buffer strip will be a setback from the stream when applying manure. Buffer strips of a minimum of 20 feet and a maximum of 120 feet will ensure manure that is applied will be at least that distance from the streams. The second benefit of the buffer strip is that by design they intercept pollutants from over land and underground movement of water runoff. Conservation buffer strips are areas or strips of land maintained in permanent native vegetation, designed to intercept pollutants. They can enhance wildliffe habitat, improve water quality, and enrich aesthetics on the farmland of the Silver Creek Watershed. Buffers are most effective when they’re used in combination with other conservation measures as part of a planned conservation system. Whole farm conservation planning will be an integral part of one-on-one operator meetings within the watershed. The native vegatation seeded on the buffers will intercept both overland surface run off and the deep roots can filter the lateral movement of pollutants through the soil before it reaches the stream. Excess nutrients are used by the vegetation and sediment is trapped before it reaches the stream including manure thus reducing E. coli reaching the Creek.
Construct Sediment Basins
The watershed will be assessed for posible sediment basin construction. Reducing sediment from reaching the stream will be a valuable tool in restoring the health of the stream. Nutrient laden sediment will be intercepted in the basin and reduce sediment delivery from the resouce concern of the gully that is no longer widening and lenthening in the valley. The benefit of the sediment basin is that by reducing sediment from reaching the stream we can also reduce E. coli that is attached to that

53
sediment from reaching Silver Creek. We will leverage project dollars with the EQIP program to fund construction of 12 sediment contrtol basins.
Construct Grassed Waterways
Grassed waterways are a very important conservation practice that has the potential to reduce large amounts of sediment from reaching the stream. The reduction in sediment delivery due to construction of grassed waterways will be beneficial to reducing bacteria from reaching the stream also. This will be achieved due to the ability that bacteria can attach to sediment particles. A reduction of sediment reaching the stream translates into a reduction in bacteria reaching the stream. Most of the waterways to be constructed in the watershed will qualify for the continuous CRP program. The waterways not eligible for CRP will benefited from cost share available through the project, EQIP or state cost share. Previously discussed issues with high sediment are also likely contributors to high E. coli levels. Excessive amounts of suspended sediment can result in higher E. coli populations by providing additional substrate on which colonies can grow and multiply. Construction of 75 acres of grassed waterways will be completed.
Construct Terraces
Similar to the construction of grassed waterways, terraces can serve the same purpose. Reducing the sediment delivery reaching Silver Creek and it’s tributaries will have a beneficial effect to the health of the creek. Much of the land in the watershed is highly erodible land (HEL) and the construction of terraces can reduce sheet and rill erosion on those fields. With the added incentive that a project brings to a watershed it will encourage more construction of terraces. We will use both project dollars and leverage other program dollars to install 10,000’ of this practice. With the increased comodity prices the whole farm General CRP program has become less attractive to landowners. As this land comes back into production terraces will be an effective tool to ensure the cultivation of that land meets soil loss tolerance (T).
Develop Urban Landscape Practices
The city of Cresco continues to grow and the issue of storm water is of significant concern. The rainfall and snowmelt that would usually infiltrate into the soil becomes runoff. This increase impacts both the volume and rate of the runoff that can potentially lead to flooding, stream bank erosion and impact water quality. The city of Cresco has a majority of it’s population (3,905) located in the watershed. Storm water discharge is an issue to be addressed within the watershed. Two new housing developments and a new industrial park are located in the Silver Creek watershed. City planners have made an attempt at addressing the storm water by installing two sediment basins at the bottom end of both housing developments. We will develop 50 urban landscape projects to reduce nutrients from reaching Silver Creek.
The city is very interested in addressing these concerns with various urban landscape practices such as:
• Pervious Asphalt Pavement • Bio-retention practices (rain garden) • Modular Block Paver System • Native landscaping • Infiltration Basin

54
• Shallow Wetlands • Portland Cement Pervious Concrete
Wetland Creation
Figure 15: Hydric Soils Map
The project will promote wetland creation and construct 18 of these practices within the watershed. This practice has been very popular in the county. We have used a combination of several sources to fund these practices. While the practice does help reduce sediment delivery to streams it has a unique ability to filter nitrates from drainage tile water before it exits the wetland to the streams. The watershed is comprised of 25% hydric soils. Wetland Creations are constructed by breaking drainage tile, excavating shallow water areas and surfacing drainage tile into the newly created wetlands. The NRCS office in Cresco has a tremendous experience creating wetlands throughout the county and utilizing several different funding sources including: EQIP, CRP, WIRB, 319, WSPF and REAP. The construction of the wetland creations is one more practice that will intercept surface and subsurface water flow before it reaches the streams. They will serve as a filter of pollutants and a sediment trap. Wetlands provide natural pollution control by removing excess agricultural chemicals, such as pesticides and fertilizers from surface waters. They also are an important part of an efficient alternative for human and animal waste treatment. Restoring wetlands involves returning degraded wetlands or

55
former wetlands in hydric soils (Figure 15) to their naturally functioning condition. Ideally, a successful wetland will closely mimic the functions of a natural wetland.
Conduct voluntary septic inspections
We will conduct an extensive information and education program to increase stakeholder awareness on the impacts that their septic systems (see Figure 14) can have within a watershed if they have a faulty system. We will work with the county sanitarians from both counties to develop an information and education program for all housholds in the watershed that are dependant on their own septic system. Special attention will be those homes nearest the streams. Unmaintained or leaky septic systems could have a negative impact on the stream and increase posibilities that E. coli is reaching the stream from these faulty systems. Information pertaining to the Low-Cost Septic System Financing program will be made available to homeowners in the watershed for assistance in the event that their septic system is in need of repair. If you purchase a home with a septic system, the Iowa Finance Authority's Water Quality Division can provide you with affordable financing for system repair or replacement. Iowa's time of transfer septic system inspection law took effect July 1, 2009. The law requires that every home/building served by a septic system have an inspection prior to the sale or deed transfer for the home. Funding from this source could help home owners replace faulty septic systems. We will provide vouchers for septic inspection and cleaning for 50 homes in high priority areas. There are 113 known septic systems installed before 1990 when new rules on installation went into effect. We calculate that approximately 45% of these systems have either failed or are not in compliance with current standards. We will provide an incentive payment for new installations of new septic systems for 3 homes that are the highest priority sources of bacteria for use as demonstration sires for field days.
Conservation Stewardship Program Enrollment
Enrollment of 2,000 acres in the Conservation Stewardship Program (CSP) will be an important program within the watershed. The CSP program is an all encompasing conservation program that operators can enroll their working farmland into. If accepted the contract holder is required to meet certain levels of conservation above and beyond their current farming practices. The added enhancements can include reduced tillage, applying fertilizer at recommended rates, requireing soil nutrient analysis, reducing energy usage, addressing all ephemeral gullying on the operation and having adequate wildlife habitat. The program also has a water quality component that requires a minimum setback of 30 feet from any water course on the property. Also the operator is required to keep records of all chemical, fertilizer and pesticide application. Enrollment of as much of the land within the watershed will be a priority of the project. An information and education effort will be undertaken to ensure that all the opertors in the watershed have an opportunity to participate in this program. The Howard and Winnesheik NRCS offices are leaders in the State of Iowa with number of CSP contracts and have a history of aggressivly promoting the program

56
5.6 Implementation Schedule

57

58

59
5.7 Target Load Reductions
1.3 Departure from load capacity. The departure from load capacity is the difference between the existing load and the load capacity. This varies for each of the five flow conditions. Table 1-11 shows this difference. The existing and target loads for the five flow conditions are shown graphically in Figure 1-5. Table 1-11 Silver Creek departure from load capacity Design flow condition, percent recurrence
Recurrence interval range (mid %)
Existing E. coli orgs/day
Load capacity, orgs/day
Departure from capacity, orgs/day
Reduction needed
High flow 0 to 10% (5)
1.25E+13 6.3E+11 1.19E+13 95.0%
Moist conditions
10% to 40% (25)
1.64E+12 2.0E+11 1.44E+12 87.8%
Mid-range flow 40% to 60% (50)
8.38E+11 1.0E+11 7.36E+11 87.9%
Dry conditions 60% to 90% (75)
5.79E+11 5.8E+10 5.21E+11 90.0%
Low flow 90% to 100% (95)
3.16E+10 2.7E+10 4.69E+09 14.9%
Plan set a target of reducing bacteria load reductions by 90% for 0-40% and 60-100% flow conditions.
Figure 1-5 Difference between existing and target load
Silver Creek existing and target loads for SSM criteria
1.00E+09
1.00E+10
1.00E+11
1.00E+12
1.00E+13
1.00E+14
0% 10% 20% 30% 40% 50% 60% 70% 80% 90% 100%
Recurrence percentage
E. c
oli,
orgs
/day
Load duration curve Target loads Existing load

60
5.8 Implementation Analysis The reduction of the loads by source provides a starting point for the evaluation of proposed implementation plans for the Silver Creek watershed. The BIT spreadsheet has been used to evaluate two flow conditions. The first is the 60 to 100 % flow interval when most bacteria loads are from continuous sources, namely CIS and failed septic systems. The second is the 0 to 40% flow interval when the bacteria carried to the stream in runoff predominate. In Figures 1-8 and 1-9 the month by month E. coli concentrations for CIS and septic are shown with the mean sample load for that month and the target load for the flow interval. Figure 1-8 shows the existing load condition with the CIS varying by month and the septic as a constant load. The CIS loads are significantly higher than the septic loads. In Figure 1-9 the CIS loads have been reduced from 3% of grazing cattle in the stream to 0.1%.
Figure 1-8 CIS and septic existing bacteria load contributions
Existing continuous loads by source
1.00E+09
1.00E+10
1.00E+11
1.00E+12
1.00E+13
1.00E+14
1.00E+15
April May June July August September October November
E. c
oli l
oads
, org
s/da
y
cattle in stream, Ecoli orgs/day septics, Ecoli orgs/day median sample load mean sample load target load at 60 to 100% interval, orgs/day

61
Figure 1-9 CIS and septic bacteria load contributions after CIS reduction The second flow interval considered, 0 to 40%, evaluates the loads washed off by precipitation. Figures 1-10 through 1-12 show the estimated existing monthly loads and the monthly loads after wash off bacteria are reduced. Table 1-16 shows the reduction in animal numbers in the BIT spreadsheets that generated Figures 1-11 and 1-12. The BIT spreadsheet that generated Figure 12 also includes the cattle in stream reduction from 3% to 0.1%. The CIS reduction has minor impact during runoff conditions. Load Reductions from Septic Systems: Currently 50% failure rate: 4.84 10^9 org/day End of Phase 2: 5% failure rate: 7.44 10^8 org/day 90% Bacteria Load Reduction from Septic Systems Load Reduction: 4.35 10^9 org/day Cattle in Stream: Current E coli load: 4.27 10^12 orgs/day End of Phase 2 E coli load: 4.04 10^11 orgs/day Bacteria Load Reductions for removing livestock access to stream: 4.04 10^12 orgs/day 95% Bacteria Load Reduction Wash off load during precipitation: Current E coli load from wash off during precipitation: 4.62 10^12 orgs/day End of Phase 2 E coli load from wash off during precipitation: 1.89 10^11 orgs/day Bacteria Load Reduction: 4.43 10^12 org/day 95% Bacteria Load Reduction
Reduced continuous loads by source(CIS<1%)
1.00E+09
1.00E+10
1.00E+11
1.00E+12
1.00E+13
1.00E+14
1.00E+15
April May June July August September October November
E. c
oli l
oads
, org
s/da
y
cattle in stream, Ecoli orgs/day septics, Ecoli orgs/day median sample load mean sample load target load at 60 to 100% interval, orgs/day

62
These three figures use log scales and it is important to note that each gridline represents an order of magnitude increase in the number of E. coli organisms. It can be seen from these charts that the Forest and Built-up land uses are not significant contributors to the bacteria load delivered to Silver Creek. The existing load and the target load are the same for each month since they were developed from the flow and load duration curve analysis (based on stream monitoring data) that is independent of the BIT spreadsheet analysis (based on watershed land use and bacteria sources derived from basin assessments).
Figure 1-10 Estimated existing wash off load during precipitation with 1 % delivery of E. coli available. As can be seen in Figure 1-10, the total load estimated using the BIT spreadsheet is somewhat higher than that estimated using the monitoring data (existing load from duration curve). Most of the bacteria are from the pasture land use since the major load fraction available for wash off is from grazing cattle and dairy cows on pasture.
Silver Creek E. coli washed off for existing conditions - by landuse and month
1.00E+08
1.00E+09
1.00E+10
1.00E+11
1.00E+12
1.00E+13
1.00E+14
1.00E+15
March April May June July August September
OctoberNovember
E. c
oli w
ashe
d of
f by
land
use,
org
s/da
y
Cropland Pastureland Forest, CRP and Ungrazed Pasture Built-up Existing load, 0 to 40% interval, orgs/day total target load

63
Figure 1-11 Estimated wash off load during precipitation with 1 % delivery of E. coli available (Reducing pasture cattle by 97%, applied manure by 88%)
5.9 Bacteria Reduction Milestones As noted previously, this plan addresses the high priority of bacteria impairment (Figure 9) for Silver Creek. To determine the effectiveness of BMP’s designed to reduce this impairment, bacteria concentrations must be meassured. A bacteria index is then applied to the conscentration data to gauge the relative frequency and magnitude of these bacteria concentrations at monitoriong sites. Bacteria load reductions that result from the implementation of targeted BMP’s should result in:
1) Less frequent exceddences of the normal E. Coli Bacteria (ECB) criterion (235 Colony Forming Units(CFUs/100ml) for the sampling at site 4.
2) Lowered magnitude of exceedences that do occur.
The calculated bacteria index for Silver Creek at sampling Site 4 is the natural logarithm of each sample value taken during the April-October primary recreation season, divided by the natural logarithm of the bacteria for A-1 Primary Contact Recreation. 235 CFUs/100ml.
Index = In(ECB Count) / In(235)
The indicator used will be the Upper Decile of the index values, with the desired target being that the calculated index is below 1.0 at the upper docile (90th percentile). Ultimately, compliance with water quality stanadards ( WQSs) will require sampling every 2 weeks during the entire recreational season
1.00E+08
1.00E+09
1.00E+10
1.00E+11
1.00E+12
1.00E+13
1.00E+14
1.00E+15
E. c
oli w
ashe
d of
f by
land
use,
org
s/da
y Silver Creek E. coli washed off after Phase II - by landuse and
month
Cropland Pastureland

64
April-October, and calculating the geometric mean of those samplings. Meeting the test will be justification for delisting the stream impairment.
The sampling of Site 4 on Silver Creek was sampled every 2 weeks during the recreation season in 2011. The following graph shows the bacteria index for Silver Creek as a result of the sampling that took place. Goal of the project will be for the index to be below 1 during the recreational season April through October . We expect to meet 40% of our goal in phase 1 and the remaining 60% in phase 2.
Bacteria Index for Silver Creek Watershed to Support A-1 Primary Contact Recreation Use
The nature of bacterial loading is very dynamic and complex. It is dependent on circumstances of runoff and flow as well as environmental conditions that vary daily and seasonally. Allocation and load reduction targets of the bacteria present are difficult to define in simple terms. However, bacteria load reduction targets that indicate that bacteria loads are adequately decreasing and will eventually result in the “delisting” of water bodies in the watershed (That is, removal from the 303(d) list of impaired waters), are expected to be achieved through the application of BMPs that address sources of bacteria in the watershed.
To assess the impact of BMP implementaion on bacterail loading, the frequency and magnitude of bacteria concentrations in thestream is measured. A bacteria index to assess the frequency and magnitude of the bacteria was utilized at Site 4 on Silver Creek. The overall median E. coli bacteria levels for the samples collected as part of this project was 440 MPN/100 ml. A total of 67% of the samples exceeded the one-time maximum level of 235 MPN/100 ml, with Site 4 exceeding the one-time maximum 81% of the time. In addition to the greatest exceedance rate, Site 4 also had the highest median level of 1,650 MPN/100 ml (All five sites had median bacteria levels greater than 235 MPN/100 ml. It is also the historic sampling site that the samples were taken that indicated the impairment during 2004-2006 (Site 8 of the Upper Iowa River Watershed Alliance monitoring plan).
The bacteria index is a logarithmic calculation applies to bacteria conscentrations found in samples collected at the sampling location during the April - October recreational season. Adequate water
0
0.2
0.4
0.6
0.8
1
1.2
1.4
1.6
1.8
2
1-Apr 1-May 1-Jun 1-Jul 1-Aug 1-Sep 1-Oct
2011 Bacteria Index

65
quality is indicated when a target index value below 1.0 at the upper decile (90th percent) is achieved. Additional historical bacteria monitoring data is discussed in this plan but the results of the 2011 sampling at Site 4 will be used to measure bacteria reduction milestones.
0
0.2
0.4
0.6
0.8
1
1.2
1.4
1.6
1.8
2
1-Apr 1-May 1-Jun 1-Jul 1-Aug 1-Sep 1-Oct
End of Phase 1 - Bactieria Index Goal
0
0.2
0.4
0.6
0.8
1
1.2
1.4
1.6
1.8
2
1-Apr 1-May 1-Jun 1-Jul 1-Aug 1-Sep 1-Oct
End of Phase 2 - Bactieria Index Goal

66
5.10 Resource Needs:

67

68

69
Figure 16: Phase I Implementation Map
The implementation strategy of the Silver Creek Watershed is divided into Phase 1 and Phase 2. Phase 1 will focus on the areas of the watershed with the highest priority and have the most impact on the impaired segment of Silver Creek. BMPs chosen to be implemented in this phase include pastures with unlimited access to the impaired portion of the creek, cattle lots with resource concerns for manure runoff and septic systems that are located closest to the stream with possible direct septic discharge to the stream. Phase 2 will continue to focus on the highest priority areas in addition all other areas of the watershed that may contribute pollutant to the stream. The implementation is expected to have the most activity in the during years 3, 4 & 5 as represented on the implementation schedule graph.

70
Figure 17: Phase II Implementation Map
5.11 Implementation Strategy
Goal 1: Reduce bacteria loading to meet the WQS caused by livestock access and failed septic
systems, through better manure storage practices and management techniques. Audience: Landowners /operators Rural residents
Barriers to landowners/operators adopting practices Reluctant to work with government officials and programs Lack of understanding about project goals and issues Increased costs to install practices during harsh economic times Lack of understanding regarding nutrient management planning Costs and changes in practice that could affect profit margins

71
Working with government programs / paperwork Potential loss of productivity and crop area Concerns about loss of control of land use by property owners Whether applying practices to some land will benefit the entire watershed Absentee landowners may have different motivations Aging farmers show reluctance to change at this point in life
Barriers to rural residents Little or no understanding of how watershed improvement works and why it is necessary Little or no understanding of water quality problems associated with septic systems Feeling that there’s nothing they can do to help Increased costs to install practices during harsh economic times
Possible solutions landowners/operators: Funding assistance will defray costs to install conservation practices Projects will help make the land more sustainable and provide a positive image Develop education programs and collect data to clarify source of bacterial problem. Provide better use of pasture lands through prescribed grazing, allowing for greater carrying capacity (more cows) Show landowners how conservation practices can benefit their land and farming operations through field days and workshops Show landowners how practices will protect their land and land down the watershed
Possible solutions for rural residents: Financial benefits to the home, knowing the septic system meets current law Improving surface water will safeguard their well water Improving the water quality will make it safer to be in contact with Improving the water quality will increase the aesthetic value in the areas of high tourist traffic
Message - landowners/operators:
Cattle access to the creek and manure are major sources of bacteria in Silver
Creek Existing levels exceed recommendations for human contact Conservation pasture and manure management practices can increase productivity, profitability, animal health and improve water quality Funding and technical assistance are available
Message – rural residents: Septic systems are a major source of bacteria in Silver Creek Existing levels exceed recommendations for human contact Good drinking water quality starts with good surface water quality Funding and technical assistance are available
Message delivery (both landowners/operators and rural residents): In-person meetings with landowners Have “community leaders,” explain why they adopted them Newsletters Direct mailings as needed Field days, workshops and demonstrations

72
Goal 2: The secondary goal of this project is to reduce sediment delivery to Silver Creek through the implementation erosion prevention and sediment control practices and reduce the nitrate loading to the Upper Iowa River.
Audience: Landowners / operators
Barriers to landowners adopting practices: Adopting some practices may reduce profits and affect land uses. Costs of installing practices are prohibitive during these tough economic times Costs and changes in practice that could affect profit margins Working with government programs / paperwork Potential loss of productivity and crop area Concerns about loss of control of land use by property owners Whether applying practices to some land will benefit the entire watershed Absentee landowners may have different motivations Aging farmers show reluctance to change at this point in life
Possible solutions: Show landowners how conservation practices can benefit their land and farming operations Show landowners how practices will protect their land and land down the watershed through
field days and workshops Improving the watershed will reduce soil loss and improve the value of the land
Message: Conservation practices can reduce erosion, increase soil quality and protect cropland. Reduced need for fertilizers and repair work in fields after storms will help profits Silver Creek is a tributary to the UIR which is a major tourist attraction to the area and has a
positive economic impact to Northeast Iowa
Message delivery: In-person meetings with landowners Have “community leaders,” explain why they adopted them News releases Newsletter Direct mail as needed Field days and demonstrations
5.12 Outreach Plan Over the life of the project information activities will include: A project logo for Silver Creek signage and cooperating landowner recognition Local news coverage during the Silver Creek Watershed Project period Submit newsletters / articles to the local media and partner newsletters Develop and distribute a summary of progress, including water monitoring and sediment
delivery reduction data Individual meetings with livestock landowners and producers on priority land to inform them of
project activities, conservation planning and follow up. Manure management educational workshops on manure testing and management Establish nutrient and manure management demo sites Hold pasture management workshops Establish pasture management demonstration sites

73
Hold stream bank stabilization field days to demonstrate stabilization needs and options Establish a stream bank stabilization demonstration site Hold a field day on well-water testing and septic systems in the watershed Establish 3 septic system demonstration sites.
YEAR 1 (2013):
First quarter: Sent newsletter to watershed residents / operators Article in Newspapers of Howard County regarding the Watershed Management Planning Process and public comment opportunities Public Meetings on bacteria pollution, sources and alternative practices Sent Pre Project Phase 1 survey to livestock producers Work with the Iowa Soybean Association on nutrient management / conservation planning
program opportunities
Second quarter: Continue to develop photo journal, local history data and other information Ongoing process of meeting local producers Provide news article on project goals and status Meet with Iowa Learning Farm & Iowa State University Extension / NRCS to reestablish a
cooperative agreement for the remainder of the projects education event needs Develop Silver Creek signage / interpretive display in Cresco Organize a field day at a recently constructed manure management facility Organize a watershed advisory meeting
Third quarter: Mail a winter/spring newsletter Work with Howard SWCD and Winneshiek SWCD on bridge signage project opportunity Conduct individual meetings with area producers Organize a cover crop field day
Fourth quarter: Conduct individual meetings with area producers Organize a pasture management related field day Review water monitoring data for the year Evaluate sediment delivery from project sites Project evaluations and progress summarizations. Conduct septic system educational meeting Annual review of project with project partners Annual review of project with advisory board
YEAR 2 (2014):
First quarter: Conduct individual meetings with area producers Install signage for conservation practices in watershed Organize a pasture management related field day Organize a stream bank stabilization field day Re-visit the Iowa Soybean Association on nutrient management / conservation planning
program status Re-visit / start the Silver Creek bridge signage project – Organize meeting Review possible SWCD annual banquet award winners for participating producers

74
Second quarter: Continue to develop photo journal, local history data and other information Ongoing process of meeting local producers Organize a field day at a recently constructed manure management facility Organize a cover crop field day Organize a watershed advisory meeting
Third quarter: Mail a winter/spring newsletter Article in Newspapers of Howard County regarding recent fall BMP installations Conduct individual meetings with area producers Conduct nutrient management planning sessions
Fourth quarter: Conduct individual meetings with area producers Review water monitoring data for the year Evaluate sediment delivery from project sites Project evaluations and progress summarizations. Annual review of project with project partners Annual review of project with advisory board Conduct follow-up septic system educational forum.
YEAR 3 (2015):
First quarter: Conduct individual meetings with area producers Install signage for conservation practices in watershed Organize a pasture management related field day Review possible SWCD annual banquet award winners for participating producers
Second quarter: Continue to develop photo journal, local history data and other information Ongoing process of meeting local producers Organize a field day at a recently constructed manure management facility Organize a cover crop field day Organize a watershed advisory meeting
Third quarter: Mail a winter/spring newsletter Article in Newspapers of Howard County regarding recent fall BMP installations Conduct individual meetings with area producers Conduct nutrient management planning sessions
Fourth quarter: Conduct individual meetings with area producers Review water monitoring data for the year Evaluate sediment delivery from project sites Project evaluations and progress summarizations. Annual review of project with project partners Annual review of project with advisory board Conduct follow-up septic system educational forum

75
YEAR 4 (2016):
First quarter: Conduct individual meetings with area producers Install signage for conservation practices in watershed Organize a pasture management related field day Review possible SWCD annual banquet award winners for participating producers
Second quarter: Continue to develop photo journal, local history data and other information Ongoing process of meeting local producers Organize a stream bank stabilization field day Organize a field day at a recently constructed manure management facility Organize a watershed advisory meeting
Third quarter: Mail a winter/spring newsletter Article in Newspapers of Iowa County regarding recent fall BMP installations Conduct individual meetings with area producers Conduct nutrient management planning sessions
Fourth quarter: Conduct individual meetings with area producers Review water monitoring data for the year Evaluate sediment delivery from project sites Project evaluations and progress summarizations. Annual review of project with project partners Annual review of project with advisory board Conduct follow-up septic well / system field day at a recently installed system
YEAR 5 (2017):
First quarter: Conduct individual meetings with area producers Install signage for conservation practices in watershed Organize a pasture management related field day Review possible SWCD annual banquet award winners for participating producers
Second quarter: Continue to develop photo journal, local history data and other information Ongoing process of meeting local producers Organize a field day at a recently constructed manure management facility Organize a watershed advisory meeting Mail a project review survey to producers
Third quarter: Annual review of project with project partners Mail a winter/spring newsletter Public Meetings on bacteria pollution, sources and alternative practices

76
Article in Newspapers of Howard County regarding recent fall BMP installations Conduct individual meetings with area producers
Fourth quarter: Conduct individual meetings with area producers Review water monitoring data for the year Evaluate sediment delivery from project sites Project evaluations and progress summarizations. Annual review of project with advisory board Conduct follow-up septic well / system meeting at a recently installed system
YEAR 6 (2018):
First quarter: Conduct individual meetings with area producers Install signage for conservation practices in watershed Mail a project newsletter / submit articles with project related information Organize a pasture management related field day Organize a cover crop field day Review possible SWCD annual banquet award winners for participating producers
Second quarter: Continue to develop photo journal, local history data and other information Ongoing process of meeting local producers Organize a field day at a recently constructed manure management facility Organize a stream bank stabilization field day Organize a watershed advisory meeting
Third quarter: Mail a winter/spring newsletter Article in Newspapers of Howard County regarding recent fall BMP installations Conduct individual meetings with area producers Conduct nutrient management planning sessions Write final report draft and submit to Iowa DNR Section 319 for comment
Fourth quarter: Conduct individual meetings with area producers Review water monitoring data for the year Evaluate sediment delivery from project sites Project evaluations and progress summarizations. Annual review of project with project partners Annual review of project with advisory board Conduct follow-up septic well / system meeting Write final report and submit to Iowa DNR Section 319 and EPA for approval

77
Measures of Success and Evaluate Effectiveness
Success will be measured through calculating and meeting Sediment Delivery Reduction goals, the number of people attending workshops, organizations participating and partnering with us, farm follow-ups completed, by the number, acres, or feet of best management practices that are installed, number of acres of critically eroding acres treated, number of wells tested, septic systems updated, and water quality improvement documented through IOWATER monitoring.
Additionally, before, during, and after photos will be taken to visually document watershed improvements. Another method of evaluation will be through the quarterly and annual project reports and reviews which can be used to make adjustments to work plans as needed throughout the period. The WMP will be assessed on an annual basis to determine if milestones are being met. The WMP will also be assessed at the end of each phase to determine if goals and reductions are being achieved or if there needs to be adjustments to the plan.
Other evaluations will include participation in field days, workshops, and demonstrations. Attitudes of residents will be measured by conducting a post-project survey to compare with the survey results completed in 2011. The number of partnering agencies involved will allow us to contact a large number of individuals. The key will be in organizing the various groups and tracking their accomplishments. We will work with every possible partner to focus all of the available resources within Silver Creek Watershed for the time frame allowed.
Participating Agencies and Organizations Iowa Department of Natural Resources (IDNR) Iowa Department of Agriculture and land Stewardship, Division of Soil Conservation (IDALS-
DSC) Howard Soil & Water Conservation District Winneshiek Soil & Water Conservation District Howard County Conservation Board (HCCB) Winneshiek County Conservation Board (WCCB) IOWATER FFA, Crestwood Chapter Iowa State University Extension Service (ISUE) Turkey River Pheasants Forever Chapter Cresco Wildlife Club Natural Resources Conservation Service (NRCS) Cresco City Council Howard County Farm Bureau Winneshiek County Farm Bureau Howard County Economic Committee Cresco Chamber of Commerce Iowa DNR Fisheries – Decorah Iowa DNR Water Monitoring Division Iowa Learning Farm- Iowa State University NE Iowa RC&D Postville Howard County Supervisors Winneshiek County Supervisors

78
6 Supporting Information 6.1 Quality Assurance Project Plan (QAPP)
Quality Assurance Project Plan Chemical/Physical Water Quality Monitoring of Iowa’s
Streams, Rivers, and Lakes
Silver Creek Watershed Project Iowa Department of Natural Resources
Iowa Geological and Water Survey
March 2012 QA/WM/28-01
Silver Creek Watershed Project ___________________________________
Coordinator: Neil Shaffer Date
Iowa Department of Natural Resources
Project Coordinator: ___________________________________
Mary Skopec Date
University Hygienic Laboratory
SHL Project Officer: ___________________________________
Mike Schueller Date
Plan Approved By DNR Quality ___________________________________
Assurance Officer Lynette Seigley Date
79
TABLE OF CONTENTS
Page
DISTRIBUTION LIST . . . . . . . . . . . . . . . . . . . . . . . . . . . . . . . . . . . . . . . . . . . . . . . . . . . . . . . . . . . . . . . . . . . 72 PROJECT/TASK ORGANIZATION . . . . . . . . . . . . . . . . . . . . . . . . . . . . . . . . . . . . . . . . . . . . . . . . . . . . . . . . 72
PROBLEM DEFINITION/BACKGROUND . . . . . . . . . . . . . . . . . . . . . . . . . . . . . . . . . . . . . . . . . . . . . . . . . . 73
PROJECT DESCRIPTION . . . . . . . . . . . . . . . . . . . . . . . . . . . . . . . . . . . . . . . . . . . . . . . . . . . . . . . . . . . . . . . . 75
GOALS/OBJECTIVES . . . . . . . . . . . . . . . . . . . . . . . . . . . . . . . . . . . . . . . . . . . . . . . . . . . . . . . . . . . . . . . . . . . 75
DATA QUALITY OBJECTIVES . . . . . . . . . . . . . . . . . . . . . . . . . . . . . . . . . . . . . . . . . . . . . . . . . . . . . . . . . . . 77
TRAINING REQUIREMENTS/CERTIFICATION . . . . . . . . . . . . . . . . . . . . . . . . . . . . . . . . . . . . . . . . . . . . . 80
DOCUMENTATION AND RECORDS . . . . . . . . . . . . . . . . . . . . . . . . . . . . . . . . . . . . . . . . . . . . . . . . . . . . . . 80
SAMPLING DESIGN AND COLLECTION METHODS . . . . . . . . . . . . . . . . . . . . . . . . . . . . . . . . . . . . . . . . 81
DESIGN RATIONALE. . . . . . . . . . . . . . . . . . . . . . . . . . . . . . . . . . . . . . . . . . . . . . . . . . . . . . . . . . . . . . . . . . . 81
SAMPLE METHOD REQUIREMENTS . . . . . . . . . . . . . . . . . . . . . . . . . . . . . . . . . . . . . . . . . . . . . . . . . . . . 84
SAMPLE HANDLING AND CUSTODY REQUIREMENTS . . . . . . . . . . . . . . . . . . . . . . . . . . . . . . . . . . . . 85
METHODS REQUIREMENTS . . . . . . . . . . . . . . . . . . . . . . . . . . . . . . . . . . . . . . . . . . . . . . . 86
QUALITY CONTROL REQUIREMENTS . . . . . . . . . . . . . . . . . . . . . . . . . . . . . . . . . . . . . . . . . . . . . . . . . . 86
EQUIPMENT TESTING, INSPECTION AND MAINTENANCE REQUIREMENTS . . . . . . . . . . . . . . . . 87
DATA MANAGEMENT . . . . . . . . . . . . . . . . . . . . . . . . . . . . . . . . . . . . . . . . . . . . . . . . . . . . . . . . . . . . . . . . . 88
ASSESSMENT AND RESPONSE ACTION . . . . . . . . . . . . . . . . . . . . . . . . . . . . . . . . . . . . . . . . . . . . . . . . . 89
REPORTS . . . . . . . . . . . . . . . . . . . . . . . . . . . . . . . . . . . . . . . . . . . . . . . . . . . . . . . . . . . . . . . . . . . . . . . . . . . . 89
DATA REVIEW, VALIDATION AND VERIFICATION REQUIREMENTS . . . . . . . . . . . . . . . . . . . . . . 90
PROJECT ORGANIZATION AND RESPONSIBILITY. . . . . . . . . . . . . . . . . . . . . . . . . . . . . . . . . . . . . . . 90
REFERENCES . . . . . . . . . . . . . . . . . . . . . . . . . . . . . . . . . . . . . . . . . . . . . . . . . . . . . . . . . . . . . . . . . . . . . . . . 93
Appendix 1. Analytical procedures, maximum holding times, and sample preservation methods for laboratory measurements.
Appendix 2. Analytical procedures for field measurements.

80
Appendix 3. Data quality requirements and assessments for the Silver Creek Watershed water quality monitoring.
Appendix 4. Chain of Custody form for the Silver Creek Watershed water quality monitoring.
Appendix 5. Field Form for the Silver Creek Watershed water quality monitoring
DISTRIBUTION LIST John Miller, State Hygienic Lab, Des Moines
John Olson, Watershed Monitoring and Assessment Section, Iowa Department of Natural Resources
Mike Schueller, State Hygienic Lab, Iowa City
Neil Shaffer, Howard County SWCD, Cresco
Lynette Seigley, Watershed Monitoring and Assessment Section, Iowa Department of Natural Resources
Mary Skopec, Watershed Monitoring and Assessment Section, Iowa Department of Natural Resources
Jeff Wasson, State Hygienic Lab, Iowa City
Mike Wichman, State Hygienic Lab, Iowa City
PROJECT/TASK ORGANIZATION
Figure 1 shows the project organization, lines of responsibility, and lines of communication for this project. The Silver Creek Watershed Project Coordinator is responsible for the overall coordination of work outlined in the Iowa Department of Natural Resources (DNR) Watershed Planning Grant (2010). The Iowa Department of Natural Resources – Watershed Monitoring and Assessment Section is responsible for overall management of the Ambient Water Monitoring Program, the 319 Water Monitoring, and water monitoring for other watershed projects. The DNR Project Coordinator is responsible for overall coordination, writing of contracts to the State Hygienic Laboratory at the University of Iowa (SHL) for completion of sample collection and analyses, and payment of bills for work

81
completed. The DNR Quality Assurance officer and data manager is responsible for carrying out the quality control/quality assurance exercises and data management as outlined in the QAPP and responsible for receipt of data from the laboratory, the upload of data into AWQMS, overall management of the AWQMS database, development of Web database access tools for AWQMS, and documentation for database.
SHL is contracted to conduct the laboratory analyses of samples collected as part of the Silver Creek Watershed Project.
Figure 1. Silver Creek watershed project organization.
PROBLEM DEFINITION/BACKGROUND
According to the Silver Creek Watershed Project Application for DNR Watershed Planning Grant (2010), Silver Creek is a 22,410-acre watershed (35 mi2) located in northeast Iowa in Howard and Winneshiek counties. Silver Creek originates in Vernon Springs Township in Howard County and flows east/northeast through Winneshiek County before emptying into the Upper Iowa River. The Silver Creek watershed includes 13,104 acres in Howard County and 9,306 acres in Winneshiek County. A total of 8.2 miles of Silver Creek is classified as a Class A1, Class B (WW-2) river.

82
Silver Creek is on the 2010 303(d) Impaired Waters List for excessive bacteria. This impairment is based on results of monitoring for indicator bacteria conducted on Silver Creek (Site 8) of the Upper Iowa River Watershed (UIRW) project from April 2004 through October 2006. The presumptive Class A1 (primary contact recreation) uses were assessed (monitored) as “not supported” due to levels of indicator bacteria that exceeded the state water quality criteria. The geometric mean of E. coli in the 21 samples collected in Silver Creek (UIRW Site 8) during the recreational seasons of 2004 through 2006 was 707 MPN/100ml. This geometric mean exceeds the Class A1 criterion of 126 MPN/100 ml. Eighteen of the 21 samples (86%) exceeded Iowa’s single-sample maximum criterion of 235 MPN/100 ml.
Figure 1. Bedrock geology and karst features for the Silver Creek watershed (Wolter and others, 2011). The Silver Creek Watershed is located in the Iowan Surface and Paleozoic Plateau landform regions of Iowa (Prior, 1991). Geologic mapping of bedrock units in the Silver Creek Watershed area as well as locations of sinkholes, springs, and losing streams have been completed (Liu and others, 2008; Wolter and others, 2011). Thin surficial deposits overly carbonate bedrock aquifers throughout much of the Silver Creek watershed. The western part of the watershed is underlain by Devonian age Cedar Valley Limestone (Figure 1; map symbol Dc). The Cedar Valley Limestone readily transmits and yields

83
groundwater to wells; it also is subject to karst development. The greatest number of sinkholes occurs in the western part of the watershed. The lower portion of the watershed is underlain by the Wise Lake, Dubuque, and Dunleith formations, carbonate units that are also prone to sinkhole development and the presence of losing streams (Figure 1 map symbols Owd and Od).
PROJECT DESCRIPTION
Silver Creek is a 22,410 acre watershed located in northeast Iowa and is on the 303(d) list of impaired waters for excessive bacteria. Silver Creek has provides fishing and other recreational opportunities for the residents of Cresco, as well as others from northeast Iowa and those who choose to recreate in this part of Iowa. Since Silver Creek empties into the Upper Iowa River the health of this watershed is of considerable interest to the thousands of area residents and visitors that enjoy the waters of the Upper Iowa River each year. The Silver Creek watershed project is currently in a DNR Watershed Planning Grant Phase, and the data collected as part of this phase, including additional water quality information, will be used to complete a Watershed Management Plan which then gains access to 319 funding for BMP implementation throughout the watershed.
This Quality Assurance Project Plan has been prepared in accordance with USEPA guidance (USEPA, 1998) and the Iowa Department of Natural Resource’s Quality Management Plan (2006).
GOALS/OBJECTIVES
The first objective for achieving the goals identified in the DNR Watershed Planning Grant is to gain support from the watershed community for the project. The City of Cresco has already committed their support for the project. The watershed will be assessed covering the length of all the tributaries as well as the main channels of the watershed with the assistance of a Rapid Assessment of Stream Conditions Along Length (RASCAL) unit. This unit allows us to address the second objective of identifying priority areas where the source of bacteria may originate within the watershed. The information gathered from this assessment will enable the development of a profile that will help identify critical areas for potential future BMPs. In addition to Bacteria, 2 other goals will be sediment delivery reduction and reducing nitrate loading by 45%.

84
Another valuable tool for attaining information about the health of the watershed is to introduce additional water monitoring sites. Five sites throughout the watershed will be monitored. The first two sites are located just above and below the Cresco Wastewater Treatment Plant. The purpose of this is to identify any potential issues within the treatment plant, and if so, what are those issues are. The third site is a tributary (Minors Creek) that meanders into the main channel of Silver Creek. The fourth site is located at the historical monitoring site on the main channel of Silver Creek. This site represents the Silver Creek Site #8 sampled as part of the Upper Iowa River Watershed Alliance. The fifth site is located near the Upper Iowa River, and below where all the tributaries of Silver Creek merge.
One of the known impairments of Silver Creek is bacteria. The Upper Iowa River Watershed Alliance (UIRW) has been monitoring Silver Creek to identify contaminants in the water and the potential source of these contaminants, with the goal to improve the water. Because Silver Creek is a tributary of the Upper Iowa River, the UIRW Alliance realized that some questions needed to be answered. Samples were collected in 2002 through 2003 and analyzed by the University of Iowa Hygienic Laboratory. Bacterial DNA studies were conducted as a joint project between the IDNR, Iowa Geological Survey Bureau, the University of Iowa Hygienic Laboratory and the Upper Iowa River Watershed Alliance, through the Northeast Iowa RC&D in Postville Iowa. The findings of this research found a variety of sources for possible contamination including humans, livestock, and wildlife. The bacteria may come from a variety of paths including malfunctioning septic systems, manure runoff of fields after application and even storm water runoff from land with wildlife, livestock and pet waste. The UIRW plans to utilize these findings to supp ort projects that will assist in the long-term health of the tributaries that flow into the Upper Iowa River.
As Silver Creek is impaired for bacteria, of prime importance are “open” sinkholes that allow free entry of runoff into the groundwater. These are the most likely to input large volumes of water with high concentrations of bacteria. The very shallow rock Spillville area and shallow soil-filled depressions allow significant infiltration to groundwater, but do provide filtration that will decrease bacteria concentrations; however, the shallow rock – shallow aquifer nature of most of the watershed does indicate a high potential for leaching on nitrogen, soluble herbicides, and some level of bacterial constituents. In order to confirm the geologic interpretations and assure that watershed improvement activities

85
will lead to positive results in the Silver Creek itself, the IDNR and Northeast Iowa RC&D will continue to study this watershed through groundwater dye tracing study.
DATA QUALITY OBJECTIVES
The main objective of the Silver Creek watershed project is to gather additional background information for the watershed, including additional water quality data that can then be used in developing a Watershed Management Plan for the watershed. The data collected will be used as a measure for reducing bacteria and nitrate levels during the life of the project.
The data collected for this monitoring represent conditions in the Silver Creek watershed collected under a variety of weather conditions and throughout the year. The measurements made include those for which standards or USEPA criteria may be used to judge water quality. The quantitation limits specified in Table 1 are sufficient to meet the data quality objectives for each analyte.
Appendices 1 through 3 are included to provide information on the analytical procedures used, sample container, sample preservation methods, maximum holding times, and data quality requirements.
Table 1. Water quality criteria for analytes monitored as part of Silver Creek’s monitoring project (source: Iowa Administrative Code, Chapter 61, p. 13-22). Only analytes with standards are listed.
Parameter Iowa Water Quality Standard
Applicable Designated Use Classification(s)
Parameter Quantitation Limit
Ammonia Nitrogen ** (depends on pH and temperature of water)
B 0.05 mg/L
Dissolved Oxygen 7.0 mg/L (5.0 mg/L)1
5.0 mg/L (5.0 mg/L)1
BCW
BWW
0.1 mg/L

86
5.0 mg/L (4.0 mg/L)1
5.0 mg/L (5.0 mg/L)1
BLR
BLW
Escherichia coli Bacteria
30- day geometric mean 126 organisms/100 ml**
30-day geometric mean 630 organisms/100 ml**
single-sample maximum 235 organisms/100 ml**
single-sample maximum 2880 organisms/100 ml**
A1, A3
A2
A1, A3
A2
10 organisms/100 ml
pH Minimum 6.5; maximum 9.0
A, B 0.1 unit
Temperature Max. increase = 3°C not to exceed 32°C BWW
BLW, BLR 0.5°C
1 Minimum value for at least 16 hours of every 24-hour period (minimum value at any time during every 24-hour period)
“B” includes all of the following designated uses: BLW, BCW, BWW, BLR
“A” includes all of the following designated uses: A1, A2, A3
** Water quality standards criteria apply from March 15 through November 15 unless Class A2 and B(CW) or HQ then applies year-round.
Table 1. Water quality criteria for analytes monitored as part of Silver Creek watershed monitoring project (source: Iowa Administrative Code, Chapter 61, p. 13-22). Only analytes with standards are listed.
Parameter Iowa Water Quality Standard
Applicable Designated Use Classification(s)
Parameter Quantitation Limit
Ammonia Nitrogen ** (depends on pH and temperature of water)
B 0.05 mg/L

87
Chloride ** (depends on hardness and sulfate of water)
BCW BWW BLW
25 mg/L
Dissolved Oxygen 7.0 mg/L (5.0 mg/L)1
5.0 mg/L (5.0 mg/L)1
5.0 mg/L (4.0 mg/L)1
5.0 mg/L (5.0 mg/L)1
BCW
BWW
BLR
BLW
0.1 mg/L
Escherichia coli Bacteria
30- day geometric mean 126 organisms/100 ml**
30-day geometric mean 630 organisms/100 ml**
single-sample maximum 235 organisms/100 ml**
single-sample maximum 2880 organisms/100 ml**
A1, A3
A2
A1, A3
A2
10 organisms/100 ml
Nitrite + Nitrate as Nitrogen
10 mg/L C 0.05 mg/L
pH Minimum 6.5; maximum 9.0
A, B 0.1 unit
Temperature Max. increase = 3°C not to exceed 32°C BWW
BLW, BLR 0.5°C
1 Minimum value for at least 16 hours of every 24-hour period (minimum value at any time during every 24-hour period)
“B” includes all of the following designated uses: BLW, BCW, BWW, BLR
“A” includes all of the following designated uses: A1, A2, A3

88
TRAINING REQUIREMENTS/CERTIFICATION
Field sampling completed by the local project staff is conducted according to DNR SOP (2002) for surface water monitoring. Silver Creek watershed field staff was initially trained by the DNR Quality Assurance Officer in the proper sample collection, sample handling, completion of field tests, completion of paperwork, and handling of QA/QC samples prior to the start of the monitoring. A certified drinking water laboratory performs laboratory analyses.
DOCUMENTATION AND RECORDS
SHL will report the data from the chemical/physical monitoring of Iowa’s streams and rivers to the Iowa Department of Natural Resources in an AWQMS-compatible format on a monthly basis. SHL will submit completed monitoring results to the Silver Creek Watershed Coordinator and the DNR not later than fifteen (15) calendar days after the end of each month or as soon as possible following completion of all analytical determinations requested. Extra time for analysis is allowed in cases when the analytical work warrants. A notification to the submitter that analytical results from a sample will be delayed and the reason for the delay will be made within fifteen (15) calendar days of receipt of the sample if extra time is required for analysis.
SHL will provide a monthly report to the DNR via Excel Spreadsheets via email from the SHL project coordinator. The report will detail the projects completed including the date, location, and number of stream analyses per project, and parameters analyzed during the reporting period. Any deviation from normal sampling procedures, such as a change in sampling location, omission of samples for analysis, etc., will be identified to DNR in writing prior to transmittal of analytical results. The Silver Creek project coordinator will store field sheets for a period of 6 years. The Silver Creek watershed project coordinator will transfer the field data to an Excel spreadsheet throughout the monitoring season.
Data collected as part of this project will be summarized by site and sub watershed. Results will be displayed in spreadsheet format. Results will also be presented at the local, regional, and state meetings. The data will be available through the DNR’s Ambient Watershed Monitoring and Assessment Program web site (www.igsb.uiowa.edu/wqm).

89
SAMPLING DESIGN AND COLLECTION METHODS
Sampling for the Silver Creek Watershed Project was designed to collect baseline data at the sub watershed scale. Local project staff will perform sample collection. The sampling protocol will be conducted according to the DNR SOP for surface water monitoring (2002). Sample containers will be provided by SHL. All sites are sampled on the same day and are sampled bi-weekly from April through November. Samples are collected early enough in the day to ensure that all samples can be delivered to a central location where they will be placed in a cooler according to lab specifications for shipment to the lab. Samples will be shipped to the SHL via an overnight courier. Appropriate chain of custody paperwork will be delivered with the water samples to the laboratory.
Quality assurance (QA) samples or duplicate samples will be collected at 5-10% of the sites each month. Duplicate samples entail collecting both duplicate samples for the field parameters as well as duplicate samples for lab analysis. Duplicate samples will be identified by the site name plus the designation “DUP.” The Silver Creek Watershed Coordinator will randomly select the sites each month for QA analysis and will ensure that the corresponding agency has the necessary bottles to collect the QA samples for those sites.
DESIGN AND RATIONALE
Five locations (Table 2) will be monitored on a bi-weekly basis from April to November for the parameters listed in Table 3, which includes field and lab parameters. The first two sites are located just above and below the Cresco Wastewater Treatment Plant. The purpose of this is to identify any potential issues within the treatment plant, and if so, what are those issues are. The third site is a tributary (Minors Creek) that meanders into the main channel of Silver Creek. The fourth site is located at the historical monitoring site on the main channel of Silver Creek (Silver Creek Site #8 for the Upper Iowa River Watershed). The fifth site is located near the Upper Iowa River, and below where all the tributaries of Silver Creek merge.

90
Grab samples will be collected from the five sites on the same day. Given that bi-weekly sampling is occurring, rainfall events will not be targeted. Locations of monitoring sites were chosen to subdivide the project watershed into sub watersheds that are of a size that are likely to demonstrate a measureable change in water quality during the life of any future watershed project (3-5 years).
Table 2 lists the location of Silver Creek watershed sites to be sampled. Figure 2 shows the location of the sampling sites.
Local project staff will collect and analyze stream grab samples monthly from the locations listed in Table 2 (Figure 2). Sampling is to occur on a set day of the week during the monthly period. This allows for a consistent sampling interval and allows the data from all sites to be directly compared. SHL will analyze these samples for parameters listed in Table 3. Sampling site locations, analytical parameters, and sampling frequency may be modified through written agreement between the Department and SHL and the Silver Creek Watershed project coordinator. All samples collected as part of this activity will be coded as SILCKHOW.
Table 2. Selected monitoring locations.
Site Name Name County UTM X
(meters) UTM Y
(meters) STORET Number
1 Trib to Silver Creek US of WWTP (Site 1) Howard 573125 4804707 15450018
2 Trib to Silver Creek DS of WWTP (Site 2) Howard 573260 4804800 15450017
3 Minor Creek at 318th Ave (Site 3) Howard 578687 4807154 15960043
4 Silver Creek at 325th St Howard 580093 4806504 15960010
5 Silver Creek at Co Rd W14 (Site 5) Howard 580701 4808687 15960044
Table 3. Parameters monitored for Silver Creek Watershed monitoring program.

91
All Parameters – Monthly Sampling Ammonia-Nitrogen (mg/L) - lab pH (pH units) – field
Chloride (mg/L) - field Temperature (degrees F) – field
Dissolved Oxygen (mg/L) - field Total Phosphate (mg/L) – lab
E. coli Bacteria (MPN/100 ml) - lab Turbidity (NTU) - field
Nitrate + Nitrite-N (mg/L) - lab
Figure 2. Map of monitoring sites for the Silver Creek watershed water quality monitoring.

92
SAMPLE METHOD REQUIREMENTS
Local project staff will perform sample collection. A representative grab sample will be collected from each sampling location as outlined in the DNR SOP (2002) for chemical/physical water quality monitoring of Iowa’s streams and rivers. Grab samples will be preserved according to the requirements of SHL and shipped via an overnight courier to the laboratory for analysis.
Local project staff will follow the specimen handling procedures documented in the DNR SOP (2002) for the Ambient Water Monitoring Program.
Documentation
The SHL Laboratory Procedures Manuals indicate how data will be documented to protect it against legal and scientific challenge.
FIELD SAMPLING EQUIPMENT
The following equipment is used to measure field parameters as part of the Silver Creek Watershed project: an Oakton waterproof pH Tester, Hach QuanTab® chloride test strips, plastic beakers, a Hach 2100Q turbidimeter, and a YSI55 handheld meter. All of the equipment is provided by the Iowa DNR. The Oakton waterproof pH Tester is calibrated each time prior to sampling according to the manufacturer’s instructions. pH standards of 7 and 10 are used for calibration. The Hach QuanTab®chloride test strips are used according to the IOWATER QAPP (2010). The Hach 2100Q turbidimeter and YSI 55 meter are calibrated according to the manufacturer’s instructions. Training in the proper use of the field meters and test kits was provided to the Silver Creek watershed coordinator by the Iowa DNR Quality Assurance Officer.
SAMPLE HANDLING AND CUSTODY REQUIREMENTS
Silver Creek watershed staff will perform sample collection. A representative grab sample will be collected from each sampling location as outlined in the DNR SOP (2002) for

93
chemical/physical water quality monitoring of Iowa’s streams, rivers, and lakes. Field measurements will be done by local staff and performed as outlined in this QAPP. Grab samples will be preserved according to this QAPP and shipped via an overnight courier by the collector to the laboratory for analysis.
The SHL will provide bottles, labels, forms, packaging, and shipping materials (if necessary). Local project staff will label, preserve, and package the samples. Local project staff will arrange for transport of samples that they collect to SHL. Sample bottle preparation and preservation methods are documented in Appendices 1 and 2. Samples collected by local project staff will be received at the Ankeny Laboratory Sample Receiving Section and processed according to the SHL-Des Moines Support Services SOP (SHL, 1997c). Sample chain of custody will be documented according to the Limnology Section SOP and the Limnology Section QASP (SHL 1997a; SHL 2000).
All samples submitted to SHL will be coded to a specific monitoring activity (SILCKHOW) and will include a completed chain of custody form (Appendix 4). SHL log-in procedures will accommodate this code. In a format agreed upon by the DNR, a monthly report will be provided to the DNR from computer printouts of logged-in samples. Any deviation from normal sampling procedures, such as a change in sampling location, omission of samples for analysis, etc., will be identified to DNR in writing prior to transmittal of analytical results.
ANALYTICAL METHODS REQUIREMENTS
The State Hygienic Laboratory in Iowa City and Ankeny does analyses of water samples. Appendices 1 and 2 list the analytical procedures, maximum holding times, sample preservation methods for field and lab measurements, and laboratory methods. Samples will be disposed of via the sanitary sewer system; acidified samples will be neutralized before disposal. Analyses of samples with QA parameters outside acceptable limits will require reanalysis and, if deemed necessary by the QA Officer, corrective action to be undertaken. The SHL Sample Operations and Quality Assurance Officer are responsible for insuring that corrective action is taken and will report the corrective action to the DNR QA Officer. Individuals responsible for corrective action and corrective action procedures are described in the SHL’s QA documents.

94
QUALITY CONTROL REQUIREMENTS
The SHL is a state agency under the Iowa Board of Regents. The Iowa General Assembly created the Laboratory in 1904 to meet the needs of the citizens of Iowa as the “state public health and environmental laboratory.” The statute placed the Laboratory as a “permanent part of the University of Iowa.” The SHL is well known for its high quality analytical performance. Since 1973, the Laboratory has had a cooperative agreement with the Iowa Department of Natural Resources to support many aspects of IDNR’s statewide environmental programs. Particular to monitoring related to Iowa’s 319 Program and other watershed efforts, the SHL conducts field and analytical efforts in support of these programs. For the Silver Creek Watershed Project, SHL is responsible for sample analysis.
The SHL follows very strict Quality Assurance and Quality Control (QA/QC) guidelines to maintain a high degree of precision and accuracy. The Quality Assurance Program Plan of the State Hygienic Laboratory (SHL, 1997d) includes protocols for sample custody, holding and extraction times, and detection limits. Other procedures include: daily instrument calibration, interference checks, verification standards, assessment of extraction and sampling efficiencies. Confirmation studies are performed routinely. In general, at least one duplicate and one spike sample are prepared for each set of ten to fifteen samples. A minimum of one reagent blank is prepared and analyzed for each complete set of samples. Trip blanks are used for field sampling programs.
As part of its QA effort, SHL participates in numerous inter-agency and inter-laboratory proficiency testing and performance evaluation programs, including: U.S. EPA, Water Supply Series, Water Pollution Series, Office of Enforcement and Compliance Assurance series for the Federal Insecticide, Fungicide, and Rodenticide Act (FIFRA), and Solid Waste Series; the U.S. Geological Survey Standard Reference Sample Program; and American Industrial Hygiene Association programs. In addition, the SHL has participated in the U.S. EPA Contract Laboratory Program, one of the most rigorous quality assured analytical programs for environmental laboratories.

95
EQUIPMENT TESTING, INSPECTION AND MAINTENANCE REQUIREMENTS
Field equipment calibration and preventive maintenance procedures are outlined in the DNR SOP (2002) for chemical/physical water quality monitoring of Iowa’s streams and rivers. The field meters will be inspected and calibrated by local project staff prior to going to the field. On each data sheet, local project staff will record the date and time when the field meters are calibrated and the person responsible for the calibration.
The laboratory equipment will be calibrated and maintained according to SHL’s standard operating procedures for the laboratory.
DATA MANAGEMENT
Samples collected will be logged into the SHL mainframe system (ELIS). Once analyses are completed, results are entered into ELIS by the analyst, and then released by another analyst.
SHL will report the data from Silver Creek Watershed water monitoring stations to the Silver Creek watershed coordinator and the Iowa Department of Natural Resources on a monthly basis in an electronic format that is AWQMS compatible. SHL will submit completed monitoring results to the Iowa Department of Natural Resources not later than fifteen (15) calendar days after the end of each month.
For analytical results that are below the quantitation limit (such as E. coli bacteria, total phosphate), the quantitation limit of the test will be reported with a “less than” designation.
The Silver Creek project coordinator will enter the field data information into a spreadsheet. Data quality inspection includes reviewing and comparing field data sheets and spreadsheets for any data entry errors, measurement errors, and/or omissions. Any data discrepancies are investigated and corrected. The DNR Quality Assurance Officer

96
provides further review of all data prior to it being entered into an AWQMS compatible database.
The original field forms as well as scanned copies of the field forms will be stored locally for a period of 6 years.
ASSESSMENT AND RESPONSE ACTION
The data collected as part of the Silver Creek Watershed Project will be used to assess water quality variability, both spatially and temporally, throughout the watershed. The data will allow for assessment of designated stream uses. The database also provides a source of water quality information for other governmental agencies, industry, and the general public.
Locations of monitoring sites were chosen to subdivide the project watershed into sub watersheds that are of a size that are likely to demonstrate a measureable change in water quality during the life of any future watershed project (3-5 years).
REPORTS
SHL will provide a monthly report to the DNR in an Excel spreadsheet from logged-in samples. The report will detail the projects completed including the date, location, number of stream analyses per project, and parameters analyzed during the reporting period. Any deviation from normal sampling procedures, such as a change in sampling location, omission of samples for analysis, etc., will be identified to DNR in writing prior to electronic transmittal of analytical results. Reports will be prepared by the SHL Sample Operations and Quality Assurance Officer and sent to the IDNR Project Officer.

97
DATA REVIEW, VALIDATION AND VERIFICATION REQUIREMENTS
All lab data associated with QA controls outside of the acceptance limits will be rejected by the SHL Section Chief or reviewing manager. Rejected data problems will be reported to the QA officer. Data verification will be conducted in accordance with data processing’s SOP for ELIS. Rejected data are reported on the rejected data report to the analytical section chief and the SHL Sample Operations and Quality Assurance Officer. Data review, validation, and verification criteria are discussed in the Limnology Section QASP (SHL, 1997b), and other SHL QA documents.
All field data are verified and validated by the Silver Creek Watershed Coordinator. Data are cross checked for data entry errors and compared to data collected previously for the site and other sites throughout the watershed. Any issues identified with field data collection and measurement procedures will be addressed by the Silver Creek Watershed Coordinator in consultation with the Iowa DNR Quality Assurance Officer.
The DNR Quality Assurance Officer will also verify and validate all field and lab data prior to it being loaded into a WQX compatible format.
PROJECT ORGANIZATION AND RESPONSIBILITY
The following is a list of key project personnel and their corresponding responsibilities:
Silver Creek Watershed Coordinator: Provides overall coordination of the project. Ensures that local project staff has the necessary equipment and supplies to conduct the monthly sampling.
Neil Shaffer
Howard County SWCD
311 7th St. SW Ste 1
Cresco, IA 52136

98
(563) 547-3040
SHL Sample Processing: Provides overall management of sample processing procedures to ensure that proper sample containers, shipping materials, and paperwork are provided to the watershed coordinator. Also ensures that requested analyses are being performed.
Mike Schueller
SHL, Iowa City Laboratory
UI Research Park – HLI 1171
Iowa City, IA 52242-5002
(319)335-4500
SHL Analysis: Provides overall management of lab activities that occur in association with water samples collected as part of this project and submitted to SHL for analysis.
Mike Wichman
SHL, Iowa City Laboratory
UI Research Park – HLI 1171
Iowa City, IA 52242-5002
(319)335-4500
SHL Quality Assurance: Overall coordination and supervision of chemistry laboratory analysis, records management, and data quality assurance management.
Jeff Wasson
SHL, Iowa City Laboratory
UI Research Park – HLI 1171
Iowa City, IA 52242-5002
(319)335-4500

99
SHL Laboratory Information Technology: Provides to DNR on a monthly basis the watershed project lab data. Data are placed on the DNR FTP site in an AWQMS compatible format.
Mike Schueller
SHL, Iowa City Laboratory
UI Research Park – HLI 1171
Iowa City, IA 52242-5002
(319)335-4500
DNR Quality Control/Quality Assurance: Review and approval of QAPP and subsequent revisions to ensure information collected meets data quality standards.
Lynette Seigley
Iowa Department of Natural Resources - Watershed Monitoring and Assessment Section
109 Trowbridge Hall
Iowa City, IA 52242-1319
(319)335-1575
DNR Overall Project Coordinator: Overall project administration for the Iowa DNR as well as providing project information to the Silver Creek Watershed Coordinator.
Mary Skopec
Iowa Department of Natural Resources - Watershed Monitoring and Assessment Section
109 Trowbridge Hall
Iowa City, IA 52242-1319
(319)335-1575

100
DNR Data Management: Review of field and lab data collected as part of the Silver Creek Watershed Project. Transfer of data to a WQX compatible format and eventual availability on the Web at https://programs.iowadnr.gov/iastoret/.
Lynette Seigley
Iowa Department of Natural Resources - Watershed Monitoring and Assessment Section
109 Trowbridge Hall
Iowa City, IA 52242-1319
(319)335-1575
Water quality data collected as part of the Silver Creek Watershed project will be made available through the Iowa DNR’s website (https://programs.iowadnr.gov/iastoret/). Data will be accessed by the Silver Creek watershed coordinator through SHL’s online web reporting interface. Data will be downloaded and stored in a spreadsheet format.
SHL will transfer the Silver Creek Watershed Project water data to the DNR – Iowa Geological and Water Survey via the Survey’s FTP site. Chemical and physical data are transferred in a text-delimited format. IGWS then completes a validity check on the data to verify site names, parameters, personnel sampling, and project code. A trip ID is established and added to the data before being uploaded into AWQMS. The data are placed in Access look-up tables and Visual Basic programming is used to create batch upload files into an AWQMS compatible format. The data are then available on the Web at https://programs.iowadnr.gov/iastoret/.
REFERENCES
Liu, Huaibao, McKay, Robert M., Tassier-Surine, Stephanie, and Giglierano, James D., 2008, Bedrock Geology of the Upper Iowa River Watershed: Phase 4: Cresco Ne 7.5’ Quadrangle, Iowa Geological Survey Open File Map OFM-08-1, Supported in part by the U.S. Geological Survey Cooperative Agreement Number 07HQAG0087.

101
Iowa Administrative Code, Chapter 61, Water Quality Standards.
Iowa Department of Natural Resources, 2002, SOP for Surface Water Quality Monitoring, Iowa City, IA.
Iowa Department of Natural Resources, 2010, Quality Assurance Project Plan for IOWATER, QA/WM/01-02, 90 p.
Prior, J.C., 1991, Landforms of Iowa, University of Iowa Press, Iowa City, 153 p.
Silver Creek Watershed Project Application for DNR Watershed Planning Grant Form A, 2010, Howard Soil and Water Conservation District, 27 p.
University Hygienic Laboratory, 1997a, Limnology Section Standard Operating Procedures Manual, The University of Iowa Hygienic Laboratory, Iowa City, IA.
University Hygienic Laboratory, 1997b, Limnology Section Quality Assurance Section Plan, The University of Iowa Hygienic Laboratory, Iowa City, IA.
University Hygienic Laboratory, 1997c, University Hygienic Laboratory Des Moines Support Services Standard Operating Procedures, The University of Iowa Hygienic Laboratory, Iowa City, IA.
University Hygienic Laboratory, 1997d, Quality Assurance Program Plan of the University Hygienic Laboratory, The University of Iowa Hygienic Laboratory, Iowa City, IA.
University Hygienic Laboratory, 2000, Limnology Quality Assurance Section Plan, The University of Iowa Hygienic Laboratory, Iowa City, IA.

102
Wolter, C.F., McKay, R.M., Liu, H., Bounk, M.J., and Libra, R.D., 2011, Geologic Mapping for Water Quality Projects in the Upper Iowa River Watershed, Iowa Geological and Water Survey Technical Information Series 54, 34 p.

103
Appendix 1. Analytical procedures, maximum holding times, and sample preservation methods for laboratory measurements.
REQUIRED CONTAINERS, PRESERVATION TECHNIQUES, AND HOLDING TIMES
Analyte Container Preservative
Maximum Holding Time Method
Ammonia Nitrogen 250 ml plastic Cool, 4°C
H2SO4 to pH<2 28 days LAC10-107-06-1J
E. coli Bacteria 120 ml clear plastic 0.008% NA2S2O3; Cool to 4 ◦C
<24 hours,
<10°C for surface water EPA 1603 (modified mTEC)
Nitrate+Nitrite-Nitrogen 250 ml plastic Cool, 4°C
H2SO4 to pH<2 28 days EPA 353.2
Phosphorus, Total 250 ml plastic Cool, 4°C
H2SO4 to pH<2 28 days LAC10-115-01-1D
Appendix 2. Analytical procedures for field measurements.
REQUIRED CONTAINERS, PRESERVATION TECHNIQUES, AND HOLDING TIMES
Analyte Container Preservative
Maximum Holding Time Method
Chloride None required None required Analyze immediately IOWATER QAPP 2010 (Hach Quantab test strips)
Dissolved Oxygen None required None required Analyze immediately APHA 4500-O-G
pH, Field None required None required Analyze immediately APHA 4500-H
Temperature, Field None required None required Analyze immediately APHA 2550
Turbidity None required None required Analyze immediately USEPA 180.1
Appendix 3. Data quality requirements and assessments for the Silver Creek watershed water quality monitoring.
Analyte Matrix Method Estimated Accuracy Estimated

104
Detection
Limit
Accuracy of
True Value
Protocol Precision
(Relative % Difference)
Ammonia Nitrogen as N Water 0.05 mg/L + 14% Recovery on
spikes RDP < 20%
E. coli Bacteria Water 10 CFU NA NA Three-year
Average = 0.21
Nitrate+Nitrite-Nitrogen Water 0.05 mg/L ±0.1 low level
Recovery on spikes
RDP < 20%
Phosphorus, Total Water 0.02 mg/L +5% Recovery on
spikes RPD <20%
mg/L – milligrams per liter; NA – not applicable; RPD - Relative % Difference

Appendix 4. Chain of Custody form for Silver Creek water quality monitoring.

106

107

108

109
6.2 Karst Study of Silver Creek
Sinkhole Locations Upper Iowa River Watershed
Previous knowledge of sinkholes in the Upper Iowa River watershed comes from Natural Resources Conservation Service (NRCS) county soil surveys for Howard, Winneshiek, and Allamakee counties. These soil surveys were performed from 1956-1960 (Winneshiek), 1962-1967 (Howard), and 1984-1987 (Allamakee). Therefore, some of these surveys were mapped over 40 years ago, which, although short in geological terms, is plenty of time for new sinkholes to develop and old ones to be filled in naturally or with human assistance. The soil surveys also did not focus as much on forested areas as on crop production areas and therefore may have missed sinkholes in the forested areas. Karst features such as sinkholes, losing streams, enlarged fractures, and springs may occur in limestone, dolomites or other rocks that dissolve through geologic time. When well developed, these rocks may form subsurface drainage systems that cross watershed boundaries. Sinkholes allow for direct surface water run-off to enter the aquifer, without soil filtration. Compared to some other limestone-type aquifers, the Prairie du Chien has a relatively low density of sinkholes, and isn’t known to exhibit well developed subsurface drainage. Sinkholes and other karst features are very common where rocks of the Cedar Valley Group or the Dubuque through Dunleith Formations are the uppermost bedrock, and much less so in areas underlain by the Prairie du Chien, as is the case in Waterloo Creek.

110
Location of Seeps and Springs UIR Watershed There is approximately 1,600 feet of total bedrock thickness variably exposed throughout the watershed. The oldest exposed rock in the watershed is Cambrian sandstone of the Wonewoc Formation; it outcrops low in the valley wall of the Upper Iowa River Valley near the confluence with Irish Hollow in Allamakee County. The youngest rock exposed in the watershed is Cretaceous ironstone and sandstone of the Windrow Formation. It outcrops in two places; northeast of Waukon at Iron Hill in Allamakee County where it overlies the Ordovician Dunleith Formation, and on a private farmstead along the Minnesota border northeast of Lime Springs, Howard County where it rests on Devonian Cedar Valley Group. One of the primary goals of the study was to gain a more thorough understanding of relationships between bedrock geology and karst features within the watershed. Since karst features within the watershed are all developed within bedrock aquifers, bedrock formations were grouped into mapping units that represented either entire aquifer systems, subdivisions of aquifer systems, or aquifer-separating aquitards within the watershed. The above map illustrates the entire stratigraphic column within the area of the watershed and the division of bedrock units into aquifers, aquitards, map units, and their component geologic formations. Major rock types, distinctive accessory lithologies, and distinguishing rock fabric features, as well as major spring, seep, and unconformity horizons are graphically summarized.

111

112

113
Silver Creek watershed heads northwest of Cresco in Howard County, and flows into the Upper Iowa River in eastern Winneshiek County. The city of Cresco straddles the watershed divide. Geologic mapping of bedrock units in northeast Iowa shows Silver Creek watershed is underlain by Cedar Valley Limestone in the Cresco area, which overlies the Spillville Formation of the Wapsipinicon Group. These rocks in turn overlie the Maquoketa Fm and finally rocks of the Galena Group. These relationships and unit thicknesses are also shown in cross – sectional view in Figure B-2. Past erosion has removed younger, overlying rocks from the lower elevations of the watershed. This has resulted in thinning or complete removal of the younger units as the Upper Iowa River valley is approached.
The two basic methods by which karst-carbonate aquifers are recharged with water are described by Hoyer and Hallberg (1984) as infiltration (diffuse percolation through the soil) and direct flow (runin of surface water into sinkholes). They point out that although in the past much attention has been directed at the influence of sinkholes, the largest mass and highest concentrations of soluble chemicals, including nitrates are delivered to ground water by infiltration, not by direct runin from sinkholes. However, the runin component is thought to be primarily responsible for the delivery of groundwater of large loads and high concentrations of relatively insoluble chemicals, including pesticides, during short periods of peak runin. Peak runin occurs during periods of very heavy rainfall or thawing when the recharging of aquifers by direct runin for precipitation exceeds that from infiltration. These periods are usually characterized by peak turbidity and sediment loads, and peak loads of organic matter and pathogenic organisms.
6.3 Survey Results
This report presents the tabulated results of the surveys. The tables present the questions and response categories as they were presented in the surveys. The number of responses for each question or question item is provided in parentheses.
1. What is the best definition of a watershed? (CHECK ONE BOX) (n=210)
All A structure that stores water 3%
An area of land that drains to a common body of water 79%
A basin to hold extra water to prevent flooding 12%
An underground water supply 6%
Water Issues (CHECK THE BEST ANSWER, UNLESS MULTIPLE ANSWERS ARE INDICATED.)

114
2. Where do you get your drinking water? (CHECK ALL THAT APPLY)
All
Well (individual well or well that serves fewer than 15 residences) (n=46) 21%
Rural water system (n=4) 2%
River, stream, pond, or lake (individual system) (n=1) 1% City water system (n=170) 79%
Purchase bottled water (n=50) 23%
Produce own with reverse osmosis (RO) system (n=1) 1% Don’t know (n=0) 0%
3. Do you feel that your home drinking water is safe to drink? (n=212)
All
Yes 86%
No 14%
4. In your opinion, what is the quality of groundwater (sources of well water) in your area? (n=216)
All Non-Farming Farming
Good 40% 42% 34%
Fair 37% 34% 47%
Poor 6% 6% 7%
Don’t know 17% 18% 12%
5. In your opinion, what is the quality of surface waters (rivers, streams, lakes) where you live? (n=217)
All Non-Farming Farming
Good 15% 12% 27%
Fair 57% 59% 51%
Poor 14% 14% 12%
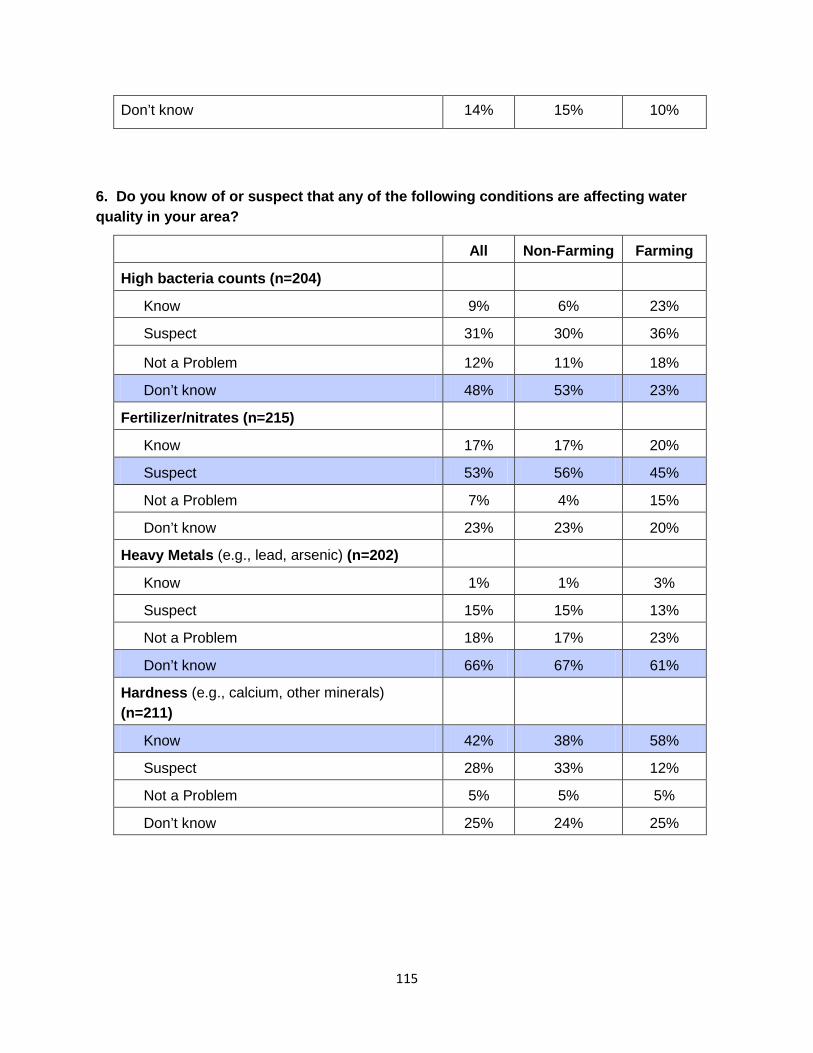
115
Don’t know 14% 15% 10%
6. Do you know of or suspect that any of the following conditions are affecting water quality in your area?
All Non-Farming Farming
High bacteria counts (n=204)
Know 9% 6% 23%
Suspect 31% 30% 36%
Not a Problem 12% 11% 18%
Don’t know 48% 53% 23%
Fertilizer/nitrates (n=215)
Know 17% 17% 20%
Suspect 53% 56% 45%
Not a Problem 7% 4% 15%
Don’t know 23% 23% 20%
Heavy Metals (e.g., lead, arsenic) (n=202)
Know 1% 1% 3%
Suspect 15% 15% 13%
Not a Problem 18% 17% 23%
Don’t know 66% 67% 61%
Hardness (e.g., calcium, other minerals) (n=211)
Know 42% 38% 58%
Suspect 28% 33% 12%
Not a Problem 5% 5% 5%
Don’t know 25% 24% 25%

116
Pesticides (n=210) All Non-Farming Farming
Know 10% 10% 10%
Suspect 47% 51% 30%
Not a Problem 9% 6% 23%
Don’t know 34% 33% 37%
Animal waste (n=210)
Know 15% 14% 20%
Suspect 44% 48% 30%
Not a Problem 12% 9% 25%
Don’t know 29% 29% 25%
Septic Systems (n=204)
Know 3% 2% 8%
Suspect 25% 26% 18%
Not a Problem 19% 18% 25%
Don’t know 53% 54% 49%
Pharmaceuticals (i.e. antibiotics, personal care products) (n=210)
Know 2% 2% 3%
Suspect 20% 21% 17%
Not a Problem 21% 18% 30%
Don’t know 57% 59% 50%
7. In your opinion, which of the following are most responsible for the existing pollution problems in rivers and lakes in Iowa? (CHECK UP TO 3 ANSWERS)
All Non-Farming Farming
Agriculture crop production (n=144) 66% 69% 51%
Erosion from roads and/or construction sites (n=24)
11% 11% 10%
Wastes from urban areas (n=51) 23% 19% 42%
Industry (n=59) 27% 26% 32%
Wild animals/pets (n=1) 1% 1% 0%
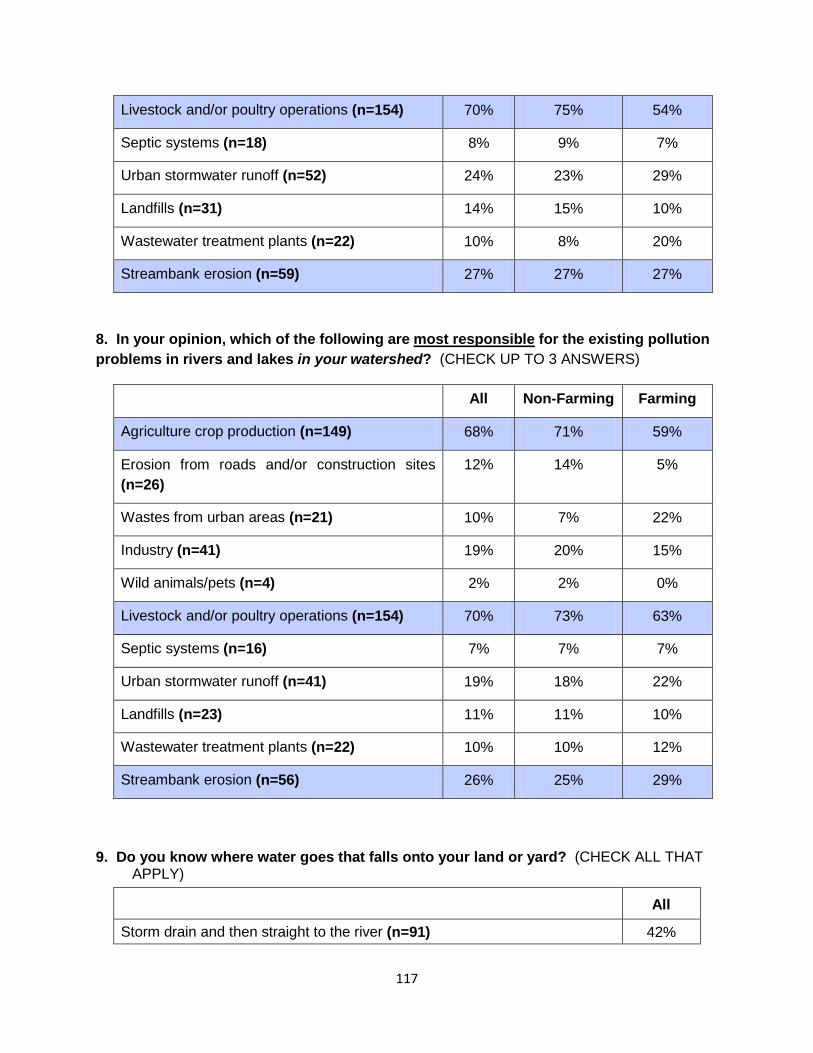
117
Livestock and/or poultry operations (n=154) 70% 75% 54%
Septic systems (n=18) 8% 9% 7%
Urban stormwater runoff (n=52) 24% 23% 29%
Landfills (n=31) 14% 15% 10%
Wastewater treatment plants (n=22) 10% 8% 20%
Streambank erosion (n=59) 27% 27% 27%
8. In your opinion, which of the following are most responsible for the existing pollution problems in rivers and lakes in your watershed? (CHECK UP TO 3 ANSWERS)
All Non-Farming Farming
Agriculture crop production (n=149) 68% 71% 59%
Erosion from roads and/or construction sites (n=26)
12% 14% 5%
Wastes from urban areas (n=21) 10% 7% 22%
Industry (n=41) 19% 20% 15%
Wild animals/pets (n=4) 2% 2% 0%
Livestock and/or poultry operations (n=154) 70% 73% 63%
Septic systems (n=16) 7% 7% 7%
Urban stormwater runoff (n=41) 19% 18% 22%
Landfills (n=23) 11% 11% 10%
Wastewater treatment plants (n=22) 10% 10% 12%
Streambank erosion (n=56) 26% 25% 29%
9. Do you know where water goes that falls onto your land or yard? (CHECK ALL THAT APPLY)
All
Storm drain and then straight to the river (n=91) 42%

118
Directly into a nearby creek (n=38) 17%
Roadside ditch and then stream or river (n=37) 17% It gets absorbed into the land (n=122) 56%
Don’t know (n=30) 14% Soil Erosion Issues
10. Do you have any soil erosion on your property? (n=202)
All
None 63%
A little 30%
Moderate 2%
A lot 1%
Don’t know 4%
11. What are some of the ways that you try to prevent or fix soil erosion on your property? (CHECK ALL THAT APPLY)
All
Continuous no-till or strip-till (n=28) 13%
Leaving vegetation on the ground in garden (n=47) 22%
Following the natural contours of the land (either farmland or in landscaping) (n=31)
14%
Planted windbreaks (n=36) 16%
Grassed waterway or grass strip around garden (n=63) 29%
Placing mulch on all exposed soil on land (n=28) 13%
Use of native plantings to protect streambanks (n=17) 8%
Cover crops (n=14) 6%
We don't do anything (n=22) 10%
Not applicable (n=82) 37%

119
12. Have you or someone in your household done any of the following as part of an individual or community effort to conserve water or preserve water quality in the last five years? (CHECK ALL THAT APPLY)
All
Changed the way your yard is landscaped (n=33) 15%
Reduced your water consumption (i.e. stopped watering lawn) (n=97) 44%
Reduced your use of pesticides, fertilizers or other chemicals (n=62) 28%
Increased residue on row crop acres (n=24) 11%
Addressed erosion on your land (n=34) 16%
Pumped your septic system (n=28) 13%
Tested your drinking water (n=45) 21%
Other______________________________________________________________
Governance
13. In your opinion, does the environment receive the right amount of emphasis from government and elected officials in your community? (CHECK ONE ANSWER) (n=214)
All Non-Farming Farming
Not enough emphasis is placed on environmental protection 41% 46% 22%
Environmental protection receives about the right amount of emphasis
24% 23% 30%
Too much emphasis is placed on environmental protection 5% 2% 18%
Don’t know 30% 29% 30%
14. In your opinion, who should be most responsible for protecting water quality in your community? (SELECT ONE) (n=211)
All Non-Farming Farming
Environmental Protection Agency (EPA) 5% 5% 2%

120
Natural Resources Conservation Service (NRCS) 8% 9% 5%
Iowa Department of Agriculture and Land Stewardship (IDALS)
5% 5% 8%
Iowa Department of Natural Resources (IDNR) 10% 12% 5%
Local Soil and Water Conservation District (SWCD) 14% 14% 18%
Your county, city, or town 14% 17% 3%
Individual citizens without land 2% 2% 3%
Landowners 28% 24% 49%
Don't know 13% 14% 8%
Other: All of the above 2% 2% 2%
Not IDNR 1% 0% 5%
15. How well do you feel each one of these groups is fulfilling their responsibility for protecting water quality in your community? (CIRCLE ONE ANSWER PER GROUP. LEAVE IT BLANK IF YOU “DON’T KNOW.”)
Responses given in average rating
All
Non-Farming
Farming
Very Well Well Okay Poorly Very Poorly
Federal government (EPA, NRCS) (n=156)
5 4 3 2 1 2.67 2.59 3.0
State government (DNR, IDALS) (n=161)
5 4 3 2 1 2.82 2.80 2.93
Your county, city, or town govt. (n=161)
5 4 3 2 1 2.88 2.89 2.79
Soil and water conservation district (SWCD) (n=159)
5 4 3 2 1 3.01 2.98 3.09
Your community 5 4 3 2 1 2.94 2.95 2.86

121
(n=167)
The landowners (n=158)
5 4 3 2 1 2.67 2.59 3.00
Individual citizens (n=158)
5 4 3 2 1 2.72 2.63 3.10
Water Quality Education
16. Have you received water quality information from the following sources? (CHECK ALL THAT APPLY)
All Non-Farming Farming
Television (n=88) 40% 43% 32%
Internet (n=38) 17% 17% 22%
Newspapers (n=105) 48% 49% 42%
Radio (n=40) 18% 18% 22%
Extension Service (n=66) 30% 26% 49%
Iowa Learning Farms (n=13) 6% 6% 2%
Universities (n=20) 9% 10% 7%
Schools (elementary and secondary) (n=14) 6% 7% 5%
Agricultural trade/commodity groups (n=14) 6% 6% 10%
Environmental agencies (government) (n=33) 15% 14% 20%
Environmental agencies (citizen groups) (n=25) 11% 13% 5%
17. Would you like to learn more about any of the following water quality issue areas? (CHECK ALL THAT INTEREST YOU)
All
Agricultural water management on row crop acreages (n=32) 15%
Animal manure and waste management (n=45) 21%

122
Drinking water and human health (n=103) 47%
Environmental restoration (n=32) 15%
Nutrients and pesticide management (n=43) 20%
Pollution assessment and prevention (n=44) 20%
Water conservation (n=38) 17%
Water policy and economics (n=15) 7%
Watershed management (n=42) 19%
Private well and septic system management (n=22) 10%
Small acreage water and land management (n=26) 12%
Home and garden landscaping for water quality (n=39) 18%
Other 3%
18. Have you ever changed your mind about an environmental issue as a result of: (CHECK ALL THAT APPLY)
All
Non-Farming
Farming
News coverage (TV, newspapers, Internet, etc.) (n=79) 36% 40% 20%
Field days (n=17) 8% 7% 10%
Conversations with other people (n=55) 25% 27% 20%
Attending public meetings or participating in volunteer activities (n=14)
6% 6% 7%
Classes or presentations (n=26) 12% 12% 12%
Speech by an elected representative (n=3) 1% 2% 0%
Firsthand observation (n=81) 37% 33% 56%
Financial considerations (n=18) 8% 7% 15%
Concern about the future for your children/grandchildren (n=108)
49% 50% 49%

123
19. Of the following kinds of learning opportunities available, which would you be most likely to take advantage of for water quality issues? (CHECK UP TO 3 ITEMS)
All
Non-Farming
Farming
Read printed fact sheets, bulletins, or brochures (n=125) 57% 59% 49%
Visit a website for information and tips (n=65) 30% 31% 24%
Look at a demonstration or display (n=59) 27% 27% 29%
Watch a video (n=35) 16% 16% 17%
Volunteer in a one-time learning activity (e.g. water monitoring, streamside restoration or education) (n=23)
11% 11% 7%
Take a course for certification or credit (n=11) 5% 5% 5%
Get trained for a regular volunteer position (e.g. as a watershed steward or a water quality monitor) (n=13)
6% 6% 7%
Ask for a home, farming, or workplace water practices assessment (n=29)
13% 11% 22%
Attend a fair or festival (n=43) 20% 21% 15%
20. Are you now participating, or have you participated, in any of the following activities in the last five years? (CHECK ALL THAT APPLY)
All
Master Gardener program (n=10) 5%
Volunteer water quality monitoring (n=6) 3% Lake or river protection groups (n=6) 3%
Town conservation commissions (n=2) 1%
Other water or environmental protection groups (n=20) 9%
Please answer the following as they pertain to you
21. Where do you live? (n=217)
All
Inside city limits, not engaged in Farming 70%

124
Outside city limits, not engaged in Farming 12%
Inside city limits, currently engaged in Farming 8%
Outside city limits, currently engaged in Farming 10%
22. Approximately what is the population of your community? (n=186)
Average 4075
23. How long have you lived in your area? (n=216)
Average 35 years
24. To what extent are you currently active in your local community?
All Frequent local shops and restaurants (n=208)
Never 3%
Sometimes 41%
Always 56%
Attend local sporting events (n=176)
Never 19%
Sometimes 65%
Always 16%
Active member of local church (n=201)
Never 15%
Sometimes 32%
Always 53%
Participate in local social clubs (n=174)
Never 40%
Sometimes 43%
Always 17%
Participate in environmental/garden club (n=159)
Never 78%
Sometimes 18%
Always 4%

125
Attend school events (n=182)
Never 17%
Sometimes 65%
Always 18%
25. What is your gender? (n=216)
All
Male 57%
Female 43%
26. What is your age? (n=212)
Average of 60 years old (range ages 20-95)
27. How many people live in your household? (n=219)
# of individuals Individuals 18 and over Individuals under 18
0 --- 80%
1 29% 7%
2 61% 8%
3 8% 3%
4 2% 1%
5 --- 1%
28. What level of education you have completed? (n=213)
All
Less than high school or some high school 6%
High school graduate 31%
Some college or vocational training 28%
College graduate 25%
Advanced college degree 10%

126
29. What is your current occupation? (n=201)
All
Farming 6%
Manufacturing/Contracting/Transportation 12%
Education 5%
Management/Retail 8%
Government 3%
Retired 44%
Professional (Lawyer/Doctor/Insurance) 8%
In the home 3%
Disabled 2%
Self-employed 4%
Other 5%
6.4 RASCAL (Rapid Assessment of Stream Channel Along Lenth)

127

128

129

130

131

132
Silver Creek, Howard & Winneshiek County
Stream Miles Assessed: 25.52
Flow at time of survey Stream Miles % of Total Left Riparian Zone Width Stream Miles % of TotalNormal 19.89 77.9% < 10 Feet 0.31 1.2%High 0.00 0.0% 10-30 Feet 1.23 4.8%Low 1.23 4.8% 30-60 Feet 1.03 4.1%No Flow 4.22 16.6% > 60 Feet 22.87 89.6%No Data 0.18 0.7% No Data 0.08 0.3%
Hydrologic Varaibility Right Riparian Zone WidthDry Channel 4.30 16.8% < 10 Feet 0.24 0.9%Pond 0.00 0.0% 10-30 Feet 1.70 6.7%Pool/Glide 0.07 0.3% 30-60 Feet 1.48 5.8%Riffle/Pool 1.36 5.3% > 60 Feet 22.01 86.3%Riffle 0.00 0.0% No Data 0.08 0.3%Riffle/Run 9.74 38.2%Run 10.04 39.3% Left Riparian Zone CoverNo Data 0.00 0.0% Grass 3.42 13.4%
Trees 9.27 36.3%Substrate Pasture 3.53 13.8%Bedrock 2.85 11.2% CRP-Trees 1.90 7.4%Boulder 0.23 0.9% CRP-Grass 7.31 28.6%Cobble 8.95 35.1% Residential 0.00 0.0%Gravel 6.71 26.3% Commercial 0.00 0.0%Sand 3.87 15.2% No Data 0.08 0.3%Silt/Mud 2.86 11.2%Clay/Hard Pan 0.05 0.2% Right Riparian Zone CoverNo Data 0.00 0.0% Grass 5.54 21.7%
Trees 8.39 32.9%Sediment Coverage Pasture 3.51 13.8%Entire Segment 2.34 9.2% CRP-Trees 1.36 5.3%75-90% of Segment 9.07 35.5% CRP-Grass 6.63 26.0%50-75% of Segment 5.23 20.5% Residential 0.00 0.0%25-50% of Segment 5.14 20.2% Commercial 0.00 0.0%0-25% of Segment 3.20 12.5% No Data 0.08 0.3%No Sediment 0.54 2.1%No Data 0.00 0.0% Left Adjacent Land Cover
Row Crop 12.97 50.8%Pool Frequency Trees 3.37 13.2%None 20.14 78.9% Grass 1.49 5.8%1 Pool 1.85 7.3% Mowed Grass 0.00 0.0%2 Pools 2.31 9.0% Pasture 3.44 13.5%3 Pools 0.53 2.1% CRP 4.16 16.3%4 Pool 0.19 0.7% Residential 0.00 0.0%5 or More 0.51 2.0% Commercial 0.00 0.0%No Data 0.00 0.0% Open Feedlot 0.00 0.0%
Farmstead 0.00 0.0%Riffle Frequency Cliff 0.00 0.0%None 12.51 49.0% Other 0.00 0.0%1 Riffle 3.75 14.7% No Data 0.08 0.3%2 Riffles 2.01 7.9%3 Riffles 2.86 11.2% Right Adjacent Land Cover4 Riffles 1.71 6.7% Row Crop 12.99 50.9%5 or More 2.67 10.5% Trees 3.25 12.8%No Data 0.00 0.0% Grass 1.33 5.2%
Mowed Grass 0.00 0.0%Losing Flow Pasture 3.44 13.5%Yes 0.39 1.5% CRP 4.22 16.6%No 20.42 80.0% Residential 0.00 0.0%No Data 4.71 18.5% Commercial 0.00 0.0%
Open Feedlot 0.00 0.0%Stream Habitat Farmstead 0.19 0.8%Poor 9.64 37.8% Cliff 0.00 0.0%Average 10.40 40.7% Other 0.00 0.0%Excellent 5.48 21.5% No Data 0.08 0.3%No Data 0.00 0.0%
Canopy CoverBank Stability 0-10% 11.97 46.9%Stable 9.53 37.3% 10-25% 0.82 3.2%Minor Erosion 8.47 33.2% 25-50% 1.70 6.7%Moderate Erosion 3.59 14.1% 50-75% 4.62 18.1%Severe Erosion 3.92 15.4% 75-100% 6.41 25.1%No Data 0.00 0.0% No Data 0.00 0.0%
Bank Height Right Livestock Access0 - 3' 3.90 15.3% Yes 1.10 4.3%3 - 6' 17.33 67.9% No 21.72 85.1%6 - 10' 3.72 14.6% No Data 2.69 10.6%10 - 15' 0.40 1.6%15' + 0.17 0.7% Left Livestock AccessNo Data 0.00 0.0% Yes 0.14 0.6%
No 22.02 86.3%Bank Erosion No Data 3.35 13.1%None 10.24 40.1%Both Banks 6.14 24.1% Channel PatternAlternate Banks 0.07 0.3% Straight 9.88 38.7%Random 9.06 35.5% Meandering 15.64 61.3%No Data 0.00 0.0% Braided 0.00 0.0%
No Data 0.00 0.0%Bank MaterialRock/RipRap 0.00 0.0% Channel ConditionSoil/Silt 24.32 95.3% Artificial 0.00 0.0%Concrete 0.00 0.0% Natural Channel 15.40 60.3%Cobble/Gravel 1.13 4.4% Past Channel Alteration 9.18 36.0%Sand 0.06 0.2% Recent Alteration 0.94 3.7%No Data 0.00 0.0% No Data 0.00 0.0%
Bank VegetationNone 0.00 0.0%Overhanging Only 0.79 3.1%Dislodged 5.33 20.9%Partially Established 1.48 5.8%Well Established 16.88 66.2%No Data 1.03 4.0%
In-Stream Assessment Summary

133
Appendix A. Works Cited:
Huaibao Liu, Robert M. McKay, Stephanie Tassier-Surine, and James D. Giglierano, 2008, Bedrock Geology of the Upper Iowa River Watershed: Phase 4: Cresco Ne 7.5’ Quadrangle, Iowa Geological Survey Open File Map OFM-08-1, Supported in part by the U.S. Geological Survey Cooperative Agreement Number 07HQAG0087.
Prior, J.C., 1991, Landforms of Iowa, University of Iowa Press, Iowa City, 153 p.
Puffer, David C., Silver Creek Watershed Project Application for DNR Watershed Planning Grant Form A, 2010, Howard Soil and Water Conservation District, 27 p.
Water Quality Summary 2000-2011, 2012, Silver Creek; Iowa Department of Natural Resources, Water Fact Sheet 2012-1, 2 p.
Wolter, C.F., McKay, R.M., Liu, H., Bounk, M.J., and Libra, R.D., 2011, Geologic Mapping for Water Quality Projects in the Upper Iowa River Watershed, Iowa Geological and Water Survey Technical Information Series 54, 34 p.
Kiel, Adam, Upper Iowa River Watershed GIS Analysis, Northeast Iowa RC&D Upper Iowa River Watershed Project, 11 p.13 p.
Comito, Jacqueline; Brown, Carol; Staudt, Ann; Andrews, Aaron; Assisted by White, Ellen; Juchems, Elizabeth; Sloan, Sara; Silver Creek Watershed Citizens Awareness Campaign 2011, excerpts cited pp. 3-25.
Eckblad, Jim Dr., Department of Biology, Luther College, Decorah Iowa; Project Report: Upper Iowa River Alliance; May 20, 2000; 2 p. & 3 p.

134
Bounk, M.J., and E.A. Bettis. 1984. Karst development in northeast Iowa. Porch. Iowa Acad. SCI. 91(1) 12 p.-15 p.
Hoyer, B.E., and G.R. Hallberg. 1984. Carbonate aquifers and the water quality problems in northeat Iowa. In: Proceedings of a conference on Goundwater Quality in Northeast Iowa, October 16 & 17, 1984 at Luther College, Decorah Iowa., pp. 3-20.
Klemme, Mark. 1973. Biological and Chemical Paprameters of the Upper Iowa River Watershed. Final Report for Luther College Grant GY-9578 (UES/SOS) to the National Science Foundation, Washington, DC.
Roosa, D.M. 1984. Natural Heritage protection in the driftless region. Proc. Iowa Acad.Sci. 91 (1): 42-46
Iowa DNR 305(b) Water Quality Assessment Database: Silver Creek Assessment, 2008
Angerman, William K.; Drainage Report and Hydrolic Computations for 7th Street West Storm Sewer, Cresco, Iowa; Nov. 01, 2007, pp. 3,10 & 11.
Iowa Department of Natural Resources, Geological Survey; Iowa’s Water, Ambient Monitoring Program, Fact Sheet, January 2004 pp. 1,2, 4,5
Libra, Robert, State Geologist, Iowa Department of Natural Resources; September 2011, Geologic Mapping for Water Quality Projects in the Upper Iowa River Watershed; excerpts pp. 2-20