water: the potential consequences of global warming for water resources in usa
DESCRIPTION
Water: The Potential Consequences of Global Warming for Water Resources in USATRANSCRIPT
Water: The Potential Consequences of
Climate Variability and Change for the
Water Resources of the United States
The Report of the Water Sector Assessment Teamof the National Assessment of the Potential Consequences of
Climate Variability and Change
For the U.S. Global Change Research Program
Lead AuthorPeter H. Gleick, Pacific Institute for Studies in Development, Environment, and Security
Co-Chairs of Water SectorD. Briane Adams, U.S. Geological Survey
Peter H. Gleick, Pacific Institute for Studies in Development, Environment, and Security
September 2000
This report was supported by the U.S. Department of the Interior through theU.S. Geological Survey (Grant # 98HQAG2118)
Special thanks to David A. Kirtland, U.S. Geological Survey,Department of Interior representative to the National Assessment Working Group
Final Report prepared by:
Pacific Institute for Studies inDevelopment, Environment, and Security
654 13th StreetPreservation Park
Oakland, CA 94612
(510) 251-1600 (phone)(510) 251-2203 (fax)[email protected]
http://www.pacinst.org
ISBN #1-893790-04-5
Printed on recycled paper with a minimum of 30% post consumer waste
Photo Credits: St. Louis Arch and river in flood, St. Louis Post-Dispatch; mountain snow water, State of Alaska,David H. Peterson, U.S. Geological Survey; desert cloud and rain photos, Alan M. Cressler,
U.S. Geological Survey; dam and swamp photos, US Army Corps of Engineers; rainbow, irrigation andwaterfall photos are by Melody Warford, Stone Soup, Inc.
Cover design: Melody Warford, Stone Soup, Inc., www.stonesoupinc.comInterior design: Anna Land, Anna Land Design, www.annalanddesign.com
Participating Agencies
Water: The Potential Consequences of
Climate Variability and Change for the
Water Resources of the United States
The Report of the Water Sector Assessment Teamof the National Assessment of the Potential Consequences of
Climate Variability and Change
For the U.S. Global Change Research Program
This Report was supported by the U.S. Department of the Interior through the
U.S. Geological Survey (Grant # 98HQAG2118)
Lead AuthorPeter H. Gleick, Pacific Institute for Studies in Development, Environment, and Security
Co-Chairs of Water SectorD. Briane Adams, U.S. Geological Survey
Peter H. Gleick, Pacific Institute for Studies in Development, Environment, and Security
Water Sector Assessment TeamD. Briane Adams, U.S. Geological Survey
Antonio J. Busalacchi, Jr. and Ted Engman, National Atmospheric and Space AdministrationKenneth D. Frederick, Resources for the Future
Aris P. Georgakakos, Georgia Institute of TechnologyPeter H. Gleick, Pacific Institute for Studies in Development, Environment, and Security
Bruce P. Hayden, National Science Foundation and the University of VirginiaKatherine L. Jacobs, Arizona Department of Water Resources
Judy L. Meyer, University of GeorgiaMichael J. Sale, Oak Ridge National Laboratory
John C. Schaake, National Oceanic and Atmospheric AdministrationSusan S. Seacrest and Robert Kuzelka, The Groundwater Foundation
Eugene Z. Stakhiv, United States Army Corps of Engineers
Acknowledgements
Water Sector Advisory CommitteeThomas O. Barnwell, U.S. Environmental Protection Agency
Joseph W. Dellapenna, Villanova UniversityDonald R. Glaser, Western Water Policy Review Advisory Commission
Gerald M. Hansler, Delaware River Basin Commission (retired)Blair Henry, The Northwest Council on Climate ChangeSheldon Kamieniecki, University of Southern California
Debra S. Knopman, Center for Innovation and the Environment, Progressive Policy InstituteDennis P. Lettenmaier, University of Washington
Barbara A. Miller, The World BankTimothy L. Miller, U.S. Geological Survey
Norman J. Rosenberg, Pacific Northwest National LaboratoryDavid S. Shriner, U.S. Forest Service
U.S. Geological Survey Analytical TeamLauren C. Hay
Steven W. HostetlerGregory J. McCabe
Paul C. MillyGregory E. SchwarzDavid M. Wolock
Other Acknowledgements and Contributors
Producing this report has required the generous contributions of time and thought of hundreds of individualsand organizations, including scientists, academics, public officials, non-governmental organizations, and membersof the general public, participating in regional and sectoral activities across the country. Without their input,support, comments, and expertise, this assessment would not have been possible. This report has also receivedmany different levels of formal scientific review. Results from hundreds of scientific papers were reviewed andsummarized. More than 40 research papers were peer-reviewed and published as part of the water assessment.Three separate drafts of this report received formal review from the Assessment Team assembled at the beginningof the process, from the Water Sector Advisory Committee, from a group of U.S. Geological Survey scientists,and from the broad water and climate research communities. A formal draft was made available to the publicduring a 30-day review process, later extended to 60 days.
Special thanks are also due to Beth Chalecki of the Pacific Institute for her help with both research andproduction of the report, Justin Wettstein and LaShaunda Malone, who provided coordination through theNational Assessment Coordination Office, Wil Burns of the Pacific Institute, and Christopher L. Lant and theAmerican Water Resources Association, which helped host the mid-project symposium and published researchfindings of the water sector in two special issues of the Journal of the American Water Resources Association.The U.S. Geological Survey was the sponsoring organization for the water sector work, with the specialcontributions of David Kirtland, USGS Advisor to the Water Sector.
Peter H. GleickD. Briane Adams
The Earth’s climate is intrinsic to everything important to society – the production offood and energy, human and ecosystem health, the functioning and characteristics of thehydrologic cycle, and much more. Natural and human-induced changes in the Earth’sclimate will thus have widespread implications for society. The National Assessment ofPotential Consequences of Climate Variability and Change for the United States (“theNational Assessment”) was designed to begin the complex process of assessing how torespond and adapt to an uncertain and changing climate. The National Assessment wascalled for by the 1990 Global Change Research Act (Public Law 101-606) and has beenconducted under a plan approved by the National Science and Technology Council – thecabinet-level body of agencies responsible for scientific research in the U.S. government.
The Global Change Research Act gave voice to early scientific findings that humanactivities were starting to change the global climate:
“(1) Industrial, agricultural, and other human activities, coupled with anexpanding world population, are contributing to processes of globalchange that may significantly alter the Earth habitat within a fewgenerations; (2) Such human-induced changes, in conjunction withnatural fluctuations, may lead to significant global warming and thus alterworld climate patterns and increase global sea levels. Over the nextcentury, these consequences could adversely affect world agricultural andmarine production, coastal habitability, biological diversity, humanhealth, and global economic and social well-being.”
To address these issues, Congress established the U.S. Global Change Research Program(USGCRP) and instructed Federal research agencies to cooperate in developing andcoordinating a “comprehensive and integrated United States research program which willassist the Nation and the world to understand, assess, predict, and respond to human-induced and natural processes of global change.” Further, the Congress mandated thatthe USGCRP
“shall prepare and submit to the President and the Congress an assessmentwhich
1) integrates, evaluates, and interprets the findings of the Programand discusses the scientific uncertainties associated with suchfindings;2) analyzes the effects of global change on the naturalenvironment, agriculture, energy production and use, land andwater resources, transportation, human health and welfare, humansocial systems, and biological diversity; and
About the National Assessment
3) analyzes current trends in global change, both human-inducedand natural, and projects major trends for the subsequent 25 to100 years.”
The USGCRP’s National Assessment of the Potential Consequences of Climate Variabilityand Change is being conducted under the provisions of this Act.
The overall goal of the National Assessment is to analyze and evaluate what is knownabout the potential consequences of climate variability and change for the Nation in thecontext of other pressures on the public, the environment, and the Nation’s resources. Itis also addressing the question about why we should care about, and how we mighteffectively prepare for, climate variability and change. The National Assessment process hasbeen broadly inclusive, drawing on inputs from academia, government, the public andprivate sectors, and interested citizens. Starting with public concerns about theenvironment, the Assessment is exploring the degree to which existing and futurevariations and changes in climate might affect issues that people care about. A short list ofquestions has guided the process as the Assessment has focused closely on regionalconcerns around the U.S. and national concerns for particular sectors:
• What are the current environmental stresses and issues that form the backdrop forpotential additional impacts of climate change?
• How might climate variability and change exacerbate or ameliorate existing problems?What new problems and issues might arise?
• What are the priority research and information needs that can better prepare thepublic and policymakers for reaching informed decisions related to climate variabilityand change? What research is most important to complete over the short term? Overthe long term?
• What coping options exist that can build resilience to current environmental stresses,and also possibly lessen the impacts of climate change?
The National Assessment has three major components:
1. Regional analysis: Regional workshops and assessments are characterizing thepotential consequences of climate variability and change in regions spanning theUnited States. A total of 20 workshops were held around the country, with the NativePeoples/Native Homelands workshops being national in scope rather than regional.Based on the issues identified, 16 of these groups have been supported to prepareassessment reports. The reports from these activities address the issues of most interestto those in the particular regions by focusing on the regional patterns and texture ofchanges where people live. Most workshop reports are already available (see http://www.nacc.usgcrp.gov).
2. Sectoral analysis: Workshops and assessments are also being carried out to characterizethe potential consequences of climate variability and change for major sectors that cutacross environmental, economic, and societal interest. The sectoral studies analyzehow the consequences in each region affect the nation, making these reports national
in scope and of interest to everyone. The sectors being focused on in this first phase ofthe ongoing National Assessment include Agriculture, Forests, Human Health,Coastal Areas and Marine Resources, and in this report, Water. Final sectorassessment reports are now starting to become available.
3. National overview: The National Assessment Synthesis Team has responsibility forproviding a national perspective that summarizes and integrates the findings emergingfrom the regional and sectoral studies and that then draws conclusions about theimportance of the consequences of climate change and variability for the UnitedStates. The draft synthesis report was released for public comment in June 2000 andthe final will be published in the Fall 2000.
Each of the regional, sectoral, and synthesis activities is being led by a team comprised ofexperts from both the public and private sectors, from universities and government, andfrom the spectrum of stakeholder communities. All of the reports are going through anextensive review process involving experts and other interested stakeholders. Theassessment process is supported in a shared manner by the set of USGCRP agencies,including the departments of Agriculture, Commerce (National Oceanic and AtmosphericAdministration), Energy, Health and Human Services, and Interior, plus theEnvironmental Protection Agency, National Aeronautics and Space Administration, andthe National Science Foundation. Through this involvement, the USGCRP is hopefulthat broad understanding of the issue and its importance for the nation will be gained andthat the full range of perspectives about how best to respond will be aired.
Extensive information about the National Assessment, names of participants on thevarious assessment teams and groups, and links to the activities of the various regions andsectors are available over the Web at http://www.nacc.usgcrp.gov or by inquiry to theGlobal Change Research Information Office, PO Box 1000, 61 Route 9W, Palisades, NewYork 10964.
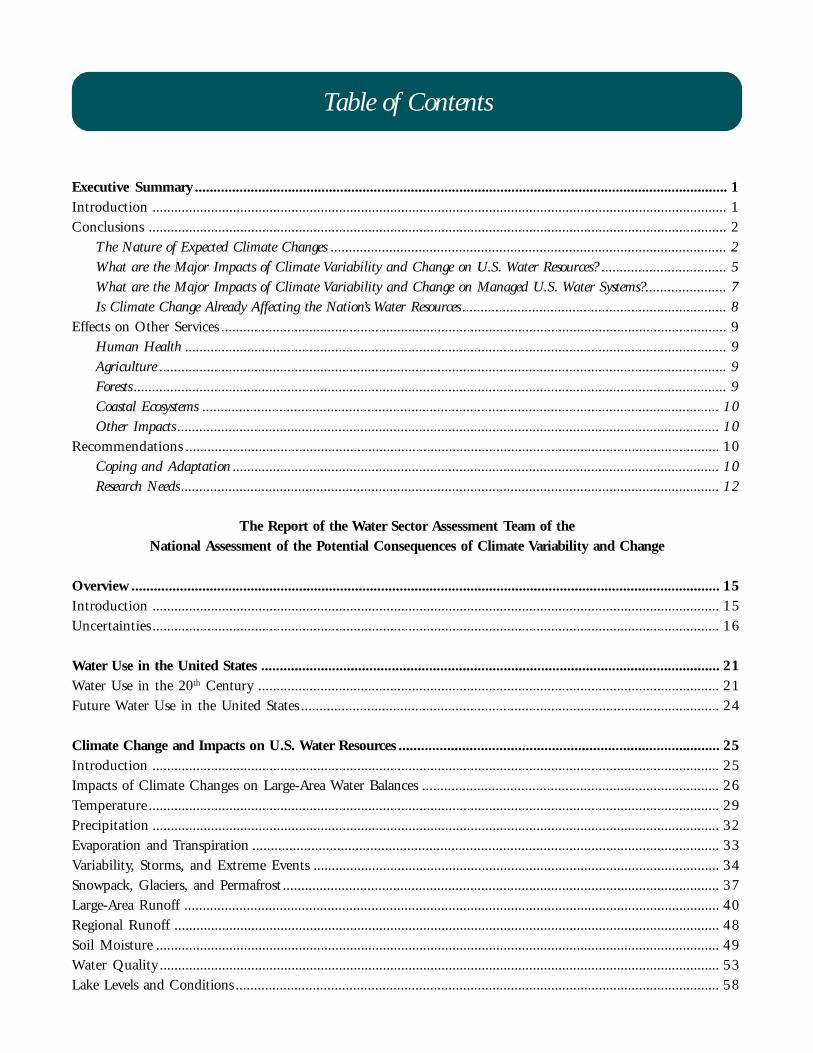
Table of Contents
Executive Summary ............................................................................................................................................... 1Introduction ............................................................................................................................................................. 1Conclusions .............................................................................................................................................................. 2
The Nature of Expected Climate Changes ............................................................................................................ 2What are the Major Impacts of Climate Variability and Change on U.S. Water Resources? .................................. 5What are the Major Impacts of Climate Variability and Change on Managed U.S. Water Systems? ...................... 7Is Climate Change Already Affecting the Nation’s Water Resources ........................................................................ 8
Effects on Other Services .......................................................................................................................................... 9Human Health .................................................................................................................................................... 9Agriculture ........................................................................................................................................................... 9Forests .................................................................................................................................................................. 9Coastal Ecosystems ............................................................................................................................................. 10Other Impacts .................................................................................................................................................... 10
Recommendations .................................................................................................................................................. 10Coping and Adaptation ..................................................................................................................................... 10Research Needs ................................................................................................................................................... 12
The Report of the Water Sector Assessment Team of theNational Assessment of the Potential Consequences of Climate Variability and Change
Overview .............................................................................................................................................................. 15Introduction ........................................................................................................................................................... 15Uncertainties ........................................................................................................................................................... 16
Water Use in the United States ........................................................................................................................... 21Water Use in the 20th Century .............................................................................................................................. 21Future Water Use in the United States .................................................................................................................. 24
Climate Change and Impacts on U.S. Water Resources ...................................................................................... 25Introduction ........................................................................................................................................................... 25Impacts of Climate Changes on Large-Area Water Balances ................................................................................. 26Temperature ............................................................................................................................................................ 29Precipitation ........................................................................................................................................................... 32Evaporation and Transpiration ............................................................................................................................... 33Variability, Storms, and Extreme Events ............................................................................................................... 34Snowpack, Glaciers, and Permafrost ....................................................................................................................... 37Large-Area Runoff .................................................................................................................................................. 40Regional Runoff ..................................................................................................................................................... 48Soil Moisture .......................................................................................................................................................... 49Water Quality ......................................................................................................................................................... 53Lake Levels and Conditions .................................................................................................................................... 58
Groundwater ........................................................................................................................................................... 59Sea Level .................................................................................................................................................................. 60Direct Effects on Ecosystems ................................................................................................................................. 61River Channel and Geomorphology ...................................................................................................................... 67
Is Climate Change Already Affecting the Nation’s Water? Evidence of Hydrologic Trends .............................. 69Introduction ........................................................................................................................................................... 69Temperature and Related Trends ........................................................................................................................... 69Precipitation Trends ............................................................................................................................................... 72Snowpack and Ice Cover Trends ............................................................................................................................. 74Runoff Trends ......................................................................................................................................................... 74Variability and Extreme Events .............................................................................................................................. 77
Climate Change and Impacts on Managed Water-Resource Systems ................................................................. 81Introduction ........................................................................................................................................................... 81Water Supply Infrastructure ................................................................................................................................... 82Hydropower and Thermal Power Generation ........................................................................................................ 85Human Health ....................................................................................................................................................... 88Navigation and Shipping ....................................................................................................................................... 90Agriculture .............................................................................................................................................................. 90Extreme Events ....................................................................................................................................................... 99
Floods ................................................................................................................................................................ 99Droughts .......................................................................................................................................................... 104
Socioeconomic Costs and Benefits of Changes in Water Supply and Demand ................................................ 107
Coping and Adaptation ..................................................................................................................................... 111Water Planning and Management ....................................................................................................................... 113Modifying Operation of Existing Systems .......................................................................................................... 114New Supply Options ........................................................................................................................................... 116Demand Management, Conservation, and Efficiency ......................................................................................... 117Economics, Pricing, and Markets ........................................................................................................................ 118National and State Water Law ............................................................................................................................. 120International Water Management: Legal and Institutional Questions Relating to Climate Change and U.S.Border Regions ..................................................................................................................................................... 121
Research Needs .................................................................................................................................................. 123
Summary ............................................................................................................................................................ 125
References .......................................................................................................................................................... 126
Table of Contents
1
Executive Summary of theWater Sector Report of the National Assessment
Introduction
The water resources of the United States of America,like the water anywhere on the planet, are anintegral part of the global hydrologic cycle.Precipitation originates as evaporation from landand the oceans. Soil moisture is used by plants,which return more moisture to the atmosphere.Water that does not evaporate or transpire or seepinto aquifers runs off to form the nation’s streamsand rivers. Snow stored in winter in the mountainsprovides water for rivers and deltas in the spring andsummer. Storms bring extra moisture; droughtsarise from protracted periods of low rainfall – all aspart of our natural climate.
Over the past century, the United States has built avast and complex infrastructure to provide cleanwater for drinking and for industry, dispose ofwastes, facilitate transportation, generate electricity,irrigate crops, and reduce the risks of floods anddroughts. This infrastructure has broughttremendous benefits, albeit at a substantialeconomic and environmental cost. To the averagecitizen, the nation’s dams, aqueducts, reservoirs,treatment plants, and pipes are largely invisible andtaken for granted. Yet they help insulate us fromwet and dry years and moderate other aspects of ournaturally variable climate. Indeed they havepermitted us to almost forget about our complexdependences on climate. We can no longer ignorethese close connections.
The scientific evidence that humans are changing theclimate is increasingly compelling. Complex impactsaffecting every sector of society, including, especially, thenation’s water resources, now seem unavoidable.
This report summarizes the conclusions of thesubstantial body of literature on the implications ofboth existing climate variability and future climatechange for U.S. water resources. We have identified
nearly 1,000 relevant peer-reviewed studies, andthat number grows larger every day. As a result,this report must be considered just a snapshot intime, a summary of what we think we know, do notknow, and would like to know at the beginning ofthe 21st century. In the coming years, we hope andexpect that our understanding of the impacts ofclimate changes for U.S. water resources willimprove, as will our understanding of the ability ofexisting and new technologies, policies, economictools, and institutions to help us mitigate and adaptto those impacts.
Many uncertainties remain; indeed, we expect thatuncertainties will always remain. The nature andintensity of future greenhouse gas emissions dependupon future decisions of governments andindividuals, the speed of deployment of alternativeenergy systems, population sizes and affluence, andmany more factors. The models that simulate therole of these gases in our atmosphere are imperfect.There are significant limitations in the ability ofclimate models to incorporate and reproduceimportant aspects of the hydrologic cycle. Manyfundamental hydrologic processes, such as theformation and distribution of clouds andprecipitation, occur on a spatial scale smaller thanmost climate models are able to resolve. Regionaldata on water availability and use are often poor.Tools for quantifying many impacts are imperfect, atbest. We thus know much less about how the watercycle will change than we would like in order tomake appropriate decisions about how to plan,manage, and operate water systems.
At the same time, not everything is uncertain. Theresearch done to date tells us many things, bothpositive and negative, about how hydrology andU.S. water resources could be affected by climatevariability and changes. We have learned importantthings about the vulnerability and sensitivity ofwater systems and management rules, and we are
2
exploring the strengths and weaknesses oftechnologies and policies that might help us copewith adverse impacts and take advantage of possiblebeneficial effects.
In many cases and in many locations, there iscompelling scientific evidence that climate changes willpose serious challenges to our water systems. The goodnews is that where climate changes are minor orwhere other factors dominate, the impacts on U.S.water resources may be low. In some regions andfor some issues, climate changes may even reducethe risks and stresses imposed by growingpopulations, industrialization, and land-usechanges. The bad news is that a growing body ofevidence suggests that certain aspects of our waterresources are very sensitive to both climate and tohow we choose to manage our complex watersystems. Making changes in management of thesesystems requires understanding what changes wouldbe most effective and then applying the will anddirection of those responsible. Coping ormitigating other kinds of impacts, even if possible,may prove very costly in dollars, environmentalhealth, and even human lives.We also note that most impacts studies have beendone using information from global climate modelsthat evaluate the effects of increases in greenhousegas concentrations up to particular levels. At thispoint in time, there is no reason to believe thatincreasing concentrations will stop at these levels.Greater and greater impacts would be expected toresult from ever increasing levels of climate change.
It is vital that uncertainties not be used to delay oravoid taking certain kinds of action now. Prudentplanning requires that a strong national climate andwater research program be maintained, thatdecisions about future water planning andmanagement be flexible, and that the risks andbenefits of climate change be incorporated into alllong-term water planning. Rigid, expensive, andirreversible actions in climate-sensitive areas canincrease vulnerability and long-term costs. Watermanagers and policymakers must start consideringclimate change as a factor in all decisions aboutwater investments and the operation of existingfacilities and systems.
A continued reliance solely on current engineeringpractice may lead us to make incorrect – and potentiallydangerous or expensive – decisions. The United Stateshas hundreds of billions of dollars invested in dams,reservoirs, aqueducts, water-treatment facilities, andother concrete structures. These systems weredesigned and for the most part are operatedassuming that future climatic and hydrologicconditions will look like past conditions. We nowknow this is no longer true. Accordingly, two of themost important coping strategies must be to try tounderstand what the consequences of climatechange will be for water resources and to beginplanning for and adapting to those changes.
Conclusions
More than two decades of research into theimplications of climate change for water resourceshave improved our understanding of possibleimpacts and points of vulnerability. Many criticalissues and some clear and consistent results havebeen identified. Taken together, the current state-of-the-science suggests a wide range of concerns thatshould be addressed by national and local watermanagers and planners, climatologists, hydrologists,policymakers, and the public. Many climatechanges are expected. We summarize below some ofthose with the greatest implications for thehydrologic cycle and U.S. water resources, using aconsistent set of terms to denote levels ofconfidence. Sidebar ES-1 lists the common terms ofuncertainty used here.
The Nature of Expected ClimateChanges
• Global-average and U.S.-average surfacetemperatures will continue to increase aboverecent historical levels unless there aresubstantial changes in both U.S. andinternational energy and land-use patterns (veryhigh confidence). As greenhouse-gas emissionscontinue into the future, the size of thesetemperature increases will become larger overtime.
3
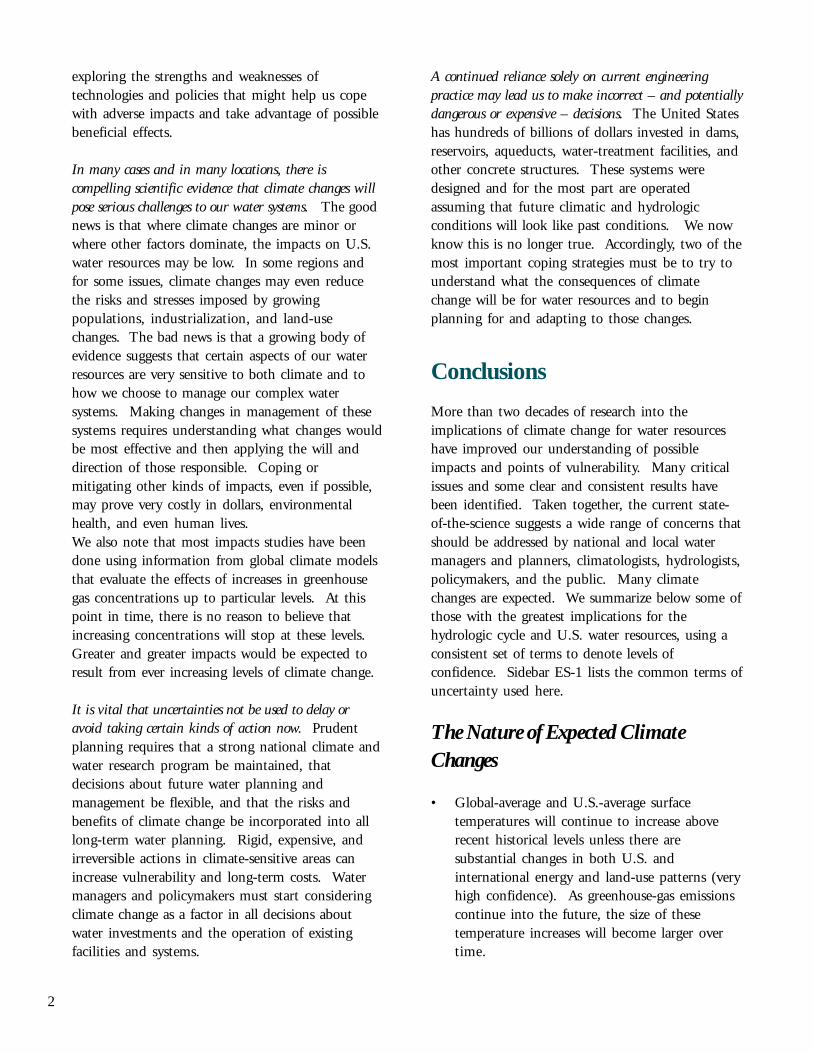
[Sidebar ES-1 HERE, relatively small please]
Sidebar ES-1:Measuring and Reporting Uncertainties
There are many different ways of assessing, defining, and describing uncertainties. Below we list two quantitativeapproaches and two qualitative approaches that have helped guide this assessment. The terms used in the text wereadopted from these scales, but we note that much more work is needed to both reduce the overall uncertainties aboutthe effects of climate change as well as to better describe the uncertainties that will inevitably remain.
Quantitative Scales for Assessing Uncertainties
IPCC Confidence Terms Probability or Confidence LimitVery High Confidence 1.00 to 0.95High Confidence 0.95 to 0.67Medium Confidence 0.67 to 0.33Low Confidence 0.33 to 0.05Very Low Confidence 0.05 to 0.00
Source: Moss and Schneider (1999). Common Language Terms Probability or Confidence LimitVery likely or very probable >90%Likely or probable 67 to 90%Possible 34 to 66%Unlikely or some chance 10 to 33%Little chance or very unlikely < 10%
Source: USGCRP (2000).
Qualitative Scales for Assessing Uncertainties
Qualitative Terms (three levels) High Confidence Wide agreement, multiple findings, high degree of consensus, considerable
evidence Medium Confidence Consensus, fair amount of information, other hypotheses cannot be ruled out
conclusively Low Confidence Lack of consensus, serious competing ideas, limited evidence in support
Source: IPCC (1996b). Qualitative Terms (four levels) Well established Multiple lines of evidence, models consistent with observations Established but incomplete Models incorporate most known processes, one or more lines of evidence,
observations somewhat consistent but incomplete Competing explanations Different models produce different results or incorporate different key processes Speculative Conceptually plausible ideas that have received little attention, or that are laced
with difficult-to-reduce uncertainties
Source: Moss and Schneider (1999).
4
• The regional and seasonal pattern oftemperature increases across the U.S. will vary(very high confidence). Researchers have lowconfidence in estimates of detailed regionaldepartures from these larger-scale changes.
• As atmospheric greenhouse-gas concentrationscontinue to rise, global average precipitationwill increase (very high confidence).
• There will be changes in the timing andregional patterns of precipitation (very highconfidence). Researchers have low confidence inprojections for specific regions because differentmodels produce different detailed regionalresults.
• Temperature increases in mountainous areaswith seasonal snowpack will lead to increases inthe ratio of rain to snow and decreases in thelength of the snow storage season (very highconfidence). It is likely that reductions insnowfall and earlier snowmelt and runoff wouldincrease the probability of flooding early in theyear and reduce the runoff of water during latespring and summer. Basins in the westernUnited States are particularly vulnerable to suchshifts.
• Average precipitation will increase in higherlatitudes, particularly in winter (highconfidence). Models are inconsistent in otherestimates of how the seasonality of precipitationwill change.
• Increases in annual average runoff in the highlatitudes caused by higher precipitation arelikely to occur (high confidence).
• Research results suggest that flood frequenciesin some areas are likely to change. In northernlatitudes and snowmelt-driven basins, researchresults suggest with medium confidence thatflood frequencies will increase, although theamount of increase for any given climatescenario is uncertain and impacts will varyamong basins.
• Research results suggest that droughtfrequencies in some areas are likely to change.The net risks to society from such changes havenot been evaluated and specific projections ofwhere such changes will occur are speculative.Models project that the frequency and severityof droughts in some areas could increase as aresult of regional decreases in total rainfall, morefrequent dry spells, and higher evaporation.Models suggest with equal confidence that thefrequency and severity of droughts in someregions would decrease as a result of regionalincreases in total rainfall and less frequent dryspells.
• Higher sea levels associated with thermalexpansion of the oceans and increased meltingof glaciers will push salt water further inland inrivers, deltas, and coastal aquifers (very highconfidence). It is well understood that suchadvances would adversely affect the quality andquantity of freshwater supplies in many coastalareas.
• Water-quality problems will worsen whererising temperatures are the predominant climatechange (high confidence). Where there arechanges in flow, complex positive and negativechanges in water quality will occur. Specificregional projections are not well-established atthis time because of uncertainties in howregional flows will change.
• Increased atmospheric carbon dioxide will affectthe use of water by vegetation (highconfidence), but hydrologists have lowconfidence in the net effects of this and othercompeting influences. Increasing CO2
concentrations in some circumstances canreduce the rate of transpiration from certainplants. This in turn would tend to increaserunoff since less water is returned directly to theatmosphere by such vegetation, allowing agreater share of precipitation to reach streams oraquifers. Rising CO
2 concentrations can also
increase plant growth, leading to a larger area oftranspiring tissue and a corresponding increasein transpiration.
5
• The southern boundary of continuouspermafrost is projected to shift north by 500kilometers over the next 50 years due towarming projected by GCMs. A 5o C warmingin Alaska would eventually melt virtually all ofthe subarctic permafrost in Alaska (mediumconfidence), which would affect more wetlandarea than currently found in the rest of theUnited States.
• While we note that some climate scenarios canproduce conditions that might reduce stresseson certain ecosystems, experience withecosystem dynamics strongly suggests thatperturbing ecosystems in any direction awayfrom the conditions under which theydeveloped and thrive will have adverse impactson the health of that system. Aquaticecosystems can be highly sensitive tohydroclimatic factors, particularly watertemperature, water quality, the probability ofextreme events, and flow volumes, rates, andtiming. Determining the impacts on particularspecies or ecosystems will require additionalregion-specific, and ecosystem-specific, research.
• Ecologists have high confidence that climatewarming will produce a shift in speciesdistributions northward, with extinctions andextirpations of temperate or cold-water speciesat lower latitudes, and range expansion ofwarm-water and cool-water species into higherlatitudes.
• A growing number of studies suggest thatclimate changes will increase the frequency andintensity of the heaviest precipitation events,but there is little agreement on detailed regionalchanges in storminess that might occur in awarmed world.
• Contradictory results from models support theneed for more research, especially to address themismatch between the resolution of models andthe scales at which extreme events can occur.This issue should be regularly revisited in laterassessments.
What are the Major Impacts ofClimate Variability and Change onU.S. Water Resources?
The current state-of-the-science suggests thatplausible climate changes, projected by generalcirculation models, raise a wide range of concernsthat should be addressed by national and localwater managers and planners, climatologists,hydrologists, policymakers, and the public.
• Detailed estimates of changes in runoff due toclimate change have been produced for theUnited States using regional hydrologic modelsof many specific river basins. In spite of manyremaining uncertainties, model results suggestthat some significant changes in the timing andamount of runoff will result from plausiblechanges in climatic variables (high confidence).
• With few exceptions, we have low confidencethat we can determine specific changes forspecific regions. In the arid and semi-aridwestern United States, it is well established thatrelatively modest changes in precipitation canhave proportionally large impacts on runoff.
• Research indicates that U.S. watersheds with asubstantial snowpack in winter will experiencemajor changes in the timing and intensity ofrunoff as average temperatures rise (very highconfidence). Reductions in spring and summerrunoff, increases in winter runoff, and earlierpeak runoff are all common responses to risingtemperatures. The ability of existing systemsand operating rules to manage these changes hasnot been adequately assessed.
• Research to date suggests that there is a risk ofincreased flooding in parts of the U.S. thatexperience large increases in precipitation(medium confidence). The IntergovernmentalPanel on Climate Change concluded in 1996,and we concur, that: “the flood relatedconsequences of climate change may be asserious and widely distributed as the adverseimpacts of droughts” and “there is more
6
evidence now that flooding is likely to become alarger problem in many temperate regions,requiring adaptations not only to droughts andchronic water shortages, but also to floods andassociated damages, raising concerns about damand levee failure.”
• Non-linear or threshold events are likely tooccur, but are difficult to project. Examplesinclude a fall in lake level that cuts off outflowsor separates a lake into two separate parts, anincrease in flood intensity that passes specificdamage thresholds, and exceedance of water-quality limits.
• Relative sea-level rise adversely affectsgroundwater aquifers and freshwater coastalecosystems (high confidence). Rising sea levelcauses an increase in the intrusion of salt waterinto coastal aquifers. Shallow island aquifers(such as those found in Hawaii, Nantucket,Martha’s Vineyard, and along the southeasternseaboard) together with coastal aquiferssupporting large amounts of human use (suchas those in Long Island, New York, and centralcoastal California) are at greatest risk. Otherimpacts of sea-level rise are likely to includechanges in salinity distribution in estuaries,altered coastal circulation patterns, destructionof transportation infrastructure in low-lyingareas, and increased pressure on coastal leveesystems.
• Climate changes have the potential to alterwater quality significantly by changingtemperatures, flows, runoff rates and timing,and the ability of watersheds to assimilatewastes and pollutants. Global and regionalincreases in air temperature, and the associatedincreases in water temperature, are likely to leadto adverse changes in water quality, even in theabsence of changes in precipitation. Changes inprecipitation can lead to both positive andnegative impacts on water quality. The neteffect on water quality for rivers, lakes, andgroundwater in the future depends not just onhow climate might change but also on a widerange of other human actions.
• Lakes are known to be sensitive to a wide arrayof changes in climate. Even small changes inclimate can produce large changes in lake levelsand salinity. As air temperatures increase, fewerlakes and streams in high-latitude areas willfreeze to the bottom and the number of ice-freedays will increase, leading to increases innutrient cycling and productivity. Other effectsof increased temperature on lakes could includehigher thermal stress for cold-water fish,improved habitat for warm-water fish, increasedproductivity and lower dissolved oxygen, anddegraded water quality.
• The direct effects of climate change onfreshwater ecosystems will be complex,depending on the nature of the change, thesystem affected, and the nature and scope ofintentional interventions by humans. Workacross the United States suggests a wide range ofserious concerns for ecosystems, with changes invegetation patterns, possible extinction ofendemic fish species already close to theirthermal limits, declining area of wetlands withreductions in waterfowl populations, concernsabout stream health, and major habitat loss.
• Researchers express concern for the limitedability of natural ecosystems to adapt or copewith climate changes that occur over a shorttime frame. This limited ability to adapt torapid changes may lead to irreversible impacts,such as extinctions. While some research hasbeen done on these issues, far more is needed.
• Little work has been done on the impacts ofclimate change for specific groundwater basins,or for general groundwater rechargecharacteristics or water quality. Some studiessuggest that some regional groundwater storagevolumes are very sensitive to even modestchanges in available recharge.
7
What are the Major Impacts ofClimate Variability and Change onManaged U.S. Water Systems?
Climate change will affect the availability of waterin the United States, as well as its quality,distribution, and form. Climate change will alsoaffect the complex infrastructure and systems inplace to manage the nation’s water and existingclimate variability. There is a growing literatureabout how different climate changes may affect theinfrastructure and complex systems built to manageU.S. water resources (http://www.pacinst.org/CCBib.html). Research has been conducted onpotential impacts over a wide range of water-systemcharacteristics, including reservoir operations,hydroelectric generation, navigation, and otherconcerns. At the same time, significant knowledgegaps remain and far more research is needed.Priorities and directions for future work should comefrom water managers and planners as well as from themore traditional academic and scientific researchcommunity.
• Large changes in the reliability of water yieldsfrom reservoirs could result from small changes ininflows (high confidence).
• In some watersheds, long-term demand growthwill have a greater impact on system performancethan climate changes. Uncertainties in projectingfuture water demands complicate evaluating therelative effects of these two forces. Overall regionalimpacts will further depend upon the economic,institutional, and structural conditions in anyregion.
• Variability in climate already causes fluctuations inhydroelectric generation. Climate changes thatreduce overall water availability will reduce theproductivity of U.S. hydroelectric facilities.Reliable increases in average flows would increasehydropower production. Changes in the timingof hydroelectric generation can affect the value ofthe energy produced. Specific regional impacts arenot well-established.
• Dynamic management strategies can be effectivein mitigating the adverse impacts of climatechange, but such policies need to be implementedbefore such changes occur to maximize theireffectiveness.
• Climate change will play a role in powerproduction from conventional fossil fuel andnuclear power plants by raising cooling watertemperatures and reducing plant efficiencies(medium confidence). In some circumstances,higher water temperatures will constrain plantoperations.
• Water-borne shipping and navigation are sensitiveto changes in flows, water depth, ice formation,and other climatic factors. A warming wouldincrease the potential length of the shippingseason on some northern lakes and rivers thattypically freeze in winter. Decreases in river flowscould reduce the periods when navigation ispossible, increase transportation costs, or increasethe conflicts over water allocated for otherpurposes. Changes in storm frequency or intensitywould affect Great Lakes navigation. Researchdone to date suggests that the net effects of climatechange may be to increase shipping and navigationcosts in the Great Lakes region (mediumconfidence).
• Research in specific watersheds has shown thatsome major U.S. river basins are so heavilydeveloped, with such complicated overlappingmanagement layers, that their ability to adapt tochanges in climate may be compromised.
All of the physical and ecological impacts of climatechange will entail social and economic costs andbenefits. On top of the uncertainties in evaluatingboth climate change and potential impacts, evaluatingthe economic implications of the diverse impacts isfraught with additional difficulties, and few efforts toquantify them have been made. Ultimately,however, comprehensive efforts to evaluate costs willbe necessary in order to assist policymakers and thepublic in understanding the implications of bothtaking and not taking actions to reduce or adapt tothe impacts of climate change.
8
The socioeconomic impacts of a greenhousewarming look very different depending on whichclimate projections are used, and on the methods andassumptions adopted by the researchers. The resultspublished to date are a valuable guide for futureassessments but policymakers should have lowconfidence in specific quantitative estimates. Someresults are described below:
• Even given the uncertainties, research indicatesthat the possible economic impacts of reductionsin flow could be very large and that some U.S.water systems are highly sensitive to climate.Under some climate scenarios, the additional costsimposed by climate changes are considerablylarger than the additional costs imposed by futurepopulation growth, industrial changes, andchanging agricultural water demands.
• The contrasting hydrologic implications of thetwo climate models used for the NationalAssessment indicate that the direction and size ofmany socioeconomic impacts are uncertain andlikely to vary among regions.
• The upper end of the costs on U.S. water resourcesimposed by climate changes described in somestudies is on the order of 0.5 percent of thenation’s total gross domestic product.
• There are many opportunities to adapt tochanging hydrologic conditions, and the net costsare sensitive to the institutions that determine howwater is managed and allocated among users.
Is Climate Change Already Affectingthe Nation’s Water Resources?
There is a very high degree of confidence in thescientific community that unchecked increases inatmospheric greenhouse-gas concentrations willeventually lead to changes in the Earth’s climate,including the variability of that climate. Despite gapsin data, inadequate and uneven climate and hydrologicmonitoring, short collection periods, and biases ininstrumental records, there is an increasing amount ofevidence that indicates some changes are alreadyoccurring.
The evidence that humans are changing the water cycleof the United States is increasingly compelling. Someof the observed changes with the most relevance forU.S. hydrology and water resources are summarizedhere:
• The United States has, on average, warmed bytwo-thirds of a degree C since 1900 (very highconfidence).
• Permafrost in the Alaskan arctic is beginning tothaw (very high confidence).
• Mean sea level has risen between 10 and 20centimeters since the 1890s (very highconfidence).
• Mountain glaciers are melting at ratesunprecedented in recorded history (highconfidence).
• Arctic ice thickness has declined significantlyfrom levels recorded in the mid-20th century(high confidence). A comparison of thesetrends with model estimates reveals that theobserved decreases are similar to modelprojections and that both trends are muchlarger than would be expected from naturalclimate variability.
• Vegetation is blooming earlier in spring andsummer and continuing to photosynthesizelonger in the fall (medium confidence).
• Snow and ice cover are decreasing and meltingearlier, on average, while total annual snowfallin the far northern latitudes is increasing(medium confidence). Field surveys show thatsnow cover over the Northern Hemisphere landsurface since 1988 has been consistently belowaverages over the last quarter century, with anannual mean decrease in snow cover of about10% over North America. These changes havebeen linked to the observed increases intemperature.
• There is evidence of historical trends of bothincreasing and decreasing precipitation indifferent parts of North America since 1900.
9
Average precipitation over the contiguous U.S.has increased by about 10% since 1910. Theintensity of precipitation has increased for veryheavy and extreme precipitation days. There ismedium confidence in average U.S. results butlow confidence in any particular regionalchanges.
• The timing of runoff in snowmelt-dominatedrivers in the western U.S. appears to bechanging (medium confidence), with a decreasein spring runoff and an increase in winterrunoff. The causes of these changes are notcompletely understood.
Effects on Other Sectors
Five separate sectoral reports have been prepared forthe National Assessment. In addition to this one onwater, work is available on agriculture, humanhealth, coastal ecosystems, and forests (see http://www.nacc.usgcrp.gov). None of the indicatedimpacts on these sectors is independent of whathappens to U.S. water resources and water systems.Yet truly integrated analysis of possible impacts hasnot yet been done. We urge further work on thecombined synergistic effects of climate change onthe United States and we offer below a fewcomments on some critical issues.
Human Health
There are direct and indirect links between wateravailability and quality and human health. Changesin climate will affect the viability of disease vectorslike mosquitoes that carry malaria or dengue fever.The transport of water-borne pathogens such asCryptosporidium is known to be affected by changesin precipitation and runoff intensities and by land-use practices. The distribution of Vibrio cholerae,the bacteria responsible for cholera, is affected byclimate, including El Niño frequency and intensity,temperature, and ocean salinity.
No clear evidence is available yet to conclude howclimate change will ultimately affect these factors orto suggest any climate-related change in the
incidences of these kinds of diseases in the UnitedStates, but we urge more research and carefulmonitoring of water-related disease vectors and data.
Agriculture
Recent studies of U.S. agriculture suggest thatoverall production of food may not be seriouslythreatened by climate changes as currentlyprojected by GCMs. Indeed, in the climatescenarios evaluated for the National Assessment thenet economic effects of changes in agriculture weregenerally positive, although there were substantialregional differences and some regions sufferedproduction declines. The overall results showed adecline in water demand for irrigation, largelybecause of the differential effects of climate changeon productivity of irrigated versus non-irrigatedcrops, and the assumed positive effects on plants ofhigher levels of CO
2. At the same time, there are
serious caveats that accompany the research done todate, including some related to water availabilityand quality. Reliable information on changes instorm frequency and intensity is not yet available.Integration of indirect effects of climate change onhydrology and water into agroclimatic models hasnot yet been widely done, particularly effects ofpests, soil conditions, disease vectors, andsocioeconomic factors. Even less work has evaluatedthe impacts of changes in climate variability foragriculture. Integrating these and other linksbetween water and food should remain a highpriority for researchers.
Forests
Research suggests that climate change can lead todramatic long-term changes in forest health anddistribution. These factors depend partly on howprecipitation and runoff patterns will change. Butchanges in forest conditions will, in turn, havelocally and regionally important effects on runoff,soil erosion, soil salinization, groundwater quality,and more. These effects have not been adequatelyassessed.
10
Coastal Ecosystems
Impacts of climate change on water resources willhave a wide range of consequences for coastalecosystems. Ecosystem health will be affected bychanges in the quality and quantity of freshwaterrunoff into coastal wetlands, higher watertemperatures, extreme runoff rates or altered timing,and the ability of watersheds to assimilate wastesand pollutants. The net effect on coastal systemsdepends not just on how climate might change butalso on a wide range of other human actions,including construction and operation of dams thattrap sediments and nutrients, water withdrawalrates and volumes, disposal of wastes, and more.
Higher average or a greater range of flows of watercould reduce pollutant concentrations or increaseerosion of land surfaces and stream channels,leading to more sediment and greater chemical andnutrient loads in rivers and coastal deltas. Loweraverage flows could reduce dissolved oxygenconcentrations, reduce the dilution of pollutants,reduce erosion, and increase zones with hightemperatures. For almost every source or waterbody, land use and agricultural practices have asignificant impact on water quality. Changes inthese practices, together with technical andregulatory actions to protect water quality, can becritical to future water conditions.
Other Impacts
The impacts of climate change on U.S. waterresources have the potential to affect internationalrelations at the nation’s northern and southernborders, where shared watersheds can lead to localand international political disputes. Internationalagreements covering these shared waters do notinclude provisions for explicitly addressing the risksof climate-induced changes in water availability orquality.
A change in flood risks is one of the potential effectsof climate change with the greatest implications forhuman well-being. Few studies have lookedexplicitly at the implications of climate change forflood frequency, in large part because of the lack of
detailed regional precipitation information fromclimate models and because of the substantialinfluence of both human settlement patterns andwater-management choices on overall flood risk.
Climate change is just one of a number of factorsinfluencing the hydrological system and waterresources of the United States. Population growth,changes in land use, restructuring of the industrialsector, and demands for ecosystem protection andrestoration are all occurring simultaneously.Current laws and policies affecting water use,management, and development are oftencontradictory, inefficient, or unresponsive tochanging conditions. In the absence of explicitefforts to address these issues, the societal costs ofwater problems are likely to rise as competition forwater grows and supply and demand conditionschange.
Recommendations
Coping and Adaptation
There are many opportunities to reduce the risks ofclimate variability and change for U.S. water resources.The nation’s water systems are highly developed andwater managers have a long history of adapting tochanges in supply and demand. Past efforts havebeen focused on minimizing the risks of naturalvariability and maximizing system reliability. Manyof the approaches for effectively dealing with climatechange are little different than the approachesalready available to manage risks associated withexisting variability. Tools for reducing these riskshave traditionally included supply-side options suchas new dams, reservoirs, and pipelines, and morerecently, demand-management options, such asimproving efficiency, modifying demand, alteringwater-use processes, and changing land-use patternsin floodplains. This work is going on largelyindependently of the issue of climate change, but itwill have important implications for the ultimateseverity of climate impacts.
Sole reliance on traditional management responses is amistake: first, climate changes are likely to produce
11
– in some places and at some times – hydrologicconditions and extremes of a different nature thancurrent systems were designed to manage; second,climate changes may produce similar kinds ofvariability but outside of the range for which currentinfrastructure was designed and built; third, relyingsolely on traditional methods assumes that sufficienttime and information will be available before theonset of large or irreversible climate impacts topermit managers to respond appropriately; andfourth, this approach assumes that no special effortsor plans are required to protect against surprises oruncertainties.
The first situation could require that completelynew approaches or technologies be developed. Thesecond could require that efforts above and beyondthose currently planned or anticipated be takenearly. Complacency on the part of water managers,represented by the third and fourth assumptions,may lead to severe impacts that could have bemitigated or prevented by cost-effective actionstaken now.
As a result, we make the following observations andrecommendations:
• Prudent planning requires that a strong nationalclimate and water monitoring and researchprogram should be maintained, that decisionsabout future water planning and management beflexible, and that expensive and irreversible actionsbe avoided in climate-sensitive areas.
• Better methods of planning under climateuncertainty should be developed and applied.
• Governments at all levels should re-evaluate legal,technical, and economic approaches for managingwater resources in the light of potential climatechanges. The federal government should requireall federally owned and operated water systemsto begin assessing both climate impacts and theeffectiveness of different operation andmanagement options.
• Improvements in the efficiency of end uses and theintentional management of water demands mustnow be considered major tools for meeting future
water needs, particularly in water-scarce regionswhere extensive infrastructure already exists. Wenote the IPCC conclusion that “water demandmanagement and institutional adaptation arethe primary components for increasing systemflexibility to meet uncertainties of climatechange.”
• Water managers should begin a systematicreexamination of engineering designs, operatingrules, contingency plans, and water allocationpolicies under a wider range of climate conditionsand extremes than has been used traditionally. Forexample, the standard engineering practice ofdesigning for the worst case in the historicalobservational record may no longer be adequate.
• Cooperation between water agencies and leadingscientific organizations can facilitate the exchangeof information on the state-of-the-art thinkingabout climate change and impacts on waterresources.
• The timely flows of information among thescientific global change community, the public, andthe water-management community are valuable.Such lines of communication need to bedeveloped and expanded.
• Traditional and alternative forms of new supply,already being considered by many water districts,can play a role in addressing changes in bothdemands and supplies caused by climate changesand variability. Options to be consideredinclude wastewater reclamation and reuse, watermarketing and transfers, and even limiteddesalination where less costly alternatives arenot available and where water prices are high.None of these alternatives, however, is likely toalter the trend toward higher water costs.
• Prices and markets are increasingly important forbalancing supply and demand. Because newconstruction and new concrete projects can beexpensive, environmentally damaging, andpolitically controversial, the proper applicationof economics and water management canprovide incentives to use less and produce more.Among the new tools being successfully
12
explored are tiered rates, water banking, andconjunctive use of groundwater.
• Even without climate change, efforts are needed toupdate and improve legal tools for managing andallocating water resources. Water is managed indifferent ways in different places around thecountry, leading to complex and oftenconflicting water laws.
Research Needs
Records of past climate and hydrological conditionsare no longer considered to be reliable guides to thefuture. The design and management of bothstructural and non-structural water-resource systemsshould allow for the possible effects of climatechange, but little professional guidance is availablein this area. Further research by hydrologists, civilengineers, water planners, and water managers isneeded to fill this gap, as is broader training ofscientists in the universities.
• More work is needed to improve the ability ofglobal climate models to provide information onwater-resources availability, to evaluate overallhydrologic impacts, and to identify regionalimpacts.
• Substantial improvements in methods todownscale climate information are needed toimprove our understanding of regional andsmall-scale processes that affect water resourcesand water systems.
• Information about how storm frequency andintensity have changed and will change is vitallyimportant for determining impacts on waterand water systems, yet such information is notreliably available. More research on how theseverity of storms and other extreme hydrologicevents might change is necessary.
• Increased and widespread hydrologicmonitoring systems are needed. The currenttrend in the reduction of monitoring networksis disturbing.
• There should be a systematic reexamination ofengineering design criteria and operating rulesof existing dams and reservoirs under conditionsof climate change.
• Information on economic sectors mostsusceptible to climate change is extremely weak,as is information on the socioeconomic costs ofboth impacts and responses in the water sector.
• More work is needed to evaluate the relativecosts and benefits of non-structuralmanagement options, such as demandmanagement and water-use efficiency, orprohibition on new floodplain development, inthe context of a changing climate.
• Research is needed on the implications ofclimate change for international water law, U.S.treaties and agreements with Mexico andCanada, and international trade in water. Can“privatization” affect vulnerability of watersystems to climate change?
• Little information is available on how climatechanges might affect groundwater aquifers,including quality, recharge rates, and flowdynamics. New studies on these issues areneeded.
• The legal allocation of water rights should bereviewed, even in the absence of climate change,to address inequities, environmental justiceconcerns, and inefficient use of water. The risksof climate change make such a review even moreurgent.
13
Key Messages for Water Managers, Planners,and Interested Members of the Public
Climate is not static and assumptions made about the future based on the climate of the past maybe inappropriate. Assumptions about the probability, frequency, and severity of extreme events usedfor planning should be carefully re-evaluated.
Climate changes will be imposed on top of current and future non-climate stresses. In some cases,these changes will be larger than those expected from population growth, land-use changes,economic growth, and other non-climate factors.
Certain threshold events may become more probable and non-linear changes and surprises should beanticipated, even if they cannot be predicted.
The time lags between identifying the nature of the problems, understanding them, prescribingremedies, and implementing them are long. Waiting for relative certainty about the nature ofclimate change before taking actions to reduce climate-change related risks may prove far morecostly than taking certain pro-active management and planning steps now. Methods must be usedthat explicitly incorporate uncertainty into the decision process.
While some kinds of actions should be taken now, expensive and long-lived new infrastructureshould be postponed until adequate information on future climate is available. If postponement isnot possible, a wider range of climate variability than provided by the historical record should befactored into infrastructure design.
14
Water: The Potential Consequences of
Climate Variability and Change for the
Water Resources of the United States
The Report of the Water Sector Assessment Teamof the National Assessment of the Potential Consequences of
Climate Variability and Change
15
Overview
Introduction
Clean and adequate fresh water is critical to the welfare of the United States. It is afundamental component of the natural ecosystems upon which we all depend, vital forhuman health and industrial production, used directly and indirectly to generate energy,an important part of our transportation system, the basis for extensive outdoor recreation,and a medium for disposing of wastes. The natural variability of the hydrologic cycle isalso important to society: large socioeconomic costs are associated with both too much andtoo little water. The nation’s water resources, in turn, are dependent on the climate.
As a nation, the United States is relatively water rich. Total precipitation averages nearly750 millimeters per year over the surface of the country. Much of this precipitationquickly evaporates back into the atmosphere, but the remainder provides a renewablesupply of surface water and groundwater that is nearly twenty times larger than currentconsumptive use (Shiklomanov 2000). The vast amounts of water stored in lakes,reservoirs, and groundwater aquifers provide reliable, high-quality supplies for much of thenation’s population.
However, a fundamental characteristic of the natural water cycle is that average figureshide important regional and temporal variations. We get water in places and at times it isnot needed, while other regions may need water and not get it. Despite its averageabundance and renewability, fresh water can be a scarce resource almost anywhere in theUnited States, particularly west of the 100th meridian. It can also be present in too muchabundance, causing floods that kill or injure large numbers of people and destroyproperty. The last drought in the northeastern U.S., followed by the worst flooding everseen along portions of the eastern seaboard, associated with the 1999 hurricane season, arejust recent manifestations of how variability in existing climate conditions affects both ourwater systems and society as a whole.
The major concerns of water managers and planners in the past have been how to meetthe demands of a growing and increasingly affluent population and how to handle bothfloods and droughts. Over the past few decades, these concerns have been furthercomplicated by the growing understanding that human water use must be balanced withthe need to sustain a healthy natural environment and restore ecosystems degraded ordestroyed by past water policy decisions. Even more recently, the scientific communityhas become aware of the likelihood that human-induced climate changes will occur, with awide variety of implications for human-built and natural water systems.
Experience with historical climatological and hydrological conditions plays a major role indetermining current water-use patterns and the infrastructure and institutions we haveput in place to regulate and allocate supplies. Even today, the design and evaluation ofalternative water investments and management strategies assume that future precipitationand runoff can be adequately described by assuming the future will continue to look likethe past. The increasing likelihood that a human-induced greenhouse warming will affect
16
the variability and availability of water quality and supplies as well as the demand forwater raises doubts about this assumption and about the most appropriate water policiesfor the future.
The Water Sector report addresses the impacts of climate changes and variability for thewater resources and water systems of the United States. It also begins to explore impactson water-management infrastructure, the nature of water supply and demand, and thetechnical, economical, and institutional mechanisms for adapting to climate variabilityand changes that may occur. Despite many remaining uncertainties, no one can claimthat this subject is unexplored. As early as 1975, the U.S. National Academy of Sciences(NAS) published a Program for Action, acknowledging the possibility that humans couldinfluence global climate and calling for a strong national research program (NationalAcademy of Sciences 1975). In 1979, the United States Senate held a symposium onclimate change, which included discussions of possible impacts on the nation (U.S. Senate1979). In 1983, the NAS published a report on climate change with an overview of issuesrelated to water resources in the western United States (Revelle and Waggoner 1983).
Since then, our understanding has expanded enormously. As part of the NationalAssessment Water Sector efforts, a comprehensive bibliography about the impacts ofclimate change on U.S. water resources was prepared. This bibliography now containsover 920 papers and more are being added regularly. The bibliography itself is availableonline in a searchable form and is updated regularly (http://www.pacinst.org/CCBib.html).
Assessing the impacts of climate changes cannot be a static activity – new information isconstantly being made available, new methods and models are being developed andtested, and policies related to water management and planning are dynamic and changing.This report must therefore be considered a snapshot in time, a summary of what we thinkwe know, do not know, and would like to know about climate and water at the verybeginning of the 21st century. In the coming years, we hope and expect that ourunderstanding of the implications of climate changes for U.S. water resources, as well asour possible responses to those impacts, will improve and advance.
Uncertainties
Making accurate projections of the future is fraught with problems and difficulties.Uncertainties pervade all levels of climate impact assessment. Compounding the vastuncertainties associated with naturally stochastic systems like the Earth’s atmosphere andhydrologic cycle are complicating human factors ranging from rates of population growth tothe speed and scope of technological innovation and the flexibility and changeability of humaninstitutions and policies. Trying to project the future behavior of the Earth’s climate asgreenhouse gas concentrations in the atmosphere increase imposes even more complexities anduncertainties.
One of the major challenges of every aspect of the National Assessment is to present balancedand up-to-date information on the impacts of climate change and response options, while theextent of our knowledge is continuously evolving. Decision-makers must weigh their potentialactions and responses to the risks of climate change before all the uncertainties can be resolved
17
Uncertainties– indeed, all the uncertainties will never be resolved because of the nature of the problem. As aresult, imperfect information must be synthesized, evaluated, and presented in a transparentand appropriate way.
There are many possible ways of describing the state of the science, but there are no universallyaccepted standards for defining uncertainties in the many different stages of climate impactassessment. A few documents offering guidance are available (see, for example, Carter et al.1994, IPCC 1996a, Moss and Schneider 1997, 1999, USGCRP 2000). Uncertainty canrange from a lack of absolute sureness to speculation or informed guesses. Some forms can bequantified; others must remain qualitative. Such uncertainties are not unique to the problemof climate change. Scientists doing fieldwork or working in laboratories must deal with naturalvariability, statistical variation, measurement error, and subjective judgment. The science ofclimate change involves even worse complexities having to do with the global and regionalscales of impacts, the long time periods involved, and the impossibility of reproducing large-scale climate conditions in a testable, laboratory situation. Yet the issue of climate change isnot a purely scientific one: it also involves socioeconomic factors and public policy questionsthat further complicate assessment.
Once any given climate scenario is developed, translating climate conditions into hydrologicalconditions can be done using a variety of methods, each with advantages and disadvantages.Hydrologic modelers have developed a wide range of computer models at many different spatialand temporal scales capable of using climate data to project runoff, water conditions, reservoirbehavior, or other variables of interest. Translating new hydrologic conditions into impacts alsoentails uncertainties. These tend to result from assumptions used, data limitations, andsocioeconomic factors, though there are also problems with water-management and operationsmodels themselves. Finally, additional important uncertainties are imposed by the inability toknow how future demographics, economics, and social preferences will change over the comingdecades, or how water managers might respond to those changes. Because of all of thesefactors, it is unlikely that we will ever be able to foresee all of the kinds of impacts likely toresult before they actually occur, and it is unlikely that all of our best estimates will be accurate.
Acknowledging the many uncertainties involved is vital. At the same time, we note that noteverything is uncertain: indeed, our understanding of the nature and magnitude of thepotential impacts of climate change on U.S. water resources is improving every day. It is vital,therefore, that uncertainties not be used as an excuse to delay or avoid taking certain kinds ofaction now. Prudent planning requires that a strong national climate and water researchprogram be maintained, that decisions about future water planning and management beflexible, and that the risks and benefits of climate change be incorporated into all long-termwater planning. Rigid, expensive, and irreversible actions in climate-sensitive areas can increasevulnerability and long-term costs. More than two decades of serious research into theimplications of climate change for water resources has improved our understanding of possibleimpacts, points of vulnerability, and critical issues, and some clear and consistent results havebeen identified. Taken all together, the current state-of-the-science suggests a wide range ofconcerns that should be addressed by national and local water managers and planners,climatologists, hydrologists, policymakers, and the public.
Sidebar 1 summarizes some of the uncertainties associated with each stage in the Water Sectorassessment. The greatest uncertainties generally arise in the initial climate scenarios because ofthe difficulty of knowing how the driving forces affecting the global climate system will change.
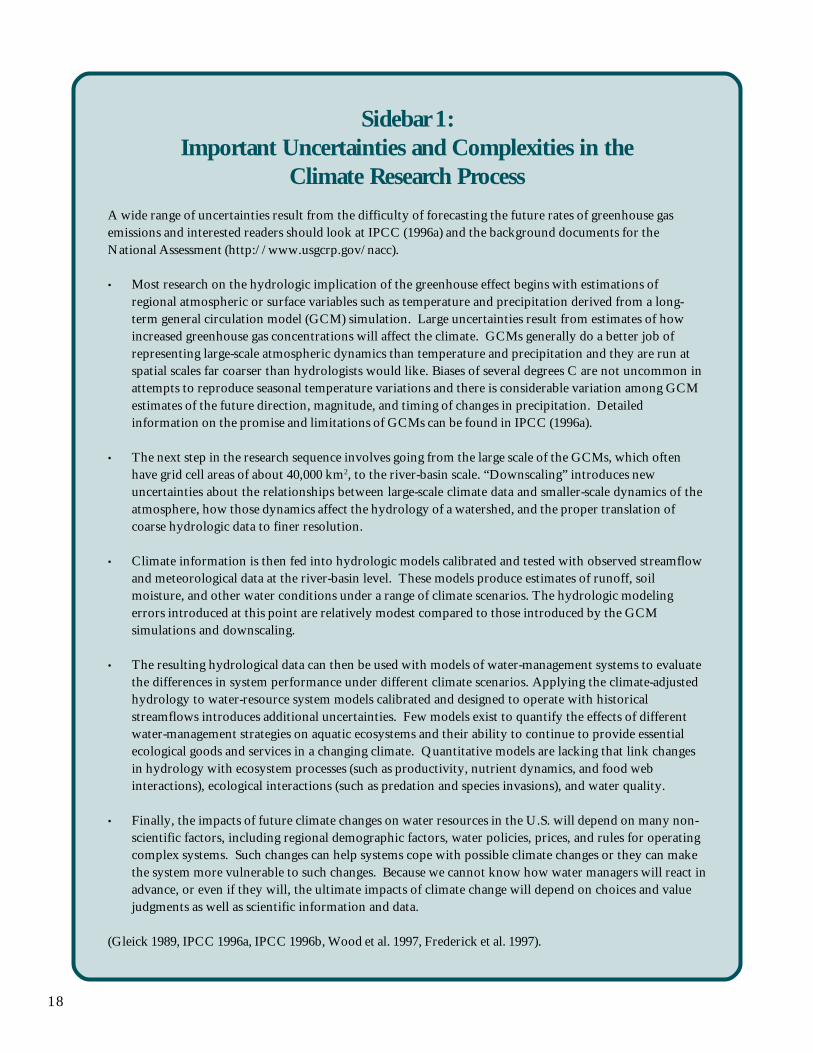
18
Sidebar 1:Important Uncertainties and Complexities in the
Climate Research Process
A wide range of uncertainties result from the difficulty of forecasting the future rates of greenhouse gasemissions and interested readers should look at IPCC (1996a) and the background documents for theNational Assessment (http://www.usgcrp.gov/nacc).
• Most research on the hydrologic implication of the greenhouse effect begins with estimations ofregional atmospheric or surface variables such as temperature and precipitation derived from a long-term general circulation model (GCM) simulation. Large uncertainties result from estimates of howincreased greenhouse gas concentrations will affect the climate. GCMs generally do a better job ofrepresenting large-scale atmospheric dynamics than temperature and precipitation and they are run atspatial scales far coarser than hydrologists would like. Biases of several degrees C are not uncommon inattempts to reproduce seasonal temperature variations and there is considerable variation among GCMestimates of the future direction, magnitude, and timing of changes in precipitation. Detailedinformation on the promise and limitations of GCMs can be found in IPCC (1996a).
• The next step in the research sequence involves going from the large scale of the GCMs, which oftenhave grid cell areas of about 40,000 km2, to the river-basin scale. “Downscaling” introduces newuncertainties about the relationships between large-scale climate data and smaller-scale dynamics of theatmosphere, how those dynamics affect the hydrology of a watershed, and the proper translation ofcoarse hydrologic data to finer resolution.
• Climate information is then fed into hydrologic models calibrated and tested with observed streamflowand meteorological data at the river-basin level. These models produce estimates of runoff, soilmoisture, and other water conditions under a range of climate scenarios. The hydrologic modelingerrors introduced at this point are relatively modest compared to those introduced by the GCMsimulations and downscaling.
• The resulting hydrological data can then be used with models of water-management systems to evaluatethe differences in system performance under different climate scenarios. Applying the climate-adjustedhydrology to water-resource system models calibrated and designed to operate with historicalstreamflows introduces additional uncertainties. Few models exist to quantify the effects of differentwater-management strategies on aquatic ecosystems and their ability to continue to provide essentialecological goods and services in a changing climate. Quantitative models are lacking that link changesin hydrology with ecosystem processes (such as productivity, nutrient dynamics, and food webinteractions), ecological interactions (such as predation and species invasions), and water quality.
• Finally, the impacts of future climate changes on water resources in the U.S. will depend on many non-scientific factors, including regional demographic factors, water policies, prices, and rules for operatingcomplex systems. Such changes can help systems cope with possible climate changes or they can makethe system more vulnerable to such changes. Because we cannot know how water managers will react inadvance, or even if they will, the ultimate impacts of climate change will depend on choices and valuejudgments as well as scientific information and data.
(Gleick 1989, IPCC 1996a, IPCC 1996b, Wood et al. 1997, Frederick et al. 1997).
19
For example, the nature and intensity of future greenhouse gas emissions depend upon futuredecisions of governments and individuals, the development of alternative energy technologies,population sizes, the distribution of wealth, and many more factors. Even if we could reliablydetermine atmospheric gas concentrations over time, converting these conditions into climatechanges involves modeling some of the most complex geophysical behaviors on Earth.Additional uncertainties appear in each subsequent stage as well.
We note when findings in this report depend on a particular climate scenario. Confidence insuch findings is evaluated assuming that the hypothesized change in climate actually occurs.Interested readers are directed to the comprehensive discussions of these issues in the IPCCreports (IPCC 1996a,b,c) and in the other reports of the National Assessment.
In order to be as explicit as possible about uncertainties, efforts have been made to clarify anddefine terms. Carter et al. (1994) recommends the use of confidence limits where possible,including upper and lower estimates of an outcome with a mean or median outcome used as a“best” or “ central” estimate. They also note, however, the difficulty of quantifying most kindsof uncertainty in impacts assessments. The National Assessment Synthesis Team adopted somecommon language terms and applied them to quantitative ranges of probability of impacts(USGCRP 2000). A comparable set of terms and quantitative ranges from the IPCC areavailable (IPCCa) (These terms are shown in Tables 1 and 2.) When only qualitative measuresare available we refer to two sets of terms used by the IPCC (IPCC 1996b, Moss and Schneider1997, 1999). These sets, using slightly different language and probabilities, are presented inTables 3 and 4 (IPCC 1996a, Moss and Schneider 1999). Both qualitative scales, which relyon expert judgment, are used here when deemed appropriate by the authors.
For the major findings described in this study we have tried to identify the most importantfactors and uncertainties likely to affect the conclusions. When quantitative measures ofprecision are available, we try to note them. When quantitative measures are not available, aqualitative approach is applied similar to that adopted by Working Group II (Impacts) of theIntergovernmental Panel on Climate Change. In this summary the terms “will,” “would,” and“likely” are used to characterize consequences of climate change when findings are well-established or established but incomplete. When consequences are not well-established,speculative, or subject to competing explanations, we try to use the terms “could,” “may,” or“might.” Readers of this report will note that detailed information on uncertainties becomesless frequent in the later sections. This kind of information is often not provided for the morescience-based analyses and it is even harder to find measures of uncertainty for socioeconomicor ecological assessments.
More work defining “uncertainty” would help future assessments. For example, a form ofuncertainty assessment and risk analysis – decision analysis – can be used to evaluate the valueof different water-management response strategies to climate change. Decision analysis assignslikelihoods to different scenarios, identifying those responses that would provide the least-costflexibility needed to reduce the anticipated range of impacts (see, for example, Fiering andRogers 1989, Haimes and Li 1991, Carter et al. 1994). These and other approaches areworthy of more discussion and analysis.
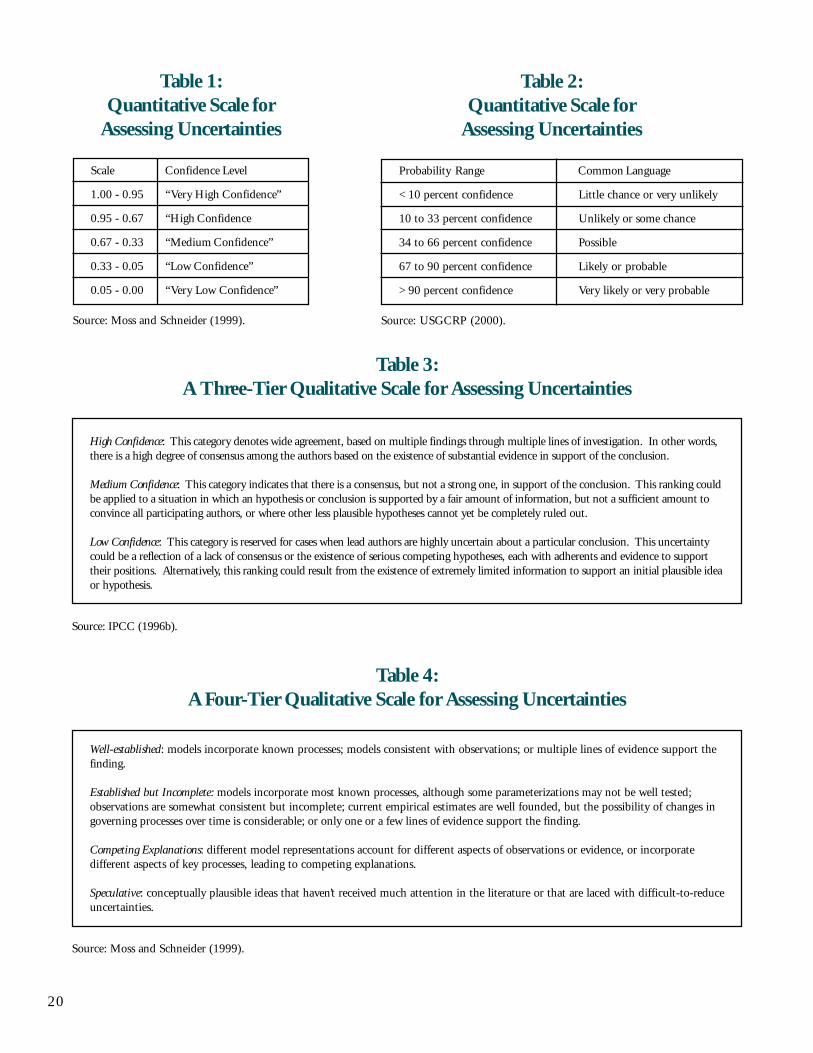
20
Table 2:Quantitative Scale for
Assessing Uncertainties
Probability Range Common Language
< 10 percent confidence Little chance or very unlikely
10 to 33 percent confidence Unlikely or some chance
34 to 66 percent confidence Possible
67 to 90 percent confidence Likely or probable
> 90 percent confidence Very likely or very probable
Source: USGCRP (2000).
Table 1:Quantitative Scale for
Assessing Uncertainties
Scale Confidence Level
1.00 - 0.95 “Very High Confidence”
0.95 - 0.67 “High Confidence
0.67 - 0.33 “Medium Confidence”
0.33 - 0.05 “Low Confidence”
0.05 - 0.00 “Very Low Confidence”
Source: Moss and Schneider (1999).
Table 3:A Three-Tier Qualitative Scale for Assessing Uncertainties
High Confidence: This category denotes wide agreement, based on multiple findings through multiple lines of investigation. In other words,there is a high degree of consensus among the authors based on the existence of substantial evidence in support of the conclusion.
Medium Confidence: This category indicates that there is a consensus, but not a strong one, in support of the conclusion. This ranking couldbe applied to a situation in which an hypothesis or conclusion is supported by a fair amount of information, but not a sufficient amount toconvince all participating authors, or where other less plausible hypotheses cannot yet be completely ruled out.
Low Confidence: This category is reserved for cases when lead authors are highly uncertain about a particular conclusion. This uncertaintycould be a reflection of a lack of consensus or the existence of serious competing hypotheses, each with adherents and evidence to supporttheir positions. Alternatively, this ranking could result from the existence of extremely limited information to support an initial plausible ideaor hypothesis.
Source: IPCC (1996b).
Table 4:A Four-Tier Qualitative Scale for Assessing Uncertainties
Well-established: models incorporate known processes; models consistent with observations; or multiple lines of evidence support thefinding.
Established but Incomplete: models incorporate most known processes, although some parameterizations may not be well tested;observations are somewhat consistent but incomplete; current empirical estimates are well founded, but the possibility of changes ingoverning processes over time is considerable; or only one or a few lines of evidence support the finding.
Competing Explanations: different model representations account for different aspects of observations or evidence, or incorporatedifferent aspects of key processes, leading to competing explanations.
Speculative: conceptually plausible ideas that haven’t received much attention in the literature or that are laced with difficult-to-reduceuncertainties.
Source: Moss and Schneider (1999).
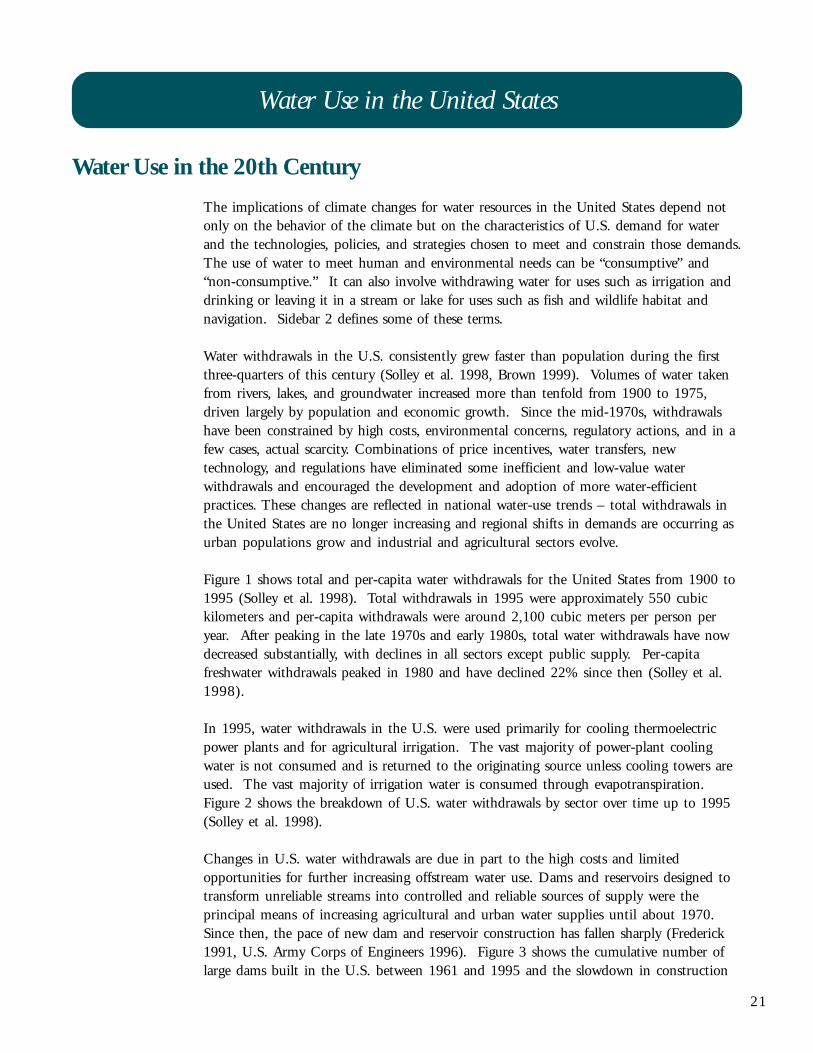
21
Water Use in the United States
Water Use in the 20th Century
The implications of climate changes for water resources in the United States depend notonly on the behavior of the climate but on the characteristics of U.S. demand for waterand the technologies, policies, and strategies chosen to meet and constrain those demands.The use of water to meet human and environmental needs can be “consumptive” and“non-consumptive.” It can also involve withdrawing water for uses such as irrigation anddrinking or leaving it in a stream or lake for uses such as fish and wildlife habitat andnavigation. Sidebar 2 defines some of these terms.
Water withdrawals in the U.S. consistently grew faster than population during the firstthree-quarters of this century (Solley et al. 1998, Brown 1999). Volumes of water takenfrom rivers, lakes, and groundwater increased more than tenfold from 1900 to 1975,driven largely by population and economic growth. Since the mid-1970s, withdrawalshave been constrained by high costs, environmental concerns, regulatory actions, and in afew cases, actual scarcity. Combinations of price incentives, water transfers, newtechnology, and regulations have eliminated some inefficient and low-value waterwithdrawals and encouraged the development and adoption of more water-efficientpractices. These changes are reflected in national water-use trends – total withdrawals inthe United States are no longer increasing and regional shifts in demands are occurring asurban populations grow and industrial and agricultural sectors evolve.
Figure 1 shows total and per-capita water withdrawals for the United States from 1900 to1995 (Solley et al. 1998). Total withdrawals in 1995 were approximately 550 cubickilometers and per-capita withdrawals were around 2,100 cubic meters per person peryear. After peaking in the late 1970s and early 1980s, total water withdrawals have nowdecreased substantially, with declines in all sectors except public supply. Per-capitafreshwater withdrawals peaked in 1980 and have declined 22% since then (Solley et al.1998).
In 1995, water withdrawals in the U.S. were used primarily for cooling thermoelectricpower plants and for agricultural irrigation. The vast majority of power-plant coolingwater is not consumed and is returned to the originating source unless cooling towers areused. The vast majority of irrigation water is consumed through evapotranspiration.Figure 2 shows the breakdown of U.S. water withdrawals by sector over time up to 1995(Solley et al. 1998).
Changes in U.S. water withdrawals are due in part to the high costs and limitedopportunities for further increasing offstream water use. Dams and reservoirs designed totransform unreliable streams into controlled and reliable sources of supply were theprincipal means of increasing agricultural and urban water supplies until about 1970.Since then, the pace of new dam and reservoir construction has fallen sharply (Frederick1991, U.S. Army Corps of Engineers 1996). Figure 3 shows the cumulative number oflarge dams built in the U.S. between 1961 and 1995 and the slowdown in construction
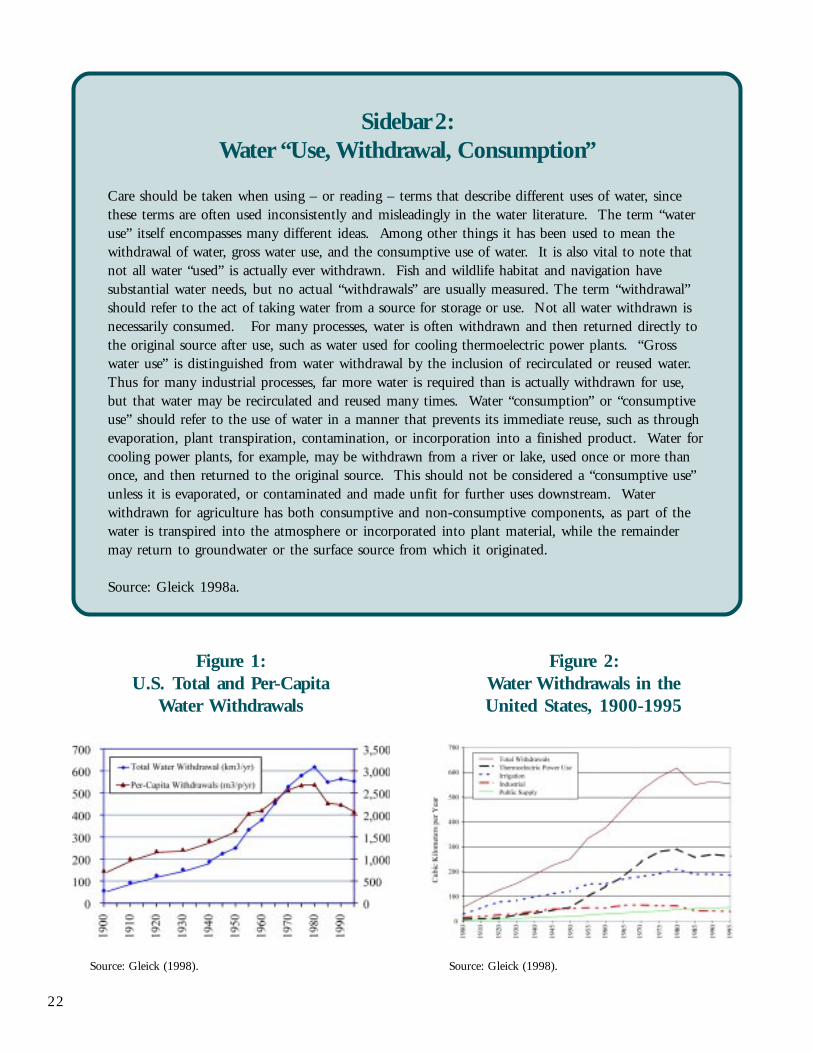
22
Sidebar 2:Water “Use, Withdrawal, Consumption”
Care should be taken when using – or reading – terms that describe different uses of water, sincethese terms are often used inconsistently and misleadingly in the water literature. The term “wateruse” itself encompasses many different ideas. Among other things it has been used to mean thewithdrawal of water, gross water use, and the consumptive use of water. It is also vital to note thatnot all water “used” is actually ever withdrawn. Fish and wildlife habitat and navigation havesubstantial water needs, but no actual “withdrawals” are usually measured. The term “withdrawal”should refer to the act of taking water from a source for storage or use. Not all water withdrawn isnecessarily consumed. For many processes, water is often withdrawn and then returned directly tothe original source after use, such as water used for cooling thermoelectric power plants. “Grosswater use” is distinguished from water withdrawal by the inclusion of recirculated or reused water.Thus for many industrial processes, far more water is required than is actually withdrawn for use,but that water may be recirculated and reused many times. Water “consumption” or “consumptiveuse” should refer to the use of water in a manner that prevents its immediate reuse, such as throughevaporation, plant transpiration, contamination, or incorporation into a finished product. Water forcooling power plants, for example, may be withdrawn from a river or lake, used once or more thanonce, and then returned to the original source. This should not be considered a “consumptive use”unless it is evaporated, or contaminated and made unfit for further uses downstream. Waterwithdrawn for agriculture has both consumptive and non-consumptive components, as part of thewater is transpired into the atmosphere or incorporated into plant material, while the remaindermay return to groundwater or the surface source from which it originated.
Source: Gleick 1998a.
Figure 1:U.S. Total and Per-Capita
Water Withdrawals
Figure 2:Water Withdrawals in theUnited States, 1900-1995
Source: Gleick (1998). Source: Gleick (1998).
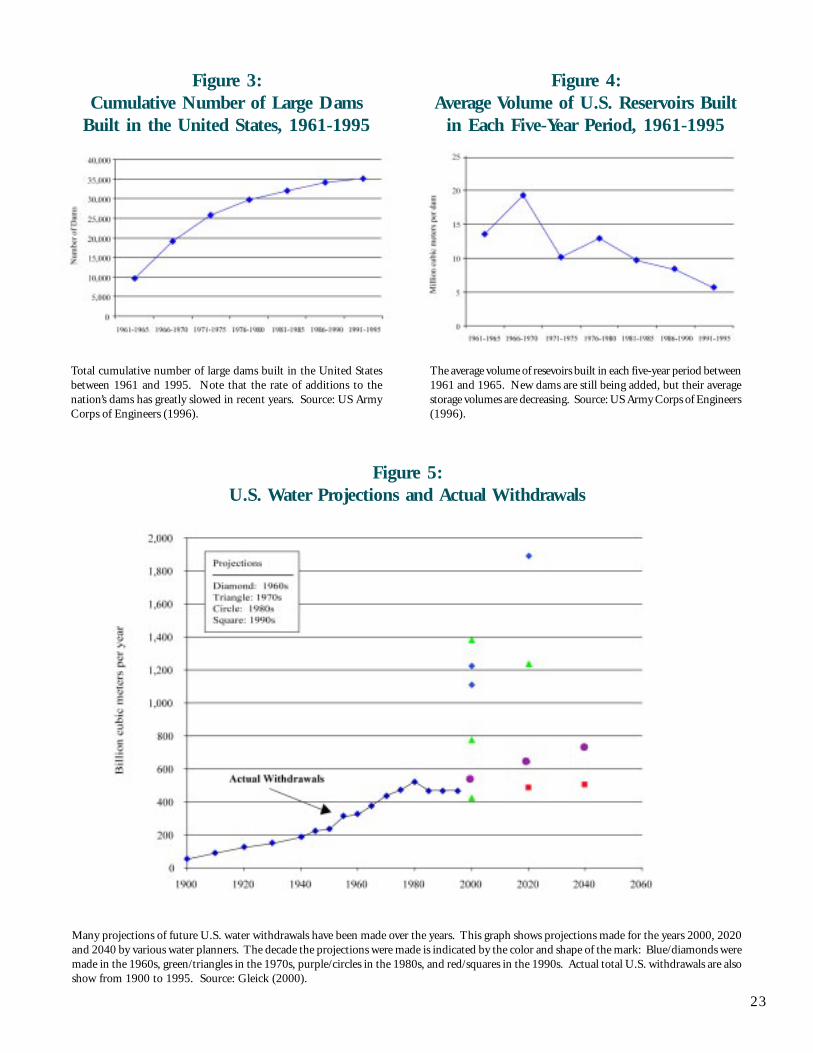
23
Figure 3:Cumulative Number of Large Dams
Built in the United States, 1961-1995
Total cumulative number of large dams built in the United Statesbetween 1961 and 1995. Note that the rate of additions to thenation’s dams has greatly slowed in recent years. Source: US ArmyCorps of Engineers (1996).
Figure 4:Average Volume of U.S. Reservoirs Built
in Each Five-Year Period, 1961-1995
The average volume of resevoirs built in each five-year period between1961 and 1965. New dams are still being added, but their averagestorage volumes are decreasing. Source: US Army Corps of Engineers(1996).
Figure 5:U.S. Water Projections and Actual Withdrawals
Many projections of future U.S. water withdrawals have been made over the years. This graph shows projections made for the years 2000, 2020and 2040 by various water planners. The decade the projections were made is indicated by the color and shape of the mark: Blue/diamonds weremade in the 1960s, green/triangles in the 1970s, purple/circles in the 1980s, and red/squares in the 1990s. Actual total U.S. withdrawals are alsoshow from 1900 to 1995. Source: Gleick (2000).
24
in recent decades. Figure 4 shows the decline in the average volume of reservoirs built ineach five-year period since 1960 (U.S. Army Corps of Engineers 1996).
Proposed large new dam projects are often characterized by high economic costs, diminishingreturns in their ability to increase the amount of water a system can reliably provide, andserious environmental and social concerns. These obstacles to dam construction are likely tomount in the future for several reasons. Since the best sites for storing water within a basin aretypically the first to be developed, subsequent increases in storage require ever-largerinvestments of resources. There are also diminishing returns in the additional water that can beproduced by successive increases in reservoir capacity within a basin. The social and ecologicalcosts of storing and diverting water increase as the number of free-flowing streams declines andsociety attaches more value to water left in a stream (Frederick 1991, 1993, Gleick 1998b).
Future Water Use in the United States
A variety of projections of future water withdrawals in the United States (and worldwide)have been made over the past 50 years. With very few exceptions, these projections haveoverestimated, often substantially, the rates of increase in water withdrawals thateventually occurred. Figure 5 shows 12 such projections made for the years 2000, 2020,and 2040. Prior to 1980, when U.S. water withdrawals began suddenly to level off andeven decline, projections assumed continued exponential increases in water withdrawals.Even after 1980, as population projections dropped and per-capita use declined, straight-lineor exponential increases were often forecast for the future. Yet current water withdrawals arenow one-half or even one-third of what they were expected to be using traditional forecastingapproaches.
As part of the U.S. Forest Service’s periodic assessment of long-term resource supply anddemand conditions, Brown (1999) has made a new set of water-use projections out to the year2040 for the 20 U.S. water-resource regions and for six water-use categories – livestock;domestic and public; industrial, commercial, and mining; thermoelectric power; irrigation; andhydroelectric power. Brown’s projections are based on estimates of future population andincome provided by the Bureau of the Census and Bureau of Economic Analysis and onassumptions about rates of change in other factors affecting water use. The projections reflectregional variations in water scarcity in the absence of climate change and some anticipatedimprovements in water-use efficiency encouraged by rising water costs. Under the middlepopulation growth projection, total water withdrawals increase only seven percent by the year2040 despite a 41% increase in population. The implied reduction in per-capita withdrawals islargely attributable to three factors: continued improvements in water-use efficiency inmunicipal, industrial, and thermoelectric uses; small increases in overall irrigated area; and arelative geographic shift in irrigation from the western to eastern U.S. where less water isapplied per acre (Brown 1999). Even these relatively modest increases in withdrawals implygrowing pressures on instream flows, especially if current groundwater overpumping is reducedto sustainable levels.
Making projections is inherently difficult, but in some regions the trend toward greaterefficiency, wastewater reuse, and shifting industrial structure may reduce expected stresses fromnon-climate factors. In these regions the impacts of climate changes may be proportionallylarger than impacts due to demographic and economics.
25
Climate Change and Impacts on U.S. Water Resources
Introduction
This section summarizes more than two decades of research on the effects of climatechanges on fundamental water-resource variables such as temperature, precipitation,evaporation, runoff, soil moisture, and storms. Any such summary will necessarily beincomplete. Interested readers are strongly encouraged to explore the original citations formore detail about assumptions and methods. The starting point for much of this researchis estimating how increasing concentrations of greenhouse gases in the atmosphere willaffect large-scale climate conditions and, particularly, the hydrologic cycle. Many suchstudies have used scenarios of future climate derived from global climate simulations orgeneral circulation models (GCMs) to evaluate changes in hydrologic conditions. Somestudies have explored past climate conditions (both paleoclimates and climates of recentdecades) as analogues for the future. A smaller effort has looked at specific impacts on theoperations or management of water systems, or on impacts to ecosystems, navigation,recreation, or other water-related activities. Even fewer studies have considered thecomplex socioeconomic costs of climate impacts or the costs and benefits of adaptationand coping strategies. These “costs” include all private and social impacts, typicallyexpressed in dollars, although we note that not all such costs are yet quantified, or evenquantifiable.
Large-scale climate information is often linked with more regional or realistic hydrologicmodels either directly or through a variety of “downscaling” techniques. “Downscaling” refersto attempts to address the scale mismatch between global climate models and watershedmodels. Methods for downscaling range from simple interpolation of climate model outputs tothe use of regional climate models nested within larger-scale simulations. Some methods usestatistical representations and interpolations; some use dynamic approaches. All of thesemethods depend on the quality of the initial simulation and few standardized techniques havebeen widely accepted (Hostetler 1994, Miller et al. 1999). Wilby et al. (2000) suggest thateven when fine-scale regional climate models are nested directly into GCMs, problems withmodel dynamics still occur and statistical approaches can still produce better results. Because ofthe importance of regional and small-scale processes in determining impacts on water resourcesand water systems, substantial improvements in methods to downscale climate informationcontinue to be needed (Crane and Hewitson 1998).
Improvements continue to be made in the hydrologic representations of the GCMs themselves,and spatial resolutions are slowly increasing. There have also been considerable advances in thepast several years in the understanding of hydrological processes both at the land surface and inthe atmosphere. These have come about through ongoing field data collection, modelingprojects, and hydrologic coordination activities such as HAPEX, GEWEX/GCIP, FIFE,BOREAS, and other efforts (see http://www.wmo.ch/web/wcrp/wcrp-home.html for moreinformation on the World Climate Research Program). We urge these efforts to continue.
26
Impacts of Climate Changes on Large-Area Water Balances
The hydrologic cycle is an integrated and dynamic component of the Earth’s geophysicalsystem and both affects and is affected by climate conditions. Changes in the Earth’sradiation balance affect winds, temperatures, atmospheric energy and water transport,cloud dynamics and more. Changes in temperature affect evapotranspiration rates, cloudcharacteristics and extent, soil moisture, and snowfall and snowmelt regimes. Changes inprecipitation affect the timing and magnitude of floods and droughts, shift runoff regimes, andalter groundwater recharge characteristics. Synergistic effects will alter cloud formation,vegetation patterns and growth rates, and soil conditions. At a larger scale, climate changes canaffect major regional atmospheric circulation patterns and storm frequencies and intensities.All of these factors are, in turn, very important for decisions about water and land-useplanning and management.
General circulation models are limited in their ability to reproduce important aspects ofthe hydrologic cycle. Most information available from GCMs focuses on how climatechanges will affect the water balance, notably precipitation, evaporation, and runoff.Many fundamental hydrologic processes, such as the formation and distribution of cloudsand rain-generating storms or watershed soil-moisture dynamics, occur on spatial scalessmaller than most GCMs are able to resolve. We thus know less about how the watercycle will change than we would like to know in order to make decisions about how toplan, manage, and operate water systems. But we do know some things about howhydrology and water-management systems will be affected by climate changes and how wemight strive to cope with those changes (Frederick et al. 1997, Frederick and Major 1997,AWWA 1997, Steiner 1998, Frederick 1998, Major 1998, Boland 1998, Gleick 1998b,Stakhiv and Schilling 1998).
The National Assessment reviewed several current general circulation models andinformation from these models was used in a variety of research studies. Two models – theCanadian Global Coupled Model (“Canadian” or “CGCM”) and the British HadleyCenter Coupled Model (version 2) (“Hadley” or “HadCM2”) model – were picked for theAssessment. Both the Canadian and Hadley “business as usual” scenarios assumed a one-percent-per-year increase in carbon dioxide equivalence and a doubling of sulfur emissionsby 2100 – assumptions taken from the Intergovernmental Panel on Climate Change(IPCC 1996a). During the latter part of the Assessment, additional information wasgathered from a third GCM – the National Center for Atmospheric Research model(NCAR CSM “stabilization run”) – and other research studies have used GCM outputfrom other modeling groups and different versions of the models. No single model can betaken as correct; each version has strengths and weaknesses depending on focus, design,and approach. As a result, modelers do not recommend that GCM outputs be used aspredictions, but rather as sensitivity studies or scenarios of possible future climates. Adetailed discussion of the strengths and limitations of GCMs, particularly the Canadianand the Hadley models, is available in other documents prepared for the NationalAssessment (see, for example, http://www.nacc.usgcrp.gov/scenarios/ and http://www.gcrio.org/nationalassessment/pdf/Chapter1.pdf, and Doherty and Mearns 1999).
The broad effects of a greenhouse warming on water systems will vary in both space andtime. Many climate changes and impacts are expected. Considerable effort has gone intoevaluating these impacts and both general and specific conclusions can be drawn. Some of
27
the conclusions with the greatest implications for hydrology and water resources aresummaried below, based on earlier research, the first two reports of the IPCC (IPCC1990, 1996a, 1996b), and the research done for the National Assessment.
• Human activities are increasing atmospheric concentrations of greenhouse gases andaerosols. The net effect of greenhouse gases is to warm the troposphere and cool thestratosphere; the net effect of tropospheric aerosols is to cool the troposphere (veryhigh confidence).
• Without substantial changes in U.S. and international energy and land-use patterns,emissions of greenhouse gases will continue to increase above current levels and lead tohigher concentrations of such gases than experienced in hundreds of thousands ofyears (very high confidence).
• As atmospheric greenhouse-gas concentrations continue to rise, global averageprecipitation will increase (very high confidence).
• Increases in global-average and U.S.-average surface temperatures will result fromhigher concentrations of greenhouse gases. As greenhouse-gas emissions continue intothe future, the magnitude of these temperature increases will become larger over time(very high confidence). It is well established that the regional and seasonal pattern ofthese temperature increases across the U.S. will vary, but researchers have lowconfidence in most estimates of detailed regional increases.
• GCMs indicate that there will be some changes in the timing and regional patterns ofprecipitation (very high confidence), but researchers have low confidence inprojections for specific regions because different models produce different detailedregional changes.
• GCMs consistently show that average precipitation will increase in higher latitudes,particularly in winter (high confidence). Models are inconsistent in other estimates ofhow the seasonality of precipitation will change.
• Research results consistently show that temperature increases in mountainous areaswith seasonal snowpack will lead to increases in the ratio of rain to snow and decreasesin the length of the snow storage season (very high confidence). It is likely thatreductions in snowfall and earlier snowmelt and runoff would increase the probabilityof flooding early in the year and reduce the runoff of water during late spring andsummer. Basins in the western United States are particularly vulnerable to such shifts.
• Increases in annual average runoff in the high latitudes caused by higher precipitationare likely to occur (high confidence).
• Research results suggest that flood frequencies in some areas are likely to change. Innorthern latitudes and snowmelt-driven basins, research results suggest that floodfrequencies will increase (medium confidence), although the amount of increase forany given climate scenario is uncertain and impacts will vary among basins.
28
• Research results suggest that drought frequencies in some areas are likely to change.The net risks to society from such changes have not been evaluated and specificprojections of where such changes will occur are speculative. Models project that thefrequency and severity of droughts in some areas could increase as a result of regionaldecreases in total rainfall, more frequent dry spells, and higher evaporation (mediumconfidence). Models suggest with equal confidence that the frequency and severity ofdroughts in some regions would decrease as a result of regional increases in total rainfalland less frequent dry spells.
• Higher sea levels associated with thermal expansion of the oceans and increased melting ofglaciers will push salt water further inland in rivers, deltas, and coastal aquifers (very highconfidence). It is well understood that such advances would adversely affect the quality andquantity of freshwater supplies in many coastal areas.
• Water-quality problems will worsen where rising temperatures are the predominantclimate change (high confidence). Where there are changes in flow, complex positive andnegative changes in water quality will occur. Water quality may improve if higher flows areavailable for diluting contaminants. Specific regional projections are not well established atthis time because of uncertainties in how regional flows will change.
• Ecologists project that climate warming will produce a shift in species distributionsnorthward, with extinctions and extirpations of temperate or cold-water species at lowerlatitudes, and range expansion of warm-water and cool-water species into higher latitudes(high confidence).
• Increased atmospheric carbon dioxide will affect the use of water by vegetation (highconfidence), but hydrologists have low confidence in the net effects of this and othercompeting influences. Increasing CO
2 concentrations in some circumstances can reduce
the rate of transpiration from certain plants. This in turn would tend to increase runoffsince less water is returned directly to the atmosphere by such vegetation, allowing agreater share of precipitation to reach streams or aquifers. Rising CO
2 concentrations can
also increase plant growth, leading to a larger area of transpiring tissue and a correspondingincrease in transpiration. More work is needed on the roles of vegetation type and otherinteracting factors such as soil conditions and groundwater interactions.
• A growing number of studies suggest that climate changes will increases the frequency andintensity of the heaviest precipitation events, but there is little agreement on detailedregional changes in storminess that might occur in a warmed world. Contradictory resultsfrom models support the need for more research, especially to address the mismatchbetween the resolution of models and the scales at which extreme events can occur. Thisissue should be regularly revisited in later assessments.
• The southern boundary of continuous permafrost is projected to shift north by 500kilometers over the next 50 years due to warming projected by GCMs. A 5o C warming inAlaska would eventually melt virtually all of the subarctic permafrost in Alaska (mediumconfidence), which would affect more wetland area than currently found in the rest of theUnited States.
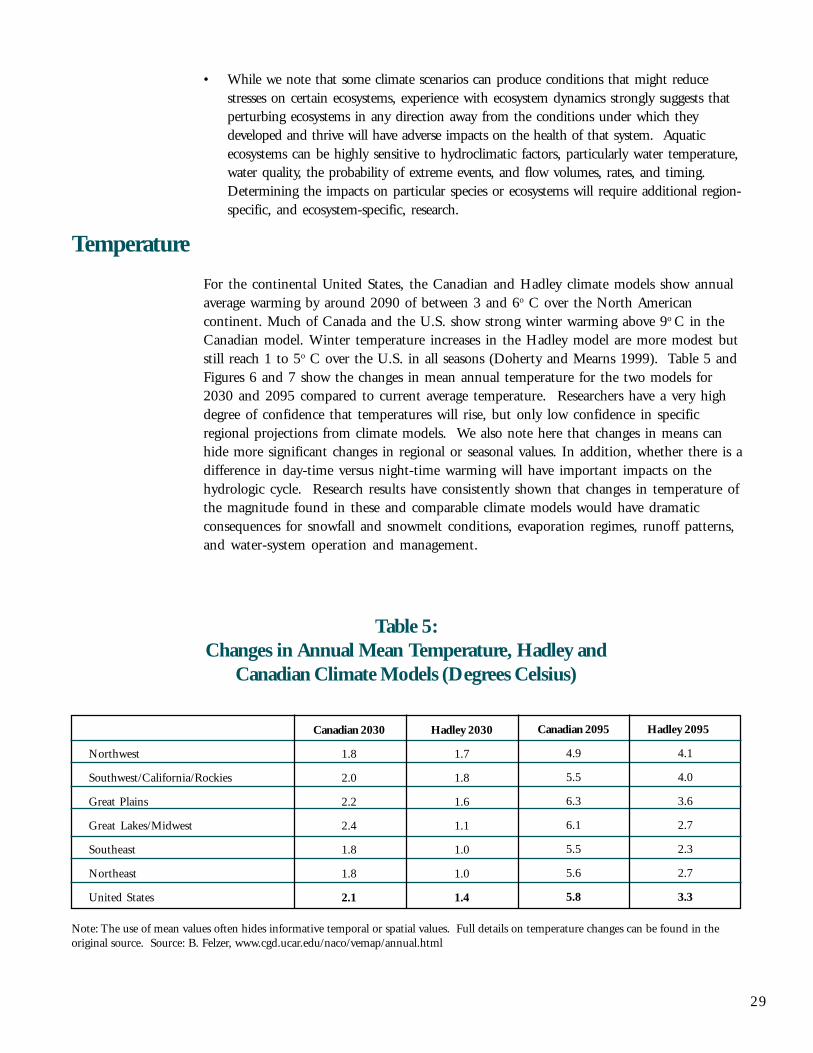
29
Table 5:Changes in Annual Mean Temperature, Hadley and
Canadian Climate Models (Degrees Celsius)
Canadian 2030
1.8
2.0
2.2
2.4
1.8
1.8
2.1
Hadley 2030
1.7
1.8
1.6
1.1
1.0
1.0
1.4
Canadian 2095
4.9
5.5
6.3
6.1
5.5
5.6
5.8
Hadley 2095
4.1
4.0
3.6
2.7
2.3
2.7
3.3
Northwest
Southwest/California/Rockies
Great Plains
Great Lakes/Midwest
Southeast
Northeast
United States
Note: The use of mean values often hides informative temporal or spatial values. Full details on temperature changes can be found in theoriginal source. Source: B. Felzer, www.cgd.ucar.edu/naco/vemap/annual.html
• While we note that some climate scenarios can produce conditions that might reducestresses on certain ecosystems, experience with ecosystem dynamics strongly suggests thatperturbing ecosystems in any direction away from the conditions under which theydeveloped and thrive will have adverse impacts on the health of that system. Aquaticecosystems can be highly sensitive to hydroclimatic factors, particularly water temperature,water quality, the probability of extreme events, and flow volumes, rates, and timing.Determining the impacts on particular species or ecosystems will require additional region-specific, and ecosystem-specific, research.
Temperature
For the continental United States, the Canadian and Hadley climate models show annualaverage warming by around 2090 of between 3 and 6o C over the North Americancontinent. Much of Canada and the U.S. show strong winter warming above 9o C in theCanadian model. Winter temperature increases in the Hadley model are more modest butstill reach 1 to 5o C over the U.S. in all seasons (Doherty and Mearns 1999). Table 5 andFigures 6 and 7 show the changes in mean annual temperature for the two models for2030 and 2095 compared to current average temperature. Researchers have a very highdegree of confidence that temperatures will rise, but only low confidence in specificregional projections from climate models. We also note here that changes in means canhide more significant changes in regional or seasonal values. In addition, whether there is adifference in day-time versus night-time warming will have important impacts on thehydrologic cycle. Research results have consistently shown that changes in temperature ofthe magnitude found in these and comparable climate models would have dramaticconsequences for snowfall and snowmelt conditions, evaporation regimes, runoff patterns,and water-system operation and management.
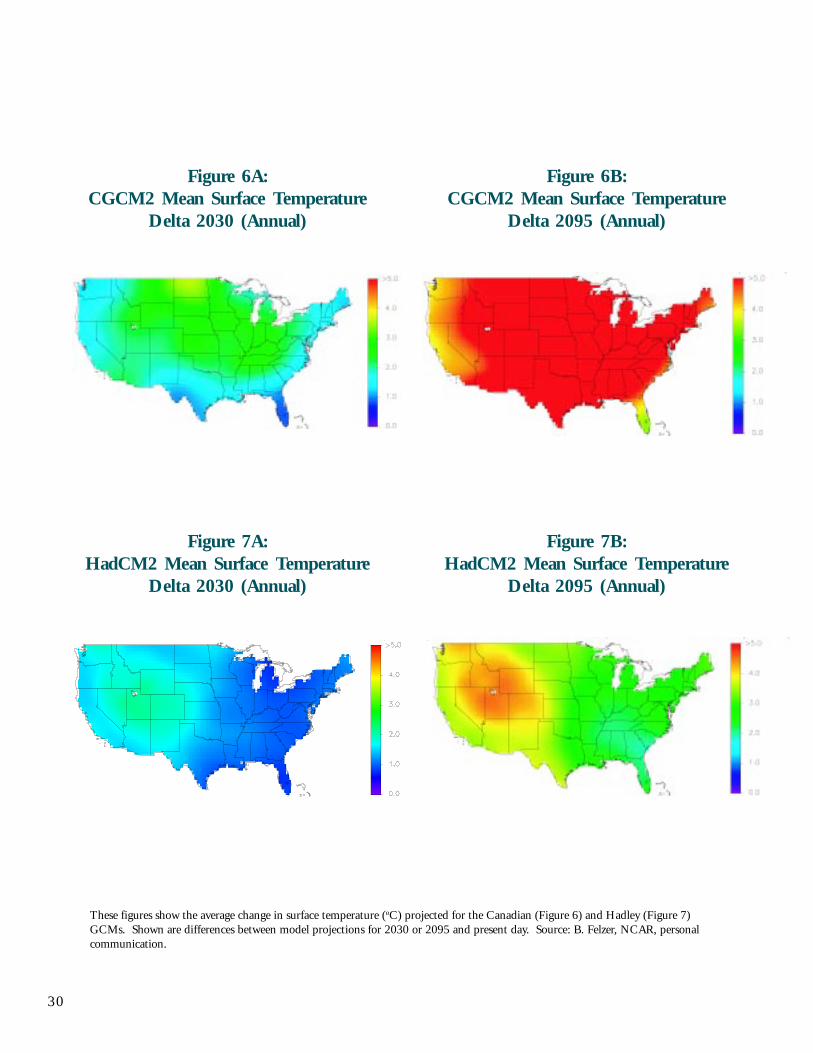
30
Figure 6A:CGCM2 Mean Surface Temperature
Delta 2030 (Annual)
Figure 6B:CGCM2 Mean Surface Temperature
Delta 2095 (Annual)
Figure 7A:HadCM2 Mean Surface Temperature
Delta 2030 (Annual)
Figure 7B:HadCM2 Mean Surface Temperature
Delta 2095 (Annual)
These figures show the average change in surface temperature (oC) projected for the Canadian (Figure 6) and Hadley (Figure 7)GCMs. Shown are differences between model projections for 2030 or 2095 and present day. Source: B. Felzer, NCAR, personalcommunication.
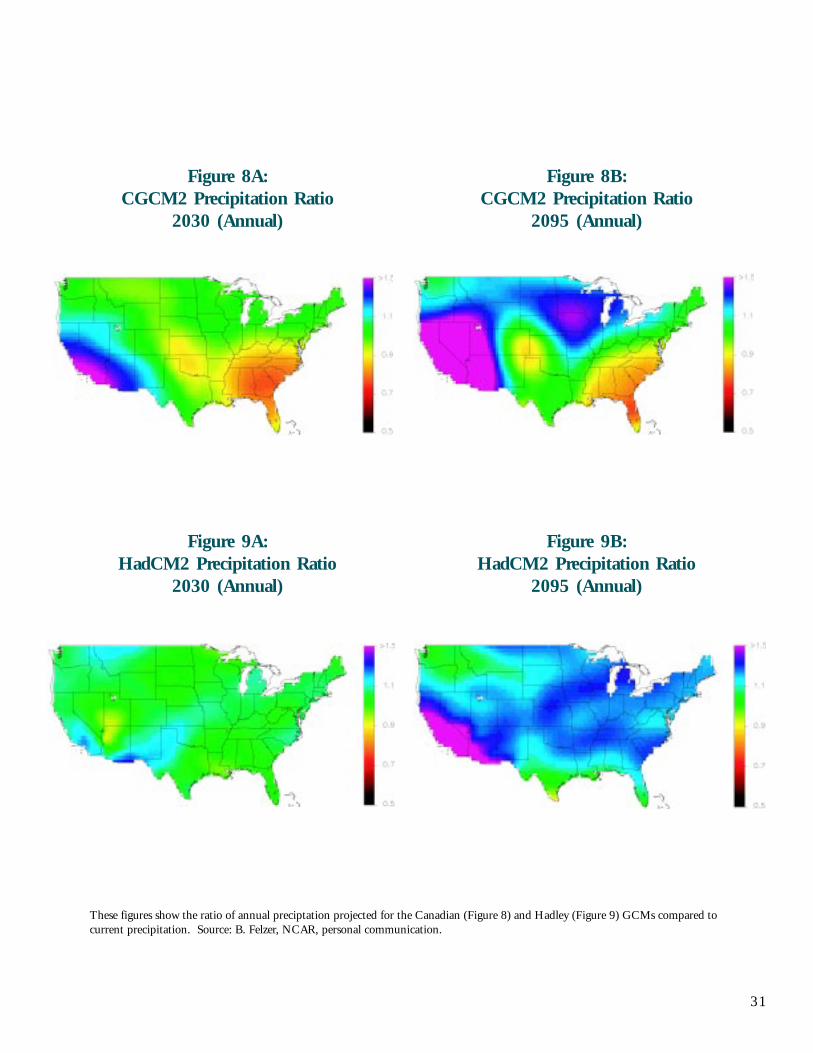
31
Figure 8A:CGCM2 Precipitation Ratio
2030 (Annual)
Figure 8B:CGCM2 Precipitation Ratio
2095 (Annual)
Figure 9A:HadCM2 Precipitation Ratio
2030 (Annual)
Figure 9B:HadCM2 Precipitation Ratio
2095 (Annual)
These figures show the ratio of annual preciptation projected for the Canadian (Figure 8) and Hadley (Figure 9) GCMs compared tocurrent precipitation. Source: B. Felzer, NCAR, personal communication.
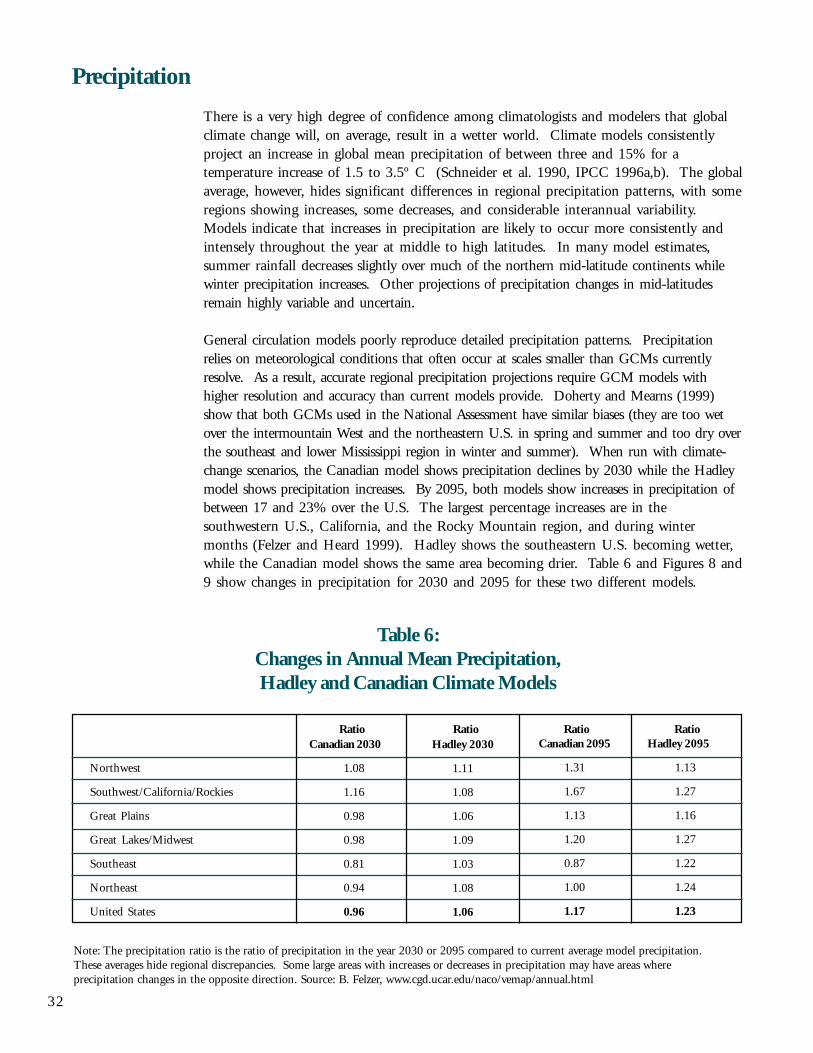
32
Precipitation
There is a very high degree of confidence among climatologists and modelers that globalclimate change will, on average, result in a wetter world. Climate models consistentlyproject an increase in global mean precipitation of between three and 15% for atemperature increase of 1.5 to 3.5º C (Schneider et al. 1990, IPCC 1996a,b). The globalaverage, however, hides significant differences in regional precipitation patterns, with someregions showing increases, some decreases, and considerable interannual variability.Models indicate that increases in precipitation are likely to occur more consistently andintensely throughout the year at middle to high latitudes. In many model estimates,summer rainfall decreases slightly over much of the northern mid-latitude continents whilewinter precipitation increases. Other projections of precipitation changes in mid-latitudesremain highly variable and uncertain.
General circulation models poorly reproduce detailed precipitation patterns. Precipitationrelies on meteorological conditions that often occur at scales smaller than GCMs currentlyresolve. As a result, accurate regional precipitation projections require GCM models withhigher resolution and accuracy than current models provide. Doherty and Mearns (1999)show that both GCMs used in the National Assessment have similar biases (they are too wetover the intermountain West and the northeastern U.S. in spring and summer and too dry overthe southeast and lower Mississippi region in winter and summer). When run with climate-change scenarios, the Canadian model shows precipitation declines by 2030 while the Hadleymodel shows precipitation increases. By 2095, both models show increases in precipitation ofbetween 17 and 23% over the U.S. The largest percentage increases are in thesouthwestern U.S., California, and the Rocky Mountain region, and during wintermonths (Felzer and Heard 1999). Hadley shows the southeastern U.S. becoming wetter,while the Canadian model shows the same area becoming drier. Table 6 and Figures 8 and9 show changes in precipitation for 2030 and 2095 for these two different models.
Table 6:Changes in Annual Mean Precipitation,Hadley and Canadian Climate Models
Note: The precipitation ratio is the ratio of precipitation in the year 2030 or 2095 compared to current average model precipitation.These averages hide regional discrepancies. Some large areas with increases or decreases in precipitation may have areas whereprecipitation changes in the opposite direction. Source: B. Felzer, www.cgd.ucar.edu/naco/vemap/annual.html
Hadley 2030
1.11
1.08
1.06
1.09
1.03
1.08
1.06
Canadian 2095
1.31
1.67
1.13
1.20
0.87
1.00
1.17
Northwest
Southwest/California/Rockies
Great Plains
Great Lakes/Midwest
Southeast
Northeast
United States
Canadian 2030
1.08
1.16
0.98
0.98
0.81
0.94
0.96
Hadley 2095
1.13
1.27
1.16
1.27
1.22
1.24
1.23
Ratio Ratio Ratio Ratio
33
Because of the differences between these and other model results, researchers have littleconfidence in specific regional projections of precipitation.
Potential changes in rainfall intensity and variability are difficult to evaluate becauseintense convective storms tend to occur over smaller regions than global models are able toresolve. In the mid-latitudes, changes in precipitation must be carefully evaluated withchanges in evaporation from higher temperatures, and few consistent results have beenreported from GCMs. Changes in seasonal precipitation are even more variable overdifferent regions.
Evaporation and Transpiration
Water is returned to the atmosphere through evaporation from land and water surfaces andtranspiration from plants. Evaporation of water into the atmosphere is a function of manythings, including climate and landscape conditions, such as humidity, wind speed, theavailability of water and energy, and vegetation and soil characteristics. It is well establishedthat as temperatures rise, the energy available for evaporation increases and the atmosphericdemand for water from land and water surfaces increases. A warmer atmosphere can hold morewater, but actual changes in both potential and actual evapotranspiration will depend on manyfactors, including the ability of the atmosphere to hold water (the humidity), changes in themovements of air (wind patterns), changes in net radiation (which can increase or decrease dueto cloud cover), and available soil moisture.
The rate of evaporation is critical to a region’s hydrologic balance. Increasing averagetemperatures generally lead to an increase in the potential for evaporation, though lowerradiation and increased atmospheric water vapor content can reduce evaporative demands.Evaporation is driven by the availability of energy, but actual evaporation rates are constrainedby the actual water availability on land and vegetation surfaces and in the soils. In temperatezones, atmospheric moisture content can limit evaporation rates, so changes in humidity arerelatively important. Vegetative cover is also important because plants intercept precipitationand transpire water back to the atmosphere. Different vegetation types play different roles inevaporation, so evaluating the overall hydrologic impacts of climate change in a region requireshaving some understanding of the ways in which vegetation patterns may change.
Transpiration is also affected by a wide range of factors, including plant type and cover, rootdepth, stomatal behavior, and the concentration of carbon dioxide in the atmosphere. Somelaboratory and field studies have shown that certain plants will decrease water use whenexposed to higher carbon dioxide levels. Other studies suggest that much of this improvementcan be lost if plants grow more and the increased leaf area offsets increased water-use efficiency(Field et al. 1995, Korner 1996, Rötter and Van de Geijn 1999). Evidence also suggests thatsome plants acclimatize to increased CO
2 levels, limiting improvements in water-use efficiency,
and that nutrients other than water sometimes limit growth. One study suggests that waterresources in the Delaware River Basin are sufficiently sensitive to changes in stomatal resistancethat increased water-use efficiency by plants could offset to some extent the effects of highertemperatures and lower precipitation (Lins et al. 1997). Real-world effects make laboratoryfindings hard to reproduce in the field or inappropriate to generalize to large catchments.These issues continue to be major concerns for hydrologists, soil scientists, and plant
34
physiologists (further details on this issue can be found in the Agricultural Sector report).Climate models have consistently projected that global average evaporation would increasein the range of three to 15% for an equivalent doubling of atmospheric carbon dioxideconcentration. The greater the warming, the larger these increases. Moreover, regionalincreases in potential evaporation could be as high as 40% in humid temperate regions(IPCC 1996c). There is a significant difference between the actual and potential rates ofevaporation in a basin. Higher temperatures will lead to an increase in potentialevaporation, but could result in lower actual evaporation if water availability decreases dueto soil-moisture drying or lower precipitation.
Variability, Storms, and Extreme Events
Climates vary naturally on all time-scales. These variations are caused by processes internal(such as ocean dynamics) and external (such as solar variability) to the climate system.These processes will continue to exert an important influence on the climate system evenas changes induced by rising concentrations of greenhouse gases begin to be felt. Naturalvariations in climate complicate unambiguous detection of the human-inducedgreenhouse effect and are also a reason why future climate projections will never beperfect.
Existing variability of climate has profound impacts on humans, primarily through thecosts of flood and drought events or through the cost of implementing options andbuilding infrastructure to prevent them. Storms also help renew beaches or flush coastalecosystems, and intense storms in some regions provide important water supplies. Inrecent years there have been new efforts to understand how natural patterns of variability,such as hurricanes, intense rainstorms, and El Niño/La Niña events, affect U.S. waterresources (McCabe 1996, Vogel et al. 1997, Piechota et al. 1997). This researchconsistently notes that the hydrological “baseline” used by water planners and systemsdesigners cannot be assumed to be constant, even without climate changes. It also helpsto identify vulnerabilities of existing systems to hydrologic extremes and providesinformation that should be useful to those interested in the issue of adaptation andcoping.
As CO2 and other trace-gas levels change and circulation of the atmosphere adjusts, storm
frequency and intensity may change as well. An important question, therefore, is whatglobal climate changes may do to the frequency and intensity of weather events andsystems, such as precipitation or temperature extremes, cyclones, hurricanes, and longerduration circulation phenomena like El Niño. The connection between elevatedgreenhouse gas concentrations and these extreme events has been inadequately studied andthere is low confidence in the few available results.
Only in the past few years have models improved enough to begin to look at higher-orderfeatures such as extreme events in more detail. This is a product of the rapid developmentof climate modeling capabilities in concert with increased computer resources. Currentglobal coupled climate models have improved resolution, more detailed and accurate land-surface simulations, and dynamical sea-ice formulations. Some have even higher resolutionin the ocean near the equator (leading to improved simulations of El Niño and La Niñaevents). Techniques for studying climate processes at smaller regional scales from GCM
35
results have also improved, through either embedding high-resolution regional models(with grid points every 50 km or so) in the global models or using statistical downscalingtechniques. Despite these improvements, the models still have limitations in terms ofspatial resolution, simulation errors, and parameterizations of processes that cannot yet beincluded explicitly in the models, such as those dealing with clouds and small-scaleprecipitation. As a result, researchers have varying degrees of confidence in many of thequantitative aspects of the model simulations (Meehl et al. 2000).
A growing number of model studies suggest that the variability (as measured, for example,by the interannual standard deviation) of the hydrologic cycle increases when meanprecipitation increases and vice-versa. In one model study looking at convective systems,the total area over which precipitation fell decreased, even though global meanprecipitation increased (Noda and Tokioka 1989), implying more intense local stormsand, perhaps, increased runoff as well. Increased precipitation intensity (with widelyvarying regional changes) in a future climate with increased greenhouse gases was seen inearly model results and this result also appears in improved, more detailed models(Kothavala 1997; Hennessy et al. 1997).
Increases in extreme precipitation events recently have been projected in nested regionalmodels over the United States (Giorgi et al. 1998), and in a high-resolution nestedhurricane model over the north-west tropical Pacific (Knutson and Tuleya 1999). In arecent global model simulation with doubled CO
2, precipitation extremes increased more
than the mean (the mean increase was 4%; 20-yr extreme precipitation event return valuesincreased 11%) with a decrease in the return period of 20-yr extreme precipitation eventsto 10 years over North America (Zwiers and Kharin 1998).
Another long-standing model result points to an increase in drought, represented by ageneral drying of mid-continental areas during summer with increasing CO
2 (e.g. Rind et al.
1990). This finding has been reproduced with the latest generation of global coupled climatemodels (Haywood et al. 1997; Wetherald and Manabe 1999, Meehl et al. 2000). Theincreased risk of drought during summer results from a combination of increased temperatureand evaporation along with decreased precipitation. Analysis of one GCM showed this effect tobe the result of large increases in the frequency of low summer precipitation, a higherprobability of dry soil, and the occurrence of long dry spells ascribed to the reduction of rainfallevents in the model rather than decreases in mean precipitation (Gregory et al. 1997).
General studies on climate change and storminess note that there are two possible conflictingeffects on extratropical storms. Some model projections of CO
2-forced climate change
suggest that storms in a climate-changed world should, on average, be fewer in numberbut stronger in intensity. Enhanced warming at high latitudes near the surface leads toreduced meridional temperature gradients in the lower troposphere and hence fewerstorms. In contrast, more warming at the surface than aloft and a wetter atmospherearising from increased latent heating should result in reduced atmospheric stability,increased convection, and a more vigorous hydrologic cycle, which might support morestorms and perhaps more intense storms as well (Carnell and Senior 1998, Hayden 1999).Combining these processes, Lambert (1995) found that earlier scenarios from theCanadian model produced fewer, but more intense storms, on a global basis. Othermodel studies have also suggested that higher CO
2 levels might produce more intense
storm events (Frei et al. 1998).
36
Limitations in earlier global climate models meant there have been few studies of futurechanges in the frequency, location, and strength of extratropical storms. Recentimprovements in models make such studies more credible, but results are still mixed andhighly uncertain. For example, a storm track analysis of a GCM with doubled CO
2
indicates a northeastward shift of storm frequency in the North Atlantic, with littlechange in storm intensities (Schubert et al. 1998), though another study found areduction of intensity (Beersma et al. 1997), and still another found an increase (Lunkeitet al. 1996). An analysis of an ensemble of four future climate-change experiments in aglobal coupled model with increased CO
2 and sulfate aerosols showed a decrease in the
total number of Northern Hemisphere storms, but an increase in the number of the mostintense storms (Carnell and Senior 1998). Knutson and Tuleya (2000) note increasedhurricane intensities with CO
2-induced warming from one GCM.
Both the Canadian and Hadley models show decreases in the number of Atlantic storms,but the Canadian model is able to simulate the storm track along the eastern seaboard,whereas the Hadley model only simulates the storm track in the North Atlantic (Felzerand Heard 1999). Both models show increased storm counts in the Gulf of Alaska wherePacific storms terminate; the Canadian model shows decreased storm counts off thesoutheastern U.S. where Atlantic storms originate. Because the Atlantic storm track in theCanadian model appears further south and west than that of the Hadley model, thedecrease in storms in the Canadian model contributes to the decrease in precipitation seenin the model results for the southeastern U.S. The two models disagree about changes instorm counts in the eastern and western U.S. Both models generally show more intensestorms, so regions of decreased storm frequency may actually see increased precipitation(Lambert 1995, Carnell and Senior 1998, Felzer and Heard 1999).
Hayden (1999) also evaluated the Hadley climate models runs for 2030 and 2095 (theCanadian model results were not available at the time). Storm occurrences are calculatedfrom the low-pressure systems or other model outputs (such as variances in geopotentialheights). Extratropical storms are an important cause of beach erosion and flooding ofwetlands with saline water and they provide essential precipitation that drives much of thehydrological cycle in middle and high latitudes. Using these model output data, Haydenfound no sensitivity of North American storm tracks to increasing CO
2. The author notes
the need for better regional resolution of storm tracks, particularly in the western U.S.(Hayden 1999). He concludes, however, that GCMs remain the best tool for ultimatelyaccounting for the effect of greenhouse-gas accumulations on storms and recommends thatthis capacity in model development should be further refined.
A model-based study released in 1999 suggests that the frequency of El Niño events mayincrease due to greenhouse warming. Timmermann et al. (1999) used a high-resolutionglobal climate model to simulate the El Niño/Southern Oscillation phenomenon (ENSO)under conditions of warming. Their model indicated that the tropical Pacific climatesystem would undergo systematic changes if greenhouse gas concentrations doubled. Inparticular, their results suggest a world where the average condition is like the present-dayEl Niño condition and events typical of El Niño will become more frequent. Their resultsalso found more intense La Niña events and a stronger interannual variability, meaningthat year-to-year variations may become more extreme under enhanced greenhouseconditions. More frequent or intense El Niños would alter precipitation and floodingpatterns in the United States in a significant way. Conflicting conclusions about storms
37
support the need for higher-spatial-resolution models with better cloud and precipitationprocesses. Progress in such efforts should be regularly revisited in later assessments.
Snowpack, Glaciers, and Permafrost
Seasonal snow accumulation is an important source of water storage and runoff in manyparts of the world, including the western United States. Despite all of the uncertaintiesabout how increased greenhouse gas concentrations will affect precipitation, there is veryhigh confidence that higher temperatures will result and, as discussed in the followingsection, are likely already occurring. The greatest increases in temperature are expected tobe in higher latitude regions because of the dynamics of the atmosphere and feedbacksamong ice, albedo, and radiation. A growing amount of research has established thathigher temperatures will lead to dramatic changes in snowfall and snowmelt dynamics inwatersheds with substantial snow. Higher temperatures will have several major effects:they will increase the ratio of rain to snow, delay the onset of the snow season, acceleratethe rate of spring snowmelt, and shorten the overall snowfall season, leading to more rapidand earlier seasonal runoff. They can also lead to significant changes in the distribution ofpermafrost and the mass balances of glaciers.
As early as the mid-1980s, regional hydrologic studies of global warming impactssuggested with increasing confidence that higher temperatures will affect the timing andmagnitude of runoff in these regions and studies have now shown that all watersheds withsubstantial snow dynamics are likely to be affected (see, for example, Gleick 1986, Gleick1987a,b, Lettenmaier and Gan 1990, Lettenmaier and Sheer 1991, Nash and Gleick1991, Miller et al. 1992, Cooley et al. 1992, Martinec et al. 1992, Rango and Martinec1994, Rango 1997, Leung and Wigmosta 1999, Hamlet and Lettenmaier 1999).Indeed, over the past two decades, this has been one of the most persistent and well-established findings on the impacts of climate change for water resources in the UnitedStates and elsewhere. Figure 10 shows how a snow basin hydrograph may shift withwarming. Figure 11 shows how snow levels in higher elevation regions may be affected.
A few broad assessments have simulated the effects of climate change on snowpack in theUnited States (McCabe and Legates 1995, Cayan 1996, McCabe and Wolock 1999).McCabe and Wolock (1999) evaluated the links between climate conditions andsnowpack for over 300 different snow sites in the western U.S., organized into majorclusters around the Pacific Northwest, the Sierra Nevada, and the Colorado basin. Theyused long-term historical records to develop a snow model that used altered climateinformation from GCMs. For most of the sites, strong positive correlations were foundbetween precipitation and snowpack; strong negative correlations were found betweentemperature and snowpack. These correlations indicate that the supply of winter moistureis the best predictor of snowpack volume, while temperature is the best predictor of thetiming of snowmelt and the overall nature of the snow season. This correlation breaksdown only for those high-altitude sites where mean winter temperatures are so cold thatthe ratio of rain to snow is not affected.
Both the Canadian and the Hadley models project large increases in winter temperatureover the next century and increases in winter precipitation for the Sierra Nevada sites
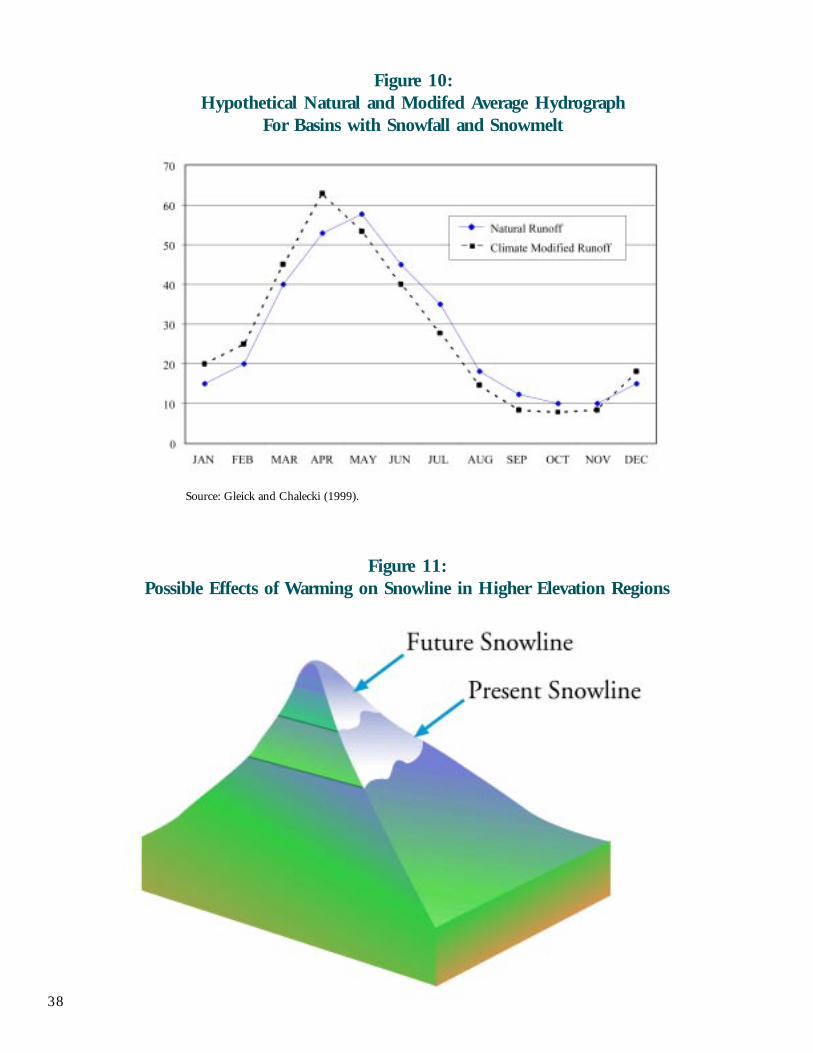
38
Figure 10:Hypothetical Natural and Modifed Average Hydrograph
For Basins with Snowfall and Snowmelt
Source: Gleick and Chalecki (1999).
Figure 11:Possible Effects of Warming on Snowline in Higher Elevation Regions
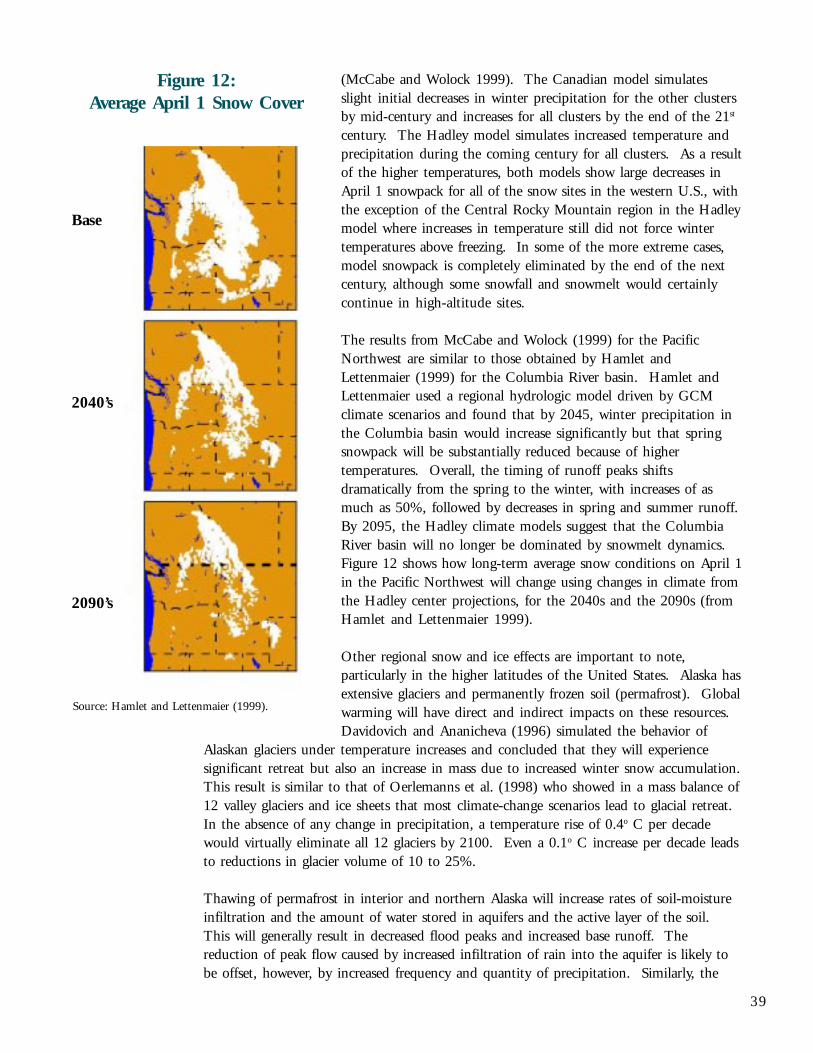
39
(McCabe and Wolock 1999). The Canadian model simulatesslight initial decreases in winter precipitation for the other clustersby mid-century and increases for all clusters by the end of the 21st
century. The Hadley model simulates increased temperature andprecipitation during the coming century for all clusters. As a resultof the higher temperatures, both models show large decreases inApril 1 snowpack for all of the snow sites in the western U.S., withthe exception of the Central Rocky Mountain region in the Hadleymodel where increases in temperature still did not force wintertemperatures above freezing. In some of the more extreme cases,model snowpack is completely eliminated by the end of the nextcentury, although some snowfall and snowmelt would certainlycontinue in high-altitude sites.
The results from McCabe and Wolock (1999) for the PacificNorthwest are similar to those obtained by Hamlet andLettenmaier (1999) for the Columbia River basin. Hamlet andLettenmaier used a regional hydrologic model driven by GCMclimate scenarios and found that by 2045, winter precipitation inthe Columbia basin would increase significantly but that springsnowpack will be substantially reduced because of highertemperatures. Overall, the timing of runoff peaks shiftsdramatically from the spring to the winter, with increases of asmuch as 50%, followed by decreases in spring and summer runoff.By 2095, the Hadley climate models suggest that the ColumbiaRiver basin will no longer be dominated by snowmelt dynamics.Figure 12 shows how long-term average snow conditions on April 1in the Pacific Northwest will change using changes in climate fromthe Hadley center projections, for the 2040s and the 2090s (fromHamlet and Lettenmaier 1999).
Other regional snow and ice effects are important to note,particularly in the higher latitudes of the United States. Alaska hasextensive glaciers and permanently frozen soil (permafrost). Globalwarming will have direct and indirect impacts on these resources.Davidovich and Ananicheva (1996) simulated the behavior of
Alaskan glaciers under temperature increases and concluded that they will experiencesignificant retreat but also an increase in mass due to increased winter snow accumulation.This result is similar to that of Oerlemanns et al. (1998) who showed in a mass balance of12 valley glaciers and ice sheets that most climate-change scenarios lead to glacial retreat.In the absence of any change in precipitation, a temperature rise of 0.4o C per decadewould virtually eliminate all 12 glaciers by 2100. Even a 0.1o C increase per decade leadsto reductions in glacier volume of 10 to 25%.
Thawing of permafrost in interior and northern Alaska will increase rates of soil-moistureinfiltration and the amount of water stored in aquifers and the active layer of the soil.This will generally result in decreased flood peaks and increased base runoff. Thereduction of peak flow caused by increased infiltration of rain into the aquifer is likely tobe offset, however, by increased frequency and quantity of precipitation. Similarly, the
Figure 12:Average April 1 Snow Cover
Base
2040’s
2090’s
Source: Hamlet and Lettenmaier (1999).
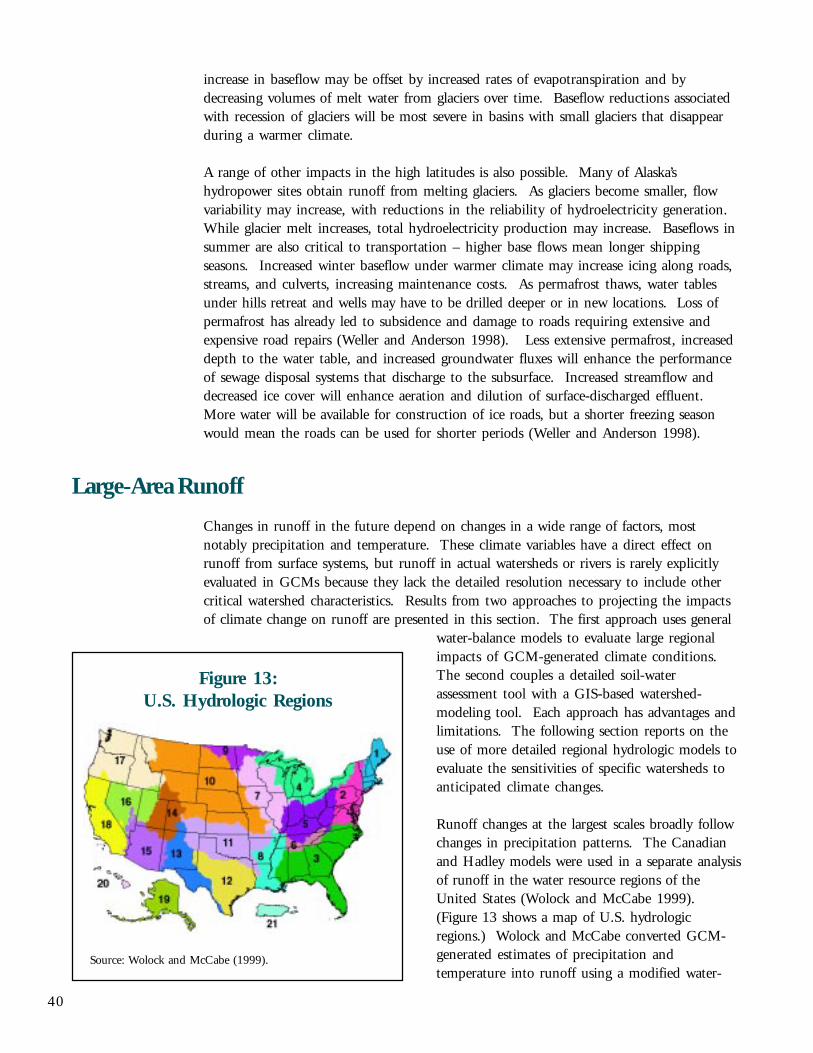
40
Figure 13:U.S. Hydrologic Regions
Source: Wolock and McCabe (1999).
increase in baseflow may be offset by increased rates of evapotranspiration and bydecreasing volumes of melt water from glaciers over time. Baseflow reductions associatedwith recession of glaciers will be most severe in basins with small glaciers that disappearduring a warmer climate.
A range of other impacts in the high latitudes is also possible. Many of Alaska’shydropower sites obtain runoff from melting glaciers. As glaciers become smaller, flowvariability may increase, with reductions in the reliability of hydroelectricity generation.While glacier melt increases, total hydroelectricity production may increase. Baseflows insummer are also critical to transportation – higher base flows mean longer shippingseasons. Increased winter baseflow under warmer climate may increase icing along roads,streams, and culverts, increasing maintenance costs. As permafrost thaws, water tablesunder hills retreat and wells may have to be drilled deeper or in new locations. Loss ofpermafrost has already led to subsidence and damage to roads requiring extensive andexpensive road repairs (Weller and Anderson 1998). Less extensive permafrost, increaseddepth to the water table, and increased groundwater fluxes will enhance the performanceof sewage disposal systems that discharge to the subsurface. Increased streamflow anddecreased ice cover will enhance aeration and dilution of surface-discharged effluent.More water will be available for construction of ice roads, but a shorter freezing seasonwould mean the roads can be used for shorter periods (Weller and Anderson 1998).
Large-Area Runoff
Changes in runoff in the future depend on changes in a wide range of factors, mostnotably precipitation and temperature. These climate variables have a direct effect onrunoff from surface systems, but runoff in actual watersheds or rivers is rarely explicitlyevaluated in GCMs because they lack the detailed resolution necessary to include othercritical watershed characteristics. Results from two approaches to projecting the impactsof climate change on runoff are presented in this section. The first approach uses general
water-balance models to evaluate large regionalimpacts of GCM-generated climate conditions.The second couples a detailed soil-waterassessment tool with a GIS-based watershed-modeling tool. Each approach has advantages andlimitations. The following section reports on theuse of more detailed regional hydrologic models toevaluate the sensitivities of specific watersheds toanticipated climate changes.
Runoff changes at the largest scales broadly followchanges in precipitation patterns. The Canadianand Hadley models were used in a separate analysisof runoff in the water resource regions of theUnited States (Wolock and McCabe 1999).(Figure 13 shows a map of U.S. hydrologicregions.) Wolock and McCabe converted GCM-generated estimates of precipitation andtemperature into runoff using a modified water-
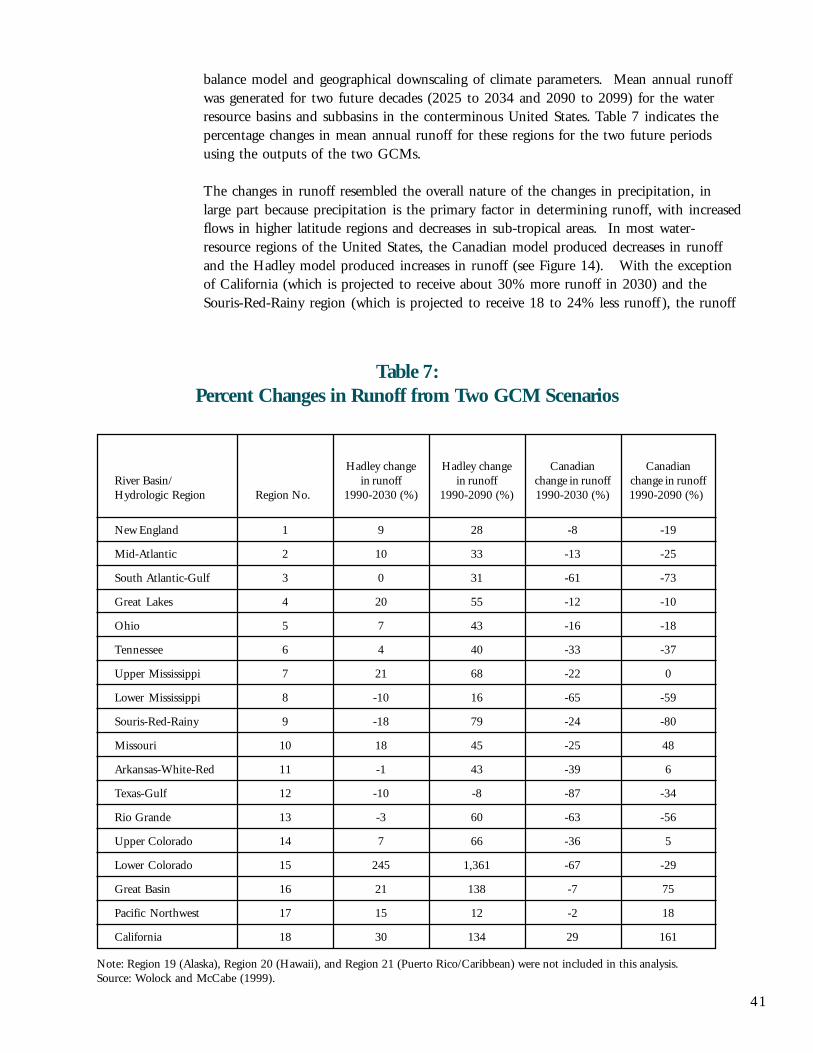
41
balance model and geographical downscaling of climate parameters. Mean annual runoffwas generated for two future decades (2025 to 2034 and 2090 to 2099) for the waterresource basins and subbasins in the conterminous United States. Table 7 indicates thepercentage changes in mean annual runoff for these regions for the two future periodsusing the outputs of the two GCMs.
The changes in runoff resembled the overall nature of the changes in precipitation, inlarge part because precipitation is the primary factor in determining runoff, with increasedflows in higher latitude regions and decreases in sub-tropical areas. In most water-resource regions of the United States, the Canadian model produced decreases in runoffand the Hadley model produced increases in runoff (see Figure 14). With the exceptionof California (which is projected to receive about 30% more runoff in 2030) and theSouris-Red-Rainy region (which is projected to receive 18 to 24% less runoff ), the runoff
Note: Region 19 (Alaska), Region 20 (Hawaii), and Region 21 (Puerto Rico/Caribbean) were not included in this analysis.Source: Wolock and McCabe (1999).
River Basin/Hydrologic Region
New England
Mid-Atlantic
South Atlantic-Gulf
Great Lakes
Ohio
Tennessee
Upper Mississippi
Lower Mississippi
Souris-Red-Rainy
Missouri
Arkansas-White-Red
Texas-Gulf
Rio Grande
Upper Colorado
Lower Colorado
Great Basin
Pacific Northwest
California
Region No.
1
2
3
4
5
6
7
8
9
10
11
12
13
14
15
16
17
18
Hadley changein runoff
1990-2030 (%)
9
10
0
20
7
4
21
-10
-18
18
-1
-10
-3
7
245
21
15
30
Hadley changein runoff
1990-2090 (%)
28
33
31
55
43
40
68
16
79
45
43
-8
60
66
1,361
138
12
134
Canadianchange in runoff1990-2030 (%)
-8
-13
-61
-12
-16
-33
-22
-65
-24
-25
-39
-87
-63
-36
-67
-7
-2
29
Canadianchange in runoff1990-2090 (%)
-19
-25
-73
-10
-18
-37
0
-59
-80
48
6
-34
-56
5
-29
75
18
161
Table 7:Percent Changes in Runoff from Two GCM Scenarios
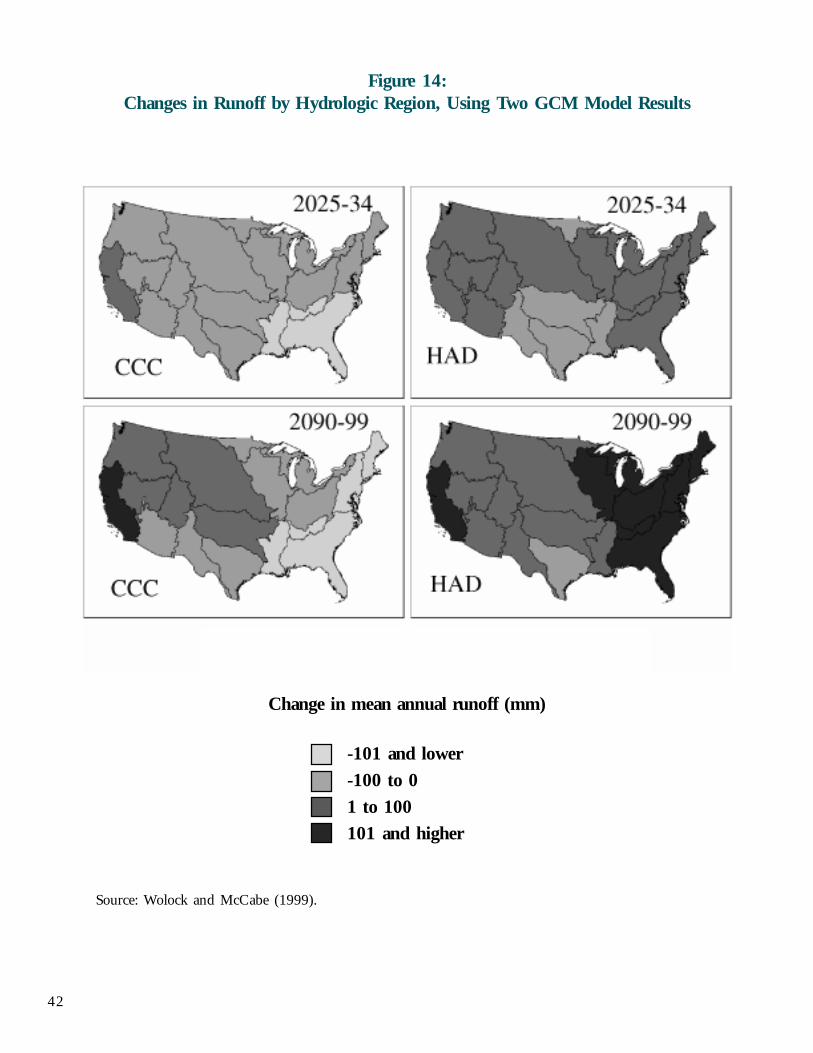
42
Figure 14:Changes in Runoff by Hydrologic Region, Using Two GCM Model Results
Source: Wolock and McCabe (1999).
Change in mean annual runoff (mm)
-101 and lower
-100 to 0
1 to 100
101 and higher
43
projections for the year 2030 derived from the two climate models suggest very differentscenarios. The Canadian model results indicate that runoff would decline by 2030 in allregions except California. In 12 of the 18 regions, runoff declines by more than 20%,outcomes that could have serious adverse impacts if not addressed by water managers. Incontrast, the Hadley model projects increases in average runoff in most regions: most ofthe nation’s arid and semiarid regions would have substantially more water, reducingproblems of water scarcity but perhaps increasing the threat of floods. By the year 2090,most of the U.S. is projected to be even wetter under the Hadley model; the Canadianmodel suggests some further drying in the East but an increase in supplies in much of theWest (Wolock and McCabe 1999). The changes in runoff for the period 2025-2034were, for the most part, smaller in magnitude than natural variability and the expectederror in the simulations. For the period 2090-2099, runoff changes in several regionswere more significant, though the overall results are still highly uncertain.
Several different conclusions can be drawn from these results. First, the great differences inresults show the difficulty of making accurate “predictions” of future runoff – these resultsshould be viewed as sensitivity studies and used with considerable caution. Second, runoffis extremely sensitive to climate conditions. Large increases in precipitation will probablylead to increases in runoff: such increases can either worsen or lessen water managementproblems, depending on the region and the nature of the problem. Third, far more workis needed, on a regional scale, to understand how climate will affect national waterresources. Until GCMs get better at evaluating regional temperature and precipitation,their regional estimates of future runoff must be considered speculative and uncertain.While it is well established that changes in runoff are likely to occur, we have littleconfidence that we understand how specific regions will be affected. The above discussionand model results highlight many of the uncertainties surrounding the implications ofclimate change for overall water availability.
Another large-scale runoff modeling study for the National Assessment was conductedunder the auspices of the Pacific Northwest National Laboratory (PNNL) climate group.This project used a GIS-based modeling system (HUMUS) that provides input for a soilwater “assessment tool” (SWAT) (Arnold et al. 1998, Arnold et al. 1999, Srinivasan et al.1993). HUMUS was used to simulate the workings of the hydrologic cycle at the scale ofthe 8-digit United States Geographic Survey Hydrologic Unit Areas (HUA) (USGS 1987)using inputs assembled for the conterminous United States at the scale of 1:250,000. Forthe National Assessment project, analysis was confined to the Hadley 2025-2034 and2090-2099 climate scenarios. The much drier Canadian climate scenarios would have ledto quite different conclusions.
The soil-water model represents the basin water balance through four storage volumes:snow, 0-2 meters of soil, the shallow aquifer (2 – 20 m), and the deep aquifer (> 20 m).Hydrologic processes simulated in the model include infiltration, evapotranspiration (ET),net primary productivity, lateral flow, percolation, and total water yields (includingsurface runoff and changes in groundwater storage). The model also includes algorithmsto simulate the effect of higher CO
2 concentrations on photosynthesis and on water-use
efficiency (WUE) through increased stomatal resistance for C3 and C4 vegetation (Stockleet al. 1992a, 1992b). The HUMUS simulations of climate change effects in 2030 and2095 were made under two CO
2 concentrations: recent ambient (365 ppm) levels and
levels elevated to represent a doubling of the pre-industrial concentration (560 ppm).
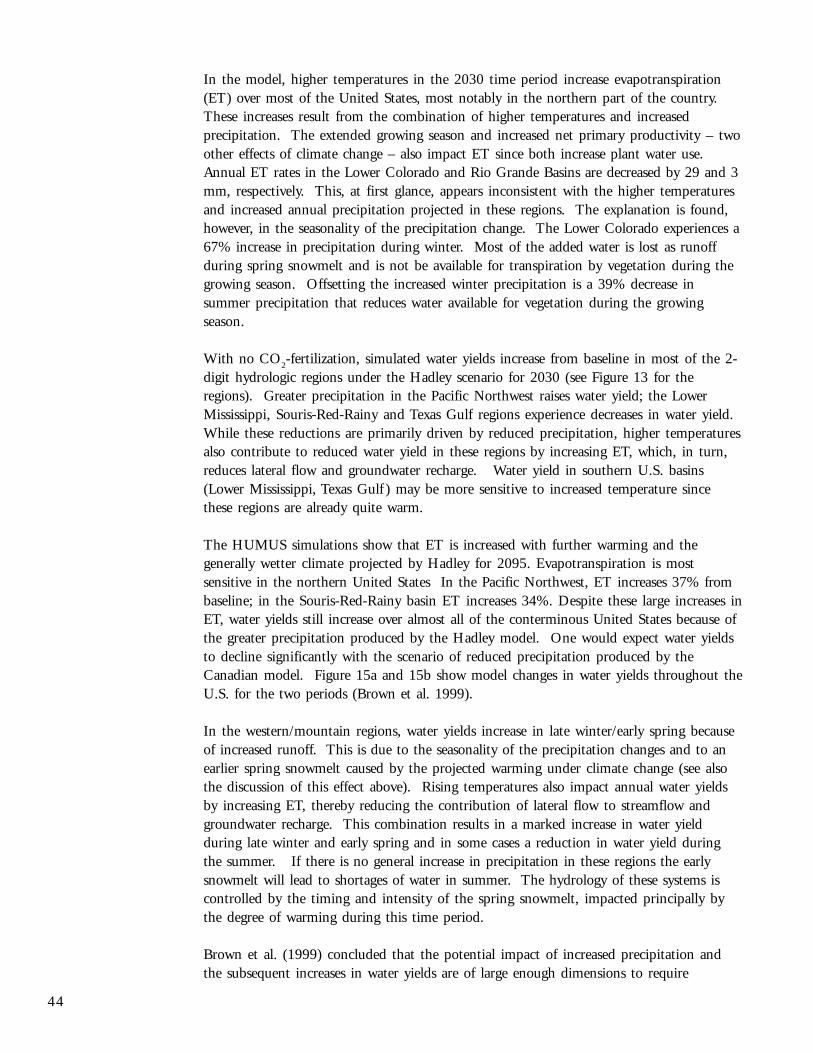
44
In the model, higher temperatures in the 2030 time period increase evapotranspiration(ET) over most of the United States, most notably in the northern part of the country.These increases result from the combination of higher temperatures and increasedprecipitation. The extended growing season and increased net primary productivity – twoother effects of climate change – also impact ET since both increase plant water use.Annual ET rates in the Lower Colorado and Rio Grande Basins are decreased by 29 and 3mm, respectively. This, at first glance, appears inconsistent with the higher temperaturesand increased annual precipitation projected in these regions. The explanation is found,however, in the seasonality of the precipitation change. The Lower Colorado experiences a67% increase in precipitation during winter. Most of the added water is lost as runoffduring spring snowmelt and is not be available for transpiration by vegetation during thegrowing season. Offsetting the increased winter precipitation is a 39% decrease insummer precipitation that reduces water available for vegetation during the growingseason.
With no CO2-fertilization, simulated water yields increase from baseline in most of the 2-
digit hydrologic regions under the Hadley scenario for 2030 (see Figure 13 for theregions). Greater precipitation in the Pacific Northwest raises water yield; the LowerMississippi, Souris-Red-Rainy and Texas Gulf regions experience decreases in water yield.While these reductions are primarily driven by reduced precipitation, higher temperaturesalso contribute to reduced water yield in these regions by increasing ET, which, in turn,reduces lateral flow and groundwater recharge. Water yield in southern U.S. basins(Lower Mississippi, Texas Gulf ) may be more sensitive to increased temperature sincethese regions are already quite warm.
The HUMUS simulations show that ET is increased with further warming and thegenerally wetter climate projected by Hadley for 2095. Evapotranspiration is mostsensitive in the northern United States In the Pacific Northwest, ET increases 37% frombaseline; in the Souris-Red-Rainy basin ET increases 34%. Despite these large increases inET, water yields still increase over almost all of the conterminous United States because ofthe greater precipitation produced by the Hadley model. One would expect water yieldsto decline significantly with the scenario of reduced precipitation produced by theCanadian model. Figure 15a and 15b show model changes in water yields throughout theU.S. for the two periods (Brown et al. 1999).
In the western/mountain regions, water yields increase in late winter/early spring becauseof increased runoff. This is due to the seasonality of the precipitation changes and to anearlier spring snowmelt caused by the projected warming under climate change (see alsothe discussion of this effect above). Rising temperatures also impact annual water yieldsby increasing ET, thereby reducing the contribution of lateral flow to streamflow andgroundwater recharge. This combination results in a marked increase in water yieldduring late winter and early spring and in some cases a reduction in water yield duringthe summer. If there is no general increase in precipitation in these regions the earlysnowmelt will lead to shortages of water in summer. The hydrology of these systems iscontrolled by the timing and intensity of the spring snowmelt, impacted principally bythe degree of warming during this time period.
Brown et al. (1999) concluded that the potential impact of increased precipitation andthe subsequent increases in water yields are of large enough dimensions to require
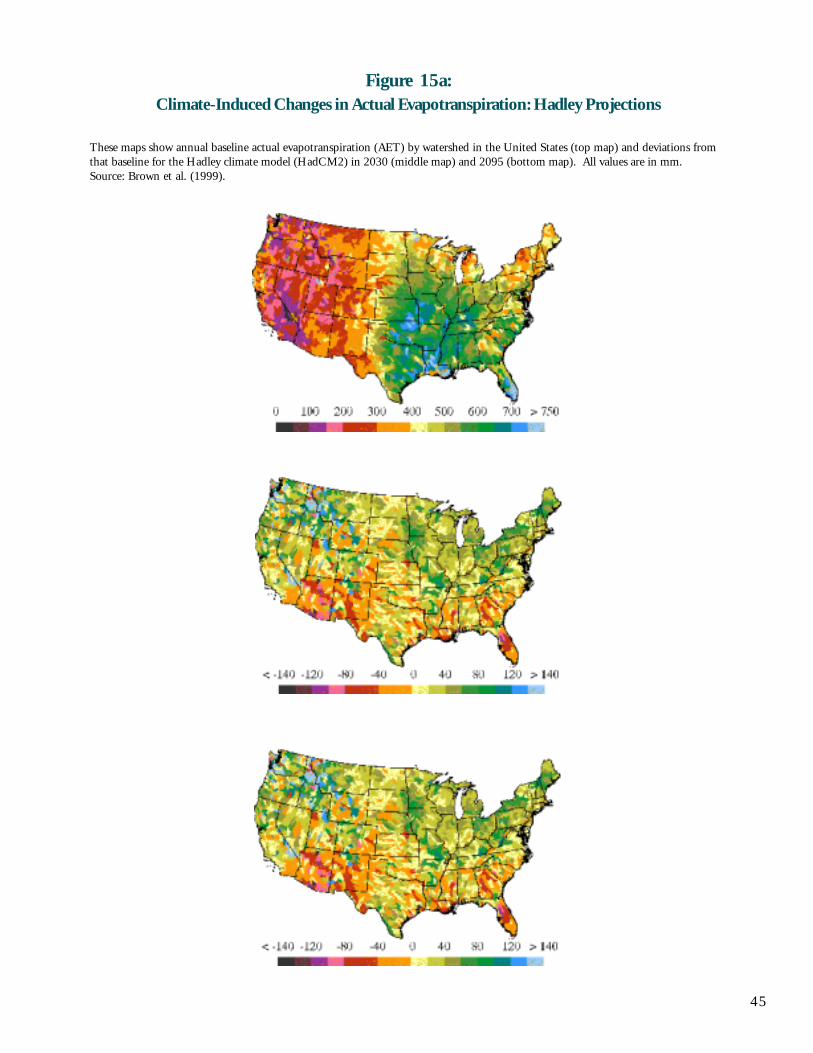
45
Figure 15a:Climate-Induced Changes in Actual Evapotranspiration: Hadley Projections
These maps show annual baseline actual evapotranspiration (AET) by watershed in the United States (top map) and deviations fromthat baseline for the Hadley climate model (HadCM2) in 2030 (middle map) and 2095 (bottom map). All values are in mm.Source: Brown et al. (1999).
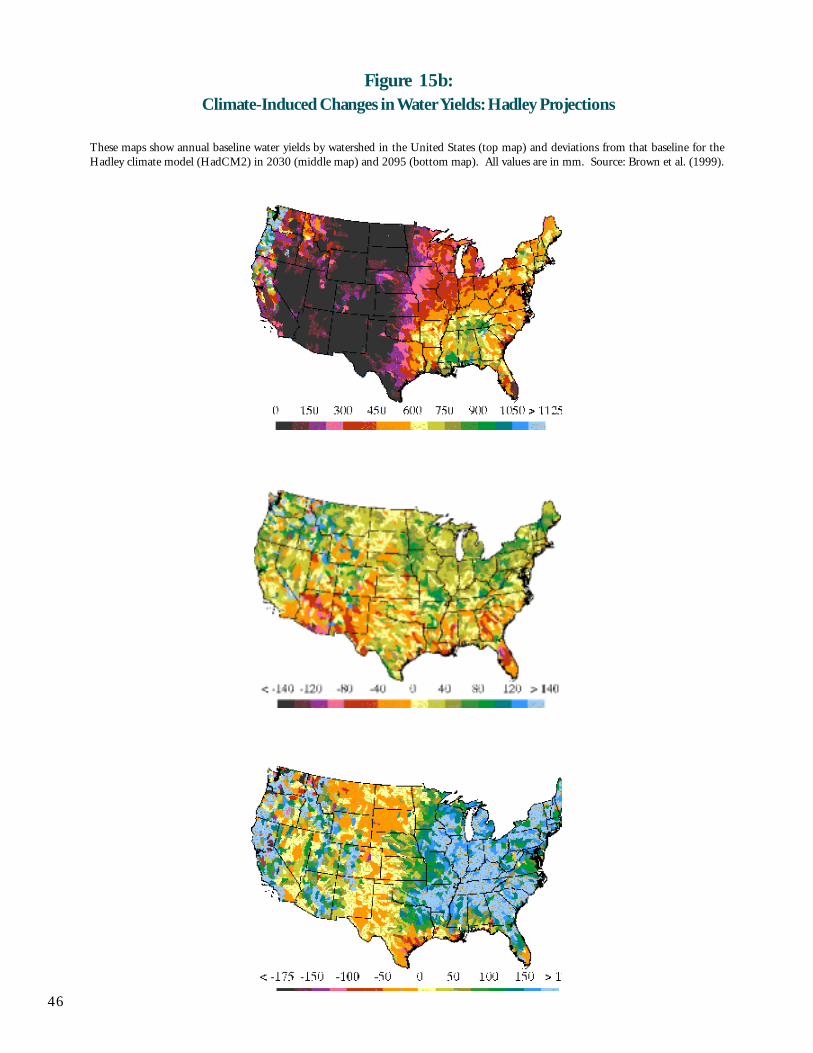
46
Figure 15b:Climate-Induced Changes in Water Yields: Hadley Projections
These maps show annual baseline water yields by watershed in the United States (top map) and deviations from that baseline for theHadley climate model (HadCM2) in 2030 (middle map) and 2095 (bottom map). All values are in mm. Source: Brown et al. (1999).
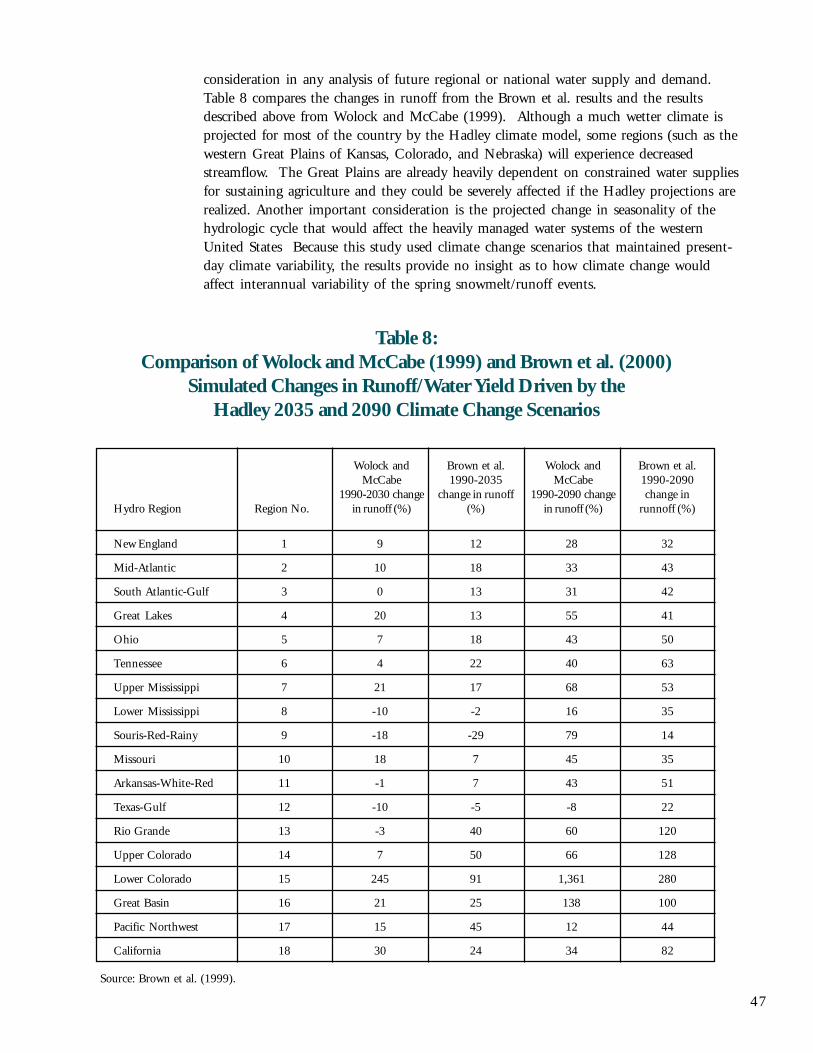
47
consideration in any analysis of future regional or national water supply and demand.Table 8 compares the changes in runoff from the Brown et al. results and the resultsdescribed above from Wolock and McCabe (1999). Although a much wetter climate isprojected for most of the country by the Hadley climate model, some regions (such as thewestern Great Plains of Kansas, Colorado, and Nebraska) will experience decreasedstreamflow. The Great Plains are already heavily dependent on constrained water suppliesfor sustaining agriculture and they could be severely affected if the Hadley projections arerealized. Another important consideration is the projected change in seasonality of thehydrologic cycle that would affect the heavily managed water systems of the westernUnited States Because this study used climate change scenarios that maintained present-day climate variability, the results provide no insight as to how climate change wouldaffect interannual variability of the spring snowmelt/runoff events.
Hydro Region
New England
Mid-Atlantic
South Atlantic-Gulf
Great Lakes
Ohio
Tennessee
Upper Mississippi
Lower Mississippi
Souris-Red-Rainy
Missouri
Arkansas-White-Red
Texas-Gulf
Rio Grande
Upper Colorado
Lower Colorado
Great Basin
Pacific Northwest
California
Region No.
1
2
3
4
5
6
7
8
9
10
11
12
13
14
15
16
17
18
Wolock andMcCabe
1990-2030 changein runoff (%)
9
10
0
20
7
4
21
-10
-18
18
-1
-10
-3
7
245
21
15
30
Brown et al.1990-2035
change in runoff(%)
12
18
13
13
18
22
17
-2
-29
7
7
-5
40
50
91
25
45
24
Wolock andMcCabe
1990-2090 changein runoff (%)
28
33
31
55
43
40
68
16
79
45
43
-8
60
66
1,361
138
12
34
Brown et al.1990-2090change in
runnoff (%)
32
43
42
41
50
63
53
35
14
35
51
22
120
128
280
100
44
82
Table 8:Comparison of Wolock and McCabe (1999) and Brown et al. (2000)
Simulated Changes in Runoff/Water Yield Driven by theHadley 2035 and 2090 Climate Change Scenarios
Source: Brown et al. (1999).
48
Regional Runoff
Runoff integrates changes in hydrologic characteristics over a large area and is aparticularly valuable indicator of climate change. As noted in the section above, however,large-area estimates of runoff are both uncertain and less valuable for regional watermanagers. Many detailed estimates of changes in runoff due to climate change have beenproduced for the United States using regional hydrologic models of specific river basins. Inspite of their inevitable uncertainties, it is instructive to review the results of these paststudies. By using anticipated, hypothetical, or historical changes in temperature andprecipitation and models that include realistic small-scale hydrology, modelers haveconsistently seen significant changes in the timing and magnitude of runoff resulting fromquite plausible changes in climate variables. With some exceptions, however, there is lowconfidence in specific regional projections because estimates of precipitation changes atregional and finer scales vary substantial from climate model to model. Society andnatural ecosystems are highly dependent upon river flows and any changes caused by thegreenhouse effect would be cause for concern. Specific regional impacts will depend onboth future climate changes as well as the economic, institutional, and structuralconditions in any region.
In the arid and semi-arid western United States, it is well established that relativelymodest changes in precipitation can have proportionally large impacts on runoff. Even inthe absence of changes in precipitation patterns, higher temperatures resulting fromincreased greenhouse gas concentrations lead to higher evaporation rates, reductions instreamflow, and increased frequency of droughts (Schaake 1990, Rind et al. 1990, Nashand Gleick 1991, 1993). In such cases, increases in precipitation would be required tomaintain runoff at historical levels.
In cold and cool-temperate zones of the United States, which includes most mid- to high-latitude areas and large areas of mountains, a large proportion of annual runoff comes fromspring snowmelt. The major effect of warming in these regions is a change in the timingof streamflow, including both the intensity and timing of peak flows. A decliningproportion of total precipitation falls as snow as temperatures rise, more winter runoffoccurs, and remaining snow melts sooner and faster in spring (Gleick 1986, 1987a,b,Lettenmaier and Gan 1990, Nash and Gleick 1991, Miller et al. 1992, Cooley et al.1992, Martinec et al. 1992, Burn 1994, IPCC 1996c, Leung and Wigmosta 1999,Hamlet and Lettenmaier 1999). In some basins, spring peak runoff may increase; inothers, runoff volumes may significantly shift to winter months.
In southern portions of the United States, runoff is affected much more significantly by totalprecipitation. In these regions, the hydrologic regime is not dominated by snowfall andsnowmelt but by seasonal cycles of rainfall and evaporation. In the arid and semi-aridregions of the United States, runoff is extremely sensitive to rainfall: a small percentagechange in rainfall can produce a much larger percentage change in runoff (i.e., rainfall/runoff ratios are large).
Considerable effort has been made to evaluate climate impacts in particular river basins,including the Sacramento, the San Joaquin, the Delaware, the Mississippi, the Colorado,the Columbia, the Carson/Truckee, the Apalachicola-Chattahoochee-Flint, and others.Many of them show large possible changes in future hydrologic conditions relative to
49
historical conditions. Table 9 and Figure 16 provide estimates of the impacts of a range oftemperature and precipitation changes on annual runoff for several mountainous riverbasins in the western United States. These model studies used a variety of climatescenarios ranging from GCM-derived temperature and precipitation estimates topaleoclimatic and hypothetical temperature and precipitation data used as sensitivitystudies.
The results of the simulation studies summarized in Figure 16 and Table 9 support theconclusion that relatively small changes in temperature and precipitation can have largeeffects on runoff. In every one of these studies, an increase in temperature and no changein precipitation resulted in decreases in runoff. With no change in precipitation,estimated runoff declines by 3 to 12% with a 2o C increase in temperature and by 7 to21% with a 4o C increase in temperature. A 10% reduction in precipitation and a 2oCincrease in temperature reduce estimated runoff by between 13 to 40% in most studies.Increasing precipitation by 10% approximately balances evaporative losses resulting froman increase in temperature of 4oC. These results are not comprehensive, but are suggestiveas to the possible magnitude and uncertainty surrounding the hydrologic implications of agreenhouse warming. In contrast to these variable results, shifts in runoff timing in basinswith snowfall and snowmelt are consistent in all studies that looked at daily or monthlyrunoff. These studies show with very high confidence that increases in winter runoff,decreases in spring and summer runoff, and higher peak flows will occur in such basins iftemperatures rise.
Georgakakos and Yao (2000a) investigated the response of eight basins in Georgia andAlabama using hydrologic watershed models forced by historic (1939 to 1993) and future(1994 to 2093) climate scenarios. The latter were generated using the Canadian andHadley model projections. Compared to the historical (baseline) response, under theCanadian model results all basins exhibit less precipitation (ranging from 15 to 22% ofthe historical values), increased evapotranspiration (16 to 22% below historical values),less runoff (28 to 48% below historical values), and smaller runoff coefficients (13 to 35%below historical values). By contrast, under the Hadley model, the non-snowmelt drivenbasins experience higher precipitation (7 to 14 % above historical values), higherevapotranspiration (8 to 11% above historical values), higher runoff (7 to 21% abovehistorical values), and higher runoff coefficients (1 to 10% above historical values). Noappreciable seasonal shift was noted for any of these variables since these basins havelimited snow, while runoff exhibited higher variability (Georgakakos and Yao 2000a).
Soil Moisture
Soil moisture is a crucial hydrologic variable of particular interest to many, includingecologists and farmers. Precipitation that does not evaporate back into the atmosphere,transpire immediately from vegetation, becomes incorporated into plant material, getscaptured by humans for direct use, or runs off into rivers, lakes, or the ocean, infiltratesinto the soil, where part of it may filter down to groundwater. The amount of waterstored in the soils is influenced by vegetation type, soil type, evaporation rates, andprecipitation intensity. Soil moisture is critically important in both supportingagricultural production and defining natural vegetative type and extent. Any changes inclimate that alter precipitation patterns and the evapotranspiration regime will directly
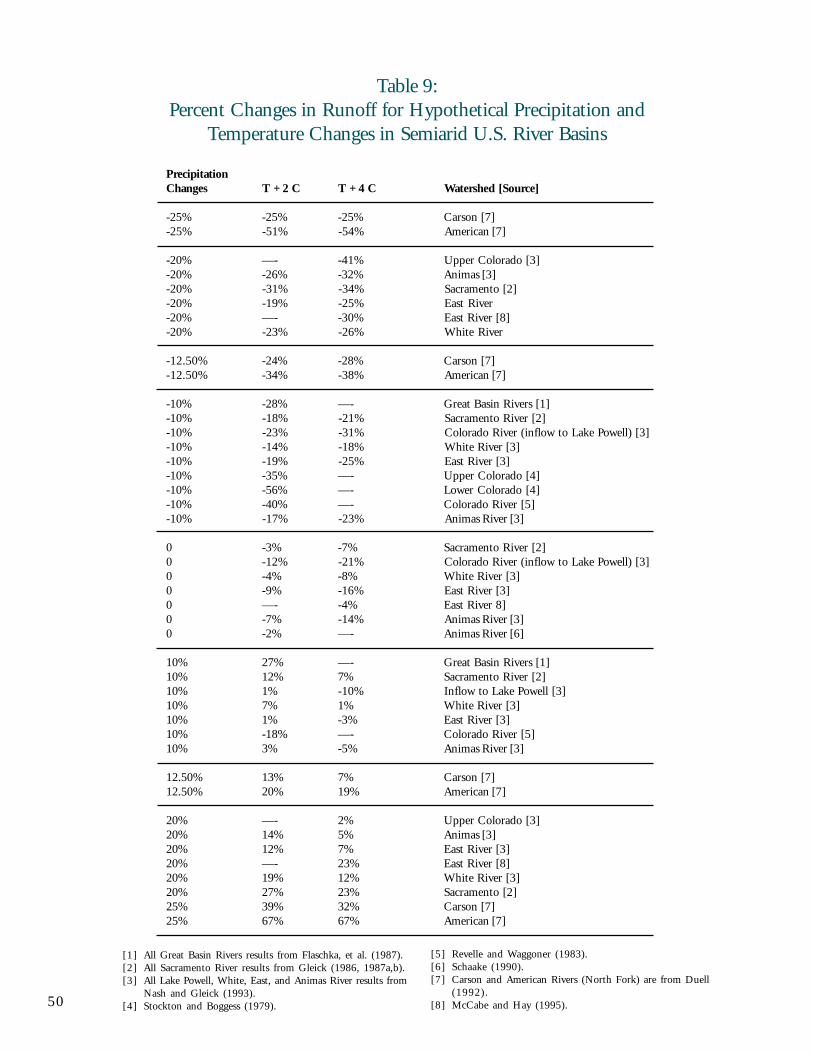
50
Table 9:Percent Changes in Runoff for Hypothetical Precipitation and
Temperature Changes in Semiarid U.S. River Basins
[1] All Great Basin Rivers results from Flaschka, et al. (1987).[2] All Sacramento River results from Gleick (1986, 1987a,b).[3] All Lake Powell, White, East, and Animas River results from
Nash and Gleick (1993).[4] Stockton and Boggess (1979).
PrecipitationChanges T + 2 C T + 4 C Watershed [Source]
-25% -25% -25% Carson [7]-25% -51% -54% American [7]
-20% —- -41% Upper Colorado [3]-20% -26% -32% Animas [3]-20% -31% -34% Sacramento [2]-20% -19% -25% East River-20% —- -30% East River [8]-20% -23% -26% White River
-12.50% -24% -28% Carson [7]-12.50% -34% -38% American [7]
-10% -28% —- Great Basin Rivers [1]-10% -18% -21% Sacramento River [2]-10% -23% -31% Colorado River (inflow to Lake Powell) [3]-10% -14% -18% White River [3]-10% -19% -25% East River [3]-10% -35% —- Upper Colorado [4]-10% -56% —- Lower Colorado [4]-10% -40% —- Colorado River [5]-10% -17% -23% Animas River [3]
0 -3% -7% Sacramento River [2]0 -12% -21% Colorado River (inflow to Lake Powell) [3]0 -4% -8% White River [3]0 -9% -16% East River [3]0 —- -4% East River 8]0 -7% -14% Animas River [3]0 -2% —- Animas River [6]
10% 27% —- Great Basin Rivers [1]10% 12% 7% Sacramento River [2]10% 1% -10% Inflow to Lake Powell [3]10% 7% 1% White River [3]10% 1% -3% East River [3]10% -18% —- Colorado River [5]10% 3% -5% Animas River [3]
12.50% 13% 7% Carson [7]12.50% 20% 19% American [7]
20% —- 2% Upper Colorado [3]20% 14% 5% Animas [3]20% 12% 7% East River [3]20% —- 23% East River [8]20% 19% 12% White River [3]20% 27% 23% Sacramento [2]25% 39% 32% Carson [7]25% 67% 67% American [7]
[5] Revelle and Waggoner (1983).[6] Schaake (1990).[7] Carson and American Rivers (North Fork) are from Duell
(1992).[8] McCabe and Hay (1995).
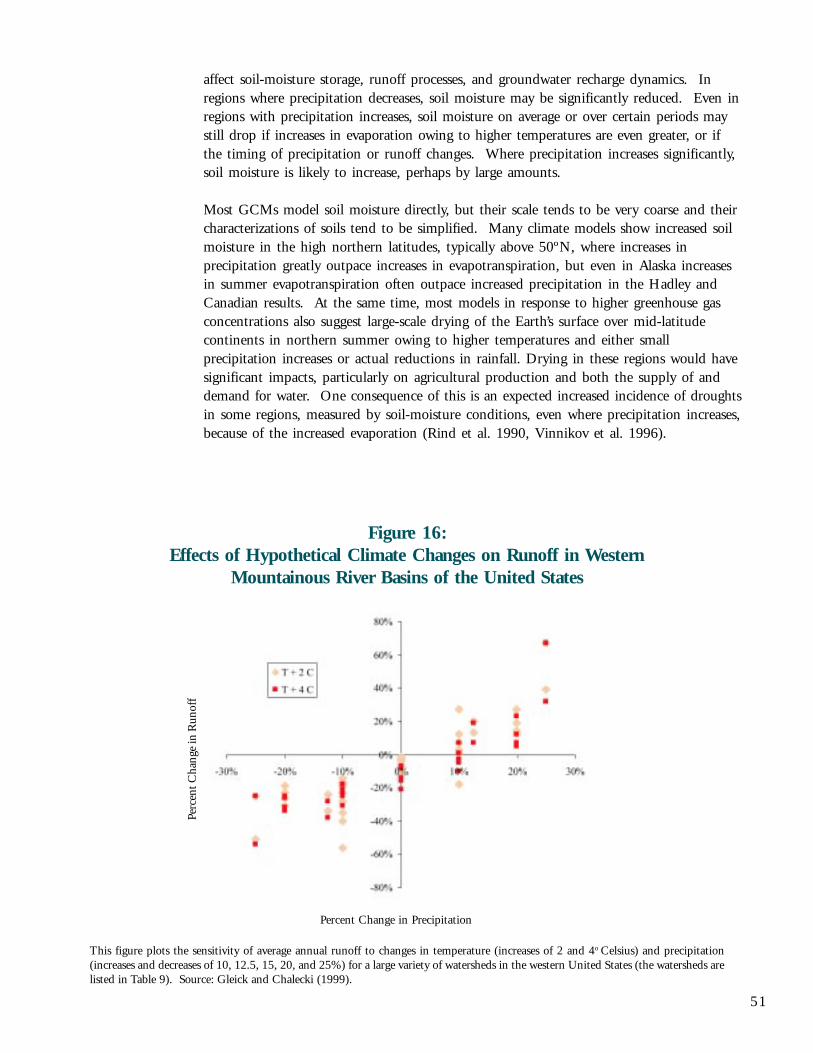
51
affect soil-moisture storage, runoff processes, and groundwater recharge dynamics. Inregions where precipitation decreases, soil moisture may be significantly reduced. Even inregions with precipitation increases, soil moisture on average or over certain periods maystill drop if increases in evaporation owing to higher temperatures are even greater, or ifthe timing of precipitation or runoff changes. Where precipitation increases significantly,soil moisture is likely to increase, perhaps by large amounts.
Most GCMs model soil moisture directly, but their scale tends to be very coarse and theircharacterizations of soils tend to be simplified. Many climate models show increased soilmoisture in the high northern latitudes, typically above 50ºN, where increases inprecipitation greatly outpace increases in evapotranspiration, but even in Alaska increasesin summer evapotranspiration often outpace increased precipitation in the Hadley andCanadian results. At the same time, most models in response to higher greenhouse gasconcentrations also suggest large-scale drying of the Earth’s surface over mid-latitudecontinents in northern summer owing to higher temperatures and either smallprecipitation increases or actual reductions in rainfall. Drying in these regions would havesignificant impacts, particularly on agricultural production and both the supply of anddemand for water. One consequence of this is an expected increased incidence of droughtsin some regions, measured by soil-moisture conditions, even where precipitation increases,because of the increased evaporation (Rind et al. 1990, Vinnikov et al. 1996).
Percent Change in Precipitation
Figure 16:Effects of Hypothetical Climate Changes on Runoff in Western
Mountainous River Basins of the United States
This figure plots the sensitivity of average annual runoff to changes in temperature (increases of 2 and 4o Celsius) and precipitation(increases and decreases of 10, 12.5, 15, 20, and 25%) for a large variety of watersheds in the western United States (the watersheds arelisted in Table 9). Source: Gleick and Chalecki (1999).
Perc
ent C
hang
e in
Run
off
Percent Change in Precipitation
52
Research from individual basins indicates similar results. In the Sacramento Basin innorthern California, a study identified reductions in summer soil moisture of 30% ormore resulting from a shift in the timing of runoff from spring to winter, a decrease insnow, and higher summer temperatures and evaporative losses (Gleick 1986, 1987a,b).This finding has also been seen in some of the detailed hydrologic modeling of theColorado River basin, where large increases in precipitation were found to be necessary inorder to simply maintain soil moisture at present historical levels as temperatures andevaporative losses rise (Nash and Gleick 1991, 1993).
More recently, Gregory et al. (1997) noted that sensitivity studies using the Hadleymodel led to reduced soil-moisture conditions in mid-latitude summers in the northernhemisphere as temperature and evaporation rise and winter snow cover and spring runoffdecline. In another sensitivity analysis of GCM results, Wetherald and Manabe (1999)investigated the temporal and spatial variation of soil moisture associated with globalwarming in a coupled ocean-atmosphere model. Their results show both summer soilmoisture dryness and winter wetness in middle and high latitudes of North America andsouthern Europe. In the Wetherald and Manabe study, the percentage reduction of soilmoisture in summer is large, and soil moisture is decreased for nearly the entire year inresponse to greenhouse warming.
In order to explore the question of the expected tendencies and sensitivities of soilmoisture over the conterminous United States given different climate projections, amacroscale hydrologic model was developed. This model includes soil moisture, runoff,and snow accumulation and ablation, and is forced by precipitation, temperature, andpotential evapotranspiration using spatial digital data of soil texture and plant cover. Themodel determines soil-moisture field capacity, hydraulic conductivity, and plantphenology seasonal coefficients, and yields good reproduction of observed conditions overthe historical record (Brumbelow and Georgakakos 2000, Georgakakos and Smith 2000).
Assuming a one-percent greenhouse-gas increase scenario through the period 1999 to2050 results in a reduction of the average soil-moisture content of the conterminousUnited States in the model (Figure 17). Significant changes were projected for the easternUnited States (both southeast and northeast) where an increasing trend of soil-moisturedryness was seen during the period 2025-2060. It was also found that with the increaseof greenhouse gases there would be an increase in soil-moisture variability, with regionalenhancement of the range of extreme soil-moisture values. If these model results areaccurate, the severity of future droughts and floods would increase in these regions.
In the southeastern United States, Georgakakos and Yao (2000a) found that soil moisturein the model declines sharply (by as much as 30 to 40%) under the Canadian scenario,and increases somewhat (by 10 to 20%) under the Hadley scenario. The authors note thepoor ability of the Canadian model to reproduce current climate in this region. Figure 18portrays the expected sequences of a soil-moisture index (normalized by its averagehistorical value) for four ACF sub-basins, depicting these trends but also indicating thetendency of the soil moisture to become more and more variable under both scenarios(Georgakakos and Yao 2000a). As noted in the section on agriculture, soil-moistureresponse has important implications for crop yield and irrigation demand (Brumbelowand Georgakakos 2000).
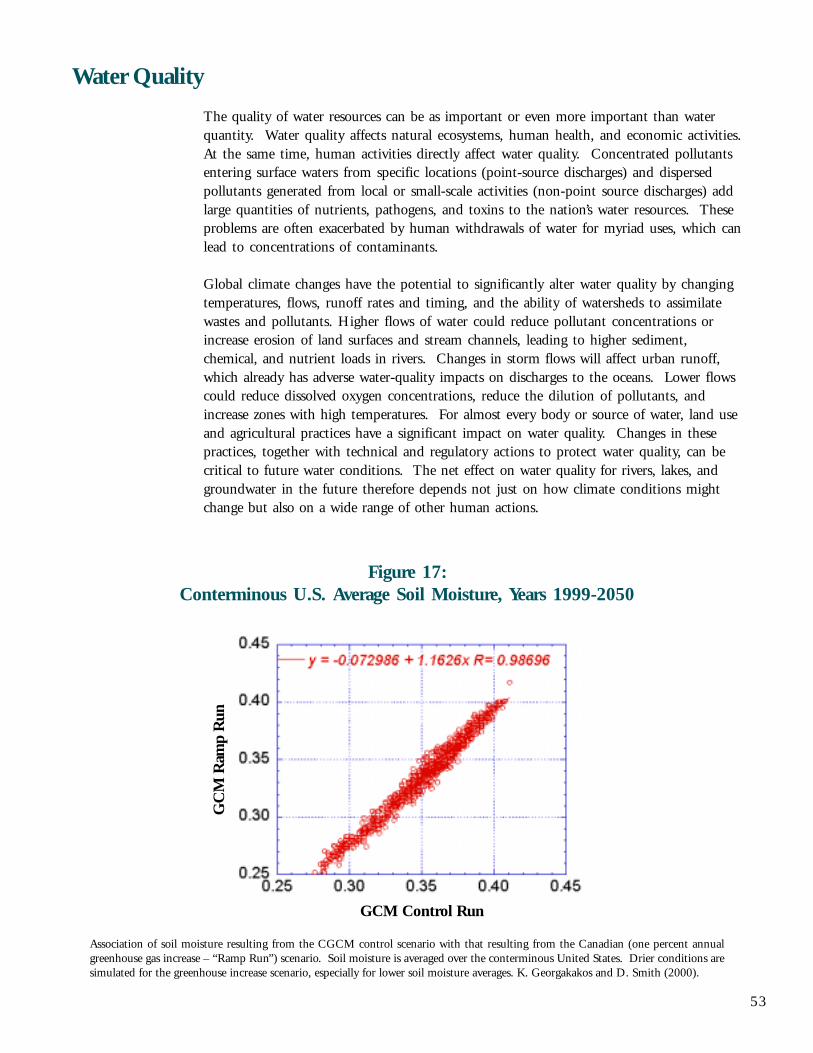
53
Water Quality
The quality of water resources can be as important or even more important than waterquantity. Water quality affects natural ecosystems, human health, and economic activities.At the same time, human activities directly affect water quality. Concentrated pollutantsentering surface waters from specific locations (point-source discharges) and dispersedpollutants generated from local or small-scale activities (non-point source discharges) addlarge quantities of nutrients, pathogens, and toxins to the nation’s water resources. Theseproblems are often exacerbated by human withdrawals of water for myriad uses, which canlead to concentrations of contaminants.
Global climate changes have the potential to significantly alter water quality by changingtemperatures, flows, runoff rates and timing, and the ability of watersheds to assimilatewastes and pollutants. Higher flows of water could reduce pollutant concentrations orincrease erosion of land surfaces and stream channels, leading to higher sediment,chemical, and nutrient loads in rivers. Changes in storm flows will affect urban runoff,which already has adverse water-quality impacts on discharges to the oceans. Lower flowscould reduce dissolved oxygen concentrations, reduce the dilution of pollutants, andincrease zones with high temperatures. For almost every body or source of water, land useand agricultural practices have a significant impact on water quality. Changes in thesepractices, together with technical and regulatory actions to protect water quality, can becritical to future water conditions. The net effect on water quality for rivers, lakes, andgroundwater in the future therefore depends not just on how climate conditions mightchange but also on a wide range of other human actions.
Figure 17:Conterminous U.S. Average Soil Moisture, Years 1999-2050
Association of soil moisture resulting from the CGCM control scenario with that resulting from the Canadian (one percent annualgreenhouse gas increase – “Ramp Run”) scenario. Soil moisture is averaged over the conterminous United States. Drier conditions aresimulated for the greenhouse increase scenario, especially for lower soil moisture averages. K. Georgakakos and D. Smith (2000).
GCM Control Run
GC
M R
amp
Run
54
In a review of potential impacts of climate change on water quality, Murdoch et al. (2000)conclude that significant changes in water quality are known to occur as a direct result ofshort-term changes in climate. They note that water quality in ecological transition zonesand areas of natural climate extremes is vulnerable to climate changes that increasetemperatures or change the variability of precipitation and argue that changes in land andresource use will have comparable or even greater impacts on water quality than changes intemperature and precipitation. They contend that long-term monitoring of water qualityis critical for identifying severe impacts, as is developing appropriate managementstrategies for protecting water quality.
Water quality is a direct result of the chemical inputs received from air and thesurrounding land and the biogeochemical processes that transform those inputs (Murdochet al. 2000). Direct chemical contributions come from atmospheric deposition or pointsource discharges. Indirect contributions come from water that flows off watershedsthrough vegetation, soils, and aquifers, each of which contributes to water chemistry.Climate changes will influence water quality by altering these contributions, particularlythrough changes in temperature and moisture. A comprehensive summary of many ofthese changes can be found in Murdoch et al. (2000).
Global and regional increases in air temperature, and the associated increases in watertemperature, are likely to lead to adverse changes in water quality, even in the absence ofchanges in precipitation. The southeastern U.S., for example, has significant variability instreamflow due to seasonal changes in evapotranspiration rates. Mulholland et al. (1997)projected increased rates of oxygen depletion in already eutrophied waters of this region ifglobal warming occurs. Warming has been shown to increase the rate of biologicalproduction and decomposition by increasing rates of metabolism, the duration of thegrowing season, and the volume of lakes that are biologically active (Covich et al. 1997,Hauer et al. 1997). Increases in productivity increase nutrient cycling and accelerateeutrophication in lakes with sufficient nutrients and oxygen (Mulholland et al. 1997). Inoxygen-poor waters, increased productivity could lead to oxygen depletion, which wouldsubsequently limit overall productivity. Fang and Stefan (1997) evaluated changes in lakestratification in cold regions of the north-central United States under conditions of climatechanges. They showed that winter stratification would be weakened as averagetemperatures increased and that the anoxic zone could disappear.
Moore et al. (1997) note that increased water temperatures enhance the toxicity of metalsin aquatic ecosystems and that increased lengths of biological activity could lead toincreased accumulation of toxics in organisms. Ironically, increased bioaccumulationcould decrease the concentration of toxics in the water column, improving local waterquality. Similarly, higher temperatures may lead to increased transfer of chemicals fromthe water column to sediments.
Changes in terrestrial ecosystems will also lead to changes in water quality by alteringnutrient cycling rates and the delivery of nutrients to surface waters. Nitrification rates insoils are temperature dependent and in some regions, mean annual nitrate concentrationsin streams are highly correlated with average annual air temperature (Murdoch et al.1998). Similarly, a significant correlation has been observed between soil respiration ratesand temperature. Alexander et al. (1996) looked at nutrient loadings to coastal zones as afunction of streamflow volume. Because streamflows along Atlantic coast states increased
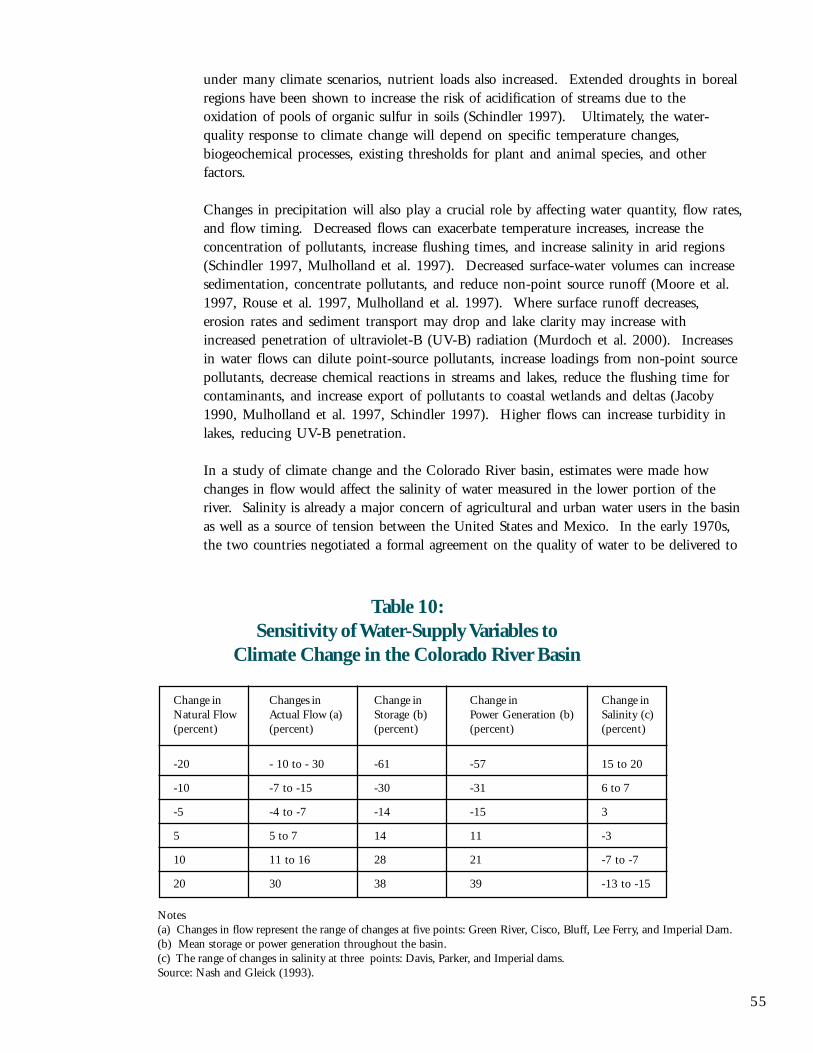
55
under many climate scenarios, nutrient loads also increased. Extended droughts in borealregions have been shown to increase the risk of acidification of streams due to theoxidation of pools of organic sulfur in soils (Schindler 1997). Ultimately, the water-quality response to climate change will depend on specific temperature changes,biogeochemical processes, existing thresholds for plant and animal species, and otherfactors.
Changes in precipitation will also play a crucial role by affecting water quantity, flow rates,and flow timing. Decreased flows can exacerbate temperature increases, increase theconcentration of pollutants, increase flushing times, and increase salinity in arid regions(Schindler 1997, Mulholland et al. 1997). Decreased surface-water volumes can increasesedimentation, concentrate pollutants, and reduce non-point source runoff (Moore et al.1997, Rouse et al. 1997, Mulholland et al. 1997). Where surface runoff decreases,erosion rates and sediment transport may drop and lake clarity may increase withincreased penetration of ultraviolet-B (UV-B) radiation (Murdoch et al. 2000). Increasesin water flows can dilute point-source pollutants, increase loadings from non-point sourcepollutants, decrease chemical reactions in streams and lakes, reduce the flushing time forcontaminants, and increase export of pollutants to coastal wetlands and deltas (Jacoby1990, Mulholland et al. 1997, Schindler 1997). Higher flows can increase turbidity inlakes, reducing UV-B penetration.
In a study of climate change and the Colorado River basin, estimates were made howchanges in flow would affect the salinity of water measured in the lower portion of theriver. Salinity is already a major concern of agricultural and urban water users in the basinas well as a source of tension between the United States and Mexico. In the early 1970s,the two countries negotiated a formal agreement on the quality of water to be delivered to
Table 10:Sensitivity of Water-Supply Variables to
Climate Change in the Colorado River Basin
Change in Changes in Change in Change in Change inNatural Flow Actual Flow (a) Storage (b) Power Generation (b) Salinity (c)(percent) (percent) (percent) (percent) (percent)
-20 - 10 to - 30 -61 -57 15 to 20
-10 -7 to -15 -30 -31 6 to 7
-5 -4 to -7 -14 -15 3
5 5 to 7 14 11 -3
10 11 to 16 28 21 -7 to -7
20 30 38 39 -13 to -15
Notes(a) Changes in flow represent the range of changes at five points: Green River, Cisco, Bluff, Lee Ferry, and Imperial Dam.(b) Mean storage or power generation throughout the basin.(c) The range of changes in salinity at three points: Davis, Parker, and Imperial dams.Source: Nash and Gleick (1993).
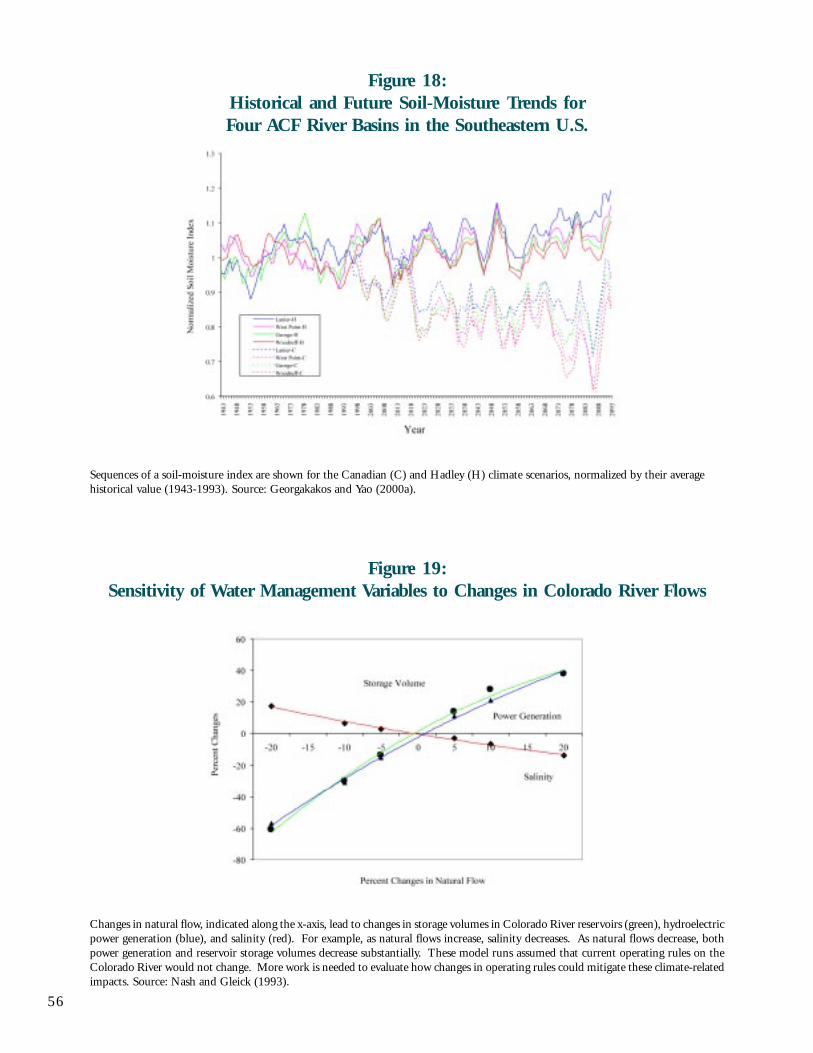
56
Figure 18:Historical and Future Soil-Moisture Trends forFour ACF River Basins in the Southeastern U.S.
Sequences of a soil-moisture index are shown for the Canadian (C) and Hadley (H) climate scenarios, normalized by their averagehistorical value (1943-1993). Source: Georgakakos and Yao (2000a).
Figure 19:Sensitivity of Water Management Variables to Changes in Colorado River Flows
Changes in natural flow, indicated along the x-axis, lead to changes in storage volumes in Colorado River reservoirs (green), hydroelectricpower generation (blue), and salinity (red). For example, as natural flows increase, salinity decreases. As natural flows decrease, bothpower generation and reservoir storage volumes decrease substantially. These model runs assumed that current operating rules on theColorado River would not change. More work is needed to evaluate how changes in operating rules could mitigate these climate-relatedimpacts. Source: Nash and Gleick (1993).
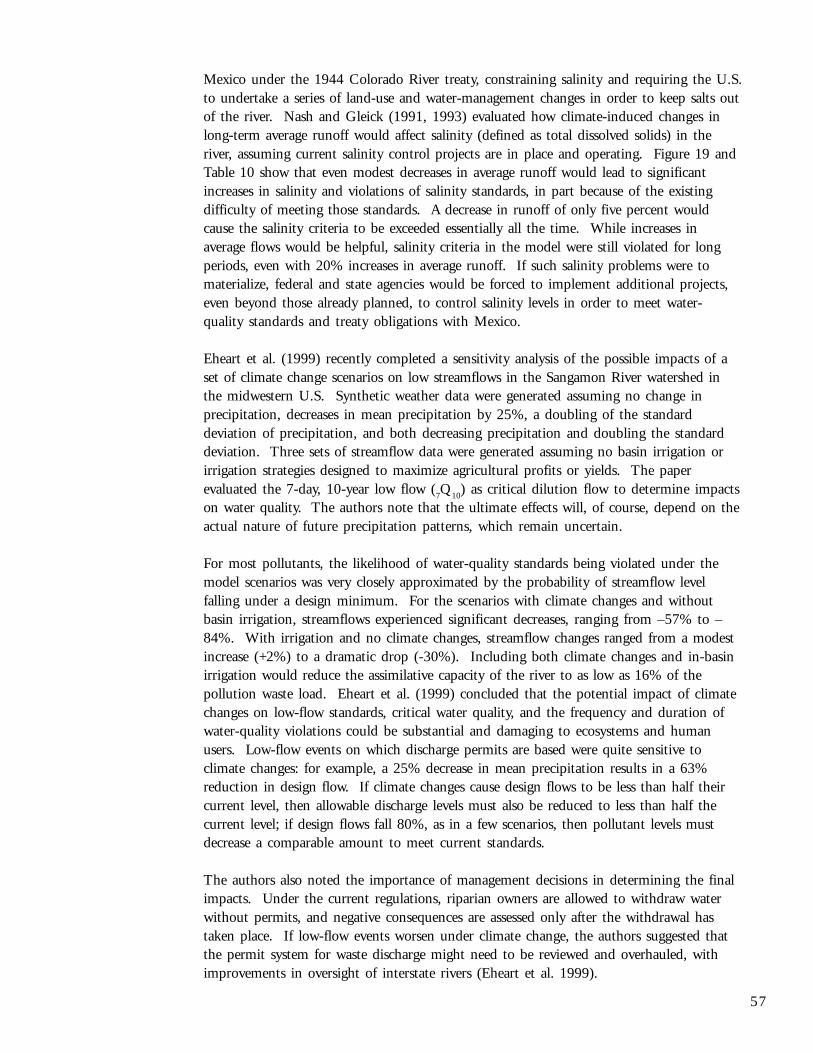
57
Mexico under the 1944 Colorado River treaty, constraining salinity and requiring the U.S.to undertake a series of land-use and water-management changes in order to keep salts outof the river. Nash and Gleick (1991, 1993) evaluated how climate-induced changes inlong-term average runoff would affect salinity (defined as total dissolved solids) in theriver, assuming current salinity control projects are in place and operating. Figure 19 andTable 10 show that even modest decreases in average runoff would lead to significantincreases in salinity and violations of salinity standards, in part because of the existingdifficulty of meeting those standards. A decrease in runoff of only five percent wouldcause the salinity criteria to be exceeded essentially all the time. While increases inaverage flows would be helpful, salinity criteria in the model were still violated for longperiods, even with 20% increases in average runoff. If such salinity problems were tomaterialize, federal and state agencies would be forced to implement additional projects,even beyond those already planned, to control salinity levels in order to meet water-quality standards and treaty obligations with Mexico.
Eheart et al. (1999) recently completed a sensitivity analysis of the possible impacts of aset of climate change scenarios on low streamflows in the Sangamon River watershed inthe midwestern U.S. Synthetic weather data were generated assuming no change inprecipitation, decreases in mean precipitation by 25%, a doubling of the standarddeviation of precipitation, and both decreasing precipitation and doubling the standarddeviation. Three sets of streamflow data were generated assuming no basin irrigation orirrigation strategies designed to maximize agricultural profits or yields. The paperevaluated the 7-day, 10-year low flow (
7Q
10) as critical dilution flow to determine impacts
on water quality. The authors note that the ultimate effects will, of course, depend on theactual nature of future precipitation patterns, which remain uncertain.
For most pollutants, the likelihood of water-quality standards being violated under themodel scenarios was very closely approximated by the probability of streamflow levelfalling under a design minimum. For the scenarios with climate changes and withoutbasin irrigation, streamflows experienced significant decreases, ranging from –57% to –84%. With irrigation and no climate changes, streamflow changes ranged from a modestincrease (+2%) to a dramatic drop (-30%). Including both climate changes and in-basinirrigation would reduce the assimilative capacity of the river to as low as 16% of thepollution waste load. Eheart et al. (1999) concluded that the potential impact of climatechanges on low-flow standards, critical water quality, and the frequency and duration ofwater-quality violations could be substantial and damaging to ecosystems and humanusers. Low-flow events on which discharge permits are based were quite sensitive toclimate changes: for example, a 25% decrease in mean precipitation results in a 63%reduction in design flow. If climate changes cause design flows to be less than half theircurrent level, then allowable discharge levels must also be reduced to less than half thecurrent level; if design flows fall 80%, as in a few scenarios, then pollutant levels mustdecrease a comparable amount to meet current standards.
The authors also noted the importance of management decisions in determining the finalimpacts. Under the current regulations, riparian owners are allowed to withdraw waterwithout permits, and negative consequences are assessed only after the withdrawal hastaken place. If low-flow events worsen under climate change, the authors suggested thatthe permit system for waste discharge might need to be reviewed and overhauled, withimprovements in oversight of interstate rivers (Eheart et al. 1999).
58
A broad assessment of the impacts of climate changes on water quality in the southeasternUnited States used climate scenarios developed from the Hadley and Canadian models tosimulate climate from now to 2100 (Cruise et al. 1999). This study looked at waterquality on a broad scale, with a focus on levels of pH, nitrates, and dissolved oxygen inUSGS hydrological regions or “hydrological units” (HUs). Most HUs in the southeast donot currently experience quality problems under normal conditions, but many water-quality indices are approaching recommended levels. Existing stresses appear to be relatedto intense agricultural practices, coastal processes, and mining activities. Without climatechanges, preliminary findings showed that there are low dissolved oxygen (DO) levels nearthe coast and in agricultural regions. There are also higher nitrate levels in agriculturalareas and in proximity to Gulf coast, but the low-DO areas do not necessarily correlate tothe areas with high nitrates. Since only larger basins are evaluated, local-scale problemsmay still occur but be missed by this approach. Finally, high pH levels occurred muchmore often than low pH levels.
The two climate models used for the National Assessment were evaluated and the resultsfor the periods 2020-2039 and 2080-2099 compared with observed water-quality datafrom 1974-1993. The authors concluded that both models led to worsening water-quality conditions in the southeastern U.S. during 2020-2039 due to drier late spring/summers and falls, corresponding to periods of intensive agriculture. Water quality thenbegins to improve as regional precipitation increases toward the end of the century. Theauthors also note that regions affected by climate-induced stresses could also be affectedby sea-level rise, leading to increased salinity (an indicator not measured in this study)and high nitrate levels (Cruise et al. 1999). This work should be considered preliminaryand it highlights areas and issues for which more research is necessary.
Lake Levels and Conditions
While most research has focused on rivers and runoff, some studies have looked at theimpacts of climate change on lakes. Lakes are known to be sensitive to a wide array ofchanges in climate conditions: variations in temperature, precipitation, humidity, andwind conditions can alter evaporation rates, the water balance of a basin, ice formation andmelting, and chemical and biological regimes (McCormick 1990, Croley 1990, Bates etal. 1993, Hauer et al. 1997, Covich et al. 1997, Grimm et al. 1997, Melak et al. 1997).Closed (endorheic) lakes are extremely sensitive to the balance of inflows and evaporativelosses. Even small changes in climate can produce large changes in lake levels and salinity(Laird et al. 1996).
Several studies have also shown that large open (exorheic) lakes are sensitive to changes ininflows and outflows. The levels of the Great Lakes, shared by the United States andCanada, change as temperatures increase and precipitation patterns change. In work doneon the impacts of climate changes on the Great Lakes, including Lake Erie, lake levels wereprojected to drop under most GCM-generated scenarios, decreasing hydropower revenues,increasing navigation costs, reducing cold-water fish habitat, and reducing the costs offlooding and shoreline erosion (Chao et al. 1999). This study also noted that the actualimpacts depended on assumptions about how the connected lakes were operated.
Hostetler and Small (1999) modeled the response of hypothetical lakes throughout the
59
United States to climate changes using an energy-balance model that simulates the verticalstructure of temperature, stratification, lake ice formation, and evaporation. The resultsfor the climate-change scenarios differ from the results for the control lakes in a number ofways. Lake ice cover decreases or even disappears entirely. Ice-free boundaries shiftnorthward. Summer lake temperatures increase, leading to inhibited mixing of thermallayers. Higher evaporation and changes in precipitation lead to changes in net moisturedepending on the model used. Despite the large differences among the models, there aresome areas of agreement: for example, ice-free lakes warmed by approximately 3o C andnearly 5o C over higher latitude lakes due to feedbacks with winter ice cover and albedo.
As air temperatures increase, fewer lakes and streams in high-latitude areas will freeze tothe bottom and the number of ice-free days will increase, leading to increases in nutrientcycling and productivity (Anderson et al. 1996, Rouse et al. 1997, Magnuson et al.1997). Other effects of increased temperature on lakes could include higher thermalstress for cold-water fish, higher trophic states leading to increased productivity and lowerdissolved oxygen, degraded water quality, increased summer anoxia, and a loss ofproductivity in boreal lakes. Among the effects of loss of ice cover are increased growth ofwarm-water fish (though productivity may be curtailed by lack of food supply) anddecreased winter anoxia. Decreases in lake levels coupled with decreased flows from runoffand groundwater may exacerbate temperature increases and loss of thermal refugia anddissolved oxygen. Increased net evaporation may increase salinity of lakes. Hostetler andSmall (1999) also note that climate variability may amplify or offset changes in the meanstate under climate changes and may ultimately be more important than changes inaverage conditions. Some non-linear or threshold events may also occur, such as a fall inlake level that cuts off outflows or separates a lake into two isolated parts.
Groundwater
Groundwater accounted for 22% of total U.S. freshwater withdrawals in 1995 (Solley etal. 1998). In some areas, current levels of groundwater use are already unsustainable. Forexample, declining aquifer levels and higher pumping lifts have increased water costs inthe southern High Plains, leading farmers to take millions of acres out of production inrecent decades. Groundwater overdrafts in California in the drier years of the 1990saveraged nearly 1.5 million acre-feet per year (California Department of Water Resources1998). Pumping from some coastal aquifers in California, Cape Cod, Long Island, NewJersey, and Florida has exceeded the rates of natural recharge, resulting in saltwaterintrusion into the aquifers.
Little work has been done on the impacts of climate changes for specific groundwaterbasins, or for general groundwater recharge characteristics or water quality. Recharge andwithdrawal rates are relatively balanced in some watersheds and any change in recharge ratescould have a major effect on the long-term sustainability of a basin. Aquifers are replenished byrainfall above the rate of evaporation and where soils are sufficiently saturated to permitadditional storage to flow into subsurface basins. Changes in recharge will result from changesin effective rainfall as well as a change in the timing of the recharge season. Increased winterrainfall, expected for some mid-continental, mid-latitude regions could lead to increasedgroundwater recharge. Actual recharge will also depend on the period over which soils arefrozen. Higher temperatures could increase the period of infiltration. Higher evaporation or
60
shorter rainfall seasons, on the other hand, could mean that soil deficits persist for longerperiods of time, shortening recharge seasons (Leonard et al. 1999).
Vaccaro (1992) studied the climate sensitivity of groundwater recharge for the Ellensburgbasin of the Columbia Plateau in Washington and concluded that median recharge rates coulddecrease by as much as 25% under the climate scenarios studied. A study of a semi-arid basinin the United States, the Edwards aquifer under Texas, showed that six of seven GCM-basedscenarios led to reductions in groundwater levels and spring flows (Loaiciga et al. 1998). Inanother study, Rosenberg et al. (1999) noted that climate changes can affect aquifers indirectly.Estimated irrigation demands in Kansas and Nebraska under current climate conditions andconditions similar to a drier, warmer period were compared. This analogue study showeddramatic increases in irrigation water needs – as much as 39% higher in Nebraska and 14%higher in Kansas, assuming no change in irrigated area. Such needs would have to be met withincreased groundwater pumping.
Several international groundwater and climate studies have relevance for similar kinds of UnitedStates regions and climate zones. A study of a semi-arid basin in Africa concluded that a 15%reduction in rainfall could lead to a 45% reduction in groundwater recharge (Sandstrom1995). Similar sensitivities were seen in two studies of the effects of climate changes ongroundwater in Australia, where proportionally larger decreases in groundwater levels were seenfor a given reduction in precipitation (Sharma 1989, Green et al. 1997). Groundwater-streamflow interactions under conditions of climate change were studied in a mountainousbasin in central Greece and large impacts were seen in spring and summer months because oftemperature-induced changes in snowfall and snowmelt patterns (Panagoulia and Dimou1996).
Groundwater and sea level (discussed in the next section) interact in coastal areas. As sea levelrises, saltwater intrusion into coastal aquifers increases. Many regions of the United States arevulnerable to such impacts but relatively few detailed regional studies have been conducted. Ina study of the impacts of climate change on groundwater discharge to the ocean, Oberdorfer(1996) used a simple water-balance model to test how changes in recharge rates and sea-levelwould affect groundwater stocks and flows in a California coastal watershed. While somesensitivities were identified, the author notes that the complexity of the interactions amongthe variables required more sophisticated analysis.
Sea Level
Relative sea-level rise will affect groundwater aquifers and coastal ecosystems. Rising sealevel will cause an increase in the intrusion of salt water into coastal aquifers, depending onthe groundwater gradients and pumping rates. Shallow island aquifers (such as those found inHawaii, Nantucket, Martha’s Vineyard, and along the southeastern seaboard) together withcoastal aquifers supporting large amounts of human activity (such as those in Long Island, NewYork, and central coastal California) are at greatest risk. Other impacts could include changesin salinity distribution in estuaries, increased risk of salt-water contamination at water-supplyintakes, altered circulation patterns, increased pressure on coastal levee systems, and effects onbiodiversity (Ray et al. 1992). An early summary of the kinds of impacts possible for theUnited States from climate-change induced sea-level rise can be found in Titus (1986). Whileresearchers have high confidence that sea-level rises will adversely affect coastal ecosystems and
61
some groundwater aquifers, they have only medium confidence in the expected range of sea-level rise.
One of the first efforts to evaluate regional sea-level rise impacts on water-resource systems wasdone for the San Francisco Bay and the Sacramento-San Joaquin River delta in northernCalifornia (Williams 1985, 1987, SFBCDC 1988). This delta region is of critical importancefor water supply for much of the state’s population and is one of the few coastal estuaries in thewestern United States with significant remaining biological resources. Williams evaluated howsea-level rise would affect the location of the salt front and the stability of delta levees. Theselevees are vital for protecting transportation systems, agriculture, and homes in the region.Among the conclusions was that the fragile levees of the delta would fail at a higher rate,sediment movements would be changed, mudflats and salt marshes would experience moreerosion, and ecosystem impacts could be substantial. For a one-meter sea level rise, the areaand volume of this large west coast estuary could triple from 1,100 square kilometers to over3,500 square kilometers if substandard levees were allowed to fail. Williams also concludedthat the average salinity level could migrate roughly 15 kilometers upstream, leading to massiveimpacts on the state’s water supply infrastructure. Other conclusions were that tidal marshesin parts of the San Francisco Bay where salt and freshwater ecosystems interact would besubmerged by a one-meter sea-level rise (SFBCDC 1988).
Changes in climate were evaluated in the Delaware River basin in an effort to understand howchanges in runoff and sea level might affect the position of the salt front in the Delaware Riverestuary relative to intakes of fresh water for major metropolitan areas (Wolock et al. 1993). Theauthors concluded that changes in management of the reservoirs would be necessary to preventsaltwater intrusion to freshwater supplies. Simulations also suggested that reservoir depletionwas more likely to occur than changes in the movement of the salt front because managers wereassumed to increase freshwater releases to keep the salt front below water-supply intakes. Theauthors noted that reservoir releases would be limited by overall water available in storage.
Direct Effects on Ecosystems
The health and dynamics of ecosystems are fundamentally dependent on a wide range ofclimate-sensitive factors, including the timing of water availability, overall water quantity,quality, and temperature. All of these factors may be altered in a changed climate. Humans, inturn, are dependent upon ecosystem processes to supply essential goods and services: forexample, primary productivity and inputs from watersheds support food webs yielding fish forcommercial and recreational purposes; decomposition and biological uptake purify water byremoving organic materials and nutrients. Freshwater systems are rich in biological diversity,and a large part of the fauna is under threat of extinction (Naiman et al. 1995). A changingclimate may intensify these threats in many ways, such as by accelerating the spread of exoticspecies and further fragmenting populations (Firth and Fisher 1991, Naiman 1992). Whilewe note that some climate scenarios can produce conditions that might reduce stresses oncertain ecosystems, experience with ecosystem dynamics strongly suggests that perturbingecosystems in any direction away from the conditions under which they developed and thrivewill have adverse impacts on the health of that system (Peters and Lovejoy 1992, IPCC 1996c).
The direct effects of climate change on ecosystems will be complex, depending on the nature ofthe change, the systems affected, and the nature and scope of intentional interventions by
62
humans. Previous assessments have established a wide range of possible direct effects, includingchanges in lake and stream temperatures, lake levels, mixing regimes, water residence times,water clarity, thermocline depth and productivity, invasions of exotic species, firefrequency, permafrost melting, altered nutrient exchanges, food web structure, and more(see, for example, Peters and Lovejoy 1992 and the 1997 special issue of HydrologicalProcesses (Volume 11, Number 8, including Covich et al. 1997, Grimm et al. 1997,Hauer et al. 1997, Melak et al. 1997, and Schindler 1997). These impacts could lead toa wide range of serious adverse impacts on ecosystems, with changes in vegetationpatterns, possible extinction of endemic fish species already close to their thermal limits,declining area of wetlands, precipitating reductions in waterfowl populations, concernsabout stream health, and major habitat loss (Westman and Malanson 1992, Billings andPeterson 1992, Eaton and Scheller 1996, Covich et al. 1997; Hauer et al. 1997; Meyer1997; Schindler 1997; Meyer et al. 1999). This section focuses on the direct effects ofclimate changes on aquatic ecosystems, though reference is also made to work done onterrestrial ecosystems. For more detail on the effects of climate changes on coastalecosystems, please see the separate sectoral report on this issue prepared for the NationalAssessment.
The effects of climate change on aquatic ecosystems will depend on the magnitude andrate of changes in climate as well as the current state of the ecosystem. Patterns oftemporal variation in streamflow differ among watersheds because of regional variations inclimate, geology, soil conditions, and vegetative cover. The ecological response to amodification in natural flow regime resulting from climate change depends on how theregime is altered relative to the historical conditions (Meyer et al. 1999). For example, asystem that has historically experienced predictable, seasonal flooding, such as snowmelt-dominated streams and rivers, may show dramatic changes in community compositionand ecosystem function if the seasonal cycles are eliminated or substantially altered, as hasbeen documented for the loss of riparian trees along western watercourses (Auble et al.1994). A river characterized by highly variable flows would not likely show muchresponse to a climate change that exacerbated this already harsh regime; however, a climatechange shift to more perennial and stable flows would be expected to elicit great response(Poff 1992). These observations also apply to lakes: paleoecological studies havedemonstrated that the hydrologic setting of a lake determines how it responded to pastclimate change (Fritz 1996). Thus understanding local factors that control water volumeand quality is necessary to predict climate impacts (Murdoch et al. 2000). The biologicaland chemical processes that control aquatic ecosystem health are a function of theevolutionary history of a region as well as its geologic and climatic setting; how these localprocesses respond to climate shifts determines the impact of that shift on ecosystemhealth. Continuing land-use changes that have profound impacts on aquatic ecosystemswill also complicate predicting and interpreting the consequences of climate change (Dale1997). Projected climate change can be viewed as another form of anthropogenicenvironmental alteration that will modify the ecological organization of aquatic ecosystems(Grimm 1993, Poff et al. 2000). We can only plan for climate change based on localunderstanding of processes controlling water quantity and quality and ecosystem health(Murdoch et al. 2000).
It is likely that the ecosystems most vulnerable to climate change are those that are alreadynear important thresholds, such as where competition for water is occurring, wheresummer water temperatures are already near the limit for a species of concern, or where
63
climate change will act in concert with other anthropogenic stressors such as large waterwithdrawals or wastewater returns (Meyer et al. 1999, Murdoch et al. 2000).Slight shifts in climate can also alter the boundaries of terrestrial ecosystems, plantcompositions, and the rate of supply of organic matter, with resulting impacts on the health ofaquatic ecosystems (Meyer and Pulliam 1992, Hauer et al. 1997). Transition zones, wherespecies compositions alter dramatically, may show the earliest evidence of change, and thechanges may not be gradual. Better information is needed on which ecosystems changegradually and which may be subject to dramatic or sudden changes when a threshold isreached (Meyer et al. 1999). Understanding these responses would enhance our ability todetect and predict the impacts of climate change.
Future climate scenarios, such as those evaluated for the National Assessment, suggest a futureclimate that is warmer with altered patterns and intensity of precipitation. We consider firstsome of the changes expected to result from warmer temperatures and then look at effectsprojected with altered hydrology.
There will be both positive and negative direct effects of increasing temperatures on aquatic andterrestrial ecosystems. In general, while many uncertainties remain, ecologists have highconfidence that warming will produce a shift in species distributions northward, withextinctions and extirpations of temperate or cold-water species at lower latitudes, and rangeexpansion of warm-water and cool-water species into higher latitudes. Mean summer airtemperature increases of 2-6o C are projected to reduce the suitable habitat for cold- and cool-water fish species in streams of the conterminous United States by over 50% (Eaton andScheller 1996). A 4o C increase in mean air temperature is projected to expand the ranges ofsmallmouth bass and yellow perch northward across Canada by about 500 km (Shuter andPost 1990). Some fish species may be eliminated from drainages, particularly those orientedeast-west rather than north-south (Carpenter et al. 1992). Predicted warming of surface watersin the western and northern Great Plains could lead to increasing salinity and to extinction ofendemic fish species already close to their lethal thermal limits (Covich et al. 1997). One likelyconsequence of a warmer climate is increasing fragmentation of cold-water fish habitats inheadwaters and potential shifts in the competitive dominance of salmonid species (Mulhollandet al. 1997, Hauer et al. 1997, Melack et al. 1997). Shifts are also likely in distributions ofinsects, whose development and generation times are highly sensitive to temperature (see, forexample, Sweeney et al. 1992 for work on aquatic insects).
Climate warming could result in substantial changes in the mixing properties of manyhigh and mid-latitude lakes (Hostetler and Small 1999), which would alter deep-waterdissolved oxygen concentrations and primary productivity via effects on nutrient suppliesand exposure of phytoplankton to light. Ice-free conditions under double CO
2 climate
scenarios are projected to shift northward by 10o (Hostetler and Small 1999), whichwould change mixing regimes and alter ecological conditions (Porter et al. 1996). Insaline lakes, reductions in streamflow are linked to increased incidence of permanentstratification and reduced productivity (Melack et al. 1997), while increases in streamflowcould have the opposite effect. In deep, thermally-stratified lakes in the mid- and highlatitudes, winter survival, growth rates, and thermal habitat for fish generally increaseunder doubled CO
2 climate simulations, although the models do not take changes in
oxygen into account (Magnuson and DeStasio 1996), and dissolved oxygen below thethermocline is predicted to decrease (Magnuson et al. 1997).
64
Changes in thermal regime pose threats to a broad range of population and communityinteractions, ranging from direct mortality from acute temperature stress, chronicbioenergetic stresses, and shifts in the balance of interspecies competition as habitat space forsome species is reduced (Meyer et al. 1999). Chao (1999) notes that for ten steady-state andtransient climate scenarios, the area of cold-water habitat in the Great Lakes decreases by 40 -85%. The effects of higher water temperatures are sufficient, even in the most modest impacts,to lead to a higher proportion of areas suffering from oxygen depletion. In smaller mid-latitudelakes and reservoirs, warming may also reduce habitat for many of the cool- and cold-waterspecies because deep-water thermal refuges with adequate oxygen are not present in summer(Stefan et al. 1996). Thermal refugia are a critical component of aquatic ecosystems that aredifficult to capture using current climate models.
A recent assessment of the impacts of changing water temperatures on the economic yield fromrecreational fisheries concluded that changes in cool- and cold-water fisheries could lead to neteconomic losses ranging from $85 - $320 million/yr (Abt Associates 1995), although theseestimates are speculative because the extent of any tradeoff from cold- to warm-water fisheries isunknown and hard to monetize. Flow alterations were not formally considered in theanalysis, but the authors concluded that they would likely increase calculated losses.Qualitative benefits expected in a warmer climate include increased productivity of warm-water fisheries and aquaculture as well as reduced winter fish kill.
Warmer temperatures in the Arctic are predicted to increase aquatic primary andsecondary productivity because of increased decomposition rate and water residence time;yet these increases in production may not be adequate to make up for the increasedmetabolic demand of higher temperatures for fishes (Rouse et al. 1997). Top predators(grayling and lake trout) appear particularly vulnerable to climate change, and reductionsin their abundance would likely have effects throughout Arctic food webs. Abundantboreal and Arctic peatlands are vulnerable to changes in water table depth influenced bypermafrost melting and altered water balances. The southern boundary of continuouspermafrost is projected to shift north by 500 km over the next 50 years due to warmingprojected by general circulation models (Anisimov and Nelson 1996, Burkett and Kusler2000). Gorham (1995) projected that a 5o C warming in Alaska would eventually meltvirtually all of the subarctic permafrost in Alaska, which would affect more wetland areathan currently found in the rest of the United States. Changes in hydrology resultingfrom this permafrost melting have not been adequately assessed (Gorham 1995), althoughsoil movement, terrain slumping or subsidence, increased sediment loads, and changes inflow regimes are likely (IPCC 1998, Burkett and Kusler 2000). Peatlands are vulnerable todrying and fire, and a warmer climate would shift them from a net sink to a net source forCO
2 (Burkett and Kusler 2000). This is of considerable significance in the global carbon
budget because estimates of carbon stored in boreal peatlands range from 20% to 35% ofglobal terrestrial carbon (Patterson 1999).
Mulholland et al. (1997) evaluated the implications of a range of future climate scenariosfor the freshwater ecosystems in the southeastern U.S. Among the projected impacts ofhigher temperature are: reduction in habitat for cool-water species, such as brook troutand many aquatic insects, which are near the southern extent of their ranges; greatersummer drying of wetland soils resulting in greater fire threat; northward expansion ofsubtropical species, some of which are nuisance exotics (e.g. Melaleuca); more extensivesummer deoxygenation in reservoirs (also seen in Chang et al. 1992); and increased rates
65
of production and nutrient cycling with both higher temperature and longer growingseason.
In addition to warmer temperatures, aquatic ecosystems are sensitive to changes inhydrologic regime. Murdoch et al. (2000) recently reviewed likely impacts of possiblefuture “warmer and wetter” vs. “warmer and drier” climates on water quality. Theseimpacts are a function of direct effects on processes regulating water quality in aquaticecosystems as well as indirect effects via climate impacts on terrestrial ecosystems. Forexample, changes in water quality result from differences in depth of snowpack, likelihoodof soil freezing, and extent of microbial processing occurring in the soil (Murdoch et al.2000). Nitrification rates in the soil and nitrate concentrations in streams are correlatedwith air temperature in the Catskills (Murdoch et al. 1998). Warmer and drier conditionscould increase residence times in lakes and reservoirs with increased ability of biologicalprocesses to reduce pollutant concentrations (Schindler 1997). Enhanced metal toxicityand increased bioaccumulation are possible with warmer temperatures (Moore et al.1997). Under warmer, drier conditions, concentrations of constituents derived fromsurface and shallow soil runoff during high flows (such as nitrogen and acidity) andthrough erosion (including organic material) will decrease; and the proportion ofconcentrations of constituents derived from deeper flow paths (base cations, silica) andfrom point sources (sewage and industrial waste water) will increase (Murdoch et al.2000). Under warmer, wetter conditions, Murdoch et al. (2000) predict greater dilutionof point source inputs, but less instream biological uptake and transformation because ofshorter residence time. Hydrologic changes that increase stream discharge or watervelocity without commensurate increases in biological uptake reduce nutrient retentionefficiency (Meyer et al. 1999). In addition, increased erosion could wash additionalcontaminants into streams from source areas.
Nutrient loading generally increases with runoff, particularly in human-dominatedlandscapes (Alexander et al. 1996). Thus, increases in runoff due to increasedprecipitation are likely to increase the flows of nutrients into rivers and lakes. Ofparticular concern in a wetter climate are episodic water-quality excursions beyondparticular thresholds (Murdoch et al. 2000). Delivery of constituents like phosphorus,pesticides, or acids in pulses are known to have adverse consequences for fishes, dependingon their frequency, duration, and intensity. For example, annual export of hydrogen ionsin the Catskills depends more on the magnitude and duration of episodic events than onion concentrations in baseflow (Murdoch 1991, Baldigo and Murdoch 1997). Increasednumbers of water-quality excursions that exceed ecological thresholds will limit theeffectiveness of policies designed for mean conditions (Murdoch et al. 2000).In north-temperate regions, dissolved organic carbon (DOC) concentrations are projectedto decrease because of reduced runoff from drier catchments, resulting in increases inwater clarity, thermocline depth, productivity, and UV-B penetration. Schindler (1997)estimates that this latter effect could lead to a greater exposure of aquatic animals toultraviolet radiation than would result from reductions in the ozone hole (Schindler1997). Extended droughts in boreal regions have been shown to result in acidification ofstreams due to oxidation of organic sulfur pools in soils (Schindler 1997). Lake levels arehighly sensitive to changes in precipitation and evaporation. Lakes in dry evaporativedrainage basins in the north-central U.S. (fed primarily by ground water, precipitation,and spring snowmelt) are among the most sensitive to changes in climate that producedrier conditions (Covich et al. 1997).
66
In snowmelt rivers of the Pacific Northwest, likely shifts in the hydrologic regime towardearlier and higher winter and spring flows and lower summer flows could exacerbate thestresses resulting from changes in population and land use and lead to water quality andquantity problems (Miles et al. 2000). Peak flows occurring much earlier in the season(Leung and Wigmosta 1999, Hay et al. 2000) could result in washout of early life-historystages of autumn-spawning salmonids. Altered runoff regimes, increased sediment loads,and decreased channel stability would reduce benthic diversity in glacial-fed rivers andreduce growth rates of economically important species such as salmon (Melack et al.1997). Changes in sediment loading and channel morphology in an altered climate canimpact processes regulating nutrient cycling and community composition (Ward et al.1992).
Burkett and Kusler (2000) recently reviewed likely climate change impacts on wetlands.They concluded that expected changes in temperature and precipitation would alterwetland hydrology, biogeochemistry, plant species composition, and biomassaccumulation. Because of fragmentation resulting from past human activities, wetlandplants often cannot migrate in response to temperature and water-level changes and henceare vulnerable to complete elimination. Wetland plant response to increased CO
2 could
also lead to shifts in community structure with impacts at higher trophic levels. Smallchanges in the balance between precipitation and evapotranspiration can altergroundwater level by a few centimeters, which can significantly reduce the size of wetlandsand shift wetland types. Loss of remnant plant and animal species from alpine wetlandsseems likely since there is little opportunity to migrate. Mid-continental wetlands thatdepend on precipitation as a primary water source are especially vulnerable to climatevariation and change (Winter 2000). Climate scenarios for the Northern Great Plainsregion suggest that increased temperatures over the next 50 years would result in a 40%or more decline in the number of prairie potholes and the population of ducks (Sorensonet al 1998, Poiani et al. 1995). Wetland species are also sensitive to changes in seasonalityof precipitation. For example, reduced winter precipitation can affect bird migration orreduce nesting success even if mean annual precipitation remains constant (Burkett andKusler 2000). Increased periods of inundation for wetlands would result in increased ratesof methane production (Meyer and Pulliam 1992) and other anaerobic processes such asmercury methylation (Rudd 1995).
In addition to the direct effects of temperature and flow on organisms and ecologicalprocesses, indirect effects mediated through food web interactions are also likely in analtered climate. Occasional extreme temperatures that lead to fish kills can have long-lastingimpacts because they result in cascading effects throughout the food web (Carpenter et al.1992). Relative strengths of year classes are altered by conditions during spawning and earlylife, and variations in year classes of top predators can alter food web structure at lower trophiclevels (Carpenter et al. 1992). In rivers with reduced winter floods, insect grazer populationsare maintained, and their grazing pressure reduces the likelihood of spring Cladophora blooms(Power 1992). Modeling the complexity of the interaction between food webs and hydrologicregime is in its infancy (Power et al. 1995) and more research is needed here. More complexdynamic models based on an understanding of mechanisms linking environmental variablesand species performance in the context of complex food webs would help to develop usefulprojections of the impacts of climate-induced changes in hydrologic regime on endangeredspecies, nuisance species, fisheries yields, and overall health of aquatic ecosystems.
67
Several researchers have reviewed likely impacts of climate change on aquatic ecosystemhealth, water quality, and wetlands (Firth and Fisher 1992, McKnight and Covich 1997,Meyer et al. 1999, Murdoch et al. 2000, Burkett and Kusler 2000, respectively). Meyeret al. (1999) identified the most vulnerable regions in the U.S. to include the Arctic,Great Lakes, and the Great Basin. Table 11 summarizes some important findings withrespect to vulnerabilities of different ecosystem types. Wetlands are particularly sensitive tochanges in water balances that lead to reduced areal extent, altered species composition,increased vulnerability to fire, and altered rates of exchange of greenhouse gases. Thechanges identified in lakes are associated with altered mixing regimes, delivery of nutrientsand organic carbon from the watershed, availability of thermal refuges, and alteration ofpopulation sizes of the top predators with cascading effects on lower trophic levels. Instreams, the changes are closely linked with climate impacts on riparian zone, species-specific thermal tolerances, and alterations in flow regime.
Researchers express concern for the limited ability of natural ecosystems to adapt or copewith climate changes that occur over a short time frame, especially in the context of theanthropogenic alterations to aquatic ecosystems that have already occurred (Naiman et al.1995). This limited ability to adapt to rapid changes may lead to irreversible impacts,such as extinctions. While some research has been done on these issues, far more isneeded.
Burkett and Kusler (2000) note that there are no practical options for protecting wetlandsas a whole from rising temperature and sea level and changes in precipitation. Somemanagement measures could be applied to specific places to increase ecosystem resilienceor to partially compensate for negative impacts, but there is often no explicit economic orinstitutional support for doing so. Among the options for mitigation are developmentsetbacks for coastal and estuarine wetlands, linking fragmented ecosystems to provideplant and animal migration routes, using water-control structures to enhance ecosystemfunction, and explicit protection and allocation of water needed for ecosystem health.Some research has been done on these issues, but far more is needed.
River Channel and Geomorphology
River channel erosion and sedimentation are a function of many variables, including thecharacteristics of soils, precipitation, and streamflow. Very little research has been done onthe implications of climate changes for river channels and erosion, in part because ofuncertainties about how precipitation – and especially extreme precipitation events – willchange. Hanratty and Stefan (1998) simulated streamflow and sediment yield in a smallriver basin in Minnesota and concluded that the lack of physically-based models ofchannel dynamics hindered their ability to evaluate impacts. In the scenario they used,sediment yields decreased because of reduced soil-erosion rates, but the authors state thattheir confidence in the model results was low. Erosion and sedimentation rates will haveeffects on reservoir yields, water quality, ecosystem structure, and much more, and we urgemore research on this issue.
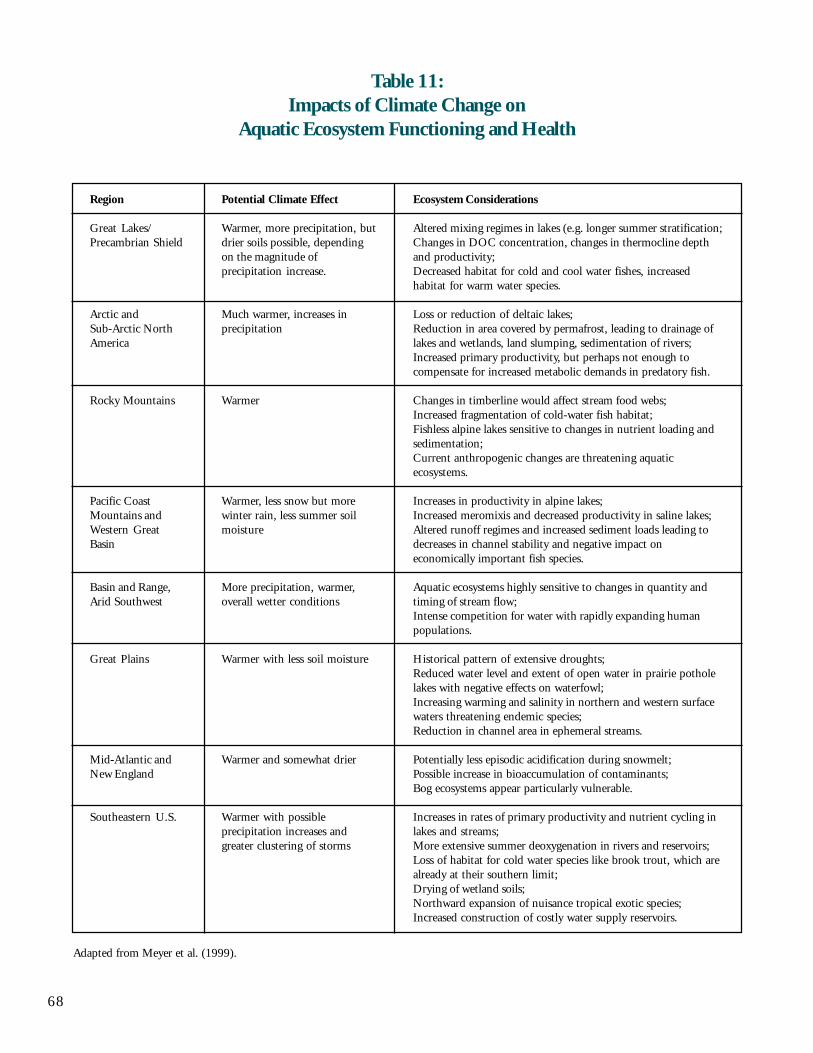
68
Table 11:Impacts of Climate Change on
Aquatic Ecosystem Functioning and Health
Region
Great Lakes/Precambrian Shield
Arctic andSub-Arctic NorthAmerica
Rocky Mountains
Pacific CoastMountains andWestern GreatBasin
Basin and Range,Arid Southwest
Great Plains
Mid-Atlantic andNew England
Southeastern U.S.
Potential Climate Effect
Warmer, more precipitation, butdrier soils possible, dependingon the magnitude ofprecipitation increase.
Much warmer, increases inprecipitation
Warmer
Warmer, less snow but morewinter rain, less summer soilmoisture
More precipitation, warmer,overall wetter conditions
Warmer with less soil moisture
Warmer and somewhat drier
Warmer with possibleprecipitation increases andgreater clustering of storms
Ecosystem Considerations
Altered mixing regimes in lakes (e.g. longer summer stratification;Changes in DOC concentration, changes in thermocline depthand productivity;Decreased habitat for cold and cool water fishes, increasedhabitat for warm water species.
Loss or reduction of deltaic lakes;Reduction in area covered by permafrost, leading to drainage oflakes and wetlands, land slumping, sedimentation of rivers;Increased primary productivity, but perhaps not enough tocompensate for increased metabolic demands in predatory fish.
Changes in timberline would affect stream food webs;Increased fragmentation of cold-water fish habitat;Fishless alpine lakes sensitive to changes in nutrient loading andsedimentation;Current anthropogenic changes are threatening aquaticecosystems.
Increases in productivity in alpine lakes;Increased meromixis and decreased productivity in saline lakes;Altered runoff regimes and increased sediment loads leading todecreases in channel stability and negative impact oneconomically important fish species.
Aquatic ecosystems highly sensitive to changes in quantity andtiming of stream flow;Intense competition for water with rapidly expanding humanpopulations.
Historical pattern of extensive droughts;Reduced water level and extent of open water in prairie potholelakes with negative effects on waterfowl;Increasing warming and salinity in northern and western surfacewaters threatening endemic species;Reduction in channel area in ephemeral streams.
Potentially less episodic acidification during snowmelt;Possible increase in bioaccumulation of contaminants;Bog ecosystems appear particularly vulnerable.
Increases in rates of primary productivity and nutrient cycling inlakes and streams;More extensive summer deoxygenation in rivers and reservoirs;Loss of habitat for cold water species like brook trout, which arealready at their southern limit;Drying of wetland soils;Northward expansion of nuisance tropical exotic species;Increased construction of costly water supply reservoirs.
Adapted from Meyer et al. (1999).
69
Is Climate Change Already Affecting the Nation’s Water?Evidence of Hydrologic Trends
Introduction
There is a very high degree of confidence in the scientific community that unchecked increasesin atmospheric greenhouse-gas concentrations will eventually lead to changes in the Earth’sclimate, including the variability of that climate. There is also an increasing amount ofevidence accumulating that some changes are already occurring. The executive summary of the1995 IPCC report stated that the weight of evidence suggests a discernible human influence onclimate (IPCC 1996a). Nearly five more years of evidence of various kinds have accumulatedsince that report was completed. Indeed, a primary reason for the rapidly growing concernabout global climate change is the observation from more and more data sets of departuresfrom historical averages, combined with a growing understanding of how current climatevariability affects humans in their day-to-day lives. Despite gaps in data, inadequate anduneven climate monitoring, short record length, and biases in instrumental data, recentresearch suggests that changes and variations in the hydrologic cycle of the earth may alreadybe occurring as a result of growing greenhouse gas concentrations. Trends of increasingtemperature have been noted and debated for more than twenty years and recently departuresfrom historical averages have been observed for the timing of snowmelt, runoff magnitudes,flowering dates, ice retreats, borehole temperatures, butterfly ranges, onset of egg-laying inbirds, and many other things (see, for example, Changnon et al. 1993, Groisman et al. 1994,Beaubien and Johnson 1994, Moore and McKendry 1996, Dettinger and Cayan 1995, Cayan1996, Ainley and Divoky 1998, Hodge et al. 1998, Crick and Sparks 1999, Parmesan et al.1999, Schwartz and Reiter 2000, McCabe et al. 2000). Detection of trends in hydrologicaltime series is notoriously difficult because of the normally large variability in natural systemsand because of inadequate or incomplete long-term data records. Nevertheless, a number ofthe observed changes are sufficiently different from the past record to be considered the resultof something other than natural variability.
A similar conclusion can be drawn for the United States. In work done by the NationalClimate Data Center, Karl and associates analyzed national weather-related trends since1910 and found, within 95% confidence limits, that actual climate trends in the United Statesare consistent with projected trends due to a human-induced warming effect resulting fromincreased concentrations of greenhouse gases (http://www.ncdc.noaa.gov/ol/climate/research/gcps/papers/amsbull/amsbull.html). Given all the current research results and observations, weconclude that the evidence that humans are changing the water cycle of the United States isincreasingly compelling.
Temperature and Related Trends
The climate change that has received the most attention is the increase in average temperature.Data from a network of ground- and ocean-based sites suggest that the average surfacetemperature of the Earth has increased by over a degree Fahrenheit (around 0.6o Celsius) over
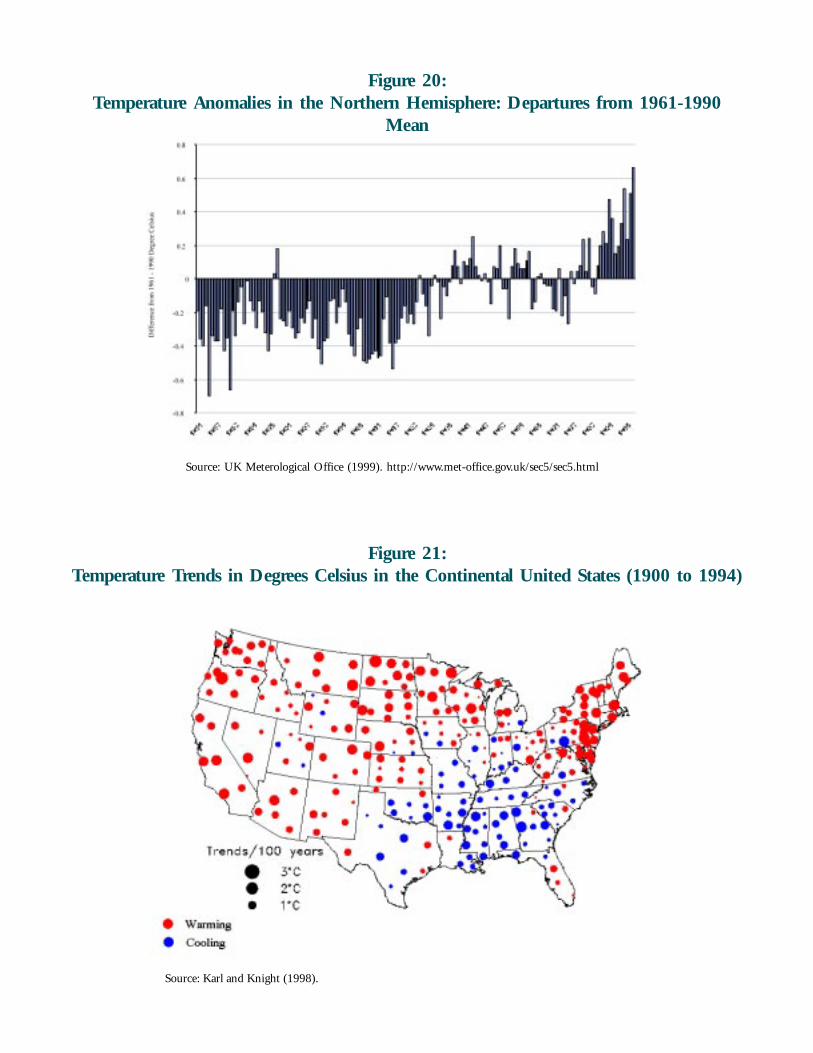
Figure 20:Temperature Anomalies in the Northern Hemisphere: Departures from 1961-1990
Mean
Source: UK Meterological Office (1999). http://www.met-office.gov.uk/sec5/sec5.html
Figure 21:Temperature Trends in Degrees Celsius in the Continental United States (1900 to 1994)
Source: Karl and Knight (1998).
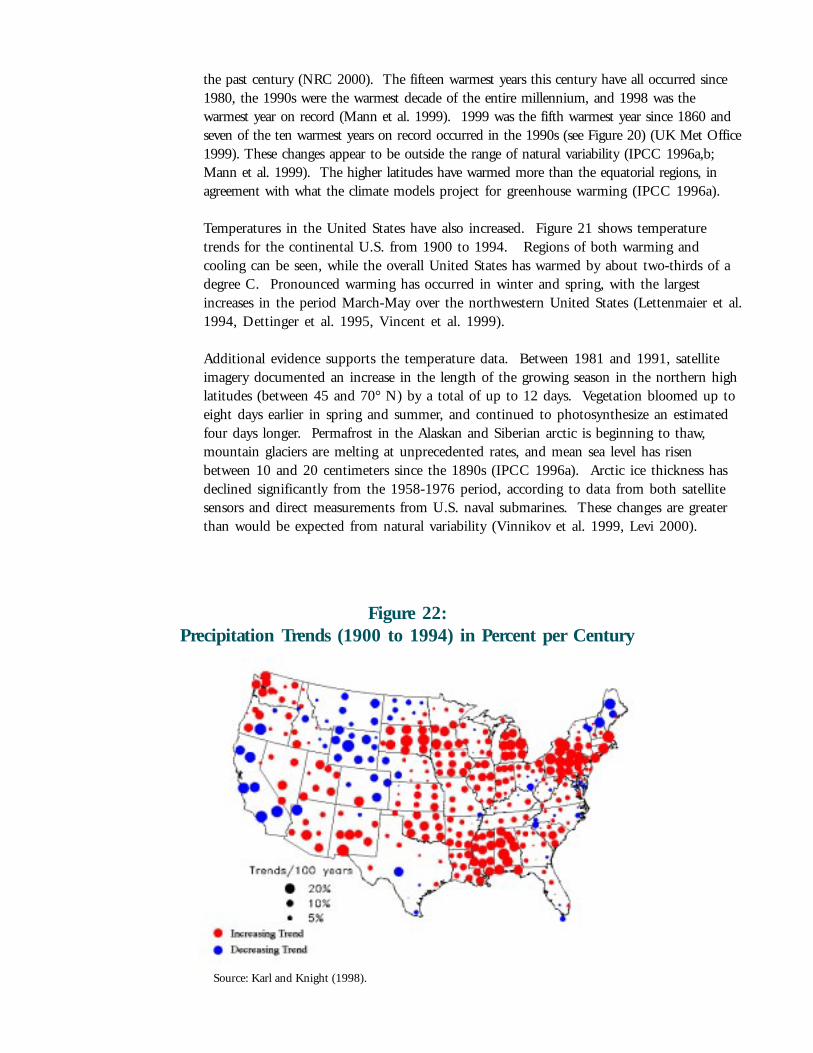
the past century (NRC 2000). The fifteen warmest years this century have all occurred since1980, the 1990s were the warmest decade of the entire millennium, and 1998 was thewarmest year on record (Mann et al. 1999). 1999 was the fifth warmest year since 1860 andseven of the ten warmest years on record occurred in the 1990s (see Figure 20) (UK Met Office1999). These changes appear to be outside the range of natural variability (IPCC 1996a,b;Mann et al. 1999). The higher latitudes have warmed more than the equatorial regions, inagreement with what the climate models project for greenhouse warming (IPCC 1996a).
Temperatures in the United States have also increased. Figure 21 shows temperaturetrends for the continental U.S. from 1900 to 1994. Regions of both warming andcooling can be seen, while the overall United States has warmed by about two-thirds of adegree C. Pronounced warming has occurred in winter and spring, with the largestincreases in the period March-May over the northwestern United States (Lettenmaier et al.1994, Dettinger et al. 1995, Vincent et al. 1999).
Additional evidence supports the temperature data. Between 1981 and 1991, satelliteimagery documented an increase in the length of the growing season in the northern highlatitudes (between 45 and 70° N) by a total of up to 12 days. Vegetation bloomed up toeight days earlier in spring and summer, and continued to photosynthesize an estimatedfour days longer. Permafrost in the Alaskan and Siberian arctic is beginning to thaw,mountain glaciers are melting at unprecedented rates, and mean sea level has risenbetween 10 and 20 centimeters since the 1890s (IPCC 1996a). Arctic ice thickness hasdeclined significantly from the 1958-1976 period, according to data from both satellitesensors and direct measurements from U.S. naval submarines. These changes are greaterthan would be expected from natural variability (Vinnikov et al. 1999, Levi 2000).
Figure 22:Precipitation Trends (1900 to 1994) in Percent per Century
Source: Karl and Knight (1998).
72
Precipitation Trends
Considerable uncertainty remains in evaluating trends in precipitation. Records areincomplete, measurements vary in accuracy, and perhaps most importantly, precipitation isnaturally highly variable, making trends difficult to detect. Additional analysis will benecessary before researchers have a very high degree of confidence that trends in precipitationhave been detected and whether or not such trends are attributable to anthropogenic climatechange. Some analyses, however, have begun to report statistically significant trends in bothglobal and North American precipitation patterns. By the late 1980s, observers had noticed ageneral increase in precipitation outside of the tropics, with a tendency for rainfall declines inthe subtropics, particularly in the northern tropics of Africa (IPCC 1990, 1996a). Between1900 and 1988, precipitation over land increased by 2.4 millimeters (mm) per decade andglobal mean rainfall rose by more than two percent. These results show that global rainfall nowis about 22 mm per year higher than it was at the turn of the century (Dai et al. 1997a,b).Consistent with the upward trend in global precipitation, the average mean interval betweentwo drier-than-average-months increased by approximately 28% from 1900-1944 to 1945-1988.
There is also evidence of an historical trend of both increasing and decreasing precipitation indifferent regions of North America since 1900 (Lettenmaier et al. 1994, Karl et al. 1995). Thepercentage of wet areas over the United States has more than doubled (from ~12% to >24%)since the 1970s while the percentage of dry areas has decreased by a similar amount since the1940s. Figure 22 shows precipitation trends in the continental United States from 1900 to1994. Precipitation has increased over land in the high latitudes of the Northern Hemisphere,particularly during winter. These trends have been supported by regional, national, and globalstudies, even correcting for known biases of precipitation measurements (Karl et al. 1995).
In another analysis, Karl and Knight (1998) show an increase in precipitation in thecontinental United States, with most of the increase in the highest annual one-dayprecipitation event – a potentially worrisome trend in regions where flooding is a problem(Figures 23 and 24). By analyzing long-term precipitation trends in the United States, theydetermined that:
• Precipitation over the contiguous United States has increased by about 10% since 1910;
• The intensity of precipitation has only increased for very heavy and extreme precipitationdays;
• Increases in total precipitation are strongly affected by increases in both the frequency andthe intensity of heavy and extreme events, measured as the highest 1-day annualprecipitation event;
• The probability of precipitation on any given day has increased;
• The proportion of total precipitation from heavy events has increased at the expense ofmoderate precipitation events.
Regional analyses support some of the conclusions of the continental trends. For example,Angel and Huff (1997) found an approximately 20% increase in the number of dailyprecipitation events of two inches or more in the midwestern U.S. between 1901 and 1994.
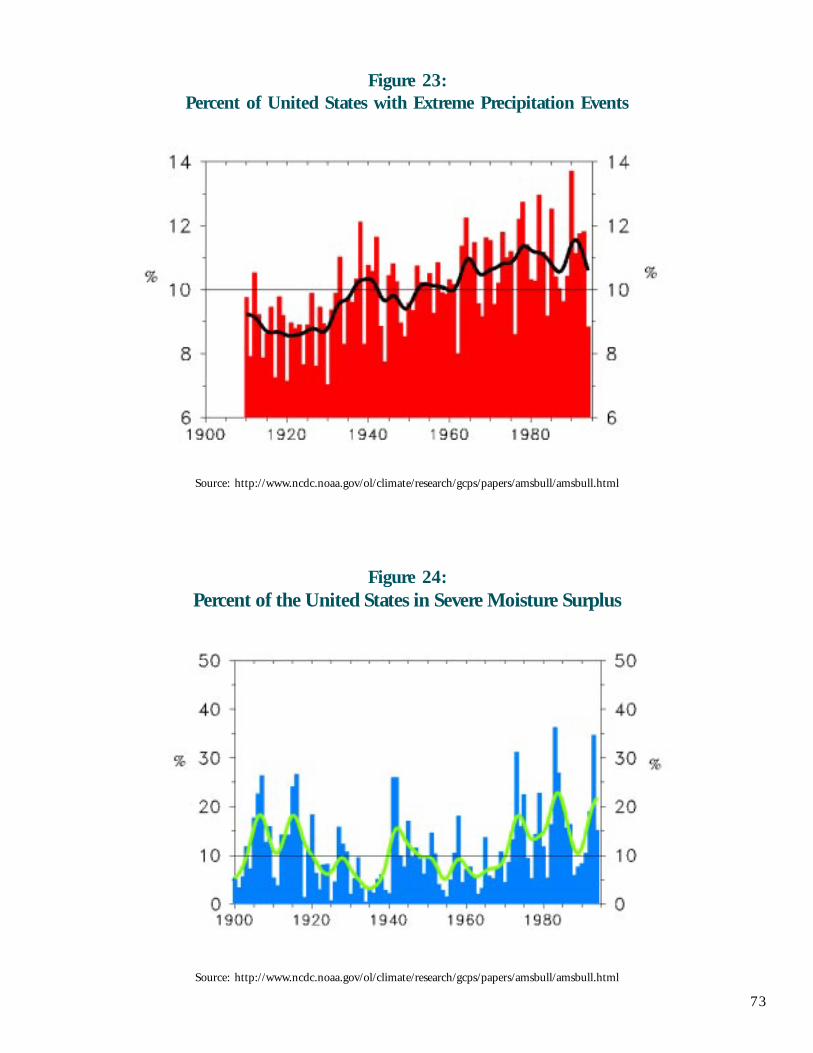
73
Figure 23:Percent of United States with Extreme Precipitation Events
Source: http://www.ncdc.noaa.gov/ol/climate/research/gcps/papers/amsbull/amsbull.html
Figure 24:Percent of the United States in Severe Moisture Surplus
Source: http://www.ncdc.noaa.gov/ol/climate/research/gcps/papers/amsbull/amsbull.html
74
Karl and Knight (1998) also found an increase in the upper 10th percentile of dailyprecipitation amounts in this region, which feeds the Mississippi River. As discussed later,climate change-induced increases in the frequency and magnitude of extreme precipitationevents could have important ramifications for water management, system operation, andthe probability or consequences of water-related disasters.
Snowpack and Ice Cover Trends
Climate models and theoretical studies of snow dynamics have long projected that highertemperatures would lead to a decrease in the extent of snow cover in the NorthernHemisphere (see, for example, Rango 1992, Dettinger and Cayan 1995, Cayan 1996,Rango 1997). Recent field surveys corroborate these findings. Snow cover over theNorthern Hemisphere land surface has been consistently below the 21-year average (1974to 1994) since 1988 (Robinson et al. 1993, Groisman et al. 1994), with an annual meandecrease in snow cover of about 10% over North America. These changes have beenlinked to the observed increases in temperature. Continuous and discontinuouspermafrost has warmed considerably in Alaska and is thawing in some locations(Lachenbruch and Marshall 1986, Osterkamp 1994, Osterkamp and Romanovsky 1996).Eight glaciers (seven in Alaska and one in Washington State) showed on average a decreasein thickness of 10 meters between the late 1950s and mid 1990s (Sapiano et al. 1998).Other effects include earlier lake ice melting, earlier snowmelt-related floods in westernCanada and the western United States, and earlier warming of Northern Hemisphere landareas in the spring (Nicholls et al. 1996). At the same time that snow and ice cover seemto be decreasing and melting earlier, total annual snowfall in the far northern latitudesseems to be increasing, consistent with the observed increases in northern latitudeprecipitation where even the higher winter temperatures do not get above freezing.
Surface and satellite observations of the extent of sea ice in the Northern Hemisphere alsoshow extensive decreases over the period 1953 to 1998. A comparison of these trendswith model estimates reveals that the observed decreases agree with the climate modelsimulations and that both trends are much larger than would be expected from naturalclimate variability (Vinnikov et al. 1999, Levi 2000). Changes in Arctic ice andpermafrost, described above in the Temperature section, are additional observationalevidence supporting detection of climate change.
Runoff Trends
River runoff or discharge is considered to be an excellent integrator of climate factors,which makes it an important indicator of climate variability and change. Long records ofrunoff are essential to determining whether runoff is changing over time, but the numberof rivers with reliable records longer than several decades is limited and records longerthan a century are extremely rare. Similarly, discharge also integrates numerous humaninfluences such as flow diversions for irrigation and municipal use, natural streamflowregulation by dams and reservoirs, and baseflow reduction by groundwater pumping.Detecting a climate signal in the midst of these complicating factors can be difficult(Changnon and Demissie 1996). Importantly, however, not all watercourses are subjectto such confounding human activities and discharge data sets specifically designed to be
75
sensitive to the effects of climate have been assembled and published (Wallis et al. 1991,Slack and Landwehr 1992, see also http://wwwrvares.er.usgs.gov/hcdn_report/content.html.)
A small number of analyses of nationwide streamflow trends in the United States havebeen completed using these data sets; their conclusions should be considered preliminaryand incomplete. Although each used a different approach, their results will form the basisfor further work in the future. Lins and Michaels (1994) looked at trends in monthlymean flow in 11 broad regions of the United States between 1941 and 1988. They foundstatistically significant increases in nine of the 11 regions and, in nearly all instances, thetrends were observed in autumn and early winter months. The largest increases occurredin the upper Mississippi and Ohio River valleys.
Lettenmaier et al. (1994) also evaluated trends using monthly mean discharge, but did sofor 1,009 stations for the period 1948 to 1988. They found significant increases inwinter and early spring streamflow across much of the United States. Although the trendswere geographically widespread, there was a distinct concentration in the upperMississippi and Ohio River valleys, consistent with the Lins and Michaels findings. Linsand Slack (1999) analyzed trends in U.S. streamflow using daily discharge records across arange of flow quantiles, from the annual minimum to the annual maximum discharge.These quantiles were not fixed over the analysis period, but varied from year-to-year so forexample, the 90th percentile in a low flow year could be less then the long-term meanmedian flow. The assessment evaluated trends of 30- to 80-year periods, each ending in1993, providing insights on interdecadal variability in streamflow trends. Their analysissuggests that by the early 1990s discharge had increased across broad sections of theUnited States, and that the greatest percentage increases occurred primarily in the lowesthalf of the streamflow distribution from the annual minimum to the annual mediandischarge (see Figure 25). Their results indicate no systematic trend in the annualmaximum streamflow and no continental-scale seasonal shift in peak discharges. Theseresults suggest that average runoff in the United States was increasing but getting lessextreme up to the early 1990s, though small percentage increases in the highestpercentiles can still be large absolute increases in flow.
To help reconcile apparent discrepancies between observed increases in heavy daily andweekly precipitation during much of the 20th century as reported by several studies (see,for example, Karl et al. 1996, Karl and Knight 1998, Kunkel et al. 1999), Groisman et al.(2000) analyzed the co-variations of daily precipitation and streamflow for events abovevarious precipitation and runoff thresholds. The period studied included much of the20th century, but focused on the periods of most extensive data, 1939-99 and 1939-93.In the mountainous western part of the country their analysis found little relationbetween increases in heavy precipitation and changes in high streamflow, similar to Linsand Slack (1999). In this area snow cover has significantly retreated during the latter halfof the 20th century. Streamflow decreases were observed in the months of maximumstreamflow and were found to be related to decreases in snow cover extent causing a shiftin the seasonal peak discharges. For much of the eastern half of the United States,Groisman et al. (2000) found a significant and coherent signal of increasing heavyprecipitation contributing to increasing high streamflows (those in the upper five and onepercent of the observations). They found statistically significant increases when averagedacross the nation for both streamflow and precipitation during the period 1939-99 for
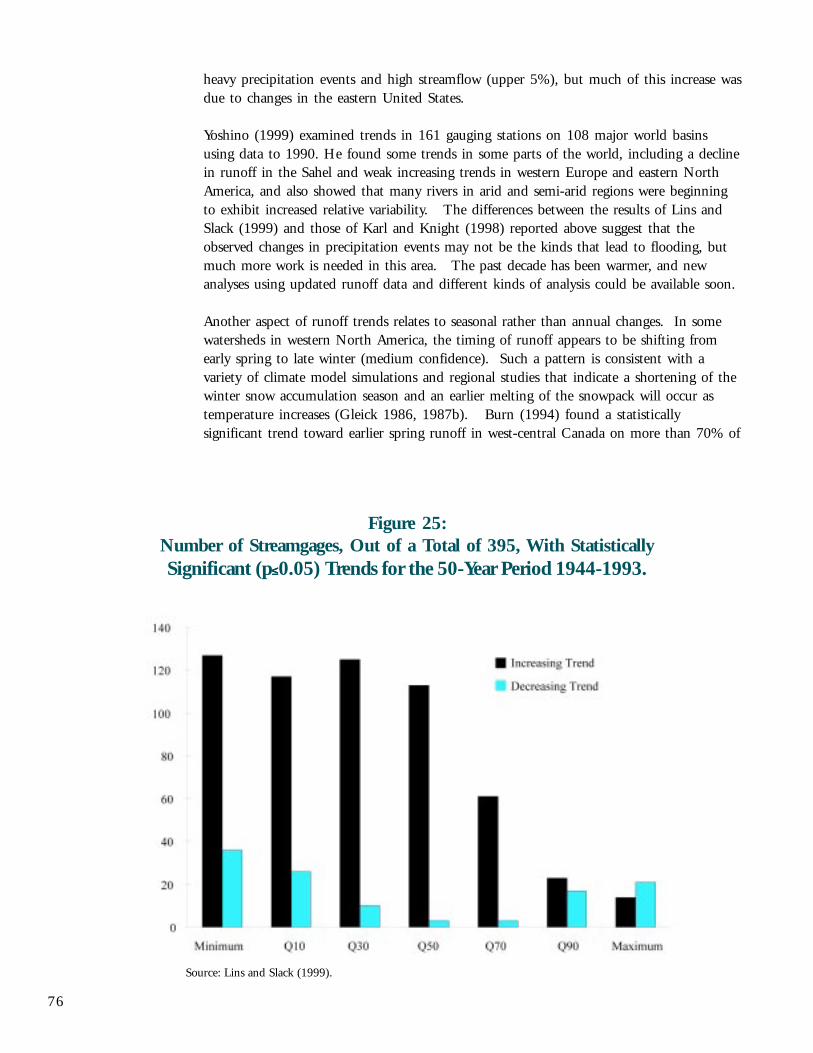
76
heavy precipitation events and high streamflow (upper 5%), but much of this increase wasdue to changes in the eastern United States.
Yoshino (1999) examined trends in 161 gauging stations on 108 major world basinsusing data to 1990. He found some trends in some parts of the world, including a declinein runoff in the Sahel and weak increasing trends in western Europe and eastern NorthAmerica, and also showed that many rivers in arid and semi-arid regions were beginningto exhibit increased relative variability. The differences between the results of Lins andSlack (1999) and those of Karl and Knight (1998) reported above suggest that theobserved changes in precipitation events may not be the kinds that lead to flooding, butmuch more work is needed in this area. The past decade has been warmer, and newanalyses using updated runoff data and different kinds of analysis could be available soon.
Another aspect of runoff trends relates to seasonal rather than annual changes. In somewatersheds in western North America, the timing of runoff appears to be shifting fromearly spring to late winter (medium confidence). Such a pattern is consistent with avariety of climate model simulations and regional studies that indicate a shortening of thewinter snow accumulation season and an earlier melting of the snowpack will occur astemperature increases (Gleick 1986, 1987b). Burn (1994) found a statisticallysignificant trend toward earlier spring runoff in west-central Canada on more than 70% of
Figure 25:Number of Streamgages, Out of a Total of 395, With StatisticallySignificant (p≤≤≤≤≤0.05) Trends for the 50-Year Period 1944-1993.
Source: Lins and Slack (1999).
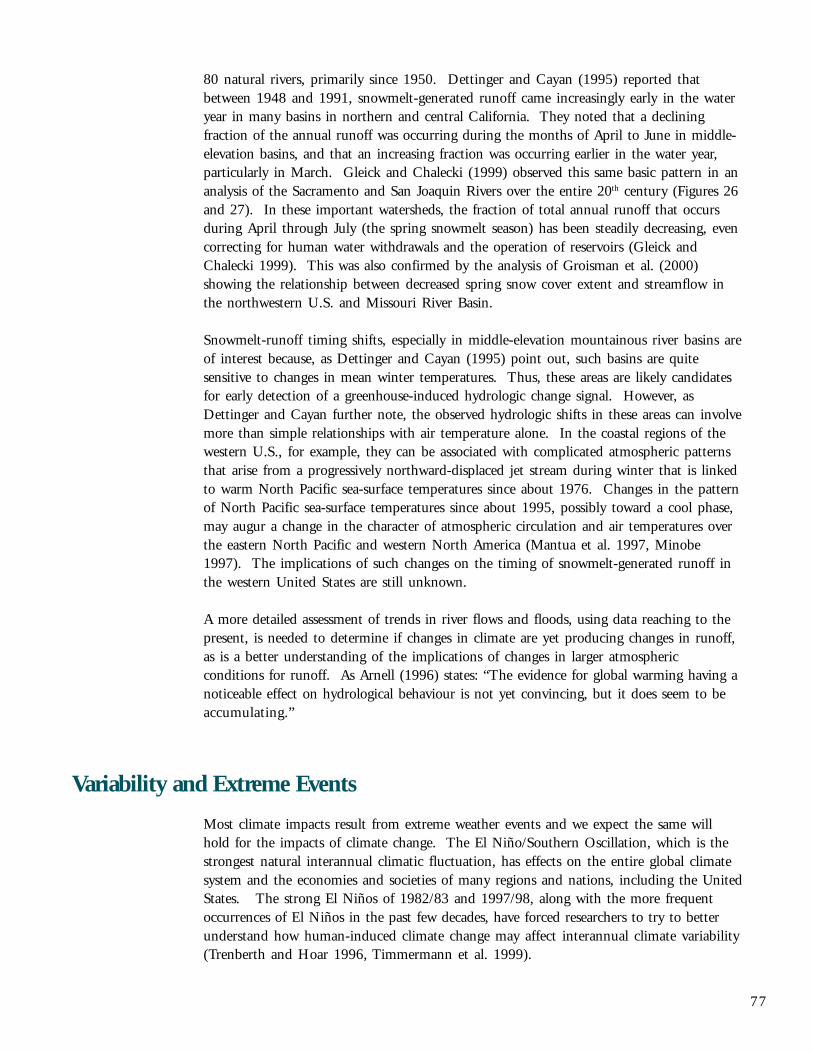
77
80 natural rivers, primarily since 1950. Dettinger and Cayan (1995) reported thatbetween 1948 and 1991, snowmelt-generated runoff came increasingly early in the wateryear in many basins in northern and central California. They noted that a decliningfraction of the annual runoff was occurring during the months of April to June in middle-elevation basins, and that an increasing fraction was occurring earlier in the water year,particularly in March. Gleick and Chalecki (1999) observed this same basic pattern in ananalysis of the Sacramento and San Joaquin Rivers over the entire 20th century (Figures 26and 27). In these important watersheds, the fraction of total annual runoff that occursduring April through July (the spring snowmelt season) has been steadily decreasing, evencorrecting for human water withdrawals and the operation of reservoirs (Gleick andChalecki 1999). This was also confirmed by the analysis of Groisman et al. (2000)showing the relationship between decreased spring snow cover extent and streamflow inthe northwestern U.S. and Missouri River Basin.
Snowmelt-runoff timing shifts, especially in middle-elevation mountainous river basins areof interest because, as Dettinger and Cayan (1995) point out, such basins are quitesensitive to changes in mean winter temperatures. Thus, these areas are likely candidatesfor early detection of a greenhouse-induced hydrologic change signal. However, asDettinger and Cayan further note, the observed hydrologic shifts in these areas can involvemore than simple relationships with air temperature alone. In the coastal regions of thewestern U.S., for example, they can be associated with complicated atmospheric patternsthat arise from a progressively northward-displaced jet stream during winter that is linkedto warm North Pacific sea-surface temperatures since about 1976. Changes in the patternof North Pacific sea-surface temperatures since about 1995, possibly toward a cool phase,may augur a change in the character of atmospheric circulation and air temperatures overthe eastern North Pacific and western North America (Mantua et al. 1997, Minobe1997). The implications of such changes on the timing of snowmelt-generated runoff inthe western United States are still unknown.
A more detailed assessment of trends in river flows and floods, using data reaching to thepresent, is needed to determine if changes in climate are yet producing changes in runoff,as is a better understanding of the implications of changes in larger atmosphericconditions for runoff. As Arnell (1996) states: “The evidence for global warming having anoticeable effect on hydrological behaviour is not yet convincing, but it does seem to beaccumulating.”
Variability and Extreme Events
Most climate impacts result from extreme weather events and we expect the same willhold for the impacts of climate change. The El Niño/Southern Oscillation, which is thestrongest natural interannual climatic fluctuation, has effects on the entire global climatesystem and the economies and societies of many regions and nations, including the UnitedStates. The strong El Niños of 1982/83 and 1997/98, along with the more frequentoccurrences of El Niños in the past few decades, have forced researchers to try to betterunderstand how human-induced climate change may affect interannual climate variability(Trenberth and Hoar 1996, Timmermann et al. 1999).
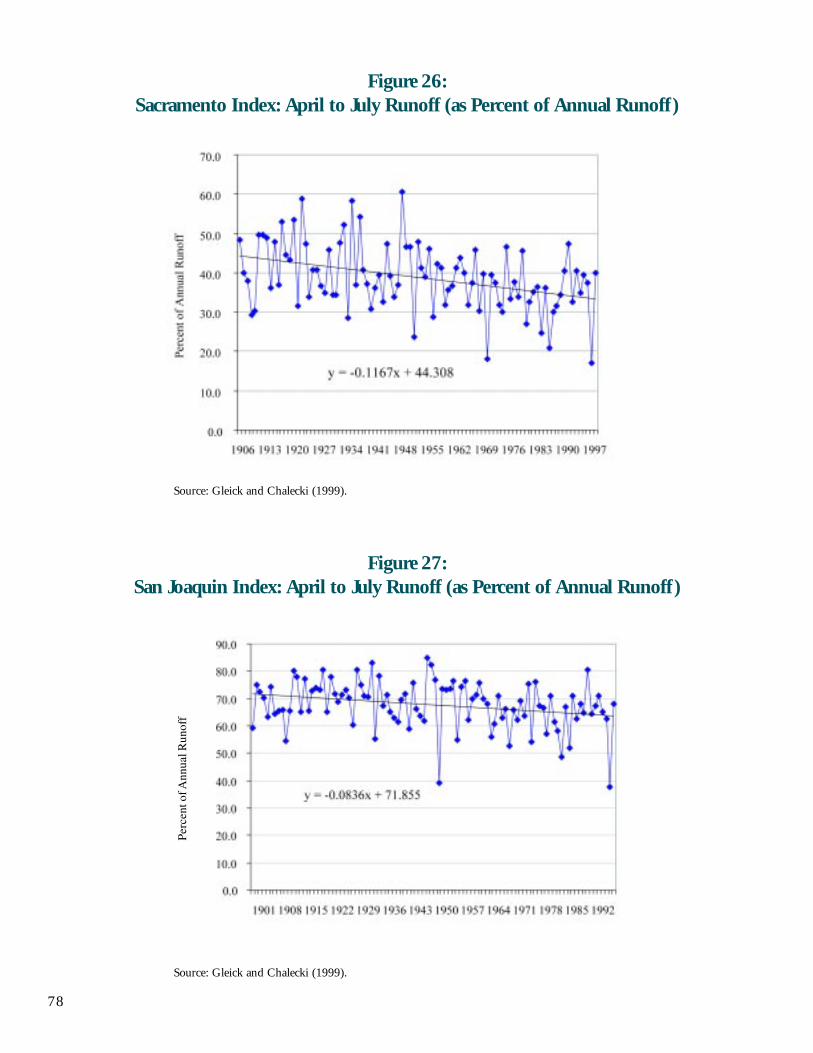
78
Figure 26:Sacramento Index: April to July Runoff (as Percent of Annual Runoff)
Source: Gleick and Chalecki (1999).
Figure 27:San Joaquin Index: April to July Runoff (as Percent of Annual Runoff )
Source: Gleick and Chalecki (1999).
Per
cent
of A
nnua
l Run
off
79
Limited research has been conducted on trends in the frequency and intensity of extremehydrologic events, though in the past few years more efforts have been made in this area.Clear evidence of very few trends has yet appeared, and much more effort is needed, evento identify appropriate indicators of such changes and to compile the data needed to do acomprehensive assessment (Meehl et al. 2000, Easterling et al. 2000). As noted above,Karl and Knight (1998) reported an increase in the highest 1-day annual precipitationrecords, but efforts to assess changes in actual storm frequencies or intensities, or extremerunoff, are just beginning.
Hayden (1999) reviewed storm tracks and strengths from 1885 to 1997. BreakingNorth America into 180 grid cells and tracking storm during this period revealed noindication of any overall trends. He also concluded that there has been neither asystematic increase or decrease in the number of storms since 1885. Landsea et al. (1999)found a statistically significant decrease in intense hurricanes that cause the most damage.An analysis of precipitation, runoff, and flood data for the Upper Mississippi and lowerMissouri rivers concluded that flood risk has increased in recent decades. Analysis of flowson tributaries of the Missouri and Meremac rivers shows “a significant increase in floodrisk over time in the last century” (Olsen et al. 1999). There are several possiblecompeting explanations for these apparent changes, including human-induced climateange, natural variability in precipitation in the region, measurement errors, oranthropogenic change such as levee construction and alteration of local geomorphology.Some of the changes in risk are also certainly due non-climatic factors, including land-usechanges, population increases in vulnerable areas, and changes in structural protection.Rossel and Garbrecht (1999) examined systematic spatial and random spatial variability ofprecipitation in central Oklahoma and related it to temporal variability for the years1919-1996. Both natural temporal and spatial variability of precipitation are large andthe authors note that using regional precipitation data from large-scale model outputs todraw conclusions about how local conditions might change in the future is risky, sinceaccurate regional and local precipitation patterns are not reproducible yet.
Winstanley and Changnon (1999) reviewed how existing variability in weather andclimate affected water conditions for the state of Illinois, from 1901 to 1997. The resultsfor Illinois were considered representative of impacts over other midwestern states. Theyalso evaluated how regional hydrologists perceive the relative importance of variousweather factors in altering water availability and quality. The water factors studiedincluded streamflow, reservoir supplies, groundwater supplies, and the quality of bothsurface and ground water. These water factors were most sensitive to weather conditionsin spring and summer, and less sensitive to conditions in the fall and winter. The majorseasonal impacts identified were:
• Wet/Warm springs led to mixed effects on surface water quantity and water quality,and positive effects on groundwater quantity;
• Dry/Warm springs led to negative effects on surface water quantity and mixed effectson water quality;
• Wet/Warm summers led to mixed effects on surface water quantity and negative effecton water quality; and

80
• Dry/Warm summer led to negative effects on all water factors.
• Cool conditions, whether wet or dry, had little effect.
Analyses of flood risks are traditionally based on past data and on a fundamentalassumption that peak floods are “random, independent, and identically distributedevents.” This assumes that climate trends or cycles are not affecting the distribution offlood flows and that the future climate will be similar to past climate. Current concernover natural variability, anthropogenic climate change, and possible impacts on hydrology,however, calls this assumption into question (NRC 1998).
81
Climate Change and Impacts on Managed Water-Resource Systems
Introduction
Climate change will affect the availability of water in the United States, as well as itsquality, distribution, and form. Climate change will also affect the complex infrastructureand systems in place to manage the nation’s water and existing climate variability. Thereis a growing literature about how different climate changes may affect the infrastructureand complex systems built to manage United States water resources (Chalecki and Gleick1999: see http://www.pacinst.org/CCBib.html for a searchable bibliography). Researchhas been conducted on potential impacts over a wide range of water-system characteristics,including reservoir operations, hydroelectric generation, navigation, and other concerns.At the same time, significant knowledge gaps remain and far more research is needed.Priorities and directions for future work should come from water managers and planners aswell as from the more traditional academic and scientific research community.
Precipitation, temperature, and carbon dioxide levels affect both the supply of, anddemand for, renewable water resources. Irrigation, which accounts for 39% of all U.S.water withdrawals and 81% of consumptive use (Solley et al. 1998), is particularlysensitive to climate conditions (see Figure 2). Water for household purposes — drinking,preparing food, bathing, washing clothes and dishes, flushing toilets, and watering lawnsand gardens — accounts for eight percent of withdrawals and seven percent ofconsumptive use in the United States (Solley et al. 1998). While indoor domestic wateruse is not very sensitive to temperature and precipitation, outdoor uses for gardens andparks are very climate dependent. In some regions of the U.S., particularly the arid andsemi-arid west, climate-induced changes in domestic demand can aggravate the problemsof balancing supplies with demands.
Industrial use, which includes water for processing materials, washing, and cooling,accounts for seven percent of withdrawals and three percent of consumptive use in theUnited States. Thermoelectric power use in the U.S., which includes water for cooling tocondense the steam that drives the turbines in the generation of electric power with fossilfuel, nuclear, or geothermal energy, accounts for 39% of all withdrawals but only threepercent of consumptive use (Solley et al. 1998). A rise in air and water temperaturesmight have several effects on these water uses. For instance, higher water temperatureswould reduce the efficiency of cooling systems and increase the demand for cooling water.Increased air and water temperatures can also cause plant deratings, forced shutdowns dueto environmental constraints, or violation of safety water intake limits.
Changing air temperatures would alter energy use for summer air conditioning and winterspace heating. These changes in the temporal and spatial demand for energy could alsoalter the demand for cooling water. The effect on consumptive water use, however, wouldbe small because more than 95% of the freshwater withdrawn for industrial andthermoelectric power use is now returned to ground and surface water sources where it canbe reused.
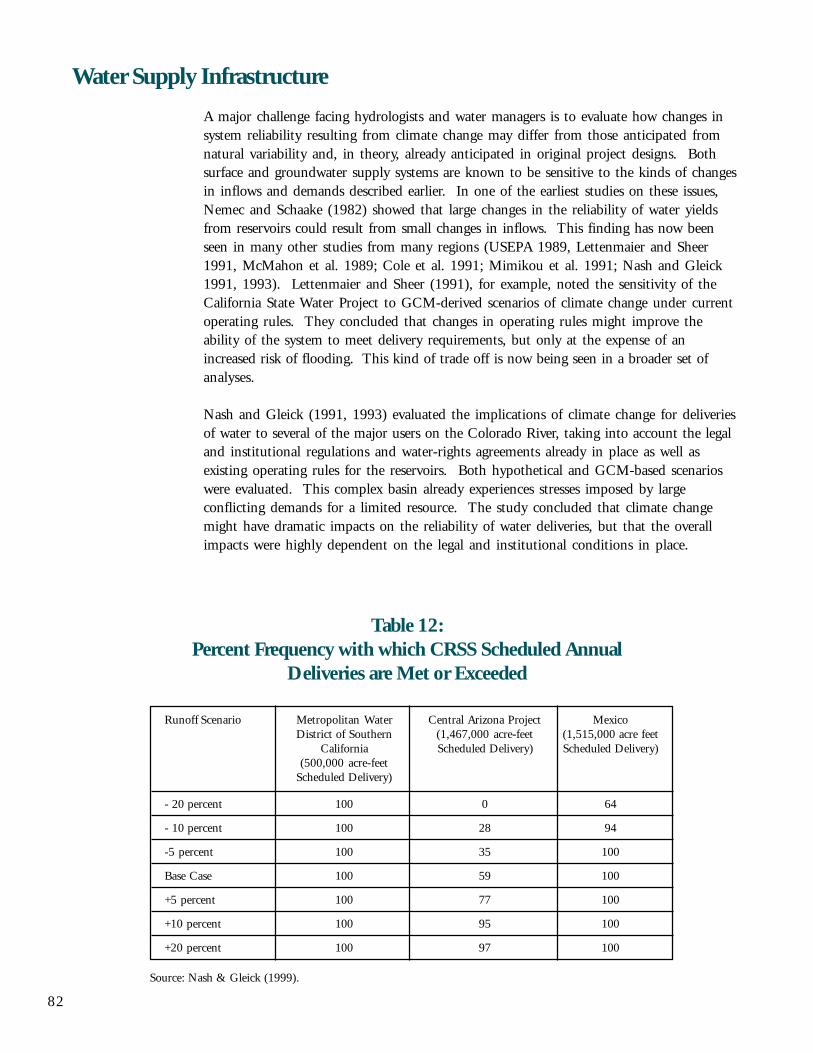
82
Water Supply Infrastructure
A major challenge facing hydrologists and water managers is to evaluate how changes insystem reliability resulting from climate change may differ from those anticipated fromnatural variability and, in theory, already anticipated in original project designs. Bothsurface and groundwater supply systems are known to be sensitive to the kinds of changesin inflows and demands described earlier. In one of the earliest studies on these issues,Nemec and Schaake (1982) showed that large changes in the reliability of water yieldsfrom reservoirs could result from small changes in inflows. This finding has now beenseen in many other studies from many regions (USEPA 1989, Lettenmaier and Sheer1991, McMahon et al. 1989; Cole et al. 1991; Mimikou et al. 1991; Nash and Gleick1991, 1993). Lettenmaier and Sheer (1991), for example, noted the sensitivity of theCalifornia State Water Project to GCM-derived scenarios of climate change under currentoperating rules. They concluded that changes in operating rules might improve theability of the system to meet delivery requirements, but only at the expense of anincreased risk of flooding. This kind of trade off is now being seen in a broader set ofanalyses.
Nash and Gleick (1991, 1993) evaluated the implications of climate change for deliveriesof water to several of the major users on the Colorado River, taking into account the legaland institutional regulations and water-rights agreements already in place as well asexisting operating rules for the reservoirs. Both hypothetical and GCM-based scenarioswere evaluated. This complex basin already experiences stresses imposed by largeconflicting demands for a limited resource. The study concluded that climate changemight have dramatic impacts on the reliability of water deliveries, but that the overallimpacts were highly dependent on the legal and institutional conditions in place.
Runoff Scenario Metropolitan Water Central Arizona Project MexicoDistrict of Southern (1,467,000 acre-feet (1,515,000 acre feet
California Scheduled Delivery) Scheduled Delivery)(500,000 acre-feet
Scheduled Delivery)
- 20 percent 100 0 64
- 10 percent 100 28 94
-5 percent 100 35 100
Base Case 100 59 100
+5 percent 100 77 100
+10 percent 100 95 100
+20 percent 100 97 100
Source: Nash & Gleick (1999).
Table 12:Percent Frequency with which CRSS Scheduled Annual
Deliveries are Met or Exceeded
83
Estimates of consumptive use of water in the basin were reported in terms of depletionsand deliveries. Some users are guaranteed, by law, minimum deliveries. Deliveries ofwater from the upper to the lower basin fall below legal requirements 23% of the time inthe base case. If average flows drop only five percent, this frequency rises to 41%. Underthe Colorado River Simulation System operating assumptions, the scheduled deliveries ofwater to the Metropolitan Water District of Southern California are met in all years underall scenarios because of their higher water right. Annual deliveries to the Central ArizonaProject, which has a more junior right, meet or exceed scheduled deliveries only 40% ofthe time in the base case and fall to their minimum level in 50% of the years when long-term runoff drops only five percent. Table 12 summarizes the percent frequency withwhich scheduled deliveries to MWD, CAP, and Mexico are met or exceeded. Deliveries toMexico fall under the level specified by international treaty when long-term average runoffdecreases by 10% or more. Potential changes in water demand due to climate changewere not addressed by the study, but would further complicate basin management.
Lettenmaier et al. (1999) conducted a broad assessment of the sensitivity of six major U.S.water resource systems to climate change and evaluated the performance of multiple-usesystems. These studies applied a range of transient GCM scenarios and evaluated theeffects on end users of water. Six systems were studied in all: two very large river basins(the Columbia and Missouri), two moderate size basins (the Savannah and Apalachicola-Chattahoochee-Flint (ACF)); and two urban water-supply systems (Boston and Tacoma).For each system, several indicators were evaluated, including system reliability (defined asthe percentage of time the system operates without failure), the system resiliency (definedas the ability of the system to recover from a failure), and the system vulnerability (definedas the average severity of failure).
Changes in runoff were the most important factors determining the climate sensitivity ofsystem performance (Lettenmaier et al. 1999), even when they evaluated the direct effectsof climate change on water demands. These sensitivities depended on the purposes forwhich water was needed and the priority given to those uses. Higher temperaturesincreased system use in many basins, but these increases tended to be modest, as were theeffects of higher temperatures on system reliability.
One complication of this analysis is the difficulty of projecting future water demands in theabsence of climate change. Wood et al. (1997) and Lettenmaier et al. (1999) noted that theinfluence of long-term demand growth on system performance had a greater impact thanclimate change when long-term withdrawals are projected to grow substantially. In the Bostonand Tacoma areas, traditional projections of large growth in municipal and industrial water useled to a greater mismatch between supply and demand than did most of the climate scenarios.Kirshen and Fennessey (1995) also evaluated the potential impacts of both changes in demandand climate change on the Boston water-supply system and noted that supply deficits causedby these factors could cost as much as $700 million to make up, while implementing demand-management options, such as installing water-conserving fixtures and appliances, fixing leaks,and modifying industrial processes, could reduce this amount to under $150 million. As wasshown earlier in Figure 5, general projections for the United States have regularly andsignificantly overestimated future withdrawals, often by a factor of two or more. The same istrue for local and regional estimates. Actions to reduce demands or to moderate the rate ofincrease in demand growth can therefore play a direct role in moderating the impacts ofclimate change as well, with concomitant effects on system reliability.
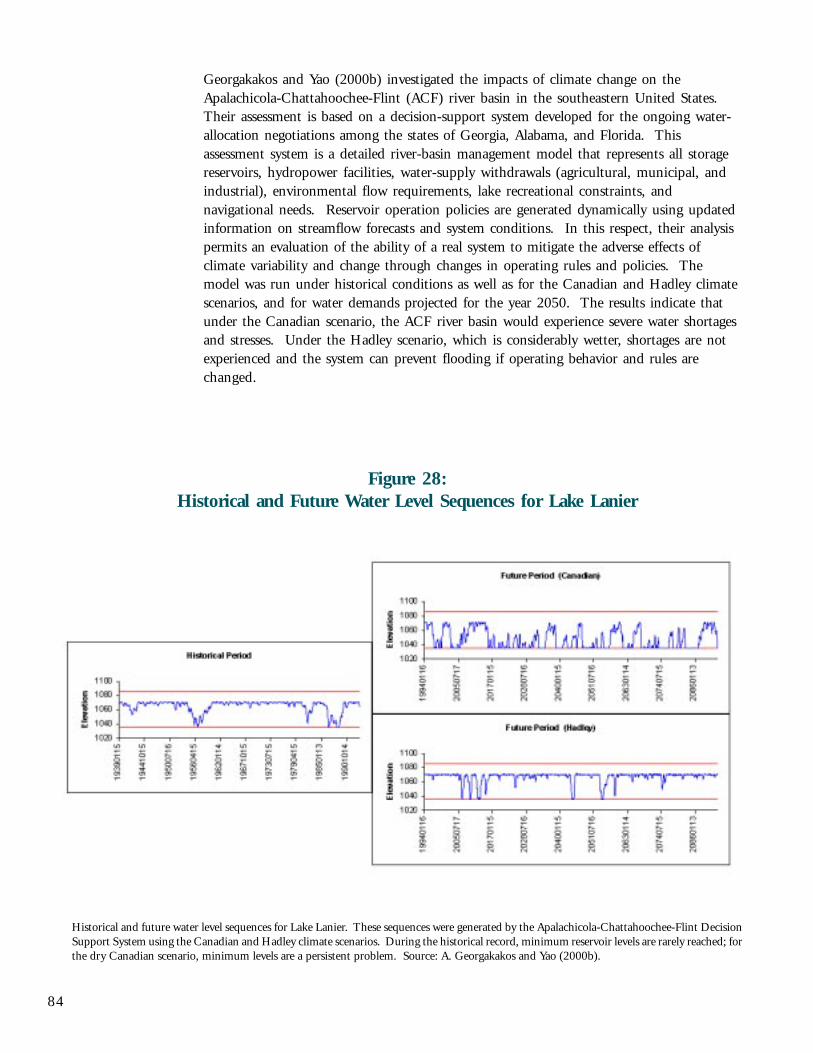
84
Georgakakos and Yao (2000b) investigated the impacts of climate change on theApalachicola-Chattahoochee-Flint (ACF) river basin in the southeastern United States.Their assessment is based on a decision-support system developed for the ongoing water-allocation negotiations among the states of Georgia, Alabama, and Florida. Thisassessment system is a detailed river-basin management model that represents all storagereservoirs, hydropower facilities, water-supply withdrawals (agricultural, municipal, andindustrial), environmental flow requirements, lake recreational constraints, andnavigational needs. Reservoir operation policies are generated dynamically using updatedinformation on streamflow forecasts and system conditions. In this respect, their analysispermits an evaluation of the ability of a real system to mitigate the adverse effects ofclimate variability and change through changes in operating rules and policies. Themodel was run under historical conditions as well as for the Canadian and Hadley climatescenarios, and for water demands projected for the year 2050. The results indicate thatunder the Canadian scenario, the ACF river basin would experience severe water shortagesand stresses. Under the Hadley scenario, which is considerably wetter, shortages are notexperienced and the system can prevent flooding if operating behavior and rules arechanged.
Figure 28:Historical and Future Water Level Sequences for Lake Lanier
Historical and future water level sequences for Lake Lanier. These sequences were generated by the Apalachicola-Chattahoochee-Flint DecisionSupport System using the Canadian and Hadley climate scenarios. During the historical record, minimum reservoir levels are rarely reached; forthe dry Canadian scenario, minimum levels are a persistent problem. Source: A. Georgakakos and Yao (2000b).
85
For the Canadian scenario, water-supply deficits would increase more than 50-fold in theupper part of the basin while reservoir levels would experience frequent and very severedrawdowns. Unmistakable evidence of this is shown in Figure 28, which depicts thehistorical and future water-level fluctuations for Lake Lanier, the largest of the ACFreservoirs. Among other detrimental consequences, water-level fluctuations of suchmagnitude would sharply diminish the ability of the lake to provide relief duringdroughts, generate dependable energy, and maintain its high recreational value. Underthe Canadian climate scenario, the ACF system would also frequently fail to meet the low-flow targets throughout the basin, degrading environmental quality and compromisingecosystem health. These adverse effects are exacerbated if the reservoirs are operatedaccording to the historical operational practices. Figure 28 also portrays the Lake Lanierfluctuations for the Hadley scenario. In this scenario, all ACF reservoirs exhibit amarkedly different response: water-supply shortages and flow target violations are notrecorded in this case, while the risk of flooding is fully controlled. These resultsunderscore the uncertainty associated with climate scenarios and emphasize the need forflexible water-allocation agreements and adaptive management strategies that explicitlyaccount for uncertainty.
Hydropower and Thermal Power Generation
In parts of the United States, substantial amounts of electricity are produced byhydroelectric facilities. Table 13 shows the production of hydroelectricity in 1995 bywater-resource region. The amount and value of hydropower production from a givenhydroelectric power plant is a function of the amount of water available, the height thatwater falls before going through a turbine, and operational decisions about schedulingreleases.
Variability in climate already causes variations in hydroelectric generation. During arecent multi-year drought in California, decreased hydropower generation led to increasesin fossil-fuel combustion and higher costs to consumers. Between 1987 and 1991, thesechanges cost ratepayers more than $3 billion and increased greenhouse gas emissions(Gleick and Nash 1991). Because of conflicts between flood-control functions andhydropower objectives, human-induced climate change in California may require morewater to be released from California reservoirs in spring to avoid flooding. This wouldresult in a reduction in hydropower generation and the economic value of that generation.At the same time, production of power by fossil fuels would have to increase to meet thesame energy demands in California at a cost of hundreds of millions of dollars and anincrease in emissions of greenhouse gases (Hanemann and McCann 1993).
Climate changes that reduce overall water availability or change the timing of thatavailability have the potential to adversely affect the productivity of U.S. hydroelectricfacilities. In contrast, reliable increases in average flows would increase hydropowerproduction. A growing number of regional assessments have begun to look at these issues.Nash and Gleick (1993) evaluated how equilibrium and transient climate scenarios wouldaffect hydroelectricity production in the Colorado River system. Hydroelectricityproduction in the lower Colorado Basin was determined to be more sensitive to changes inrunoff in the basin than any of the other variables studied, including salinity, reservoirlevels, and deliveries of water to users. Under current operation laws and rules, Lake Mead
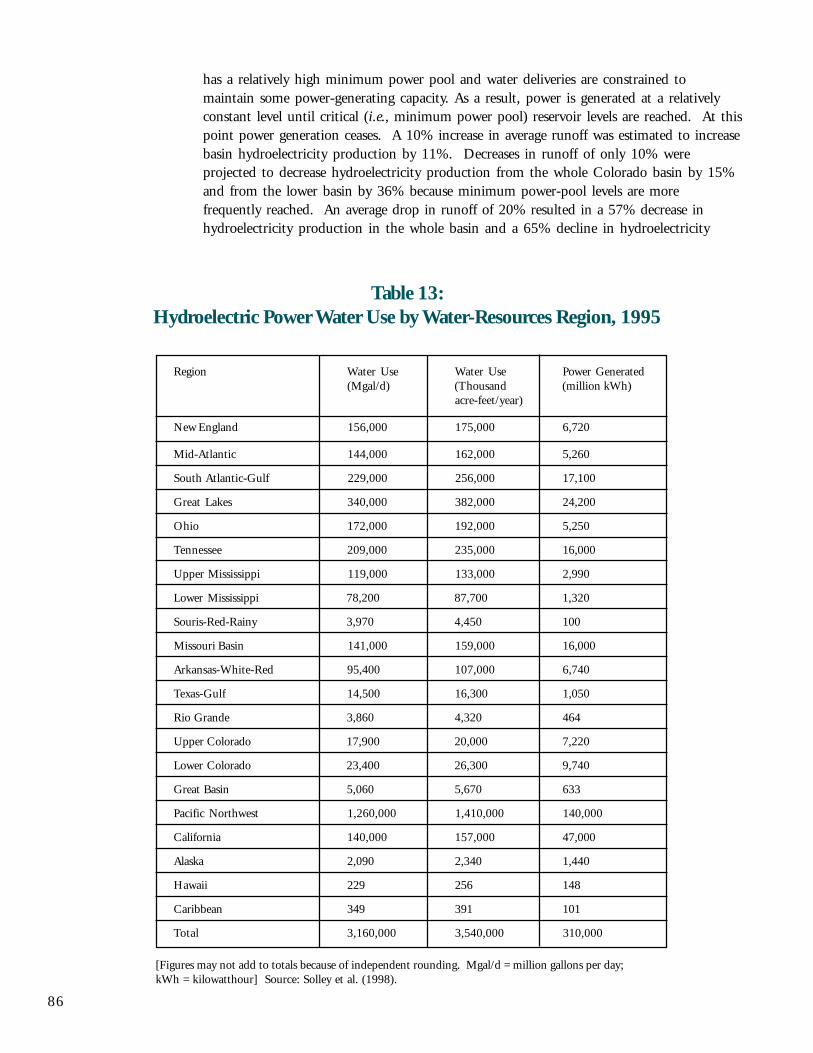
86
has a relatively high minimum power pool and water deliveries are constrained tomaintain some power-generating capacity. As a result, power is generated at a relativelyconstant level until critical (i.e., minimum power pool) reservoir levels are reached. At thispoint power generation ceases. A 10% increase in average runoff was estimated to increasebasin hydroelectricity production by 11%. Decreases in runoff of only 10% wereprojected to decrease hydroelectricity production from the whole Colorado basin by 15%and from the lower basin by 36% because minimum power-pool levels are morefrequently reached. An average drop in runoff of 20% resulted in a 57% decrease inhydroelectricity production in the whole basin and a 65% decline in hydroelectricity
Table 13:Hydroelectric Power Water Use by Water-Resources Region, 1995
Region Water Use Water Use Power Generated(Mgal/d) (Thousand (million kWh)
acre-feet/year)
New England 156,000 175,000 6,720
Mid-Atlantic 144,000 162,000 5,260
South Atlantic-Gulf 229,000 256,000 17,100
Great Lakes 340,000 382,000 24,200
Ohio 172,000 192,000 5,250
Tennessee 209,000 235,000 16,000
Upper Mississippi 119,000 133,000 2,990
Lower Mississippi 78,200 87,700 1,320
Souris-Red-Rainy 3,970 4,450 100
Missouri Basin 141,000 159,000 16,000
Arkansas-White-Red 95,400 107,000 6,740
Texas-Gulf 14,500 16,300 1,050
Rio Grande 3,860 4,320 464
Upper Colorado 17,900 20,000 7,220
Lower Colorado 23,400 26,300 9,740
Great Basin 5,060 5,670 633
Pacific Northwest 1,260,000 1,410,000 140,000
California 140,000 157,000 47,000
Alaska 2,090 2,340 1,440
Hawaii 229 256 148
Caribbean 349 391 101
Total 3,160,000 3,540,000 310,000
[Figures may not add to totals because of independent rounding. Mgal/d = million gallons per day;kWh = kilowatthour] Source: Solley et al. (1998).
87
production in the lower basin. Table 10 and Figure 19 show the sensitivity of water-supply variables including hydroelectricity production to changes in the natural flows ofthe Colorado under the current law of the river. No runs were made to explore theimpacts on water deliveries or reservoir levels if operators try to maximize powerproduction, but presumably hydropower production could be increased at the cost of areduction in the reliability of water deliveries.
A more sophisticated study by Lettenmaier et al. (1999) looked at how climate changewould affect a wide range of system characteristics for major watersheds, complex reservoirsystems, and urban areas in several parts of the United States. They evaluated the impactsof a range of climate change scenarios, including three transient scenarios and anequilibrium doubled-CO
2 scenario. Among the effects studied were hydroelectric power
operations. Their analysis concluded that power operations would be most sensitive toclimate change in the Missouri River, where the climate scenarios would result in declinesin the reliability of meeting monthly energy targets of as much as 15 to 35%. For theColumbia River basin, shifts in the seasonal hydrograph are critical, as are operatingpolicies. In this region reliability of firm energy production showed progressive declines ofas much as 5 to 15 % over time as climate changes; more modest decreases were seen inthe equilibrium doubled-CO
2 scenario. For the Savannah River, two out of the three
transient scenarios led to increases in hydroelectricity production; the third had slightdeclines. Results for the ACF basin were similar in direction to the Savannah basin, butsmaller.
While most of the scenarios were evaluated assuming current operating conditions, somealternative operational scenarios were evaluated. For example, the current conflicts in theColumbia basin over fisheries protection versus hydropower generation could lead to areprioritization of operational rules. Another possibility is that hydropower generationmight be constrained by recreational needs to maintain reservoir levels in summer. Bothof these alternatives were evaluated under conditions of climate change, and the overalleffects on hydropower were on the order of those effects for the most severe climatescenarios using current operating rules (Lettenmaier et al. 1999).
Georgakakos and Yao (2000b) conducted a detailed hydropower assessment for the ACFriver basin under historical and future (Canadian and Hadley) climate scenarios. Theirmodel includes details of the basin’s hydropower facilities and optimizes peak and off-peakenergy generation subject to all other water-use commitments and constraints. Relative tothe historical response, the dry Canadian climate scenario resulted in a 33% reduction intotal energy generation, a 14% reduction in peak energy generation, and a 35% reductionin off-peak energy generation. By contrast, the wetter Hadley Climate Scenario increasedtotal energy generation by 21%. In this assessment, all hydropower facilities werescheduled to generate at peak power for only one hour per day. Raising the peak powerrequirement from one to four hours per day leads to water shortages and stresses for allscenarios comparable to those of the Canadian scenario. Thus, water-use changes may beas consequential as climate change. Furthermore, Georgakakos and Yao (2000b)estimated that if reservoir operators use adaptable policies rather than traditional operatingrules, energy generation gains as high as 20% could be achieved without any adverseimpact to other water uses. The implication of this finding is that dynamic managementstrategies could be effective in mitigating the adverse impacts of climate change.
88
Chao (1999) evaluated ten different steady-state and transient climate scenarios andmodeled changes in the value of hydropower generation in the Great Lakes compared witha base climate. Hydropower plants and their diversion works along the St. Mary’s and St.Lawrence rivers serve as water-level control structures for Lake Superior and Lake Ontario.The model also includes hydropower generated at Niagara. Treaties between the UnitedStates and Canada determine flow releases, but there are exceptions in the treaties when levelsand flows fall outside treaty conditions. In all ten scenarios, hydropower generation decreasedbecause of projected decreases in lake levels. On average, hydropower dropped 7 to 10%,though it decreased in some scenarios by as much as 20% (Chao 1999).
Climate also plays a role in power production from conventional fossil fuel and nuclear powerplants by affecting cooling water temperatures and plant efficiencies. In an unusual study ofthe impacts of climate change on river temperatures, Miller (1993) concluded that theTennessee Valley Authority would be forced to reduce power generation and shut down fossiland nuclear plants more frequently to avoid violating temperature standards set for regionalrivers. Plant efficiencies, which depend in part on the temperature of cooling water, would bereduced (medium confidence) and cooling towers required more often.
Human Health
There are direct and indirect links between water availability and quality and human health.Efforts are just beginning to explore the complex connections among climate, water, andhuman health (Bernard et al. 1999). A separate effort of the National Assessment has beendevoted to this problem, and interested readers are urged to read the analyses prepared for thatsector. Many urban areas already have a problem with urban storm runoff that, whenuntreated, leads to problems with both inland and coastal water quality, which in turn has welldocumented direct effects on human health. Changes in climate conditions can affect theintensity of urban storm runoff, particularly in regions where precipitation increases. Climatechange will also affect the viability of disease vectors like mosquitoes. The viability andtransport of water-borne pathogens such as Cryptosporidium is known to be affected by changesin precipitation and runoff intensities and by land-use practices. Cryptosporidium has beenresponsible for an increasing number of drinking water advisories in recent years and a majoroutbreak in Milwaukee in 1993 led to more than 100 deaths and 400,000 illnesses.Hantavirus, a disease spread by deer mice, has been linked to ENSO-related climate variability.Higher rainfall has led to increased rodent populations and increased contact between humansand rodents. The distribution of Vibrio cholerae, the bacteria responsible for cholera, is affectedby climate conditions, including El Niño, temperature, and ocean salinity (Colwell 1996,Motes et al. 1998, Harvell et al. 1999). Figures 29 and 30 (from MMWR 1999) show theincidences of cholera and malaria in the United States, two diseases related to the quality ofwater or vectors that breed in water.
Many of the cases of cholera, malaria, dengue fever, and other diseases reported in the UnitedStates are actually imported by travelers from other parts of the world. Increases in water-related diseases elsewhere, therefore, can have an indirect effect on United States cases. Over740,000 cases of dengue fever were reported for 1998 by Pan American Health Organizationscountries, more than twice the total for 1997. Continued expansion of dengue in LatinAmerica will ultimately have an effect on the United States either through direct orimported incidences. In 1998, 90 probable or confirmed cases of dengue fever were
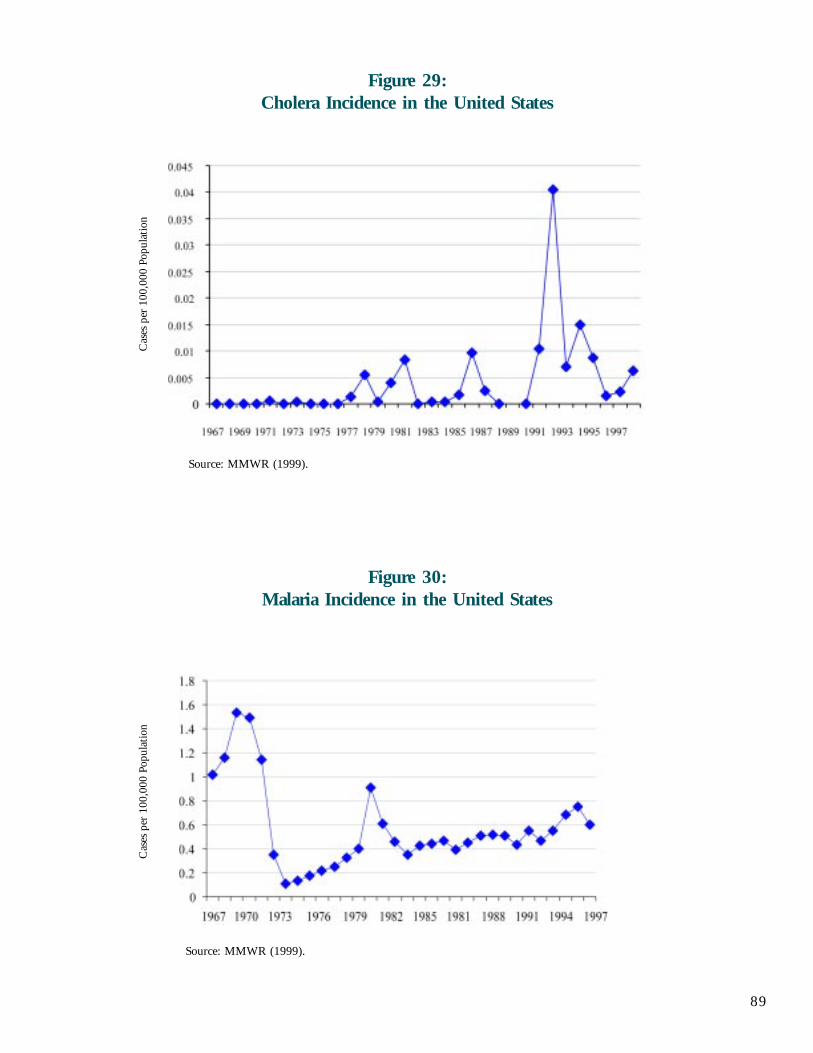
89
Figure 29:Cholera Incidence in the United States
Figure 30:Malaria Incidence in the United States
Source: MMWR (1999).
Source: MMWR (1999).
Cas
es p
er 1
00,0
00 P
opul
atio
nC
ases
per
100
,000
Pop
ulat
ion
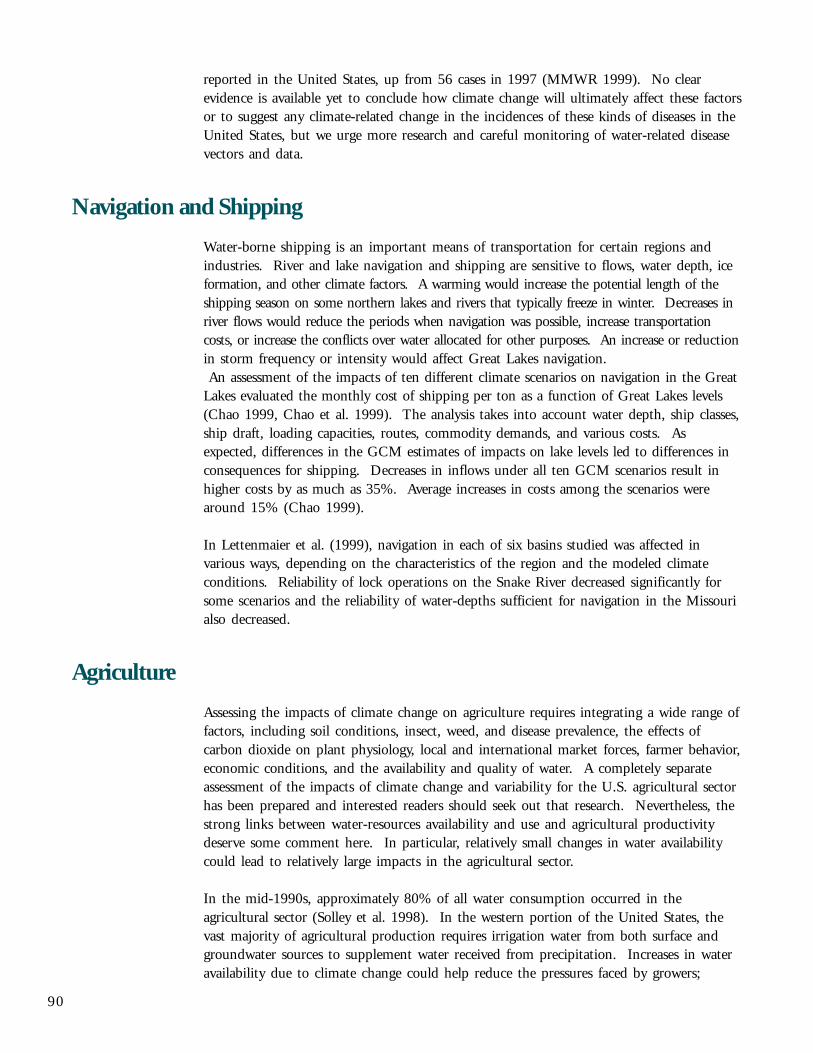
90
reported in the United States, up from 56 cases in 1997 (MMWR 1999). No clearevidence is available yet to conclude how climate change will ultimately affect these factorsor to suggest any climate-related change in the incidences of these kinds of diseases in theUnited States, but we urge more research and careful monitoring of water-related diseasevectors and data.
Navigation and Shipping
Water-borne shipping is an important means of transportation for certain regions andindustries. River and lake navigation and shipping are sensitive to flows, water depth, iceformation, and other climate factors. A warming would increase the potential length of theshipping season on some northern lakes and rivers that typically freeze in winter. Decreases inriver flows would reduce the periods when navigation was possible, increase transportationcosts, or increase the conflicts over water allocated for other purposes. An increase or reductionin storm frequency or intensity would affect Great Lakes navigation. An assessment of the impacts of ten different climate scenarios on navigation in the GreatLakes evaluated the monthly cost of shipping per ton as a function of Great Lakes levels(Chao 1999, Chao et al. 1999). The analysis takes into account water depth, ship classes,ship draft, loading capacities, routes, commodity demands, and various costs. Asexpected, differences in the GCM estimates of impacts on lake levels led to differences inconsequences for shipping. Decreases in inflows under all ten GCM scenarios result inhigher costs by as much as 35%. Average increases in costs among the scenarios werearound 15% (Chao 1999).
In Lettenmaier et al. (1999), navigation in each of six basins studied was affected invarious ways, depending on the characteristics of the region and the modeled climateconditions. Reliability of lock operations on the Snake River decreased significantly forsome scenarios and the reliability of water-depths sufficient for navigation in the Missourialso decreased.
Agriculture
Assessing the impacts of climate change on agriculture requires integrating a wide range offactors, including soil conditions, insect, weed, and disease prevalence, the effects ofcarbon dioxide on plant physiology, local and international market forces, farmer behavior,economic conditions, and the availability and quality of water. A completely separateassessment of the impacts of climate change and variability for the U.S. agricultural sectorhas been prepared and interested readers should seek out that research. Nevertheless, thestrong links between water-resources availability and use and agricultural productivitydeserve some comment here. In particular, relatively small changes in water availabilitycould lead to relatively large impacts in the agricultural sector.
In the mid-1990s, approximately 80% of all water consumption occurred in theagricultural sector (Solley et al. 1998). In the western portion of the United States, thevast majority of agricultural production requires irrigation water from both surface andgroundwater sources to supplement water received from precipitation. Increases in wateravailability due to climate change could help reduce the pressures faced by growers;
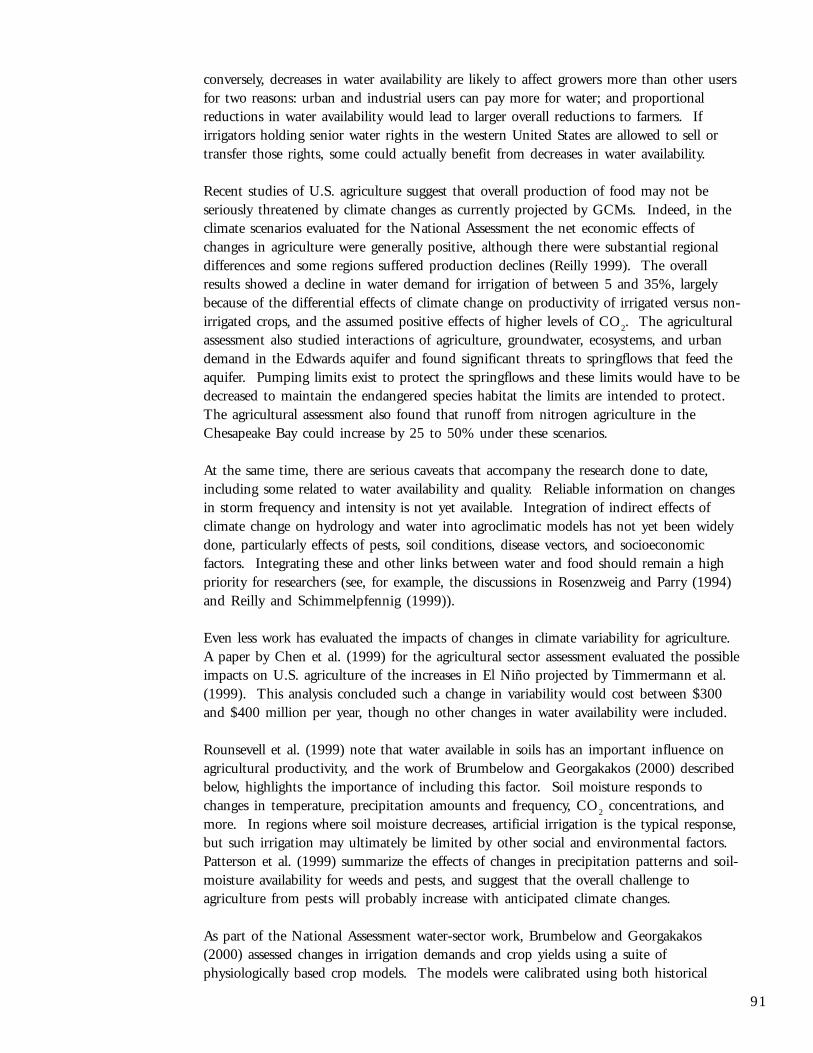
91
conversely, decreases in water availability are likely to affect growers more than other usersfor two reasons: urban and industrial users can pay more for water; and proportionalreductions in water availability would lead to larger overall reductions to farmers. Ifirrigators holding senior water rights in the western United States are allowed to sell ortransfer those rights, some could actually benefit from decreases in water availability.
Recent studies of U.S. agriculture suggest that overall production of food may not beseriously threatened by climate changes as currently projected by GCMs. Indeed, in theclimate scenarios evaluated for the National Assessment the net economic effects ofchanges in agriculture were generally positive, although there were substantial regionaldifferences and some regions suffered production declines (Reilly 1999). The overallresults showed a decline in water demand for irrigation of between 5 and 35%, largelybecause of the differential effects of climate change on productivity of irrigated versus non-irrigated crops, and the assumed positive effects of higher levels of CO
2. The agricultural
assessment also studied interactions of agriculture, groundwater, ecosystems, and urbandemand in the Edwards aquifer and found significant threats to springflows that feed theaquifer. Pumping limits exist to protect the springflows and these limits would have to bedecreased to maintain the endangered species habitat the limits are intended to protect.The agricultural assessment also found that runoff from nitrogen agriculture in theChesapeake Bay could increase by 25 to 50% under these scenarios.
At the same time, there are serious caveats that accompany the research done to date,including some related to water availability and quality. Reliable information on changesin storm frequency and intensity is not yet available. Integration of indirect effects ofclimate change on hydrology and water into agroclimatic models has not yet been widelydone, particularly effects of pests, soil conditions, disease vectors, and socioeconomicfactors. Integrating these and other links between water and food should remain a highpriority for researchers (see, for example, the discussions in Rosenzweig and Parry (1994)and Reilly and Schimmelpfennig (1999)).
Even less work has evaluated the impacts of changes in climate variability for agriculture.A paper by Chen et al. (1999) for the agricultural sector assessment evaluated the possibleimpacts on U.S. agriculture of the increases in El Niño projected by Timmermann et al.(1999). This analysis concluded such a change in variability would cost between $300and $400 million per year, though no other changes in water availability were included.
Rounsevell et al. (1999) note that water available in soils has an important influence onagricultural productivity, and the work of Brumbelow and Georgakakos (2000) describedbelow, highlights the importance of including this factor. Soil moisture responds tochanges in temperature, precipitation amounts and frequency, CO
2 concentrations, and
more. In regions where soil moisture decreases, artificial irrigation is the typical response,but such irrigation may ultimately be limited by other social and environmental factors.Patterson et al. (1999) summarize the effects of changes in precipitation patterns and soil-moisture availability for weeds and pests, and suggest that the overall challenge toagriculture from pests will probably increase with anticipated climate changes.
As part of the National Assessment water-sector work, Brumbelow and Georgakakos(2000) assessed changes in irrigation demands and crop yields using a suite ofphysiologically based crop models. The models were calibrated using both historical
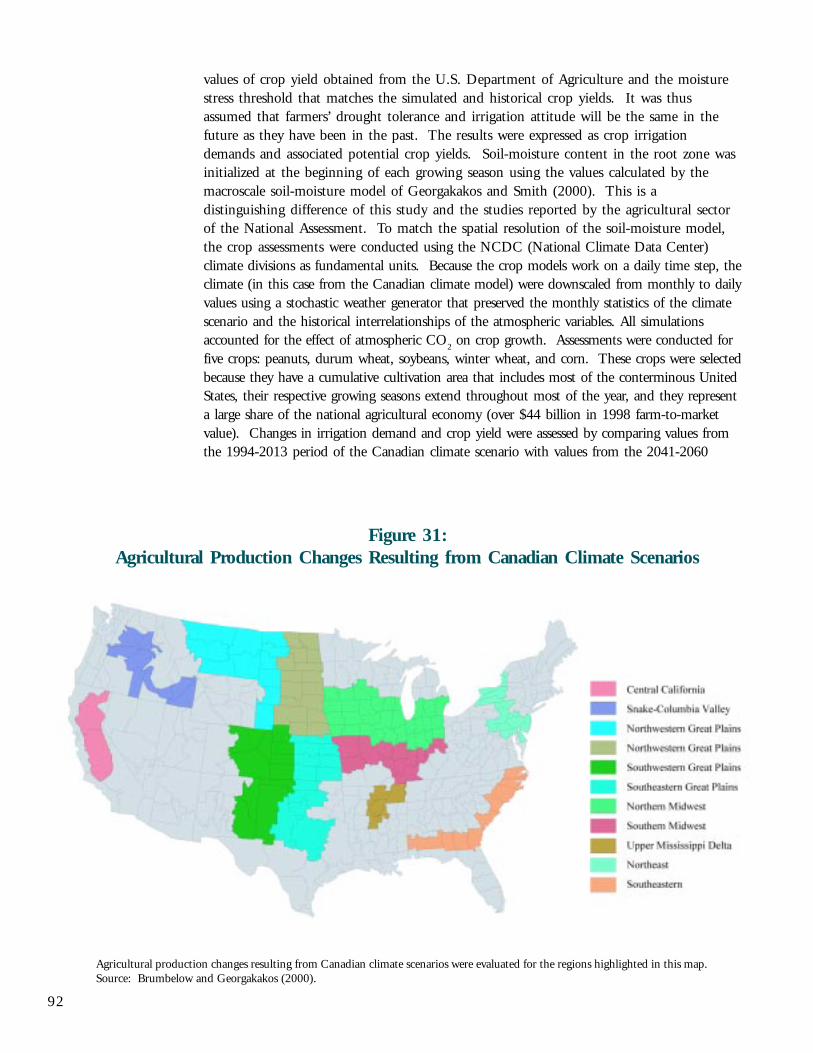
92
values of crop yield obtained from the U.S. Department of Agriculture and the moisturestress threshold that matches the simulated and historical crop yields. It was thusassumed that farmers’ drought tolerance and irrigation attitude will be the same in thefuture as they have been in the past. The results were expressed as crop irrigationdemands and associated potential crop yields. Soil-moisture content in the root zone wasinitialized at the beginning of each growing season using the values calculated by themacroscale soil-moisture model of Georgakakos and Smith (2000). This is adistinguishing difference of this study and the studies reported by the agricultural sectorof the National Assessment. To match the spatial resolution of the soil-moisture model,the crop assessments were conducted using the NCDC (National Climate Data Center)climate divisions as fundamental units. Because the crop models work on a daily time step, theclimate (in this case from the Canadian climate model) were downscaled from monthly to dailyvalues using a stochastic weather generator that preserved the monthly statistics of the climatescenario and the historical interrelationships of the atmospheric variables. All simulationsaccounted for the effect of atmospheric CO
2 on crop growth. Assessments were conducted for
five crops: peanuts, durum wheat, soybeans, winter wheat, and corn. These crops were selectedbecause they have a cumulative cultivation area that includes most of the conterminous UnitedStates, their respective growing seasons extend throughout most of the year, and they representa large share of the national agricultural economy (over $44 billion in 1998 farm-to-marketvalue). Changes in irrigation demand and crop yield were assessed by comparing values fromthe 1994-2013 period of the Canadian climate scenario with values from the 2041-2060
Figure 31:Agricultural Production Changes Resulting from Canadian Climate Scenarios
Agricultural production changes resulting from Canadian climate scenarios were evaluated for the regions highlighted in this map.Source: Brumbelow and Georgakakos (2000).
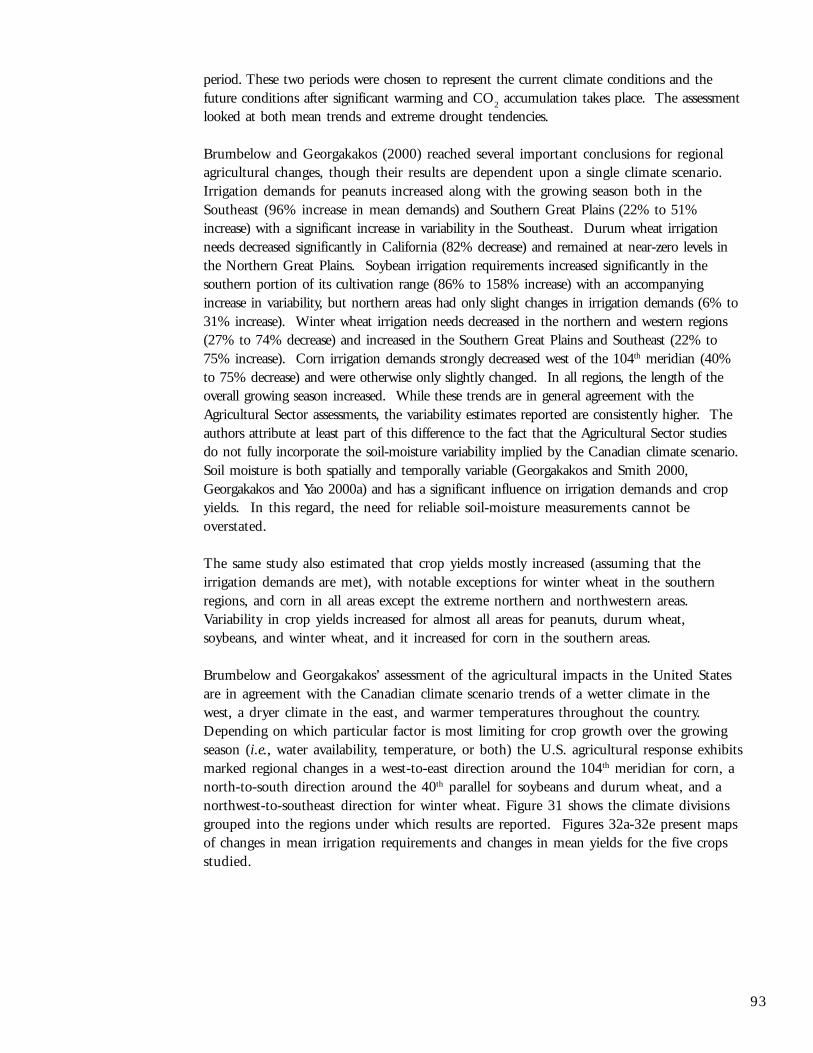
93
period. These two periods were chosen to represent the current climate conditions and thefuture conditions after significant warming and CO
2 accumulation takes place. The assessment
looked at both mean trends and extreme drought tendencies.
Brumbelow and Georgakakos (2000) reached several important conclusions for regionalagricultural changes, though their results are dependent upon a single climate scenario.Irrigation demands for peanuts increased along with the growing season both in theSoutheast (96% increase in mean demands) and Southern Great Plains (22% to 51%increase) with a significant increase in variability in the Southeast. Durum wheat irrigationneeds decreased significantly in California (82% decrease) and remained at near-zero levels inthe Northern Great Plains. Soybean irrigation requirements increased significantly in thesouthern portion of its cultivation range (86% to 158% increase) with an accompanyingincrease in variability, but northern areas had only slight changes in irrigation demands (6% to31% increase). Winter wheat irrigation needs decreased in the northern and western regions(27% to 74% decrease) and increased in the Southern Great Plains and Southeast (22% to75% increase). Corn irrigation demands strongly decreased west of the 104th meridian (40%to 75% decrease) and were otherwise only slightly changed. In all regions, the length of theoverall growing season increased. While these trends are in general agreement with theAgricultural Sector assessments, the variability estimates reported are consistently higher. Theauthors attribute at least part of this difference to the fact that the Agricultural Sector studiesdo not fully incorporate the soil-moisture variability implied by the Canadian climate scenario.Soil moisture is both spatially and temporally variable (Georgakakos and Smith 2000,Georgakakos and Yao 2000a) and has a significant influence on irrigation demands and cropyields. In this regard, the need for reliable soil-moisture measurements cannot beoverstated.
The same study also estimated that crop yields mostly increased (assuming that theirrigation demands are met), with notable exceptions for winter wheat in the southernregions, and corn in all areas except the extreme northern and northwestern areas.Variability in crop yields increased for almost all areas for peanuts, durum wheat,soybeans, and winter wheat, and it increased for corn in the southern areas.
Brumbelow and Georgakakos’ assessment of the agricultural impacts in the United Statesare in agreement with the Canadian climate scenario trends of a wetter climate in thewest, a dryer climate in the east, and warmer temperatures throughout the country.Depending on which particular factor is most limiting for crop growth over the growingseason (i.e., water availability, temperature, or both) the U.S. agricultural response exhibitsmarked regional changes in a west-to-east direction around the 104th meridian for corn, anorth-to-south direction around the 40th parallel for soybeans and durum wheat, and anorthwest-to-southeast direction for winter wheat. Figure 31 shows the climate divisionsgrouped into the regions under which results are reported. Figures 32a-32e present mapsof changes in mean irrigation requirements and changes in mean yields for the five cropsstudied.
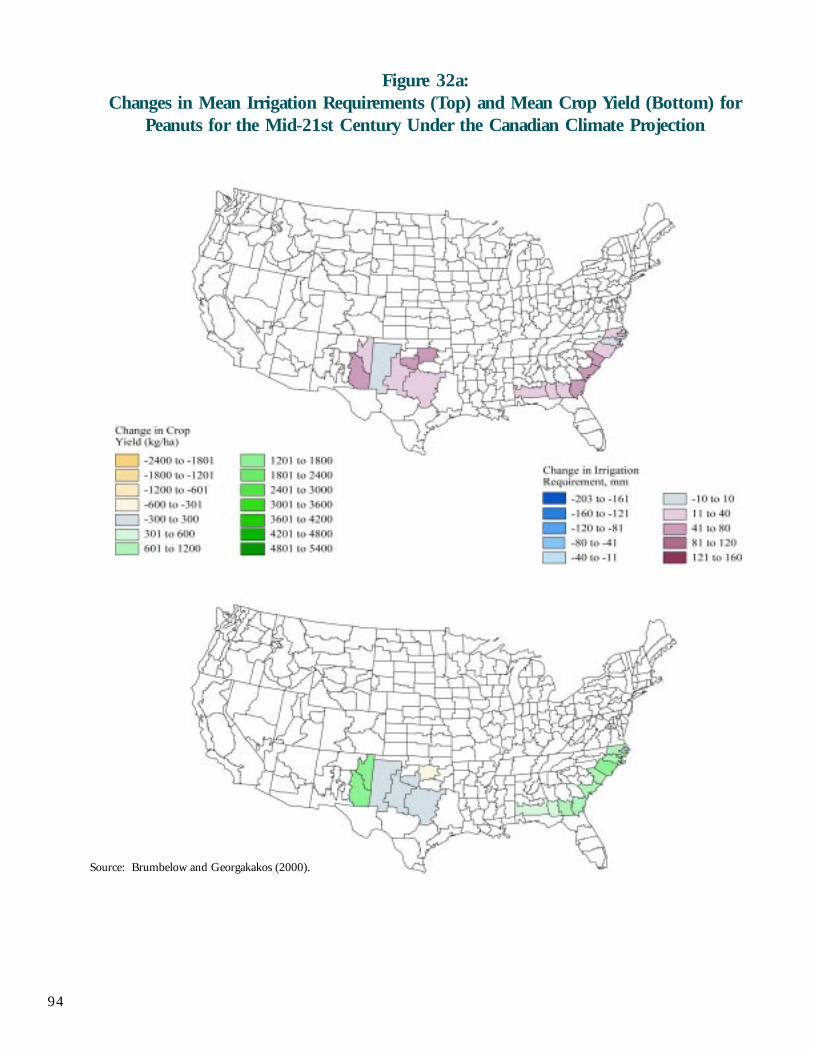
94
Source: Brumbelow and Georgakakos (2000).
Figure 32a:Changes in Mean Irrigation Requirements (Top) and Mean Crop Yield (Bottom) for
Peanuts for the Mid-21st Century Under the Canadian Climate Projection
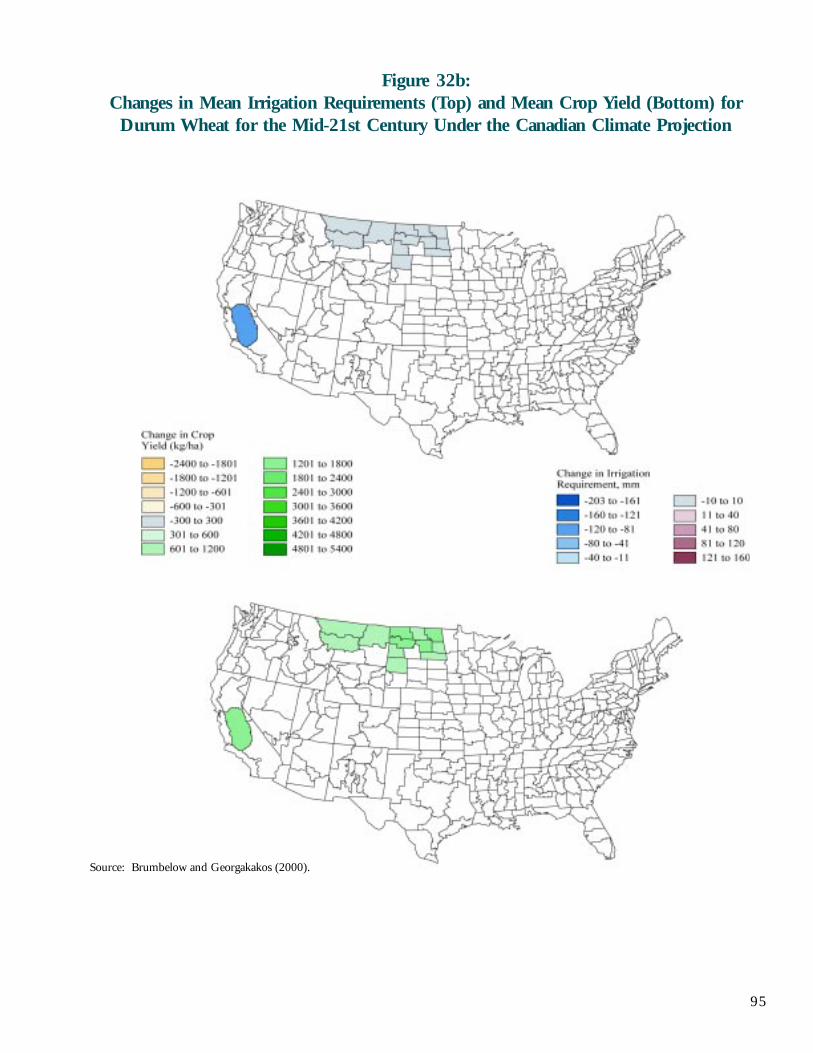
95
Figure 32b:Changes in Mean Irrigation Requirements (Top) and Mean Crop Yield (Bottom) for
Durum Wheat for the Mid-21st Century Under the Canadian Climate Projection
Source: Brumbelow and Georgakakos (2000).
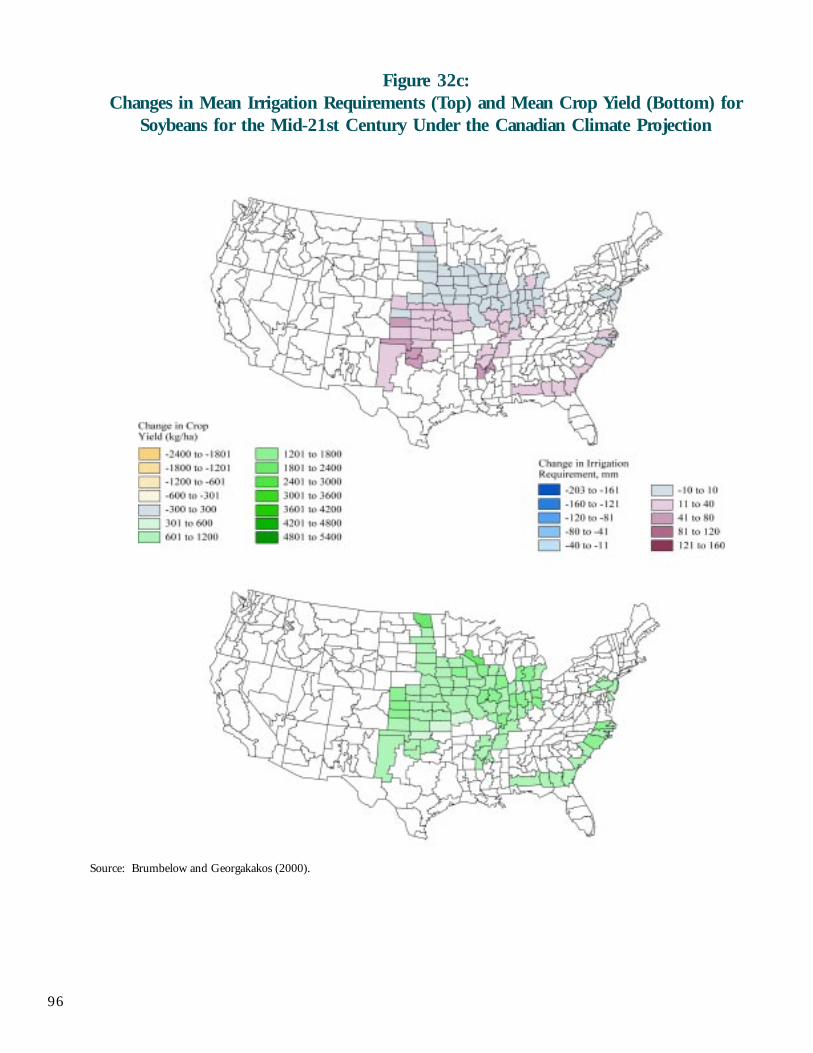
96
Figure 32c:Changes in Mean Irrigation Requirements (Top) and Mean Crop Yield (Bottom) for
Soybeans for the Mid-21st Century Under the Canadian Climate Projection
Source: Brumbelow and Georgakakos (2000).
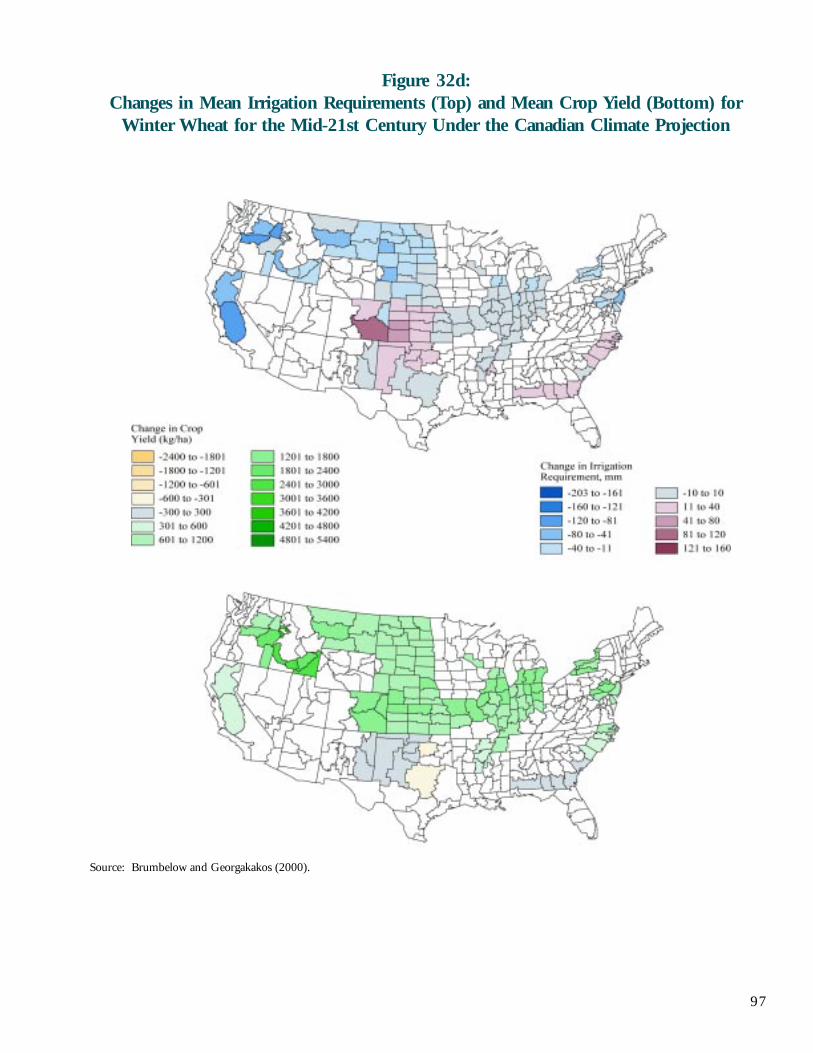
97
Figure 32d:Changes in Mean Irrigation Requirements (Top) and Mean Crop Yield (Bottom) for
Winter Wheat for the Mid-21st Century Under the Canadian Climate Projection
Source: Brumbelow and Georgakakos (2000).
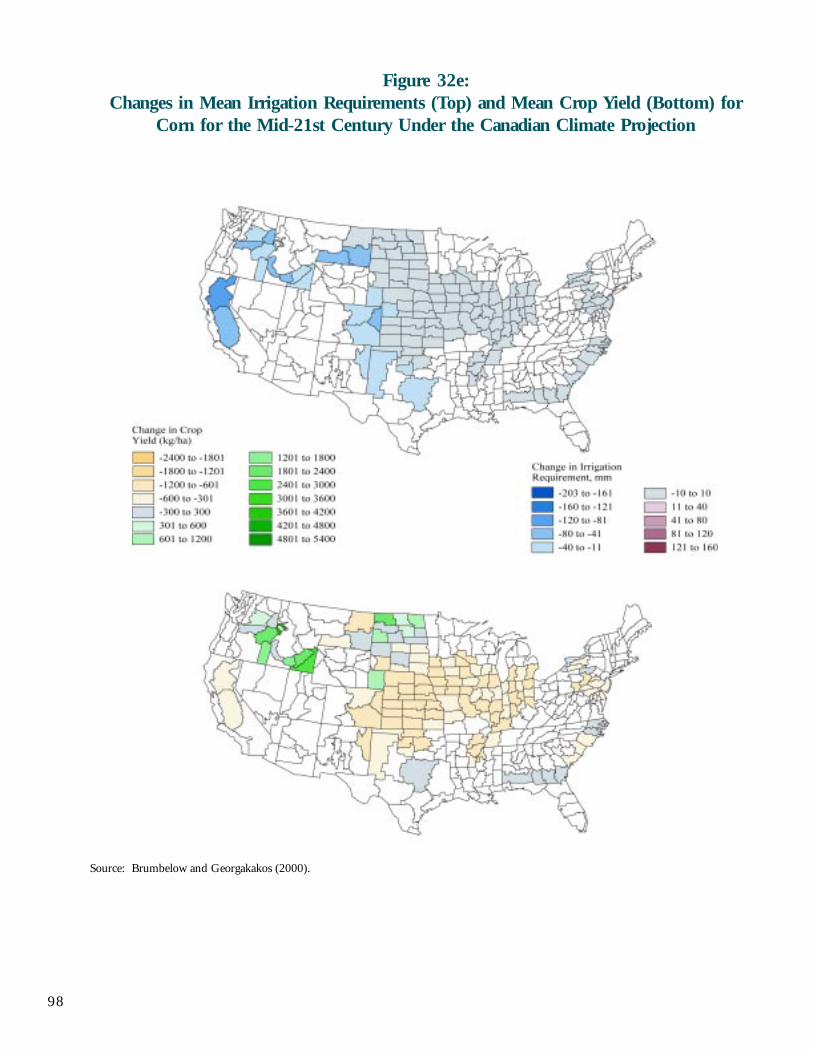
98
Figure 32e:Changes in Mean Irrigation Requirements (Top) and Mean Crop Yield (Bottom) for
Corn for the Mid-21st Century Under the Canadian Climate Projection
Source: Brumbelow and Georgakakos (2000).
99
Extreme Events
Much of the analysis of climate and water impacts looks at how changes in various meanswill affect water and water systems, such as mean temperatures, average precipitationpatterns, mean sea-level, and so on. While many factors of concern are affected by suchaverage conditions, some of the most important impacts will result, not from changes inaverages, but from changes in local extremes. Water managers and planners are especiallyinterested in extreme events and how they may change with climate change. Unfortunately,this is one of the least-well understood categories of impacts and we urge more effort bedevoted to studying it. Hydrological fluctuations impose various types of costs on society,including the costs of building and managing infrastructure to provide more even and reliableflows, and the economic and social costs of floods and droughts that occur in spite of theseinvestments. The United States has constructed more than 80,000 dams and reservoirs mostlyto control flood waters and increase available supplies during dry periods. Yet floods anddroughts continue to impose significant costs, and some of these costs have been rising overtime. Climate-induced changes in hydrological conditions will affect the magnitude, frequency,and costs of future extreme hydrological events.
In a worst case, some regions could be subjected to both increases in droughts andincreases in floods if climate becomes more variable. Even without increases in variability,both problems may occur in the same region. In the western United States, for example,where winter precipitation falls largely as snow, higher temperatures will increase the ratioof rain to snow (as described elsewhere), shifting peak runoff toward the period of timewhen flood risk is already highest. The actual magnitude of peak runoff could go up ordown, depending on the extent of the shift and what happens with overall precipitation(Hay et al. 2000). At the same time, summer and dry-season runoff will decrease becauseof a decline in snowpack and accelerated spring melting.
Floods
The area of floodplains in the United States has been estimated at about 160 million acresor seven percent of U.S. land (Schilling 1987). These lands are often close to recreationalopportunities, agricultural regions, and municipal and industrial developments, whichmakes them attractive for settlement. Federal and state efforts to control floods throughthe construction of dams, reservoirs, and levees have also led to floodplain development.Since the Flood Control Act of 1936 established flood control as a federal responsibility,the federal government has spent about $100 billion (1996 dollars) to construct, operate,and maintain flood-control structures (U.S. Army Corps of Engineers 1998). Thesefacilities include approximately 400 major lake and reservoir projects, over 8,500 miles oflevees and dikes, and hundreds of smaller local flood-protection projects. The U.S. ArmyCorps of Engineers estimates that these facilities have prevented nearly $500 billion inflood damages since 1950 (U.S. Army Corps of Engineers 1998).
Despite these expenditures, flooding remains the nation’s most costly and destructivenatural disaster and the cause, at least in part, of most federally declared disasterdeclarations. A change in flood risks is therefore one of the potential effects of climatechange with the greatest implications for human well-being. Few studies have lookedexplicitly at the implications of climate change for flood frequency, in large part because of
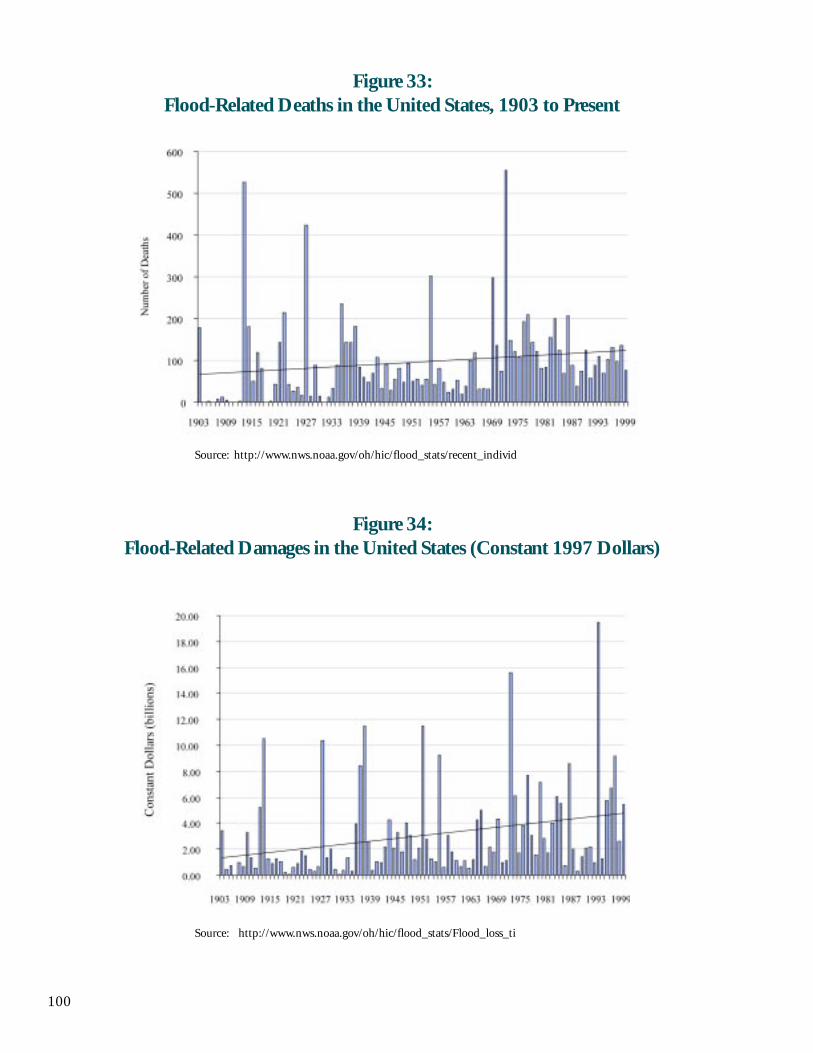
100
Figure 33:Flood-Related Deaths in the United States, 1903 to Present
Figure 34:Flood-Related Damages in the United States (Constant 1997 Dollars)
Source: http://www.nws.noaa.gov/oh/hic/flood_stats/Flood_loss_ti
Source: http://www.nws.noaa.gov/oh/hic/flood_stats/recent_individ
101
the difficulty of getting detailed regional precipitation information from climate modelsand because of the substantial influence of both human settlement patterns and water-management choices on overall flood risk.
Floods already cause extensive loss of life and damage to property, particularly hurricane-induced flooding. Flood damages, which vary widely from year to year, averaged $4billion and caused more than 100 deaths annually over the past 50 years (NationalWeather Service 1999, http://www.nws.noaa.gov/om/reachout/floods.htm). Dollardamages have increased about one percent per year and flood-related deaths rose one andone-half percent per year on average since 1945 (National Weather Service 1999, http://www.nws.noaa.gov/oh/hic/flood_stats/index.html). Figures 33 and 34 show estimatedflood deaths and damages in the United States since the early 1900s. These estimatesinclude only directly reported deaths and economic costs such as repairs to buildings,roads, and bridges attributable to flooding from rainfall and snowmelt. Excluded aredamages attributable to wind such as hurricane storm surges and indirect damages such as lostwages due to business closures or the social costs of temporarily evacuating homes for higherground.
In a particularly dramatic example of the costs of flooding, the 1993 floods in the upperMississippi and Missouri rivers resulted in economic damages estimated at between $12 billionand $16 billion. The Interagency Floodplain Management Review Committee (1994)established to determine the major causes and consequences of the flood concluded: “The floodof 1993 in the Midwest was a hydrometeorological event without precedent in modern times.In terms of precipitation amounts, record river levels, flood duration, area of flooding, andeconomic losses, it surpassed all previous floods in the United States.” The U.S. Army Corps ofEngineers, responsible for flood protection in the region, estimated that the damages wouldhave been $19 billion higher without the dams, reservoirs, and levees available to control floodwaters (Interagency Floodplain Management Review Committee 1994). These facilities alsocontributed indirectly to some of the damages that did occur by encouraging settlement anddevelopment in the floodplain. Floodplain development places more people and property atrisk and it reduces a basin’s capacity to naturally absorb flood flows.
Future flood damages will depend on many factors. Among the most important are the rateand style of development in the floodplains, the level and type of flood protection, and thenature of climate-induced changes in hydrological conditions, sea levels, and storm surges. Asnoted earlier, regional and local changes in hydrological conditions attributable to a greenhousewarming are uncertain but research to date suggests that there is a risk of increased flooding inparts of the United States that experience large increases in precipitation. The authors of thesecond IPCC impacts report (IPCC 1996b) concluded that: “the flood-related consequencesof climate change may be as serious and widely distributed as the adverse impacts ofdroughts” and “there is more evidence now that flooding is likely to become a largerproblem in many temperate regions, requiring adaptations not only to droughts andchronic water shortages, but also to floods and associated damages, raising concerns aboutdam and levee failure.”
A study was done on the Colorado River Basin looking explicitly at flood risks andprobabilities under conditions of climate change (Nash and Gleick 1991, 1993). Thisstudy looked at a series of climate change scenarios (including hypothetical scenarios andGCM equilibrium and transient scenarios). Using a basin-scale hydrologic model to
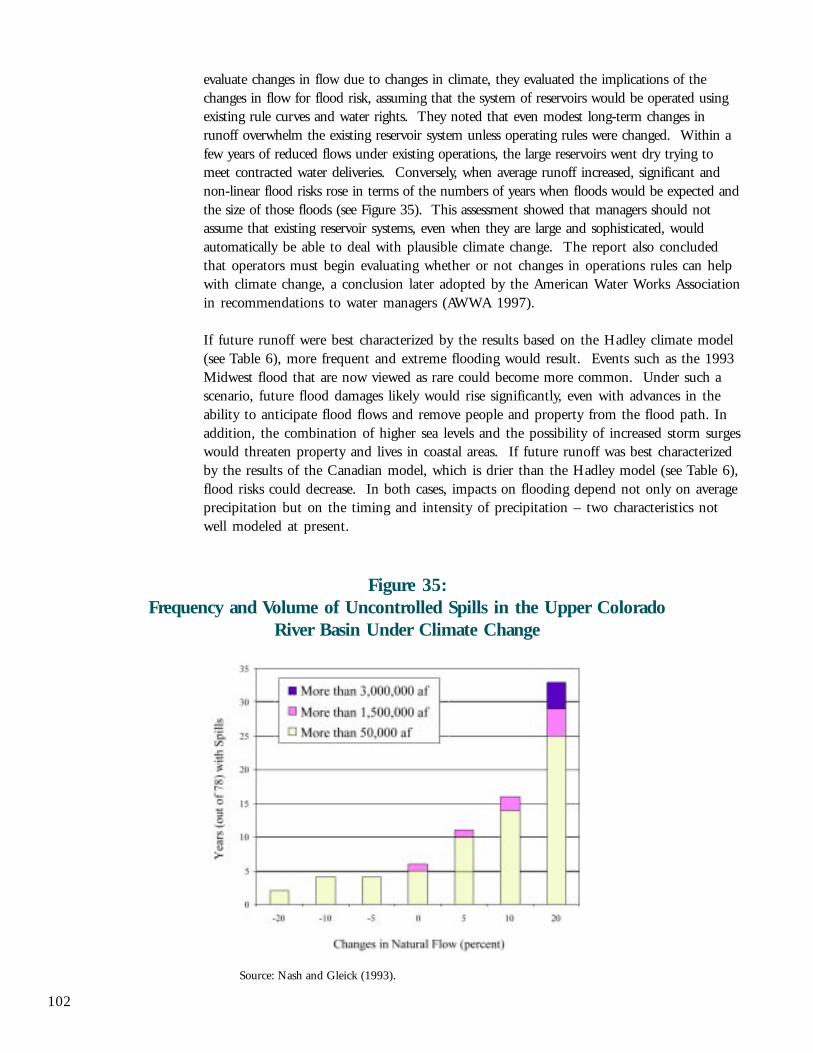
102
evaluate changes in flow due to changes in climate, they evaluated the implications of thechanges in flow for flood risk, assuming that the system of reservoirs would be operated usingexisting rule curves and water rights. They noted that even modest long-term changes inrunoff overwhelm the existing reservoir system unless operating rules were changed. Within afew years of reduced flows under existing operations, the large reservoirs went dry trying tomeet contracted water deliveries. Conversely, when average runoff increased, significant andnon-linear flood risks rose in terms of the numbers of years when floods would be expected andthe size of those floods (see Figure 35). This assessment showed that managers should notassume that existing reservoir systems, even when they are large and sophisticated, wouldautomatically be able to deal with plausible climate change. The report also concludedthat operators must begin evaluating whether or not changes in operations rules can helpwith climate change, a conclusion later adopted by the American Water Works Associationin recommendations to water managers (AWWA 1997).
If future runoff were best characterized by the results based on the Hadley climate model(see Table 6), more frequent and extreme flooding would result. Events such as the 1993Midwest flood that are now viewed as rare could become more common. Under such ascenario, future flood damages likely would rise significantly, even with advances in theability to anticipate flood flows and remove people and property from the flood path. Inaddition, the combination of higher sea levels and the possibility of increased storm surgeswould threaten property and lives in coastal areas. If future runoff was best characterizedby the results of the Canadian model, which is drier than the Hadley model (see Table 6),flood risks could decrease. In both cases, impacts on flooding depend not only on averageprecipitation but on the timing and intensity of precipitation – two characteristics notwell modeled at present.
Figure 35:Frequency and Volume of Uncontrolled Spills in the Upper Colorado
River Basin Under Climate Change
Source: Nash and Gleick (1993).
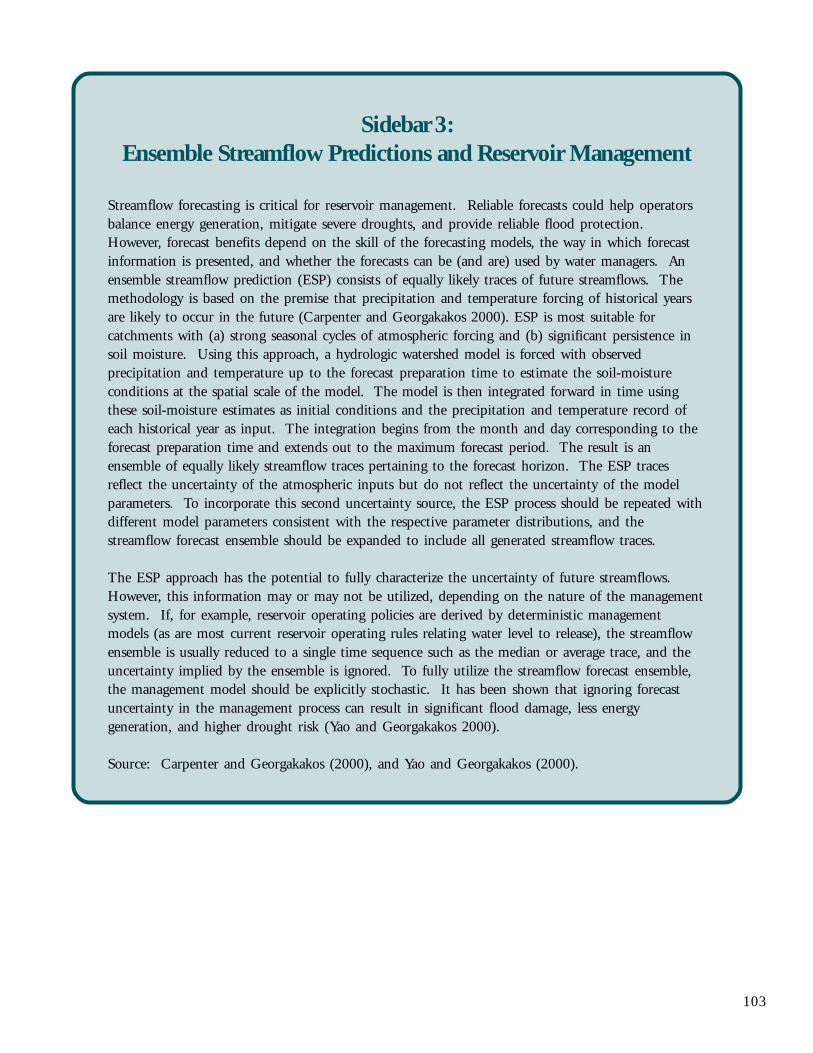
103
Sidebar 3:Ensemble Streamflow Predictions and Reservoir Management
Streamflow forecasting is critical for reservoir management. Reliable forecasts could help operatorsbalance energy generation, mitigate severe droughts, and provide reliable flood protection.However, forecast benefits depend on the skill of the forecasting models, the way in which forecastinformation is presented, and whether the forecasts can be (and are) used by water managers. Anensemble streamflow prediction (ESP) consists of equally likely traces of future streamflows. Themethodology is based on the premise that precipitation and temperature forcing of historical yearsare likely to occur in the future (Carpenter and Georgakakos 2000). ESP is most suitable forcatchments with (a) strong seasonal cycles of atmospheric forcing and (b) significant persistence insoil moisture. Using this approach, a hydrologic watershed model is forced with observedprecipitation and temperature up to the forecast preparation time to estimate the soil-moistureconditions at the spatial scale of the model. The model is then integrated forward in time usingthese soil-moisture estimates as initial conditions and the precipitation and temperature record ofeach historical year as input. The integration begins from the month and day corresponding to theforecast preparation time and extends out to the maximum forecast period. The result is anensemble of equally likely streamflow traces pertaining to the forecast horizon. The ESP tracesreflect the uncertainty of the atmospheric inputs but do not reflect the uncertainty of the modelparameters. To incorporate this second uncertainty source, the ESP process should be repeated withdifferent model parameters consistent with the respective parameter distributions, and thestreamflow forecast ensemble should be expanded to include all generated streamflow traces.
The ESP approach has the potential to fully characterize the uncertainty of future streamflows.However, this information may or may not be utilized, depending on the nature of the managementsystem. If, for example, reservoir operating policies are derived by deterministic managementmodels (as are most current reservoir operating rules relating water level to release), the streamflowensemble is usually reduced to a single time sequence such as the median or average trace, and theuncertainty implied by the ensemble is ignored. To fully utilize the streamflow forecast ensemble,the management model should be explicitly stochastic. It has been shown that ignoring forecastuncertainty in the management process can result in significant flood damage, less energygeneration, and higher drought risk (Yao and Georgakakos 2000).
Source: Carpenter and Georgakakos (2000), and Yao and Georgakakos (2000).
104
In Lettenmaier et al. (1999), flood risks increased for many of the climate changescenarios, at all of the sites except for the Columbia River basin. For the Savannah Riverand the Tacoma system, flood risks rose substantially. Carpenter and Georgakakos (2000)and Yao and Georgakakos (2000) investigated the response of Lake Folsom on theAmerican River in central California to potential climate and management scenarios.Folsom’s main water uses are flood control, energy generation, water supply, andmaintenance of low flows for environmental quality. The modeling approach used adecision-support system that included forecast uncertainty characterization, downscalingof GCM information, ensemble hydrologic forecasting, and dynamic reservoirmanagement in the presence of uncertainty. The assessment was based on two climatescenarios. In the first scenario, CO
2 was assumed constant, equal to its present
atmospheric concentration level. In the second scenario, based on the Canadian climatemodel, CO
2 was assumed to increase by one percent per year.
The Canadian GCM suggests that central California will experience wetter and morevariable climate under a CO
2 increase. These climate changes cause Folsom’s annual
energy generation and revenues (based on present energy prices) to increase by around$15 million (an increase of 24%), spillage (defined as water released above turbinecapacity) to increase by 80%, and potential flood damage to increase by $219 million(using present damage cost curves). Furthermore, the study clearly demonstrates thatcharacterizing forecast uncertainty and using it to develop adaptive management policiescan drastically improve system response from disastrous to desirable. Sidebar 3 describesthe approach of using ensemble streamflow projections for reservoir management. ForLake Folsom, using a median deterministic forecast sequence (rather than the full forecastensemble) under the Canadian one percent CO
2 increase scenario would cause flood
damage on the order of $4.3 billion, 20 times higher than that of the full forecastensemble ($219 million). By contrast, an improved forecast ensemble would reduce flooddamage to $26 million, a 10-fold decrease. Energy generation is not adversely affected bythe added flood protection, but it actually increases, as indicated by the results of Table14. To establish an upper performance bound, a run was also conducted with “perfect”streamflow forecasts. In this case, flood damages can be completely eliminated, energygeneration attains a maximum value, and spillage is minimized. These findings show thatclimate change impacts could be mitigated by changes in the way systems are modeled,managed, and operated. Under a changing climate, traditional operating rules becomeineffective, while adaptive forecast-control management schemes can provide reliablecoping strategies. This assessment also clearly corroborates the value of improved shortterm and seasonal projections.
Droughts
Water managers must also be concerned about the risks of droughts. Drought in the 19thcentury and again in the 1930s led to large-scale migrations and much social hardship,and extended droughts can still result in substantial adverse economic and social impacts.Droughts vary in their spatial and temporal dimensions and are highly dependent on localmanagement conditions and the perceptions of local water users. No single definition ofdrought applies in all circumstances; thus, determining changes in drought frequency orintensity that might be expected to result from climate changes is complicated. Most paststudies have focused on evaluating changes in low-flow conditions and probabilities.
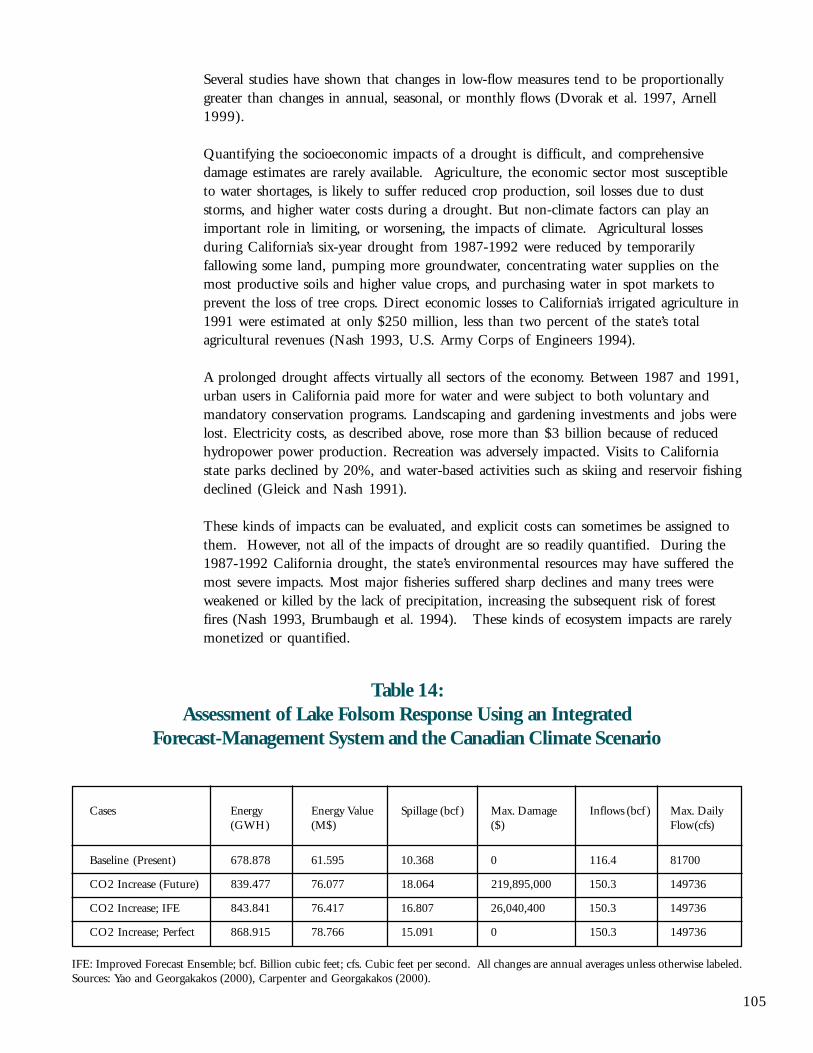
105
Several studies have shown that changes in low-flow measures tend to be proportionallygreater than changes in annual, seasonal, or monthly flows (Dvorak et al. 1997, Arnell1999).
Quantifying the socioeconomic impacts of a drought is difficult, and comprehensivedamage estimates are rarely available. Agriculture, the economic sector most susceptibleto water shortages, is likely to suffer reduced crop production, soil losses due to duststorms, and higher water costs during a drought. But non-climate factors can play animportant role in limiting, or worsening, the impacts of climate. Agricultural lossesduring California’s six-year drought from 1987-1992 were reduced by temporarilyfallowing some land, pumping more groundwater, concentrating water supplies on themost productive soils and higher value crops, and purchasing water in spot markets toprevent the loss of tree crops. Direct economic losses to California’s irrigated agriculture in1991 were estimated at only $250 million, less than two percent of the state’s totalagricultural revenues (Nash 1993, U.S. Army Corps of Engineers 1994).
A prolonged drought affects virtually all sectors of the economy. Between 1987 and 1991,urban users in California paid more for water and were subject to both voluntary andmandatory conservation programs. Landscaping and gardening investments and jobs werelost. Electricity costs, as described above, rose more than $3 billion because of reducedhydropower power production. Recreation was adversely impacted. Visits to Californiastate parks declined by 20%, and water-based activities such as skiing and reservoir fishingdeclined (Gleick and Nash 1991).
These kinds of impacts can be evaluated, and explicit costs can sometimes be assigned tothem. However, not all of the impacts of drought are so readily quantified. During the1987-1992 California drought, the state’s environmental resources may have suffered themost severe impacts. Most major fisheries suffered sharp declines and many trees wereweakened or killed by the lack of precipitation, increasing the subsequent risk of forestfires (Nash 1993, Brumbaugh et al. 1994). These kinds of ecosystem impacts are rarelymonetized or quantified.
Table 14:Assessment of Lake Folsom Response Using an Integrated
Forecast-Management System and the Canadian Climate Scenario
Cases Energy Energy Value Spillage (bcf ) Max. Damage Inflows (bcf ) Max. Daily(GWH) (M$) ($) Flow(cfs)
Baseline (Present) 678.878 61.595 10.368 0 116.4 81700
CO2 Increase (Future) 839.477 76.077 18.064 219,895,000 150.3 149736
CO2 Increase; IFE 843.841 76.417 16.807 26,040,400 150.3 149736
CO2 Increase; Perfect 868.915 78.766 15.091 0 150.3 149736
IFE: Improved Forecast Ensemble; bcf. Billion cubic feet; cfs. Cubic feet per second. All changes are annual averages unless otherwise labeled.Sources: Yao and Georgakakos (2000), Carpenter and Georgakakos (2000).
106
The net national economic costs of a drought are likely to be less than the costs sufferedwithin the drought-affected area because some groups benefit from the hardships ofothers. For example, drought-induced agricultural losses increase the prices farmersunaffected by the drought receive for their crops and a decline in hydropower productionincreases the demand and price for alternative sources of energy. Including incometransfers reduces the costs of drought as the scale of the impact assessment increases. Thus,drought events that are costly at the local level may be lessened at the regional level andnegligible at the national levels. For example, analysis of the agricultural impacts ofCalifornia’s drought concluded that in 1991 the national economic costs were less than30% of the state impacts (U.S. Army Corps of Engineers 1991, 1995, Brumbaugh et al.1994, Frederick and Gleick 1999).
107
Socioeconomic Costs and Benefits of Changes inWater Supply and Demand
All of the physical and ecological impacts of climate change will entail social and economiccosts and benefits. On top of the uncertainties described above in evaluating both climatechanges and potential impacts, evaluating the economic implications of the diverseimpacts is fraught with difficulties, and few efforts to quantify them have been made.Ultimately, however, comprehensive efforts to evaluate costs will be necessary in order tohelp policymakers and the public understand the implications of both taking and nottaking actions to either reduce the impacts of climate change or adapt to the changes thatare unavoidable.
Several steps are needed to evaluate socioeconomic effects of climate change. First,estimates of the nature and magnitude of the impacts of climate change are necessary.Second, these impacts need to be put into common units, typically monetary, with acomprehensive discussion of the limitations of doing so. Among these limitations is thefact that many impacts may never be quantifiable in economic terms. Third, the costs oftaking various actions must be evaluated, together with the effects of options to reduceexpected impacts.
The socioeconomic impacts of a greenhouse warming look very different depending onwhich projections are used and on the methods and assumptions adopted by theresearchers. The results published to date are a valuable guide for future assessments butpolicymakers should have low confidence in specific quantitative estimates. Someresearchers have argued that the effects of climate change on municipal and industrial water usewill generally be small compared with the expected rates of growth of water use, but in theUnited States new research is beginning to suggest the opposite may be true – that the impactsof climate change could exceed, sometimes significantly, impacts due to population growth andeconomic changes in some sectors and for some kinds of impacts (see, for example, Frederickand Schwarz 1999). While climate impacts on water use could be large in some areas, researchto date indicates that climate-induced changes in demands would mostly be modest comparedto changes in water supplies. Some water-scarce regions could benefit from increasedprecipitation and runoff while others are forced to adjust to less water. Water abundant areasmight suffer from further increases in runoff but benefit from reductions.
The costs of water supply and protection from floods and droughts have been rising for muchof this century and they are likely to continue rising even in the absence of climate change.Future water costs will depend on the costs of developing new supplies, implementingconservation options, foregoing desired water uses, meeting water quality standards, andprotecting natural aquatic ecosystems. Additional factors likely to contribute to higher futurecosts of water are the threats to existing supplies posed by contamination and groundwaterdepletion. Although billions of dollars have been spent in recent decades to improve waterquality, 36% of the nation’s surveyed rivers and streams and 39% of the surveyed lakes,reservoirs, and ponds are still impaired for one or more of their designated uses (USEPA 1996,see also http://www.epa.gov/iwi/national/index.html). Non-point source pollutants, such as
108
agricultural chemicals applied to farmland and runoff from urban areas, are now the principalsources of surface water contamination, and effective means of curbing these pollutants have yetto be developed. Threats to water quality are also continuing to come from underground tankscontaining hazardous substances, old mines, landfills, abandoned waste sites, and oil and gasbrine pits.
Few studies have attempted to evaluate the economic consequences of the impacts of climatechange on U.S. water resources. Most of these studies are “back of the envelope” computationsthat make relatively simple assumptions about both climate change and consequences foroverall water systems. As a result, policymakers should have little confidence in specific results,some of which are described here. Cline (1992) assumed that climate change would cause a10% decrease in water availability across the country. Assuming average values for water indifferent sectors, he estimated that this simple impact would cause economic damages ofapproximately $7 billion annually, ignoring ecological impacts, effects on water quality, floodrisks, and many other factors. Titus (1992) estimated changes in water supply and demand foreach state under simple climate change scenarios and concluded that annual damages to waterresources in the nation would be between $21 and $60 billion, with the majority of costsresulting from increased costs of controlling water pollution. Neither of these studies includedeconomic models that integrate water supply and demand functions, producer or consumersurplus, or constraints on water systems.
Hurd et al. (1998) integrated climate scenarios, simple hydrologic models, and an economicmodel that allocates water to different activities to maximize economic welfare, one relativelynarrow measure of overall well-being. While actual water-supply systems rarely attempt tomaximize economic welfare, this approach offers a more detailed insight into possible economicimpacts than earlier general assessments. The study assessed possible economic costs andbenefits from climate change for four major water regions and for the nation as a whole,focusing on five aspects of water: water quality, lost hydropower, flooding, navigation, andwater supply. The results varied depending on region and the nature of the climate change.For the Colorado River basin, welfare declines by $102 million annually for the “central case”of a 2.5o C warming and a seven percent drop in precipitation; for the Missouri basin, welfaredeclines by $519 million; for the Delaware basin, welfare falls by only $22 million; and for theApalachicola, Flint, Chattahoochee (AFC) basin total damages for the central case are $15million. For the national analysis, welfare losses associated with the central case are estimatedto be $9.4 billion annually. Of this amount, over $5 billion are associated with water-qualitydamages and $2.8 billion with hydroelectric losses (Hurd et al. 1998). If average temperaturesrise 5o C with no change in average precipitation, national welfare losses are projected to rise to$43 billion annually. Most of the economic losses are imposed on nonconsumptive water userssuch as hydropower rather than consumptive water users such as irrigators. Furthermore,most of the impacts will be in the western part of the United States. The authors note theuncertainties and assumptions in their analysis and call for further improvements andefforts in this area. In particular, the methods of putting dollar values on flood damages,ecological damages, and all of the “costs” of water scarcity are poorly developed.
Another study recently found the potential for much more severe economic costs for theUnited States. Frederick and Schwarz (1999) evaluated the impacts of the Canadian andHadley climate models, described earlier, on water scarcity in the nation’s water resourceregions. Unlike previous studies, they also attempted to evaluate how population andeconomic changes would affect U.S. water resources in the absence of climate change.
109
They also evaluated the socioeconomic impacts of the changes in water scarcity underalternative water-management scenarios, where “scarcity” was defined as the adequacy ofwater supplies to meet consumptive use plus “desired” or “critical” instream uses on asustainable basis. Desired instream use is defined as the flow required to maintain fishand wildlife populations estimated for the Second National Water Assessment (USWRC1978). Critical instream use is defined as 50% of desired flow.
Water-scarcity indices were developed for the 1995 historical baseline and for the year2030 both with and without climate change. Under current conditions, average annualrenewable water supplies already fail to meet estimated desired use (the sum ofconsumptive use and desired instream flow) in the Rio Grande, Lower Colorado, andGreat Basin regions. Mean renewable supplies in the Lower Colorado do not even meetthe much lower flows needed to provide critical instream use. Dry condition renewablesupplies (flows exceeded 80% of the time) fall short of critical needs in these three basinsand in the Texas-Gulf region.
The 2030 scenario without climate change assumes renewable supplies and desiredinstream use are unchanged from the 1995 baseline. Consumptive use is projected toincrease about eight percent by 2030 based on projections by Brown (1999). Thisincrease in consumptive use, which is substantially smaller than the projected increases inpopulation and economic growth, anticipates improvements in water-use efficiency as wellas a shift in irrigation from the western to eastern United States. These assumptions leadto a modest increase in water scarcity in the absence of climate change. Frederick andSchwarz (1999) estimate the annual costs of the changes in water use between 1995 and2030 without climate change to be just under $14 billion. This figure is based on thecosts of the changes in water withdrawals, development of new supplies, conservation,reductions in irrigation, and instream flows implied in Brown’s (1999) projections ofwater use. The costs are based on estimates of the current costs of developing supplies foroffstream use and conservation opportunities, with allowance for future technological andmanagerial advances and changes in energy prices.
The economic impacts of different scenarios of climate-induced changes in water suppliesare calculated as the changes in the annual costs of maintaining the projected no-climatechange, non-irrigation offstream water uses with the climate-altered supplies. Scenarioswere developed using both the Hadley and Canadian climate models, and the authorsnote that different climate models would lead to different results. The options formaintaining offstream water uses include (a) removing land from irrigation, (b) investingin water conservation, (c) developing new supplies, and (d) changing instream flows. Thebenefits and costs of the climate-induced changes in water supplies are estimated underthree alternative management scenarios that differ in the level of protection provided forinstream flows and irrigation.
The increased annual costs for the conterminous United States attributable to the sharpdecline in water supplies implied by the drier Canadian climate model range from $105billion under the “efficient” management scenario to $251 billion under the scenario thatprovides the greatest protection for instream flows. “Efficient” management permitsstreamflows to fall to critical levels for ecosystems. Most of the damages occur in theSouth Atlantic-Gulf, Lower Mississippi, and Texas-Gulf regions. In contrast to the costincreases estimated with the Canadian climate scenarios, the increases in water supplies
110
under the wetter Hadley climate scenarios reduce annual water costs by nearly $5 billionrelative to the no-climate-change case. The benefits are attributed to the projectedincrease in instream flows (Frederick and Schwarz 1999). The analysis does not considerflooding costs or the benefits of reduced flooding. In the case of the Hadley scenario,increases in water supplies could be accompanied by increases in damaging floods; for theCanadian scenarios, flood risks could drop. Nijssen et al. (2000) note that the Frederickand Schwartz damages, which used annual runoff changes, could be underestimated inregions where seasonal changes in runoff are important, such as the Pacific Northwest.
The results of the Frederick and Schwarz analysis support several general conclusions.First, given the uncertainties in future climate projections, the range of plausible outcomesis very wide, but a greenhouse warming could have major impacts on the costs ofbalancing future water supplies and demands. Under some scenarios, the additional costsimposed by climate change are extremely large: ten to twenty times larger than theadditional costs imposed by future population growth, industrial changes, and changingagricultural water demands. Indeed, the upper end of the changes described above is onthe order of 0.5 percent of the nation’s total gross domestic product. Second, thecontrasting hydrologic implications of the two climate models used indicate themagnitudes as well as the direction of these impacts are uncertain and likely to varyamong water resources regions. Third, there are many opportunities to adapt to changinghydrologic conditions, and the net costs are particularly sensitive to the institutions thatdetermine how the resource is managed and allocated among users. Far more effort isrequired to expand upon this kind of analysis, to reduce uncertainties, and to incorporatethe kinds of economic costs and benefits these studies were not able to include.
111
Coping and Adaptation
Climate change is just one of a number of factors putting pressure on the hydrologicalsystem and water resources of the United States. Population growth, changes in land use,restructuring of the industrial sector, and demands for ecosystem protection andrestoration are all occurring simultaneously. Current laws and policies affecting water use,management, and development are often contradictory, inefficient, or unresponsive tochanging conditions. In the absence of explicit efforts to address these issues, the societalcosts of water problems are likely to rise as competition for water grows and supply anddemand conditions change.
There are many opportunities for reducing the risks of climate variability and change forU.S. water resources. We note the applicability here of the precautionary approach takenin many international agreements, including the United Nations Framework Conventionon Climate Change:
“Parties should take precautionary measures to anticipate, prevent orminimize the causes of climate change and mitigate its adverse effects.Where there are threats of serious or irreversible damage, lack of fullscientific certainty should not be used as a reason for postponing suchmeasures, taking into account that policies and measures … should becost-effective so as to ensure global benefits at the lowest possible cost”(UNFCCC 1992).
The nation’s water systems are highly developed and water managers have a long history ofadapting to changes in supply and demand. Their efforts have largely focused onminimizing the risks of natural variability and maximizing system reliability. Many of theapproaches for effectively dealing with climate change are little different than theapproaches already available to manage risks associated with existing variability. Tools forreducing these risks have traditionally included supply-side options such as new dams,reservoirs, and pipelines, and more recently, demand-management options, such asimproving efficiency, modifying demand, altering water-use processes, and changing land-use patterns in floodplains. This work is going on largely independently of the issue ofclimate change, but it will have important implications for the ultimate severity of climateimpacts. Among the new tools water agencies and managers are exploring are (1)incentives for conserving and protecting supplies, (2) opportunities for transferring wateramong competing uses in response to changing supply and demand conditions, (3)economic changes in how water is managed within and among basins, (4) evaluating how“re-operating” existing infrastructure can help address possible changes, and (5) newtechnology to reduce the intensity of water use to meet specific goals.
The lessons from existing efforts need to be evaluated in order to understand how theymight mitigate (or worsen) the impacts of climate change. During the 20th century dams,reservoirs, and other water infrastructure were designed with a focus on extreme eventssuch as the critical drought periods or the probable maximum flood. This approach
112
provided a cushion to deal with uncertainties such as climate change (Matalas and Fiering1977). In recent years, however, the high costs and environmental concerns that nowmake it difficult to get a new project approved also make it possible that the projects thatare undertaken will have less redundancy built into their water supply and controlfacilities than the projects built earlier (Frederick 1991).
Few studies have evaluated how to integrate climate change into regional or localplanning, how water-system managers view climate change, or how to best bring waterplanners, designers, and system managers into the discussion about future climate change(see, for example, Waggoner 1990, AWWA 1997, O’Conner et al. 1999). Even fewerefforts to take pro-active measures have been initiated. In part this reflects a split inopinion among water analysts and policymakers. Some believe that water managersalready have the tools necessary to deal with plausible climate change. Schilling andStakhiv (1998), for example, comment on the apparent lack of concern or awareness of theissue of climate change among water managers and operators and argue that the keyresponse of water managers to climate change should be virtually the same as that toexisting climate variability: to upgrade and intensify introduction of innovative and costeffective supply-side and demand-side management measures and to create institutionsthat are flexible in adapting to both social and environmental changes (see also Stakhivand Schilling 1998). They note that the apparent indifference of water professionalsshould not be interpreted to mean that they are oblivious to the potentially seriousconsequences of climate change. Rather it may stem from their belief that the approachesfor effectively dealing with climate change are little different than the approaches alreadyavailable to manage existing variability.
Others believe that this approach ignores some critical concerns: first, climate changecould produce hydrologic conditions and extremes of a different nature than currentsystems were designed to manage; second, it may produce similar kinds of variability butoutside of the range for which current infrastructure was designed; third, it assumes thatsufficient time and information will be available before the onset of large or irreversibleclimate impacts to permit managers to respond appropriately; fourth, it assumes that nospecial efforts or plans are required to protect against surprises or uncertainties. The firstsituation could require that completely new approaches or technologies be developed.The second could require that efforts above and beyond those currently planned oranticipated be taken early. Moreover, complacency on the part of water managers maylead to the failure to anticipate impacts that could be mitigated or prevented by actionstaken now. Schilling and Stakhiv (1998) and Stakhiv and Schilling (1998) urge the activesolicitation of the views of the water-management community and point to exampleswhere water agencies, river commissions, or utilities have begun to act on the kinds ofrecommendations noted above.
Another major complication exists: some major river basins in the United States are soheavily developed, with such complicated overlapping management layers, that theirability to adapt to changes in climate may be compromised. In a detailed analysis of theColumbia River Basin, for example, Miles et al. (2000) concluded that it is alreadyimpossible to meet all current water-resources objectives and that current institutionalarrangements in the Basin preclude an organized and comprehensive managementresponse. When they imposed climate change on the Basin, decreased spring and summerstreamflows led to rapid decreases in the reliability of meeting some system objectives,
113
including irrigation water supply and fishery protection target flows. Coupled withinefficient allocations resulting from western water law, the authors concluded thatrecreation, instream flow targets, agricultural diversions in the middle Snake River, andnon-firm energy targets are all vulnerable to climate variability because of the lack ofadaptability to low flows in the system.
Some options for coping or adapting to climate change impacts on U.S. water resourcesare described below. This section should be regularly revisited and expanded in laterassessments.
Water Planning and Management
Decisions about long-term water planning, the design and construction of new water-supply infrastructure, the type and acreage of crops to be grown, urban water allocationsand rate structures, reservoir operation, and water-supply management all depend onclimate conditions and what humans do to respond and adapt to those conditions. In thepast, these decisions relied on the assumption that future climate conditions would havethe same characteristics and variability as past conditions, and U.S. water-supply systemswere designed with this assumption in mind. Dams are sized and built using availableinformation on existing flows in rivers and the size and frequency of expected floods anddroughts. Reservoirs are operated for multiple purposes using the past hydrologic recordto guide decisions. Irrigation systems are designed using historical information ontemperature, water availability, and soil water requirements.
This reliance on the past record now may lead us to make incorrect – and potentiallydangerous or expensive – decisions. Given that risk, one of the most important copingstrategies must be to try to understand what the consequences of climate change will befor water resources and to begin planning for those changes. The academic communityhas advocated this position for a decade. An earlier two-year study by the Climate andWater Panel of the American Association for the Advancement of Science on theimplications of global climate change for the water resources of the United States(Waggoner 1990) concluded:
“Among the climatic changes that governments and other public bodiesare likely to encounter are rising temperatures, increasingevapotranspiration, earlier melting of snowpacks, new seasonal cycles ofrunoff, altered frequency of extreme events, and rising sealevel...Governments at all levels should reevaluate legal, technical, andeconomic procedures for managing water resources in the light of climatechanges that are highly likely.” [Italics in original.]
The Second World Climate Conference concluded in 1991 that:
“The design of many costly structures to store and convey water, fromlarge dams to small drainage facilities, is based on analyses of past recordsof climatic and hydrologic parameters. Some of these structures aredesigned to last 50 to 100 years or even longer. Records of past climate andhydrological conditions may no longer be a reliable guide to the future. The
114
design and management of both structural and non-structural water resourcesystems should allow for the possible effects of climate change.” (Italics added)(Jager and Ferguson 1991.)
Similarly, the IPCC (1996c) urged water managers to begin “a systematic reexamination ofengineering design criteria, operating rules, contingency plans, and water allocationpolicies” and states with “high confidence” that “water demand management andinstitutional adaptation are the primary components for increasing system flexibility tomeet uncertainties of climate change.” This emphasis on planning and demandmanagement rather than construction of new facilities marks a change in traditional water-management approaches, which in the past have relied on the construction of large andexpensive infrastructure.
In 1997, the American Water Works Association, the largest professional association ofwater utilities and providers in the United States, published a set of recommendationsfrom its Public Advisory Forum (AWWA 1997). Among the recommendations to watermanagers were the following:
• While water management systems are often flexible, adaptation to new hydrologicconditions may come at substantial economic costs. Water agencies should begin nowto re-examine engineering design assumptions, operating rules, system optimization,and contingency planning for existing and planned water-management systems undera wider range of climate conditions than traditionally used.
• Water agencies and providers should explore the vulnerability of both structural andnon-structural water systems to plausible future climate change, not just past climatevariability.
• Governments at all levels should re-evaluate legal, technical, and economic approachesfor managing water resources in the light of possible climate change.
• Cooperation of water agencies with the leading scientific organizations can facilitatethe exchange of information on the state-of-the-art thinking about climate change andimpacts on water resources.
• The timely flow of information from the scientific global change community to thepublic and the water-management community would be valuable. Such lines ofcommunication need to be developed and expanded.
One of the main implications of climate change for water management is a shift towardimproved decision-making under uncertainty and flexible management approaches.
Modifying Operation of Existing Systems
Many portions of the country have extensive and complex water supply and managementsystems, consisting of an intricate web of imported and local supplies, dams, reservoirs,aqueducts, pipelines, water treatment facilities, wastewater plants, and hydropower
115
stations. Balancing water supply and demand while maintaining ecosystem health, evenin the absence of climate change, is a daunting task. These systems must play a leadingrole in adapting to, and coping with any future climate change just as they now play aleading role in mitigating the impacts of existing climate variability.
There are two critical issues associated with using existing facilities to address futureclimate change: can they handle the kinds of changes that will occur; and at whateconomic and ecological cost? There have been few detailed analysis of either of thesequestions, in part because of the large remaining uncertainties about how the climate mayactually change. Another issue that must be addressed is how to involve the publicadequately in decisions about water supply and distribution. While the principle of localpublic participation is often espoused, even at the international water policy level, it israrely successfully implemented. Without precise information on the characteristics offuture climate, the best that water managers can hope to do may be to explore thesensitivity of their system to a wider-range of conditions than currently experienced and todevelop methods or technologies that can improve operational water management. Thiskind of approach was first recommended by the Climate and Water Panel of the AmericanAssociation for the Advancement of Science in the late 1980s. That panel, chaired byRoger Revelle and Paul Waggoner, recommended:
During planning, managers should be alert for economical measures toincrease flexibility and accommodate climatic variability, sea-level rise, andas we learn more about it, climatic change. They should exploitopportunities to retain or increase flexibility of systems, especially sincesuch measures may be fairly inexpensive if put in an original design(Waggoner 1990, p. 5).
Georgakakos et al. (1998) explored the use of flexible reservoir management strategies topermit managers to reduce the uncertainties associated with climate variability. In a testof this approach, current reservoir practices for the Saylorville Reservoir in the upper DesMoines river basin were shown to be inadequate for accommodating historical variability,while alternative methods mitigated adverse effects of climate variability. This approach isalso applicable for changes in conditions caused by the greenhouse effect.
Major (1998) also looked at how water systems might be managed under conditions of climatechange. Among the techniques he discusses are how to integrate multiple systems to provideflexibility for changing conditions; the value of reallocating storage under new conditions; andthe applicability of non-structural measures such as land-use planning, flood and stormwarnings, and water pricing. In a study of how effective current operating rules are foraddressing possible climate changes, Hotchkiss et al. (2000) evaluated the operation of six maindams on the Missouri River and concluded that if basin precipitation were to increase only10%, the operating rules for the reservoirs will require modification to increase release rates.Miles et al. (2000) did an comprehensive assessment of the impacts of climate variability andchange for the Columbia River Basin and concluded that the adaptability of the basin to thethreat of floods is high, but that there is also high vulnerability to likely changes inseasonality of streamflow and reductions in spring and summer flows.
The work of Lettenmaier et al. (1999) and Georgakakos and Yao (2000a,b) reinforce theconclusion that effective operation of complex systems can reduce impacts of climate
116
change, but only if implemented in a timely and dynamic manner. Lettenmaier et al.(1999) addressed this question of response to climate change for a series of water systemsaround the United States. They noted that reservoir systems buffer modest hydrologicchanges through operational adaptations. As a result, the effects of climate change on thesystems they studied tend to be smaller than the underlying changes in hydrologicvariables. They concluded that significant changes in design or scale of water managementsystems might not be warranted to accommodate climate change alone, although thisobviously depends on the ultimate size of the changes. They urged a concerted effort toadjust current operating rules or demand patterns to better balance the existing allocatedpurposes of reservoirs, which requires planning and participation by water managers.
O’Conner et al. (1999) examined the sensitivity and vulnerability of community water systemsto climate change by surveying 506 managers. Water-system managers do not dismiss theissue of climate change, but they have been reluctant to consider it in their planning horizonsuntil they perceive a greater degree of scientific certainty about regional impacts. Interestingly,most managers admit that they expect disruptions in daily operations caused by changes inclimate variability. Experienced and full-time water managers were more likely to considerfuture climate scenarios in planning than inexperienced or part-time managers. O’Conner et al(1999) offered some conclusions and discussion of policy implications of their survey:
• Moving away from exclusive reliance on surface water by integrating surface andgroundwater management reduced vulnerability to climate fluctuations;
• Continued efforts to improve research and to communicate the risk of climate change towater managers, especially at the local level, will be useful; and
• Local governments should consider creating more full-time water manager positions toattract top professionals capable of considering long-term issues and concerns in planning.
Chao et al. (1999) explored ways of managing the water level of Lake Erie under conditionsof climate uncertainty in two workshops with managers, scientists, and water planners.Four different methods of including the issue of climate were explored and the authorsconcluded that large-scale modeling could help managers improve their understanding ofhow any particular system might be affected in the future and what management optionsmight be appropriate to evaluate or consider. They also found that scenario analysis wasuseful for addressing climate change by permitting managers to explore unanticipatedoutcomes. Public planning sessions were found to be useful for eliciting ideas andopinions. They also recommended that more work be conducted to improve GCMs, toevaluate overall impacts, and to identify the most susceptible economic sectors.
New Supply Options
Traditional water-supply options, such as dams, reservoirs, and aqueducts may still havean important role to play in meeting water needs in parts of the United States. We note,however, the existing financial, environmental, and social difficulties now associated withsuch options. Because new infrastructure often has a long lifetime, it is vital that the issueof climate change be factored into decisions about design and operation.
117
While new supply options can be expensive and controversial, traditional and alternativeforms of new supply will play a role in addressing changes in demands and suppliescaused by climate change and variability. Options to be considered include wastewaterreclamation and reuse, water marketing and transfers, and even limited desalination whereless costly alternatives are not available and where water prices are high. None of thesealternatives, however, are likely to alter the trend toward higher water costs. They areeither expensive relative to traditional water costs or their potential contributions tosupplies are too limited to make a significant impact on long-term supplies (Frederick1993). Ultimately, the relative costs, environmental impacts, and social and institutionalfactors will determine the appropriate response to greenhouse-gas induced climate change.
Major (1998) notes that incremental construction can allow for adaptation but adds thatplanners must choose robust designs to permit satisfactory operation under a wider rangeof conditions than traditionally considered. Designing for extreme conditions, ratherthan simply maximizing the expected value of net benefits, should be considered. He alsosuggests postponement of irreversible or costly decisions.
Demand Management, Conservation, and Efficiency
As the economic and environmental costs of new water-supply options have risen, so hasinterest in exploring ways of improving the efficiency of both allocation and use of waterresources. Improvements in the efficiency of end uses and sophisticated management ofwater demands are increasingly being considered as major tools for meeting future waterneeds, particularly in water-scarce regions where extensive infrastructure already exists(Vickers 1991, Postel 1997, Gleick 1998a, Dziegielewski 1999, Vickers 1999). Evidenceis accumulating that such improvements can be made more quickly and moreeconomically, with fewer environmental and ecological impacts, than further investmentsin new supplies (Gleick et al. 1995, Owens-Viani et al. 1999).
Industrial water withdrawals in the United States have declined significantly over the pasttwenty years because of the changing mix of the economy and improvements in theefficiency of water use. Making a ton of steel in the 1930s consumed 60 to 100 tons ofwater. Today that same steel can be produced with less than six tons of water. Yetproducing a ton of aluminum today only requires one and a half tons of water (Gleick1998a). Replacing old steel-making technology with new can thus reduce water needs.Replacing steel with aluminum, as has been happening for many years in the automobileindustry for other reasons, also reduces water needs. Total industrial water use inCalifornia decreased 30% between 1980 and 1990 because of natural economic andtechnological changes. Over the same period, total gross industrial production rose 30%in real terms (CDOF 1994). In 1979, on an industry-wide level, it took an average of13,500 cubic meters of water to produce a million dollars of industrial output. By 1990,this figure had dropped to under 7,400 cubic meters.
Water productivity can also be improved in outdoor gardens, municipal lawns, golfcourses, and other urban landscapes. In some parts of the United States as much as half ofall residential or institutional water demand goes to landscaping. Improvements inwatering efficiency could reduce that demand substantially, as could changes in thecomposition of these gardens. Innovative garden designs, xeriscaping, the use of sprinkler
118
controllers, moisture sensors, and drip technology can all reduce outdoor water use inhomes, often by 25 to 50% or more depending on homeowner’s preferences, the price ofwater, and the cost of alternatives (Gleick et al. 1995). In some regions, outdoormunicipal and institutional landscape irrigation is being done with reclaimed water,completely eliminating the use of potable water for this purpose.
The largest single user of water is the agricultural sector and in some places a substantialfraction of this water is lost as it moves through leaky pipes and unlined aqueducts, as it isdistributed to farmers, and as it is applied to grow crops. In water-short areas, newtechniques and new technologies are already changing the face of irrigation. Newsprinkler designs, such as low-energy precision application (LEPA) can increase sprinklerefficiencies from 60 to 70% to as high as 95% (Postel 1997). Drip irrigation hasexpanded worldwide. In California, more than 400,000 hectares of crops were wateredusing drip systems in the mid-1990s and more crops are being covered by such methods.Where high-valued crops are grown in relatively permanent settings such as orchards andvineyards, drip irrigation is now the dominant irrigation method. But even for row cropssuch as strawberries, asparagus, peppers, melons, tomatoes, cotton, and sugar cane, dripsystems are becoming more common. Identifying technical and institutional ways ofimproving the efficiency of these systems in a cost-effective manner will go a long waytoward increasing agricultural production without having to develop new supplies of water(Gleick 1998a).
Some studies have recently begun to explore how effective such improvements in water-useefficiency might be for addressing climate-related impacts. In an assessment of urbanwater use, Boland (1997, 1998) shows that water conservation measures such aseducation, industrial and commercial reuse, modern plumbing standards, and pricingpolicies can be extremely effective at mitigating the effects of climate change on regionalwater supplies. A number of water-system studies have begun to look at the effectivenessof reducing system demands for reducing the overall stresses on water supplies, both withand without climate change. As described earlier, Kirshen and Fennessey (1995) showedthat supply deficits in the Boston water system caused by climate change could cost asmuch as $700 million to make up, but that these costs dropped to under $150 million ifdemand management options were implemented. Wood et al. (1997) and Lettenmaier etal. (1999) noted that long-term demand growth estimates had a greater impact on systemperformance than climate change in circumstances when long-term withdrawals areprojected to grow substantially. Actions to reduce demands or to moderate the rate ofincrease in demand growth can therefore play a major role in reducing the impacts ofclimate change. Far more work is needed to evaluate the relative costs and benefits ofdemand management and water-use efficiency options in the context of a changingclimate.
Economics, Pricing, and Markets
Prices and markets are also increasingly important tools for balancing supply and demandfor water and hence for coping with climate-induced changes. Economists and others arebeginning to advocate an end to the treatment of water as a free good. This can beaccomplished in many different ways. Because new construction and new concreteprojects are increasingly expensive, environmentally damaging, and socially controversial,

119
new tools such as the reduction or elimination of subsidies, sophisticated pricingmechanisms, and smart markets provide incentives to use less water, produce more withexisting resources, and reallocate water among different users. Water marketing is viewedby many as offering great potential to increase the efficiency of both water use andallocation (NRC 1992, Western Water Policy Review Advisory Commission 1998). Asconditions change, markets can help resources move from lower- to higher-value uses.
The characteristics of water resources and the institutions established to control them haveinhibited large-scale water marketing to date. Water remains underpriced and markettransfers are constrained by institutional and legal issues. Efficient markets require thatbuyers and sellers bear the full costs and benefits of transfers. However, when water istransferred, third parties are likely to be affected. Where such externalities are ignored,the market transfers not only water, but also other benefits that water provides from anon-consenting third party to the parties to the transfer. A challenge for developing moreeffective water markets is to develop institutions that can expeditiously and efficiently takethird-party impacts into account (Loh and Gomez 1996, Gomez and Steding 1998,Dellapenna 1999). As a result, despite their potential advantages, prices and markets havebeen slow to develop as tools for adapting to changing supply and demand conditions.
The potential gains are breaking down many of the barriers to transfers in the western UnitedStates. Temporary transfers are becoming increasingly common for responding to short-termsupply and demand fluctuations. Water banks can provide a clearinghouse to facilitate thepooling of water rights for rental. The temporary nature of such a transfer blunts a principalthird-party concern that a transfer will permanently undermine the economic and socialviability of the water-exporting area. California’s emergency Drought Water Banks in the early1990s helped mitigate the impacts of a prolonged drought by facilitating water transfersamong willing buyers and sellers. Dellapenna (1999) and others have noted, however, that theCalifornia Water Bank was not a true market, but rather a state-managed reallocation effort thatmoved water from small users to large users at a price set by the state, not a functioningmarket. More recent efforts to develop more functioning markets on a smaller scale have hadsome success (California Department of Water Resources, http://rubicon.water.ca.gov/b16098/v2txt/ch6e.html). Idaho and Texas have established permanent water banks and other states areconsidering establishing them as well.
Temporary transfers are particularly useful for adapting to short-term changes such as climatevariability. They are less effective in dealing with long-term imbalances that might resultfrom changing demographic and economic factors, social preferences, or climate. At somepoint, the historical allocation of water becomes sufficiently out of balance to warrant apermanent transfer of water rights. The prospect that neighboring basins and states will beimpacted very differently by climate change could increase the potential benefits ofinterbasin and interstate transfers. Such transfers have occurred, but the process ofresolving third-party issues remains slow, costly, and contentious (Gomez and Steding1998).
While a private-property market system can be a good mechanism for allocated resources,such a system fails when there are significant barriers to the functioning of a market.Actual markets in water have been very rare in practice, and those that have been mostsuccessful have generally been for the transfer of small quantities of water, in narrowgeographical regions, among similar types of users. Dellapenna (1999) argues that
120
markets intended to bring about major changes in the time, place, or manner of use ofwater have only functioned through the strong intervention of central state authorities,and that such “markets” are rather most appropriately described as public management.At a broader level, various economic instruments can be useful in managing publicproperty, but resort to these instruments should not obscure the difficulties in settingprices on a public good such as water where prices alone cannot capture the full value ofthe resource.
A related factor is the implications of climate change for environmental justice and equity.While almost no work has been done in this area, several concerns arise, including thepossible impacts of changes in water availability for rate structures and the prices paid bythe poor for water, the consequences of inequitable allocations of scarce supplies, andeffects on rural water quality from water transfers from agricultural to urban users.
National and State Water Law
Water in its many different forms has been managed in different ways at different times,and in different places around the country, leading to complex and sometimes conflictingwater laws. At the federal level, laws such as the Clean Water Act and the Safe DrinkingWater Act have played a major role in how water is used, allocated, and treated. Yet thesenational tools, not to mention the many regional and local laws affecting water, were alldesigned without considering the possibilities of climate changes. Even without suchchanges, efforts are needed to update and improve legal tools for managing and allocatingwater resources. Dellapenna (1999) argues that the current fragmented approach isobsolete and that integrated water management at the basin level is required, both withand without climate changes. He further argues, however, that climate changes are likelyto exacerbate the problems that already exist under inefficient management.
Two separate legal issues must be addressed. The first is the role of law in managing waterresources within the United States, in different hydrologic conditions and under differentmanagement and legal structures of the states, counties, municipalities, irrigation districts,and other complex institutions with roles in water management. The second is the role oflaw in managing the water resources shared between the United States and its northernand southern neighbors. In this case, international water law plays a critical role (see thefollowing section).
There are currently three major kinds of water rights in the United States: appropriativerights – which assigns rights to water on a first-come, first-served basis; traditional riparianrights – where water is treated as a common pool resource available to whoever is capable ofaccessing it; and regulated riparianism – which treats water as public property, managed bylocal or regional governments. Regulated riparian statutes may permit new access after ajudicial or public review process.
Dellapenna (1999) argues that the last option, while not perfect, may be the best formanaging the nation’s water supply in the face of future environmental, economic, andpopulation-driven stresses. The balance between community values and expert judgmentcan be guided by the principle of “subsidiarity,” whereby decisions are to be made at thelowest level possible and higher-level decisions are subsidiary to lower-level ones.
121
International Water Management: Legal and Institutional QuestionsRelating to Climate Change and U.S. Border Regions
More than 260 river basins around the world are shared by more than one nation (Wolf etal. 1999). Internationally, this characteristic has led to both water-related conflicts as wellas cooperation (Gleick 1998a, 2000). Customary international law has only beenmarginally effective in dealing with such matters. If conflict is to be avoided, new andeffective legal instruments will have to be developed and implemented in many riverbasins around the world (Dellapenna 1994, 1996, 1997). Differences between surfacewater and groundwater laws may also be important, but such differences are not wellunderstood.
There is a significant body of international law addressing transboundary water problems,and more addressing climate change-related activities that affect air quality, but very littlelaw addressing climate change-related activities that affect water quality, quantity, ordistribution. Ultimately, this will be of importance for the United States at both itsnorthern and southern borders, where shared watersheds lead to local and regionalpolitical disputes. The United States has several treaties with its neighbors over waterresources, including a major treaty with Mexico signed in 1944 over the Colorado River.International agreements also cover the protection and use of the Great Lakes, shared bythe United States and Canada. These agreements include no provisions for explicitlyaddressing the risks of climate-induced changes in water availability or quality (Gleick1988, Goldenman 1990).
A sizable body of international customary law regarding freshwater allocation andprotection has developed over the last century. This body of law argues that riparian stateshave a legal right to use surface water, such as a river, absent agreement otherwise. Beyondthat, upstream states sometimes argue their right to do what they want to a river thatoriginates in their sovereign territory. In contrast, downstream states argue that upstreamstates can do nothing to alter historical flows and water quality of the river (Dellapenna1999). The United Nations completed work in 1997 on a new convention reconcilingthese discordant claims in two principles now generally recognized and accepted evenamong states that have not ratified the convention:
• “equitable utilization” - each state is entitled to a fair share of the water, and is subjectto an obligation to cooperate in negotiating those shares as well as cooperating toavoid harm to the shares of other states;
• “no harm” rule – states are not to cause substantial injury to the water resources inother states, subject to the need to accommodate the equitable utilization of theshared waters (United Nations 1997, articles 5, 7).
One other issue may cause international tensions in the future – international trade ofwater. Such trades are already causing tensions between parties in Canada and the UnitedStates as a result of tentative proposals to market and move Canadian water. In late 1999,Canada announced its intention to enact a ban on bulk exports of water to othercountries. The Canadian proposal has uncertain implications for existing treatyarrangements with the United States, including the North American Free Trade

122
Agreement (NAFTA). The implications of climate change have not yet been adequatelyaddressed for these issues.
123
Research Needs
To readers of this report who have come this far, it should be clear that there are importantgaps in our understanding of how climate changes will affect the water resources of theUnited States. This report can only be a first step – regular assessments must be done inorder to reduce the risks of making mistakes or missing critical impacts. New research isneeded, new data need to be collected and analyzed, and new and existing solutions needto be assessed. Below are several recommendations for filling the gaps in our knowledge.Participation by all sectors of U.S. society is necessary, including hydrologists, civilengineers, public and private organizations, governments at all levels, water planners, andwater managers.
• More work is needed to improve the ability of global climate models to provideinformation on water-resources availability, to evaluate overall hydrologic impacts, andto identify regional impacts.
• Substantial improvements in methods to downscale climate information are needed toimprove our understanding of regional and small-scale processes that affect waterresources and water systems.
• Information about how storm frequency and intensity has changed and will change isvitally important for determining impacts on water and water systems, yet suchinformation is not reliably available. More research on how the severity of storms andother extreme hydrologic events might change is necessary.
• Increased and widespread hydrologic monitoring systems are needed. The currenttrend in the reduction of monitoring networks is disturbing (see http://water.usgs.gov/streamgaging).
• There should be a systematic reexamination of engineering design criteria andoperating rules of existing dams and reservoirs under conditions of climate change.
• Information on economic sectors most susceptible to climate change is extremelyweak, as are tools for assessing the socioeconomic costs of both impacts and responsesin the water sector.
• More work is needed to evaluate the relative costs and benefits of non-structuralmanagement options, such as demand management and water-use efficiency, orprohibition on new floodplain development, in the context of a changing climate.
• Research is needed on the implications of climate change for international water law,U.S. treaties and agreements with Mexico and Canada, and international trade inwater.

124
• Little information is available on how climate change might affect groundwateraquifers, including quality, recharge rates, and flow dynamics. New studies on theseissues are needed.
• The legal allocation of water rights should be reviewed, even in the absence of climatechange, to address inequities, environmental justice concerns, and inefficient use ofwater. The risks of climate change make such a review even more urgent.
125
Summary
As the new century begins, many challenging factors face the public, water planners andmanagers, and policymakers. Changes in population, economic conditions, technology,policies, and the relative values of society will be important determinants of future watersupply and demand. On top of these complexities, human-induced changes in our basicclimate conditions must also be taken into account. More than twenty years of researchand more than a thousand peer-reviewed scientific papers have firmly established that agreenhouse warming will alter the supply and demand for water, the quality of water, andthe health and functioning of aquatic ecosystems.
As noted throughout this report, the detailed nature of future climate change and itsimpacts remain uncertain. These uncertainties are obstacles to introducing climateimpacts into investment or operational decisions, but they must not be used as an excuseto avoid taking certain actions now. The first line of defense for protecting the nation’swater resources must be a strong and consistent research and monitoring program tocontinue to evaluate climate-related risks. Where climate change is minor or where otherfactors dominate, the impacts on our water resources may be low. In some regions and forsome issues, climate change may even reduce the risks imposed by growing populations,industrialization, and land-use changes.
A growing body of evidence, however, shows that U.S. water resources are sensitive to bothclimate and to how these complex water systems are managed. In many cases and inmany locations, there is compelling scientific evidence that climate change will poseserious challenges to our water systems. Of particular concern are climate changes thatcause impacts that are larger than other expected changes, different in nature thanexpected changes, or imposed on top of existing long-term challenges. In these instances,the marginal economical, ecological, and social costs to society could be substantial.There is also a risk that climate impacts will not be felt equally across social or economicgroups in the country.
The United States has invested hundreds of billions of dollars in dams, reservoirs,aqueducts, water treatment facilities, and other concrete structures. These systems weredesigned and are operated assuming that future climatic and hydrologic conditions willhave the same characteristics as past conditions. We now understand that this is no longera valid assumption. Some managers are beginning to explore how different operating rulesand regimes might reduce future climate risks; this kind of evaluation should beencouraged. The relative socioeconomic and environmental impacts of both climate andnon-climate impacts on the supply and demand for water will depend in large part on theability to foresee major changes, to adapt to such changes, to be flexible in the face ofprobable surprises, and to be innovative in the management and allocation of the nation’swater resources. Maintaining options and building in dynamic flexibility are importantfor designing and operating water systems that will continue to meet our needs in thecoming decades.
126
References
Abt Associates. 1995. Ecological Impacts from Climate Change: An Economic Analysis ofFreshwater Recreational Fishing. U.S. Environmental Protection Agency. Office of Policy,Planning and Evaluation. EPA 230-R-95-004.
Ainley, D. G. and G. J. Divoky. 1998. “Climate change and seabirds: a review of trends inthe eastern portion of the Pacific Basin.” Pacific Seabirds 25(1): 20.
Alexander, R.B., P.S. Murdoch, and R.A. Smith. 1996. Streamflow-induced variations innitrate flux in tributaries to the Atlantic coastal zone. Biogeochemistry, Vol. 33, No. 3,pp. 148-177.
American Water Works Association (AWWA). 1997. Climate change and water resources.Committee Report of the AWWA Public Advisory Forum. Journal of the American WaterWorks Association, Vol. 89, No. 11, pp. 107-110.
Anderson, W.L., D.M. Robertson, and J.J. Magnuson. 1996. Evidence of recent warmingand El Niño-related variations in ice breakup of Wisconsin Lakes. Limnology andOceanography, Vol. 41, pp. 815-821.
Angel, J.R., and F.A. Huff. 1997. Changes in heavy rainfall in the Midwestern U.S.ASCE, Water Resources Planning and Management, Vol. 123, pp. 246-249.
Angell, J.K. 1990. Variation in United States cloudiness and sunshine duration between1950 and the drought year of 1988. Journal of Climate, Vol. 3, pp. 296-308.
Anisimov, O.A. and F.E. Nelson. 1996. Permafrost distribution in the NorthernHemisphere under scenarios of climatic change. Global and Planetary Change, Vol. 14,pp. 59-72.
Arnell, N. 1996. Global Warming, River Flows and Water Resources. John Wiley andSons, Chichester, UK.
Arnell, N.W. 1999. The effect of climate change on hydrological regimes in Europe: Acontinental perspective. Global Environmental Change, Vol. 9, pp. 5-23.
Arnold, J. G., Srinivasan, R., Muttiah, R. S., and P.M. Allen. 1999. Continental scalesimulation of the hydrologic balance. Journal of American Water Resources AssociationVol. 35, pp. 1037-1051.
Arnold, J. G., Srinivasan, R., Muttiah, R. S., and J.R. Williams. 1998. Large areahydrologic modeling and assessment, Part I: model development. Journal of AmericanWater Resources Association, Vol. 34, pp. 1-17.
127
Auble, G.T., J.M. Friedman, and M.L. Scott. 1994. Relating riparian vegetation topresent and future streamflows. Ecological Applications, Vol. 4, pp. 544-554.
Baldigo, B.P. and P.S. Murdoch. 1997. Effect of stream acidification and inorganicaluminum on mortality of brook trout (Salvelinus fontinalis) in the Catskill Mountains,New York. Canadian Journal of Fisheries and Aquatic Sciences, Vol. 54, pp. 603-615.
Bates, G.T., F. Giorgi, S.W. Hostetler. 1993. Toward the simulation of the effects of theGreat Lakes on regional climate. Monthly Weather Review, Vol. 121, pp. 1373-1387.
Beersma, J. J., K. M. Rider, G. J. Komen, E. Kaas, and V. V. Kharin. 1997. An analysis ofextratropical storms in the North Atlantic region as simulated in a control and 2XCO
2
time-slice experiment with a high-resolution atmospheric model. Tellus, Vol. 49A, pp.347–361.
Bernard, S.M., J. Rose, B. Sherman, M. McGeehin, J. Scheraga, and J. Patz. 1999. Water,health and climate: Assessing the potential consequences of climate change and variabilityon waterborne disease risk. Proceedings of the AWRA Specialty Conference on PotentialConsequences of Climate Variability and Change to Water Resources of the United States.May. Atlanta, Georgia.
Beaubien, E.G. and D.L. Johnson. 1994. Flowering plant phenology and weather inAlberta, Canada. International Journal of Biometeorology, Vol. 38, pp. 23-27.
Billings, D.W. and K.M. Peterson. 1992. Some possible effects of climatic warming onArctic tundra ecosystems of the Alaskan North Slope. In R.L. Peters and T.E. Lovejoy(editors) Global Warming and Biological Diversity. Yale University Press, New Haven,Connecticut, pp. 233-243.
Boland, J.J. 1997. Assessing urban water use and the role of water conservation measuresunder climate uncertainty. Climatic Change, Vol. 37, pp. 157-176.
Boland, J.J. 1998. Water supply and climate uncertainty. In Global Change and WaterResources Management (K. Schilling and E. Stakhiv, eds.) Water Resources Update, Issue112, Universities Council on Water Resources, pp. 55-63.
Brown, R.A., N.J. Rosenberg, R.C. Izarraulde. 1999. Response of U.S. regional waterresources to CO
2-fertilization and Hadley Centre climate model projections of
greenhouse-forced climate change: A continental scale simulation using the HUMUSmodel. Pacific Northwest National Laboratory, PNNL-13110.
Brown, T.C. 1999. Past and Future Fresh Water Use in the United States. GeneralTechnical Report RMRS-GTR-39. U.S. Department of Agriculture, Forest Service, RockyMountain Research Station, Fort Collins, Colorado.
Brumbaugh, R., W. Werick, W. Teitz, J. Lund. 1994. Lessons Learned from the CaliforniaDrought (1987-1992). IWR Report 94-NDS-6. U.S. Army Corps of Engineers,Alexandria, VA.
128
Brumbelow, K., and A. Georgakakos. 2000. Assessment of US Irrigation Needs and CropYields under Potential Climate Changes. Journal of Geophysical Research (in review).U.S. Geological Survey Open-File Report 00-332, 42p.
Burkett, V. and J. Kusler. 2000. Climate change: Potential impacts and interactions inwetlands of the United States. Journal of the American Water Resources Association, Vol.36, pp. 313-320.
Burn, D.H. 1994. Hydrologic effects of climatic change in west-central Canada. Journalof Hydrology, Vol. 160, pp. 53-70.
California Department of Finance (CDOF). 1994. California Statistical Abstract.Compilation of U.S. Department of Commerce and Bureau of Economic Analysis data,Sacramento, California.
California Department of Water Resources n(CDWR). 1998. Update to the CaliforniaWater Plan. Bulletin 160-98, Sacramento, California.
Carnell, R. E., and C. A. Senior, 1998. Changes in mid-latitude variability due togreenhouse gases and sulphate aerosols. Climate Dynamics, Vol. 14, pp. 369–383.
Carpenter, S.R., S.G. Fisher, N.B. Grimm, and J.F. Kitchell. 1992. Global change andfreshwater ecosystems. Annual Review of Ecology and Systematics, Vol. 23, pp. 119 -139.
Carpenter, T., and K. Georgakakos. 2000. Assessment of Folsom Lake Response toHistorical and Potential Future Climate Scenarios, 1, Forecasting. Journal of Hydrology(in review). U.S. Geological Survey Open-File Report 00-333, 62p.
Carter, T.R., M.L. Parry, H. Harasawa, and S. Nishioka. 1994. IPCC TechnicalGuidelines for Assessing Climate Change Impacts and Adaptation. IntergovernmentalPanel on Climate Change, CGER-I015-94. Department of Geography, UniversityCollege London, United Kingdom, and the Center for Global Environmental Research,National Institute for Environmental Studies, Tsukuba, Japan. 59p.
Cayan, D.R. 1996. Interannual climate variability and snowpack in the western UnitedStates. Journal of Climate, Vol. 9, pp. 928-948.
Chalecki, E.L. and P.H. Gleick. 1999. A comprehensive bibliography of the impacts ofclimatic change and variability on water resources of the United States. Journal of theAmerican Water Resources Association. Vol. 35, pp. 1657-1665.
Chang, L.H., S.F. Railsback, and R.T. Brown. 1992. Use of a reservoir water qualitymodel to simulate global climate change effects on fish habitat. Climatic Change, Vol. 20,pp. 277 – 296.
Changnon, D., T.B. McKee, and N.J. Doesken. 1993. Annual snowpack patterns acrossthe Rockies: Long-term trends and associated 500-mb synoptic patterns. MonthlyWeather Review, Vol. 121, pp. 633-647.
129
Changnon, S.A. and M. Demissie. 1996. Detection of changes in streamflow and floodsresulting from climate fluctuations and land use-drainage changes. Climatic Change, Vol.32, pp. 411-421.
Chao, P.T. 1999. Great Lakes water resources – Climate change impact analysis withtransient GCM scenarios. Journal of the American Water Resources Association. Vol. 35,pp. 1499-1508.
Chao, P.T., B.F. Hobbs, and B.N. Venkatesh. 1999. How should climate uncertainty beincluded in Great Lakes management? Workshop Results. Journal of the AmericanWater Resources Association, Vol. 35, pp. 1485-1498.
Chen, C.C., B.A. McCarl, and R.M. Adams. 1999. Economic implications of potentialclimate change induced frequency and strength shifts. National Assessment AgriculturalSector reports, http://www.nacc.usgcrp.gov/sectors/agriculture/chen3.pdf.
Cline, W.R. 1992. The Economics of Global Warming. Institute for InternationalEconomics, Washington, D.C.
Cole, J.A., S. Slade, P.D. Jones, and J.M. Gregory. 1991. Reliable yield of reservoirs andpossible effects on climatic change. Hydrological Sciences Journal, Vol. 36, pp. 579-597.
Colwell, R.R. 1996. Global climate and infectious disease: the cholera paradigm. ScienceVol. 274, pp. 2025-2031.
Cooley, K.R., Flerchinger, G.N., Wight, J.R. and C.L. Hanson. 1992. Effects of climatechanges on water supplies. In R. Herrman (ed.) Managing Water Resources DuringGlobal Change. American Water Works Association 28th Annual Conference andSymposium, Reno, Nevada. AWRA, Maryland, pp. 185-194.
Covich, A.P., S.C. Fritz, P.J. Lamb, R.D. Marzolf, W.J. Matthews, K.A. Poiani, E.E.Prepas, M.B. Richman, T.C. Winter. 1997. Potential effects of climate change on aquaticecosystems of the Great Plains of North America. Hydrological Processes Vol. 11, No. 8,pp. 993-1021.
Crane, R.G. and B.C. Hewitson. 1998. Doubled CO2 precipitation changes for the
Susquehanna Basin: Downscaling from the GENESIS general circulation model.International Journal of Climatology, Vol. 18, pp. 65-76.
Crick, H. Q. P. and T. H. Sparks. 1999. Climate change related to egg-laying trends.Nature, Vol. 399, pp. 423-24.
Croley, T.E. 1990. Laurentian Great Lakes double-CO2 climate change hydrologic
impacts. Climatic Change, Vol. 17, pp. 27-48.
Cruise, J.F., A.S. Limaye, and N. Al-Abed. 1999. Assessment of impacts of climate changeon water quality in the southeastern United States. Journal of the American WaterResources Association. Vol. 35, pp. 1539-1550.
130
Dai, A., I.Y. Fung, and A.D. Del Genio. 1997a. Surface observed global landprecipitation variations during 1900-1988. Journal of Climate Vol. 10, pp. 2943-2962.
Dai, A., A.D. Del Genio and I.Y. Fung. 1997b. Clouds, precipitation and temperaturerange. Nature, Vol. 386, pp. 665-666.
Dale, V.H. 1997. The relationship between land-use change and climate change.Ecological Processes, Vol. 7, pp. 753-769.
Davidovich, N.V. and M.D. Ananicheva. 1996. Prediction of possible changes in glacio-hydrological characteristics under global warming: Southeastern Alaska, USA. Journal ofGlaciology, Vol. 42, pp. 407-412.
Dellapenna, J.W. 1994. Treaties as instruments for managing internationally-sharedresources: Restricted sovereignty vs. community property. Case-Western Reserve Journalof International Law, Vol. 26, pp. 27-56.
Dellapenna, J.W. 1996. The two rivers and the lands between: Mesopotamia and theinternational law of transboundary waters. BYU Journal of Public Law, Vol. 10, pp. 213-261.
Dellapenna, J.W. 1997. Population and water in the Middle East: The challenge andopportunity for law. International Journal of Environment and Pollution, Vol. 7, No. 72-111.
Dellapenna, J. W. 1999. Adapting the law of water management to global climate changeand other hydropolitical stresses. . Journal of the American Water Resources Association.Vol. 35, pp. 1301-1326.
Dettinger, M.D. and D.R. Cayan. 1995. Large-scale atmospheric forcing of recenttrends toward early snowmelt runoff in California. Journal of Climate, Vol. 8, pp. 606-623.
Dettinger, M.D., M. Ghil, and C.L. Keppenna. 1995. Interannual and interdecadesvariability of United States surface-air temperatures: 1910-1987. Climatic Change Vol.31, pp. 35-66.
Doherty, R. and L.O. Mearns. 1999. A comparison of simulations of current climate fromtwo coupled atmosphere-ocean global climate models against observations and evaluationof their future climates. Report to the National Institute for Global EnvironmentalChange (NIGEC). National Center for Atmospheric Research, Boulder, Colorado.(February).
Duell, L.F.W., Jr. 1992. Use of regression models to estimate effects of climate change onseasonal streamflow in the American and Carson River Basins, California-Nevada. InManaging Water Resources During Global Change. Proceedings of the 28th AmericanWater Resources Association Annual Conference, Bethesda, Maryland.
131
Dvorak,V., J. Hladny, and L. Kasparek. 1997. Climate change hydrology and waterresources impact and adaptation for selected river basins in the Czech Republic. ClimaticChange, Vol. 36, pp. 93-106.
Dziegielewski, B. (editor). 1999. Management of water demand: Unresolved issues.Water Resources Update. Issue No. 114, Universities Council on Water Resources.Carbondale, Illinois.
Easterling, D. R., J. L. Evans, P. Ya. Groisman, T. R. Karl, K. E. Kunkel, P. Ambenje.2000. Observed variability and trends in extreme climate events: A brief review. Bulletinof the American Meteorological Society, Vol. 81, pp. 417–426.
Eaton, J.G. and R.M. Scheller. 1996. Effects of climate warming on fish thermal habitatsin streams of the United States. Limnology and Oceanography Vol. 41, pp. 1109-1115.
Eheart J.W., A.J. Wildermuth, and E.E. Herricks. 1999. The effects of climate changeand irrigation on criterion low streamflows used for determining Total Maximum DailyLoads. Journal of the American Water Resources Association. Vol. 35, pp. 1365-1372.
Fang, X., and H.G. Stefan. 1997. Simulated climate change effects on dissolved oxygencharacteristics in ice-covered lakes. Ecological Modeling, Vol. 103, No. 2-3, pp. 209-229.
Felzer, B. and P. Heard. 1999. Precipitation difference amongst GCMs used for the U.S.National Assessment. Journal of the American Water Resources Association. Vol. 35, pp.1327-1340.
Field, C.B., R.B. Jackson, and H.A. Mooney. 1995. Stomatal responses to increasedCO2 – Implications from the plant to the global scale. Plant Cell and Environment, Vol.18, pp. 1214-1225.
Fiering, M.B. and P.P. Rogers. 1989. Climate Change and Water Resource Planningunder Uncertainty. Research Report of the Institute for Water Resources, U.S. ArmyCorps of Engineers, Washington, D.C.
Firth, P. and S.G. Fisher (editors). 1992. Global Climate Change and FreshwaterEcosystems. Springer-Verlag, New York.
Flaschka, I.M., C.W. Stockton, and W.R. Boggess. 1987. Climatic variation and surfacewater resources in the Great Basin region. Water Resources Bulletin, Vol. 23, pp. 47-57.
Frederick, K. D. 1991. Water resources: Increasing demand and scarce supplies. InFrederick and Sedjo, eds. America’s Renewable Resources: Historical Trends and CurrentChallenges. Resources for the Future. Washington, DC.
Frederick, K.D. 1993. Balancing water demands with supplies: The role of managementin a world of increasing scarcity. World Bank Technical Paper No. 189. Washington, DC.
132
Frederick, K.D. 1998. Principles and concepts for water resources planning under climateuncertainty. In Global Change and Water Resources Management (K. Schilling and E.Stakhiv, eds.) Water Resources Update, Issue 112, Universities Council on WaterResources, pp. 41-46.
Frederick, K.D. and P.H. Gleick. 1999. Water and Global Climate Change: PotentialImpacts on U.S. Water Resources. Pew Center on Global Climate Change. Washington,D.C.
Frederick, K. D. and D. C. Major. 1997. Climate change and water resources. ClimaticChange Vol. 37, pp. 7-23.
Frederick, K. D., D. C. Major, and E. Z. Stakhiv. 1997. Water resources planningprinciples and evaluation criteria for climate change: Summary and conclusions. ClimaticChange, Vol. 36, pp. 291-313 .
Frederick, K.D. and G.E. Schwarz. 1999. Socioeconomic impacts of climate change onU.S. water supplies. Journal of the American Water Resources Association. Vol. 35, pp.1563-1584.
Frei, C., C. Schar, D. Luthi, and H.C. Davies. 1998. Heavy precipitation processes in awarmer climate. Geophysical Research Letters, Vol. 25, No. 9, pp. 1431-1434.
Fritz, S.C. 1996. Paleolimnological records of climate change in North America.Limnology and Oceanography, Vol. 41, pp. 882-889.
Georgakakos, A. and H. Yao. 2000a. Climate change impacts on Southeastern U.S.basins, 1: Hydrology. Water Resources Research (in review). U.S. Geological SurveyOpen-File Report 00-334, 68p.
Georgakakos, A. and H. Yao. 2000b. Climate change impacts on Southeastern U.S.Basins, 2: Management. Water Resources Research (in review). U.S. Geological SurveyOpen-File Report 00-334, 68p.
Georgakakos, A., H. Yao, M. Mullusky, and K. Georgakakos. 1998. Impacts of climatevariability on the operational forecast and management of the upper Des Moines Riverbasin. Water Resources Research, Vol. 34, pp. 799-821.
Georgakakos, K.P. and D.E. Smith. 2000. Soil moisture tendencies into the next centuryfor the conterminous United States. J. Geophysical Research (in review). U.S. GeologicalSurvey Open-File Report 00-335, 50p.
Giorgi, F., L. Mearns, S. Shields, and L. McDaniel. 1998. Regional nested modelsimulations of present day and 2XCO
2 climate over the central Great Plains of the United
States. Climatic Change, Vol. 40, pp. 457–493.
Gleick, P.H. 1986. Methods for evaluating the regional hydrologic impacts of globalclimatic changes. Journal of Hydrology. Vol. 88, pp. 97-116.
133
Gleick, P.H. 1987a. The development and testing of a water-balance model for climateimpact assessment: Modeling the Sacramento Basin. Water Resources Research. Vol. 23,pp. 1049-1061.
Gleick, P.H. 1987b. Regional hydrologic consequences of increases in atmospheric carbondioxide and other trace gases. Climatic Change. Vol. 10, No. 2, pp. 137-161.
Gleick, P.H. 1988. “The effects of future climatic changes on international waterresources: The Colorado River, The United States, and Mexico.” Policy Science. Vol. 21,pp. 23-39.
Gleick, P.H. 1989. Climate change, hydrology, and water resources. Review ofGeophysics. Vol. 27, No. 3. pp. 329-344.
Gleick, P.H. 1998a. The World’s Water 1998-1999. Island Press, Washington, D.C.
Gleick, P.H. 1998b. Water planning and management under climate change. In GlobalChange and Water Resources Management (K. Schilling and E. Stakhiv, eds.) WaterResources Update, Issue 112, Universities Council on Water Resources, pp.25-32.
Gleick, P.H. 2000. The World’s Water 2000-2001. Island Press, Washington, D.C.
Gleick, P.H. and E.L. Chalecki. 1999. The impacts of climatic changes for water resourcesof the Colorado and Sacramento-San Joaquin river basins. Journal of the American WaterResources Association. Vol. 35, pp. 1429-1441.
Gleick, P., P. Loh, S. Gomez, and J. Morrison. 1995. California Water 2020: ASustainable Vision. Pacific Institute Report, Pacific Institute for Studies in Development,Environment, and Security. Oakland, California.
Gleick, P.H. and L. Nash. 1991. The Societal and Environmental Costs of the ContinuingCalifornia Drought. Pacific Institute for Studies in Development, Environment, andSecurity, Oakland, California.
Goldenman, G. 1990. Adapting to climate change: A study of international rivers andtheir legal arrangements. Ecology Law Quarterly, Vol. 17, No. 4, pp. 741-802.
Gomez, S. and A. Steding. 1998. California Water Transfers: An Evaluation of theEconomic Framework and a Spatial Analysis of the Potential Impacts. Pacific Institute forStudies in Development, Environment, and Security, Oakland, California.
Gorham, E. 1995. The biogeochemistry of northern peatlands and its possible response toclimatic warming. In G.M. Woodwell and F.T. MacKenzie (editors). Biotic Feedback inthe Global Climatic System. Will the Warming Feed the Warming? Oxford UniversityPress, Oxford, pp. 169 - 187.
134
Green, T.R., B.C. Bates, P.M. Fleming, S.P. Charles, and M. Taniguchi. 1997. Simulatedimpacts of climate change on groundwater recharge in the subtropics of Queensland,Australia. In Subsurface Hydrological Responses to Land Cover and Land Use Changes.Kluwer Academic Publishers, Norwell, USA, pp. 187-204.
Gregory, J.M., J.F.B. Mitchell, and A.J. Brady. 1997. Summer drought in northernmidlatitudes in a time-dependent CO
2 climate experiment. Journal of Climate, Vol. 10,
pp. 662-686.
Grimm, N. B. 1993. Implications of climate change for stream communities. In P.M.Kareiva, J. G. Kingsolver, R. B. Huey (editors). Biotic Interactions and Global Change.Sinauer Associates Inc., Sunderland, MA. pp. 292-314.
Grimm, N.B., A. Chacon, C.N. Dahm, S.W. Hostetler, O.T. Lind, P.L. Starkweather, andW.W. Wurtsbaugh. 1997. Sensitivity of aquatic ecosystems to climatic and anthropogenicchanges: Basin and Range American Southwest and Mexico. Hydrological Processes, Vol.11, No. 8, pp. 1023-1042.
Groisman, P.Ya., Knight, R.W., and T. R. Karl. 2000. Heavy precipitation and highstreamflow in the continuous United States: Trends in the 20th century. Bulletin of theAmerican Meteorological Society (in press).
Groisman, P.Ya., T.R. Karl, R.W. Knight, and G.L. Stenchikov. 1994. Changes in snowcover, temperature, and the radiative heat balance over the Northern Hemisphere. Journalof Climate, Vol. 7, pp. 1633-1656.
Haimes, Y.Y. and D. Li. 1991. Multiobjective risk partitioning for rare hydrologicevents. In Y.Y. Haimes, D. Moser, and E. Stakhiv (editors). Risk-Based Decision Makingin Water Resources VI. Engineering Foundation Conference, American Society of CivilEngineers, New York.
Hamlet, A.F. and D.P. Lettenmaier. 1999. Effects of climate change on hydrology andwater resources objectives in the Columbia River basin. Journal of the American WaterResources Association. Vol. 35, pp. 1597-1624.
Hanemann, M.W. and R. McCann. 1993. Economic impacts on the northern Californiahydropower system. In J. Dracup et al. (eds.). Integrated Modeling of Drought andGlobal Warming: Impacts on Selected California Resources. National Institute for GlobalEnvironmental Change. University of California, Davis, California, pp. 69-96.
Hanratty, M.P. and H.G. Stefan. 1998. Simulating climate change effects in a Minnesotaagricultural watershed. Journal of Environmental Quality, Vol. 27, pp. 1524-1532.
Harvell, C.D., K. Kim, J.M, Burkholder, R. R. Colwell, P.R. Epstein, D.J. Grimes, E.E.Hofmann, E.K. Lipp, A.D. Osterhaus, R.M. Overstreet, J.W. Porter, G.W. Smith, and G.Vasta. 1999. Emerging marine diseases: Climate links and anthropogenic factors.Science, Vol. 285, pp. 1505-1510.
135
Hauer, F.R. J.S. Baron, D.H. Campbell, K.D. Fausch, S.W. Hostetler, G.H. Leavesley, P.R.Leavitt, D.M. McKnight, J.A. Stanford. 1997. Assessment of climate change andfreshwater ecosystems of the Rocky Mountains, USA and Canada. Hydrological Processes,Vol. 11, No. 8, pp. 903-924.
Hay, L.E., R.L. Wilby, and G.H. Leavesley. 2000. A comparison of delta change anddownscaled GCM scenarios for three mountainous basins in the United States. Journal ofthe American Water Resources Association, Vol. 36, pp. 387-398.
Hayden, B.P. 1999. Climate change and extratropical storminess in the United States:An assessment. Journal of the American Water Resources Association. Vol. 35, pp. 1387-1398.
Haywood, J. M., R. J. Stouffer, R. T. Wetherald, S. Manabe, and V. Ramaswamy, 1997.Transient response of a coupled model to estimated changes in greenhouse gas and sulfateconcentrations. Geophysical Research Letters, Vol. 24, pp. 1335–1338.
Hennessy, K. J., J. M. Gregory, and J. F. B. Mitchell. 1997. Changes in dailyprecipitation under enhanced greenhouse conditions. Climate Dynamics, Vol. 13, pp.667–680.
Hodge, S.M., D.C. Trabant, R.M. Krimmel, T.A. Heinrichs, R.S. March, and E.G.Josberger. 1998. Climate variations and changes in mass of three glaciers in westernNorth America. Journal of Climate, Vol. 11, pp. 2161-2179.
Hostetler, S.W. 1994. Hydrologic and atmospheric models – the continuing problem ofdiscordant scales. Guest editorial, Climatic Change, Vol. 27, pp. 345-350.
Hostetler, S.W. and E.E. Small. 1999. Response of North American freshwater lakes tosimulated future climates. Journal of the American Water Resources Association. Vol. 35,pp. 1625-1638.
Hotchkiss, R.H., S.F. Jorgensen, M.C. Stone, and T.A. Fontaine. 2000. Regulated rivermodeling for climate change impacts assessment: The Missouri River. Journal of theAmerican Water Resources Association. Vol. 36, pp. 375-386.
Hurd, B.H., J.M. Callaway, J.B. Smith, and P. Kirshen. 1998. Economic effects ofclimate change on U.S. water resources. In R. Mendelsohn and J.E. Neumann (eds.) TheImpact of Climate Change on the United States Economy. Cambridge University Press,Cambridge, United Kingdom, pp. 133-177.
Hurd, B., N. Leary, R. Jones, and J. Smith. 1999. Relative regional vulnerability ofwater resources to climate change. Journal of the American Water Resources Association.Vol. 35, pp. 1399-1410.
Interagency Floodplain Management Review Committee. 1994. Sharing the Challenge:Floodplain Management into the 21st Century. Report to the Administration FloodplainManagement Task Force. Washington, DC.
136
Intergovernmental Panel on Climate Change (IPCC). 1990. Climate Change. The IPCCScientific Assessment. J.T. Houghton, G.J. Jenkins, and J.J. Ephrauns (editors).Cambridge University Press, Cambridge, United Kingdom.
Intergovernmental Panel on Climate Change (IPCC). 1996a. Climate Change 1995: TheScience of Climate Change: Contribution of Working Group I to the Second AssessmentReport of the Intergovernmental Panel on Climate Change. Cambridge University Press,New York.
Intergovernmental Panel on Climate Change (IPCC). 1996b. Climate Change 1995:Impacts, Adaptations and Mitigation of Climate Change: Scientific-Technical Analyses:Contribution of Working Group II to the Second Assessment Report of theIntergovernmental Panel on Climate Change, Cambridge University Press, New York.
Intergovernmental Panel on Climate Change (IPCC). 1996c. Hydrology and FreshwaterEcology. In Climate Change 1995: Impacts, Adaptations, and Mitigation of ClimateChange. Contribution of Working Group II to the Second Assessment Report of theIntergovernmental Panel on Climate Change. Cambridge University Press, Cambridge,UK.
Intergovernmental Panel on Climate Change (IPCC). 1998. Regional Impacts of ClimateChange: An Assessment of Vulnerability. Cambridge University Press, New York.
Jacoby, H.D. 1990. Water quality. In P.E. Waggoner (editor) Climate Change and U.S.Water Resources. John Wiley and Sons, New York, pp. 307-328.
Jager, J. and H. Ferguson. 1991. Proceedings of the Second World Climate Conference,Geneva, Switzerland.
Karl, T.R., R.W. Knight, D.R. Easterling, and R.G. Quayle. 1996. Indices of climaticchange for the United States. Bulletin of the American Meteorological Society, Vol. 77,pp. 279-292.
Karl, T.R. and R.W. Knight. 1998. Secular trends of precipitation amount, frequency, andintensity in the USA. Bulletin of the American Meteorological Society, Vol. 79, pp. 231-241.
Karl, T.R., R.R. Heim, and R.G. Quayle. 1991. The greenhouse effect in NorthAmerica: If not now, when? Science, Vol. 251, p. 1058.
Karl, T.R., R.W. Knight, and N. Plummer. 1995. Trends in high-frequency climatevariability in the twentieth century. Nature, Vol. 377, pp. 217-220.
Kirshen, P. and N. Fennessey. 1995. Potential Impacts of Climate Change on the WaterSupply of the Boston Metropolitan Area. U.S. Environmental Protection Agency, EPA230-R-95-003, Washington, D.C.
137
Knutson, T.R. and R.E. Tuleya. 2000. Increased hurricane intensities with CO2-induced
warming as simulated using the GFDL hurricane prediction system. Climate Dynamics,Vol. 15, pp. 503-519.
Korner, C. 1996. The response of complex multispecies systems to elevated CO2. In B.R.
Walker and W. Steffen (eds.) Global Change and Terrestrial Ecosystems. CambridgeUniversity Press, Cambridge, United Kingdom, pp. 20-42.
Kothavala, Z. 1997. Extreme precipitation events and the applicability of global climatemodels to study floods and droughts. Mathematical Computer Simulations, Vol. 43, pp.261–268.
Kunkel, K., K. Andsager, and D.R. Easterling. 1999. Trends in heavy precipitation eventsover the continental United States. Journal of Climate, Vol. 12, pp. 2515-2527.
Lachenbruch, A.H. and B.V. Marshall. 1986. Changing climate – Geothermal evidencefrom permafrost in the Alaskan Arctic. Science, Vol. 234, pp. 689-696.
Laird, K.R., S.C. Fritz, E.C. Grimm, and P.G. Mueller. 1996. Century-scale paleoclimaticreconstruction from Moon Lake, a closed-basin lake in the northern Great Plains.Limnology and Oceanography, Vol. 41, pp. 890-902.
Lambert, S.J. 1995. The effect of enhanced greenhouse warming on winter cyclonefrequencies and strengths. Journal of Climate, Vol. 8, No. 5, pp. 1447-1452.
Landsea, C.W., R.A. Pielke Jr., A.M. Mestas-Nunez, and J.A. Knaff. 1999. Atlantic basinhurricanes: indices of climatic changes. Climatic Change, Vol. 42, pp. 89-129.
Leonard, R., B. Kuzelka, and S. Seacrest. 1999. Groundwater-climate changeinteractions. AWRA Specialty Conference on Potential Consequences of ClimateVariability and Change to Water Resources of the United States, Atlanta Georgia, May,pp. 173-176.
Lettenmaier, D.P. and T.Y. Gan. 1990. Hydrologic sensitivities of the Sacramento-SanJoaquin River Basin, California, to global warming. Water Resources Research, Vol. 26,No. 1, pp. 69-86.
Lettenmaier, D.P. and D.P. Sheer. 1991. Climatic sensitivity of California waterresources. Journal of Water Resources Planning and Management, Vol. 117, pp. 108-125.
Lettenmaier, D.P., E.F. Wood, and J.R. Wallis. 1994. Hydro-climatological trends in thecontinental United States 1948-1988. Journal of Climate, Vol. 7, pp. 586-607.
Lettenmaier, D.P., A.W. Wood, R.N. Palmer, E.F. Wood, and E.Z. Stakhiv. 1999. Waterresources implications of global warming: A U.S. regional perspective. Climatic Change,Vol. 43, No. 3, pp. 537-579.
138
Leung, L.R. and M.S. Wigmosta. 1999. Potential climate change impacts on mountainwatersheds in the Pacific Northwest. Journal of the American Water ResourcesAssociation. Vol. 35, No. 6, pp. 1463-1471.
Levi, B.G. 2000. The decreasing arctic ice cover. Physics Today, January, pp. 19-20.
Lins, H.F. And P.J. Michaels. 1994. “Increased US streamflow linked to greenhouseforcing.” EOS, Transactions of the American Geophysical Union, Vol. 75, pp. 281, 284-285.
Lins, H.F., and J.R. Slack. 1999. Streamflow trends in the United States. GeophysicalResearch Letters, Vol. 26, No. 2, pp. 227-230.
Lins, H.F., D.M. Wolock, and G.J. McCabe. 1997. Scale and modeling issues in waterresources planning. Climatic Change, Vol. 36, pp. 63-88.
Loaiciga, L.C., D.R. Maidment, and J.B. Valdes. 1998. Climate change impacts on thewater resources of the Edwards Balcones Fault Zone aquifer, Texas. American Society ofCivil Engineers, ASCE/USEPA. Reston, Virginia.
Loh, P. and S. Gomez. 1996. Water Transfers in California: A Framework for Sustainabilityand Justice. Pacific Institute for Studies in Development, Environment, and Security.Oakland, California.
Lunkeit, F., M. Ponater, R. Sausen, M. Sogalla, U. Ulbrich, and M. Windelband. 1996.Cyclonic activity in a warmer climate. Contrib. Atmospheric Physics, Vol. 69, pp. 393–407.
Magnuson, J.J. and B.T. DeStasio. 1996. Thermal niche of fishes and global warming. InC.M. Wood and D.G. MacDonald (eds.) Global Warming – Implications for Freshwaterand Marine Fish. Society for Experimental Biology Seminar Series 61, CambridgeUniversity Press, Cambridge, United Kingdom, pp. 377-408.
Magnuson, J.J., K.E. Webster, R.A. Assel, C.J. Bowser, P.J. Dillon, J.G. Eaton, H.E.Evans, E.J. Fee, R.I. Hall, L.R. Mortsch, D.W. Schindler, and F.H. Quinn. 1997.Potential effects of climate changes on aquatic systems: Laurentian Great Lakes andPrecambrian Shield Region. Hydrological Processes, Vol. 11, pp. 825-871.
Major, D.C. 1998. Climate change and water resources: The role of risk managementmethods. Water Resources Update, Issue No. 112, pp. 47-50.
Mann, M.E. and R.S. Bradley. 1999. Northern hemisphere temperatures during thepast millennium: Inferences, uncertainties and limitations. Geophysical Research Letters,Vol. 26, pp. 759-762.
Mann, M., R. Bradley, and M.K. Hughes. 1999. Northern hemisphere temperaturesduring the past millennium: Inferences, uncertainties, and limitations. GeophysicalResearch Letters, Vol. 26, No. 6, pp. 759-762.
139
Mantua, N.J., S.R. Hare, Y. Zhang, J.M. Wallace, and R.C. Francis. 1997. A Pacificdecadal climate oscillation with impacts on salmon. Bulletin of the AmericanMeteorological Society, Vol. 78, pp. 1069-1079.
Martinec, J. A. Rango, and R. Roberts. 1992. Rainfall-snowmelt peaks in a warmerclimate. In R. Herrman (ed.) Managing Water Resources During Global Change.American Water Works Association 28th Annual Conference and Symposium, Reno,Nevada. AWRA, Maryland. Pp. 195-202.
Matalas, N.C. and M.B. Fiering. 1977. Water resource systems planning. In NationalResearch Council. Climate, Climatic Change, and Water Supply. National Academy ofSciences, Washington, DC.
McCabe, G.J. 1996. Effects of winter atmospheric circulation on temporal and spatialvariability in annual streamflow in the western United States. Hydrological SciencesJournal, Vol. 41, pp. 873-888.
McCabe, G.J., A.G. Fountain, and M. Dyurgerov. 2000. Variability in winter massbalance of northern hemisphere glaciers and relations with atmospheric circulation.Arctic, Antarctic, and Alpine Research, Vol. 32, No. 1, pp. 64-72.
McCabe, G.J. and L.E. Hay. 1995, Hydrologic effects of hypothetical climate changes onwater resources in the East River basin, Colorado. Hydrological Sciences Journal, Vol. 40,pp. 303-318.
McCabe, G.J. and D.R. Legates. 1995. Relations between atmospheric circulation andsnowpack accumulations in the western United States. International Journal ofClimatology, Vol. 15, pp. 517-530.
McCabe, G.J. and D.M. Wolock. 1999. General-circulation-model simulations of futuresnowpack in the western United States. Journal of the American Water ResourcesAssociation. Vol. 35, No. 6, pp. 1473-1484.
McCormick, M.J. 1990. Potential changes in thermal structure and the cycle of LakeMichigan due to global warming. Transactions of the Amerian Fisheries Society, Vol. 119,pp. 183-194.
McKnight, D. and A. Covich (editors). 1997. Regional assessment of climate change andfreshwater ecosystems. Hydrological Processes, Vol. 11, pp. 819 - 1067.
McMahon, T.A., R.J. Nathan, B.L. Finlayson, and A.T. Haines. 1989. Reservoir systemperformance and climatic change. In G.C. Dandy and A.R. Simpson (eds.) Proceedingsof the National Workshop on Planning and Management of Water Resource Systems: Riskand Reliability. Canberra. Australian Government Publishing Service, Canberra,Australia. Pp. 106-124.
140
Meehl, G.A., F. Zwiers, J. Evans, T. Knutson, L. Mearns, P. Whetton. 2000. Trends inextreme weather and climate events. Issues related to modeling extremes in projections offuture climate change. Bulletin of the American Meteorological Society. Vol. 81, No. 3,pp. 427–436.
Melak, J.M., J. Dozier, C.R. Goldman, D. Greenland, A.M. Milner, and R.J. Naiman.1997. Effects of climate change on inland waters of the Pacific Coastal Mountains andwestern Great Basin. Hydrological Processes, Vol. 11, No. 8, pp. 971-991.
Meyer, J.L. 1997. Stream health: incorporating the human dimension to advance streamecology. Journal of the North American Benthological Society, Vol. 16, pp. 439-447.
Meyer, J.L., M. J. Sale, P.J. Mulholland, and N.L. Poff. 1999. Impacts of climate changeon aquatic ecosystem functioning and health. Journal of the American Water ResourcesAssociation, Vol. 35, pp. 1373 - 1386.
Meyer, J.L. and W.M. Pulliam. 1992. Modifications of terrestrial-aquatic interactions by achanging climate. In P. Firth and S.G. Fisher (editors). Global Climate Change andFreshwater Ecosystems, Springer Verlag, New York. pp. 177 – 191.
Miles, E.L., A.K. Snover, A.F. Hamlet, B. Callahan, and D. Fluharty. 2000. PacificNorthwest regional assessment: The impacts of climate variability and climate change onthe water resources of the Columbia River Basin. Journal of the American Water ResourcesAssociation. Vol. 36, No. 2, pp. 399-420.
Miller, B. 1993. Sensitivity of the TVA reservoir and power supply systems to changes inmeteorology. In Proceedings of the First National Conference on Climate Change andWater Resources Management, (T.M. Ballentine and E.Z. Stakhiv, editors), IWR Report93-R-17 U.S. Army Corps of Engineers, Institute for Water Resources, Ft. Belvoir, VI. Pp.II70-II84.
Miller, J.R., G.L. Russell, and S.C. Van Blarcum. 1992. The effects of climate change onmonthly river runoff. In R. Herrman (ed.) Managing Water Resources During GlobalChange. American Water Works Association 28th Annual Conference and Symposium,Reno, Nevada. AWRA, Maryland. pp. 175-183.
Miller, N.L., J. Kim, R.K. Hartman, and J. Farrar. 1999. Downscaled climate andstreamflow study of the southwestern United States. Journal of the American WaterResources Association. Vol. 35, No. 6, pp. 1525-1538.
Mimikou, M., P.S. Hadjisavva, Y.S. Kouvopoulos, and H. Afrateos. 1991. Regionalclimate change impacts: II. Impacts on water management works. Hydrological SciencesJournal, Vol. 36, pp. 259-270.
Minobe, S. 1997. A 50-70 year climatic oscillation over the North Pacific and NorthAmerica. Geophysical Research Letters, Vol. 24, pp. 683-686.
141
MMWR (Morbidity and Mortality Weekly Report). 1999. Summary of notifiablediseases, United States, 1998. December 31, Vol. 47, No. 53, pp. 1-93. Available viahttp://www.cdc.gov/epo/mmwr/preview/mmwrhtml/mm4753al.htm
Moore, R.D. and I.G. McKendry. 1996. Spring snowpack anomaly patterns and winterclimatic variability: British Columbia, Canada. Water Resources Research, Vol. 32, pp.623-632.
Moore, M.V., M.L. Pace, J.R. Mather, P.S. Murdoch, R.W. Howarth, C.L. Folt, C.Y.Chen, H.F. Hemond, P.A. Flebbe, and C.T. Driscoll. 1997. Potential effects of climatechange on freshwater ecosystems of the New England/Mid-Atlantic Region. HydrologicalProcesses, Vol. 11, pp. 925-947.
Moss, R.H. and S.H. Schneider. 1997. Characterizing and communicating scientificuncertainty: Moving ahead from the IPCC Second Assessment. In S. Hassol and J.Katzenberger (editors), Elements of Change, Aspen Global Change Institute, Aspen,Colorado, pp. 90-135.
Moss, R.H. and S.H. Schneider. 1999. Towards consistent assessment and reporting ofuncertainties in the IPCC TAR: Initial recommendations for discussion by authors. DraftVersion 2, Intergovernmental Panel on Climate Change.
Motes, M.L., A. DePaola, D.W. Cook, J.E. Veazey, J.C. Hunsucker, W.E. Garthright, R.J.Blodgett, and S.J. Chirtel. 1998. Influence of water temperature and salinity on Vibriovulnificusin Northern Gulf and Atlantic Coast Oysters (Crassostrea virginica). Applied andEnvironmental Microbiology Vol. 64, No. 4, pp. 1459-1465.
Mulholland, P.J., G.R. Best, C.C. Coutant, G.M. Hornsberger, J.L. Meyer, P.J. Robinson,J.R. Stenberg, R.E. Turner, F. VeraHerrera, and R. Wetzel. 1997. Effects of climatechange on freshwater ecosystems of the south-eastern United States and the Gulf Coast ofMexico. Hydrological Processes, Vol. 11, pp. 949-970.
Murdoch, P.S. 1991. Chemical Budgets and Stream-Chemistry Dynamics of a HeadwaterStream in the Catskill Mountains of New York. U.S. Geological Survey Water ResourcesInvestigation Report 88-4035, Washington, D.C. 66 pp.
Murdoch, P.S., D.A. Burns, and G.B. Lawrence. 1998. Relation of climate change to theacidification of surface waters by nitrogen deposition. Environmental Science andTechnology, Vol. 32, pp. 1642-1647.
Murdoch, P.S., J.S. Baron, and T.L. Miller. 2000. Potential effects of climate change onsurface-water quality in North America. Journal of the American Water ResourcesAssociation. Vol. 36, No. 2, pp. 347-366.
Naiman, R.J. (editor). 1992. Watershed Management: Balancing Sustainability andEnvironmental Change. Springer-Verlag, New York.
Naiman, R.J., J.J. Magnuson, D.M. McKnight, and J.A. Stanford (editors). 1995. TheFreshwater Imperative: A Research Agenda. Island Press, Washington, D.C.
142
Nash. L. 1993. Environment and Drought in California 1987-1992: Impacts andImplications for Aquatic and Riparian Resources. Pacific Institute for Studies inDevelopment, Environment, and Security, Oakland, California (July).
Nash, L.L. and P.H. Gleick. 1991. The sensitivity of streamflow in the Colorado Basin toclimatic changes. Journal of Hydrology Vol. 125, pp. 221-241.
Nash, L.L. and P.H. Gleick. 1993. The Colorado River Basin and Climatic Change: TheSensitivity of Streamflow and Water Supply to Variations in Temperature andPrecipitation. U.S. Environmental Protection Agency, EPA230-R-93-009, Washington,D.C. 121 pp.
National Academy of Sciences. 1975. Understanding Climatic Change: A Program forAction. National Academy of Sciences, Washington, D.C.
National Research Council (NRC). 1992. Water Transfers in the West: Efficiency, Equity,and the Environment. National Academy Press. Washington, DC.
National Research Council (NRC). 1998. Decade-to-Century-Scale Climate Variabilityand Change: A Science Strategy. Panel on Climate Variability on Decade-to-CenturyTime Scales: Board on Atmospheric Sciences and Climate. National Academy Press,Washington, D.C.
National Research Council (NRC). 2000. Reconciling Observations of GlobalTemperature Change. National Academy Press, Washington, D.C.
National Weather Service (NWS). 1999. Hydrologic Information Center. (available onNOAA’s web site, http://www.nws.noaa.gov/oh/hic/flood_stats/index.html).
Nemec, J. and J.C. Schaake. 1982. Sensitivity of water resource systems to climatevariation. Hydrological Sciences Journal, Vol. 27, pp. 327-343.
Nicholls, N., G.V. Gruza, J. Jouzel, T.R. Karl, L.A. Ogallo, D.E. Parker. 1996. Observedclimate variability and change. Climate Change 1995: The Science of Climate Change.The Intergovernmental Panel on Climate Change, Working Group I Assessment.Cambridge University Press, pp. 133-192.
Nijssen, B., G.M. O’Donnell, A.F. Hamlet, and D.P. Lettenmaier. 2000. Hydrologicsensitivity of global rivers to climate change. In press, Climatic Change.
Noda, A. and T. Tokioka. 1989. “The effect of doubling the CO2 concentration onconvective and non-convective precipitation in a general circulation model with a simplemixed layer ocean.” Journal of the Meteorological Society of Japan, Vol. 67, pp. 1055-1067.
Oberdorfer, J.A. 1996. Numerical modeling of coastal discharge: Predicting the effects ofclimate change. In R.W. Buddemeier (editor) Groundwater Discharge in the CoastalZone. Proceedings of an International Symposium, Moscow, Russia 6-10 July 1996, pp.85-91.
143
O’Conner, R.E., B. Yarnal, R. Neff, R. Bord, N. Wiefek, C. Reenock, R. Shudak, C.L.Jocoy, P. Pacale, and C. G. Knight. 1999. Weather and climate extreme, climate change,and planning: Views of community water system managers in Pennsylvania’s SusquehannaRiver Basin. Journal of the American Water Resources Association. Vol. 35, No. 6, pp.1411-1420.
Oerlemans, J., B. Anderson, A. Hubbard, P. Huybrechts, T. Jóhannesson, W. H. Knap,M. Schmeits, A. P. Stroeven, R. S. W. van de Wal, J. Wallinga, Z. Zuo. 1998. Modellingthe response of glaciers to climate warming. Climate Dynamics, Vol. 14, pp. 267-274.
Office of Science and Technology Policy (OSTP). 1997. Climate Change: State ofKnowledge. Executive Office of the President, Washington, D.C.
Ojima, D., L. Garcia, E. Elgaali, K. Miller, T.G.F. Kittel, and J. Lackett. 1999. Potentialclimate change impacts on water resources in the Great Plains. Journal of the AmericanWater Resources Association. Vol. 35, pp. 1443-1454.
Olsen, J. R., J.R. Stedinger, N.C. Matalas, and E.Z. Stakhiv. 1999. “Climate variabilityand flood frequency estimation for the Upper Mississippi and Lower Missouri Rivers.”Journal of the American Water Resources Association Vol. 35, No. 6, pp. 1509-1524.
Osterkamp, T. 1994. Evidence for warming and thawing of discontinuous permafrost inAlaska. EOS, Transactions of the American Geophysical Union, Vol. 75, No. 44, pp. 85.
Osterkamp, T.E. and V.E. Romanovsky. 1996. Impacts of thawing permafrost as a resultof climatic warming. EOS, Transactions of the American Geophysical Union, Vol. 77, No.46, pp. F188.
Owens-Viani, L., A.K. Wong, and P.H. Gleick (editors). 1999. Sustainable Use of Water:California Success Stories. Pacific Institute Report, Pacific Institute for Studies inDevelopment, Environment, and Security. Oakland, California.
Panagoulia, D. and G. Dimou. 1996. Sensitivities of groundwater-streamflowinteratctions to global climate change. Hydrological Sciences Journal, Vol. 41, pp. 781-796.
Parmesan, C., N. Ryrholm, C. Stefanescu, J.K. Hill, C.D. Thomas, H. Descimon, B.Huntley; L. Kaila, J. Kullberg, T. Tammaru, W. J. Tennent, J.A. Thomas, M. Warren.1999. Poleward shifts in geographical ranges of butterfly species associated with regionalwarming. Nature, Vol. 399, pp. 579-583.
Patterson, J. 1999. A Canadian perspective on wetlands and carbon sequestration.National Wetlands Newsletter, Vol. 21, No. 2, pp. 3-4.
Patterson, D.T., J.K. Westbrook, R.J.V. Joyce, P.D. Lingren, and J. Rogasik. 1999. Weeds,insects, and diseases. Climatic Change, Vol. 43, pp. 711-727.
Peters, R.L. and T.E. Lovejoy (editors). 1992. Global Warming and Biological Diversity.Yale University Press, New Haven, Connecticut.
144
Piechota, T.C., J.A. Dracup, and R.G. Fovell. 1997. Western US streamflow andatmospheric circulation patterns during El Niño/Southern Oscillation. Journal ofHydrology, Vol. 201, pp. 249-271.
Poff, N.L, P.L. Angermeier, S.D. Cooper, P.S. Lake , K.D. Fausch, K.O. Winemiller, L.A.K.Mertes, M.W. Oswood, J.Reynolds, and F.J. Rahel. 2000. Global change and stream fishdiversity. In O.E. Sala, F.S. Chapin, and R. Huber-Sannwald (editors). Future Scenarios ofGlobal Biodiversity. Springer-Verlag (In press).
Poff, N.L. 1992. Regional hydrologic response to climate change: An ecologicalperspective. In P. Firth and S.G. Fisher (editors). Global Climate Change and FreshwaterEcosystems. Springer-Verlag, New York. pp. 88-115.
Poiani, K.A., C.W. Johnson, and T.G.F. Kittel. 1995. Sensitivity of prairie wetlands toincreased temperature and seasonal precipitation changes. Water Resources Bulletin, Vol.31, pp. 283-294.
Porter, K.G., P.A. Saunders, K.A. Haberyan, A.E. Macubbin, T.R. Jacobsen and R.E.Hodson. 1996. Annual cycle of autotrophic and heterotrophic production in a small,monomictic Piedmont lake. Limnology and Oceanography, Vol. 41, pp. 1041-1051.
Postel, S. 1997. Last Oasis: Facing Water Scarcity. Worldwatch Institute, W.W. Norton,New York.
Power, M. 1992. Hydrologic and trophic controls of seasonal algal blooms in northernCalifornia Rivers. Archiv fur Hydrobiologie, Vol. 125, pp. 385 - 410.
Power, M., A. Sun, G. Parker, W.E. Dietrich, and J.T. Wootton. 1995. Hydraulic foodchain models. BioScience, Vol. 45, pp. 159 - 167.
Rango, A. 1992. Worldwide testing of the snowmelt runoff model with applications forpredicting the effects of climate change. Nordic Hydrology, Vol. 23, No. 3, pp. 155-172.
Rango, A. 1997. The response of areal snow cover to climate change in a snowmelt-runoffmodel. Annals of Glaciology, Vol. 25, pp. 232-236.
Rango, A. and J. Martinec. 1994. Areal extent of seasonal snow cover in a changedclimate. Nordic Hydrology, Vol. 25, pp. 233-246.
Ray, G.C., B.P. Hayden, A.J. Bulger Jr., and M.G. McCormick-Ray. 1992. “Effects ofglobal warming on the biodiversity of coastal-marine zones. In R.L. Peters and T.E.Lovejoy (editors) Global Warming and Biological Diversity. Yale University Press, NewHaven, Connecticut, p. 91-104.
Reilly, J.M. 1999. Climate change and agriculture: The state of the scientific knowledge.Guest editorial. Climatic Change, Vol. 43, pp. 645-650.
Reilly, J.M. and D. Schimmelpfennig. 1999. Agricultural impact assessment,vulnerability, and the scope for adaptation. Climatic Change, Vol. 43, pp. 745-788.
145
Revelle, R.R. and P.E. Waggoner. 1983. Effects of a carbon dioxide-induced climaticchange on water supplies in the western United States. In Changing Climate, NationalAcademy of Sciences, National Academy Press, Washington, D.C.
Ritschard, R.L., J.F. Cruise, and L.U. Hatch. 1999. Spatial and temporal analysis ofagricultural water requirements in the Gulf Coast of the United States. Journal of theAmerican Water Resources Association Vol. 35, pp. 1585-1596.
Rind, D., R. Goldberg, J. Hansen, C. Rosenzweig, and R. Ruedy. 1990. Potentialevapotranspiration and the likelihood of future drought. Journal of Geophysical Review,Vol. 95, pp. 9983-10004.
Robinson, D.A., K.F. Dewey, and R.R. Heim, Jr. 1993. Global snow cover monitoring:An update. Bulletin of the American Meteorological Society, Vol. 74, pp. 1689-1696.
Rosenberg, N.J., D.J. Epstein, D. Wang, L. Vail, R. Srinivasan, and J.G. Arnold. 1999.Possible impacts of global warming on the hydrology of the Ogallala Aquifer. ClimaticChange, Vol. 42, pp. 677-692.
Rosenzweig, C. and M.L. Parry. 1994. Potential impact of climate change on world foodsupply. Nature, Vol. 367, pp. 133-138.
Rossel, F. and J. Garbrecht. 1999. Variability characteristics of monthly precipitation incentral Oklahoma. Journal of the American Water Resources Association Vol. 35, pp.1455-1462.
Rötter, R. and S.C. Van de Geijn. 1999. Climate change effects on plant growth, cropyield and livestock. Climatic Change, Vol. 43, pp. 651-681.
Rounsevell, M.D.A., S.P. Evans, and P. Bullock. 1999. Climate change and agriculturalsoils: impacts and adaptation. Climatic Change, Vol. 43, pp. 683-709.
Rouse, R.W., M.S. V. Douglas, R.E. Hecky, A.E. Hershey, G.W. Kling, L. Lesack, P.Marsh, M. McDonald, B.J. Nicholson, N.T. Roulet, and J.P. Smol. 1997. Effects ofclimate change on the freshwaters of Arctic and Subarctic North America. HydrologicalProcesses, Vol. 11, pp. 873-902.
Rudd, J.W. 1995. Sources of methyl mercury to aquatic ecosystems: A review. Water, Airand Soil Pollution, Vol. 80, pp. 697-713.
Sandstrom, K. 1995. Modeling the effects of rainfall variability on groundwater rechargein semi-arid Tanzania. Nordic Hydrology, Vol. 26, pp. 313-320.
San Francisco Bay Conservation and Development Commission (SFBCDC). 1988. SeaLevel Rise: Predictions and Implications for San Francisco Bay. SF BCDC, San Francisco,California. (October 1988 revision).
146
Sapiano, J. J., Harrikson, W. D., and K.A. Echelmeyer. 1998: Elevation, volume andterminus changes of nine glaciers in North America. Journal of Glaciology, Vol. 44, pp.119-135.
Schaake, J.C. 1990. From climate to flow. In P.E. Waggoner (editor) Climate Change andU.S. Water Resources, J. Wiley and Sons, New York, pp. 177-206.
Schilling, K.E. 1987. Water Resources: The State of the Infrastructure. Report to theNational Council on Public Works Improvement. Washington, DC.
Schilling, K.E. and E. Stakhiv. 1998. Summary and commentary. Water ResourcesUpdate, Issue No. 112, pp. 1-5.
Schindler, D.W. 1997. Widespread effects of climatic warming on freshwater ecosystemsin North America. Hydrological Processes, Vol. 11, No. 8, pp. 1043-1067.
Schneider, S.H., P.H. Gleick, L.O. Mearns. 1990. Prospects for climate change. In P.E.Waggoner (ed.) Climate Change and U.S. Water Resources. J. Wiley and Sons, Inc. NewYork, pp. 41-73.
Schubert, M., J. Perlwitz, R. Blender, K. Fraedrich, and F. Lunkeit. 1998. NorthAtlantic cyclones in CO
2 -induced warm climate simulations. Frequency, intensity, and
tracks. Climate Dynamics, Vol. 14, 827–837.
Schwartz, M.D. and B.E. Reiter. 2000. Changes in North American spring.International Journal of Climatology (in press).
Seacrest, S., R. Kuzelka, and R. Leonard. 2000. Global climate change and publicperception: The challenge of translation. Journal of the American Water ResourcesAssociation Vol. 36, pp. 253-263.
Sharma, M.L. 1989. Impact of climate change on groundwater recharge. In Proceedings ofthe Conference on Climate and Water. Volume I. September 11-15, Helsinki, Finland.Valtion Painatuskeskus, pp. 511-520.
Shiklomanov, I.A. 2000. World Freshwater Resources. State Hydrological Institute, St.Petersburg, Russia. CD-ROM available from the International Hydrological Program ofUNESCO, Paris, France.
Shuter, B.J. and J.R. Post. 1990. Climate, population viability, and the zoogeography oftemperature fishes. Transactions of the American Fisheries Society, Vol. 119. pp. 316-336.
Slack, J.R. and J.M. Landwehr. 1992. Hydro-climatic data network (HCDN): A U.S.Geological Survey streamflow data set for the United States for the study of climatevariations, 1874-1988. U.S. Geological Survey Open-File Report 92-129, 193p.
147
Solley, W.R., R. Pierce, and H.A. Perlman. 1998. Estimated Use of Water in the UnitedStates in 1995. U.S. Geological Survey Circular 1200. Denver, CO.
Sorenson, L.G., R. Goldberg, T.L. Root, and M.G. Anderson. 1998. Potential effects ofglobal warming on waterfowl populations breeding in the northern Great Plains. ClimaticChange, Vol. 40, pp. 343-369.
Srinivasan, R., Arnold, J. G., Muttiah, R. S., Walker, C., and P.T. Dyke. 1993. HydrologicUnit Model for the United States (HUMUS). In Advances in Hydro-science andEngineering. CCHE, School of Engineering, University of Mississippi, Oxford, MS.
Stakhiv, E. and K. Schilling. 1998. What can water managers do about global warming?Water Resources Update, Issue No. 112, pp. 33-40.
Stefan, H.G., M. Hondzo, X. Fang, J.G. Eaton, and J. McCormick. 1996. Simulatedlong-term temperature and dissolved oxygen characteristics of lakes in the north-centralUnited States and associated fish habitat limits. Limnology and Oceanography, Vol. 41,pp. 1124-1135.
Steiner, R.C. 1998. Climate change and municipal water use. Water Resources Update,Issue 112, Universities Council on Water Resources, pp. 51-54.
Stockle, C. O., Dyke, P. T., Williams, J. R., Jones, C. A., and N.J. Rosenberg. 1992a. Amethod for estimating direct and climatic effects of rising atmospheric carbon dioxide ongrowth and yield of crops: Part II — sensitivity analysis as three sites in the MidwesternU.S.A. Agricultural Systems Vol. 38, pp. 239-256.
Stockle, C. O., Williams, J. R., Rosenberg, N. J., and C.A. Jones. 1992b. A method forestimating direct and climatic effects of rising atmospheric carbon dioxide on growth andyield of crops: Part I — modification of the EPIC model for climate change analysis.Agricultural Systems Vol. 38, pp. 225-228.
Stockton, C.W. and W.R. Boggess. 1979. Geohydrological Implications of ClimateChange on Water Resource Development. U.S. Army Coastal Engineering ResearchCenter, Fort Belvoir, Virginia.
Sweeney, B.W., J.K. Jackson, J.D. Newbold, and D.H. Funk. 1992. Climate change andthe life histories and biogeography of aquatic insects in eastern North America. In P. Firthand S.G. Fisher (editors). Global Climate Change and Freshwater Ecosystems. SpringerVerlag. New York. pp. 143 – 176
Timmermann, A., J. Oberhuber, A. Bacher, M. Esch, M. Latif, and E. Roeckner. 1999.Increased El Niño frequency in a climate model forced by future greenhouse warming.Nature, Vol. 398, pp. 694-696.
Titus, J.G. 1986. Greenhouse effect, sea level rise, and coastal zone management. CoastalZone Management Journal, Vol. 14, pp. 147-172.
148
Titus, J.G. 1992. The costs of climate change to the United States. In S.K. Majumdar, B.Kalkstein, L.S. Yarnal, E.W. Miller, and L.M. Rosenfeld (eds.) Global Climate Change:Implications, Challenges and Mitigation Measures. Pennsylvania Academy of Sciences,Philadelphia, Pennsylvania.
Trenberth, K. and T. Hoar. 1996. The 1990-1995 El Niño-Southern Oscillation event:Longest on record. Geophysical Research Letters, Vol. 23, pp. 57-60.
U.K. Meteorological Office. 1999. 1999 Was Earth’s fifth warmest year. Report issuedDecember 16, 1999. Available at http://dailynews.yahoo.com/h/nm/19991216/sc/environment_weather_1.html.
United Nations Framework Convention on Climate Change (UNFCCC). 1992.International Legal Materials (ILM), Vol. 31, pp. 849. See also http://www.unfccc.de.
United Nations (UN). 1997. Convention on the Law of Non-Navigational Uses ofInternational Watercourses. Approved May 21, UN Doc. No. A/51/869. United NationsPublications, New York.
U.S. Army Corps of Engineers. 1991. The National Study of Water Management DuringDrought: A Research Assessment. IWR Report 91-NDS-3.
U.S. Army Corps of Engineers. 1994. Executive Summary of Lessons Learned During theCalifornia Drought (1987-1992). IWR Report 94-NDS-12.
U.S. Army Corps of Engineers. 1995. National Study of Water Management DuringDrought: The Report to Congress. IWR Report 94-NDS-12.
U.S. Army Corps of Engineers. 1996. National Inventory of Dams. Data available on theWorld Wide Web at URL http://corpsgeol.usace.army.mil/CECG/hq.html.
U.S. Army Corps of Engineers. 1998. Civil Works Program. IWR Report 98-R-3.Alexandria, VA.
U.S. Environmental Protection Agency (USEPA). 1989. The Potential Effects of GlobalClimate Change on the United States. Report to Congress. U.S. Environmentalprotection Agency, Office of Policy, Planning, and Evaluation, Washington, D.C.
U.S. Environmental Protection Agency (USEPA). 1996. National Water QualityInventory: 1996 Report to Congress. http://www.epa.gov/305b/execsum.html.
U.S.Geological Survey (USGS). 1987. “Hydrologic Unit Maps,” Rep. No. 2294. USGovernment Printing Office, Washington, DC.
U.S. Global Change Research Program (USGCRP). 2000. Climate Change and America:Overview Document. A Report of the National Assessment Synthesis Team. U.S. GlobalChange Research Program, Washington, D.C.
149
U.S. Senate. 1979. Carbon Dioxide Accumulation in the Atmosphere, Synthetic Fuelsand Energy Policy: A Symposium. Committee on Governmental Affairs. 96th Congress, 1st
Session. U.S. Government Printing Office, Washington, D.C.
U.S. Water Resources Council (USWRC). 1978. The Nation’s Water Resources 1975-2000: Second National Water Assessment. GPO. Washington, DC.
Vaccaro, J. 1992. Sensitivity of groundwater recharge estimates to climate variability andchange, Columbia Plateau, Washington. Journal of Geophysical Research, Vol. 93, pp.2821-2833.
Vickers, A. 1991. The emerging demand-side era in water management. American WaterWorks Association, Vol. 83, No. 10, pp. 38-43.
Vickers, A. 1999. The future of water conservation: Challenges ahead. Water ResourcesUpdate, Issue No. 114, Universities Council on Water Resources, pp. 49-51.
Vincent, L.A., X. Zhang, and W.D. Hogg. 1999. Maximum and minimum temperaturetrends in Canada for 1895-1995 and 1945-1995. Proceedings of the AmericanMeteorological Society 10th Global Change Studies, Dallas, Texas, pp. 95-98.
Vinnikov, K.Ya., A. Robock, N.A. Speranskaya, and C.A. Schlosser. 1996. Scales oftemporal and spatial variability of midlatitude soil moisture. Journal of GeophysicalResearch, Vol. 101, pp. 7163-7174.
Vinnikov, K.Y., A. Robock, R.J. Stouffer, J.E. Walsh, C.L. Parkinson, D.J. Cavalieri, J.F.B.Mitchell, D. Garrett, V.F. Zakharov. 1999. Global warming and Northern Hemispheresea ice extent. Science, Vol. 286, pp. 1934-1936.
Vogel, R.M., C.J. Bell, and N.M. Fennessey. 1997. Climate, streamflow and watersupply in the northeastern United States. Journal of Hydrology, No. 198, pp. 42-68.
Waggoner, P.E. (editor). 1990. Climate Change and U.S. Water Resources. John Wileyand Sons, Inc., New York.
Wallis, J.R., D.P. Lettenmaier, and E.F. Wood. 1991. A daily hydro-climatological dataset for the continental U.S. Water Resources Research, Vol. 27, pp. 1657-1663.
Ward, A.K., G.M. Ward, J. Harlin, and R. Donahoe. 1992. Geological mediation ofstream flow and sediment and solute loading to stream ecosystems due to climate change.In P. Firth and S.G. Fisher (editors). Global Climate Change and Freshwater Ecosystems.Springer Verlag. New York. pp. 116 – 142.
Weller, G. and P.A. Anderson (editors). 1998. Implications of Global Change in Alaskaand the Bering Sea Region. Proceedings of a Workshop, (June). The Center for GlobalChange and Arctic System Research, University of Alaska, Fairbanks.
150
Western Water Policy Review Advisory Commission. 1998. Water in the West: Challengefor the Next Century. National Technical Information Service. Springfield, VA.
Westman, W.E. and G.P. Malanson. 1992. Effects of climate change on Mediterranean-type ecosystems in California and Baja California. In R.L. Peters and T.E. Lovejoy(editors) Global Warming and Biological Diversity. Yale University Press, New Haven,Connecticut, pp. 258-276.
Wetherald, R.T. and S. Manabe. 1999. Detectability of summer dryness caused bygreenhouse warming. Climatic Change, Vol. 43, No. 3, pp. 495-511.
Wilby, R.L., L.E. Hay, W.J. Gutowski, R.W. Arritt, E.S. Takle, Z. Pan, G.H. Leavesley,and M.P. Clark. 2000. Hydrological responses to dynamically and statisticallydownscaled climate model output. Geophysical Research Letters (in press). Available athttp://wwwwbrr.cr.usgs.gov/projects/SW_precip_runoff/papers/grl.
Williams, P.B. 1985. An overview of the impact of accelerated sea level rise on SanFrancisco Bay. Project No. 256. Philip Williams and Associates, San Francisco,California.
Williams, P.H. 1987. The impacts of climate change on the salinity of San Francisco Bay.Philip Williams and Associates, San Francisco, California.
Winstanley, D. and S.A. Changnon. 1999. Long-term variations in seasonal weatherconditions important to water resources in Illinois. Journal of the American WaterResources Association Vol. 35, pp. 1421-1428.
Winter, T. 2000. The vulnerability of wetlands to climate change: A hydrologic landscapeperspective. Journal of the American Water Resources Association, Vol. 36, pp. 305-312.
Wolf, A.T., J.A. Natharius, J.J. Danielson, B.S. Ward, J. Pender. 1999. “International riverbasins of the world.” International Journal of Water Resources Development, Vol. 15, pp.387-427.
Wolock, D.M., G.J. McCabe, Jr., G.D. Tasker, and M.E. Moss. 1993. Effects of climatechange on water resources in the Delaware River basin. Water Resources Bulletin, Vol.29, pp. 475-486.
Wolock, D. M., and G.J. McCabe. 1999. Estimates of runoff using water-balance andatmospheric general circulation models. Journal of the American Water ResourcesAssociation Vol. 35, pp. 1341-1350.
Wood, A.W., D.P. Lettenmaier, and R.N. Palmer. 1997. Assessing climate changeimplications for water resources planning, Climatic Change, Vol. 37, pp. 203-228.
Yao, H. and A. Georgakakos. 2000. Assessment of Folsom Lake response to historical andpotential future climate scenarios, 2, Reservoir management. Journal of Hydrology (inreview). U.S. Geological Survey Open-File Report 00-336, 35p.

151
Yoshino, F. 1999. Studies on the characteristics of variation and spatial correlation of thelong-term annual runoff in the world rivers. Journal of Japan Society on Hydrology andWater Resources. Vol. 12, pp. 109-120.
Zwiers, F. W., and V. V. Kharin, 1998. Changes in the extremes of the climate simulatedby CCC GCM2 under CO
2 doubling. Journal of Climate, Vol. 11, pp. 2200–2222.