water system and disasters -...
TRANSCRIPT
Water System and Disasters Background Information Compiled for the 2009-2010 Update of the ABAG-Led Multi-Jurisdictional Local Hazard Mitigation Plan for the San Francisco Bay Area
The lifeline infrastructure commitment of the MJ-LHMP for the San Francisco Bay Area is to maintain Bay Area transportation and utility facilities and networks as vital lifelines during and following disasters, as well as in the functioning of our region and its economy. The objective of this specific water system update effort has been to identify effective strategies for increasing the safety and reliability of the Bay Area’s water supply system in disasters.
Key components of this effort have been: ♦ Describing the Water Supply System – Compiling information on the water supply
system, including system components and sources of water; ♦ Estimating Hazard Exposure – Overlay critical system components with various hazard
maps to identify systems at risk; ♦ Identifying Water System Interdependencies – Creating flow charts and diagrams to describe
the ways in which it interacts with other critical infrastructure to better estimate the ways that water supply can be disrupted due to a disaster;
♦ Assessment of Key Vulnerabilities – Convert disruption information to damage and associated loss estimates based on these probabilities.
♦ Assessing Mitigation Strategies – Develop a range of mitigation strategy priorities and associated benefit-cost information on the effectiveness of those strategies in various hazard scenarios.
♦ Identifying Implementation Mechanisms – Work with water districts, city water departments, public water utilities, and others to better reflect water supply disruption risks, mitigation strategies, and implementation priorities.
♦ Planning Process and Public Outreach – Ensure public participation and involvement in the priority setting process.
Each of these components has been integrated into the updated MJ-LHMP, either in Chapter 1: Infrastructure or in Appendix C. The Existing Water and Wastewater Systems The regional water and wastewater systems are managed by a network of public special districts, city and county departments, and private companies. There are over 100 water retailers and wholesalers in the Bay Area. While most wastewater collection and treatment is handled by cities and counties, some special districts treat wastewater. ABAG estimates that there are 32,000 miles each of water and sewer pipes.
Some communities within the Bay region derive their urban, suburban and rural water supplies from groundwater and surface waters within the nine-county region (Napa River, Russian River, Guadalupe River, numerous creeks and springs). Others rely on groundwater and surface waters that are imported from watersheds and basins outside the region (including the Tuolumne,
ABAG Earthquake & Hazards Program December 2009 1
Mokelumne, Sacramento, San Joaquin and Eel River watersheds). The State of California Water Project and the U.S. Bureau of Reclamation Central Valley Project are large suppliers of water to the Bay region.
The Bay Area contains over 400 watersheds, including a portion of the Sacramento/San Joaquin watershed system. Water is distributed from these watersheds via a series of open and closed conveyances within the region, and inter-regionally. A significant amount of annual supply is impounded in 260 major reservoirs and behind numerous small check dams scattered throughout the region. 75% of the water supplies for the Bay Area are from water agencies that obtain all or part of their water either (1) from aqueducts or canals passing through the Sacramento-San Joaquin Delta or (2) by extracting water from that Delta.
The Bay Area also contains a series of dedicated groundwater recharge areas where groundwater can accumulate for current and future use. Some groundwater recharge areas are employed to begin arresting the decline of groundwater levels in some basins, or to cope with salt water intrusion. These declines can, and do, lead to land subsidence, cones of depression, damaged infrastructure, and altered soil chemistry, which in turn can affect the region’s groundwater carrying capacity. Groundwater basins outside the region act as significant storage sites for some Bay Area water needs during dry years.
Conserved and recycled water is another source of water and estimates of its potential are provided in the State of California Water Plan and in a range of Urban Water Management Plans in the Bay Region. The State’s Recycled Water Task Force recently estimated that building additional water recycling plants could meet 30 percent of the region’s water needs by 2030. Recycled water in the region is used in a wide range of applications, including landscape irrigation, industrial cooling, and agricultural needs, as well as an environmental water source for wetlands restoration. The Department of Water Resources estimates that close to 50 million gallons per day (GPD) of recycled water is produced here, and planned projects have the potential to double this amount in ten years.
A typical water supply system consists of: ♦ water supply extraction and storage facilities, including pumps, dams, and reservoirs; ♦ water conveyance facilities, including aqueducts, canals, and associated pumps; ♦ water treatment facilities; and ♦ water distribution pipelines.
In addition, water agencies have maintenance, operations, and capital improvement groups, as well as staff involved in emergency response planning and disaster recovery.
The associated wastewater system consists of: ♦ sewer pipelines for wastewater collection; ♦ minimal or no pumping facilities (except for low-lying areas); and ♦ wastewater treatment facility.
The largest “customer” of the water supply is, in a way, the wastewater system. Similarly, the wastewater system exists because of the water supply system.
The water and wastewater agencies directly participating in this water supply and wastewater portion of the MJ- LHMP include several special districts: ♦ Alameda County Water District
ABAG Earthquake & Hazards Program December 2009 2
♦ Contra Costa Water District ♦ Dublin-San Ramon Services District ♦ East Bay Municipal Utility Dist. ♦ Mid-Peninsula Water District ♦ Montara Water & Sanitary Dist. ♦ Purissima Hills Water Dist. ♦ Santa Clara Valley Water Dist. ♦ Sewer Authority Mid-Coastside ♦ Solano Co. Water Agency ♦ Solano Irrigation District ♦ Vallejo Sanitation & Flood Control District ♦ Zone 7 Water Agency
The city and county water department representative on the committee overseeing this process has been the largest such entity, the San Francisco Public Utility District which operates the Hetch-Hetchy system.
Private companies partnering in this updated plan include: ♦ San Jose Water Company ♦ Cal Water Earthquake Hazards and the Bay Area Water and Wastewater Systems Examining the locations of dams, water and wastewater treatment facilities, and pipeline networks that make up the water supply and wastewater collection system, shows earthquakes to be the greatest hazard. Because these systems have to be located in urban areas to serve those communities, their general hazard exposure is similar to that of the areas they serve.
While 93.4% of critical water system facilities and 88.8% of critical wastewater system facilities are exposed to high ground shaking levels (peak accelerations of greater than 40% of gravity [g] with a 10% chance of being exceeded in the next 50 years), 68.1% of critical water system facilities and 67.5% of critical wastewater system facilities are exposed to extremely high shaking levels (60% g). In addition, 95.2% of pipelines are estimated to be exposed to high shaking levels (peak accelerations of greater than 40% g with a 10% chance of being exceeded in the next 50 years), and 62.8% are exposed to extremely high shaking levels (60% g). Thus, most of the mitigation strategies that follow deal with this hazard. While shaking will not damage pipelines in the same manner as buildings, the ground waves associated with shaking will damage those pipelines.
The ability of the levees in the Sacramento-San Joaquin Delta to withstand strong shaking is being studied, as discussed later in this report. The hazards associated with failure of these levees, both directly and indirectly, on the region’s water supply could be catastrophic. When faults rupture and generate earthquakes, that rupture can extend to the surface, rupturing aqueducts and pipelines. Existing state law prohibits the construction of structures intended for human occupancy across the trace of an active fault. However, water aqueducts and pipelines cross these faults. For example, if the Hayward fault ruptures from San Pablo Bay to its southern end near the Santa Clara County border, fault surface rupture could severely damage the Hetch-Hetchy aqueducts, the EBMUD aqueducts, the South Bay aqueduct, and numerous local
ABAG Earthquake & Hazards Program December 2009 3
pipelines. Some dams are also on or near faults. In some cases, local roads have been intentionally placed astride faults as a land-use decision to avoid the placement of buildings astride the fault. When this occurs, the water and sewer pipelines are placed in this same alignment.
Liquefaction occurs when loose, water-saturated, sand and silt behave like liquid quicksand when shaken in an earthquake. The exposure to liquefaction is far less than shaking. In addition, not all areas of very high susceptibility to liquefaction will actually behave like quicksand in any individual earthquake. A much higher percentage of wastewater (35.8%) than water (5.4%) facilities are located in the highest hazard categories for this hazard. As liquefaction results in buckling and bending of the ground, pipelines can be damaged. While the percentage of pipe distribution lines in these areas is only 5.9%, they tend to serve the largest population centers.
An ABAG analysis of damaged pipelines following the 1989 Loma Prieta earthquake indicated that pipelines in areas subject to liquefaction AND exposed to violent ground shaking were the most likely to have broken or leaked as a result of that earthquake. ABAG has estimated that there could be, for example, 7,800 pipeline breaks or major leaks in an earthquake on the Hayward fault (compared to 507 in the Loma Prieta earthquake). Rapid repair and replacement of these pipelines is essential to recovery from an earthquake.
Landslides can be generated as a result of earthquakes. This hazard is discussed with rainfall-induced landslides later in this document.
Tsunamis can be generated as a result of earthquake fault rupture or underground landslides triggered by earthquakes. After extensive modeling by a number of organizations, maps of the potential inundation areas impacted by tsunamis near the Bay or Pacific Ocean are being released in December 2009 for evaluation planning. The most at-risk areas are those bordering the Pacific Ocean and next to San Francisco Bay. An estimated 1.7% of critical water facilities and 16% of critical wastewater facilities are in these areas. Weather-Related Hazards and the Bay Area Water and Wastewater Systems The Bay Area has historically had a mild Mediterranean climate characterized by mild rainy winters and dry summers. Flooding and landsliding occurred during the wet season, while wildfires and drought occurred in the dry season.
Climate change has been shown to exacerbate all of these hazards. Thus, the region can expect more flooding and landsliding due to a more abrupt runoff in the spring, as well as increased potential for wildfires any time of year and multi-year drought conditions. Some wastewater treatment facilities may be subject to the threat of sea level rise.
Flooding can occur when occasional intense winter storms result in local stream flooding, as well as when particularly warm rains in the Sierras result in sudden snow melting. Flooding is a lesser hazard than earthquakes to the region’s water and wastewater systems. A significant 11.5% of the wastewater and 3.8% water critical facilities in the region are in the 100-year flood plain. While an estimated 3.7% of pipelines are in these areas, flooding of areas above pipelines is not a significant hazard because areas are not expected to be flooded for weeks at a time.
Occasionally strong winter storms can close roads in the Bay Area.
ABAG Earthquake & Hazards Program December 2009 4
Finally, warm storms in the Sierras can cause rapid snow melt, which can lead to high water levels that can damage levees in the Sacramento-San Joaquin Delta. Delta islands can also be flooded due to damage not associated with storms because of the poor quality of some Delta levees. In addition to these traditionally flood-prone areas, some portions of the region, particularly in the Bay-Delta, are actually below sea level and other areas are subject to sea level rise.
Landslides can be generated as a result of earthquakes or severe winter storms. While 23.1% of the region’s land is located in areas that are mostly active or ancient landslides, a much smaller percentage of the urban land (8.3%) and water and wastewater system pipelines (3.9%) are located in these hazardous areas. While 0.6% of the major wastewater facilities are located in these areas, 11% of the water facilities are located in these areas. However, erosion and siltation can also impact the storage capacity of critical reservoirs.
Wildfire hazards are shown in two separate hazard maps – the wildland-urban-interface fire threat (WUI) maps and the wildfire threat maps. The WUI maps show the wildfire threat in urban areas, while the wildfire threat maps focus on more rural areas.
Based on the WUI maps, an estimated 51.1% of the water and wastewater pipelines are in fire hazard areas, as well as 66.8% of the critical water facilities and 44.4% of the critical wastewater facilities. While only 4.5% of these areas have actually burned in the past 50 years, this indicates a build-up in fuel loads.
The wildfire threat maps indicate that 14.7% of the critical water facilities and only 1.5% of the critical wastewater facilities are in areas of high, very high, and extremely high wildfire threat, as well as 6% of the pipelines.
Drought in the Sierras, as well as the region itself, can cause water shortages because of the large dependency of the Bay Area on imported water. What would be a drought in other areas of the country is controlled in the Bay Area through the importation of water and the storage of water in reservoirs. Prolonged periods of drought cause additional drought-related problems, including crop losses and shortages of water for landscaping.
Drought can impact the entire Bay Area, not just one particular county or a few cities. In addition, shortages in precipitation in the Sierra Nevada can have a more pronounced impact on water supply in the region than a drought in the Bay Area itself because of the reliance of the region of water from the Tuolumne and Mokelumne watersheds. Thus, drought is not a hazard that can be depicted in map form.
Major droughts were in 1973, 1976, and 2009. Climate change is likely to increase the number and severity of future droughts. The magnitude of this change is currently unknown. There is no current data on the probability of drought that would be comparable to the USGS effort on earthquakes in the region, or the way 100-year flood maps are created. Such an effort has been promoted by the Western Governors’ Association as part of a National Integrated Drought Information System in a 2004 report, Creating a Drought Early Warning System for the 21st Century. In that report, WGA notes, “Droughts are as much a part of the weather and climate extremes as floods, hurricanes and tornadoes. Yet in marked contrast to the myriad federal programs that report, prevent and mitigate the damage of these other extreme events, we passively accept drought’s effects as an unavoidable natural hardship. This passive approach to droughts is manifested in our lack of a comprehensive federal drought policy: we respond to
ABAG Earthquake & Hazards Program December 2009 5
droughts through ad hoc, crisis management, rather than through proactive, coordinated strategies designed to mitigate the impacts. To address other natural disasters — floods, hurricanes, tornadoes, etc. — Congress enacted the Stafford Act, which gives clear roles and responsibilities to the various federal agencies and makes the Federal Emergency Management Agency (FEMA) the federal lead.” Thus, while long-term drought probabilities are not yet available, annual monitoring has started. See http://www.westgov.org/wga/publicat/nidis.pdf and http://www.drought.unl.edu/dm/monitor.html for more information. The lead federal agency is the U.S. Department of Agriculture. Most Bay Area water districts develop long-term water supply and management plans, including urban water shortage contingency analyses. The Executive Summary of the Integrated Regional Water Management Plan for the San Francisco Bay Area states that “the San Francisco Bay Area water, wastewater, flood protection and stormwater management agencies; cities and counties represented by the Association of Bay Area Governments (ABAG); and watershed management interests represented by the California Coastal Conservancy (CCC) and non-governmental environmental organizations signed a Letter of Mutual Understandings (LOMU) to develop an Integrated Regional Water Management Plan (IRWMP) for the San Francisco Bay Area.” According to that BA-IRWMP, “the Bay Area’s existing annual supplies are inadequate to meet projected demands during prolonged drought periods. As the population continues to grow - the gap between available supplies and customer demand will widen in the coming decades unless agencies have the resources to fully implement necessary actions. … Historically, conservation measures have proven to be effective at controlling Bay Area water use. Overall water use has only increased 1% since 1986 – despite a 23% increase in population.” Finally, the BA-IRWMP notes, “Many sources of supply for the Bay Area are limited in dry years. If the Bay Area experiences another multi-year drought similar to that of the 1987-1992 drought, the following supply reductions are expected for the region:
• 60% reduction in [State Water Project] SWP supplies • 25% reduction in [Central Valley Project] CVP supplies • 30% reduction in Tuolumne supplies [source of SF PUC supply] • 40% reduction in Mokelumne supplies [source of EBMUD water supply] • 50% +/- reduction in local supplies”
The IRWMP can be accessed at http://bairwmp.org/plan/bay-area-irwmp-document-1.
Lifeline System Interdependencies and Disaster Recovery As mentioned earlier, one of the main reasons for the interdependencies of infrastructure systems is that they tend to be geographically located in the same areas. For example, water, sewer, and natural gas pipelines tend to be under local roads. Communications and electrical cables are either located under those roads or adjacent to them. All have similar exposures to hazards that are related to serving the developed portions of the region.
However, in addition to geographic interdependencies, lifeline systems also have system interdependencies. Examples include the relatively flexible use of the transportation system to
ABAG Earthquake & Hazards Program December 2009 6
deliver water treatment chemicals to a water treatment facility and the short-term relatively inflexible use of the electric power system to run pumps at that water treatment facility. Such interdependent analyses therefore need to address the length of time required to restore various services or interdependences to a level adequate for recovery. The length of time of a disruption increases the impacts. However, typically, doubling the time of disruption more than doubles the impacts. In addition, the disruption of one infrastructure system delays the recovery of other systems because the infrastructure systems are not available. Thus, speeding recovery of infrastructure systems is particularly critical.
The following linkages between the water supply systems and other infrastructure lifeline systems are critical:
Water ◄-► Transportation – (◄ = needed by water from transportation; ►= needed from water by transportation) ◄-► Co-location hazard exposure of distribution pipelines beneath roads ◄ Transport of repair and maintenance vehicles to locations for repairing pipelines ◄ Transport of repair, customer service, and operations facility crews to-and-from their homes ◄ Delivery of chemicals to water treatment facilities ◄ Delivery of fuel to run critical facilities ◄ Delivery of emergency drinking water in bags to customers at emergency distribution points ► Water for concrete construction and dust control
Water ◄-► Telecommunications – (◄ = needed by water from telecommunications; ►= needed from water by telecom) ◄-► Co-location hazard exposure of distribution pipelines beneath roads with cable and underground wiring; above ground networks also aligned with roads (and thus pipeline corridors) ◄ Automated systems and process control equipment for treatment and operations ◄ Communication with repair and maintenance crews ◄ Communication with customers for repair and maintenance requests ◄ Emergency communications with emergency operations centers ► Water for communication equipment cooling systems
Water ◄-► Petroleum, natural gas, and electrical systems – (◄ = needed by water from energy systems; ►= needed from water by energy systems) ◄-► Co-location hazard exposure of natural gas and some other fuel lines beneath roads, as well as electric power lines both beneath and adjacent to road corridors ◄ Gasoline and lubricants for use in repair and maintenance vehicles repairing pipelines ◄ Gasoline and lubricants for vehicles of repair, customer service, and operations facility crews to-and-from their homes ◄ Electric power for pump and lift stations, treatment plant operations, and control systems ◄ Fuel to run back-up generators at some critical facilities ► Water for refinery production, pumps, compressors, cooling, emissions reduction, and fire suppression ► Water for electric power plant operations, including cooling and emissions reduction The following figure shows these linkages.
ABAG Earthquake & Hazards Program December 2009 7
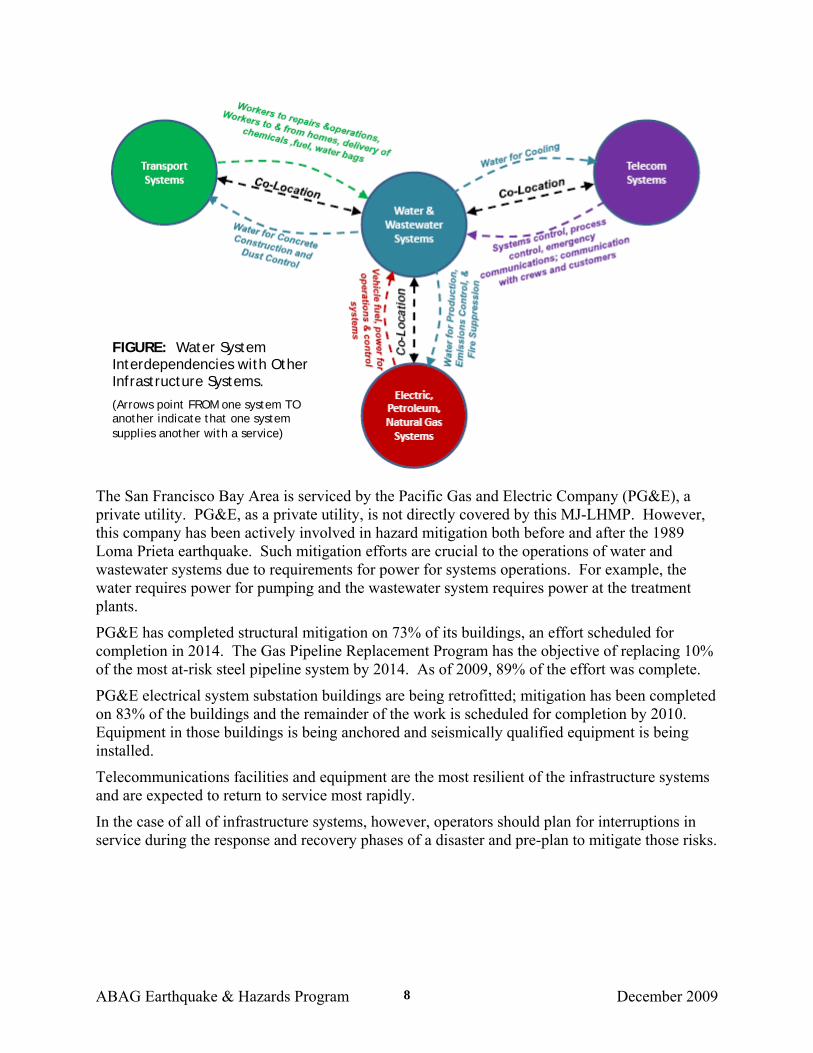
FIGURE: Water System Interdependencies with Other Infrastructure Systems.
(Arrows point FROM one system TO another indicate that one system supplies another with a service)
The San Francisco Bay Area is serviced by the Pacific Gas and Electric Company (PG&E), a private utility. PG&E, as a private utility, is not directly covered by this MJ-LHMP. However, this company has been actively involved in hazard mitigation both before and after the 1989 Loma Prieta earthquake. Such mitigation efforts are crucial to the operations of water and wastewater systems due to requirements for power for systems operations. For example, the water requires power for pumping and the wastewater system requires power at the treatment plants.
PG&E has completed structural mitigation on 73% of its buildings, an effort scheduled for completion in 2014. The Gas Pipeline Replacement Program has the objective of replacing 10% of the most at-risk steel pipeline system by 2014. As of 2009, 89% of the effort was complete.
PG&E electrical system substation buildings are being retrofitted; mitigation has been completed on 83% of the buildings and the remainder of the work is scheduled for completion by 2010. Equipment in those buildings is being anchored and seismically qualified equipment is being installed.
Telecommunications facilities and equipment are the most resilient of the infrastructure systems and are expected to return to service most rapidly.
In the case of all of infrastructure systems, however, operators should plan for interruptions in service during the response and recovery phases of a disaster and pre-plan to mitigate those risks.
ABAG Earthquake & Hazards Program December 2009 8
Assessment of Key Water and Wastewater System Vulnerabilities (Accounting for Current Mitigation) The vulnerabilities of critical water systems are related to the components of these systems, that is: ♦ water supply extraction and storage facilities, including pumps, dams, and reservoirs; ♦ water conveyance facilities, including aqueducts, canals, and associated pumps; ♦ water treatment facilities; and ♦ water distribution pipelines.
Dams
Dams are critical for two reasons: (1) their catastrophic failure can kill many people and destroy homes and other structures downstream from the facility, and (2) the storage capacity is lost and not recovered until the dam is rebuilt (a lengthy process).
Dams built to hold the water in reservoirs can be damaged, due to a huge storm and associated runoff, an earthquake, or a terrorism event. Maps depicting the areas that might be inundated were prepared by the dam owners. No quantitative probability information is available for the Bay Area dam failure hazard, in part because when a dam in known to have a failure potential, the water level is reduced to allow for partial collapse without loss of water. For example, the SF PUC is currently operating Calaveras Reservoir at less than 30% of capacity to avoid a catastrophic release of water. Thus, the probability of failure resulting in damage is approaching zero. While dams have failed elsewhere, a dam has never failed in the Bay Area.
Dam owners and operators, under the regulation of the State Division of Safety of Dams, routinely inspect their facilities and reevaluate their safety in light of current engineering and seismology. Based on these assessments, EBMUD is retrofitting San Pablo Dam and Reservoir at a cost of $75 million dollars. The San Francisco PUC Calaveras Dam Replacement Project has an estimated total cost of $409 million dollars.
The potential direct property losses from catastrophic failure of these dams is enormous. The 2005 value of the property improvements in the San Pablo Dam inundation area alone is $1.9 billion. The 2005 value of the property improvements in the Calaveras Reservoir inundation area is $15.6 billion. In one respect, this loss underestimates the potential loss. Since a dam is most likely to fail as a result of ground shaking from a catastrophic earthquake, the combined impact of the two events, as noted in the section on infrastructure interdependencies, will be greater than the individual impact of either disaster on its own. On the other hand, the losses will be minimal when the inundation depth is small (keeping in mind that, due to velocity, losses will exceed that of a “typical” flood to the same depth). However, due to the age of these maps, no reliable inundation depth information is available and thus this analysis could not be completed in a quantitative manner.
Critical Facilities
All water and wastewater special districts, as well as cities and counties, routinely take account of predicted earthquake forces in the design of new structures, including office and operations buildings, as well as wastewater and water treatment plants and conveyance networks.
ABAG Earthquake & Hazards Program December 2009 9
Bay Area residents have funded major improvements to the San Francisco PUC Hetch-Hetchy, EBMUD, and Contra Costa Water District (CCWD) systems, particularly related to storage tanks, treatment plants, and fault crossings. However, with these major systems, as well as with smaller agencies, the capital improvements budgets are limited. These financial issues are have been exacerbated by the 2008-09 recession.
The amount of effort and money currently being spent on the mitigation of the impacts of weather-related hazards is far less than for earthquake-related hazards due to the much lower exposure of water and wastewater facilities, storage tanks, aqueducts, and pipelines to these hazards. In addition, the potential disasters have tended to be less regional in scope, making the functioning of these systems less critical.
However, climate changes may greatly increase the potential need for additional funding. For example, because wastewater treatment plants tend to be located in the lowest areas of the region, planning has started to include adaptation to sea level rise on the part of these facility operators. In addition, water agencies have begun planning for water quality degradation.
The principal exception to this assessment is the potential for catastrophic flooding of islands in the Sacramento-San Joaquin Delta. The State Department of Water Resources has taken the lead in working with reclamation districts to strengthen those levees for flooding damage.
Landslides are not a major concern, in general, for water and wastewater systems. Damage tends to be localized. The exposure of these systems is similar to that of the transportation network. One solution is to install flexible pipelines in areas of past landslides as part of the capital improvements budget, a practice being implemented by water agencies and now being discussed by wastewater agencies. Pipelines
Pipelines break and leak as a result of earthquakes. An ABAG analysis of damaged pipelines following the 1989 Loma Prieta earthquake indicated that pipelines in areas subject to liquefaction AND exposed to violent ground shaking were the most likely to have broken or leaked as a result of that earthquake.
In 2009, ABAG re-estimated the number of kilometers (and miles) of water distribution pipeline based on assuming that all roads within a water supply retailer’s service area are underlain by a pipeline. (In the previous research performed by ABAG (Perkins and others, 2001), all roads were assumed to be underlain by a pipeline, which led to an overestimation of the number of kilometers of water distribution pipeline.)
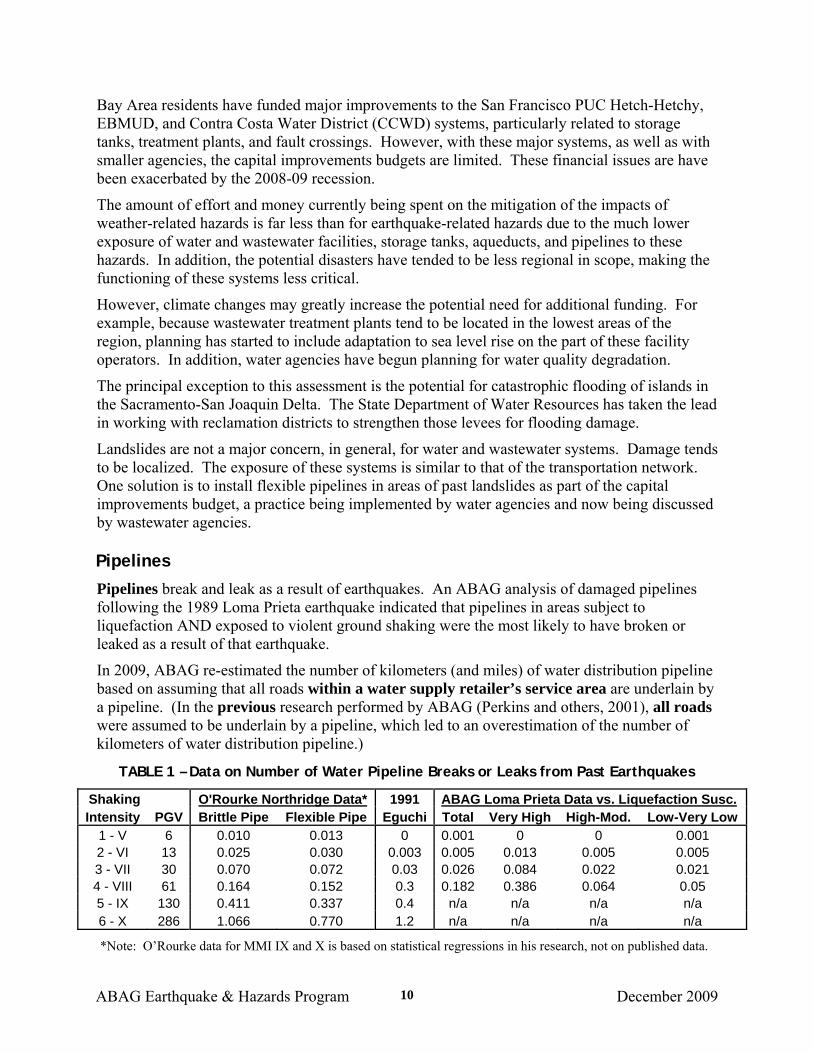
TABLE 1 – Data on Number of Water Pipeline Breaks or Leaks from Past Earthquakes
Shaking O'Rourke Northridge Data* 1991 ABAG Loma Prieta Data vs. Liquefaction Susc.Intensity PGV Brittle Pipe Flexible Pipe Eguchi Total Very High High-Mod. Low-Very Low
1 - V 6 0.010 0.013 0 0.001 0 0 0.001 2 - VI 13 0.025 0.030 0.003 0.005 0.013 0.005 0.005 3 - VII 30 0.070 0.072 0.03 0.026 0.084 0.022 0.021 4 - VIII 61 0.164 0.152 0.3 0.182 0.386 0.064 0.05 5 - IX 130 0.411 0.337 0.4 n/a n/a n/a n/a 6 - X 286 1.066 0.770 1.2 n/a n/a n/a n/a
*Note: O’Rourke data for MMI IX and X is based on statistical regressions in his research, not on published data.
ABAG Earthquake & Hazards Program December 2009 10
In addition, in 2009, ABAG has re-calculated the number of pipeline breaks associated with the Loma Prieta earthquake based on the 2006 liquefaction susceptibility mapping (Witter and others, 2006 versus the earlier Knudsen and others, 2000, mapping). The following table compares the number of pipeline breaks based on Eguchi (1991), Jeon and O’Rourke (2005), and ABAG (Perkins, 2001, updated 2009).
Based on pipeline repair rates determined by ABAG in the 1989 Loma Prieta earthquake, including damage due to shaking, liquefaction, landsliding, and fault rupture, the number of pipeline repairs would be approximately 6,000 in an earthquake on the Hayward fault (compared to 507 in the Loma Prieta earthquake). However, some pipeline materials, such as concrete asbestos and cast iron, are significantly more prone to breaking and leaking. In addition, if the earthquake occurs in the winter when the ground is saturated, many more repairs will be necessary than during the dry conditions present during the October Loma Prieta event or the extremely dry January Northridge event. These changes could increase the number of estimated repairs to 10,000 or more. Thus, the estimate for water pipeline repairs in a large Hayward fault earthquake is 6,000 to 10,000. This range is consistent with system-specific engineering evaluations conducted by water suppliers impacted by this East Bay earthquake.
There will be more leaks and breaks in sewer system collection pipelines because these pipes are more brittle.
Rapid repair and replacement of water and sewer pipelines is essential to recovery from an earthquake.
EBMUD, CCWD, and Santa Clara Valley Water District have installed, and SFPUC and Alameda County Water District are in the process of installing, shut-off valves in pipelines that cross active faults. These valves, installed on each side of the fault, enable above-ground potable water bypass lines to be rapidly installed.
The pipeline distribution systems for water and sewer lines typically have not been replaced since they were originally installed, in some cases almost 100 years ago. These pipelines will break and leak. Ways to mitigate this damage through repair and replacement of the most susceptible lines has started, but will not be completed for many years. Some water suppliers have also purchased equipment to bag water for customers if pipelines are broken. Response and Recovery Issues
Water and wastewater agencies have started to plan for speeding the repair and functional restoration of water and wastewater systems through joining the Water/Wastewater Agency Response Network (WARN). The plan is to stockpile shoring materials, temporary pumps, surface pipelines, portable hydrants, and other supplies.
ABAG’s Sewer Smart Program, with water and wastewater districts, has developed innovative materials to help the public cope with disrupted storm drains, sewer lines, and wastewater treatment. This program grew out of the exposure of the wastewater system to earthquake hazards and the information gap identified as part of this project.
ABAG Earthquake & Hazards Program December 2009 11
Delta Levees Delta levee failure probabilities, location, and extent The probability of levee failure is increasing over time, and is related to sea level rise, climate change impacting the likelihood that rapid snowmelt from a warm late-winter storm would cause flooding, and earthquake probabilities. Some researchers have estimated the likelihood of a multiple levee failure disaster at about 2% per year.
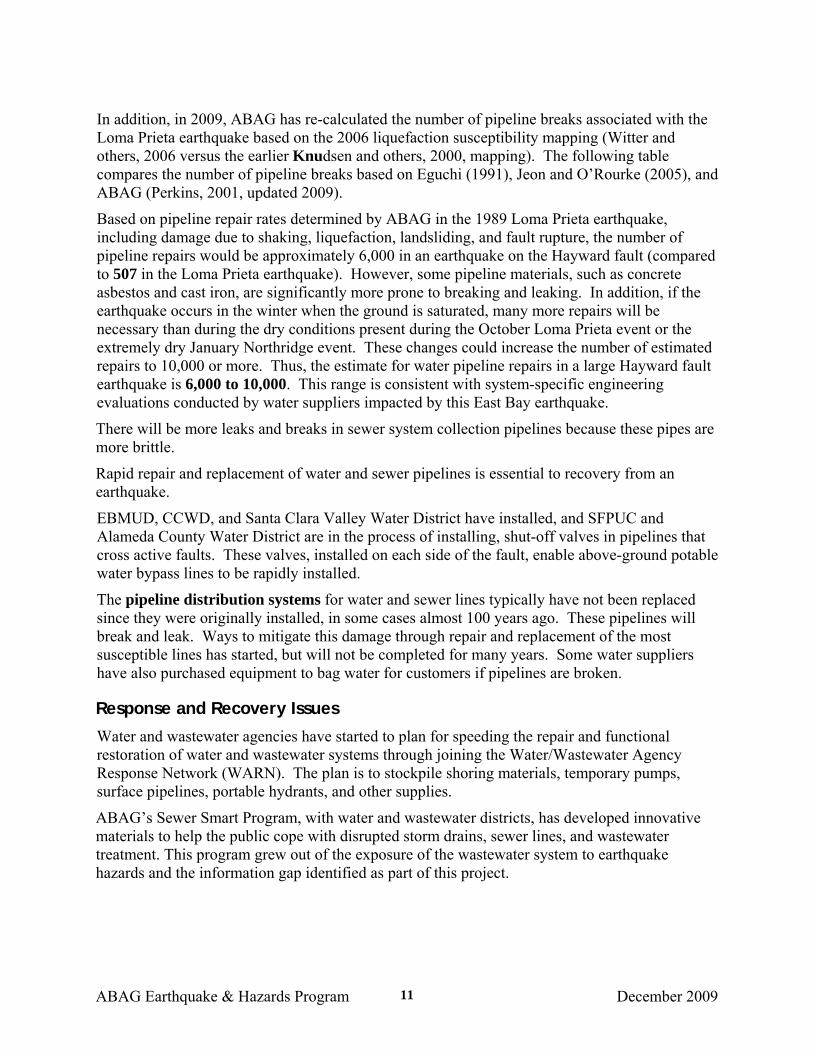
The DRMS performed a time-dependent Probabilistic Seismic Hazard Analysis (PSHA) that identified likely ground motions at six different locations (shown on Figure 1) around the Delta and their likely recurrence rate at selected times over the next 200 years. The study evaluated all faults that could impact the Delta including major Bay Area faults, Delta seismic sources, Coastal Ranges-Sierran Block (CRSB) boundary source zone, Cascadia subduction source zone, and background seismicity (shown on this map).
While Bay Area faults, including San Andreas, Hayward and Calaveras faults, are well characterized, little is known about the local faults in the Delta. The Delta faults have only exhibited a low-level pattern of scattered small earthquakes since 1966, but are still believed to be capable of moderate to strong earthquakes (M>6.0). There is no record of M>5.0 earthquakes on Delta faults, but based on geologic formations likely caused by earthquakes and subsurface seismic data, it is believed that earthquakes on these faults occur every couple thousand years.
Similarly, seismic activity is inferred in the CRSB bmagnitude 6.5 earthquake is still possible in this zon
Much of the land in the Delta Region is below sea lemiles of levees in the Delta and 230 miles of levees levees started out 3 to 5 feet high and were constructthe last 130 years to protect farm land from floodingsea level rise and increased demand for land in the dincreased in length over the years. Today most of thecarry additional loads during flood events.
An earthquake is the single biggest risk the Delta Rlevees may fail and as many as 20 or more islands mresult in an economic impact of $15 billion or more
ABAG Earthquake & Hazards Program 12
Figure: Faults and Seismic Sources in the Delta Region (DRMS 2008, Figure 6-1)
oundary source zone and it is believed that a e.
vel and is protected by approximately 1,115 in the Suisun Marsh. The majority of these ed and maintained by local landowners in inundation. As a result of land subsidence, elta, these levees have been raised and se levees retain water 365 days a year, and
egion faces. If an earthquake occurs, ay be flooded instantaneously. This would
.
December 2009
Risk reduction strategies to prevent catastrophic failure were not explored in DRMS Phase 1, but they will be the focus of Phase 2 of the study, due to be completed in 2009. The Delta has become integral to our economic and environmental sustainability. In 2005, Assembly Bill 1200 required the Department of Water Resources (DWR) to evaluate the potential impact on Delta water supplies from a variety of hazards. Phase 1 of the Delta Risk Management Strategy (DRMS) was completed in 2008 in response to AB 1200 with the objective of determining whether current business-as-usual management and regulatory practices can sustain the Delta Region for the next 100 years. DRMS focused on evaluating the hazards of subsidence, earthquakes, floods, changes in precipitation, temperature and ocean levels, and a combination of these hazards.
Identifying the Seismic Hazard
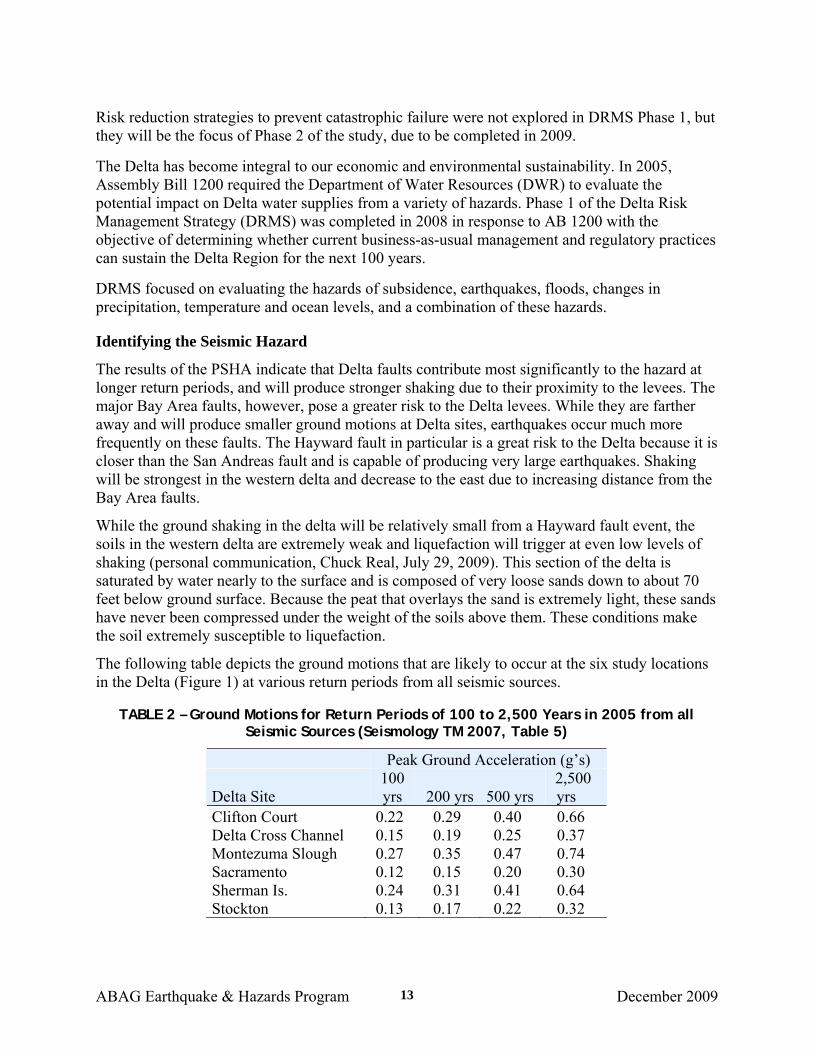
The results of the PSHA indicate that Delta faults contribute most significantly to the hazard at longer return periods, and will produce stronger shaking due to their proximity to the levees. The major Bay Area faults, however, pose a greater risk to the Delta levees. While they are farther away and will produce smaller ground motions at Delta sites, earthquakes occur much more frequently on these faults. The Hayward fault in particular is a great risk to the Delta because it is closer than the San Andreas fault and is capable of producing very large earthquakes. Shaking will be strongest in the western delta and decrease to the east due to increasing distance from the Bay Area faults.
While the ground shaking in the delta will be relatively small from a Hayward fault event, the soils in the western delta are extremely weak and liquefaction will trigger at even low levels of shaking (personal communication, Chuck Real, July 29, 2009). This section of the delta is saturated by water nearly to the surface and is composed of very loose sands down to about 70 feet below ground surface. Because the peat that overlays the sand is extremely light, these sands have never been compressed under the weight of the soils above them. These conditions make the soil extremely susceptible to liquefaction.
The following table depicts the ground motions that are likely to occur at the six study locations in the Delta (Figure 1) at various return periods from all seismic sources.
TABLE 2 – Ground Motions for Return Periods of 100 to 2,500 Years in 2005 from all Seismic Sources (Seismology TM 2007, Table 5)
Peak Ground Acceleration (g’s)
Delta Site 100 yrs 200 yrs 500 yrs
2,500 yrs
Clifton Court 0.22 0.29 0.40 0.66 Delta Cross Channel 0.15 0.19 0.25 0.37 Montezuma Slough 0.27 0.35 0.47 0.74 Sacramento 0.12 0.15 0.20 0.30 Sherman Is. 0.24 0.31 0.41 0.64 Stockton 0.13 0.17 0.22 0.32
ABAG Earthquake & Hazards Program December 2009 13
The DRMS study also evaluated the hazard without considering Delta faults and found only a small reduction in potential ground motion over shorter return periods, further illustrating the importance of the Bay Area faults to the hazard in the Delta. Figure 4 at the end of this document related the seismic vulnerability of individual levees to ground shaking of 0.3g. It does not indicate whether ground motion less than 0.3g is sufficient to cause liquefaction.
Past occurrences of Bay Area Delta levee disasters While levees of Delta islands fail frequently, these occurrences typically are not on islands within the nine-county San Francisco Bay Area. Even with the Jones Tract levee failure, the island was not within the region. However, this failure almost caused the subsequent loss of both Mokelumne Aqueducts of East Bay MUD. Such occurrences are expected to occur more frequently based on an assessment of the Delta Risk Management Study (DRMS) and other researches. See Appendix D and http://quake.abag.ca.gov/mitigation/disaster-history.html for more specific information on the Jones Tract failure.
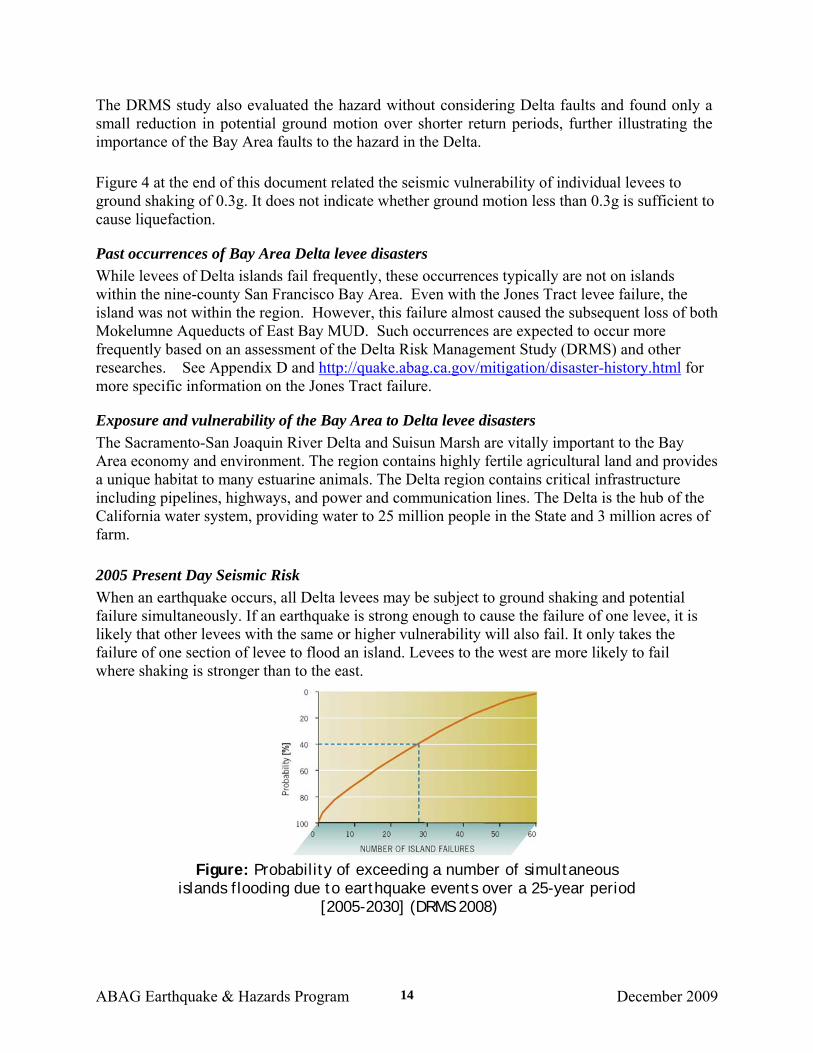
Exposure and vulnerability of the Bay Area to Delta levee disasters The Sacramento-San Joaquin River Delta and Suisun Marsh are vitally important to the Bay Area economy and environment. The region contains highly fertile agricultural land and provides a unique habitat to many estuarine animals. The Delta region contains critical infrastructure including pipelines, highways, and power and communication lines. The Delta is the hub of the California water system, providing water to 25 million people in the State and 3 million acres of farm. 2005 Present Day Seismic Risk When an earthquake occurs, all Delta levees may be subject to ground shaking and potential failure simultaneously. If an earthquake is strong enough to cause the failure of one levee, it is likely that other levees with the same or higher vulnerability will also fail. It only takes the failure of one section of levee to flood an island. Levees to the west are more likely to fail where shaking is stronger than to the east.
Figure: Probability of exceeding a number of simultaneous
islands flooding due to earthquake events over a 25-year period [2005-2030] (DRMS 2008)
ABAG Earthquake & Hazards Program December 2009 14
The seismicity of the Delta Region is characterized as moderate to high as a result of the active Bay Area faults. The USGS predicts a 62% chance that a magnitude 6.7 or greater earthquake will occur in the Bay Area in the next 30 years.
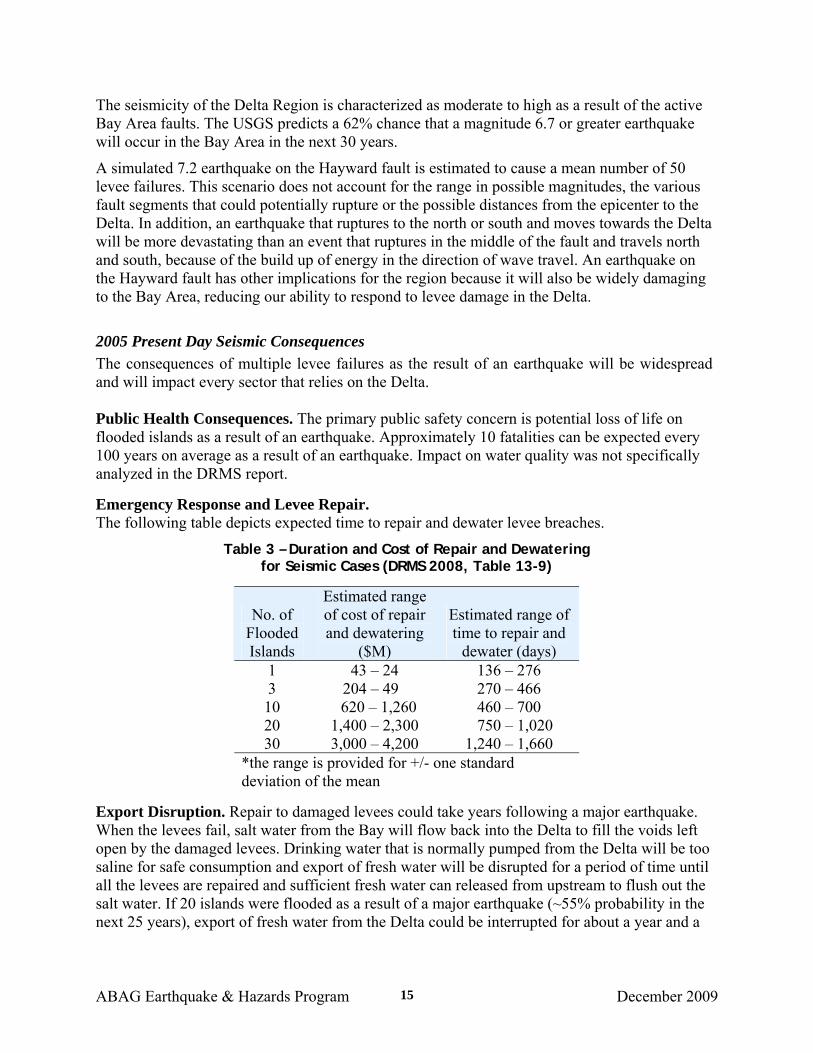
A simulated 7.2 earthquake on the Hayward fault is estimated to cause a mean number of 50 levee failures. This scenario does not account for the range in possible magnitudes, the various fault segments that could potentially rupture or the possible distances from the epicenter to the Delta. In addition, an earthquake that ruptures to the north or south and moves towards the Delta will be more devastating than an event that ruptures in the middle of the fault and travels north and south, because of the build up of energy in the direction of wave travel. An earthquake on the Hayward fault has other implications for the region because it will also be widely damaging to the Bay Area, reducing our ability to respond to levee damage in the Delta. 2005 Present Day Seismic Consequences The consequences of multiple levee failures as the result of an earthquake will be widespread and will impact every sector that relies on the Delta. Public Health Consequences. The primary public safety concern is potential loss of life on flooded islands as a result of an earthquake. Approximately 10 fatalities can be expected every 100 years on average as a result of an earthquake. Impact on water quality was not specifically analyzed in the DRMS report. Emergency Response and Levee Repair. The following table depicts expected time to repair and dewater levee breaches.
Table 3 – Duration and Cost of Repair and Dewatering for Seismic Cases (DRMS 2008, Table 13-9)
No. of Flooded Islands
Estimated range of cost of repair and dewatering
($M)
Estimated range of time to repair and
dewater (days) 1 0,043 – 240,0 136 – 276 3 0,204 – 490,0 270 – 466 10 0620 – 1,260 460 – 700 20 1,400 – 2,300 0,750 – 1,020 30 3,000 – 4,200 1,240 – 1,660
*the range is provided for +/- one standard deviation of the mean
Export Disruption. Repair to damaged levees could take years following a major earthquake. When the levees fail, salt water from the Bay will flow back into the Delta to fill the voids left open by the damaged levees. Drinking water that is normally pumped from the Delta will be too saline for safe consumption and export of fresh water will be disrupted for a period of time until all the levees are repaired and sufficient fresh water can released from upstream to flush out the salt water. If 20 islands were flooded as a result of a major earthquake (~55% probability in the next 25 years), export of fresh water from the Delta could be interrupted for about a year and a
ABAG Earthquake & Hazards Program December 2009 15
half. Contra Costa Water District is particularly as risk because they lack alternative sources of drinking water outside of the Delta. Economic Consequences. When multiple levees fail in the Delta, the cost will be borne by the entire state. In the DRMS study, the economic consequences are quantified in terms of the economic cost (net costs to the state economy) and economic impacts (value of lost output, lost jobs, lost labor income, lost value income and indirect business taxes). The DRMS study indicates that due to an earthquake economic costs will exceed $20 billion and economic impacts will exceed $12 billion once every 90 years on average. The economic consequences will depend primarily on number of flooded islands, which islands have flooded, and the month in which the initiating event occurs. ABAG estimates the 2005 value of property improvements on the Delta islands within Contra Costa County as $1.4 billion, and the 2005 value of the property itself as $1.1 billion – far less than the potential economic impact of loss of the water supply. Ecological Consequences. For breach scenarios involving less than 10 breaches, a very small percentage of the total area of the vegetation types in the Delta are impacted. For breach scenarios with 20 breaches, greater losses are incurred for a vegetation types. Large numbers of delta breaches would also have significant impact on terrestrial wildlife because available habitat would be severely reduced.
Increasing Future Risks and Consequences – As the Delta moves ahead from 2005, several factors will drive changes that will affect the seismic vulnerability of the Delta. These include seismic activity, climate change, subsidence, and population growth and urbanization. Seismicity. The Bay Area has experienced a period of relatively low seismic activity since the 1906 San Francisco earthquake. As stress continues to build in the earth, we may experience greater seismic activity in the region in the near future. The DRMS study assumes that seismic activity will increase by 10% in 2050, 20% in 2100 and 40% in 2200. Climate Change. Rising sea levels as a result of global warming produce higher water levels on Delta levees as well as increase internal seepage, both of which will increase the probability that an earthquake will fail the levee. Warmer temperatures will also mean that more winter precipitation falls as rain rather than snow and more runoff will flow into the Delta earlier, adding to the demand on the levees. This study assumed that the levees would be raised to accommodate higher water, but does not assume any strengthening of the levees. Projections estimate that sea-levels will rise between 4 and 16 inches by 2050 and 8 inches and 4.6 feet in 2100. Subsidence. The ground surface in areas of the Delta-Suisun that have peat soils are expected to continue subsiding if current management practices do not change. Projections for total subsidence are up to 3 feet by 2050, 8 feet by 2100 and 17 feet by 2200, varying across the delta depending on the thickness of the organic layer. These scenarios place additional load on Delta levees as the height of water being held by the levee increases. Seepage through some of the levees will increase due to this additional load, making levees more vulnerable to earthquake loads.
ABAG Earthquake & Hazards Program December 2009 16
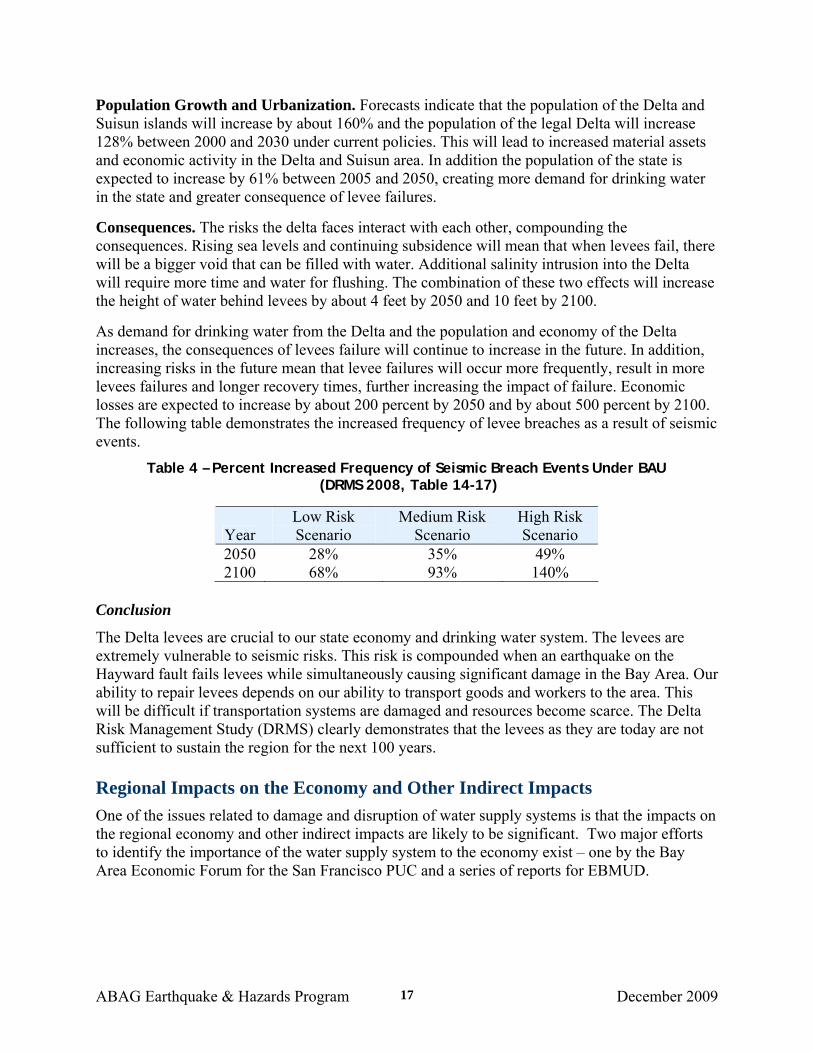
Population Growth and Urbanization. Forecasts indicate that the population of the Delta and Suisun islands will increase by about 160% and the population of the legal Delta will increase 128% between 2000 and 2030 under current policies. This will lead to increased material assets and economic activity in the Delta and Suisun area. In addition the population of the state is expected to increase by 61% between 2005 and 2050, creating more demand for drinking water in the state and greater consequence of levee failures. Consequences. The risks the delta faces interact with each other, compounding the consequences. Rising sea levels and continuing subsidence will mean that when levees fail, there will be a bigger void that can be filled with water. Additional salinity intrusion into the Delta will require more time and water for flushing. The combination of these two effects will increase the height of water behind levees by about 4 feet by 2050 and 10 feet by 2100. As demand for drinking water from the Delta and the population and economy of the Delta increases, the consequences of levees failure will continue to increase in the future. In addition, increasing risks in the future mean that levee failures will occur more frequently, result in more levees failures and longer recovery times, further increasing the impact of failure. Economic losses are expected to increase by about 200 percent by 2050 and by about 500 percent by 2100. The following table demonstrates the increased frequency of levee breaches as a result of seismic events.
Table 4 – Percent Increased Frequency of Seismic Breach Events Under BAU (DRMS 2008, Table 14-17)
Year Low Risk Scenario
Medium Risk Scenario
High Risk Scenario
2050 28% 35% 49% 2100 68% 93% 140%
Conclusion
The Delta levees are crucial to our state economy and drinking water system. The levees are extremely vulnerable to seismic risks. This risk is compounded when an earthquake on the Hayward fault fails levees while simultaneously causing significant damage in the Bay Area. Our ability to repair levees depends on our ability to transport goods and workers to the area. This will be difficult if transportation systems are damaged and resources become scarce. The Delta Risk Management Study (DRMS) clearly demonstrates that the levees as they are today are not sufficient to sustain the region for the next 100 years.
Regional Impacts on the Economy and Other Indirect Impacts One of the issues related to damage and disruption of water supply systems is that the impacts on the regional economy and other indirect impacts are likely to be significant. Two major efforts to identify the importance of the water supply system to the economy exist – one by the Bay Area Economic Forum for the San Francisco PUC and a series of reports for EBMUD.
ABAG Earthquake & Hazards Program December 2009 17
The Bay Area Economic Forum produced a 2002 report on the impact of this earthquake on Hetch-Hetchy Water and the Bay Area Economy1, estimating that the losses associated with failure of that system alone would be $17.2 billion.
The report on Hetch-Hetchy Water and the Bay Area Economy hints at the importance of water to the region and the potential impacts of drought and population growth. That report notes on page 5 that:
Based on conditions during the most recent drought period, SFPUC now has determined that the maximum quantity of water it can reliably deliver to its customer base is 239 mgd annually. However, actual demand in 2000-2001 was nearly 260 mgd, and it is generally understood that the SFPUC system is operating in excess of its assured supply capacity and approaching its actual delivery capacity.
Total demand for Hetch Hetchy water is expected to grow to 303 mgd in 2030 and 310 mgd by 2050. Absent a significant expansion of the system, the shortfall relative to assured supply will therefore increase from 21 mgd presently to 64 mgd within 30 years and 71mgd within 50 years.
A report by Goettel & Horner, Inc. for the East Bay Municipal Utility District in 1994 looked at the costs of water disruptions to the Bay Area economy due to several earthquakes, including a magnitude 7 Hayward event. The losses were as high as $1.7 billion to the Gross Regional Product of the East Bay (in 1994 dollars). These projected losses were also calculated before the extensive improvements to the water system conducted by EMBUD since 1994.
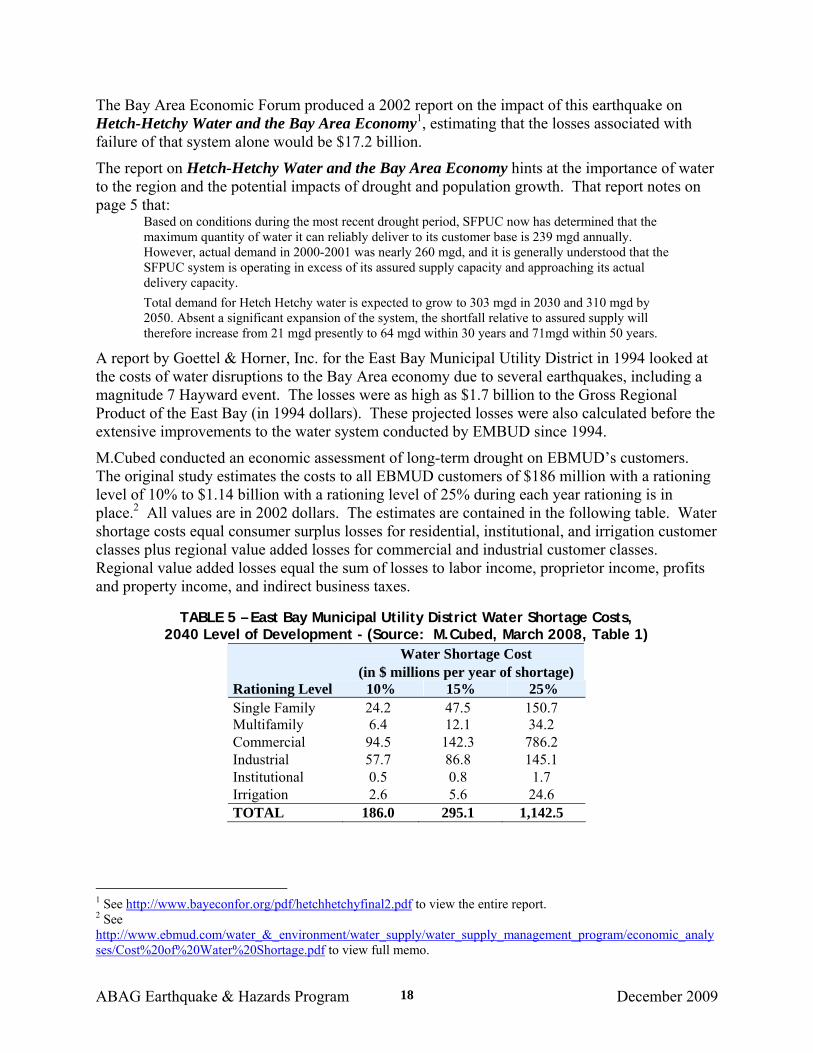
M.Cubed conducted an economic assessment of long-term drought on EBMUD’s customers. The original study estimates the costs to all EBMUD customers of $186 million with a rationing level of 10% to $1.14 billion with a rationing level of 25% during each year rationing is in place.2 All values are in 2002 dollars. The estimates are contained in the following table. Water shortage costs equal consumer surplus losses for residential, institutional, and irrigation customer classes plus regional value added losses for commercial and industrial customer classes. Regional value added losses equal the sum of losses to labor income, proprietor income, profits and property income, and indirect business taxes.
TABLE 5 – East Bay Municipal Utility District Water Shortage Costs, 2040 Level of Development - (Source: M.Cubed, March 2008, Table 1)
Water Shortage Cost (in $ millions per year of shortage)
Rationing Level 10% 15% 25% Single Family 24.2 47.5 150.7 Multifamily 6.4 12.1 34.2 Commercial 94.5 142.3 786.2 Industrial 57.7 86.8 145.1 Institutional 0.5 0.8 1.7 Irrigation 2.6 5.6 24.6 TOTAL 186.0 295.1 1,142.5
1 See http://www.bayeconfor.org/pdf/hetchhetchyfinal2.pdf to view the entire report. 2 See http://www.ebmud.com/water_&_environment/water_supply/water_supply_management_program/economic_analyses/Cost%20of%20Water%20Shortage.pdf to view full memo.
ABAG Earthquake & Hazards Program December 2009 18
Mitigation Strategy Assessment and Implementing Agencies The mitigation strategies developed for the 2005 MJ-LHMP were re-examined and an overall regional priority assigned to each. This process is described more fully later in this document.
Certain Mitigation Practices Apply to All Hazards. There are various steps that cities, counties, and infrastructure providers take to mitigate the hazards posed by multiple disasters. For example, all large-scale disasters can cause problems due to
interdependencies and common issues of reoccupancy and recovery. Other actions may specifically relate to one type of infrastructure, but can mitigate multiple hazards. Finally, infrastructure providers, cities, and counties all need to communicate with the public.
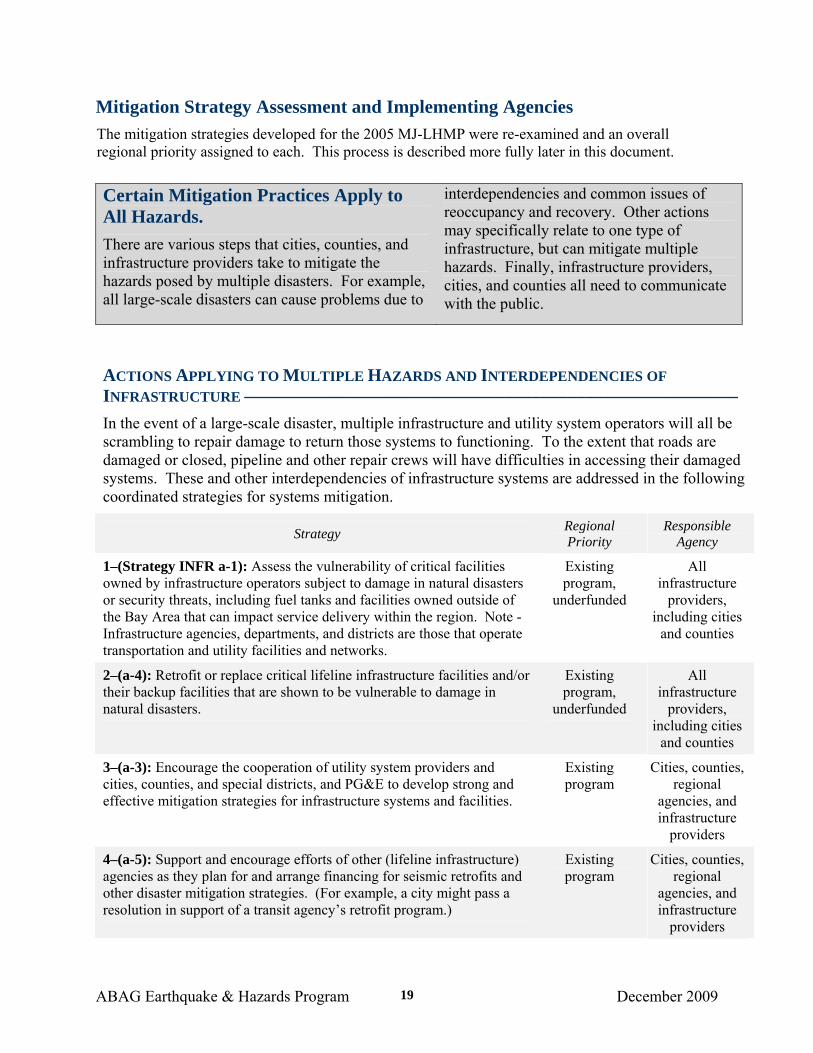
ACTIONS APPLYING TO MULTIPLE HAZARDS AND INTERDEPENDENCIES OF INFRASTRUCTURE ––––––––––––––––––––––––––––––––––––––––––––––––––––––– In the event of a large-scale disaster, multiple infrastructure and utility system operators will all be scrambling to repair damage to return those systems to functioning. To the extent that roads are damaged or closed, pipeline and other repair crews will have difficulties in accessing their damaged systems. These and other interdependencies of infrastructure systems are addressed in the following coordinated strategies for systems mitigation.
Strategy Regional Priority
Responsible Agency
1–(Strategy INFR a-1): Assess the vulnerability of critical facilities owned by infrastructure operators subject to damage in natural disasters or security threats, including fuel tanks and facilities owned outside of the Bay Area that can impact service delivery within the region. Note - Infrastructure agencies, departments, and districts are those that operate transportation and utility facilities and networks.
Existing program,
underfunded
All infrastructure
providers, including cities
and counties
2–(a-4): Retrofit or replace critical lifeline infrastructure facilities and/or their backup facilities that are shown to be vulnerable to damage in natural disasters.
Existing program,
underfunded
All infrastructure
providers, including cities
and counties
3–(a-3): Encourage the cooperation of utility system providers and cities, counties, and special districts, and PG&E to develop strong and effective mitigation strategies for infrastructure systems and facilities.
Existing program
Cities, counties, regional
agencies, and infrastructure
providers
4–(a-5): Support and encourage efforts of other (lifeline infrastructure) agencies as they plan for and arrange financing for seismic retrofits and other disaster mitigation strategies. (For example, a city might pass a resolution in support of a transit agency’s retrofit program.)
Existing program
Cities, counties, regional
agencies, and infrastructure
providers
ABAG Earthquake & Hazards Program December 2009 19
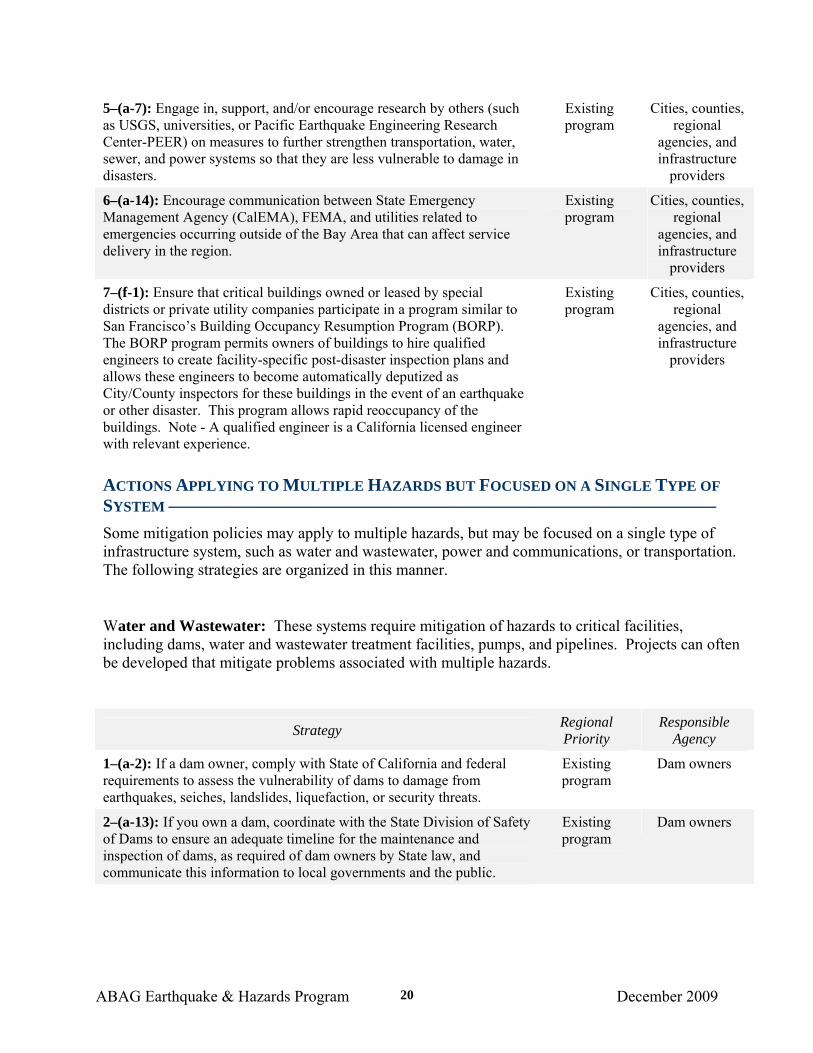
5–(a-7): Engage in, support, and/or encourage research by others (such as USGS, universities, or Pacific Earthquake Engineering Research Center-PEER) on measures to further strengthen transportation, water, sewer, and power systems so that they are less vulnerable to damage in disasters.
Existing program
Cities, counties, regional
agencies, and infrastructure
providers
6–(a-14): Encourage communication between State Emergency Management Agency (CalEMA), FEMA, and utilities related to emergencies occurring outside of the Bay Area that can affect service delivery in the region.
Existing program
Cities, counties, regional
agencies, and infrastructure
providers
7–(f-1): Ensure that critical buildings owned or leased by special districts or private utility companies participate in a program similar to San Francisco’s Building Occupancy Resumption Program (BORP). The BORP program permits owners of buildings to hire qualified engineers to create facility-specific post-disaster inspection plans and allows these engineers to become automatically deputized as City/County inspectors for these buildings in the event of an earthquake or other disaster. This program allows rapid reoccupancy of the buildings. Note - A qualified engineer is a California licensed engineer with relevant experience.
Existing program
Cities, counties, regional
agencies, and infrastructure
providers
ACTIONS APPLYING TO MULTIPLE HAZARDS BUT FOCUSED ON A SINGLE TYPE OF SYSTEM ––––––––––––––––––––––––––––––––––––––––––––––––––––––––––––– Some mitigation policies may apply to multiple hazards, but may be focused on a single type of infrastructure system, such as water and wastewater, power and communications, or transportation. The following strategies are organized in this manner.
Water and Wastewater: These systems require mitigation of hazards to critical facilities, including dams, water and wastewater treatment facilities, pumps, and pipelines. Projects can often be developed that mitigate problems associated with multiple hazards.
Strategy Regional Priority
Responsible Agency
1–(a-2): If a dam owner, comply with State of California and federal requirements to assess the vulnerability of dams to damage from earthquakes, seiches, landslides, liquefaction, or security threats.
Existing program
Dam owners
2–(a-13): If you own a dam, coordinate with the State Division of Safety of Dams to ensure an adequate timeline for the maintenance and inspection of dams, as required of dam owners by State law, and communicate this information to local governments and the public.
Existing program
Dam owners
ABAG Earthquake & Hazards Program December 2009 20
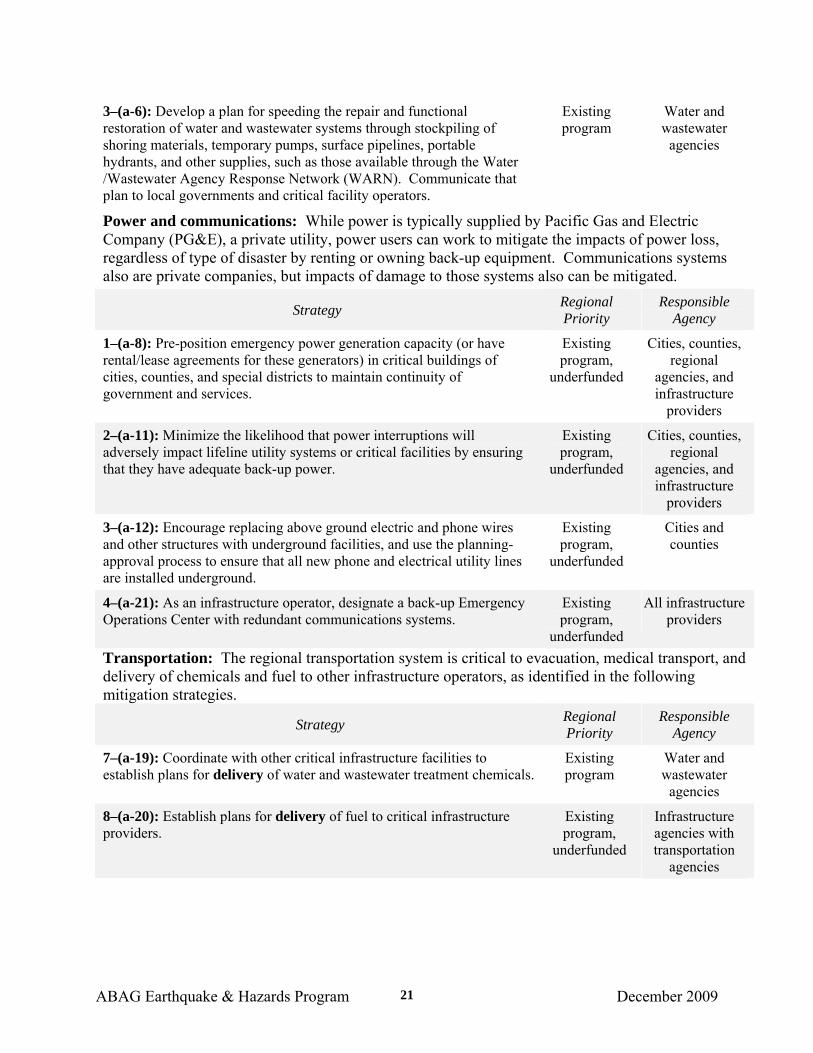
3–(a-6): Develop a plan for speeding the repair and functional restoration of water and wastewater systems through stockpiling of shoring materials, temporary pumps, surface pipelines, portable hydrants, and other supplies, such as those available through the Water /Wastewater Agency Response Network (WARN). Communicate that plan to local governments and critical facility operators.
Existing program
Water and wastewater
agencies
Power and communications: While power is typically supplied by Pacific Gas and Electric Company (PG&E), a private utility, power users can work to mitigate the impacts of power loss, regardless of type of disaster by renting or owning back-up equipment. Communications systems also are private companies, but impacts of damage to those systems also can be mitigated.
Strategy Regional Priority
Responsible Agency
1–(a-8): Pre-position emergency power generation capacity (or have rental/lease agreements for these generators) in critical buildings of cities, counties, and special districts to maintain continuity of government and services.
Existing program,
underfunded
Cities, counties, regional
agencies, and infrastructure
providers
2–(a-11): Minimize the likelihood that power interruptions will adversely impact lifeline utility systems or critical facilities by ensuring that they have adequate back-up power.
Existing program,
underfunded
Cities, counties, regional
agencies, and infrastructure
providers
3–(a-12): Encourage replacing above ground electric and phone wires and other structures with underground facilities, and use the planning-approval process to ensure that all new phone and electrical utility lines are installed underground.
Existing program,
underfunded
Cities and counties
4–(a-21): As an infrastructure operator, designate a back-up Emergency Operations Center with redundant communications systems.
Existing program,
underfunded
All infrastructure providers
Transportation: The regional transportation system is critical to evacuation, medical transport, and delivery of chemicals and fuel to other infrastructure operators, as identified in the following mitigation strategies.
Strategy Regional Priority
Responsible Agency
7–(a-19): Coordinate with other critical infrastructure facilities to establish plans for delivery of water and wastewater treatment chemicals.
Existing program
Water and wastewater
agencies
8–(a-20): Establish plans for delivery of fuel to critical infrastructure providers.
Existing program,
underfunded
Infrastructure agencies with transportation
agencies
ABAG Earthquake & Hazards Program December 2009 21
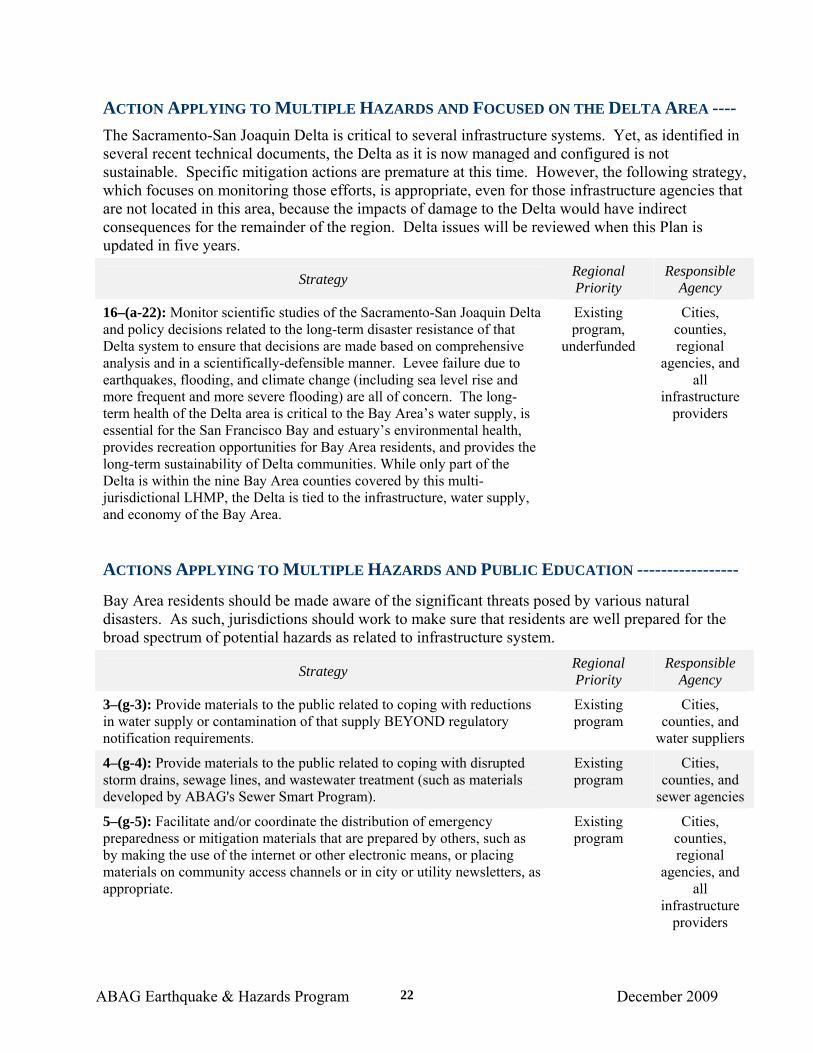
ACTION APPLYING TO MULTIPLE HAZARDS AND FOCUSED ON THE DELTA AREA ---- The Sacramento-San Joaquin Delta is critical to several infrastructure systems. Yet, as identified in several recent technical documents, the Delta as it is now managed and configured is not sustainable. Specific mitigation actions are premature at this time. However, the following strategy, which focuses on monitoring those efforts, is appropriate, even for those infrastructure agencies that are not located in this area, because the impacts of damage to the Delta would have indirect consequences for the remainder of the region. Delta issues will be reviewed when this Plan is updated in five years.
Strategy Regional Priority
Responsible Agency
16–(a-22): Monitor scientific studies of the Sacramento-San Joaquin Delta and policy decisions related to the long-term disaster resistance of that Delta system to ensure that decisions are made based on comprehensive analysis and in a scientifically-defensible manner. Levee failure due to earthquakes, flooding, and climate change (including sea level rise and more frequent and more severe flooding) are all of concern. The long-term health of the Delta area is critical to the Bay Area’s water supply, is essential for the San Francisco Bay and estuary’s environmental health, provides recreation opportunities for Bay Area residents, and provides the long-term sustainability of Delta communities. While only part of the Delta is within the nine Bay Area counties covered by this multi-jurisdictional LHMP, the Delta is tied to the infrastructure, water supply, and economy of the Bay Area.
Existing program,
underfunded
Cities, counties, regional
agencies, and all
infrastructure providers
ACTIONS APPLYING TO MULTIPLE HAZARDS AND PUBLIC EDUCATION -----------------
Bay Area residents should be made aware of the significant threats posed by various natural disasters. As such, jurisdictions should work to make sure that residents are well prepared for the broad spectrum of potential hazards as related to infrastructure system.
Strategy Regional Priority
Responsible Agency
3–(g-3): Provide materials to the public related to coping with reductions in water supply or contamination of that supply BEYOND regulatory notification requirements.
Existing program
Cities, counties, and
water suppliers
4–(g-4): Provide materials to the public related to coping with disrupted storm drains, sewage lines, and wastewater treatment (such as materials developed by ABAG's Sewer Smart Program).
Existing program
Cities, counties, and
sewer agencies
5–(g-5): Facilitate and/or coordinate the distribution of emergency preparedness or mitigation materials that are prepared by others, such as by making the use of the internet or other electronic means, or placing materials on community access channels or in city or utility newsletters, as appropriate.
Existing program
Cities, counties, regional
agencies, and all
infrastructure providers
ABAG Earthquake & Hazards Program December 2009 22
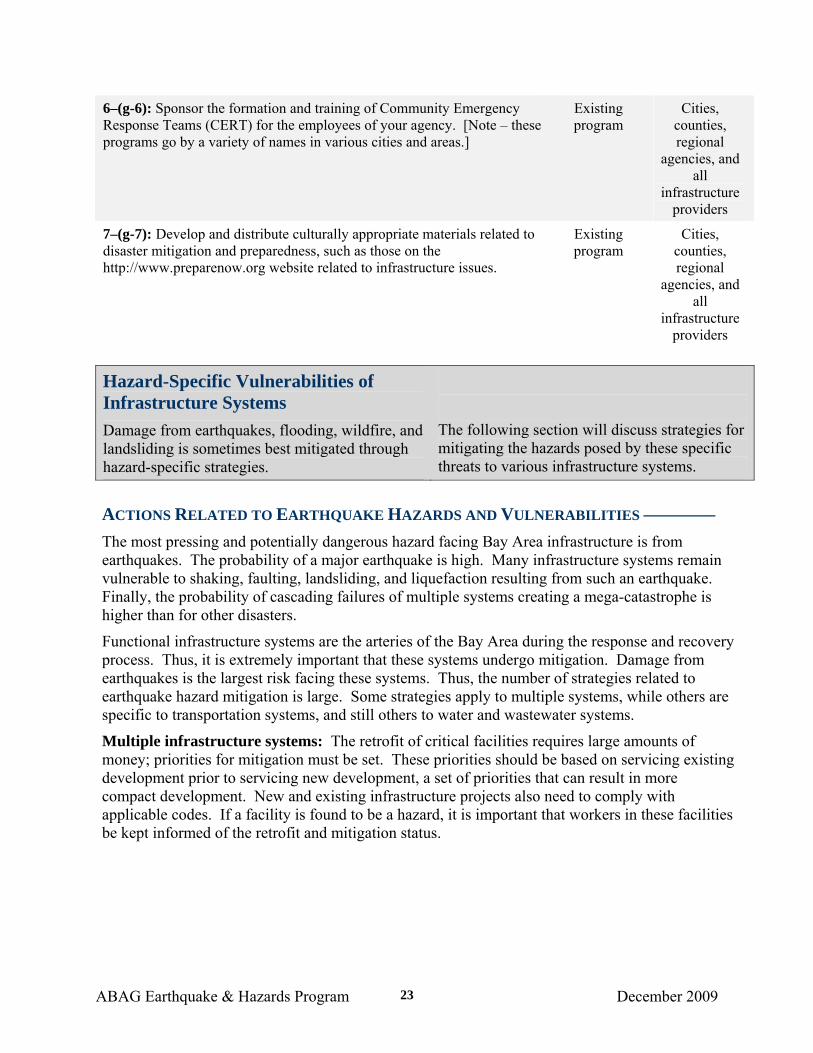
6–(g-6): Sponsor the formation and training of Community Emergency Response Teams (CERT) for the employees of your agency. [Note – these programs go by a variety of names in various cities and areas.]
Existing program
Cities, counties, regional
agencies, and all
infrastructure providers
7–(g-7): Develop and distribute culturally appropriate materials related to disaster mitigation and preparedness, such as those on the http://www.preparenow.org website related to infrastructure issues.
Existing program
Cities, counties, regional
agencies, and all
infrastructure providers
Hazard-Specific Vulnerabilities of Infrastructure Systems Damage from earthquakes, flooding, wildfire, and landsliding is sometimes best mitigated through hazard-specific strategies.
The following section will discuss strategies for mitigating the hazards posed by these specific threats to various infrastructure systems.
ACTIONS RELATED TO EARTHQUAKE HAZARDS AND VULNERABILITIES –––––––– The most pressing and potentially dangerous hazard facing Bay Area infrastructure is from earthquakes. The probability of a major earthquake is high. Many infrastructure systems remain vulnerable to shaking, faulting, landsliding, and liquefaction resulting from such an earthquake. Finally, the probability of cascading failures of multiple systems creating a mega-catastrophe is higher than for other disasters.
Functional infrastructure systems are the arteries of the Bay Area during the response and recovery process. Thus, it is extremely important that these systems undergo mitigation. Damage from earthquakes is the largest risk facing these systems. Thus, the number of strategies related to earthquake hazard mitigation is large. Some strategies apply to multiple systems, while others are specific to transportation systems, and still others to water and wastewater systems.
Multiple infrastructure systems: The retrofit of critical facilities requires large amounts of money; priorities for mitigation must be set. These priorities should be based on servicing existing development prior to servicing new development, a set of priorities that can result in more compact development. New and existing infrastructure projects also need to comply with applicable codes. If a facility is found to be a hazard, it is important that workers in these facilities be kept informed of the retrofit and mitigation status.
ABAG Earthquake & Hazards Program December 2009 23
Strategy Regional Priority
Responsible Agency
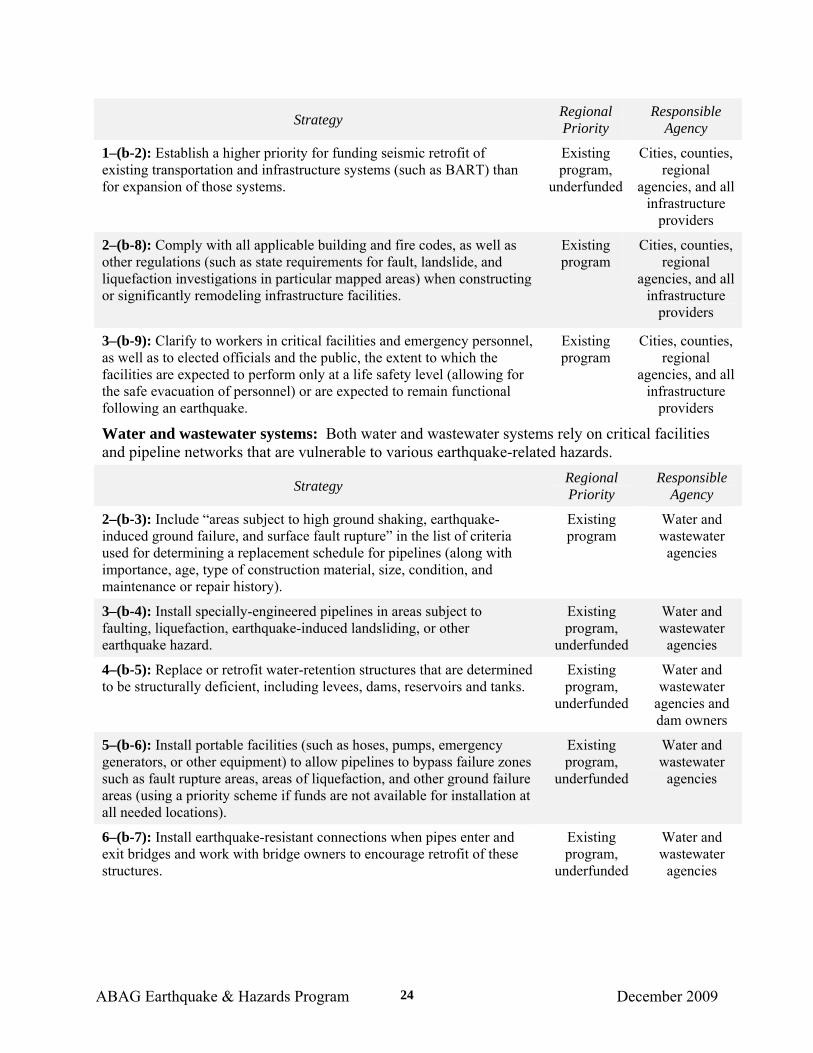
1–(b-2): Establish a higher priority for funding seismic retrofit of existing transportation and infrastructure systems (such as BART) than for expansion of those systems.
Existing program,
underfunded
Cities, counties, regional
agencies, and all infrastructure
providers
2–(b-8): Comply with all applicable building and fire codes, as well as other regulations (such as state requirements for fault, landslide, and liquefaction investigations in particular mapped areas) when constructing or significantly remodeling infrastructure facilities.
Existing program
Cities, counties, regional
agencies, and all infrastructure
providers
3–(b-9): Clarify to workers in critical facilities and emergency personnel, as well as to elected officials and the public, the extent to which the facilities are expected to perform only at a life safety level (allowing for the safe evacuation of personnel) or are expected to remain functional following an earthquake.
Existing program
Cities, counties, regional
agencies, and all infrastructure
providers
Water and wastewater systems: Both water and wastewater systems rely on critical facilities and pipeline networks that are vulnerable to various earthquake-related hazards.
Strategy Regional Priority
Responsible Agency
2–(b-3): Include “areas subject to high ground shaking, earthquake-induced ground failure, and surface fault rupture” in the list of criteria used for determining a replacement schedule for pipelines (along with importance, age, type of construction material, size, condition, and maintenance or repair history).
Existing program
Water and wastewater
agencies
3–(b-4): Install specially-engineered pipelines in areas subject to faulting, liquefaction, earthquake-induced landsliding, or other earthquake hazard.
Existing program,
underfunded
Water and wastewater
agencies
4–(b-5): Replace or retrofit water-retention structures that are determined to be structurally deficient, including levees, dams, reservoirs and tanks.
Existing program,
underfunded
Water and wastewater
agencies and dam owners
5–(b-6): Install portable facilities (such as hoses, pumps, emergency generators, or other equipment) to allow pipelines to bypass failure zones such as fault rupture areas, areas of liquefaction, and other ground failure areas (using a priority scheme if funds are not available for installation at all needed locations).
Existing program,
underfunded
Water and wastewater
agencies
6–(b-7): Install earthquake-resistant connections when pipes enter and exit bridges and work with bridge owners to encourage retrofit of these structures.
Existing program,
underfunded
Water and wastewater
agencies
ABAG Earthquake & Hazards Program December 2009 24
ACTIONS RELATED TO WILDFIRE AND STRUCTURAL FIRE HAZARDS AND VULNERABILITIES –––––––––––––––––––––––––––––––––––––––––––––––––––––
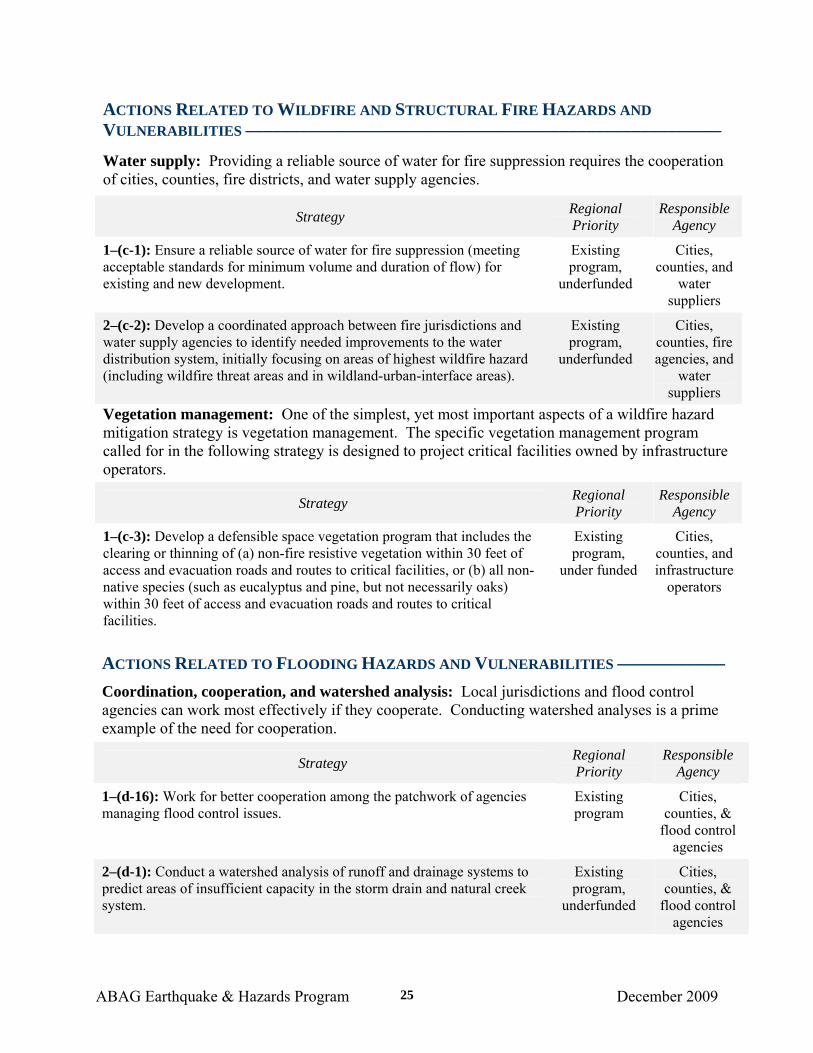
Water supply: Providing a reliable source of water for fire suppression requires the cooperation of cities, counties, fire districts, and water supply agencies.
Strategy Regional Priority
Responsible Agency
1–(c-1): Ensure a reliable source of water for fire suppression (meeting acceptable standards for minimum volume and duration of flow) for existing and new development.
Existing program,
underfunded
Cities, counties, and
water suppliers
2–(c-2): Develop a coordinated approach between fire jurisdictions and water supply agencies to identify needed improvements to the water distribution system, initially focusing on areas of highest wildfire hazard (including wildfire threat areas and in wildland-urban-interface areas).
Existing program,
underfunded
Cities, counties, fire agencies, and
water suppliers
Vegetation management: One of the simplest, yet most important aspects of a wildfire hazard mitigation strategy is vegetation management. The specific vegetation management program called for in the following strategy is designed to project critical facilities owned by infrastructure operators.
Strategy Regional Priority
Responsible Agency
1–(c-3): Develop a defensible space vegetation program that includes the clearing or thinning of (a) non-fire resistive vegetation within 30 feet of access and evacuation roads and routes to critical facilities, or (b) all non-native species (such as eucalyptus and pine, but not necessarily oaks) within 30 feet of access and evacuation roads and routes to critical facilities.
Existing program,
under funded
Cities, counties, and infrastructure
operators
ACTIONS RELATED TO FLOODING HAZARDS AND VULNERABILITIES –––––––––––– Coordination, cooperation, and watershed analysis: Local jurisdictions and flood control agencies can work most effectively if they cooperate. Conducting watershed analyses is a prime example of the need for cooperation.
Strategy Regional Priority
Responsible Agency
1–(d-16): Work for better cooperation among the patchwork of agencies managing flood control issues.
Existing program
Cities, counties, &
flood control agencies
2–(d-1): Conduct a watershed analysis of runoff and drainage systems to predict areas of insufficient capacity in the storm drain and natural creek system.
Existing program,
underfunded
Cities, counties, &
flood control agencies
ABAG Earthquake & Hazards Program December 2009 25
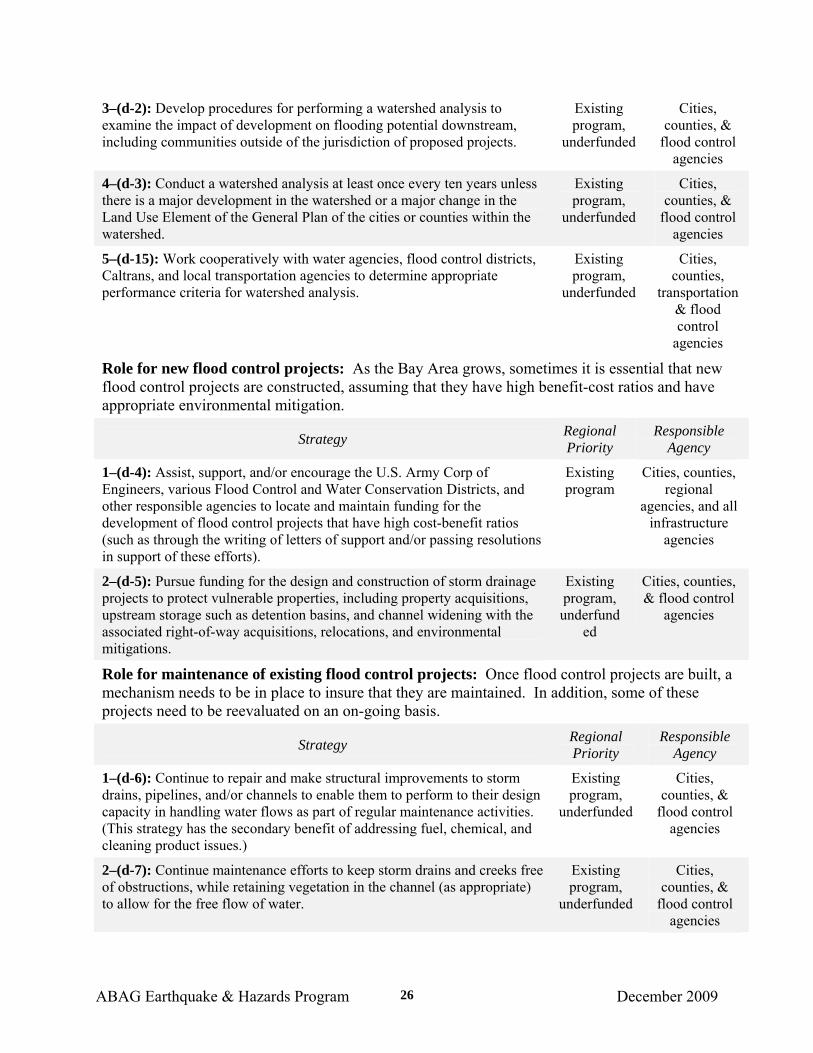
3–(d-2): Develop procedures for performing a watershed analysis to examine the impact of development on flooding potential downstream, including communities outside of the jurisdiction of proposed projects.
Existing program,
underfunded
Cities, counties, &
flood control agencies
4–(d-3): Conduct a watershed analysis at least once every ten years unless there is a major development in the watershed or a major change in the Land Use Element of the General Plan of the cities or counties within the watershed.
Existing program,
underfunded
Cities, counties, &
flood control agencies
5–(d-15): Work cooperatively with water agencies, flood control districts, Caltrans, and local transportation agencies to determine appropriate performance criteria for watershed analysis.
Existing program,
underfunded
Cities, counties,
transportation & flood control
agencies
Role for new flood control projects: As the Bay Area grows, sometimes it is essential that new flood control projects are constructed, assuming that they have high benefit-cost ratios and have appropriate environmental mitigation.
Strategy Regional Priority
Responsible Agency
1–(d-4): Assist, support, and/or encourage the U.S. Army Corp of Engineers, various Flood Control and Water Conservation Districts, and other responsible agencies to locate and maintain funding for the development of flood control projects that have high cost-benefit ratios (such as through the writing of letters of support and/or passing resolutions in support of these efforts).
Existing program
Cities, counties, regional
agencies, and all infrastructure
agencies
2–(d-5): Pursue funding for the design and construction of storm drainage projects to protect vulnerable properties, including property acquisitions, upstream storage such as detention basins, and channel widening with the associated right-of-way acquisitions, relocations, and environmental mitigations.
Existing program, underfund
ed
Cities, counties, & flood control
agencies
Role for maintenance of existing flood control projects: Once flood control projects are built, a mechanism needs to be in place to insure that they are maintained. In addition, some of these projects need to be reevaluated on an on-going basis.
Strategy Regional Priority
Responsible Agency
1–(d-6): Continue to repair and make structural improvements to storm drains, pipelines, and/or channels to enable them to perform to their design capacity in handling water flows as part of regular maintenance activities. (This strategy has the secondary benefit of addressing fuel, chemical, and cleaning product issues.)
Existing program,
underfunded
Cities, counties, &
flood control agencies
2–(d-7): Continue maintenance efforts to keep storm drains and creeks free of obstructions, while retaining vegetation in the channel (as appropriate) to allow for the free flow of water.
Existing program,
underfunded
Cities, counties, &
flood control agencies
ABAG Earthquake & Hazards Program December 2009 26
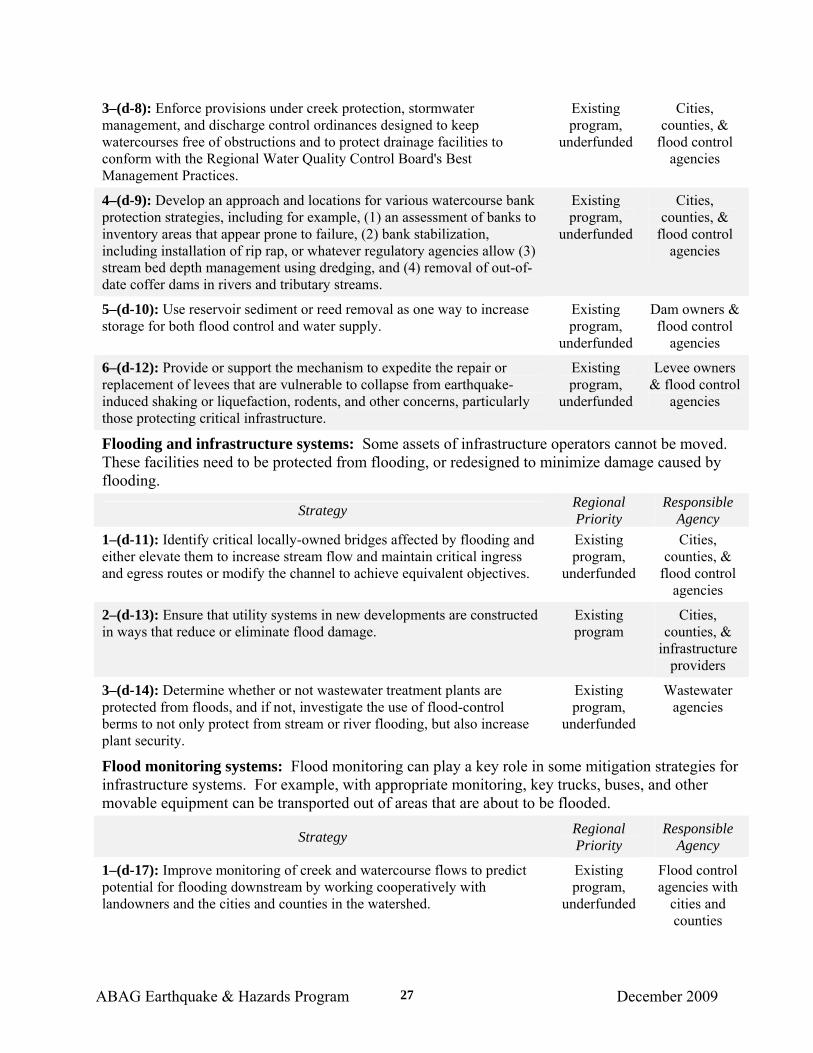
3–(d-8): Enforce provisions under creek protection, stormwater management, and discharge control ordinances designed to keep watercourses free of obstructions and to protect drainage facilities to conform with the Regional Water Quality Control Board's Best Management Practices.
Existing program,
underfunded
Cities, counties, &
flood control agencies
4–(d-9): Develop an approach and locations for various watercourse bank protection strategies, including for example, (1) an assessment of banks to inventory areas that appear prone to failure, (2) bank stabilization, including installation of rip rap, or whatever regulatory agencies allow (3) stream bed depth management using dredging, and (4) removal of out-of-date coffer dams in rivers and tributary streams.
Existing program,
underfunded
Cities, counties, &
flood control agencies
5–(d-10): Use reservoir sediment or reed removal as one way to increase storage for both flood control and water supply.
Existing program,
underfunded
Dam owners & flood control
agencies
6–(d-12): Provide or support the mechanism to expedite the repair or replacement of levees that are vulnerable to collapse from earthquake-induced shaking or liquefaction, rodents, and other concerns, particularly those protecting critical infrastructure.
Existing program,
underfunded
Levee owners & flood control
agencies
Flooding and infrastructure systems: Some assets of infrastructure operators cannot be moved. These facilities need to be protected from flooding, or redesigned to minimize damage caused by flooding.
Strategy Regional Priority
Responsible Agency
1–(d-11): Identify critical locally-owned bridges affected by flooding and either elevate them to increase stream flow and maintain critical ingress and egress routes or modify the channel to achieve equivalent objectives.
Existing program,
underfunded
Cities, counties, &
flood control agencies
2–(d-13): Ensure that utility systems in new developments are constructed in ways that reduce or eliminate flood damage.
Existing program
Cities, counties, &
infrastructure providers
3–(d-14): Determine whether or not wastewater treatment plants are protected from floods, and if not, investigate the use of flood-control berms to not only protect from stream or river flooding, but also increase plant security.
Existing program,
underfunded
Wastewater agencies
Flood monitoring systems: Flood monitoring can play a key role in some mitigation strategies for infrastructure systems. For example, with appropriate monitoring, key trucks, buses, and other movable equipment can be transported out of areas that are about to be flooded.
Strategy Regional Priority
Responsible Agency
1–(d-17): Improve monitoring of creek and watercourse flows to predict potential for flooding downstream by working cooperatively with landowners and the cities and counties in the watershed.
Existing program,
underfunded
Flood control agencies with
cities and counties
ABAG Earthquake & Hazards Program December 2009 27
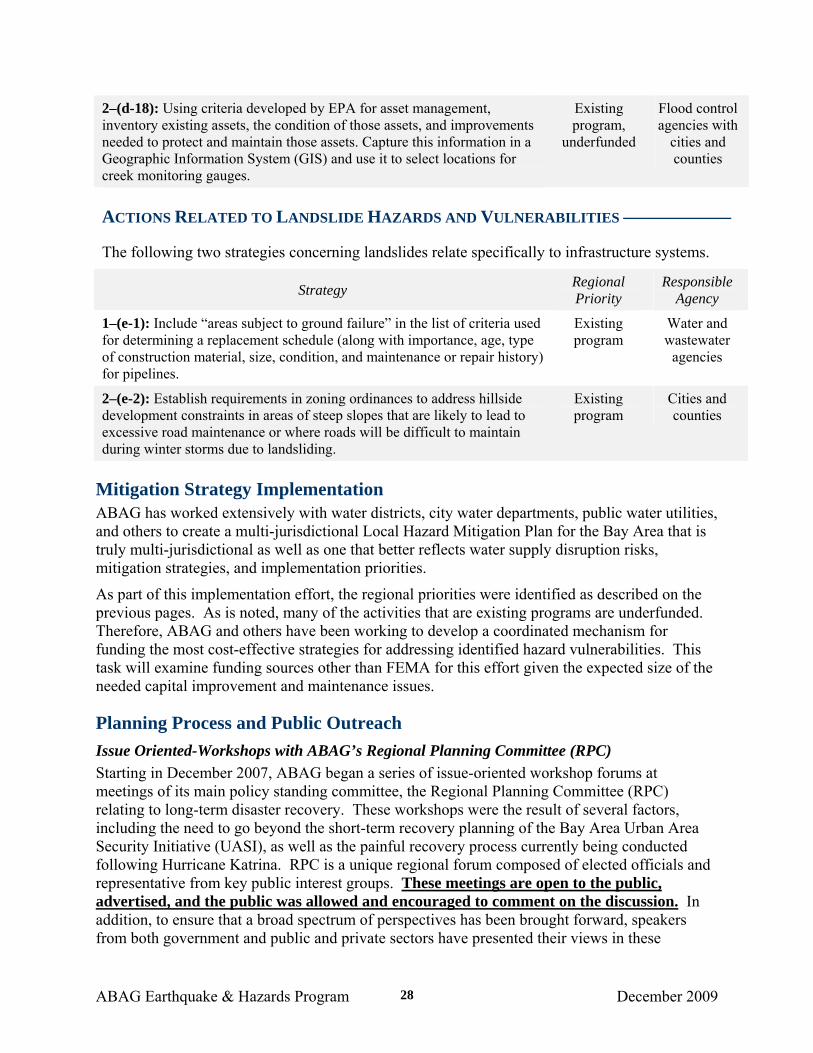
2–(d-18): Using criteria developed by EPA for asset management, inventory existing assets, the condition of those assets, and improvements needed to protect and maintain those assets. Capture this information in a Geographic Information System (GIS) and use it to select locations for creek monitoring gauges.
Existing program,
underfunded
Flood control agencies with
cities and counties
ACTIONS RELATED TO LANDSLIDE HAZARDS AND VULNERABILITIES ––––––––––––
The following two strategies concerning landslides relate specifically to infrastructure systems.
Strategy Regional Priority
Responsible Agency
1–(e-1): Include “areas subject to ground failure” in the list of criteria used for determining a replacement schedule (along with importance, age, type of construction material, size, condition, and maintenance or repair history) for pipelines.
Existing program
Water and wastewater
agencies
2–(e-2): Establish requirements in zoning ordinances to address hillside development constraints in areas of steep slopes that are likely to lead to excessive road maintenance or where roads will be difficult to maintain during winter storms due to landsliding.
Existing program
Cities and counties
Mitigation Strategy Implementation ABAG has worked extensively with water districts, city water departments, public water utilities, and others to create a multi-jurisdictional Local Hazard Mitigation Plan for the Bay Area that is truly multi-jurisdictional as well as one that better reflects water supply disruption risks, mitigation strategies, and implementation priorities.
As part of this implementation effort, the regional priorities were identified as described on the previous pages. As is noted, many of the activities that are existing programs are underfunded. Therefore, ABAG and others have been working to develop a coordinated mechanism for funding the most cost-effective strategies for addressing identified hazard vulnerabilities. This task will examine funding sources other than FEMA for this effort given the expected size of the needed capital improvement and maintenance issues. Planning Process and Public Outreach Issue Oriented-Workshops with ABAG’s Regional Planning Committee (RPC) Starting in December 2007, ABAG began a series of issue-oriented workshop forums at meetings of its main policy standing committee, the Regional Planning Committee (RPC) relating to long-term disaster recovery. These workshops were the result of several factors, including the need to go beyond the short-term recovery planning of the Bay Area Urban Area Security Initiative (UASI), as well as the painful recovery process currently being conducted following Hurricane Katrina. RPC is a unique regional forum composed of elected officials and representative from key public interest groups. These meetings are open to the public, advertised, and the public was allowed and encouraged to comment on the discussion. In addition, to ensure that a broad spectrum of perspectives has been brought forward, speakers from both government and public and private sectors have presented their views in these
ABAG Earthquake & Hazards Program December 2009 28
workshops. RPC has had meetings discussing the issues related to six of the functional areas of this plan, including long-term recovery of utilities and transportation systems (December 3, 2008).
Regional Mitigation Priority Setting by Cities, Counties, and Special Districts, with Public Involvement One of the shortcomings of the 2005 plan was the lack of consistent priorities which detracted from the quality of that plan. To correct that deficiency, ABAG staff created a multi-tiered process that focused on workshops and outreach. These workshops also provided an opportunity for local governments to participate in the planning process for the multi-jurisdictional plan. The decision on priority was made based on a variety of criteria, not simply on an economic cost-benefit analysis. These criteria include being technically and administratively feasible, politically acceptable, socially appropriate, legal, economically sound, and not harmful to the environment or our heritage. To ensure broad representation from sewer agencies and water districts, separate forums were created for those staff.
♦ The sewer district forum, on October 9, 2008, was attended by 78 staff from 30 sewer agencies and departments. Four members of the public were also in attendance at this meeting.
♦ The water forum, on March 25, 2009, was attended by 30 staff from 17 water agencies and departments.
The entire revised mitigation strategies and draft priorities were posted online for public comment from August 17, 2009 to September 17, 2009. These strategies were announced on ABAG’s website, through announcements at public meetings and in newspapers contacted by participating agencies.
a. The revised mitigation strategies and draft priorities were recommended by ABAG’s
Regional Planning Committee for endorsement by ABAG’s Executive Board in a public meeting on August 5, 2009 and during which the public had an opportunity to comment. One member of the public was in attendance at this meeting, but no comments were made. Several comments were given by RPC members that pertained to the need to include strategies to deal with public health issues and that there needs to be a strategy to deal with issues in the Sacramento-San Joaquin Delta. As a result of these comments, strategies INFR a-22 and HEAL c-6 were added. See Appendix G or Chapters 1-Infrastructure and 2- Health for the wording and discussion of these strategies. RPC also commented on the need to incorporate non-profits into the mitigation planning process. This issue is dealt with in strategies HSNG k-16 and ECON j-13. RPC members are composed of elected officials and members of the public, representing groups such as the League of Women Voters, Sierra Club, The Silicon Valley Leadership Group, Homebuilders Association of Northern California, and the California Teachers Association. Elected officials represent all of the cities and counties in the Bay Area.
b. The final mitigation strategies and regional priorities were endorsed by ABAG’s Executive
Board in a public meeting advertized for public comment and during which the public had an
ABAG Earthquake & Hazards Program December 2009 29
opportunity to comment on September 17, 2009. No members of the public were in attendance at this meeting. The Executive Board moved to endorse the strategies and regional priorities with only minor comments. One member requested that we focus more on the impact of the climate change on infrastructure. As a result of that comment and at the request of water agencies at the September 2, 2009 Lifelines and Hazards Committee meeting, this issue has been addressed more completely in Chapter 1- Infrastructure. The Executive Board is comprised of elected officials representing all of the cities and counties in the Bay Area.
Developing Chapters to Highlight the Functional Areas Chapters were developed for the updated LHMP to address in more detail the issues which the mitigation strategies were meant to address. The chapters are organized around each of the eight functional areas. The strategies are grouped together by the common issue they address and are preceded by a short summary of the issue and how it is being addressed by different jurisdictions in the Bay Area today or where more needs to be done. The chapters were drafted by ABAG staff and reviewed at a series of workshops with LHMP participants, partners and the public. All chapters have been posted on ABAG’s website for comment since August 30, 2009. These meetings are outlines below: ABAG’s Infrastructure and Lifelines Hazards Committee met on September 2, 2009 to review the Infrastructure and Environment chapters. This meeting was attended by 16 people representing 12 local lifeline infrastructure providers and local governments. A representative from the Bay Conservation and Development District was also in attendance and commented on the process. The major comments at this meeting had to do with the importance of climate change and its effect on other natural hazards which affect lifeline infrastructure providers. The Infrastructure chapter was updated to incorporate these comments. The update of both chapters was posted online for public comment.
Raising Public Awareness Public information campaigns or “messages” were developed to inform the public about update to the Local Hazard Mitigation Plan and to educate them about the issues addressed in the plan. This was accomplished by:
♦ Preparing an op-ed piece on the mitigation plan in conjunction with the 20th anniversary of the Loma Prieta earthquake published on September 29, 2009 by the Oakland Tribune, the Hayward Daily Review, and the Contra Costa Times.
♦ Securing opportunity for free print ad/community service space in local media in print and online, a task accomplished by cities, counties, and special districts participating in the update process.
♦ Posting information on ABAG’s popular earthquake and hazards website providing background information of the plan, advertising upcoming public meetings, and inviting public comment
♦ Working with organizations, local governments and special districts to schedule public meetings to discuss aspects of the plan specific to a particular sub-region or interest group that would also give the community opportunity to comment. Such events included (1) the Earthquake Alliance Meeting on mitigation opportunities for health and school systems on August 27, 2009 and (2) the joint conference on business economic and infrastructure system mitigation and recovery sponsored by the Business Executives for National Security (BENS) Northern California, the Bay Area Response Coalition (of
ABAG Earthquake & Hazards Program December 2009 30
financial institutions) (BARCFirst), and the Business Recovery Managers Association (BRMA) on Thursday, June 25, 2009.
Focused Outreach Activities in Partnership with Local Jurisdictions To ensure that the public has had an opportunity to review the draft priorities of these cities, counties, and special districts, two opportunities were provided for public comment.
a. Each of the cities, counties, and special districts participating in this LHMP held at least one meeting in conjunction with a meeting of their City Council, Board of Supervisors, Planning Commission, or held a separate advertised public meeting. The workshops were held in August, September and October 2009 and were open to the public. In general, the focus of the meetings was on the draft mitigation strategies of each of these jurisdictions. While members of the public attended many of these meetings, they largely attended to be briefed on the issues and had no substantive comments. In those cases where members of the public were in attendance, there comments were considered and incorporated into the strategy priorities. Records of these meetings and public comments, if any, are on file with the local governments. Any comments related to the MJ-LHMP were forwarded to ABAG. Most comments had to do with unclear sentences or misspelled words. The only substantive comment related to the need to discuss mobile homes more fully. This change was made in Chapter 3 – Housing.
b. Finally, the draft strategy priorities were posted online for public comment on individual city, county, and special district web sites in August, September and October 2009. Announcements in local newspapers were placed to highlight the need for public comment. Some local governments advertised these meetings through local cable access channels. Those organizations participating in the hazard workshops also participated in advertising the opportunity for public comment.
c. The strategies were then posted on ABAG’s web site at
http://quake.abag.ca.gov/mitigation/strategy.html. The only substantive comment received from a member of the public related to the need to discuss private schools more fully. This change was made in Chapter 6 – Schools and Education.
Additional Information on the Local Planning Process, Public Participation, and Outreach by Cities, Counties, and Special Districts Each local government assigned tentative priorities for the 371 mitigation strategies based on the regional priorities, as well as its own local hazards and risks, as well as on its authority and functions. For example, strategies focused on soft-story apartment buildings are not applicable to a small community with no multifamily housing. In addition, some strategies are appropriate for water districts, others for school districts, and others for county health departments. These preliminary priorities were assigned by local government staff based on a review by people from various agency departments within the local government. The decision on priority was made based on a variety of criteria, not simply on an economic cost-benefit analysis. These criteria include being technically and administratively feasible, politically acceptable, socially appropriate, legal, economically sound, and not harmful to the environment or our heritage.
ABAG Earthquake & Hazards Program December 2009 31
Cities, counties, and special districts held meetings and workshops as part of the process needed to identify their specific hazards, risks, and appropriate mitigation strategies as described in the previous section. At a minimum, the mitigation strategies were reviewed at an open meeting of the organization’s Council, Commission, or Board, as well as posted online for comment prior to submission of the draft LHMP and annexes to CalEMA and FEMA. For more information on each jurisdiction’s planning process, see the specific annexes prepared by that local government. The implementation mechanism varies by jurisdiction. General planning policies are being incorporated into the Safety Element of the General Plan by cities and counties. These strategies are typically those implemented by planning, building, and community development departments. Incorporating these mitigation strategies into the Safety Element has become a major priority of cities and counties because of the state legislation waiving local match for Public Assistance funds. Special districts, as well as cities and counties, typically work to retrofit existing facilities and build new or replacement facilities using capital improvement budgeting processes. It is anticipated that the Bay Area multi-jurisdictional Local Hazard Mitigation Plan, as well as the mitigation strategies of each actively participating local government, will be adopted at a public meeting following conditional approval of the plan by FEMA. Background References on Pipeline Repair Rates Mapping
Eguchi, R.T., 1991. Early Post-Earthquake Damage Detection for Underground Lifelines, Final Report to the National Science Foundation, Dames and Moore P.C., Los Angeles, CA.
Kayen, R.,E., and Mitchell, J.K., 1997. “Assessment of Liquefaction Potential During Earthquakes by Arias Intensity,” in Journal of Geotechnical and Geoenvironmental Engineering, Dec. 1997, pp. 1162-1174.
Knudsen, K.L., Sowers, J.M., Witter, R.C., Wentworth, C.M., and Helley, E.J., 2000. Preliminary Maps of Quaternary Deposits and Liquefaction Susceptibility, Nine-County San Francisco Bay Region, California: U. S. Geological Survey Open-File Report 00-444. Digital Database (by Wentworth, C.M., Nicholson, R.S., Wright, H.M., and Brown, K.H.) Online Version 1.0.
Jeon, S.-S., and O’Rourke, T.D., 2005. “Northridge Earthquake Effects on Pipelines and Residential Buildings” in Bulletin of the Seismological Society of America, v. 95, no. 1, pp. 294-318, February 2005.
Perkins, J.B., 2001. The Real Dirt on Liquefaction: Technical Appendices to the Guide to the Liquefaction Hazards in Future Earthquakes Affecting the San Francisco Bay Area: ABAG Report P01002EQK. Oakland, CA.
Witter, R. C., Knudsen, K.L., Sowers, J.M., Wentworth, C.M., and Koehler, R.D., and Randolph, C.E., 2006. Maps of Quaternary Deposits and Liquefaction Susceptibility in the Central San Francisco Bay Region, California: U. S. Geological Survey Open-File Report 2006-1037. Digital Database (by Wentworth, C.M., Brooks, S.K., and Gans, K.D.) Online Version 1.1.
ABAG Earthquake & Hazards Program December 2009 32
Background References on Lifeline Interdependencies
Gillette, J., Fisher, R., Peerenboom, J., and Whitfield, R., Gillette, 2002. “Analyzing Water/Wastewater Infrastructure Interdependencies” presented at the 6th Probabilistic Safety Assessment and Management Conference, San Juan, Puerto Rico, June 25, 2002.
Peerenboom, J., Fisher, R., and Whitfield, R., 2001. “Recovering from Disruptions of Interdependent Critical Infrastructures” presented at the CRIS/DRM/IIIT/NSF Workshop on Mitigating the Vulnerability of Critical Infrastructures to Catastrophic Failures” Lyceum, Alexandria, Virginia, September 10-11, 2001.
Background References on Economic Impacts of Water Supply Disruptions Bay Area Economic Forum, 2002. Hetch-Hetchy Water and the Bay Area Economy3, Bay
Area Economic Forum, San Francisco, CA.
Brozovic, N., Sunding, D., and Ziberman, D., 2006. “Estimating Business and Residential Water Supply Interruption Losses from Catastrophic Events,” University of Illinois at Urbana-Champaign, November 20, 2006.
Chang, S., Swekla, W,. and Shinozuka, M., 2002. “Linking Infrastructure and Urban Economy: Simulation of Water-Disruption Impacts in Earthquakes,” Environment and Planning B: Planning and Design, 29:281-301.
Courtney, R., Perkins, W., and Halpin, W., 2006. “East Bay Water Sources and a Pilot Study of User Response to a Potential Supply Disruption,” Center for the Regional Economy, St. Mary’s College, Moraga, CA.4
Dixon, L, Moore, N., and Pint, E., 1996. “Drought Management Policies and Economic Effects in Urban Areas of California: 1987-1992,” RAND, Santa Monica, CA.
Horner, Gerald L., and Goettel, Kenneth A., 1994. “Economic Impacts of Scenario Earthquakes on the East Bay Municipal Utility District Service Area,” Report to EBMUD Dated April 1, 1994 by Goettel & Horner, Inc., Sacramento, CA.
M.Cubed, 2008. “Cost of Water Shortage,” Memo to EBMUD Dated March 14, 2008 from EDAW Team Led by M.Cubed, San Francisco, CA5
M.Cubed, 2006. “Addendum to Shortage Cost TM [Technical Memo],” Memo to EBMUD Dated February 6, 2008: Oakland, CA.6
MHB Consultants, Inc., 1994. “The Economic Impact of Water Delivery Reductions on the San Francisco Water Department’s Commercial and Industrial Customers,” June 29, 1994.
3 See http://www.bayeconfor.org/pdf/hetchhetchyfinal2.pdf to view the entire report. 4 See http://wtfc.stmarys-ca.edu/study/WTFCFinalReport111006.pdf to view the entire report. 5 See http://www.ebmud.com/water_&_environment/water_supply/water_supply_management_program/economic_analyses/Cost%20of%20Water%20Shortage.pdf to view full memo. 6 See http://www.ebmud.com/water_&_environment/water_supply/water_supply_management_program/economic_analyses/Cost%20of%20Water%20Shortage%20Addendum.pdf to view the full memo.
ABAG Earthquake & Hazards Program December 2009 33
San Francisco Public Utilities Commission, 2007. “Measures to Reduce the Economic Impacts of a Drought-Inducted Water Shortage in the SF Bay Area,” May 3, 2007.
Spectrum Economics, 1991. “Cost of Industrial Water Shortages: Preliminary Observations,” April 11, 1991.
CREDITS Jeanne B. Perkins – ABAG Earthquake and Hazards Program Consultant Danielle Hutchings – ABAG Earthquake and Hazards Specialist
ABAG Earthquake & Hazards Program December 2009 34