water reuse/recycle…what does - aiche · refinery water reuse and conservation •good, detailed...
TRANSCRIPT

Standards
Certification
Education & Training
Publishing
Conferences & Exhibits
Automation in the
Refinery of Today
Travis Capps
Water Reuse/Recycle…What does it mean for Refiners?
Industrial Water Use and Reuse Workshop
April 30 – May 2, 2013

2
Safe Harbor Statement
Statements contained in this presentation that state the
Company’s or management’s expectations or predictions of the
future are forward–looking statements intended to be covered by
the safe harbor provisions of the Securities Act of 1933 and the
Securities Exchange Act of 1934. The words “believe,” “expect,”
“should,” “estimates,” and other similar expressions identify
forward–looking statements. It is important to note that actual
results could differ materially from those projected in such
forward–looking statements. For more information
concerning factors that could cause actual results to differ
from those expressed or forecasted, see Valero’s annual
reports on Form 10-K and quarterly reports on Form 10-Q,
filed with the Securities and Exchange Commission, and available
on Valero’s website at www.valero.com.

Valero Energy Overview
• World’s largest independent refiner
– 16 refineries
– 3 million barrels per day (BPD) of capacity, with average
capacity of 190,000 BPD (187,000 BPD without Aruba)
• Approximately 7,300 branded marketing sites
• One of the largest renewable fuels companies
– 10 efficient corn ethanol plants with total of 1.2 billion
gallons/year (72,000 BPD) of nameplate production capacity
o All plants located in resource-advantaged U.S. corn belt
– 50 MW wind farm in Texas
– Diamond Green Diesel JV under construction (renewable
diesel from waste cooking oil and animal fat)
o 10,000 BPD capacity, 50% to Valero
– Portfolio of investments in next-generation fuels
• Approximately 10,500 employees
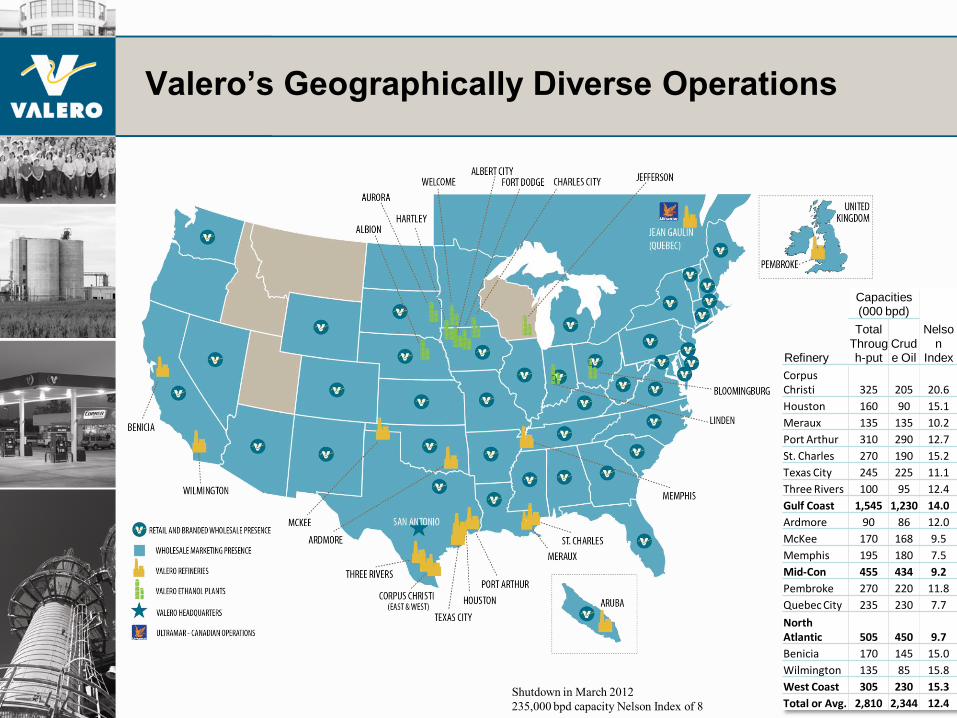
Valero’s Geographically Diverse Operations
Refinery
Capacities (000 bpd)
Nelso
n Index
Total
Through-put
Crude Oil
Corpus Christi 325 205 20.6
Houston 160 90 15.1
Meraux 135 135 10.2
Port Arthur 310 290 12.7
St. Charles 270 190 15.2
Texas City 245 225 11.1
Three Rivers 100 95 12.4
Gulf Coast 1,545 1,230 14.0
Ardmore 90 86 12.0
McKee 170 168 9.5
Memphis 195 180 7.5
Mid-Con 455 434 9.2
Pembroke 270 220 11.8
Quebec City 235 230 7.7
North Atlantic 505 450 9.7
Benicia 170 145 15.0
Wilmington 135 85 15.8
West Coast 305 230 15.3
Total or Avg. 2,810 2,344 12.4 Shutdown in March 2012
235,000 bpd capacity Nelson Index of 8

5
So, How Much Water is on Earth? Here is How We Think of Water on Earth
Demand on Limited Water Resources
is Growing

6
• The blue sphere sitting on the United States, reaching from Salt Lake City,
UT to Topeka, KS has a diameter of about 860 miles, with a volume of
about 332,500,000 cubic miles
Here is a Different View of the Water on Earth?
Demand on Limited Water Resources
is Growing

7
• This is a comparison of the water on Jupiter’s moon Europa vs. the water on
Earth – a very striking comparison.
How Much Water is this in Context of our Solar System?
Demand on Limited Water Resources
is Growing

8
Distribution of Earth’s Water
9
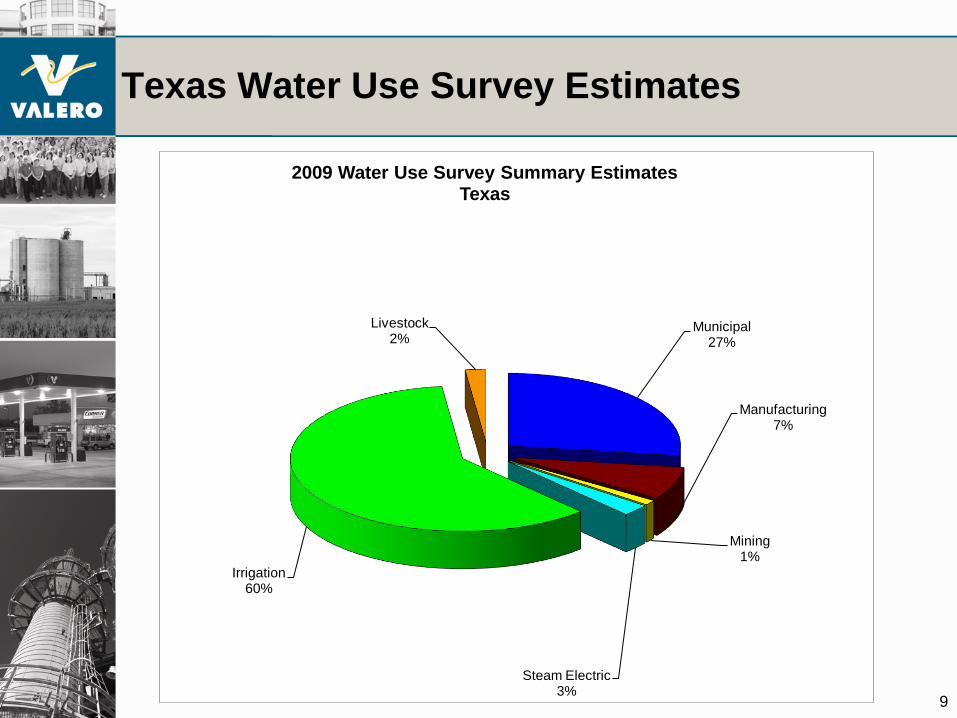
Municipal 27%
Manufacturing 7%
Mining 1%
Steam Electric 3%
Irrigation 60%
Livestock 2%
2009 Water Use Survey Summary Estimates Texas
Texas Water Use Survey Estimates

Refinery Water Use
• Depending on size and complexity, refinery water use varies from 1,400 gpm
to 12,000 gpm
– Majority of water from surface water supplies (reservoirs and rivers)
– About a third of our refineries purchase clarified water from
municipalities
– Two refineries obtain water from wells that we own and operate
• Water efficiency varies from 0.4 bbl water per bbl of crude to 1.2 bbl of water
per bbl of crude
– Depends on refinery complexity and on-site hydrogen generation from
steam methane reformers (water required for Rx)
– Refineries in water rich areas consume more due to more use of steam
drivers and cooling water circuits
– Refineries in arid regions consume less with more electric drives and use
of air fin fan cooling
• 30%-50% of the water is treated to make BFW make up with the remainder
used for cooling tower make up and utility/wash down needs

Refinery Water Reuse and Conservation
• Good, detailed water balance is critical to any water conservation strategy
• Typical water reuse and conservation in place today includes:
– Condensate recovery
– Stripped sour water used for desalter make up and process wash water
– RO reject for scrubber or fire water system make up
– Waste water effluent for fire water system make up
– Maximize cooling tower
cycles
– Blowdown control on boilers
and cooling towers
• Most significant water loss is
from evaporative cooling towers
• Typically 50%-65% of water
supply is discharged as treated
effluent

Other Water Reuse and Conservation
Opportunities • Opportunities exist to reduce cooling water needs and therefore reduce
evaporative losses
– Replace condensing turbines with electric motor drivers (currently
implementing projects at several sites based on energy efficiency benefit)
– Replace cooling water heat exchangers with fan fan coolers ($$$)
• Improving BFW treatment efficiency is another option
– 2nd pass on RO reject to recover additional BFW make up
– Install RO ahead of demin units to reduce regeneration cycles (in place at
several refineries)
• Other opportunities are available but are often not cost effective:
– Replace vacuum steam jets with electric vacuum pumps ($$$)
– Use effluent for seal water ($$$ piping costs)
– Tank farm and tracing condensate recovery ($$$ piping costs)

Alternative Water Supplies
• Treat and reuse effluent
– At best, you could recover 60%-70% of effluent and return as raw water to
the refinery or for cooling tower make up
– Potentially provide 30%-40% of the total refinery water supply
• For coastal refineries,
desalination is an option
• For refineries in urban
areas, use of municipal
treatment plant effluent is
an option
– Currently done at several
US refineries

Water Reuse Challenges
• Economic projects are difficult to justify as long as current supply is
available
• Typical cost to purchase and/or make clarified water is $1.50-$3.00 per 1,000
gallons
– In arid regions, this cost may be as high as $6.00 per 1,000 gallons
• The cost to provide clarified water is typically less than 10% of the
purchased energy cost to operate the refinery
• Recent evaluation completed at an arid refinery location (very low water
usage) identified 14 potential conservation opportunities
– Based on 10 year amortization, the recovered water cost ranged from $2 -
$300 per 1,000 gallons
– 4 of the projects were estimated at < $6/Mgal (cost of raw water supply)
and are being pursued
+ 175 gpm of water savings represents 6% of total water demand

Alternative Water Supply Challenges
• Use of treated municipal effluent water is feasible if piping costs can be
minimized (close location)
• Cost to own and operate either a coastal desalination facility or effluent
recovery system sized for a single refinery is estimated at $8.00 - $12.00 per
1,000 gallons
– Estimate assumes brine may be discharged, deep well injection not
required
• To obtain economies of scale, an industrial community based facility is
needed
• Who wants to be first in?
Conclusions
• With continued growth, competition will increase for limited fresh water
supplies
• Optimizing water usage with operational and low capital improvements can
reduce consumption by 5-15%
• Effluent treatment/reuse and desalination of seawater are both very
expensive (capital and operating expense)
• An industry-wide approach to optimize water across all the industrial water
users is needed
– Optimize how money is spent to reduce water demands to get the biggest
bang for the buck
– Can’t afford to proactively make the necessary large capital and
operating investments if our competition is not doing the same
• The other concern is that eventually a water supply strategy may need to be
included as part of the project process for a new unit, plant or expansion
– So, here also, early movement on reducing water use could put you at a
disadvantage