water quality and distribution uniformity in drip/trickle irrigation systems
TRANSCRIPT
J. agric. Engng Res. (1998) 70, 355—365Article Number: ag980287
Water Quality and Distribution Uniformity in Drip/Trickle Irrigation Systems*
Antonina Capra; Baldassare Scicolone
Institute of Agricultural Engineering, University of Reggio Calabria Piazza S. Francesco n. 4, 89061 Gallina di Reggio Calabria, Italy; Institute ofAgricultural Hydraulics, University of Catania Via Valdisavoia n. 5, 95125 Catania, Italy
(Received 17 February 1997; accepted in revised form 4 February 1998)
The clogging of emitters is a major problem encoun-tered in drip/trickle irrigation systems, as partial or com-plete clogging reduces application uniformity. Cloggingis closely related to the quality of the water used. Despitethe quantity of research reported in literature concerningthe quality treatment and distribution uniformity of irri-gation water, the problem still remains of accuratelyforeseeing the clogging risk on the basis of the irrigationwater quality and the corresponding effects on emitterflow rate in causing lack of uniformity in the field. Thepaper reports an investigation performed in the field ona number of irrigation systems in Southern Italy, with theaim of determining parameters expressing clogging andstudying the relationships between the latter and waterquality. The results obtained permitted identification ofboth some field performance indices which can be used toevaluate clogging and water quality factors which can beused to classify the clogging hazard rating of emitters.Indications can be drawn about the number of emittersto be tested in the field and also the relationships betweenclogging and emitter position in the lateral.
( 1998 Silsoe Research Institute.
1. Introduction
Although drip/trickle irrigation systems are based ona long working experience and have reached a hightechnological level, these systems are often not able todeliver all of their nominal advantages. Plugging of emit-ters is considered to be the largest maintenance problemwith drip/trickle systems. In fact, partial or completeclogging reduces emission uniformity and, as a conse-quence, decreases irrigation efficiency and increases thewater volumes needed for crop growing. In many cases,
*Paper presented at AgEng 96, Madrid, Spain, 23—26 September1996
0021-8634/98/080355#11 $30.00/0 355
to assure irrigated plants of the necessary water volume,it is necessary to put up with a water loss due to overirri-gation. Overirrigation causes deep percolation and con-sequent disadvantages due to water and energy costs,fertilizer leaching and drainage needs.
In an analysis of papers on clogging and mitigationprocedures, Nakayama and Bucks1 established that theseprocesses are closely related to the quality of water used;the authors also pointed out that the water quality prob-lem will increase on account of the use of urban andindustrial wastewater.
The plugging of emitters can be caused by physical,chemical or biological contaminants. Physical cloggingis caused by suspended inorganic particles (such assand, silt, clay, plastics), organic materials (animal resi-dues, snails, etc.), and microbiological debris (algae, etc.);physical materials can be combined with bacterialslimes.2,3 Chemical problems are due to dissolved solidswhen they interact with each other to form precipi-tates and to the precipitation of calcium carbonatein waters rich in calcium and bicarbonates. Biologicalclogging is due to algae, iron slimes and sulphur slimes.The causes of clogging are different from location tolocation: suspended particles, and high contents of ironand hydrogen sulphide cause clogging problems inSouthern Italy.
Water analysis prior to system design, a preventivemaintenance programme and field evaluation of cloggingand uniformity are strongly recommended.4,1,5
An examination of the research papers on the above-mentioned topics showed that a number of problems stillremain. No water quality evaluation method capable ofrepresenting potential emitter clogging has yet been de-veloped; the causes of clogging vary from location tolocation and, for the same water, clogging depends onother local conditions, such as water temperature, andon emitter features. In the early 1980s, Bucks et al.2
( 1998 Silsoe Research Institute
356 A. CAPRA; B. SCICOLONE
Notation
Dr
flow rate ratio of each emitter tested inthe field
Dr1@4min
average of the lower quartile of DrD
ramean flow rate ratio of emitters, %
Ec
electrical conductivity of irrigationwater, mS/cm
Eu
emission uniformity coefficient accord-ing to Capra and Tamburino,7 %
H working pressure head at the emitter,mH
2O
Ha
mean pressure in the field, mH2O
Hmin
minimum pressure measured in thefield, mH
2O
kd
emitter discharge coefficientn number of emitters tested in the fieldnc
per cent of partially clogged emitters, %ns
statistical per cent of totally andpartially clogged emitters, %
ntc
per cent of totally clogged emitters, %pH
ccalculated pH of irrigation water
pHm
measured pH of irrigation waterpH
diffdifference between pH
mand pH
cq emitter flow rate (or discharge), l/h
qa
average flow rate for the sample of newemitters, l/h
qaf
average emitters flow rate in thefield, l/h
qc
calculated emitter flow rate, l/hqf
emitter flow rate measured in thefield, l/h
qn
nominal flow rate of each type ofemitter, l/h
SDf
standard deviation of field emitter flowrate, l/h
SDh
standard deviation of pressuremeasured in the field, mH
2O
SDq
standard deviation of flow rates for thesample of new emitters, l/h
Ss
suspended solids content of irrigationwater, mg/l
ºs
uniformity coefficient according toBralts,6 %
»h
coefficient of variation of the pressurehead
»m
manufacturers’ coefficient, %»pf
coefficient of variation due to emitterperformance in the field, %
»q
coefficient of variation of field emitterflow rate
x emitter flow rate exponent
proposed a classification scheme for water quality toindicate clogging potential; little change has been madesince then. Available methods for field measurement ofirrigation uniformity are both time- and money-consum-ing and they are only able to evaluate global uniformity;in other words, with global indices it is not possible toseparate the effects on emitter flow rate of lack of uni-formity due to pressure and temperature variability,manufacturers’ specifications, clogging and cleaning ac-tions. Keller and Karmeli5 proposed a uniformity coeffic-ient for localized irrigation systems, based on emitterflow measures; Bralts6 and Capra and Tamburino7 pro-posed uniformity coefficients based on emitter flow andpressure measures, which allow the effects of pressuredifferences on emitter flow rate to be separated fromthose due to other causes.
This paper reports the results of a field investigationcarried out for 21 irrigation systems located in SouthernItaly. In this area, water treatment systems are generallyvery elementary and the operators prefer large-sizeddrippers or microjets to reduce the clogging risk. Theobjects of the investigation were
(1) to propose a simple uniformity index which is cal-culated by simple input measurements and whichexpresses clogging explicitly; and
(2) to establish the relationships between the uniformityindex selected and irrigation water quality.
2. Experimental details and methods
The investigation concerns 21 irrigation systemslocated in different areas of Sicily which have been inoperation for one to 20 yr; most of them were in vine-yards, the others in citrus and olive orchards.
Most of the irrigation water comes from wells. All thesystems were equipped with highly elementary filter sys-tems which are common to almost all the systems in thearea; the only kinds of filter were screen-type strainerswith 40—150 mesh screens; in two of the systems exam-ined there were two gravel filters in parallel with gravelsizes of 2, 4 and 6 mm. There were no cases of chemicaltreatment of water.
The emitters were drippers of ten different types (in 17systems) and microjets of four different types (in foursystems) as listed in Table 1. Laboratory tests were per-formed on 24 new emitters of each type8 to determine themost important characteristics: the nominal flow rate,flow-rate—pressure equation and manufacturers’ coeffic-ient. The nominal flow rate, q
n, is the average flow rate at
a pressure suggested by the manufacturer. The flow-rate—pressure equation of emitters can be characterized by
q"k Hx (1)
d
Table 1Characteristics of emitters (based on 24 new emitters of each type)
Nominal Emitter Manufacturer+sSystem flow rate, exponent, coefficient,tested Emitter type q
n, 1/h x V
m, %
1 TurboKey 8 0)5 182 Alfa-Jo Y 16 0)6 313 Alprene 10 0)6 104 TurboKey 8 0)5 185 Keyclip 8 0)6 186 Gadi Red* 90 0)5 147 Gadi Brown* 131 0)5 38 TurboKey 8 0)5 189 Alfa-Jo X 5 0)7 26
10 Agriplast 6 0)8 411 Gadi Green* 68 0)5 812 Netafim p)p) 4 0)0 513 Alfa-Jo X 5 0)7 2614 Alfa-Jo X 5 0)7 2615 Hydromaster 13 0)7 1816 Microfix White* 161 0)5 117 Alfa-Jo Y 16 0)6 3118 Hydromaster 13 0)7 1819 TurboKey 4 0)5 1820 Agridrip 8 0)5 221 Agridrip 8 0)5 2
*Microjets; others are drippers.
DRIP/TRICKLE IRRIGATION SYSTEMS 357
where q is the emitter flow rate (or discharge), l/h, kdthe
discharge coefficient, which is a constant of propor-tionality that characterizes each emitter, H the workingpressure head at the emitter, mH
2O and x the emitter
flow-rate exponent.The manufacturers’ coefficient, »
m, is used as a
measure of variation in flow rate for a sample of newemitters. This variation is a result of the emitter design,the material used and the precision with which it ismanufactured; it is calculated by
»m"100SD
q/q
a(2)
where »m
is the manufacturers’ coefficient, %, SDq
thestandard deviation of flow rates for the sample of newemitters, l/h and q
athe average flow rate for the sample of
new emitters, l/h.Drippers were tested at a pressure of 10 mH
2O
for nominal flow rate and manufacturers’ coefficient,and at 5, 10, 15, 18 and 20 mH
2O for the flow rate
versus pressure equation; microjets were tested at15 mH
2O for nominal flow rate and manufacturers’ coef-
ficient and at 10, 15, 18, 20 and 25 mH2O for the flow rate
versus pressure equation. The emitters tested for theflow-rate—pressure equation were the four whose flowrate was closest to the average; the water temperaturewas about 22°C. The nominal flow rate of emitters ranges
from 4 to 16 l/h for drippers and from 68 to 161 l/h formicrojets; manufacturers’ coefficients range from 1 to31% and emitter flow-rate exponent from 0)0 to 0)8(Table 1).
The pressure head and flow rate of a significant sampleof emitters7 were measured in field tests; the temperatureof the water emitted was also measured. The flow rate ofeach emitter was measured by a graduated container(200, 500 and 1000 ml for the different types of emitter);pressure by a precision pressure gauge graduated inmH
2O. At least 18 emitters were tested, located in a rep-
resentative subunit of each system; six laterals werechosen for each subunit; three emitters (the nearest to theinlet, the middle one and the last) were tested for eachlateral (Fig. 1 ); in eight systems more than 18 emitterswere tested to study the effect of sample size on theperformance indices calculated.
Water samples were taken during the field test todetermine the most important factors affecting occlu-sion:9 pH, suspended solids (S
s), electrical conductivity
(Ec), total iron (Fe), hydrogen sulphide (H
2S), manga-
nese (Mn), magnesium (Mg), calcium (Ca), bicarbonates(Bc) and dissolved oxygen (DO). Water analyseswere carried out in the laboratory; chemical changesin some factors were stopped by appropriate sampletreatment.10
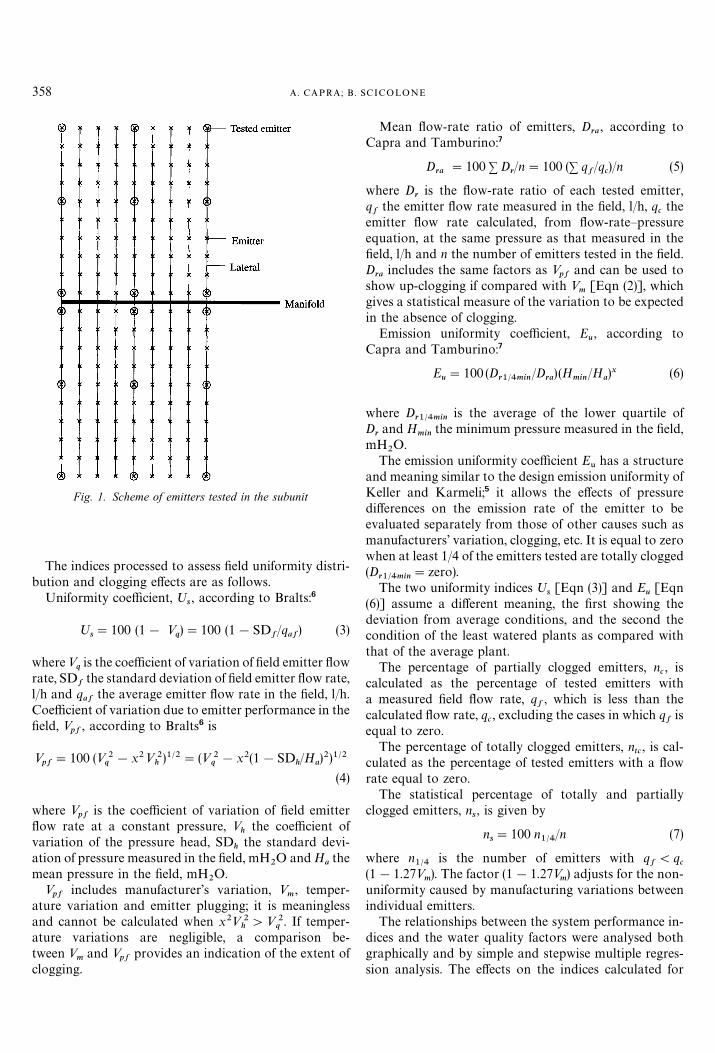
Fig. 1. Scheme of emitters tested in the subunit
358 A. CAPRA; B. SCICOLONE
The indices processed to assess field uniformity distri-bution and clogging effects are as follows.
Uniformity coefficient, ºs, according to Bralts:6
ºs"100 (1! »
q)"100 (1!SD
f/q
af) (3)
where»qis the coefficient of variation of field emitter flow
rate, SDfthe standard deviation of field emitter flow rate,
l/h and qaf
the average emitter flow rate in the field, l/h.Coefficient of variation due to emitter performance in thefield, »
pf, according to Bralts6 is
»pf"100 (»2
q!x2»2
h)1@2"(»2
q!x2(1!SD
h/H
a)2)1@2
(4)
where »pf
is the coefficient of variation of field emitterflow rate at a constant pressure, »
hthe coefficient of
variation of the pressure head, SDh
the standard devi-ation of pressure measured in the field, mH
2O and H
athe
mean pressure in the field, mH2O.
»pf
includes manufacturer’s variation, »m, temper-
ature variation and emitter plugging; it is meaninglessand cannot be calculated when x2»2
h'»2
q. If temper-
ature variations are negligible, a comparison be-tween »
mand »
pfprovides an indication of the extent of
clogging.
Mean flow-rate ratio of emitters, Dra
, according toCapra and Tamburino:7
Dra
"100 + Dr/n"100 (+ q
f/q
c)/n (5)
where Dr
is the flow-rate ratio of each tested emitter,qf
the emitter flow rate measured in the field, l/h, qcthe
emitter flow rate calculated, from flow-rate—pressureequation, at the same pressure as that measured in thefield, l/h and n the number of emitters tested in the field.D
raincludes the same factors as »
pfand can be used to
show up-clogging if compared with »m
[Eqn (2)], whichgives a statistical measure of the variation to be expectedin the absence of clogging.
Emission uniformity coefficient, Eu, according to
Capra and Tamburino:7
Eu"100 (D
r1@4min/D
ra)(H
min/H
a)x (6)
where Dr1@4min
is the average of the lower quartile ofD
rand H
minthe minimum pressure measured in the field,
mH2O.
The emission uniformity coefficient E6
has a structureand meaning similar to the design emission uniformity ofKeller and Karmeli;5 it allows the effects of pressuredifferences on the emission rate of the emitter to beevaluated separately from those of other causes such asmanufacturers’ variation, clogging, etc. It is equal to zerowhen at least 1/4 of the emitters tested are totally clogged(D
r1@4min"zero).
The two uniformity indices ºs[Eqn (3)] and E
u[Eqn
(6)] assume a different meaning, the first showing thedeviation from average conditions, and the second thecondition of the least watered plants as compared withthat of the average plant.
The percentage of partially clogged emitters, nc, is
calculated as the percentage of tested emitters witha measured field flow rate, q
f, which is less than the
calculated flow rate, qc, excluding the cases in which q
fis
equal to zero.The percentage of totally clogged emitters, n
tc, is cal-
culated as the percentage of tested emitters with a flowrate equal to zero.
The statistical percentage of totally and partiallyclogged emitters, n
s, is given by
ns"100 n
1@4/n (7)
where n1@4
is the number of emitters with qf(q
c(1!1.27»
m). The factor (1!1.27»
m) adjusts for the non-
uniformity caused by manufacturing variations betweenindividual emitters.
The relationships between the system performance in-dices and the water quality factors were analysed bothgraphically and by simple and stepwise multiple regres-sion analysis. The effects on the indices calculated for
DRIP/TRICKLE IRRIGATION SYSTEMS 359
both sample size and emitter position in the lateral (withrespect to the water inlet) were also studied.
3. Results and discussion
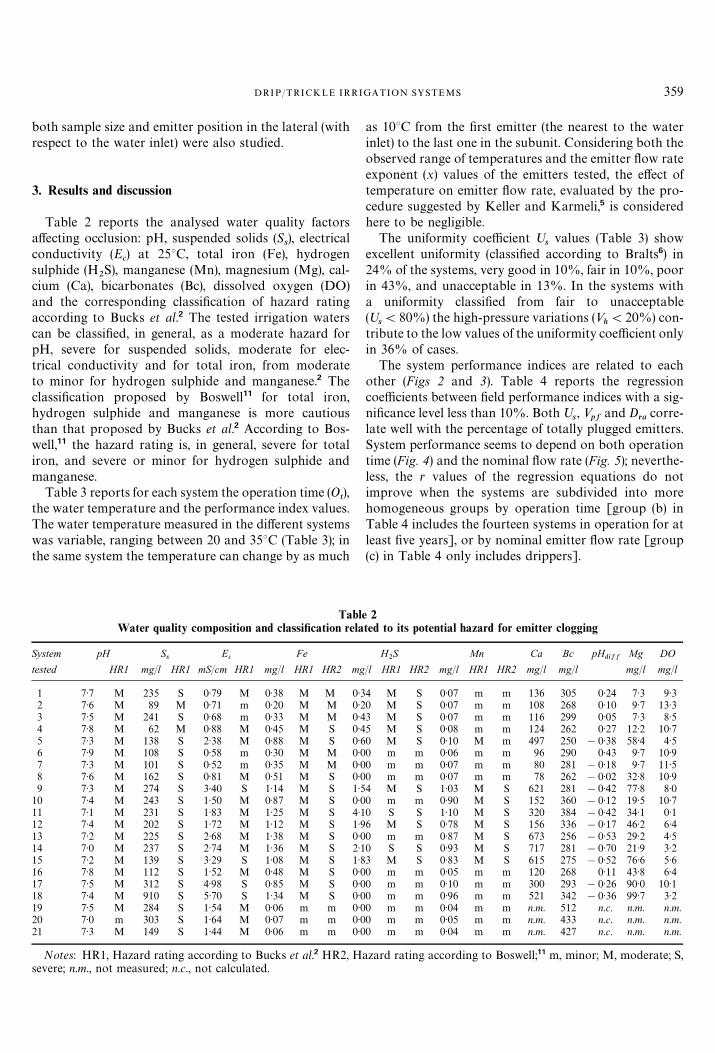
Table 2 reports the analysed water quality factorsaffecting occlusion: pH, suspended solids (S
s), electrical
conductivity (Ec) at 25°C, total iron (Fe), hydrogen
sulphide (H2S), manganese (Mn), magnesium (Mg), cal-
cium (Ca), bicarbonates (Bc), dissolved oxygen (DO)and the corresponding classification of hazard ratingaccording to Bucks et al.2 The tested irrigation waterscan be classified, in general, as a moderate hazard forpH, severe for suspended solids, moderate for elec-trical conductivity and for total iron, from moderateto minor for hydrogen sulphide and manganese.2 Theclassification proposed by Boswell11 for total iron,hydrogen sulphide and manganese is more cautiousthan that proposed by Bucks et al.2 According to Bos-well,11 the hazard rating is, in general, severe for totaliron, and severe or minor for hydrogen sulphide andmanganese.
Table 3 reports for each system the operation time (Ot),
the water temperature and the performance index values.The water temperature measured in the different systemswas variable, ranging between 20 and 35°C (Table 3); inthe same system the temperature can change by as much
TablWater quality composition and classification rela
System pH Ss
Ec
Fe
tested HR1 mg/l HR1 mS/cm HR1 mg/l HR1 HR2 m
1 7)7 M 235 S 0)79 M 0)38 M M 0)2 7)6 M 89 M 0)71 m 0)20 M M 0)3 7)5 M 241 S 0)68 m 0)33 M M 0)4 7)8 M 62 M 0)88 M 0)45 M S 0)5 7)3 M 138 S 2)38 M 0)88 M S 0)6 7)9 M 108 S 0)58 m 0)30 M M 0)7 7)3 M 101 S 0)52 m 0)35 M M 0)8 7)6 M 162 S 0)81 M 0)51 M S 0)9 7)3 M 274 S 3)40 S 1)14 M S 1)
10 7)4 M 243 S 1)50 M 0)87 M S 0)11 7)1 M 231 S 1)83 M 1)25 M S 4)12 7)4 M 202 S 1)72 M 1)12 M S 1)13 7)2 M 225 S 2)68 M 1)38 M S 0)14 7)0 M 237 S 2)74 M 1)36 M S 2)15 7)2 M 139 S 3)29 S 1)08 M S 1)16 7)8 M 112 S 1)52 M 0)48 M S 0)17 7)5 M 312 S 4)98 S 0)85 M S 0)18 7)4 M 910 S 5)70 S 1)34 M S 0)19 7)5 M 284 S 1)54 M 0)06 m m 0)20 7)0 m 303 S 1)64 M 0)07 m m 0)21 7)3 M 149 S 1)44 M 0)06 m m 0)
Notes: HR1, Hazard rating according to Bucks et al.2 HR2, Hsevere; n.m., not measured; n.c., not calculated.
as 10°C from the first emitter (the nearest to the waterinlet) to the last one in the subunit. Considering both theobserved range of temperatures and the emitter flow rateexponent (x) values of the emitters tested, the effect oftemperature on emitter flow rate, evaluated by the pro-cedure suggested by Keller and Karmeli,5 is consideredhere to be negligible.
The uniformity coefficient ºs
values (Table 3) showexcellent uniformity (classified according to Bralts6) in24% of the systems, very good in 10%, fair in 10%, poorin 43%, and unacceptable in 13%. In the systems witha uniformity classified from fair to unacceptable(º
s(80%) the high-pressure variations (»
h(20%) con-
tribute to the low values of the uniformity coefficient onlyin 36% of cases.
The system performance indices are related to eachother (Figs 2 and 3). Table 4 reports the regressioncoefficients between field performance indices with a sig-nificance level less than 10%. Both º
s, »
pfand D
racorre-
late well with the percentage of totally plugged emitters.System performance seems to depend on both operationtime (Fig. 4) and the nominal flow rate (Fig. 5); neverthe-less, the r values of the regression equations do notimprove when the systems are subdivided into morehomogeneous groups by operation time [group (b) inTable 4 includes the fourteen systems in operation for atleast five years], or by nominal emitter flow rate [group(c) in Table 4 only includes drippers].
e 2ted to its potential hazard for emitter clogging
H2S Mn Ca Bc pH
diffMg DO
g/l HR1 HR2 mg/l HR1 HR2 mg/l mg/l mg/l mg/l
34 M S 0)07 m m 136 305 0)24 7)3 9)320 M S 0)07 m m 108 268 0)10 9)7 13)343 M S 0)07 m m 116 299 0)05 7)3 8)545 M S 0)08 m m 124 262 0)27 12)2 10)760 M S 0)10 M m 497 250 !0)38 58)4 4)500 m m 0)06 m m 96 290 0)43 9)7 10)900 m m 0)07 m m 80 281 !0)18 9)7 11)500 m m 0)07 m m 78 262 !0)02 32)8 10)954 M S 1)03 M S 621 281 !0)42 77)8 8)000 m m 0)90 M S 152 360 !0)12 19)5 10)710 S S 1)10 M S 320 384 !0)42 34)1 0)196 M S 0)78 M S 156 336 !0)17 46)2 6)400 m m 0)87 M S 673 256 !0)53 29)2 4)510 S S 0)93 M S 717 281 !0)70 21)9 3)283 M S 0)83 M S 615 275 !0)52 76)6 5)600 m m 0)05 m m 120 268 0)11 43)8 6)400 m m 0)10 m m 300 293 !0)26 90)0 10)100 m m 0)96 m m 521 342 !0)36 99)7 3)200 m m 0)04 m m n.m. 512 n.c. n.m. n.m.00 m m 0)05 m m n.m. 433 n.c. n.m. n.m.00 m m 0)04 m m n.m. 427 n.c. n.m. n.m.
azard rating according to Boswell;11 m, minor; M, moderate; S,
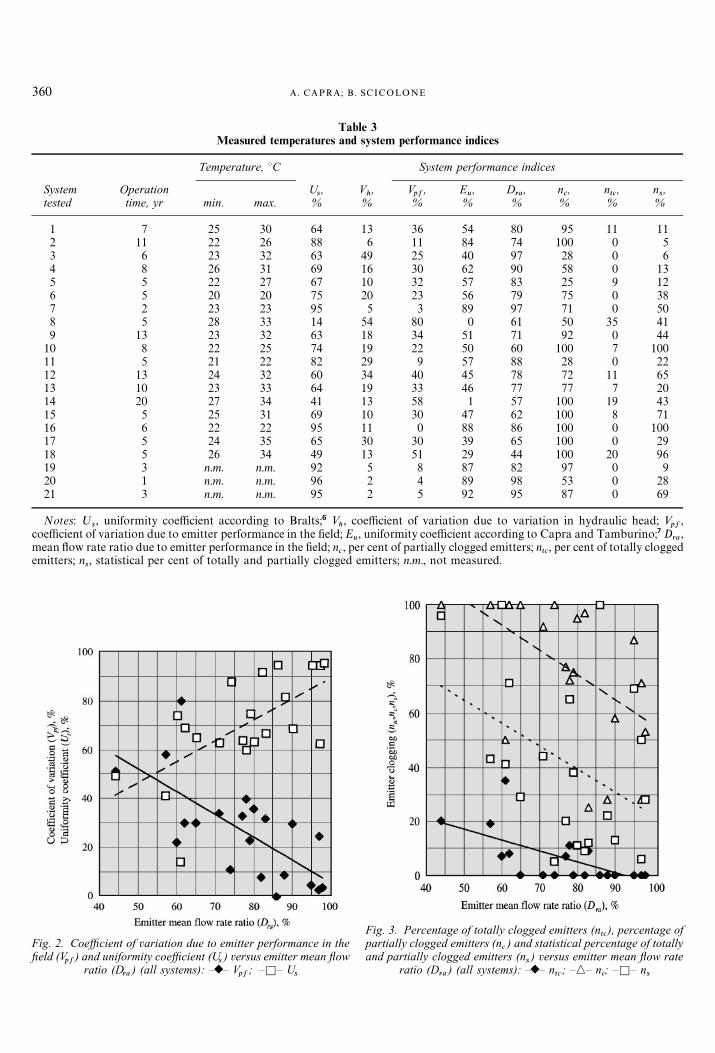
Table 3Measured temperatures and system performance indices
Temperature, °C System performance indices
System Operation Us, V
h, V
pf, E
u, D
ra, n
c, n
tc, n
s,
tested time, yr min. max. % % % % % % % %
1 7 25 30 64 13 36 54 80 95 11 112 11 22 26 88 6 11 84 74 100 0 53 6 23 32 63 49 25 40 97 28 0 64 8 26 31 69 16 30 62 90 58 0 135 5 22 27 67 10 32 57 83 25 9 126 5 20 20 75 20 23 56 79 75 0 387 2 23 23 95 5 3 89 97 71 0 508 5 28 33 14 54 80 0 61 50 35 419 13 23 32 63 18 34 51 71 92 0 44
10 8 22 25 74 19 22 50 60 100 7 10011 5 21 22 82 29 9 57 88 28 0 2212 13 24 32 60 34 40 45 78 72 11 6513 10 23 33 64 19 33 46 77 77 7 2014 20 27 34 41 13 58 1 57 100 19 4315 5 25 31 69 10 30 47 62 100 8 7116 6 22 22 95 11 0 88 86 100 0 10017 5 24 35 65 30 30 39 65 100 0 2918 5 26 34 49 13 51 29 44 100 20 9619 3 n.m. n.m. 92 5 8 87 82 97 0 920 1 n.m. n.m. 96 2 4 89 98 53 0 2821 3 n.m. n.m. 95 2 5 92 95 87 0 69
Notes: ºs, uniformity coefficient according to Bralts;6 »
h, coefficient of variation due to variation in hydraulic head; »
pf,
coefficient of variation due to emitter performance in the field; Eu, uniformity coefficient according to Capra and Tamburino;7 D
ra,
mean flow rate ratio due to emitter performance in the field; nc, per cent of partially clogged emitters; n
tc, per cent of totally clogged
emitters; ns, statistical per cent of totally and partially clogged emitters; n.m., not measured.
Fig. 2. Coefficient of variation due to emitter performance in thefield (V
pf) and uniformity coefficient (U
s) versus emitter mean flow
ratio (Dra
) (all systems): —r— Vpf
; —K— Us
Fig. 3. Percentage of totally clogged emitters (ntc
), percentage ofpartially clogged emitters (n
c) and statistical percentage of totally
and partially clogged emitters (ns) versus emitter mean flow rate
ratio (Dra
) (all systems): —r— ntc
; —n— nc; —K— n
s
360 A. CAPRA; B. SCICOLONE
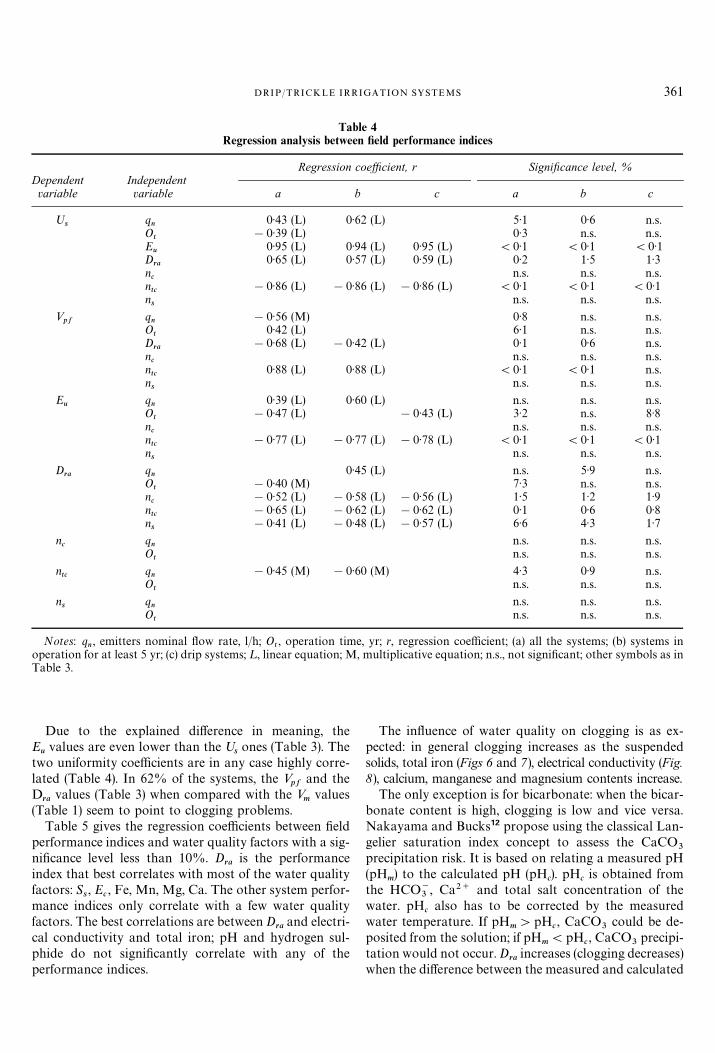
Table 4Regression analysis between field performance indices
Regression coefficient, r Significance level, %Dependent Independentvariable variable a b c a b c
ºs
qn
0)43 (L) 0)62 (L) 5)1 0)6 n.s.O
t!0)39 (L) 0)3 n.s. n.s.
Eu
0)95 (L) 0)94 (L) 0)95 (L) (0)1 (0)1 (0)1D
ra0)65 (L) 0)57 (L) 0)59 (L) 0)2 1)5 1)3
nc
n.s. n.s. n.s.ntc
!0)86 (L) !0)86 (L) !0)86 (L) (0)1 (0)1 (0)1ns
n.s. n.s. n.s.
»pf
qn
!0)56 (M) 0)8 n.s. n.s.O
t0)42 (L) 6)1 n.s. n.s.
Dra
!0)68 (L) !0)42 (L) 0)1 0)6 n.s.nc
n.s. n.s. n.s.ntc
0)88 (L) 0)88 (L) (0)1 (0)1 n.s.ns
n.s. n.s. n.s.
Eu
qn
0)39 (L) 0)60 (L) n.s. n.s. n.s.O
t!0)47 (L) !0)43 (L) 3)2 n.s. 8)8
nc
n.s. n.s. n.s.ntc
!0)77 (L) !0)77 (L) !0)78 (L) (0)1 (0)1 (0)1ns
n.s. n.s. n.s.
Dra
qn
0)45 (L) n.s. 5)9 n.s.O
t!0)40 (M) 7)3 n.s. n.s.
nc
!0)52 (L) !0)58 (L) !0)56 (L) 1)5 1)2 1)9ntc
!0)65 (L) !0)62 (L) !0)62 (L) 0)1 0)6 0)8ns
!0)41 (L) !0)48 (L) !0)57 (L) 6)6 4)3 1)7
nc
qn
n.s. n.s. n.s.O
tn.s. n.s. n.s.
ntc
qn
!0)45 (M) !0)60 (M) 4)3 0)9 n.s.O
tn.s. n.s. n.s.
ns
qn
n.s. n.s. n.s.O
tn.s. n.s. n.s.
Notes: qn, emitters nominal flow rate, l/h; O
t, operation time, yr; r, regression coefficient; (a) all the systems; (b) systems in
operation for at least 5 yr; (c) drip systems; ¸, linear equation; M, multiplicative equation; n.s., not significant; other symbols as inTable 3.
DRIP/TRICKLE IRRIGATION SYSTEMS 361
Due to the explained difference in meaning, theEuvalues are even lower than the º
sones (Table 3). The
two uniformity coefficients are in any case highly corre-lated (Table 4). In 62% of the systems, the »
pfand the
Dra
values (Table 3) when compared with the »m
values(Table 1) seem to point to clogging problems.
Table 5 gives the regression coefficients between fieldperformance indices and water quality factors with a sig-nificance level less than 10%. D
rais the performance
index that best correlates with most of the water qualityfactors: S
s, E
c, Fe, Mn, Mg, Ca. The other system perfor-
mance indices only correlate with a few water qualityfactors. The best correlations are between D
raand electri-
cal conductivity and total iron; pH and hydrogen sul-phide do not significantly correlate with any of theperformance indices.
The influence of water quality on clogging is as ex-pected: in general clogging increases as the suspendedsolids, total iron (Figs 6 and 7), electrical conductivity (Fig.8), calcium, manganese and magnesium contents increase.
The only exception is for bicarbonate: when the bicar-bonate content is high, clogging is low and vice versa.Nakayama and Bucks12 propose using the classical Lan-gelier saturation index concept to assess the CaCO
3precipitation risk. It is based on relating a measured pH(pH
m) to the calculated pH (pH
c). pH
cis obtained from
the HCO~3
, Ca2` and total salt concentration of thewater. pH
calso has to be corrected by the measured
water temperature. If pHm'pH
c, CaCO
3could be de-
posited from the solution; if pHm(pH
c, CaCO
3precipi-
tation would not occur. Dra
increases (clogging decreases)when the difference between the measured and calculated
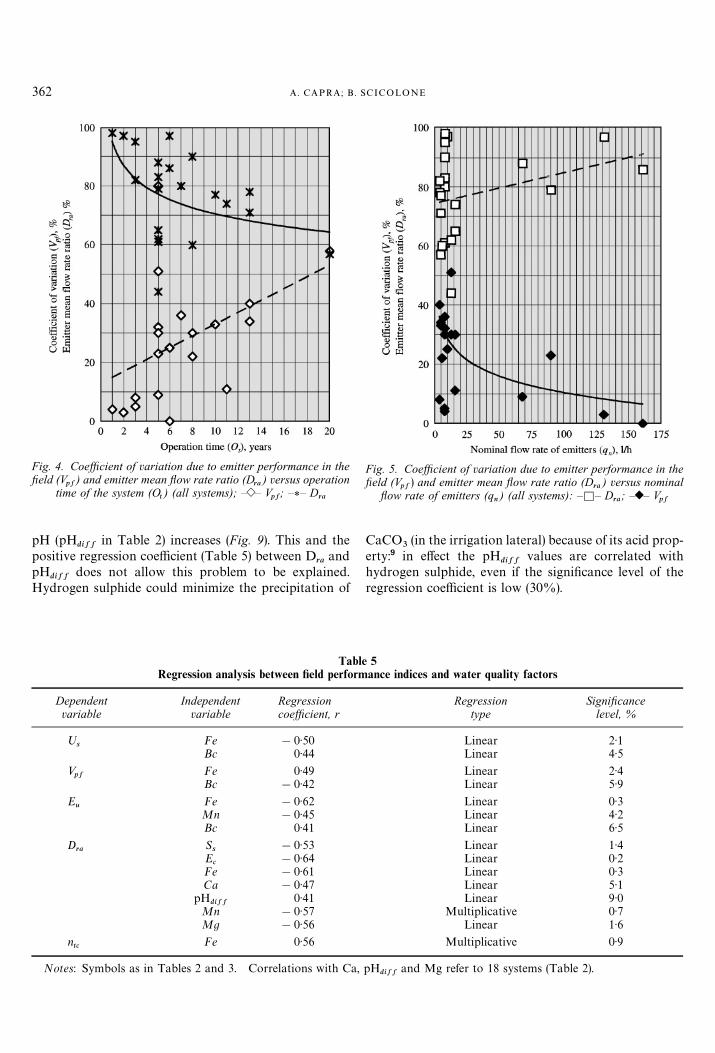
Fig. 4. Coefficient of variation due to emitter performance in thefield (V
pf) and emitter mean flow rate ratio (D
ra) versus operation
time of the system (Ot) (all systems); —e— V
pf; —*— D
ra
Fig. 5. Coefficient of variation due to emitter performance in thefield (V
pf) and emitter mean flow rate ratio (D
ra) versus nominal
flow rate of emitters (qn) (all systems): —K— D
ra; —r— V
pf
362 A. CAPRA; B. SCICOLONE
pH (pHdiff
in Table 2) increases (Fig. 9). This and thepositive regression coefficient (Table 5) between D
raand
pHdiff
does not allow this problem to be explained.Hydrogen sulphide could minimize the precipitation of
TableRegression analysis between field perform
Dependent Independent Regressionvariable variable coefficient, r
ºs
Fe !0)50Bc 0)44
»pf
Fe 0)49Bc !0)42
Eu
Fe !0)62Mn !0)45Bc 0)41
Dra
Ss
!0)53Ec
!0)64Fe !0)61Ca !0)47
pHdiff
0)41Mn !0)57Mg !0)56
ntc
Fe 0)56
Notes: Symbols as in Tables 2 and 3. Correlations with Ca,
CaCO3
(in the irrigation lateral) because of its acid prop-erty:9 in effect the pH
diffvalues are correlated with
hydrogen sulphide, even if the significance level of theregression coefficient is low (30%).
5ance indices and water quality factors
Regression Significancetype level, %
Linear 2)1Linear 4)5
Linear 2)4Linear 5)9
Linear 0)3Linear 4)2Linear 6)5
Linear 1)4Linear 0)2Linear 0)3Linear 5)1Linear 9)0
Multiplicative 0)7Linear 1)6
Multiplicative 0)9
pHdiff
and Mg refer to 18 systems (Table 2).
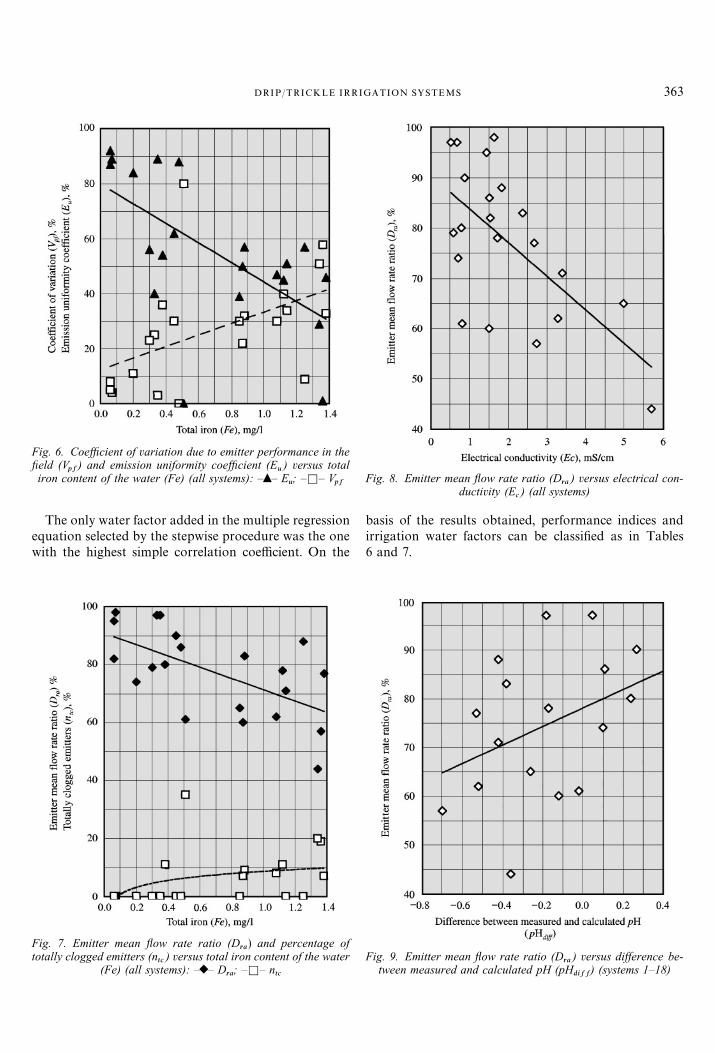
Fig. 6. Coefficient of variation due to emitter performance in thefield (V
pf) and emission uniformity coefficient (E
u) versus total
iron content of the water (Fe) (all systems): —m— Eu; —K— V
pfFig. 8. Emitter mean flow rate ratio (D
ra) versus electrical con-
ductivity (Ec) (all systems)
DRIP/TRICKLE IRRIGATION SYSTEMS 363
The only water factor added in the multiple regressionequation selected by the stepwise procedure was the onewith the highest simple correlation coefficient. On the
Fig. 7. Emitter mean flow rate ratio (Dra
) and percentage oftotally clogged emitters (n
tc) versus total iron content of the water
(Fe) (all systems): —r— Dra
; —K— ntc
basis of the results obtained, performance indices andirrigation water factors can be classified as in Tables6 and 7.
Fig. 9. Emitter mean flow rate ratio (Dra
) versus difference be-tween measured and calculated pH (pH
diff) (systems 1—18)
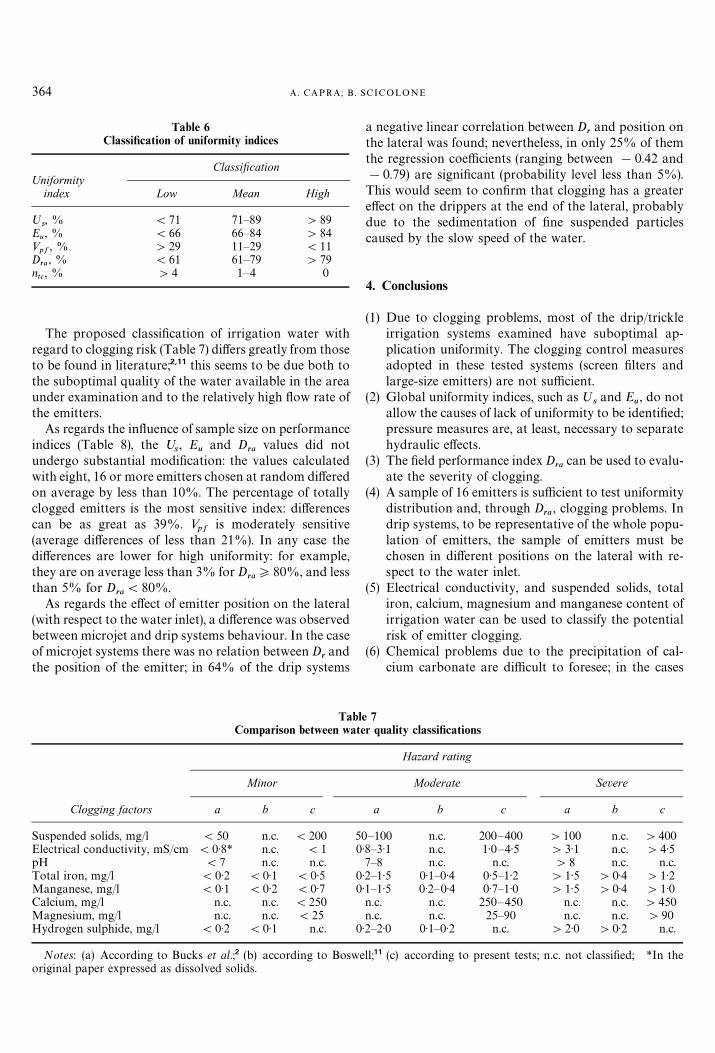
Table 6Classification of uniformity indices
ClassificationUniformity
index Low Mean High
ºs, % (71 71—89 '89
Eu, % (66 66—84 '84
»pf
, % '29 11—29 (11D
ra, % (61 61—79 '79
ntc, % '4 1—4 0
364 A. CAPRA; B. SCICOLONE
The proposed classification of irrigation water withregard to clogging risk (Table 7) differs greatly from thoseto be found in literature;2,11 this seems to be due both tothe suboptimal quality of the water available in the areaunder examination and to the relatively high flow rate ofthe emitters.
As regards the influence of sample size on performanceindices (Table 8), the º
s, E
uand D
ravalues did not
undergo substantial modification: the values calculatedwith eight, 16 or more emitters chosen at random differedon average by less than 10%. The percentage of totallyclogged emitters is the most sensitive index: differencescan be as great as 39%. »
pfis moderately sensitive
(average differences of less than 21%). In any case thedifferences are lower for high uniformity: for example,they are on average less than 3% for D
ra*80%, and less
than 5% for Dra(80%.
As regards the effect of emitter position on the lateral(with respect to the water inlet), a difference was observedbetween microjet and drip systems behaviour. In the caseof microjet systems there was no relation between D
rand
the position of the emitter; in 64% of the drip systems
TablComparison between wate
Minor
Clogging factors a b c
Suspended solids, mg/l (50 n.c. (200 5Electrical conductivity, mS/cm (0)8* n.c. (1 0pH (7 n.c. n.c.Total iron, mg/l (0)2 (0)1 (0)5 0Manganese, mg/l (0)1 (0)2 (0)7 0Calcium, mg/l n.c. n.c. (250Magnesium, mg/l n.c. n.c. (25Hydrogen sulphide, mg/l (0)2 (0)1 n.c. 0
Notes: (a) According to Bucks et al.;2 (b) according to Bosweoriginal paper expressed as dissolved solids.
a negative linear correlation between Drand position on
the lateral was found; nevertheless, in only 25% of themthe regression coefficients (ranging between !0.42 and!0.79) are significant (probability level less than 5%).This would seem to confirm that clogging has a greatereffect on the drippers at the end of the lateral, probablydue to the sedimentation of fine suspended particlescaused by the slow speed of the water.
4. Conclusions
(1) Due to clogging problems, most of the drip/trickleirrigation systems examined have suboptimal ap-plication uniformity. The clogging control measuresadopted in these tested systems (screen filters andlarge-size emitters) are not sufficient.
(2) Global uniformity indices, such as ºsand E
u, do not
allow the causes of lack of uniformity to be identified;pressure measures are, at least, necessary to separatehydraulic effects.
(3) The field performance index Dra
can be used to evalu-ate the severity of clogging.
(4) A sample of 16 emitters is sufficient to test uniformitydistribution and, through D
ra, clogging problems. In
drip systems, to be representative of the whole popu-lation of emitters, the sample of emitters must bechosen in different positions on the lateral with re-spect to the water inlet.
(5) Electrical conductivity, and suspended solids, totaliron, calcium, magnesium and manganese content ofirrigation water can be used to classify the potentialrisk of emitter clogging.
(6) Chemical problems due to the precipitation of cal-cium carbonate are difficult to foresee; in the cases
e 7r quality classifications
Hazard rating
Moderate Severe
a b c a b c
0—100 n.c. 200—400 '100 n.c. '400)8—3)1 n.c. 1)0—4)5 '3)1 n.c. '4)57—8 n.c. n.c. '8 n.c. n.c.)2—1)5 0)1—0)4 0)5—1)2 '1)5 '0)4 '1)2)1—1)5 0)2—0)4 0)7—1)0 '1)5 '0)4 '1)0n.c. n.c. 250—450 n.c. n.c. '450n.c. n.c. 25—90 n.c. n.c. '90)2—2)0 0)1—0)2 n.c. '2)0 '0)2 n.c.
ll;11 (c) according to present tests; n.c. not classified; *In the
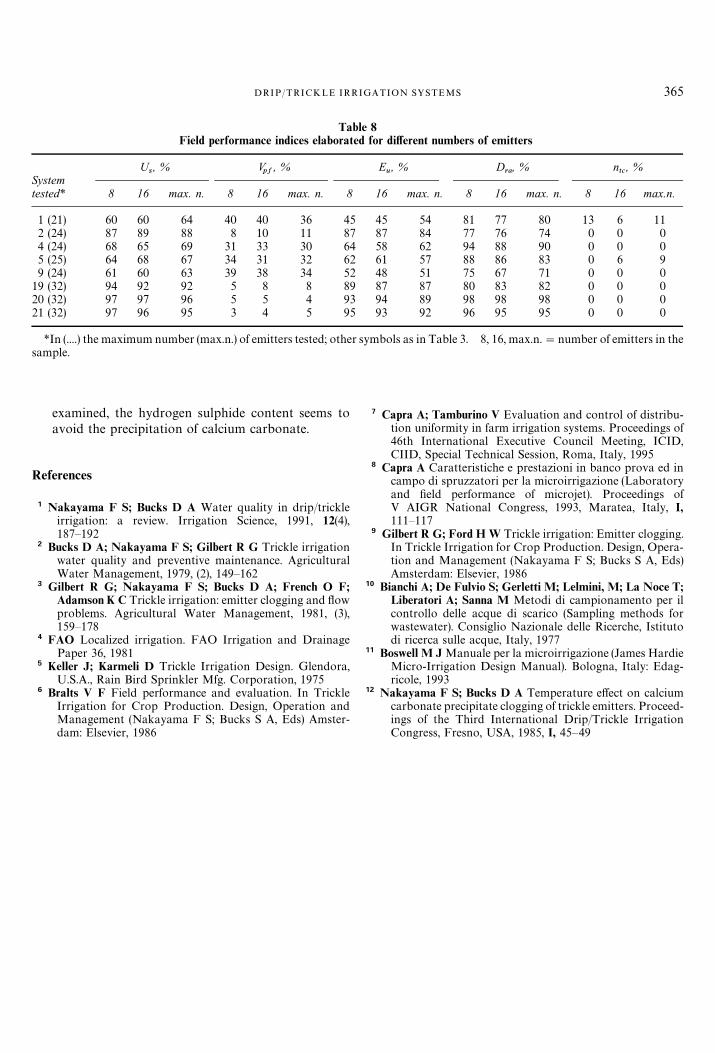
Table 8Field performance indices elaborated for different numbers of emitters
Us, % V
pf, % E
u, % D
ra, % n
tc, %
Systemtested* 8 16 max. n. 8 16 max. n. 8 16 max. n. 8 16 max. n. 8 16 max.n.
1 (21) 60 60 64 40 40 36 45 45 54 81 77 80 13 6 112 (24) 87 89 88 8 10 11 87 87 84 77 76 74 0 0 04 (24) 68 65 69 31 33 30 64 58 62 94 88 90 0 0 05 (25) 64 68 67 34 31 32 62 61 57 88 86 83 0 6 99 (24) 61 60 63 39 38 34 52 48 51 75 67 71 0 0 0
19 (32) 94 92 92 5 8 8 89 87 87 80 83 82 0 0 020 (32) 97 97 96 5 5 4 93 94 89 98 98 98 0 0 021 (32) 97 96 95 3 4 5 95 93 92 96 95 95 0 0 0
*In (....) the maximum number (max.n.) of emitters tested; other symbols as in Table 3. 8, 16, max.n."number of emitters in thesample.
DRIP/TRICKLE IRRIGATION SYSTEMS 365
examined, the hydrogen sulphide content seems toavoid the precipitation of calcium carbonate.
References
1 Nakayama F S; Bucks D A Water quality in drip/trickleirrigation: a review. Irrigation Science, 1991, 12(4),187—192
2 Bucks D A; Nakayama F S; Gilbert R G Trickle irrigationwater quality and preventive maintenance. AgriculturalWater Management, 1979, (2), 149—162
3 Gilbert R G; Nakayama F S; Bucks D A; French O F;Adamson K C Trickle irrigation: emitter clogging and flowproblems. Agricultural Water Management, 1981, (3),159—178
4 FAO Localized irrigation. FAO Irrigation and DrainagePaper 36, 1981
5 Keller J; Karmeli D Trickle Irrigation Design. Glendora,U.S.A., Rain Bird Sprinkler Mfg. Corporation, 1975
6 Bralts V F Field performance and evaluation. In TrickleIrrigation for Crop Production. Design, Operation andManagement (Nakayama F S; Bucks S A, Eds) Amster-dam: Elsevier, 1986
7 Capra A; Tamburino V Evaluation and control of distribu-tion uniformity in farm irrigation systems. Proceedings of46th International Executive Council Meeting, ICID,CIID, Special Technical Session, Roma, Italy, 1995
8 Capra A Caratteristiche e prestazioni in banco prova ed incampo di spruzzatori per la microirrigazione (Laboratoryand field performance of microjet). Proceedings ofV AIGR National Congress, 1993, Maratea, Italy, I,111—117
9 Gilbert R G; Ford H W Trickle irrigation: Emitter clogging.In Trickle Irrigation for Crop Production. Design, Opera-tion and Management (Nakayama F S; Bucks S A, Eds)Amsterdam: Elsevier, 1986
10 Bianchi A; De Fulvio S; Gerletti M; Lelmini, M; La Noce T;Liberatori A; Sanna M Metodi di campionamento per ilcontrollo delle acque di scarico (Sampling methods forwastewater). Consiglio Nazionale delle Ricerche, Istitutodi ricerca sulle acque, Italy, 1977
11 Boswell M J Manuale per la microirrigazione (James HardieMicro-Irrigation Design Manual). Bologna, Italy: Edag-ricole, 1993
12 Nakayama F S; Bucks D A Temperature effect on calciumcarbonate precipitate clogging of trickle emitters. Proceed-ings of the Third International Drip/Trickle IrrigationCongress, Fresno, USA, 1985, I, 45—49