water management planning - energy.gov · figure 2. example water balance diagram a perfect water...
TRANSCRIPT
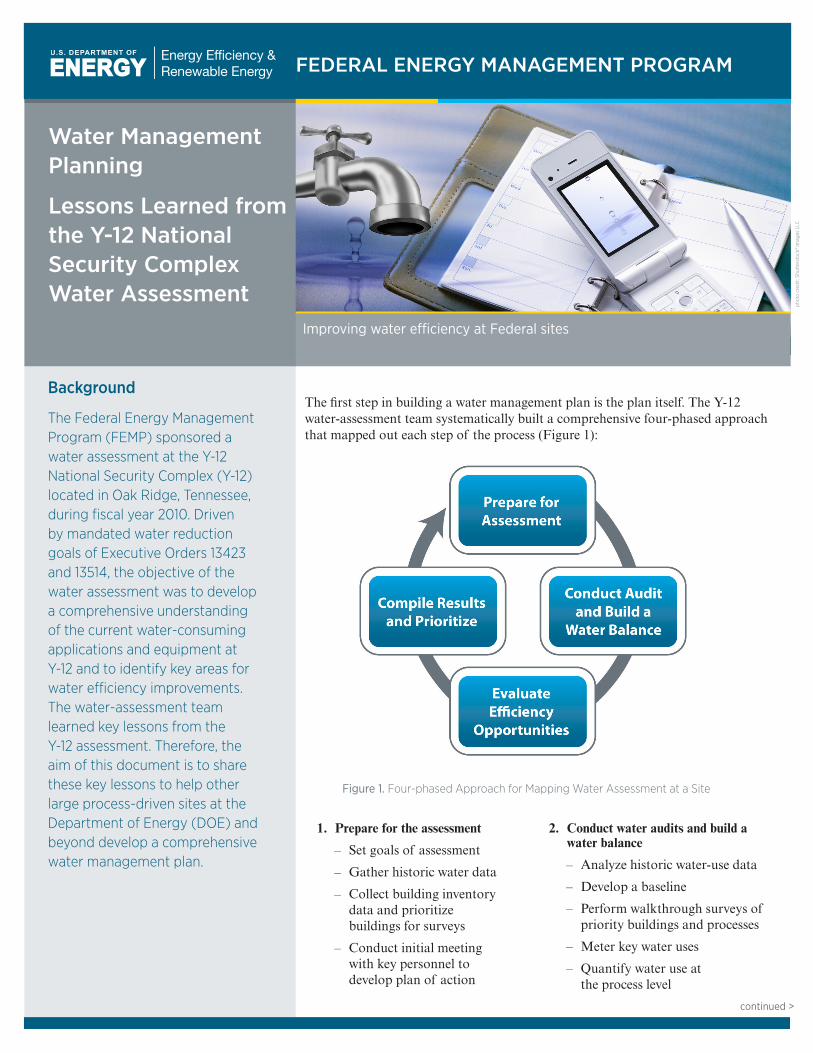
Improving water efficiency at Federal sites
Background
The Federal Energy Management Program (FEMP) sponsored a water assessment at the Y-12 National Security Complex (Y-12) located in Oak Ridge, Tennessee, during fiscal year 2010. Driven by mandated water reduction goals of Executive Orders 13423 and 13514, the objective of the water assessment was to develop a comprehensive understanding of the current water-consuming applications and equipment at Y-12 and to identify key areas for water efficiency improvements. The water-assessment team learned key lessons from the Y-12 assessment. Therefore, the aim of this document is to share these key lessons to help other large process-driven sites at the Department of Energy (DOE) and beyond develop a comprehensive water management plan.
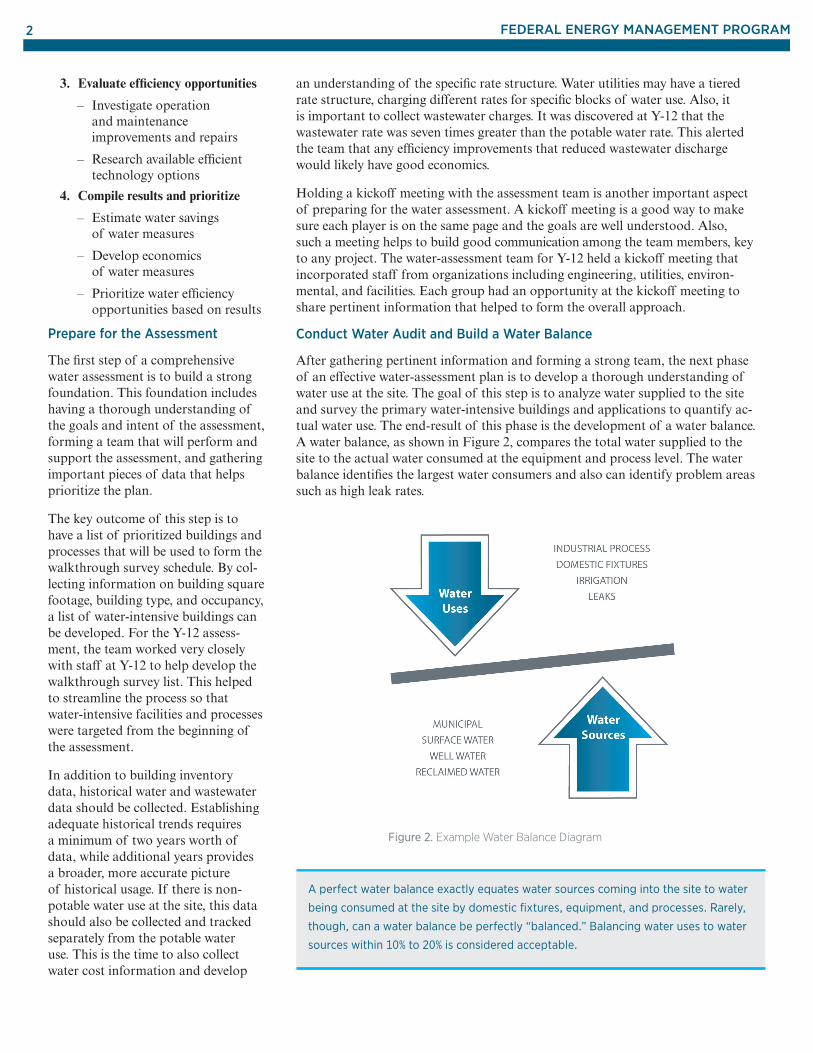
The first step in building a water management plan is the plan itself. The Y-12 water-assessment team systematically built a comprehensive four-phased approach that mapped out each step of the process (Figure 1):
Water Management Planning
Lessons Learned from the Y-12 National Security Complex Water Assessment
FEDERAL ENERGY MANAGEMENT PROGRAM
1. Prepare for the assessment
– Set goals of assessment
– Gather historic water data
– Collect building inventory data and prioritize buildings for surveys
– Conduct initial meeting with key personnel to develop plan of action
2. Conduct water audits and build a water balance
– Analyze historic water-use data
– Develop a baseline
– Perform walkthrough surveys of priority buildings and processes
– Meter key water uses
– Quantify water use at the process level
continued >
Figure 1. Four-phased Approach for Mapping Water Assessment at a Siteph
oto
cred
it: S
hutt
erst
ock®
Imag
es L
LC
2
3. Evaluate efficiency opportunities
– Investigate operation and maintenance improvements and repairs
– Research available efficient technology options
4. Compile results and prioritize
– Estimate water savings of water measures
– Develop economics of water measures
– Prioritize water efficiency opportunities based on results
Prepare for the Assessment
The first step of a comprehensive water assessment is to build a strong foundation. This foundation includes having a thorough understanding of the goals and intent of the assessment, forming a team that will perform and support the assessment, and gathering important pieces of data that helps prioritize the plan.
The key outcome of this step is to have a list of prioritized buildings and processes that will be used to form the walkthrough survey schedule. By col-lecting information on building square footage, building type, and occupancy, a list of water-intensive buildings can be developed. For the Y-12 assess-ment, the team worked very closely with staff at Y-12 to help develop the walkthrough survey list. This helped to streamline the process so that water-intensive facilities and processes were targeted from the beginning of the assessment.
In addition to building inventory data, historical water and wastewater data should be collected. Establishing adequate historical trends requires a minimum of two years worth of data, while additional years provides a broader, more accurate picture of historical usage. If there is non-potable water use at the site, this data should also be collected and tracked separately from the potable water use. This is the time to also collect water cost information and develop
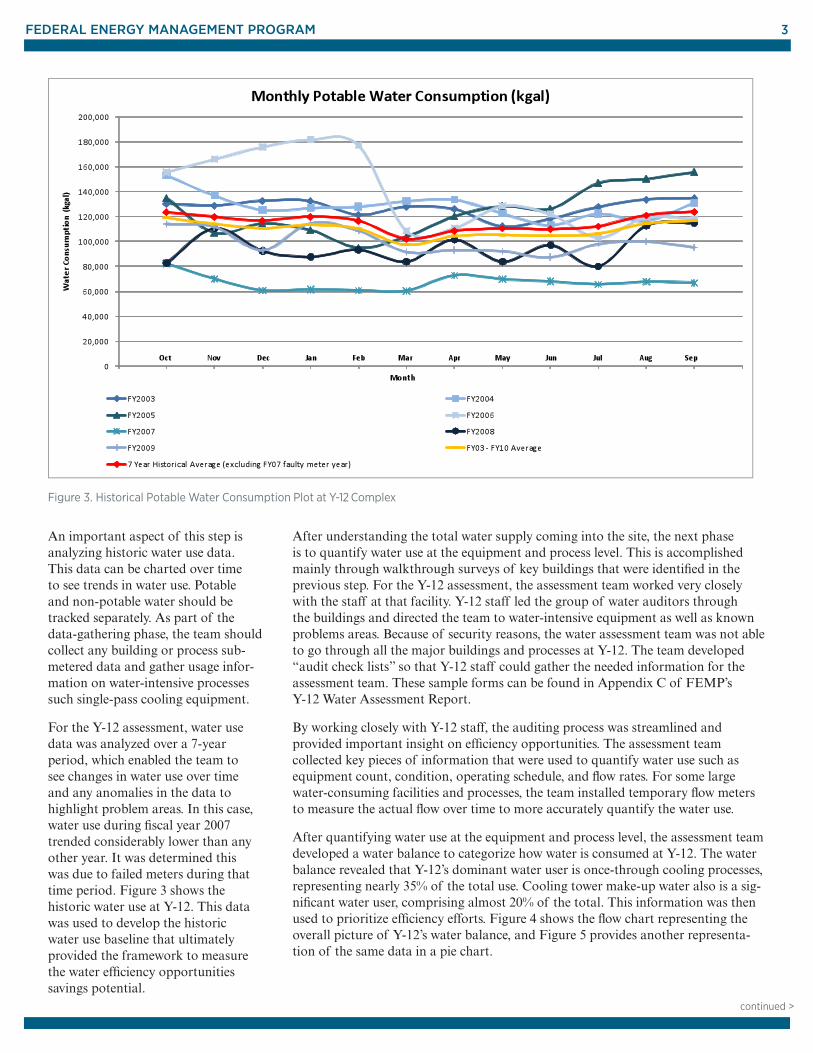
Figure 2. Example Water Balance Diagram
A perfect water balance exactly equates water sources coming into the site to water
being consumed at the site by domestic fixtures, equipment, and processes. Rarely,
though, can a water balance be perfectly “balanced.” Balancing water uses to water
sources within 10% to 20% is considered acceptable.
an understanding of the specific rate structure. Water utilities may have a tiered rate structure, charging different rates for specific blocks of water use. Also, it is important to collect wastewater charges. It was discovered at Y-12 that the wastewater rate was seven times greater than the potable water rate. This alerted the team that any efficiency improvements that reduced waste water discharge would likely have good economics.
Holding a kickoff meeting with the assessment team is another important aspect of preparing for the water assessment. A kickoff meeting is a good way to make sure each player is on the same page and the goals are well understood. Also, such a meeting helps to build good communication among the team members, key to any project. The water-assessment team for Y-12 held a kickoff meeting that incor porated staff from organizations including engineering, utilities, environ-mental, and facilities. Each group had an opportunity at the kickoff meeting to share pertinent information that helped to form the overall approach.
Conduct Water Audit and Build a Water Balance
After gathering pertinent information and forming a strong team, the next phase of an effective water-assessment plan is to develop a thorough understanding of water use at the site. The goal of this step is to analyze water supplied to the site and survey the primary water-intensive buildings and applica tions to quantify ac-tual water use. The end-result of this phase is the development of a water balance. A water balance, as shown in Figure 2, compares the total water supplied to the site to the actual water consumed at the equipment and process level. The water balance identifies the largest water consumers and also can identify problem areas such as high leak rates.
FEDERAL ENERGY MANAGEMENT PROGRAM
3
Figure 3. Historical Potable Water Consumption Plot at Y-12 Complex
An important aspect of this step is analyzing historic water use data. This data can be charted over time to see trends in water use. Potable and non-potable water should be tracked separately. As part of the data-gathering phase, the team should collect any building or process sub- metered data and gather usage infor-mation on water-intensive processes such single-pass cooling equipment.
For the Y-12 assessment, water use data was analyzed over a 7-year period, which enabled the team to see changes in water use over time and any anomalies in the data to highlight problem areas. In this case, water use during fiscal year 2007 trended considerably lower than any other year. It was determined this was due to failed meters during that time period. Figure 3 shows the historic water use at Y-12. This data was used to develop the historic water use baseline that ultimately provided the framework to measure the water efficiency opportunities savings potential.
After understanding the total water supply coming into the site, the next phase is to quantify water use at the equipment and process level. This is accomplished mainly through walkthrough surveys of key buildings that were identified in the previous step. For the Y-12 assessment, the assessment team worked very closely with the staff at that facility. Y-12 staff led the group of water auditors through the buildings and directed the team to water-intensive equipment as well as known problems areas. Because of security reasons, the water assessment team was not able to go through all the major buildings and processes at Y-12. The team developed “audit check lists” so that Y-12 staff could gather the needed information for the assessment team. These sample forms can be found in Appendix C of FEMP’s Y-12 Water Assessment Report.
By working closely with Y-12 staff, the auditing process was streamlined and provided important insight on efficiency opportunities. The assessment team collected key pieces of information that were used to quantify water use such as equipment count, condition, operating schedule, and flow rates. For some large water-consuming facilities and proces ses, the team installed temporary flow meters to measure the actual flow over time to more accurately quantify the water use.
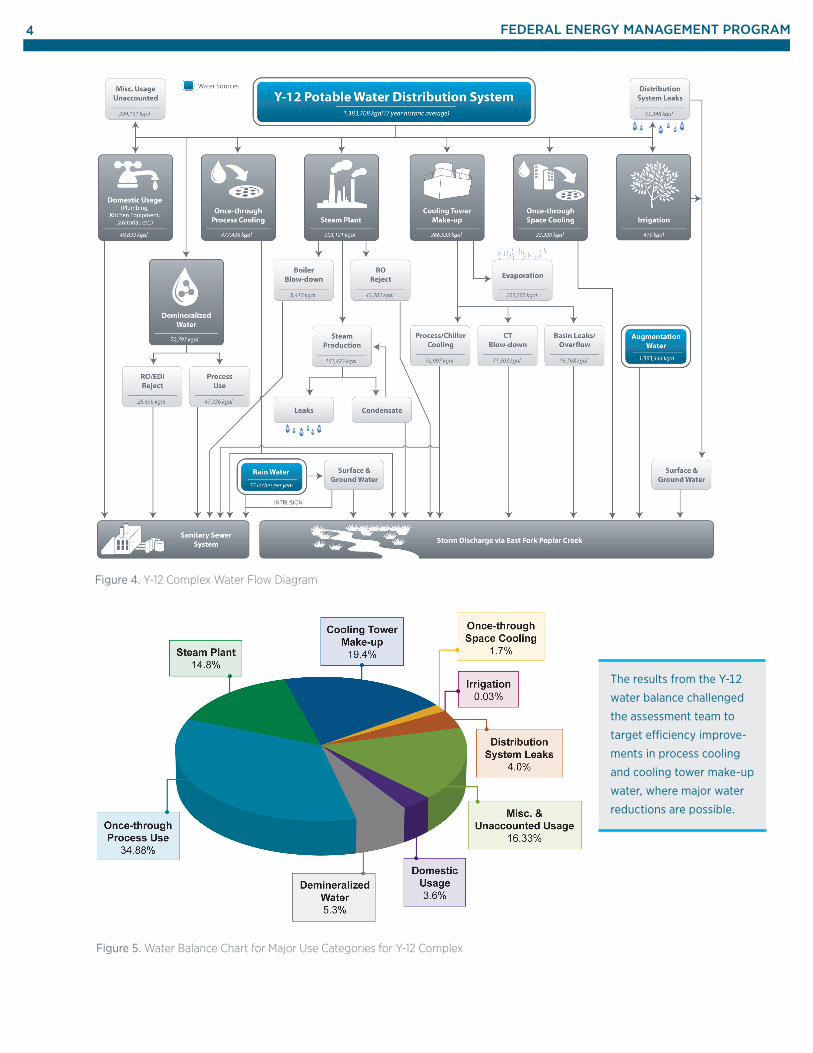
After quantifying water use at the equipment and process level, the assessment team developed a water balance to categorize how water is consumed at Y-12. The water balance revealed that Y-12’s dominant water user is once-through cooling processes, representing nearly 35% of the total use. Cooling tower make-up water also is a sig-nificant water user, comprising almost 20% of the total. This information was then used to prioritize efficiency efforts. Figure 4 shows the flow chart represent ing the overall picture of Y-12’s water balance, and Figure 5 provides another representa-tion of the same data in a pie chart.
FEDERAL ENERGY MANAGEMENT PROGRAM
continued >
4
Figure 4. Y-12 Complex Water Flow Diagram
Figure 5. Water Balance Chart for Major Use Categories for Y-12 Complex
The results from the Y-12
water balance challenged
the assessment team to
target efficiency improve-
ments in process cooling
and cooling tower make-up
water, where major water
reductions are possible.
FEDERAL ENERGY MANAGEMENT PROGRAM
5
Because of Y-12’s high wastewater rate, the team zeroed in on extensive replace-ment of domestic plumbing fixtures, which dramatically reduces wastewater discharge and cost. Retrofits included installation of high efficiency toilets and urinals with piston valve technology, along with pressure compensating high efficiency showerheads. Additional areas that were investigated for efficiency opportunities included a large commercial kitchen, a steam plant, and replacement of once-through space-cooling systems.
Compile Results and Prioritize
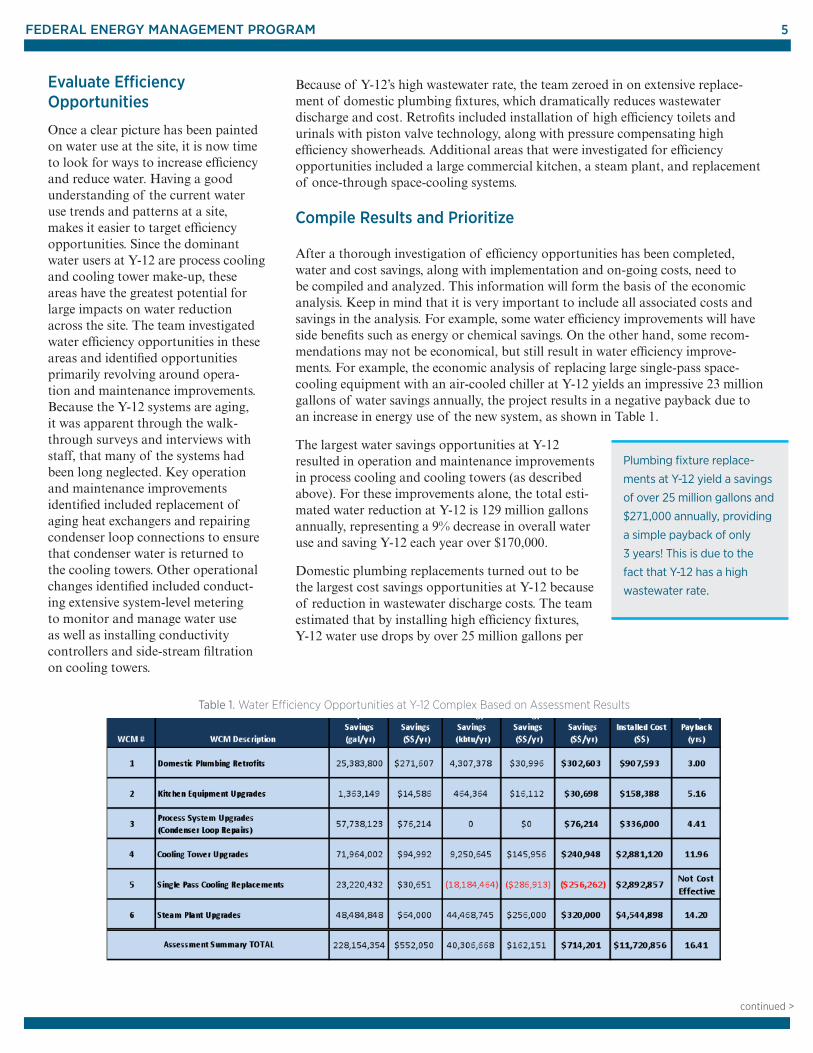
After a thorough investigation of efficiency opportunities has been completed, water and cost savings, along with implementation and on-going costs, need to be compiled and analyzed. This information will form the basis of the economic analysis. Keep in mind that it is very important to include all associated costs and savings in the analysis. For example, some water efficiency improvements will have side benefits such as energy or chemical savings. On the other hand, some recom-mendations may not be economical, but still result in water efficiency improve-ments. For example, the economic analysis of replacing large single-pass space-cooling equipment with an air-cooled chiller at Y-12 yields an impressive 23 million gallons of water savings annually, the project results in a negative payback due to an increase in energy use of the new system, as shown in Table 1.
The largest water savings opportunities at Y-12 resulted in operation and maintenance improvements in process cooling and cooling towers (as described above). For these improvements alone, the total esti-mated water reduction at Y-12 is 129 million gallons annually, representing a 9% decrease in overall water use and saving Y-12 each year over $170,000.
Domestic plumbing replacements turned out to be the largest cost savings oppor tun ities at Y-12 because of reduction in wastewater discharge costs. The team estimated that by installing high efficiency fixtures, Y-12 water use drops by over 25 million gallons per
Plumbing fixture replace-
ments at Y-12 yield a savings
of over 25 million gallons and
$271,000 annually, providing
a simple payback of only
3 years! This is due to the
fact that Y-12 has a high
wastewater rate.
Evaluate Efficiency Opportunities
Once a clear picture has been painted on water use at the site, it is now time to look for ways to increase efficiency and reduce water. Having a good understanding of the current water use trends and patterns at a site, makes it easier to target efficiency opportunities. Since the dominant water users at Y-12 are process cooling and cooling tower make-up, these areas have the greatest potential for large impacts on water reduction across the site. The team investigated water efficiency opportunities in these areas and identified opportunities primarily revolving around opera-tion and maintenance improvements. Because the Y-12 systems are aging, it was apparent through the walk-through surveys and interviews with staff, that many of the systems had been long neglected. Key operation and maintenance improvements identified included replacement of aging heat exchangers and repairing condenser loop connections to ensure that condenser water is returned to the cooling towers. Other operational changes identified included conduct-ing extensive system-level metering to monitor and manage water use as well as installing conductivity controllers and side-stream filtration on cooling towers.
Table 1. Water Efficiency Opportunities at Y-12 Complex Based on Assessment Results
FEDERAL ENERGY MANAGEMENT PROGRAM
continued >
6
For Further Resources on Water Management
FEMP Water Efficiency Website: www.femp.energy.gov/program/waterefficiency.html
Federal Requirements: www.femp.energy.gov/program/waterefficiency_requirements.html
Web-based Water Management Training: femptraining.labworks.org/
FEMP First Thursday Seminar (archived videocast): apps1.eere.energy.gov/femp/training/course_detail_ondemand.cfm/CourseId=21
WaterSense: www.epa.gov/watersense/index.html
Alliance for Water Efficiency: allianceforwaterefficiency.org/
If questions remain, contact:
Will Lintner Federal Energy Management Program (202) 586-3120 [email protected]
Kate McMordie Stoughton Pacific Northwest National Laboratory (720) 379-3511 [email protected]
year, resulting in a cost saving over $271,000 annually. This yields a simple payback of a mere 3 years. A summa-ry of the results of the water effic iency opportunities are shown in Table 1.
Demonstrated Results
The Y-12 water assessment team inspected process cooling applications and found indications that condenser water was being discharged instead of being returned to the cooling tower, which essentially turns a closed system into once-through cooling. Based on the recommendation from the water assessment team, staff at Y-12 performed an internal audit of the condenser loop to determine if return water was being discharged to either the sanitary or storm drainage by placing dye in the cooling tower and tracking where the dye discharged. The dye was confirmed in the sani-tary sewer in 7 minutes after being introduced into the cooling tower. Also, Y-12 staff found cooling tower lines were draining directly to the sanitary sewer. These lines were shut off and flow measurements showed a drastic reduction in sanitary sewer flows. It is estimated that by shutting off these lines to the sanitary sewer, there is a reduction in flow of about 154 gpm. Because of Y-12’s high sanitary sewer rates, this will save the complex $750,000 annually.
In conclusion, based on the thorough assessment and results of the eco-nomic analysis, a site will have the key information to form an implementa-tion plan of water efficiency improve-ments. This plan should be based on a prioritization of both water and cost savings and be reevaluated annually to assess results of past retrofits and to plan for the next round of efficiency improvements.
FEDERAL ENERGY MANAGEMENT PROGRAM
EERE Information Center1-877-EERE-INFO (1-877-337-3463)www.eere.energy.gov/informationcenter This document was prepared by the Pacific Northwest National Laboratory (PNNL) and Water Savers, LCC on behalf of the Federal Energy Management Program.
Printed with a renewable-source ink on paper containing at least 50% wastepaper, including 10% post consumer waste.
PNNL-SA-76321 • November 2010