water in the western cape economy - wrc in the western cape econom… · water in the western cape...
TRANSCRIPT

Water in the Western Cape Economy
Report to the WATER RESEARCH COMMISSION
by
Guy Pegram and Hannah Baleta
WRC Report No. 2075/1/13 ISBN 978-1-4312-0517-2
March 2014

ii
Obtainable from Water Research Commission Private Bag X03 Gezina, 0031 [email protected] or download from www.wrc.org.za
DISCLAIMER This report has been reviewed by the Water Research Commission (WRC) and approved for
publication. Approval does not signify that the contents necessarily reflect the views and policies of the WRC nor does mention of trade names or commercial products constitute
endorsement or recommendation for use.
© Water Research Commission

iii
Executive Summary
BACKGROUND There is increasing consensus in the international water, scientific and development communities that water scarcity will increase dramatically in many parts of the world in the next 20 to 30 years. This will have significant social, political and economic consequences. Awareness of climate change over the past decade has focused broad attention on water as a key resource under threat. This increasing water scarcity will have effects on agriculture, energy, trade, the environment, national sovereignty and international relations as nations who are water scarce continue to deplete their resources while looking to water rich areas to ensure their long term growth and sustainability. In South Africa, these factors increase the challenge of managing South Africa’s limited water resources to achieve economic and social justice imperatives. Historically, water planning has focused on water resources infrastructure development and operation, supported by demand management initiatives to reconcile water requirements and availability. However, as water resources are increasingly developed and utilised, catchment quantity and quality stress tend to increase. The resulting complexity in management and use requires a shift towards improved governance and balancing of competing economic, social and ecological interests. Consideration of the nature of water as a development catalyst or possible constraint on economic growth and social development has prompted the establishment of the Water for Growth and Development (WfGD) framework. This implies a shift from water for the economy to water in the economy. WfGD explores the way in which the water sector contributes to economic, social, and environmental imperatives, also considering the relationship between government and the private sector. At a water management area level, catchment management strategies will increasingly have to adopt a more integrated economic development paradigm in addressing water resources concerns, as technical solutions become increasingly expensive and inappropriate for local development needs. This project investigates possible ways of assessing regional water resources in the Western Cape system (Berg and Breede-Overberg WMAs) from a political-economic and developmental perspective. This can be used to inform water management strategy processes (both the National Water Resources Strategy and Catchment Management Strategies) as well as provide the types of information that allow effective engagement with provincial and local government planning processes. A few considerations must be recognised:
• Increasingly stressed water resources and the uncertainty of climate and development futures have highlighted the close interactions between water, energy and food security at a national level.
• There is significant global and national uncertainty about future pathways in the energy-carbon and food-fibre sectors to meet the population and economic growth projections over the next 20 to 40 years, which is compounded by changing climate conditions.

iv
• All of these have profound impacts on water, and this will require alignment between South Africa’s position on water security and positions on energy security and food security, given the water constraints in South Africa.
These considerations raise important dimensions of water in the economy, namely the flow of embedded water through the economy. The concept of embedded water is defined as water that is used to produce a product or service, either directly in production or embedded in (the production of) inputs that are required for the production process. From this perspective, different sectors are dependent upon water in their production or supply chains. This concept of embedded water and water footprint provides a way of understanding the intensity of water dependency of different sectors (even though their direct use may be relatively small). Similarly, the flow of embedded water in goods and services that are traded internationally can be assessed. This indicates the amount of water that is either exported or imported from the country, which is a critical implication of trade. In all of the above, there are obvious spatial, scale and development issues, focusing on different economic imperatives. At a local scale, water use has profound impacts on local economic development (particularly in rural areas), with important poverty, equity and livelihoods issues. At a national scale, water supports economic growth, with critical issues around the nature of the economy. At a global scale, water in the South African economy impacts directly on trade, security and the current account (which for South Africa is an important issue). Important themes of redress, poverty, equity and spatial underdevelopment must be considered with the growth oriented GDP perspective, particularly in the context of South Africa with its challenges around widespread poverty, rural development and high Gini coefficient. Following consideration of the context beforehand, the aims of the project are as follows: AIM 1 To frame possible government and corporate responses at a basin level which reflect the shared risk paradigm, the political economy of water use and the challenges of future development and climate uncertainty.
AIM 2 To improve understanding of the economy linked to water use in a river basin. This will be based on the use and movement of embedded water in goods and services, at subsistence local market, regional economic and international trade levels. Linkages into food, energy and water security were considered.
AIM 3 To develop and improve tools and approaches to quantitatively and qualitatively evaluate basin water use and its political-economic implications under future climate and development uncertainties. AIM 4 To foster dialogue between government, corporate and civil society representatives about the use, protection and development of basin water resources to secure political, economic, social and ecological development imperatives. This will be through the lens of shared risk in a basin with increasingly stressed water resources.

v
METHODOLOGY This project must consider the goods and services produced in the Western Cape from comprehensive water, economic, and social perspectives. This analysis, in addition to the current scenario, must look at plausible development scenarios given different economic and political growth trends. Task 1: Development of an economic analysis tool Social accounting matrices, economic impact analysis, input: output, and cost benefit analysis, etc. are able to integrate economic indicators such as employment, per capita and regional income with commonly used water metrics. This connects water use in a basin with local, regional, national and global economy. A review was done to identify best practise. Water footprinting was used as it is able to inform basin planning decisions by illustrating how water affects growth and development and how changes in the economy impact water demand.
Task 2: Water in the economy analysis Through water footprinting, basin water uses in the production of goods and services was done. This enabled understanding of the hydrology and yield of a system on one hand, and the flow of embedded water through the society and the economy at a district municipality level. The purpose of this assessment was to track water required to support different parts of the economy and society, and identify how embedded water moves within the Western Cape, nationally and internationally.
Task 3: Institutional arrangements Policy-legislative and administrative-governance arrangements related to water, energy, agriculture, environment and trade/industry were explored at each district municipality level. This took a governmental and corporate perspective through the shared risk paradigm.
Task 4: Future scenarios Future scenarios were developed from the trends and expectations of the local, national and global energy, agriculture, trade, political and water management environments. Quality and quantity implications for agriculture, industry, urban supply and environmental requirements were considered.
Task 5: Recommendations The recommendations considered a range of platforms and situations whereby this process and information may be useful. These findings came specifically out of the steering committee meetings held, as well as through interviews and meetings with key stakeholders in the province.
Task 6: Multi-stakeholder dialogue The ultimate objective of this project was to create multi-stakeholder discussions around shared risk at a system level, consisting of the key role players representing different interests and risks. The intention is to observe whether bringing an alternative perspective to water management shifts the planning paradigm of water resources, development and corporate planners.

vi
RESULTS AND DISCUSSION The preceding text on the aims and methodology shifted through the course of the research. Due to data difficulties and the complexity of the project, some of the analysis was simplified. In other respects, in recognition of the diversity in The Western Cape, a portion of the analysis was expanded. AIM 1 To frame possible government and corporate responses at a basin level which reflect the shared risk paradigm, the political economy of water use and the challenges of future development and climate uncertainty.
The following figure frames the attempt through which water footprinting at a provincial level was going to help build communication between the public and private sector. Whether or not this information is truly helpful for the private sector is not certain. This is possibly because of the district municipality scale, which is not the typical private sector operations scale.
Figure 1: Linking water and the economy with the public and private sector
AIM 2 To improve understanding of the economy linked to water use in a river basin. This will be based on the use and movement of embedded water in goods and services, at subsistence local market, regional economic and international trade levels. Linkages into food, energy and water security were considered.
AIM 3 To develop and improve tools and approaches to quantitatively and qualitatively evaluate basin water use and its political-economic implications under future climate and development uncertainties.
AIM 4 To foster dialogue between government, corporate and civil society representatives about the use, protection and development of basin water resources to secure political, economic,

vii
social and ecological development imperatives. This will be through the lens of shared risk in a basin with increasingly stressed water resources.
There are a number of cases where understanding the role of water in an economy of a region may be useful. Understanding of the flows of water through an economy may help to build dialogue between different sectors or levels of government. The method of investigating the role of water in the economy is also useful during integrated planning for a region, as the process indicates the linkages between water and the economy. Improved planning of water resources may be enabled through a better understanding of the water requirements of different sectors. GENERAL Projects or processes within the Western Cape Government which require an integrated approach have shown particular interest in this process of attempting to understand how water is embedded in different sectors of the Western Cape economy. The projects within government, taking into account this work, and supporting it with additional research are then most suited to approach different private sector representatives. The focus on gaining private sector insights and support in this initiative is to build a communication channel between the public and private sector. With both sectors aware of the risks the primary, secondary and tertiary sectors of the economy face. KEY OBSERVATIONS The Western Cape is a water stressed region, which in many areas is heavily dependent on water in the economy. This is not only true in regions where agriculture is the backbone of further productive activity, but also in terms of tourism, manufacturing (both agriculturally based and industrial) and the tertiary sector. Although the tertiary sector may use little water volumetrically, a large proportion of the services rendered are related to the agricultural sector of the province for example. Also, the quality and assurance of supply need to be higher in comparison to that of agriculture. Not only is the Western Cape economy, but our export economy too, is dependent on water. The Western Cape is characterised by key development nodes. Each of these has distinct relationships with regard to their economies and water; however, they all have same form of relationship between the economy and water. Differences between the nodes are related to their relationship between rural and urban areas; or their underlying sectorial value. As a result of the different drivers towards understanding water and the economy in each of the nodes, the management thereof may be nuanced. Observations of interest relating to the previous case study nodes are specific to the priority sector driving the economy and water management area. Following the consideration of economic and hydrological factors in each region, makes the following observations regarding the local priority nodes: - The West Coast Regional Motor is characterised by possible water tensions between the steel processed through the port (which provides 10% of the jobs) and agriculture (which provides 40% jobs). The distinction between the West Coast Regional Motor and the Olifants Agricultural Valley need to be further interrogated to distinguish between the two distinct economies.

viii
- The Breede Development Corridor is characterised by a water-based economy through its dependence on agriculture. Agriculture, both irrigated and dry, contributes 15% to the regional economy (and 40% of the jobs). Agricultural manufacturing contributes 20% of the economy and 10% of the jobs, while tourism, which is heavily dependent on the aesthetic value of functioning farms in the region, contributes 10% to the economy (and 45% of the visitors to the Western Cape). Although the towns in the region contribute heavily to the economy (50%), they are unable to function without the support of the agricultural industry. - The Eden District Municipality is characterised by a drought stressed economy (and intermittent floods). Although agriculture is relatively smaller, the region is home to crops which are unable to be grown elsewhere in the country (hops). The manufacturing sector is made up of secondary agriculture and gas processing, while the tourism sector is significantly linked to the aquatic systems of the region. In the Eden District, the tertiary services sector is significant. - Lastly, the development of the City of Cape Town (the City) as a “Global City” is characterised by domestic or urban water use. As a Global City, it is primarily a tertiary City. The City contributes 75% of the provincial GDP and is home to two thirds of the provincial population. The City is a provincial growth driver, and although not dependent on the interior of the province completely, it is an integral part. Therefore, it is clear that for each node there are distinct considerations to be made regarding the economy and water. By bringing water into the forefront of planning in terms of the LED; development planning is able to take cognisance of the resource constraints. Future development scenarios, with a clear understanding of how water underlies the economy, will contribute to further development of each node. In terms of Provincial development, it is important for future development scenarios to consider all elements (including the key development nodes), as well as the entire province. The process of understanding the role of water in the Western Cape economy is useful in a number of platforms both in government development planning, and partnership building as well as a suite of uses during the CMS process. The use of a single “language” to try and communicate complex water systems to economic policy will help “bring water out of the water box.” Through the ability to understand the impact of water on the economy, and vice versa, headway can be made into more robust decision making with respect to both water allocation and economic development planning.
RECOMMENDATIONS FOR FUTURE RESEARCH This water in the economy concept needs to be presented to a number of the platforms and processes further to gauge the usefulness of the concept. In addition, it is suggested that the process be repeated with improved data sources to better the understanding of how water flows through the economy. Data throughout this project has been a challenge. Recommendations going forward would be to use only standardised databases from government or alike in order to interrogate the nature of the economy in different regions.

ix
The use of standardised provincial or national data is necessary to ensure that analyses of regions within the Western Cape are comparable. An in-depth analysis of local level water in the economy implications is required. This is because initial presentations of this work have found the engagement with the private sector less compelling due to the scale of water and economy investigated (district level municipality or water management area). Therefore, a local level investigation into the Saldanha Bay Local Municipality economy and water scenarios will be carried out in order to better grasp the private sector role in water in the economy. It is assumed that at a local level, the public and private sector responses to understanding the role of water in the economy may be more tangible.

x
ACKNOWLEDGEMENTS
The authors would like to thank the Reference Group of this project for the assistance and the constructive discussions during the duration of the project:
• Ms E Karar WRC • Dr G Pegram Pegasys • Ms H Baleta Pegasys • Mr N Opperman Agri SA • Ms A Petersen DWA WC • Dr K Winter UCT • Mr J van Staden BOCMA
• Mr B Hollingworth Brian Hollingworth • Mr R Khan DWA WC • Helen Seyler Green Cape • Vanessa Otto-Mentz SAIA/SANTAM • Andre Roux Department of Agriculture • Jackie Crafford Independent Consultant • Christine Colvin WWF South Africa • Ms S Rashe DWA WC • Kevin Rogers University of Witwatersrand • Nisbert Chimboza Green Cape

xi
TABLE OF CONTENTS
EXECUTIVE SUMMARY ................................................................................................... III ACKNOWLEDGEMENTS ................................................................................................... X TABLE OF CONTENTS ..................................................................................................... XI LIST OF FIGURES ........................................................................................................... XIII LIST OF TABLES .............................................................................................................. XV LIST OF ABBREVIATIONS ............................................................................................. XVI 1 INTRODUCTION AND OBJECTIVES .................................................................... 1
1.1 Overview ................................................................................................. 1 Motivation for this project ........................................................................ 1
1.2 Aims ..................................................................................................... 3 1.3 Structure of this document ...................................................................... 5
2 WATER IN THE WESTERN CAPE ECONOMY .................................................... 7 2.1 Overview of key sectors in the Western Cape economy ......................... 7
Agriculture ............................................................................. 7 Manufacturing ............................................................................. 9 Tertiary Sector ........................................................................... 10
2.2 Overview of key nodes of the Western Cape: water and the
economy .................................................................................... 12 2.2.1 West Coast Development Corridor and Saldanha-Vredenburg
Regional Motor .......................................................................... 14 Overview ........................................................................... 14 Water and economy ........................................................................... 15 Institutional analysis ........................................................................... 19 Scenario planning ........................................................................... 20 Key messages ........................................................................... 21
2.3 Breede River Valley Development Corridor ........................................... 23 Overview ........................................................................... 23 Water and economy ........................................................................... 25 Institutional analysis ........................................................................... 30 Scenario planning ........................................................................... 30 Key messages ........................................................................... 31
2.4 Southern Cape Regional Motor ............................................................. 32 Overview ........................................................................... 32 Water and economy ........................................................................... 34 Institutional analysis ........................................................................... 38 Scenario planning ........................................................................... 38 Key messages ........................................................................... 39
2.5 Global City of Cape Town ..................................................................... 40 Overview ........................................................................... 40 Water and economy ........................................................................... 41 Institutional analysis ........................................................................... 45

xii
Scenario planning ........................................................................... 45 Key messages ................................................................................. 47
3 METHODOLOGY .................................................................................................. 49 3.1 Water in the economy ........................................................................... 49
Primary Sector: Agriculture.................................................................... 50 Secondary sector: Manufacturing .......................................................... 53 Tertiary sector: Services and tourism .................................................... 54
3.2 Scenario planning .................................................................................. 54 4 RESULTS OF ANALYSIS AND STAKEHOLDER DIALOGUES ......................... 69 5 DISCUSSION ........................................................................................................ 72 6 RECOMMENDATIONS ........................................................................................ 74 7 REFERENCES ...................................................................................................... 75 8 APPENDICES ....................................................................................................... 79
8.1 Appendix 1: Hoekstra Data ................................................................... 79 8.2 Appendix 2: Western Cape Water Footprint Data ................................. 81

xiii
LIST OF FIGURES
Figure 1: Linking water and the economy with the public and private sector .......................... vi Figure 2: Bridging water and the economy between private and public sectors ..................... 2 Figure 3: Links between water, development and the private sector ...................................... 2 Figure 4: Western Cape spatial development plan; PSDF, 2012 ........................................... 3 Figure 5: Combining administrative and water resource boundaries ...................................... 4 Figure 6: Western Cape key nodes and economies ............................................................... 5 Figure 7: Project process towards understanding the role of water in the economy............... 5 Figure 8: Composition of Western Cape exports: average, 2005-2010 (Source: Pero, 2012) 8 Figure 9: Western Cape: share of agro-processing industry in GDPR across districts (Pero, 2012) ....................................................................................................................................... 9 Figure 10: Western Cape export growth: primary, secondary and services: 2000-2010 (Source: PERO, 2012) ............................................................................................................ 9 Figure 11: Western Cape manufacturing: Real GDPR trends by sub-sector (Pero, 2012) ... 10 Figure 12: Western Cape Services Sector: Real GDPR and employment trends (Pero, 2012) .............................................................................................................................................. 10 Figure 13: Western Cape value contribution per sector ........................................................ 11 Figure 14: Western Cape embedded water per sector ......................................................... 11 Figure 15: Western Cape GDP contribution per sector (StatsSA, 2011) .............................. 12 Figure 16: GDP and water resources per district municipality .............................................. 13 Figure 17: Water resources availability per district municipality and water management area (WC IWRM, 2010) ................................................................................................................. 13 Figure 18: Water use in Western Cape Water Management Areas. Source: WC, (2011a) .. 14 Figure 19: West Coast Water in the Economy (own calculation) .......................................... 16 Figure 20: Olifants-Doorn Water Management Area (IWRM action plan, 2011) ................... 18 Figure 21: Olifants-Doorn Water Usage/Reserve (406 Mm3/annum) (IWRM action plan, 2011) ..................................................................................................................................... 18 Figure 22: Olifants-Doorn Water Supply (372 Mm3/annum) (IWRM action plan, 2011). ....... 18 Figure 23: West Coast Institutions ........................................................................................ 19 Figure 24: West Coast Scenarios; Green= quality, Blue = quantity ...................................... 21 Figure 25: Cape Winelands and Overberg sectors by GDP contribution, 2009 .................... 24 Figure 26: Winelands and Overberg Water in the Economy ................................................. 26 Figure 27: Map of Breede Water Management Area ............................................................ 27 Figure 28: Breede Water Usage/Preliminary Reserve (1071 Mm3/annum) (WC IWRM, 2011) .............................................................................................................................................. 28 Figure 29: Breede Water Supply (1090 Mm3/annum) (WC IWRM 2011) .............................. 28 Figure 30: Breede Agricultural Valley Institutions ................................................................. 30 Figure 31: Breede Agricultural Valley Scenarios; Green= quality, Blue = quantity ............... 31 Figure 32: Breede Water Management Area key considerations ......................................... 32 Figure 33: Eden economic sectors by GDP contribution, 2009 ............................................ 33 Figure 34: Eden Water in the Economy ................................................................................ 35 Figure 35: Gouritz Water Management Area ........................................................................ 36 Figure 36: Gouritz Water Usage/Reserve (415 Mm3/annum) ............................................... 36 Figure 37: Gouritz Water Supply (351 Mm3/annum) ............................................................. 36 Figure 38: Southern Cape Institutions .................................................................................. 38 Figure 39: Southern Cape Scenarios; Green= quality, Blue = quantity ................................ 39

xiv
Figure 40: City of Cape Town economic sectors by GDP contribution, 2009 ....................... 41 Figure 41: City of Cape Town Water in the Economy ........................................................... 42 Figure 42: Berg Water Management Area (WC IWRM Plan, 2011) ..................................... 43 Figure 43: Berg WMA Water Abstraction (745 Mm3/annum) (2005) ..................................... 43 Figure 44: Berg Water Supply (709 Mm3/annum) (2005) ...................................................... 43 Figure 45: City of Cape Town Institutions ............................................................................. 45 Figure 46: City of Cape Town Scenarios; Green= quality, Blue = quantity ........................... 47 Figure 47: Components of a water footprint (Source: Hastings and Pegram, 2012) ............ 49 Figure 48: An illustration of the calculation (Allen et al. 1998) .............................................. 51 Figure 49: Hectares planted and tons produced from crops in Western Cape (StatsSA, 2001) .............................................................................................................................................. 53 Figure 50: Western Cape Blue and Green Agricultural Water Footprint (Own Calculation) . 53 Figure 51: Water in the economy uncertainties .................................................................... 55 Figure 52: Water in the economy themes ............................................................................. 59 Figure 53: Water in the economy scenarios ......................................................................... 60 Figure 54: Water quality impacts (green) .............................................................................. 60 Figure 55: Water quantity impacts (blue) .............................................................................. 61

xv
LIST OF TABLES
Table 1: Major dams for domestic supply in the West Coast DM area (Olifants ISP, DWAF, 2005, Berg ISP, DWAF, 2004) .............................................................................................. 17 Table 2: Major dams in the Overberg DM (Breede ISP, DWA, 2004) ................................... 29 Table 3: Major dams for domestic supply in Eden DM (Gouritz IDP; DWAF 2004) .............. 37 Table 4: Selection from “Water footprint per ton of crop or derived crop product at national and sub-national level (m3/ton) (1996-2005)” ........................................................................ 79 Table 5: Water footprint of animal products (m3/ton). Period 1996-2005 .............................. 80 Table 6: The water footprint of national consumption per country (Mm3/yr) ......................... 80 Table 7: The water footprint of national production (Mm3/yr) ................................................ 80 Table 8: CropWat Deciduous Fruit crop water requirements and effective rainfall data ....... 81 Table 9: Deciduous Fruit Water Footprint Calculations ........................................................ 81 Table 10: Manufacturing sector Water Footprint Calculations .............................................. 82
xvi
LIST OF ABBREVIATIONS
CMS Catchment Management Strategy
EWR Environmental Water Requirements
IDP Integrated Development Plan
SDP Spatial Development Plan
WFGD Water for Growth and Development
WMA Water Management Areas
WCDM West Coast District Municipality

1
1 Introduction and objectives
1.1 Overview
Motivation for this project
There is increasing awareness of the potential social, political, and economic consequences of increasing water scarcity in the international water, scientific and development communities. The increasing public and corporate awareness of climate change over the past decade has focused broad attention on water as a key resource under threat. This increasing water scarcity will have effects on agriculture, energy, trade, the environment, national sovereignty, and international relations, as nations who are water scarce continue to deplete their resources and look to water rich areas to ensure their long term growth and sustainability. In South Africa, these factors increase the challenge of managing South Africa’s limited water resources to achieve economic and social justice imperatives. Historically, water planning has focused on water resources infrastructure development and operation, supported by demand management initiatives, to reconcile water requirements and availability. However, as water resources are increasingly developed and utilised, catchment quantity and quality stress tends to increase. The resulting complexity in management and use requires a shift towards improved governance and balancing of competing economic, social and ecological interests. This requires consideration of the nature of water as a development catalyst or possible constraint on economic growth and social development which prompted the establishment of the Water for Growth and Development (WfGD) framework. This implies a shift from water for the economy to water in the economy. WfGD explores the way in which the water sector contributes to economic, social, and environmental imperatives, also considering the relationship between government and the private sector. At a water management area level, catchment management strategies will increasingly have to adopt a more integrated economic development paradigm in addressing water resources concerns, as technical solutions become increasingly expensive and inappropriate for local development needs. The major key objective for the research is to bring water into economic and social planning objectives in the Western Cape. Through better understanding the role of water in supporting different sectors of the Western Cape economy, the private sector and government as well as resource managers may better understand the importance of water to business and economic and social well-being provincially. The use of water footprinting as a tool to better understand the use of water in the economy of the Western Cape will help to unlock some of the dialogue required between corporate risk managers and government development managers. The process is also useful within government through integrated planning. Understanding the flows of water through the economy by using water footprinting is particularly useful in linking sectors which traditionally may not communicate with each other. Water footprinting is helpful in this regard as the process is able to translate traditional water resources, understood through volumes of water, into economic value of the production it supports. Therefore, businesses or economic

2
policy planners within government have information which is now meaningful, as opposed to volumetric water data which may not be meaningful for their purposes. Water footprinting is helpful in building a common language through which these sectors are able to communicate their respective concerns and risks to each other. The following figure is useful in illustrating how through water footprinting, water resource information can be translated into information regarding economic activity and trade.
Figure 2: Bridging water and the economy between private and public sectors
Water footprinting is a useful tool to promote dialogue between water resource managers, government development managers and corporate risk managers. This is because water resource managers are then able to translate the impacts of water stress into economic or social impacts to the region. Additionally, water resource managers are then able to translate water resource data into production constraints to the private sector.
Figure 3: Links between water, development and the private sector
The role of water in the economy of the Western Cape is a valuable consideration. This is particularly true for future development or environmental scenarios. This project investigates the water implications of the growth projections of the Western Cape. The investigation is grounded within the strategic growth regions of the Provincial Spatial Development Framework (PSDF, 2012). The figure below indicates the provincial urbanisation strategy which takes into account the increasing water scarcity in the Cape Town and Saldanha Bay Local Municipality regions in particular. The PSDF plans to optimise the provincial settlement plan with regards to where people live and the availability of resources, particularly water, land and future economic potential for growth. Therefore, the potential of urban settlements in Breede River Valley, Saldanha Bay, the Olifants River Valley, the Southern Cape, Cape Town, the Overberg Coast and Agulhas Plain to sustain higher levels of economic activity and population is being investigated.
Government development
managers
Corporate risk managers
Water resources managers
Tools to promote dialogue

3
Figure 4: Western Cape spatial development plan; PSDF, 2012
1.2 Aims
AIM 1 To frame possible government and corporate responses at a basin level which reflect the shared risk paradigm, the political economy of water use and the challenges of future development and climate uncertainty.
As indicated previously, the use of water footprinting will help to bridge the communication gap between economic planning and water resources availability. Water resource availability is translated into a water footprint. The water footprint of each sector of the economy is linked to the attributable GDP and employment to give an indication of its role in the economy. AIM 2 To improve understanding of the economy linked to water use in a river basin. This will be based on the use and movement of embedded water in goods and services, at subsistence local market, regional economic and international trade levels.
This primarily required the bringing together of administrative boundary economic information from StatsSA and district municipalities together with water resources information from the Water Management Areas (WMA). The WMAs do not match the district municipalities, therefore the economic and water resources of the two boundaries require estimation in order to infer the water consumption of different sectors in the regions. In water footprinting, the production statistics of different sectors (i.e. agriculture) are known at a district municipality level. Therefore, the production water footprint is comparable to the economic data collected at the district level. However, the water resource availability is known at a water management level. In order to compare the water footprint of production (blue water) and the water resource availability, an estimation of the water resources per district municipality was done according the relative area each WMA covered each DM. The process of comparing the WMA and DM is shown in the figure below.

4
Figure 5: Combining administrative and water resource boundaries
AIM 3 To develop and improve tools and approaches to quantitatively and qualitatively evaluate basin water use and its political-economic implications under future climate and development uncertainties
Water footprinting and the concept of virtual water are used to improve the economic understanding of the role of water in the economy. Water in agriculture was calculated by considering the water footprints of both crops and livestock in the Western Cape. Irrigated field crops, rain-fed field crops, horticulture, vegetables and deciduous fruit were all considered in addition to cattle, pigs, goats, sheep, ostriches and poultry. Water in manufacturing was calculated by investigating agro-processing facilities, steel and petroleum industries to calculate an average water usage per ZAR contribution to the provincial or regional GDP. Water in the tertiary sector was calculated by considering the water footprint of the tourism sector (water used per bed night in the region). The services sector water footprint was estimated as a proportion of the employment of the sectors multiplied by an average human water footprint per year. Each sector of the economy has a distinct relationship with water. This is both in terms of quantity and quality. The following figure indicates the key nodes investigated in this research in addition to the predominant nature of the economy in each.

5
Figure 6: Western Cape key nodes and economies
AIM 4 To foster dialogue between government, corporate and civil society representatives about the use, protection and development of basin water resources to secure political, economic, social and ecological development imperatives. This will be through the lens of shared risk in a basin with increasingly stressed water resources
There are a number of cases where understanding the role of water in an economy of a region may be useful. Understanding of the flows of water through an economy may help to build dialogue between different sectors or levels of government. The method of investigating the role of water in the economy is also useful during integrated planning for a region, as the process indicates the linkages between water and the economy. Improved planning of water resources may be enabled through a better understanding of the water requirements of different sectors. 1.3 Structure of this document
This document is the culmination of a three year research project investigating how to communicate the value of water in the Western Cape economy. The following figure gives an indication of the project process. Each block within the project process represents the deliverables towards to culmination of this final report.
Figure 7: Project process towards understanding the role of water in the economy
Agriculture
Agriculture Industry
Industry
Urban

6
A list of the deliverables and their respective contents are shown. Although in draft form,
these deliverables are available upon request.
Number Deliverable Title Description
1 Economic analysis methods Review of economic approaches to support an economic development
planning approach in water planning
2 Strategic system description Synthesis of existing hydrological and footprint information to create the water
base to the analysis
3 Institutional analysis Institutional analysis of the implications for managing water
4 Political economic analysis of the
Western Cape
Political economic analysis of the Western Cape
5 Scenarios assessment Interpretation of future development and climate scenarios and their impact on
the political economy of water in the Western Cape system
6 Recommendations Possible options for reframing water management solutions
7 Stakeholder dialogue Contribution to Western Cape and National Dialogue, as well as promoting
issues globally
8 Final Report Compilation of a final integrated report
Following this introduction regarding the aims and objectives of the research, an overview of Western Cape water resources and the economy is given. This is followed by the key nodes of the Western Cape economy, as indicated in the Provincial Spatial Development Framework (PSDF) for the Western Cape. The water, economic, institutional and scenario planning done for each region are highlighted. This is followed by the methodology used in getting this information. The methods used in water footprinting as well as the scenario planning are indicated. Finally there is a discussion, followed by recommendations on additional research which could be done to strengthen and add to the process.

7
2 Water in the Western Cape economy
2.1 Overview of key sectors in the Western Cape economy
The Western Cape is geographically diverse and varied, both between topography as well as water resources. The eastern region (Eden, Overberg and Central Karoo districts) of the Province is characterised by alternate east-west mountain ranges and valleys starting at the coastal plains and hills of the Southern Cape and Overberg, before giving way to the Little Karoo and on to the Central Karoo, which is characterised by semi-desert landscapes. The central region (Cape Town and Cape Winelands districts) starts with Table Mountain in the southwest and descends to the Cape Flats, and the rolling countryside of the Cape Winelands district. The West Coast region includes the coastal plains and hills of the Sandveld and Swartland, which lead on to the Olifantsrivier Valley and the Cederberg.
An overview of the key elements of the Western Cape economy is given as context in order to investigate the role of water in supporting the economy. Agriculture
Agriculture in the Western Cape is distinguished in several ways from that in the rest of South Africa, largely because of the physical geographic differences. The winter rainfall region of the Cape Winelands and the year-round rainfall of the Southern Cape provide agricultural conditions that make the crop mix and productive potential unique. One of the primary features of the region’s agriculture is production stability, based on stable and relatively adequate winter rainfall, supported by well-developed infrastructure for both input supply and output processing (Elsenberg, 2009). The agricultural activity of the Western Cape covers an area of 11, 5 million hectares (ha). Although this is only approximately 12,4% of the total agricultural land available in South Africa, the Western Cape produces between 55% and 60% of South Africa’s agricultural exports, which is valued at more than R7 billion per year (Pero, 2010). Approximately half of these exports are wine, while processed and unprocessed fruit also make up a large potion. Commercial agriculture in the Western Cape contributes 22.4% to gross farming income in South Africa (Wesgro, 2011). Agriculture is one of the primary pillars of the Western Cape economy. Although the province contributes some 14% to the country’s Gross Domestic Product, it generates almost 23% of the total value added by the agricultural sector in South Africa, Agriculture accounted for 5,2% of the Western Cape’s Gross Regional Product of R185,4 billion in 2004 (Elsenberg, 2009). Nationally, the agribusiness sector contributes an estimated ZAR124bn to the country’s GDP. In the Western Cape, the agribusiness sector contributes significantly to this total at the national level. The Western Cape has a diverse production capacity with 11 commodities contributing significantly to agricultural production. Notably, crop production including fruit, poultry and eggs, winter grains, such as barley, wheat and hops, viticulture and vegetables together contribute more than 75% of the total output. Consequently, the diversity of the agricultural enterprises also contributes to the sector’s general stability (Elsenberg, 2009). This growth

8
trend has been consistent since the political transformation of 1994. The main industries in the sector include fruit contributing R2,4 billion, winter grain contributing R1,8 billion, white meat valued at R1,6 billion, viticulture worth R1,6 billion and vegetables worth R1,4 billion (Elsenberg, 2009). Horticultural products contribute 51 per cent of agricultural output, with fruit and wine the core commodities. They key producing areas are the Cape Winelands, Cape Metro, West Coast and Overberg (Wesgro, 2010). Animals and animal products contribute 42 per cent. In descending size contribution these include poultry, cattle, sheep, ostriches and pigs. The key producing areas area Paarl, Worcester, Goodwood, Malmesbury, Swellendam and Oudtshoorn (Wesgro, 2010). Field crops contribute 7% with wheat the dominant crop. Maize and barley are also important. Seventy per cent of the wheat crops are produced in Malmesbury, Moorreesburg and Piketberg (West Coast) and Caledon and Bredasdorp (Overberg) (Wesgro, 2010). Forestry and fishing contribute 1 per cent. Forestry is limited and mostly state-owned.
Figure 8: Composition of Western Cape exports: average, 2005-2010 (Source: Pero, 2012)

9
Figure 9: Western Cape: share of agro-processing industry in GDPR across districts (Pero, 2012)
The Western Cape is also the strongest contributor to national agricultural exports, with significantly more than half of South Africa’s agricultural exports originating from the Province (Wesgro, 2011). Therefore, as indicated below, the Western Cape exports of agricultural products are particularly important to the economy.
Figure 10: Western Cape export growth: primary, secondary and services: 2000-2010 (Source: PERO, 2012)
Manufacturing
The Western Cape manufacturing sector is critical to the economy development of the province. Following the recession, manufacturing bounced back in 2010-2011 to 3.6 per cent growth. A relatively strong recovery in the large food & beverages sector is evident in the following figure.

10
Figure 11: Western Cape manufacturing: Real GDPR trends by sub-sector (Pero, 2012)
Tertiary Sector
Although service activities are concentrated in the Cape Metropolitan area, growth in services real GDPR is stronger in the non-Metro districts. Figure 12 shows that 78 per cent of services GDPR are generated in the Cape Metro. The Cape Winelands contributed 9.2 per cent of services GDPR on average in 2005-2010, Eden 6.5 per cent, the West Coast 3.4 per cent, Overberg 2.4 per cent, and the Central Karoo only 0.6 per cent. In terms of growth, service activities expanded by 5.5 per cent per annum in non-Metro districts during 2000-2010, compared to 4.4 per cent in the Cape Metro
Figure 12: Western Cape Services Sector: Real GDPR and employment trends (Pero, 2012)
The GDP contribution of each of the district municipality regions is of interest. Each particular case study has a unique relationship in terms of its economy and dependency on water. The nature of the economy (agriculture, urban or industrial) in addition to the actual physical water availability is particularly important.

11
One of the major outcomes of the deliverable was a rough quantification of the output, export, import and consumption of agriculture, secondary agriculture (agro-processing), industry and urban water. This was then linked to the GDP contribution of the different sectors. Secondary agriculture represents agriculturally based manufacturing within the secondary sector, while secondary industry represents all other secondary sector activities. The agro-processing and industrial water use numbers were particularly difficult to calculate as they were based on significant assumptions regarding the average water use of subsectors of the secondary and tertiary sectors respectively.
Figure 13: Western Cape value contribution per sector
Note the importance of secondary agriculture in the Western Cape economy. In addition, note the high value of imported goods for consumption. In terms of the embedded water graph below, note the large proportion of water exported through agriculture. Details regarding how these amounts were calculated are available in the methodology section.
Figure 14: Western Cape embedded water per sector
- 20 000 40 000 60 000 80 000
100 000 120 000 140 000 160 000 180 000 200 000
Output Export Import Consumption
ZARm
(200
8)
Western Cape value contribution per sector
Agriculture
SecondaryAgricultureSecondary Industry
Tertiary
0
500
1000
1500
2000
2500
3000
Production Exports Imports Consumption
Embe
dded
Wat
er (M
m3/
year
)
Western Cape embedded water per sector

12
Further research is needed to ascertain the amount of blue vs. green water embedded within the crop exports. Considering the large amounts of deciduous and citrus fruits being exported, it is likely irrigation water is sizeable. Lower value, water intensive agricultural crops are imported where South African production is unable to meet demand. This may also be a water saving technique, where water intensive, low value crops are imported, releasing water for high value crop irrigation instead. Because of the variable nature of agriculture in the Western Cape, and the broad range of practises across the region, an estimation of the green and blue water footprint ratio was not possible.
2.2 Overview of key nodes of the Western Cape: water and the economy
This research considered the role of water in the economy of key development nodes identified by the provincial government. Of particular interest, within each of the key nodes are the municipal integrated development plans and policies for the social and economic welfare of the region. Of equal importance and interest is the quality and quantity of water available for use and development in the region. Economic and water boundaries however, are not aligned; with Water Management Areas not coinciding with the district or local administrative boundaries. This added a layer of complexity in trying to link water resources with economic contributions and employment per region and sector. As is evident in the figure below, the City of Cape Town plays a major role in the GDP contribution consideration of the Western Cape economy. It is important to note however the critical role of the agricultural hinterland in supporting the exports out of the Western Cape and other linkages with the economy.
Figure 15: Western Cape GDP contribution per sector (StatsSA, 2011)

13
The following two graphs indicate how water availability is delinked from economic contribution. Water resources are not set within district municipalities, and transfers do happen between catchments in order to move water where required. This analysis attempts to better inform the economic gains of transferring water to where needed when in competition with other sectors of the economy or other regions in the Province.
Figure 16: GDP and water resources per district municipality
The details of the apportioning of water between water management areas and district municipalities are shown in the table below.
Figure 17: Water resources availability per district municipality and water management area (WC IWRM, 2010)
Water availability in the Western Province is stretched. Currently, the only WMA in the Province in which there is a surplus in terms of water availability, is the Breede WMA (WC, 2011a). Based on the last WMA-wide reconciliation undertaken for the ISPs (2005), the Gouritz and Olifants-Doorn WMAs were in a shortfall. The situation in the Breede WMA had
78%
4%9%
2%6%
1%
GDP Contribution to Western Cape (Wesgro, 2010)
City of Cape Town
West Coast
Cape Winelands
Overberg
Eden
Central Karoo
33%
12%25%
7%
6%
17%
Relative % of Western Cape surface water resources per
district (WC IWRM, 2010)
0
200
400
600
800
1000
1200
Breede Berg Olifants Gouritz
Water per district municipality (Mm3/annum)
West Coast
Central Karoo
Eden
Overberg
City of CapeTown
Winelands

14
been one in which there was considered to be a small surplus. However, based on the ecological flow requirements recently determined as part of the CMS process, this is no longer considered to be certain, and updated water availability estimates, based on latest hydrological and land use information is not yet available. Furthermore, conventional sources such as dams and run-of-river schemes have been developed or are in the process of feasibility study. Groundwater over-utilisation in some areas of the Province is a cause for concern, such as in the Ceres, Hex River Valley, Swartberg and Beaufort West areas for example. It is anticipated that one of the effects of climate change will be the increase in water requirements which will place even further stress on the water sources (RSA Gov. 2000).
Figure 18: Water use in Western Cape Water Management Areas. Source: WC, (2011a)
Due to the different water resource availability as well as economies within the catchments, the water use pressures are distinct. These are interrogated at a closer scale within each node outlined in the Pero (2011). 2.2.1 West Coast Development Corridor and Saldanha-Vredenburg Regional Motor
Overview
The West Coast District Municipality (WCDM) is situated along the west coast of South Africa between Cape Town to the south and the Northern Cape to the north. The mountain range of the Cederberg forms the eastern boundary. The southern part of the DM area falls within the Berg Water Management Area (WMA) comprising the lower Berg River and several small coastal rivers. The northern part falls within the Olifants / Doorn WMA and is mainly drained by the Olifants River. The West Coast district is the fourth largest district economy in the Western Cape after the City of Cape Town, Cape Winelands and Eden by GDP. Province and the planning documents clearly identifies this region, and in particular the Saldanha Bay municipality as a development corridor and regional motor.
0
200
400
600
800
1000
1200
Berg Breede Olifants -Doorn
Gouritz
Water use per WMA (Mm3/annum)
Transfers out
Afforestation
Alien Invasives
Reserve
Irrigation
Urban and Industry

15
Figure 16: West Coast Economy by GDP contribution, 2009
In terms of the sector contribution, agriculture, forestry and fishing sector contributes the highest to the GDP of the Berg River Local Municipality. The manufacturing sector contributes the highest to the GDP of the Saldanha Bay Local Municipality (West Coast IDP, 2011). Therefore, there are two differentiated economies with regard to water in the West Coast District Municipality, namely:
- The West Coast Development node of Saldanha- Vredenburg - The regional development corridor of the Olifants River Valley
• District Area • 31 101km²
• Local municipalities • Saldanha Bay (Vredenburg) • Matzikama (Vredendal) • Cederberg (ClanwilliamOlifants/ Satellite DWA: RO)
• Bergriver (Piketberg) • Swartland (Malmesbury)
• WMA • Olifants and Berg WMA
• CMA • Proto-CMA
• Population • 288 945 (205)
• Contribution to WC GDP
• 4.21%
• R 11 198 880.39
• Main Sectors • Agriculture & fishing (15%) • Manufacturing (18%) • Financial (23%)
• Employment • 38% of population is employed, 8% is unemployed and 34% is unspecified in terms of employment status
• Contribution to National GDP
• 0.633%
Water and economy
The contribution from the Olifants/Doorn WMA to the national GDP is the lowest of any WMA in the country (Olifants-Doorn, ISP). Nationally the agriculture sector contributes 4.6% to the

16
Gross Domestic Product (GDP). In this WMA the agricultural sector contributes far more to the local economy (43.3%) than any other sector. Whilst emphasising the importance of agriculture in the regional economy of the WMA, it also highlights the relatively low level of activity in other sectors. The Saldanha Local Municipality receives water from the Berg WMA, where 68% of the water is allocated to domestic and industrial use (including Cape Town); while 32% is allocated to irrigation. Around the Cederberg and Matzikama Local Municipalities, which form part of the Olifants-Doorn WMA however, 95% of the water is allocated to agriculture while 21% is allocated to industry. This distinction indicates the different roles of water in supporting the Saldanha and Vredenburg Industrial node vs. the Olifants River Valley. A summary of the West Coast District Municipality in terms of water consumption and value per sector is given in the figure below.
Figure 19: West Coast Water in the Economy (own calculation)
There are three main sources of water for the West Coast District Municipality: • Purchase from external sources (e.g. WCWSS or ORGWSS); • Abstraction from surface sources (dams, rivers or streams); • Abstraction from groundwater sources (springs, boreholes or dug wells).
The main surface water sources for both the bulk purchases and local abstraction are the lower Berg River (for the West Coast Development node) and the Olifants River (for the regional development corridor), and their tributaries. However, these surface water resources are already fully allocated, including the Olifants WMA within which the Cederberg and Matzikama municipalities fall. 95% of its available water is set aside for irrigation, whereas 2% is allocated for urban and rural water use respectively, and 1% for mining. The Western Cape Water Supply System (WCWSS) extends into the West Coast DM area and supplies parts of the Swartberg, Saldanha Bay and Bergrivier LMs. The supply to these LMs comes from the Voëlvlei Dam, an off-channel dam at the Klein Berg River, and the Misverstand Dam in the lower Berg River.
-
50
100
150
200
250
300
0
1000
2000
3000
4000
5000
6000
Mm
3/ye
ar
ZARm
West Coast District Municipality
Value (ZARm)
Green FP (Mm3/year)
Blue FP (Mm3/year)

17
The other significant water supply infrastructure is the Clanwilliam Dam and the Bulshoek Weir on the Olifants River and the canals that run parallel to the Olifants River from the Bulshoek Weir to Ebenhaezer near the Olifants River mouth. This Olifants River Government Water Supply System (ORGWSS) supplies the agricultural sector and the municipalities in the northern part of the DM with water. The Clanwilliam dam wall has been extended by 12 m to increase its capacity to store water (34 million m³) per annum. Other major dams for domestic supply in the West Coast DM area are shown below. Table 1: Major dams for domestic supply in the West Coast DM area (Olifants ISP, DWAF, 2005, Berg ISP, DWAF, 2004)
In the West Coast DM, there are two significant groundwater sources in the area;
• The primary aquifers along the coast, such as the Langebaan Road Aquifer system or the Sandveld; and
• The Table Mountain Group sandstones of the Piketberg Mountains and the Cederberg Mountain range.
“While the primary aquifers are heavily exploited and over-utilised in some areas (e.g. Sandveld), the TMG aquifers are mainly under-utilised and further exploration and development is still possible in many areas within the Western Cape” (DWA, 2011). Although it is estimated that a total area of about 497 km2
of land is under irrigation, some of
this is irrigated only in years when sufficient water is available. It is estimated that an average area of about 400 km2
of crops grown under irrigation is harvested annually
(Olifants-Doorn, ISP). Of that which is irrigated, almost 50% lies within the Upper and Lower Olifants sub-areas. Irrigated citrus, deciduous fruits, grapes and potatoes are grown on a large scale in the WMA and provide the mainstay of this WMA’s economy (NWRS, 2004). In addition to the intensive irrigation practised along the Olifants River, significant irrigation also takes place in the Koue Bokkeveld (18%) and along the rivers and from groundwater in the Sandveld sub-area (10%). Urban areas are small, covering a total land area estimated at only 31 km2. There are a few small rural settlements, but they occupy an insignificant area of land (Olifants-Doorn, ISP). Industries in the WMA are small and the majority of them are concerned with the processing and packaging of agricultural products. Approximately 3 million m3/annum of water is currently required by the mining and industrial sectors. Small commercial timber plantations, totalling 10 km2, are established in the mountainous high rainfall areas in the south-west of the WMA, with very little impact on the water resource (total use one million m3/annum but negligible impact on available yield). According to the All Towns Study (DWA, 2011), a large proportion of towns in this municipality will experience water shortages in the next 5 to 10 years. As a result of water stress, the WDCM is already exploring or undertaking alternative water resources strategies to create additional water.

18
Figure 20: Olifants-Doorn Water Management Area (IWRM action plan, 2011)
This pie graph shows the specific water usage ratios of, the Olifants-Doorn WMA in terms of irrigation and urban use. The reserve, invasive aliens and afforestation water consumption values are also included. The water supply is shown in the following graph, where it becomes evident that the region is running the risk of serious water shortages.
Figure 21: Olifants-Doorn Water Usage/Reserve (406 Mm3/annum) (IWRM action plan, 2011)
Figure 22: Olifants-Doorn Water Supply (372 Mm3/annum) (IWRM action plan, 2011).
In addition to the Olifants-Doorn, the Berg River is also almost stretched to capacity. Activities in the Berg WMA contributes 12% of the GDP (national) and 68% of the water is

19
allocated for domestic and industrial use whereas 32% is allocated for irrigation purposes. The Berg WMA is dominated by the Cape Metropolitan, Stellenbosch, Paarl, Wellington and developing West Coast area of Saldanha. This WMA is dominated by the commercial trade and industry. The Berg River gets effluent, sanitation and return flows which affect the quality of the water of the end user. It has some available water left but a decision must be made on how best to allocate this available water, especially in light of the fact that the municipalities of Saldanha Bay and Cape Town have both been identified as leader towns in the planning documents. The farmers in the Berg WMA could make an argument that the available water be allocated to them as agricultural activities is more labour intensive than the tertiary economy of the City and the secondary economy of Saldanha Bay. More detail of the water resources available in the Berg WMA is dealt with under the City of Cape Town node. Institutional analysis
Figure 23: West Coast Institutions
The nature of the relationship between the WCDM and the institutions will be elaborated on in the table below. Institution Nature of Relationship
Province Support and coordination
Berg CMA, Olifants& DWA & WUA
The Reconciliation study has been done for the Western Cape to plan for water resources and WCDM is represented on the Steering Committee form a part of this study.
Local Municipalities
There are five municipalities in the WCDMs jurisdiction. The WDCM only has a coordinating role for the local municipalities in its jurisdiction, the executive authority over the municipalities functions lie with the local municipalities rather than the WDCM, e.g. the local municipalities are the water services authority and water services provider (unless this function has been outsourced in terms of the municipal Systems Act). There are quarterly meetings of the District Coordinating Forum. It has created 4 committees across the WCDM to avoid silo thinking; namely: • Water Monitoring Committee – Langebaan aquifer extraction scheme • Technical committee – area based plan under the auspices of the Department of Rural development and Agriculture comprising of WDCM and its municipalities, DoA Department of Agriculture, DWA and cape nature • Regional Coastal Committee – as part of the integrated coastal management act
20
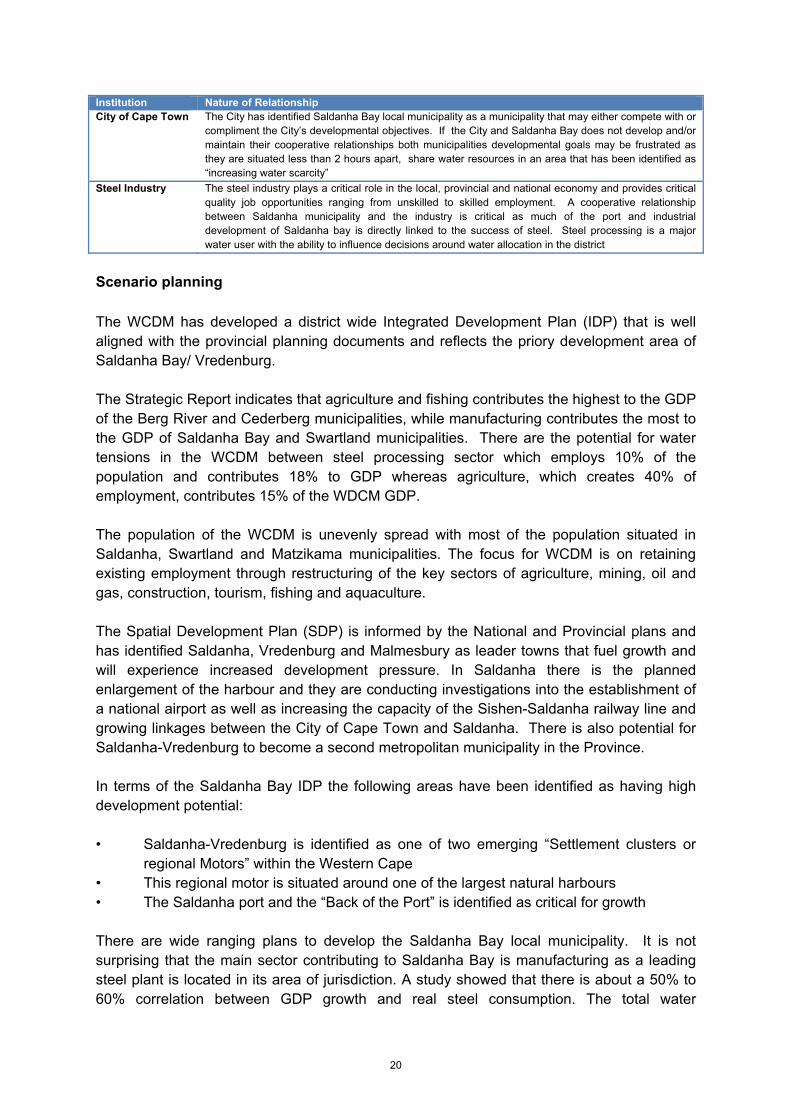
Institution Nature of Relationship City of Cape Town The City has identified Saldanha Bay local municipality as a municipality that may either compete with or
compliment the City’s developmental objectives. If the City and Saldanha Bay does not develop and/or maintain their cooperative relationships both municipalities developmental goals may be frustrated as they are situated less than 2 hours apart, share water resources in an area that has been identified as “increasing water scarcity”
Steel Industry The steel industry plays a critical role in the local, provincial and national economy and provides critical quality job opportunities ranging from unskilled to skilled employment. A cooperative relationship between Saldanha municipality and the industry is critical as much of the port and industrial development of Saldanha bay is directly linked to the success of steel. Steel processing is a major water user with the ability to influence decisions around water allocation in the district
Scenario planning
The WCDM has developed a district wide Integrated Development Plan (IDP) that is well aligned with the provincial planning documents and reflects the priory development area of Saldanha Bay/ Vredenburg. The Strategic Report indicates that agriculture and fishing contributes the highest to the GDP of the Berg River and Cederberg municipalities, while manufacturing contributes the most to the GDP of Saldanha Bay and Swartland municipalities. There are the potential for water tensions in the WCDM between steel processing sector which employs 10% of the population and contributes 18% to GDP whereas agriculture, which creates 40% of employment, contributes 15% of the WDCM GDP. The population of the WCDM is unevenly spread with most of the population situated in Saldanha, Swartland and Matzikama municipalities. The focus for WCDM is on retaining existing employment through restructuring of the key sectors of agriculture, mining, oil and gas, construction, tourism, fishing and aquaculture. The Spatial Development Plan (SDP) is informed by the National and Provincial plans and has identified Saldanha, Vredenburg and Malmesbury as leader towns that fuel growth and will experience increased development pressure. In Saldanha there is the planned enlargement of the harbour and they are conducting investigations into the establishment of a national airport as well as increasing the capacity of the Sishen-Saldanha railway line and growing linkages between the City of Cape Town and Saldanha. There is also potential for Saldanha-Vredenburg to become a second metropolitan municipality in the Province. In terms of the Saldanha Bay IDP the following areas have been identified as having high development potential: • Saldanha-Vredenburg is identified as one of two emerging “Settlement clusters or
regional Motors” within the Western Cape • This regional motor is situated around one of the largest natural harbours • The Saldanha port and the “Back of the Port” is identified as critical for growth There are wide ranging plans to develop the Saldanha Bay local municipality. It is not surprising that the main sector contributing to Saldanha Bay is manufacturing as a leading steel plant is located in its area of jurisdiction. A study showed that there is about a 50% to 60% correlation between GDP growth and real steel consumption. The total water

21
requirement of the iron and steel making processes are 100 to 200 m³ per ton of product supplied. Saldanha is lauded for being one of the world best in terms of water consumption per day (8000kl); in addition the facility uses purified waste water from the municipality for industrial and irrigation purposes. Future water requirements in the region are complex and contested as the province has highlighted the region for future development of agriculture as well as manufacturing. Already water resources are scarce. The most demanding water requirement is the demand for growth in agriculture in the Upper Olifants. Here, there is pressure from resource-poor farmers to be given land and water allocations. Water trading should be encouraged to accommodate this need or further resource development should be undertaken. Compounding the problem, there is insufficient storage to provide for agricultural use during the dry summer and the low flows are pressurised by on-going peak demand. A higher percentage of existing lawful use should be stored during winter high flows in off-channel storage dams instead of using scarce summer flows. No further licences for additional use are being encouraged until the Environmental Water Requirements (EWRs) have been established. Again, the Pero (2011) and other provincial planning documents need to consider the full water implications of development. Determining whether sufficient water is available, without considering those industries downstream is not advisable. A traffic light system is used to indicate the level of stress or risk on water quantity (circle) or quality (square) for each sector. The sectors considered include agriculture, industry, urban and environmental allocation. Red indicates high risk, orange medium and green low risk.
Figure 24: West Coast Scenarios; Green= quality, Blue = quantity
Key messages
The WCDM is home to 20% of the Western Cape population, contributing 4% to the Western Cape GDP. The district municipality has two major economies, which are dependent on two different water management areas. Agriculture and fishing contributes the highest to the GDP of the Berg River and Cederberg municipalities, while manufacturing contributes the
Agric
ultu
re •Pollution from industry and domestic use upstream - Berg WMA especially
Indu
stry •Can afford treatment
of water Urb
an
•Polluted water supply from industry, can be treated but expensive
Envi
ronm
enta
l Al
loca
tion •Poor environment
policy implementation cannot ensure water is kept clean
Agric
ultu
re •Domestic demand in Saldanha or Cape Town increasing pressure on supply
Indu
stry •Afford desalilnation
• Buy up agricultural water rights
Urb
an
• Increase in demand due to increase in industry
Envi
ronm
enta
l Al
loca
tion •Poor policy
implementation does not protect supply for the environment.

22
most to the GDP of Saldanha Bay and Swartland municipalities. As a result, the relationship with water is different between these sectors. The two nodes are:
- The West Coast Development node of Saldanha- Vredenburg - The regional development corridor of the Olifants River Valley
The West Coast development zone and Olifants Agricultural valley are supplied by the Berg and Olifants WMAs respectively. In the Olifants WMA, the agricultural sector contributes far more to the local economy (43.3%) than any other sector. Whilst emphasising the importance of agriculture in the regional economy of the WMA, it also highlights the relatively low level of activity in other sectors. Activities in the Berg WMA contributes 12% of the GDP (national) and 68% of the water is allocated for domestic and industrial use whereas 32% is allocated for irrigation purposes. In terms of competition for water, Saldanha is seen to be in direct competition with the City of Cape Town and upstream Berg farmers. Although the manufacturing industry may consider desalination or reuse, water balancing with domestic and agricultural use will be a consideration. In the Olifants River Valley, water is not abundant, which further promotes efficiency and optimal use of water resources. This is already carried out to a large extent. Growth in agriculture in the Upper Olifants is placing great pressure on water resources. Here, there is pressure from resource-poor farmers to be given land and water allocations. Water trading should be encouraged to accommodate this need or further resource development should be undertaken. For the southern region of the WCDM, the excellent export harbour facilities at Saldanha and existing infrastructure like the Sishen/Saldanha railway line have resulted in extensive expansions in the steel industries at Saldanha Bay, putting more pressure on existing limited water resources. The mainstay of the WCDMs economy is the steel plant located in Saldanha Bay and agriculture in the Olifants-Doorn corridor. With the WCDM and Saldanha Bay in particular being earmarked for industrial development, it could give rise to future tensions between the local municipalities and the WCDM given the constraints on water resources in the WCDM. In particular water tensions within the Berg, between Cape Town and further development around Saldanha are possible. The absence of a CMA and CMS is affecting the WDCM’s ability to properly integrate planning in the region. In this regard, the municipal cycle is only 3 years whereas the planning horizon for water resources is 10 years. If these planning horizons only align on paper and not in practice, the municipality may select short term gains, e.g. focusing on housing backlog without for example setting said funding for refurbishment of water works. The WDCM is conducting investigation into alternative sources of water, but this could up to 10 years from the time of investigation to the time of establishment, which means that unless water is used more efficiently, it may constraint economic development. The establishment

23
of a desalination plant will however affect the environment and increase the price of water quite considerably which may also serve to inhibit development. When decision are made between the different spheres of government it has to look at sectors that are less water intensive to sustain the local economy, while maintain the existing allocation of water to water intensive industries. Key considerations include that planning needs to take cognisance of the different water economies in the district municipality. Competition between manufacturing, domestic use and agriculture is a real possibility. 2.3 Breede River Valley Development Corridor
Overview
The Breede agricultural valley stretches across the area of jurisdiction on two district municipalities, namely the Overberg district Municipality (ODM) and the Cape Winelands District Municipality (CWDM). The Overberg District Municipality is situated east of Cape Town and covers the area between the Riviersonderend Mountains and the ocean. The coastal area stretches from the Kogelberg Biosphere Reserve in the east to the De Hoop Nature Reserve and Breede River Mouth in the west. The Cape Winelands DM is an inland District Municipality surrounded by the other DMs of the Western Cape to the west (i.e. West Coast DM), south (i.e. Overberg DM) and east (i.e. Central Karoo DM) and the Northern Cape to the north. The Stellenbosch and Drakenstein local municipalities border the City of Cape Town metropolitan area to the west. The ODM and CWDM have the following profile: CDM and ODM Profile/ General information
District CWDM ODM
District Area 22 000km² 11 391km²
Local Municipalities
• Stellenbosch • Drakenstein
• Witzenberg, • Breede Valley • Langeberg
• Theewaterskloof, • Cape Agulhas,
• Overstrand, • Swellendam • Overberg District Management
Area
WMA Breede-Overberg WMA Breede-Overberg WMA
Population 711 498 (13.5% of the Province) 212 787 (4% of the Province)
Contribution to WC GDP
8.8% ZAR27.5bn
2.4% R 3 848 710 000
Main Sectors • Agriculture, forestry and fishing (12%)
• Mining and quarrying (0.3%)
• Manufacturing (25%) • Construction (4%) • Wholesale and retail (13) • Financial and business
(22%)
• Agriculture, forestry and fishing (12%)
• Manufacturing (16%)
• Wholesale and retail (14%) • Financial and business (24%)
Employment 58.9% employed 11.4% unemployed 29.7% not economically active
17.7% rate of unemployment (2007)
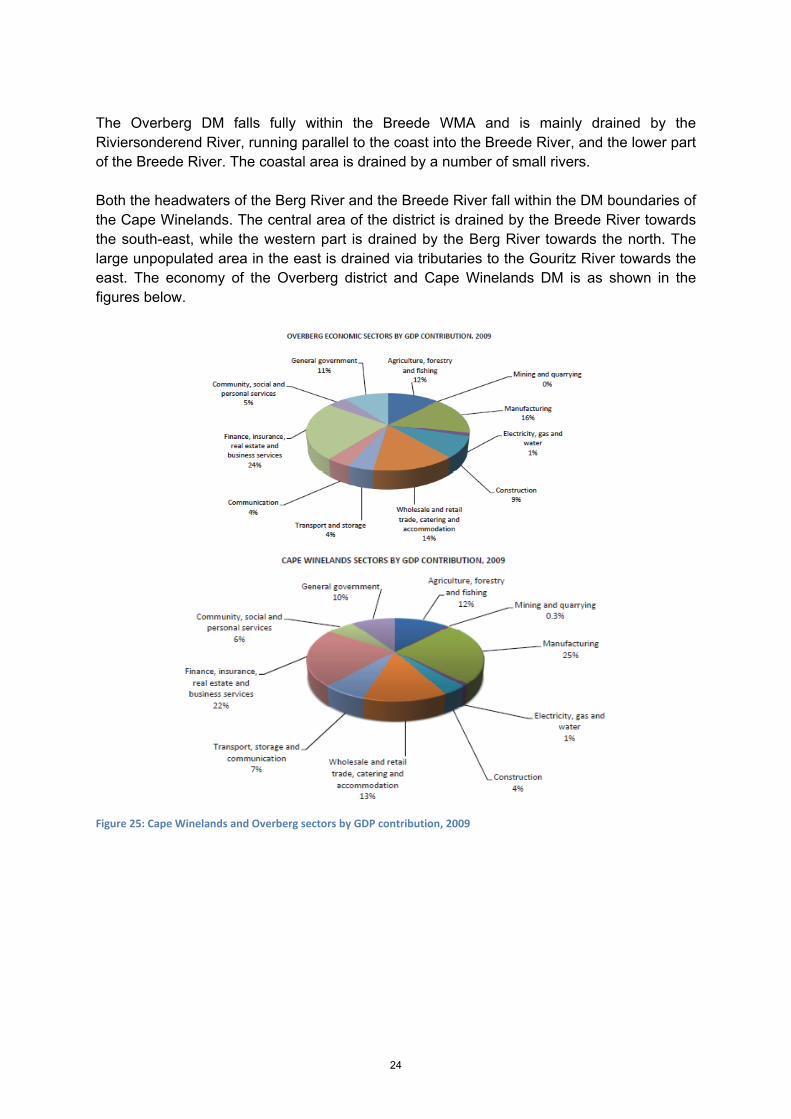
24
The Overberg DM falls fully within the Breede WMA and is mainly drained by the Riviersonderend River, running parallel to the coast into the Breede River, and the lower part of the Breede River. The coastal area is drained by a number of small rivers. Both the headwaters of the Berg River and the Breede River fall within the DM boundaries of the Cape Winelands. The central area of the district is drained by the Breede River towards the south-east, while the western part is drained by the Berg River towards the north. The large unpopulated area in the east is drained via tributaries to the Gouritz River towards the east. The economy of the Overberg district and Cape Winelands DM is as shown in the figures below.
Figure 25: Cape Winelands and Overberg sectors by GDP contribution, 2009

25
• District • CWDM • ODM
• District Area • 22 000km² • 11 391km²
• Local Municipalities • Stellenbosch • Drakenstein • Witzenberg,
• Breede Valley • Langeberg
• Theewaterskloof, • Cape Agulhas, • Overstrand,
• Swellendam • Overberg District Management Area
• WMA • Breede-Overberg WMA • Breede-Overberg WMA
• Population • 711 498 (13.5% of the Province) • 212 787 (4% of the Province)
• Contribution to WC GDP
• 8.8% • ZAR27.5bn
• 2.4% • R 3 848 710 000
• Main Sectors • Agriculture, forestry and fishing (12%)
• Mining and quarrying (0.3%) • Manufacturing (25%)
• Construction (4%) • Wholesale and retail (13) • Financial and business (22%)
• Agriculture, forestry and fishing (12%)
• Manufacturing (16%) • Wholesale and retail (14%)
• Financial and business (24%)
• Employment • 58.9% employed • 11.4% unemployed
• 29.7% not economically active
• 17.7% rate of unemployment (2007)
Water and economy
The Breede agricultural node economy is inextricably linked to agriculture. Every sector in this region is in one way or another dependent on agriculture for its viability. Unlike the other local priority nodes discussed in this chapter, its secondary and tertiary economy is dependent on the primary sector of agriculture. CWDM and OM are areas with high agricultural potential but rapid expansion of inappropriate agricultural development, e.g. crops with high water needs such as fruit with a high water demand has potential to stress the available water resources. Manufacturing is largely based on agro processing is the second largest contributor to the economy but only accounts for 11.8% of formal employment (CWDM), whereas agriculture accounts for 35.1% of formal employment (CWDM). The IDP is aware of the demand for increased water supply to the City of Cape Town, which increases the demand for inter-catchment transfer which has ecological consequences. It also places pressure on groundwater resources. There is an increase in the pollution of rivers and the Breede River’s water quality is deteriorating. There is an interdependent relationship between the City and CWDM. CWDM is reliant on visitors from the City to boost tourism in the CWDM. Although the agricultural sector provides the most employment in the CWDM, the nature of employment is an important consideration as half of the population is semi-skilled or unskilled. If the income earned by the unskilled/ semi-skilled workers is below R7000 per

26
month, they may still be reliant on the state to cover their basic needs, such as providing subsidized housing. One also has to consider whether the employment that the agricultural sector offers is permanent. Although the manufacturing and financial sector offers less employment, the employment is permanent and more financial security can be attained through employment in these sectors with the result that incumbents in this sector is less likely to rely on the state for support. The figure below summarises the Overberg water use per sector and value contribution to the districts GDP.
Figure 26: Winelands and Overberg Water in the Economy
From a water resource management perspective, the Breede WMA can be sub-divided into two specific regions, namely the Breede River and Overberg components (Breede, ISP). This is roughly correlated with the Winelands and Overberg District Municipalities.
- 50 100 150 200 250 300 350 400 450
0
2000
4000
6000
8000
10000
12000
14000
Mm
3/ye
ar
ZARm
Winelands
Value (ZARm)
Green FP (Mm3/year)
Blue FP (Mm3/year)
- 50 100 150 200 250 300 350 400
0500
1000150020002500300035004000
Mm
3/ye
ar
ZARm
Overberg
Value (ZARm)
Green FP (Mm3/year)
Blue FP (Mm3/year)

27
Figure 27: Map of Breede Water Management Area
There are a number of large water supply schemes in the Breede WMA. Locally, most of the water is used for irrigation. There is however a number of inter-basin transfers (IBT) schemes from the Breede WMA into the Berg WMA, of which the following two are the most significant: • Riviersonderend-Berg-Eerste River Government Water Scheme (RSE Scheme) • The Palmiet Pumped Storage Scheme These schemes feed into the Western Cape Water Supply System (WCWSS). The urban sector in the Berg WMA is dependent on both, whilst certain irrigators along the Berg and Eerste Rivers are dependent on the RSE Scheme only. There is one small transfer out of the Breede WMA into the Olifants/Doorn WMA (Breede, ISP). This pie graph shows the specific water usage ratios of the Breede WMA in terms of irrigation and urban use. The reserve, invasive aliens and afforestation water consumption values are also included. The water supply is shown in the following graph, where it is evident that the region is the only WMA with a water surplus in the province (albeit a small surplus).

28
Figure 28: Breede Water Usage/Preliminary Reserve (1071 Mm3/annum) (WC IWRM, 2011)
Figure 29: Breede Water Supply (1090 Mm3/annum) (WC IWRM 2011)
The indicated the surplus is not large enough to warrant a large amount of development. Instead, this may be allocated to the environment, or if kept, may be a valuable buffer against climate variability. The main water resources in the Overberg District Municipality are the Riviersonderend River and lower Breede River, although the water in the lower Breede River has a high salinity. The Theewaterskloof Dam in the upper reaches of the Riviersonderend River is the main surface water storage facility in the district municipal area and serves communities and the agricultural sector beyond the municipal boundaries. The Overberg Water Board operates two water supply systems for domestic and agricultural water supply downstream of the Theewaterskloof Dam • The Rûensveld West Water Supply Scheme receives water from the Theewaterskloof Dam. Water is released from the dam into the Riviersonderend River and abstracted and treated at the Maraisdal Water Treatment Works, which is located adjacent to the river about 5 km downstream of the Theewaterskloof Dam. • The Rûensveld East Rural Water Supply Scheme abstracts water from the Riviersonderend River, halfway between Riviersonderend and Swellendam. The water is treated near to the abstraction point. It supplies about 65% of the rural population in its supply area, as well as providing drinking water for livestock. The raw water is of a good quality for domestic use.

29
The Table Mountain Group (TMG) sandstones form the high mountains to the north (e.g. Riviersonderend Mountains) and south along the coast and comprise a significant aquifer of regional importance. Barrydale and Wolvengat are two towns indicated in the All Towns Study which face current supply shortfalls. Hermanus, Swellendam and Greyton are among the additional towns which face an expected shortfall in the next 5 to 10 years. There are a number of dams within the district municipal area, most of which are used for agriculture. The largest dam in the area is the Theewaterskloof Dam on the Riviersonderend River, which is shared between domestic supply to the City of Cape Town and the Overberg Water Board, and agricultural users downstream of the dam and in the Berg River catchment. Table 2: Major dams in the Overberg DM (Breede ISP, DWA, 2004)
The areas with the highest annual rainfall in the Western Cape are located in the high mountains within the Cape Winelands District Municipality, providing for significant run-off from the catchments. Most of the surface water dams of the WCWSS are situated in the DM area. However, the bulk of the yield is allocated to the City of Cape Town and to agricultural users. The high mountain ranges throughout the Cape Winelands DM are formed by the Table Mountain Group sandstones, which form a significant regional aquifer that is largely underutilised. Sandhills, Rawsonville and Tulbagh all experience shortfalls in water supply currently. The All Towns Study expects Touwsrivier, Franschoek, Stellenbosch and Wolseley, among others, to experience shortfalls in the near future. There are a number of large surface water storage reservoirs located within the district municipal area, some of which are part of the Western Cape Water Supply System (WCWSS) that supplies the City of Cape Town and surrounding towns in the Cape Winelands DM and West Coast DM with water. Recently the Berg River Dam at Franschhoek was added to the WCWSS. In addition, there are a number of smaller dams that are used for domestic and agricultural water supply.

30
Institutional analysis
Figure 30: Breede Agricultural Valley Institutions
The nature of the relationship the City enjoys with the institutions will be elaborated on in the table below. Institution Nature of Relationship
Province Support and coordination, ensuring that other districts are not unfairly prioritized over that of the Breede development corridor
BOCMA, DWA & WUA
Draft CMS and reconciliation study The City’s water supply is supplemented from the Breede-Overberg WMA as well and it is important that the City be represented in its CMS.
Local Municipalities
There are five municipalities in the in each of the district municipalities jurisdiction. The district municipalities only has a coordinating role for the local municipalities in its jurisdiction, the executive authority over the municipalities functions lie with the local municipalities rather than the district municipalities
City of Cape Town BOCMA supplies supplementary water to the City of Cape Town. The ODM and CWDM is reliant on the City of Cape Town as a Global City, for tourism and the city must support development of the agricultural valley
Scenario planning
A traffic light system is used to indicate the level of stress or risk on water quantity (circle) or
quality (square) for each sector. The sectors considered include agriculture, industry, urban
and environmental allocation. Red indicates high risk, orange medium and green low risk.

31
Figure 31: Breede Agricultural Valley Scenarios; Green= quality, Blue = quantity
Key messages
The Breede Agricultural Valley runs through two distinct municipalities. Together the municipalities represent 18% of the Western Cape population and 10% of the GDP contribution (although this is not completely attributed to the Breede Valley). The central WMA for the two municipalities is the Breede WMA, which can be sub-divided into two specific regions, namely the Breede River and Overberg components (roughly corresponding to the district municipalities). Locally, in the Breede WMA, most water is used for irrigation. There is however a number of inter-basin transfers (IBT) schemes from the Breede WMA into the Berg WMA, to supply water to the City of Cape Town. There is a large amount of concern from farmers and residents in the region of water being lost to Cape Town, affecting the economic growth of the Breede Region. The key exports of this region are grape wines apples, pears and other fruit and vegetables, highlighting the importance of agriculture to the agricultural valley. In addition to the increased demand for water supply to the City of Cape Town, this increases the demand for inter-catchment transfers, and has ecological consequences. There is an interdependent relationship between the City and CWDM, as the CWDM is reliant on visitors from the City to boost tourism in the CWDM.
Agric
ultu
re • No major quality concerns relative to the Berg River Catchment
Indu
stry •Increasing
quality concerns of agricultural runoff and domestic wastewater.
Urb
an
•Wastewater treatment a concern in many regions.
Envi
ronm
enta
l Allo
catio
n •Although currently in surplus, increasing demand may not ensure environmental allocation is met.
Agric
ultu
re •Currenlty sufficient, future reallocation and industrial demand will cause price increases
Indu
stry •Currently not
major water users. Future development will cause increasing demand
Urb
an
• Small towns along the coast may face insreasing water scarcity
Envi
ronm
enta
l Allo
catio
n •Poor policy implemnetation does not protect supply for the environment.
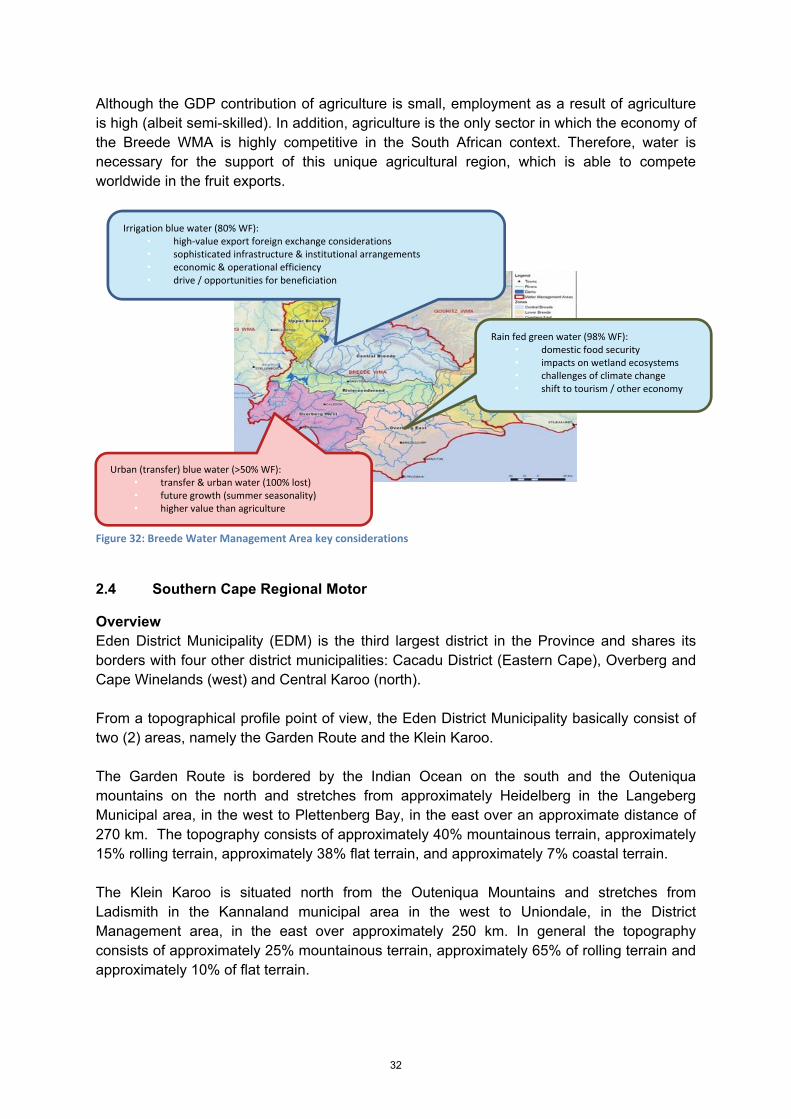
32
Although the GDP contribution of agriculture is small, employment as a result of agriculture is high (albeit semi-skilled). In addition, agriculture is the only sector in which the economy of the Breede WMA is highly competitive in the South African context. Therefore, water is necessary for the support of this unique agricultural region, which is able to compete worldwide in the fruit exports.
Figure 32: Breede Water Management Area key considerations
2.4 Southern Cape Regional Motor
Overview Eden District Municipality (EDM) is the third largest district in the Province and shares its borders with four other district municipalities: Cacadu District (Eastern Cape), Overberg and Cape Winelands (west) and Central Karoo (north). From a topographical profile point of view, the Eden District Municipality basically consist of two (2) areas, namely the Garden Route and the Klein Karoo. The Garden Route is bordered by the Indian Ocean on the south and the Outeniqua mountains on the north and stretches from approximately Heidelberg in the Langeberg Municipal area, in the west to Plettenberg Bay, in the east over an approximate distance of 270 km. The topography consists of approximately 40% mountainous terrain, approximately 15% rolling terrain, approximately 38% flat terrain, and approximately 7% coastal terrain. The Klein Karoo is situated north from the Outeniqua Mountains and stretches from Ladismith in the Kannaland municipal area in the west to Uniondale, in the District Management area, in the east over approximately 250 km. In general the topography consists of approximately 25% mountainous terrain, approximately 65% of rolling terrain and approximately 10% of flat terrain.
Irrigation blue water (80% WF): • high-value export foreign exchange considerations • sophisticated infrastructure & institutional arrangements • economic & operational efficiency • drive / opportunities for beneficiation
Rain fed green water (98% WF): • domestic food security • impacts on wetland ecosystems • challenges of climate change • shift to tourism / other economy
Urban (transfer) blue water (>50% WF): • transfer & urban water (100% lost) • future growth (summer seasonality) • higher value than agriculture

33
According the All Towns Study, there are a number of towns which are already experiencing water supply shortfalls, these include: Oudtshoorn, Calitzdorp, Ladismith, Albertinia, Slangrivier, Witsand and Riversdale. There is an even larger group of towns with expected supply shortfalls within 5 to 10 years. These include Knysna, George and Plettenberg Bay. The current population in the Eden DM is estimated at 533 500 of whom 60% (340 000) reside in the coastal strip from Mossel Bay eastwards. Of these approximately 90% reside in urban areas. A general trend of migration from rural areas to towns (particularly along the coast) is to be expected as people move towards the larger urban centres in search of employment. This has noteworthy water management implications. The key economic sectors are:
• Agriculture and fishing – the district is an ideal location for various agricultural and niche activities because of topographical and climatic diversity. Agricultural activities include dairy, fruit, vegetable and sheep products, as well as unique products like ostriches, forestry products, aloe, hops and essential oils.
• Manufacturing – agro-processing and forestry form a large part of the manufacturing base, and are supported by niche industries.
• Construction – the construction industry is well-supported by the tourism investments which have continued to increase. Upgrading of facilities has also contributed to the growth of this sector.
• Tourism – Approximately 320 000 overseas visitors visit Eden each year, and approximately 1.2 million domestic visitors (WC, 2011c).
These are illustrated in the graph below.
Figure 33: Eden economic sectors by GDP contribution, 2009
The above-average manufacturing growth of the Eden district (4.3 per cent per annum, 2000 to 2010) is more significant since the regional sector contributes 7.3 per cent to provincial manufacturing. The food & beverage processing sectors and petro-chemicals account for more than half of district manufacturing and both these sectors expanded robustly during the 2000s.

34
• District Area • 23 332km²
• Local municipalities • George, Bitou, Mossel Bay, Oudshoorn, Kannaland, Hessequa, District Management Area, Knysna
• WMA • Gouritz
• CMA • Proto-CMA
• Population • 513 307
• Contribution to WC GDP
• 6.3% • R17.669 billion
• Main Sectors • Agriculture & fishing (5.6%) • Manufacturing (16.9%) • Financial (23.1%)
• Wholesale and retail (17%)
• Employment • 23.9%
Water and economy
The majority of the EDM population is concentrated in George, Mossel Bay, Oudtshoorn and Knysna, with almost half the population of the EDM situated in George and Mossel Bay. It is anticipated that the future settlement pattern will probably continue in these growth towns. Regardless of the urbanisation, Eden DM has a diversified economy that is rooted in agriculture, manufacturing, tourism, trade and business sectors. The economy of the EDM grows at an annual average rate of 3.3% which is higher than that of the Province. The sectors contributing the most to employment in EDM are wholesale and retail trade (8.3%), construction (7.45%), community social and personal services (6%) and manufacturing (6.3%). The rate of unemployment is 23.9%. The EDM has a poverty rating of 19.31 and is cited as the poorest district in the Western Cape Province. Manufacturing occurs to the greatest extent in Mossel Bay and George, and to a lesser extent, in Oudtshoorn. At Mossel Bay the PetroSA natural gas extraction and refinery project plays a large role in the manufacturing industry. The manufacturing and transport sectors in that town are also supported by the harbour, which is important to the region as the only harbour in this WMA (Gouritz, ISP) The EDM region’s water resources have previously been under severe threat, with the municipalities of George and Bitou being clarified as “High Risk”, which means that they are towns with less than 3 months of water supply in storage. In response to the water crises in EDM, the following short and long term initiatives to create “new water” sources are being undertaken:
• Water restrictions • Boreholes sunk (Georg, Knysna, Hessequa) • Plan to sink boreholes in the short term (Bitou, Mossel Bay) • Construction of waste water treatment plant in progress in George • Re-use of waste water for use by PetroSA in Mossel bay • Desalination plant constructed in Sedgefield

35
• Investigating the establishment of desalination plants in Knysna, Hessequa (at Witsand) and Bitou in process.
The shortfall (backlogs and needs for water only) were estimated at R4 billion. The EDM recognises that it is an important economic growth area/ regional motor for the Western Cape with the following towns having been identified as either regional urban centres or major urban centres – George, Oudtshoorn, Mossel bay, Knysna and Riversdale and is the major economic drivers of the region. The most important concern to the potential development and expansion is limited water resources, bulk electricity supply, and key investments in bulk infrastructure planning and development, maintenance of bulk infrastructure network, development of a secondary road network which will support development the human and social development of people and future climate change impacts could inhibit future growth. The figure below summarises the Eden district water use and value contribution to the GDP per sector.
Figure 34: Eden Water in the Economy
The Eden District Municipality area falls nearly completely into the Gouritz Water Management Area (WMA). Only the western part of the Hessequa LM and the area around Haarlem in the east fall outside the WMA boundary. The Gouritz WMA is one of the WMAs with the lowest population in the country. The total population is estimated at 436 800. The arid inland parts are particularly sparsely populated. Close to 60% (242 800) of the total WMA population is concentrated in the narrow coastal strip from Mossel Bay eastwards. The economic activity and employment opportunities have, and will continue to attract people to that area. Similarly in the rural Karoo area, it is estimated that almost 80% of the population residing in that area, live in towns and villages (Gouritz, ISP)
-
20
40
60
80
100
120
0
2000
4000
6000
8000
10000
12000
Mm
3/ye
ar
ZARm
Eden
Value (ZARm)
Green FP (Mm3/year)
Blue FP (Mm3/year)

36
The GDP of the Gouritz WMA was R4, 9bn in 1997. Less than 1% of South Africa's Gross Domestic Product (GDP) originates from the Gouritz WMA; making it, from an economic perspective, one of the weakest WMAs in the country. The figure below shows the geographic region of the Gouritz WMA as well as key rivers and neighbouring WMAs.
Figure 35: Gouritz Water Management Area
This pie graph shows the specific water usage ratios of the Gouritz WMA in terms of irrigation and urban use. The reserve, invasive aliens and afforestation water consumption values are also included. The water supply is shown in the following graph, where it becomes evident that the region is running the risk of serious water shortages.
Figure 36: Gouritz Water Usage/Reserve (415 Mm3/annum)
Figure 37: Gouritz Water Supply (351 Mm3/annum)
To summarise the key water data of the region: - Natural Mean Annual Runoff: 1679 Mm3/annum - Current Shortfall 64 Mm3/annum - Interventions to address shortfalls include potential dams along garden route,
desalination and water reuse schemes.

37
The topography and climate within the Gouritz WMA is such that three distinct water resource zones can be distinguished. These are the: • The semi-arid Great Karoo consisting of the Gamka River catchment to the north of the
Swartberg Mountains (mainly outside of the Eden DM area) and the Touws/Buffels/Groot River catchments, to the west of the Klein Swartberg Mountains (partly outside of the Eden DM area).
• The Olifants River which is fed by mountain streams rising in the Swartberg Mountains to
the north, the central Kammanassie Mountains and the coastal Outeniqua Mountains in the south.
• The Coastal Belt which has been subdivided into two areas namely the Gouritz / Goukou
/ Duiwenhoks sub-area, extending from the western boundary of the WMA to (and including) the catchment of the lower Gouritz River. The remaining coastal belt to the eastern boundary of the WMA, referred to as the Coastal sub-area.
Water is generally drawn from a variety of sources such as dams, rivers, aquifers and boreholes in the Eden District area. Quality of water from the different sources is regularly monitored and reported on, and is generally acceptable. Approximately 40% of the water drawn from sources is returned to the sources. The quality of the water is also regularly checked and reported on. According to the Gouritz ISP (DWAF, 2004) and the Tsitsikamma to Coega ISP (DWAF, 2004) there are 14 major dams within the Eden DM area. Table 3: Major dams for domestic supply in Eden DM (Gouritz IDP; DWAF 2004)

38
Institutional analysis
Figure 38: Southern Cape Institutions
The nature of the relationship the EDM enjoys with the institutions is elaborated on in the table below. Institution Nature of Relationship
Province Support and coordination
Gouritz CMA & DWA & WUA
DWA has however in conjunction with the City developed a reconciliation study for the Western Cape considering the water balance, undertakes resources planning and management. An outcome of this study was that a Steering committee was established between the City and DWA to monitor the implementation of the reconciliation study. The City’s water supply is supplemented from the Breede-Overberg WMA as well and it is important that the City be represented in its CMS.
Local Municipalities
There are 8 municipalities in the WCDMs jurisdiction. The EDM only has a coordinating role for the local municipalities in its jurisdiction, the executive authority over the municipalities functions lie with the local municipalities
Petro SA This company plays such a critical role in the local, provincial and national economy and provides critical quality job opportunities ranging from unskilled to skilled employment. A cooperative relationship between EDM, George municipality and Petro SA is critical is the largest employer of the Mossel Bay population. The institution is accordingly a major water user
• It has made a substantial financial contribution to the development of the desalination plant situated in Mossel Bay
Scenario planning
The recent drought experienced by EDM resulted in the country’s largest desalination plant being established in the EDM. The fact that a desalination plant has been established makes the cost of water a factor an important consideration. Although it has alleviated the potential water crisis in the short term, making the current operation viable, in the long term, the cost of water may become a consideration. In addition, a factor negating against the operation of the desalination plant is the carbon footprint of the district will increase.

39
Future population trends are likely to be influenced by economic opportunities and job creation. It is anticipated that the growth in the coastal catchments is likely to be relatively strong, particularly in the larger urban centres such as Mossel Bay and George, and to a lesser extent, Knysna and Plettenberg Bay. Due to the lack of economic stimulant in the Great Karoo region, together with the general trend towards urbanisation, a decline in population is expected in that area. Little change is expected in the Gouritz and Olifants sub-areas, although there is likely to be some migration towards Oudtshoorn, out of the rural areas, because of potential employment opportunities (Gouritz, ISP). A traffic light system is used to indicate the level of stress or risk on water quantity (circle) or quality (square) for each sector. The sectors considered include agriculture, industry, urban and environmental allocation. Red indicates high risk, orange medium and green low risk.
Figure 39: Southern Cape Scenarios; Green= quality, Blue = quantity
Key messages
The Eden district contributes 6% to the Western Cape GDP. The population is approximately 500 000 (10% of WC), of which 60% live along the coastal strip from Mossel Bay eastwards. A general trend of migration from rural areas to towns (particularly along the coast) is to be expected as people move towards the larger urban centres in search of employment. This has noteworthy water management implications. Regardless of the urbanisation, Eden DM has a diversified economy that is rooted in agriculture, manufacturing, tourism, trade and business sectors. The economy of the EDM grows at an annual average rate of 3.3% which is higher than that of the Province. The Eden District Municipality area falls nearly completely into the Gouritz Water Management Area (WMA). The EDM region’s water resources have previously been under severe threat, with the municipalities of George and Bitou being clarified as “High Risk”, which means that they are towns with less than 3 months of water supply in storage. Due to the recent drought, the EDM region provides a good example of cooperative governance, where water resources are stretched to capacity and will have the effect of job losses and curtailing development. It is also provides an example of how development can
Agric
ultu
re •Previous drought shows insecure water supply In
dust
ry •Desalination infrastructure thus sources are more secure, but not certain
Urb
an
• Increase in demand due to competing increase in industry
Envi
ronm
enta
l Al
loca
tion •Alien invasive species
and domestic and industrial demand
Agric
ultu
re • Pollution from other agriculture in the region In
dust
ry •Can treat if required, or desalinate, but expensive U
rban
•Polluted water supply from industry, can be treated but expensive
Envi
ronm
enta
l Al
loca
tion •Especially during past
drought, major water quality concerns in environment

40
be curtailed not necessarily as a result of water availability but rather political agendas which has the effect of delaying economic development. Unlike the other local priority nodes forming part of this discussion, the EDM, due to the recent drought does not have sufficient water resources to cover its demand. The EDM region provides a good example of cooperative governance where water resources are stretched to capacity and will have the effect of job losses and curtailing development. It is also provides an example of how development can be curtailed not necessarily as a result of water availability but rather political agendas which has the effect of delaying economic development. The Gouritz WMA area is home to a number of industries and agricultural products of utmost importance to the province. In addition, the growing population is putting strain on water resource availability. Again, considering the water shortages of the region, further growth and development must consider either water use optimisation or alternative supply. 2.5 Global City of Cape Town
Overview
The City of Cape Town falls within the Berg WMA and is being supplied from surrounding catchments via inter basin transfer. The Western Cape Water supply system (WCWSS) supplies raw water storage and conveyance infrastructure supplies water to the City of Cape Town and surrounding towns and urban areas and agriculture. Various components of the WCWSS is owned by and operated by DWA, Eskom and the City. • Metropolitan Area • 2 455km2
• Local municipalities • • Cape Metropolitan • • Blaauwberg
• • Cape Town CBD • • Helderberg • • Oosternberg
• • South Peninsula • • Tygerberg
• WMA • Berg WMA
• (supplementary water supply from Breede-Overberg WMA)
• CMA • Proto-CMA • (BOCMA, with draft CMS)
• Population & growth rate • 3.5 million people (66% of total Province population)
• Contribution to WC GDP • 77.9% • R174.682 billion
• Main Sectors • Financial and business services industry (40.63%) • Manufacturing (17%) • Wholesale and trade (16%)
• Employment • 24.2% of the population is unemployed
• Contribution to National GDP • 11%
41
Figure 40: City of Cape Town economic sectors by GDP contribution, 2009
Water and economy
The dependence of the City on distant water supplies has the potential for social conflicts with the communities in the donor basin/ catchment as they are not compensated for the exploitation of water resources. As it is, the water resources of the donor/catchment basins are almost stretched to capacity, and a strong argument could be made in only maintaining the existing water supply to the City, with any water available for development to be used for the benefit of those stakeholders in the donor basin/ catchment. Although the City has reduced its water usage, it is not using its allocated water as efficiently as it could. Farmers in the Berg WMA (and BOCMA), could make a strong argument against allocating additional water set aside for development purposes for the Berg WMA, rather than providing it to the City as agriculture creates more employment opportunities than the City tertiary driven economy and is also contributes to biggest export product. In its IDP it has already identified Saldanha Bay as a potential competitor in respect of its port and the industrial development of the West Coast. Saldanha Bay has also been identified as a regional motor and it also obtains its water resources from the Berg WMA. The City is in support of developing the West Coast region however, the intended expansion of the Saldanha Bay Port and its industrial sector has the potential to create tension between the two municipalities if the water resources are not managed properly as they are both situated in a water scarce WMA The figure below gives a summary of the City of Cape Town regional water use per sector and value contribution to the GDP.

42
Figure 41: City of Cape Town Water in the Economy
The City of Cape Town is supplied with water through the Western Cape Water Supply System (WCWSS), which is part of the Berg WMA. The Western Cape Water Supply System (WCWSS) currently supplies the City of Cape Town, Berg, Eerste and Sonderend irrigation schemes as well as the towns of Stellenbosch, Paarl and the West Coast and Swartland regions. The water usage of the WCWSS is approximately 493 Mm3/a (2008) while the yield is 556 Mm3/a. 63% of this is used for domestic and industrial purposes within the CoCT, while 32% is used by irrigators along the Berg, Eerste and Sonderend Rivers. 5% is supplied to the towns of Stellenbosch, Paarl, Wellington and the West Coast (DWAF, 2009). Its major raw water supply schemes are Riviersonderend, Voëlvlei, Berg River schemes, Wemmershoek and Steenbras Schemes with a total storage capacity of 898 million m³. The City’s current water use is almost 27% below projected unconstrained demand. Water use per capita is also said to have decreased significantly since 1996, and is currently at its second lowest level of 225l a day or roughly 6 750kl a month. In order to maintain this reduction and improve water use efficiency, the City undertakes the following activities:
• Repairing end-user leaks • Reusing treated effluent • Offering education and awareness programmes
The City’s sewer system is deteriorating due to under provision for essential maintenance/ replacement of aging infrastructure. The cost the water and waste water pipe network (2008/9) is estimated at R19.5 billion (with all other plants, works, dams, reservoir and pump stations that figure stands at R27.1 billion. Aside from the distribution and demand pressures that the city faces within; the wider resource constraints arise from the fact that the city is dependent on water resources from the Berg WMA. A strong and diversified economy exists in the Berg WMA, which is dominated by the commercial trade and industrial activities in the Cape Town Metropolitan area, the towns of Stellenbosch, Paarl and Wellington and in the developing West Coast
-
20
40
60
80
100
120
140
020000400006000080000
100000120000140000160000
Mm
3/ye
ar
ZARm
City of Cape Town
Value (ZARm)
Green FP (Mm3/year)
Blue FP (Mm3/year)

43
area of Saldanha Bay. Approximately 12% of the Gross Domestic Product (GDP) of South Africa originates from within the Berg WMA. The Berg WMA Report indicates an unemployment rate of 19% for 1994, which was well below the official national average of 29% (unofficially 40%). Of those formally employed the government sector and the manufacturing and trade sectors account for approximately 70% of the employment. Agriculture, although one of the smallest sectors in terms of its contribution to the Gross Geographical Product (± 2,5%), has strong linkages to other sectors of the regional economy and provides livelihood to a large proportion of the rural population(Berg ISP, 2010). 87% of the population in the Berg WMA is situated in Greater Cape Town (Berg ISP, 2010)
Figure 42: Berg Water Management Area (WC IWRM Plan, 2011)
This pie graph shows the specific water usage ratios of the Berg WMA in terms of irrigation and urban use. The reserve, invasive aliens and afforestation water consumption values are also included. The water supply is shown in the following graph, where it is evident that the region is under water stress, with a calculated shortfall of 36 million m3/annum.
Figure 43: Berg WMA Water Abstraction (745 Mm3/annum) (2005)
Figure 44: Berg Water Supply (709 Mm3/annum) (2005)

44
• Therefore the current shortfall is 36 million m3 per annum. The natural Mean Annual Runoff is 1 429 million m3 per annum.
• 27% of the water supply is via catchment transfer from the Breede WMA. • The Berg River Dam and Supplement Scheme have been implemented adding 80
million m3 per annum • The reconciliation Strategy shows that by 2016/17 further augmentation is required to
meet the growing needs, primarily the CoCT (CoCT, 2007)
Intensive irrigation takes place in the Upper and Lower Berg River valleys from the Berg River, its tributaries and from private dams, as well as in the Eastern region of the Greater Cape Town subarea (along the Eerste and Lourens Rivers), with small pockets of irrigated land within the Cape Flats. Dry land cultivation of wheat is dominant in both the Upper Berg and Lower Berg sub-areas (including the Diep River), with some dry land vineyards in the hills (Berg ISP, 2010) Water is transferred between the Breede WMA and the Berg WMA, with a net transfer into the Berg WMA of some 194 million m3/a (in 2000). This is made up as follows: • Transfers via the Riviersonderend-Berg River Tunnel:
- 22 million m3/annum from Theewaterskloof to the Upper Berg sub-area. - 139 million m3/annum from Theewaterskloof to Greater Cape Town sub-area. - 9, 6 million m3/a to the Upper Berg sub-area from minor transfers.
• 23 million m3/a from the Palmiet River (Breede WMA) to the Greater Cape Town sub-area, via the Palmiet Pumped Storage Scheme. Most of the rivers in the ISP area rise in the Table Mountain Group (TMG) mountain catchments which provide very good quality water with total dissolved solids (TDS) concentrations of about 60 mg/l. The quality of the water generally deteriorates further downstream as described below: The middle reaches of the Berg River receive effluent from various wastewater treatment works as well as agricultural return flows and occasionally naturally high salinity runoff from tributaries underlain by Malmesbury shales of marine origin. This leads to water quality problems in the lower Berg River. Industrial users (steel manufacturers) in the Saldanha area need to pre-treat this water before being able to utilise it in their industrial processes. Irrigators are limited to the types of crops they can cultivate, due to increased salinity levels. Runoff in the lower reaches of the Diep River arising from the Malmesbury formation is also naturally saline and wastewater is discharged into the river from two of the CCT's wastewater treatment works. The Rietvlei wetland is a highly valued ecosystem and the potential impact; particularly from treated effluent being discharged into it is of concern. The Lourens River; most of the Peninsula rivers and the Cape Flats rivers and vleis have been impacted by urban runoff. The Kuils River and Salt River are also impacted by large, wastewater return flows that have changed these seasonal rivers into perennial rivers. These urban rivers cannot be rehabilitated but their condition must at least be maintained at levels that will not introduce social, health and aesthetic problems.

45
Institutional analysis
Figure 45: City of Cape Town Institutions
Institution Nature of Relationship
Province • Cooperative, support, capacitation • The City is the main contributor to the Western Cape economy and it is vital that the City is
not prioritized to the detriment of the remaining district municipalities within the Province and Province must play a strong coordinating role
Berg CMA & DWA & WUA
• The Berg CMA has not yet been established and accordingly there is no CMS. DWA: RO (Western Cape is therefore acting as a proto- CMA)
• Given the prioritization of the City, DWA has however in conjunction with the City developed a reconciliation study for the Western Cape considering the water balance, resources planning and management. An outcome of this study was that a Steering Committee was established between the City and DWA to monitor the implementation of the reconciliation study
• The City’s water supply is supplemented from the Breede-Overberg WMA as well and it is important that the City be represented in its CMS.
Local Municipalities
There are five municipalities in the City’s jurisdiction and the City is vested with the executive authority in respect of those municipalities.
IDF & IMF As the major contributor to the Provincial GDP, it is critical that the city maintains a cooperative relationship with the surrounding municipalities and/ or districts in the Province. The DIF and IMF are critical forums to facilitate cooperative relationships to promote the coordinated development of the province as a whole.
Saldanha Bay Local Municipality
The City has identified Saldanha Bay local municipality as a municipality that may either compete with or compliment the City’s developmental objectives. If the City and Saldanha Bay does not develop and/or maintain their cooperative relationships both municipalities developmental goals may be frustrated as they are situated less than 2 hours apart, share water resources in an area that has been identified as “increasing water scarcity”
Scenario planning
A review of the City’s IDP reveals that the City is strongly aligned with the planning documents in respect of it being a Global City and recognises the critical role it plays in the
46
context of South Africa and the world. The City describes itself as a City within a region, a City within a country, a City in Africa and a City within the world. It is South Africa’s third largest City and is identified as being an important gateway to local, regional and national development. Strategic regional infrastructure is located in the jurisdiction of the City and it provides employment to people from across the Province. It is also being increasingly linked to the surrounding towns in the region and has in particular identified Saldanha as a potential catalyst to further large scale industrial development, which may compete with or compliment the Cape Town Port in the long term. The City is being called upon to compete internationally to ensure its sustainable economic growth, without losing sight of its local, regional and national development imperatives. Having been identified as a Global City, the City has already implemented a number strategies geared towards strengthening its global position as per the Planning documents, namely:
• Intention to grow the City as an international business and investment destination. The Cape Town International Convention Centre (CTICC) aims to be a venue with a goal to be the best long-haul international convention Centre by 2020. The CTICC contributed about R2.3 billion to the national economy in 2008/9. Cape Town is still the top destination in Africa and the Middle East for conferencing.
• (FEM Research analysis, 2010) The Business process outsourcing and off-shoring (BPO&O) industry generated an annual turnover of between 2.5 billion and 3.3 billion (approx. 20% of national industry) and is fast becoming a major driver of the local economy. The City is a prime location for this developing industry as it has well established information communications technology (ITC) and is well placed to attract international investors. Cape Town is seen as the financial skills hub of South Africa based on the fact that most of the financial houses and life insurers have their headquarters based in Cape Town. An added benefit is the presence of a labour force that is equipped with financial skills. It links well with the financial and ICT sectors and has high employment potential. In 2008 approximately 28 000 people were employed by the provincial industry, 20 000 of which were full-time equivalent (FTE) agents. BPO&O industry constituted 3.1% of the total formal employment within the Metro (25% increase from the previous year).
• The creative industries comprising of film, crafts, music, performing arts, visual arts and cultural tourism. This industry is aimed at attracting foreign and local investors, and merging international trends with local creative culture. The City is also set on competing to become the world design capital by 2014. Cape Town also has the biggest visual effects studio in South Africa and an amount of R430 million has been invested into building a world calls film studio, with an incentive rebate of 15% to foreign productions.
o The sectors outlined above forms part of the tertiary economy which is export driven. It creates valuable employment but is not labour intensive.
o The City will have to focus on skills development to that the labour market can be concentrated with more semi-skilled to skilled workforce to take up employment opportunities in the tertiary sectors

47
A traffic light system is used to indicate the level of stress or risk on water quantity (circle) or quality (square) for each sector. The sectors considered include agriculture, industry, urban and environmental allocation. Red indicates high risk, orange medium and green low risk.
Figure 46: City of Cape Town Scenarios; Green= quality, Blue = quantity
Key messages
The city of Cape Town is the economic hub of the Western Cape. It is home to 78% of the Western Cape GDP and 66% of the provincial population. The City of Cape Town contributes 11% to the national GDP, and is therefore a key economic hub nationally too. The key industries include the financial and business services industry, manufacturing and wholesale and trade. Important exports include oils petroleum and citrus fruit, grapes and apples. The agricultural products are mostly sourced from outside of the metro. These are either processed within the city, and exported, or exported without further processing. The City of Cape Town is supplied with water through the Western Cape Water Supply System (WCWSS), which is part of the Berg WMA. A strong and diversified economy exists in the Berg WMA, which is dominated by the commercial trade and industrial activities in the Cape Town Metropolitan area, the towns of Stellenbosch, Paarl and Wellington and in the developing West Coast area of Saldanha Bay. The dependence of the City on distant water supplies has the potential for social conflicts with the communities in the donor basin/ catchment as they are not compensated for the exploitation of water resources. Although the City has reduced its water usage, it is not using its allocated water as efficiently as it could. Saldanha Bay is a potential competitor in respect of its port and the industrial development of the West Coast. Saldanha Bay has also been identified as a regional motor and it also obtains its water resources from the Berg WMA. The City is in support of developing the West Coast region however, the intended expansion of the Saldanha Bay Port and its industrial sector has the potential to create tension between the two municipalities if the water resources are not managed properly as they are both situated in a water scarce WMA. As it implements its strategy to become a leading global City, it will experience an influx of people from surrounding towns and provinces, in search for better opportunities. The
Agric
ultu
re • Pollution for Cape Flats farmers
Indu
stry •Current municipal
treatment sufficient Urb
an
•Current municipal treatment sufficient
Envi
ronm
enta
l Al
loca
tion •Pollution and poor
treatment of urban wastewater.
Agric
ultu
re •Not extensive farming, therefore water requirements not massive.
Indu
stry •Increasing demand
from domestic users and Saldanha causing strain on supply.
Urb
an
• Increase in demand due to increase in urbanisation
Envi
ronm
enta
l Al
loca
tion •Channeled city
streams loses the natural flow requirements of the rivers.

48
housing directorate’s housing database – 386 590 households are waiting for a housing opportunity. With the backlog in housing, an increase in the population growth rate may take place that could further frustrate housing delivery and water and sanitation services, which could delay refurbishment of the waterworks in the City even further. This will also have the effect of increasing the City’s water demand and eventually lead to a substantial increase in the price of water as generating alternative sources of water (such as desalination in the long term) may result in inhibiting economic growth and development. It is important that the City’s development path as a Global City is not pursued at the expense of its neighbouring towns. It already has the highest population in the Province which places stress on its ability to deliver quality services and may result in an increase in key delivery areas such housing, water and sanitation. Although it is not reliant on the hinterland for its sustainability, if it develops at a faster rate of the other districts in the Province it may result in the inhabitants of other districts moving to the City in search for better opportunities. It is therefore in the City’s interest to foster favourable cooperative relationships with neighbouring districts to ensure holistic regional development and coordinated allocation of resources, especially water.

49
3 METHODOLOGY
3.1 Water in the economy
A water footprint is an indicator of freshwater use that considers the direct and indirect water required to produce a product, measured over the full supply chain (Hoekstra, 2011). A water footprint is a temporally and spatially explicit representation of the volume of freshwater required to produce a good or service, measured over the entire supply chain (Hoekstra, 2011). Because a water footprint considers the total supply chain, it specifies between direct and indirect water use. Therefore water use required to grow a crop (i.e. cotton) is included as indirect water use when considering the water footprint of cotton fabric for example. A water footprint also looks at consumptive water use, excluding water which is returned to the same watershed, or is available for further use downstream. A particular characteristic of water footprints is the distinction between blue, green and grey water consumption.
• A blue water footprint refers to the volume of surface and ground water required for the production of a good or service, and is the freshwater traditionally thought of when considering water resources.
• A green water footprint refers to the volume of rainwater used to produce a product
which does not run off or recharge groundwater, but is stored in or temporarily on top of the soil.
• A grey water footprint addresses pollution, and represents the volume of freshwater
that is required to dilute or assimilate the load of pollutants based on existing ambient water quality standards. Together, the blue, green and grey components of a footprint form the overall footprint for the product.
The components of a water footprint are indicated in the following figure:
Figure 47: Components of a water footprint (Source: Hastings and Pegram, 2012)

50
A water footprint is conceptually similar to virtual water in that both represent the water required to make a product considering all inputs in the supply chain. The virtual water concept was developed by Tony Allan to explore the potential of importing virtual water through goods and services as a potential way to address water scarcity in the Middle East. A water footprint adds to virtual water in that it also describes the characteristics of the water used, including whether the water was rainwater or surface water, as well as the place of origin of the water and the time of use. Understanding the nature of the water used in a product’s supply chain is necessary to understand water dependencies and risks, as water is a resource which must be understood in its local context. Water footprinting provides a methodology through which companies or governments assess their water use and its spatial and temporal dimensions. Such assessments provide insight into subsequent risks and impacts on catchments, ecosystems, and communities. The water footprinting methodology was initially created as a tool for water resources management and this still remains its primary use. For these purposes, water footprinting allowing policymakers, planners, and managers to map various water uses in a system (e.g. agricultural, municipal, industrial), as well as the amount of water used by the community, country, region, etc. to produce the goods and services they consume (CEO Water Mandate, 2011: 81). Specific products, companies, individuals and geographic areas may have their water footprints calculated. The water footprint of a product, which is the amount of water consumed directly (operations) or indirectly (supply chain) to produce the product is distinct to the water footprint of an individual, which refers to the total amount of freshwater used to produce the goods and services (direct and indirectly) consumed by this individual. Therefore, by carrying out a water footprint one is able to provide the following information:
• Type of water used: Blue (related to fresh surface or ground water), Green (related precipitation stored in the soil as soil moisture) and Grey Water (related to water pollution).
• Spatial and Temporal localisation of the Water Footprints: all components of a total WF are specified geographically and temporally.
• Virtual Water Flows: The virtual water flow between two geographically delineated areas is the volume of virtual water that is being transferred from one to the other as a result of product trade.
The water footprint of products; the basic information provided by water footprints (WFs) can be used by the private sector to perform risk assessment, as a planning tool, to identify hotspots in their supply chains or to couple it with tools including Lifecycle Assessment (LCA) methods in order to perform benchmarking of products (UNEP, 2011). The drivers to why a corporate would carry out water footprint as a water accounting tool are explored. Primary Sector: Agriculture
The productive water footprint of the Western Cape using the bottom-up approach used the water footprint methodology as provided in the Water Footprint Assessment Manual (Hoekstra et al., 2011). A selection of the core data used can be found in Appendix 1. These

51
numbers will give an indication of the approximate crop water use required for production, however, factors including yield and yearly fluctuations in rainfall, etc. may heavily impact the calculated water footprint value. A selection of the water footprint calculations can be found in Appendix 2. The water footprint of primary production, (agricultural production) was calculated in the following way: 1. Determine the most representative weather station which has information provided on
the available databases. SAPWAT was used as it is the most representative for South African crops. Whichever crop water footprint was being calculated, an average of the closest weather stations to that region was used as an indicator of the climate.
2. Determine the crop water requirements for the crop grown in their respective areas for
the appropriate growing cycle of the crop. This represents the average millimetres of water that would be required to support optimal growth of the crop in the given location and growing season. The crop water requirements can be found for most crops using SAPWAT or the FAO’s CROPWAT and CLIMWAT databases. As the crop water requirement will change throughout the growing cycle of the crop, the crop water requirement is represented in 10-day time steps from the time it was planted to the time of harvesting.
The crop water requirement, ETc [t]mm/day, is typically determined by multiplying a crop coefficient Kc [t], which is representative of the particular crop, times the evapotranspiration ET0 [t] mm/day for a reference crop at that particular location and time. [ ] = [ ] × [ ]
Figure 48: An illustration of the calculation (Allen et al. 1998)
3. Determine the green water footprint. 3.1. Using the SAPWAT or CLIMWAT 2.0 database, determine the effective rainfall for
the geographic location for each 10-day time step relevant to the growing cycle of the crop. Effective rainfall is the rainfall which enters the root zone and which the crop can use for evapotranspiration, and therefore excludes run off.

52
3.2. For each 10-day time step, take the minimum of the effective rainfall and the crop water requirement. The green water use, CWUgreen[e,c], is equal to the minimum effective rainfall (precipitation), peff[t], and crop water evaporation requirement at that time step (t). [ , , ] = min( [ ], [ ]
3.3. Sum the minimums for each 10-day time step through the growing cycle to find the millimetres of green water used by the crop for the entire growing cycle. Multiply by 10 to convert millimetres of water to m3 per hectare, which represents crop green water use. [ , , ] = 10 × [ , , ]
3.4. Divide by yield to find the green water footprint in terms of m3 per ton of crop. 3.5. Determine the volume of apples, grapes and pears required to produce Appletiser
products, and the corresponding green water footprint resulting from crop use in products.
4. Determine the optimal blue water footprint.
4.1. For each time step, subtract the green water use found above from the crop water requirement. This represents the irrigation requirement. [ ] = [ ] − [ , , ]
4.2. As the optimal blue water footprint assumes optimal irrigation, it is assumed that the blue crop water use for each time step is equal to the irrigation requirement. Find total blue crop water use by summing overall all time steps and multiplying by 10 to convert from mm to m3 per hectare. [ , , ] = 10 × [ , , ]
4.3. Divide by yield to find the blue water footprint in terms of m3 per ton of crop. 4.4. Determine the volume of apples, grapes and pears required to produce Appletiser
products, and the corresponding blue water footprint resulting from crop use in products.
5. Determine the actual blue water footprint, which is representative of irrigation as
opposed to the theoretical blue water requirements. The actual blue water footprint could represent the volume of water abstracted for irrigation, or the amount of irrigation actually delivered to and made available to the crop for evapotranspiration which is found by multiplying irrigation abstraction by irrigation efficiency. If it is known, it is desirable to do this for each time step used above because this illustrates the use of water for a specific point in time. However, as actual irrigation for each time step is often not known, an annual total is instead used to represent the actual blue water footprint.
Following the cumulative addition of the agricultural water footprints, the total district and provincial footprints of primary production were obtained from the 2002 agricultural census in StatsSA. These are indicated in the figures below on hectares planted and yield produced.

53
Figure 49: Hectares planted and tons produced from crops in Western Cape (StatsSA, 2001)
The yield of the different crops in different areas was calculated. This data was then used to calculate the water footprint per hectare and finally per ton using the yield data. The water footprint value was then used to determine the full agricultural water footprint of the Western Cape according to water footprint type (blue or green) and district municipality within the Western Cape.
Figure 50: Western Cape Blue and Green Agricultural Water Footprint (Own Calculation)
Secondary sector: Manufacturing
The water footprint of the secondary sector proved complex to calculate. A number of options were explored. One option is the global industrial water footprint average used by Mekonnen and Hoekstra (2011) of 80l/US$. Due to the high variability of price and nature of goods manufactured in the Western Cape, the global average was not used. Instead, the
00.5
11.5
22.5
3
City ofCape Town
Winelands West Coast Eden Overberg CentralKaroo
Hect
ares
x 10
0000
Planted (ha)
FIELD DRY
FIELD IRRIG
VEGETABLES
CITRUS
GRAPES
DECIDUOUS
TEA/NUTS
0
5
10
15
City
of C
ape
Tow
n
Win
elan
ds
Wes
t Coa
st
Eden
Ove
rber
g
Cent
ral
Karo
o
Tons
x 10
0000
Production (metric tonnes)
FIELD DRY
FIELD IRRIG
VEGETABLES
CITRUS
GRAPES
DECIDUOUS
- 200 000 000 400 000 000 600 000 000 800 000 000
1 000 000 000
City of CapeTown
Winelands West Coast Eden Overberg CentralKaroo
Western Cape Blue and Green Agricultural Water Footprint (m3/annum)
Blue
Green

54
water footprint of secondary production was estimated by first calculating the average water footprint of the different key industrial sectors of the Western Cape. The key sectors investigated include agro-processing, chemicals and steel. The value of each manufacturing type was taken into account to calculate the m3/ZAR value for each form of manufactured product. This was then compared with the GDP contribution of each sector in the Western Cape to give an indication of the manufacturing water footprint. Tertiary sector: Services and tourism
The tertiary sector water footprint was separated into the human water footprint of the service sector and the water footprint of tourism in the Western Cape. Mekonnen and Hoekstra (2011) data was used as the basis of the water footprint per capita per year. The tourism footprint calculated using average person water footprint per day multiplied by number of bed nights 3.2 Scenario planning
A literature review of international methods as well as South African scenario planning examples was carried out. The following internationally recognised forms of scenario analysis were investigated:
- Shell scenario planning - High – low level envelopes - California water plan-type scenarios
In South Africa, the following scenario planning exercises were considered as inputs into this analysis:
- Mont Fleur Scenarios of 1992 - Dinokeng Scenarios of 2008 - South Africa Scenarios for 2025 - City of Cape Town Electricity Scenarios - Water Sector 2025 Institutional Landscape - Western Cape Water Reconciliation Strategy - Breede-Overberg Catchment Management Strategy - Regional downscaled climate change scenarios
Before scenarios may be formulated, an uncertainty analysis was carried out for the impact and uncertainty of numerous factors which may impact the future of water in the Western Cape. The uncertainty factors were characterised into groups, and ranked according to their impact on water in the Western Cape. This impact may be both direct (technological advances) as well as indirect (social structure).

55
The result of considering these uncertainties is shown in the figures below. Allocation of the factors into levels of impact and uncertainty was done with a group of contributors around a table. This is a subjective process and there may be flexibility regarding the placement of some of the factors. This list is not exhaustive, and there may be a large number of uncertainties which may be deemed important to both the economy and water in the Western Cape which are not included. A short explanation of the placement of each of the uncertainties is given to further explain the decisions made.
Figure 51: Water in the economy uncertainties
Total population: Uncertainty: Extremely Low. Growth of population in South Africa, and in particular the Western Cape is very certain. The growth rate and impact of migration from surrounding provinces is not expected to slow in the next 20 years. Impact: Extremely high. A growing Western Cape population will result in a large impact to both the water resources and economy of the Western Cape. More people will result in a higher demand of water resources not only for domestic use, but also for the expanding economy. Western Cape economy: Uncertainty: Extremely Low: The Western Cape is highly certain with respect to its comparative advantage in terms of agriculture, and large, low water impacting financial services economy. Impact: Medium-low. The impact of the Western Cape economy on water resources is high with respect to uncertainties in the agricultural or manufacturing sector. The tertiary services sector however, has a very small impact on water resources. Therefore, the average is a medium-low impact. South African economy: Uncertainty: Low. The wider South African economy is not uncertain with respect to its impact on water in the Western Cape.

56
Impact: The South African economy has a smaller impact on water resources in the Western Cape in comparison to the Western Cape economy as it is not a driver of the particular water intense sectors in the province. Population Density: Uncertainty: Medium-low: It is not 100% certain whether or not densification policy will be carried out effectively in the Western Cape. However, it is reasonably certain that some form of densification will take place over time regardless. Impact: Medium. The impact of low density urbanisation will result in arguably a higher water demand from the domestic sector as houses will have gardens, etc. However, total domestic demand is only 10% of the total water resources used, therefore, not having as large an impact as changes in agriculture or industry for example. Agricultural economics In essence agricultural economics is related to the price of agricultural inputs (fertiliser, labour, water, and seed) and the price of the agricultural products grown. Uncertainty: Medium-high. With increasing energy prices, the cost of fertilizer and other inputs will only increase. All trends point towards increasing input prices especially labour. Impact: High. Changes in the cost of agricultural inputs may affect the optimisation and efficiency of the agricultural sector, the largest water using sector. Cost of water and wastewater treatment: Uncertainty: Low. With increasing energy prices, the cost of treatment can only increase. Impact: Medium. Changes in the cost of water and waste water treatment may drive efficiency in domestic, industrial and agricultural water use, thereby reducing demand of water on the system. Climate Variability: Uncertainty: Medium. Climate change is undeniable. In terms of temperature, it is almost certain it is going up. Impact: High. Changes in the climatic drivers of the water cycle will heavily impact the temporal and spatial character of water in the Western Cape. This will heavily affect the agricultural sector in terms of crop growth and suitability, thereby changing the water use profile of specific regions. Tourism: Uncertainty: Low. Tourism will grow steadily in the Western Cape as a result of increasing travel globally and the resources invested by the country and province. Impact: Medium. Although the water consumption of tourism per person is not high, the destinations being visited (i.e. Winelands) require large amounts of water to remain of interest to tourists.

57
Energy Policy: Uncertainty: Medium. It is unsure as to whether or not SA will be able to remove its dependency from coal, or better manage its energy reserves. Impact: Medium. Rising costs of energy have repercussions throughout the economy, impacting on agricultural, industrial and potentially domestic water use. However, although policy may be written, implementation may not be as effective. Industrial Policy: Uncertainty: Medium. It is unsure as to where the South African labour laws, etc. will impact the industrial sector in South Africa. Impact: Medium. Increased industrial water use has implications on water supply in the Western Cape in terms of continuous water and quality requirements. In addition, waste water implications need to be considered. However, although policy may be written, implementation may not be as effective. Agricultural Policy: Uncertainty: Medium. The impact of land reclamation policy is uncertain in South Africa, however, regardless, South African agricultural policy is not completely uncertain. Impact: Medium. A dying agricultural economy as a result of unfavourable policies to (especially commercial farmers) is likely to have a large impact on water resources in the province. However, although policy may be written, implementation may not be as effective. Water Policy: Uncertainty: Medium. Western Cape water policy is not changing at rapidly and unexpectedly in South Africa. Impact: Medium. Progressive and effective policy and management of water resources in the Western Cape will have a high impact on the security if the resource. However, although policy may be written, implementation may not be as effective. Water Governance: Uncertainty: Medium. Considering the pressures being faced in the South African economy, it is not certain that water will transform into a well governed sector. Impact: Medium-high. Ineffective governance of the water sector may heavily impact the implementation of good water policies drawn up in our legislature. Water Quality: Uncertainty: Medium. With growing industrial and domestic water use, it is reasonably certain water quality may deteriorate unless effective treatment or polluter pays policies, etc. are implemented. Impact: High. Decreasing water quality will heavily impact the affordability of agriculture in the Western Cape. Among other affects, poor quality exports may destroy the export economy, a major pillar of the Western Cape economy.

58
Poverty and equity: Uncertainty: High. Although policy improving the lives of the poor is active, it is unclear whether or not it is able to keep up with the growing population pressures from migration and a growing birth rate. Impact: High. Reductions in poverty and an increasing middle-income group will have a large impact on domestic water use. In addition, decreasing poverty implies increased industrial development which also has a large water footprint. Export economy: Uncertainty: Medium-high. The export economy is not only dependent on the Western Cape and South Africa economy, exchange rates, other fruit exporting companies and spread of disease or drought may annihilate a single export year, greatly affecting the industry. Impact: High. A large majority of the water in the Western Cape is used to export crops which are then exported out of the Western Cape. Failure or expansion of this economy will have a large impact on water resources. Consumer preferences: Uncertainty: High. Behavioural economics and consumer preference is an extremely hard reaction to quantify. Impact: Medium. Consumer preferences in terms of water-wise gardening, reduced meat consumption or more frugal water use domestically may have an impact on water resource use in the province. This is not as large as widespread changes in industrial or agricultural policies however. Growth of middle income: Uncertainty: Low. Development in South Africa, with pro-poor policies is bound to translate into a growing middle class. Impact: High. Growth of the middle class has been shown to impact water demand considerably. This is not only in terms of volumetric physical water use, but water footprint as a result of increased meat consumption too. Social Compact: Uncertainty: Very high. It is uncertain as to whether or not social commitment in South Africa will be possible considering the lack of transparency, etc. in the public sector. Impact: Very high. A cohesive and committed population is able to impact a large amount of positive change in South Africa, enabling major water use reductions for example. Environmental Ethic: Uncertainty: High. It is uncertain as to whether or not en ethical fabric in relation to the environment will be developed. Impact: Medium. The environmental ethic of the Western Cape population will have a medium impact on water resources in the province. It is unlikely all of the population will be

59
able to consider the environmentally in such a manner it is unlikely to have a far reaching impact. Mining and Gas: Uncertainty: High. It is unknown as to what the future of fracking and other mining or gas exploration may be in South Africa. Impact: Medium. Although mining is not a major sector in the Western Cape, its effect, if gas and fracking are included may have a large impact on the water situation in South Africa. Technology: Uncertainty: Extremely high. Although the past shows major developments in technology changing the way in which we live. In terms of the water sector, it is uncertain such innovation will take place. Impact: Medium. Should there be a breakthrough in water treatment using solar power and saline water for example; the coastline of the Western Cape will become water secure, freeing up a large amount of industrial demand. Following the explanation of the uncertainties, the figure below indicates the specific themes which are used as the base for the scenarios. The scenarios are specifically centred, as required through the scenario planning methodology, on high impact and high uncertainty factors.
Figure 52: Water in the economy themes
As indicated in the uncertainty analysis, there are four specific nodes of uncertainties which are used to build the scenarios. These are primarily, but not exclusively the high impact, high uncertainty uncertainties as indicated in the figure above. The uncertainty nodes are centred on a selection of the following:

60
- Urban economy - Agricultural economy - Extractive economy - Society and social cohesion
These are built into four scenarios which include different scenarios of the urban, agricultural and extractives economy and social cohesion.
Figure 53: Water in the economy scenarios
Each scenario is then applied to the key development nodes of the Western Cape. A traffic light system is used to indicate the level of stress or risk on water quantity (circle) or quality (square) for each sector. The sectors considered include agriculture, industry, urban and environmental allocation. Red indicates high risk, orange medium and green low risk.
Figure 54: Water quality impacts (green)
•Uneven Social cohesion•Strong Agriculture•Growing urbanisation•Good govt policy; implementation uneven
1. Stagnating Pond
•Dysfunctional social compact•Agriculture shrinking •Small but growing extractives sector•Uncontrolled expansive urbanisation•Govt policy implementation failure
2. Falling off the boat
•Large amount of extractives including fracking•Good got policy and implementation•Reduction in tourism and agriculture•Uneven social welfare
3. Rushing through the rapids
•Managed cooperation•Controlled urbanisation•A growing extractive industry which is regulated•Implementation of good government policy•Efficiency gains and high value agriculture
4. A good wind in the sails
Agric
ultu
re • Pollution from industry
Indu
stry •Can afford
treatment of water U
rban
•Polluted water supply from industry, can be treated but expensive
Envi
ronm
enta
l Allo
catio
n •Poor env policy implementation cannot ensure water is kept unploouted for the environment.

61
Figure 55: Water quantity impacts (blue)
Scenario 1: The stagnating pond
As the economy limps along, there are a number of winners and losers. Middle (and upper) income bracket groups are able to withstand the uneven implementation and management of policy from government, carving out a future for themselves. Losers include the poor and marginalised as they are unable to leave the trap of poverty and dependency.
- Uneven social cohesion
This scenario is characterised by poor and marginal labour not having a strong social compact while the middle and upper income bracket populations are not affected. Uneven social cohesion may be likened to the middle of the road Dinokeng Scenario “walk behind.” The scenario proposes that, although belatedly, government may eventually turn towards improving the quality of its social service delivery (Dinokeng, 2009; page 55). The poor and marginalised labour by not being part of the compact are effectively left behind.
- Strong agriculture
Agriculture is a strong sector in the Western Cape. The Western Cape’s 13 million hectares of agricultural land, 12.4% of the nation’s, produces between 55% and 60% of South Africa’s agricultural exports. The contribution of the Western Cape to South African commercial agriculture is calculated by StatsSA at 21.4% (2007) (Wesgro; Agribusiness, 2011). In this scenario, agriculture remains important in the economy of the Province. However, the social compact, particularly of the marginalised farm labourers may become untenable, crises may erupt in the sector as employees’ revolt against the situation.
- Growing urbanisation
There is a high level of urbanisation in the Western Cape, particularly because it is a province with far higher opportunities than the neighbouring Eastern and Northern Cape. The key demographic trends of the Western Cape include the increase in internal and external migration added to an increase in refugees and displaced persons. With an uneven social compact, this is of concern as the current increasingly rapid rate of urbanisation is unable to keep up.
Agric
ultu
re •Outpriced by industry demand for water In
dust
ry •Afford desalilnation
• Buy up agricultural water rights
Urb
an
• Increase in demand due to increase in industry
Envi
ronm
enta
l Allo
catio
n •Poor policy implemnetation does not protect supply for the environment.

62
- Small but growing extractives industry
Currently the Western Cape mining industry contributes only 1% to the Provincial GDP. However, according to Wesgro (2005), this importance of the oil and gas sector is growing. The potential for the gas and oil as well as fracking industry is large and not yet tapped. Mossel Bay is home to South Africa’s largest gas facility while the strategic position of the industry in the Cape ensures its role as a servicing region for the oil and gas industry along the entire African coastline. Therefore, as stands, the oil, gas and energy related industries play a significant role in the economy of the Western Cape, however, there is potential for more.
- Good government policy but implementation is uneven
Lack of policy implementation in key strategic areas is not a new problem. Regardless of the fact that the legislation and policies drawn up in South Africa are often world-class, implementation thereof remains a problem. This can be likened to the “busy bee” scenario in the CSIR-WRC Water Scenarios 2025 document (2011). This scenario is characterised by noble intentions, however inability to correctly execute requisite actions. Poor spatial planning, misalignment with projects, simplistic solutions and an increasing inability to deal with the unknown may act as indicators.
- Environmental allocation
As the implementation and management of policy is unable to gain solid ground, the environmental allocation of water may decrease. Growing agriculture, urbanisation and industry without functional monitoring and regulation will result in the environment losing its allocation.
- Economy
Growth of the economy in this scenario is average. The province is unable to attract real growth and investment in neither agriculture nor the industrial sector. Cape Town will remain an anchor point to the economy, and is unlikely to change dramatically. As the economy limps along however, growing discontent will arise with those at the margins. Summary – impact on water quality and quantity: A proposed summary of potential changes in the water use of each sector are explored for this scenario. In essence, the agricultural sector’s water use will remain the same due to stagnation in the sector. There will be no drive towards efficiency; neither will there be sufficient development in the sector to warrant large increases in irrigation. Agricultural water quality may increase as less intensive agriculture with a large number of chemicals is used. There is an equal risk however that insufficient regulation allows polluters to go unchecked. This is especially true for the urban and industrial sectors. Urban water use as well as industrial water use will grow steadily during this scenario. Environmental allocations may decrease as sufficient policy is not put in place to conserve the natural resource. This is aligned with the status quo where the standards have not yet been met in terms of the environmental flow. Inadequate regulation allows other sectors to abstract water illegally.

63
- Climate Change
Assuming a significant decrease in rainfall and increase in temperature in central and western Western Cape, increased frequency of extremes including drought and floods and a change in temporal and spatial nature on eastern Western Cape rainfall (but little change to the mean), the following potential effects include:
Large negative impact on agriculture in the region as the sector is not strategic and adaptive towards change. Aside from potential sea-level rise, the urban economy; including industrial nodes such as Cape Town, remain relatively unaffected (compared to agriculture). Unsustainable urban design, which does not take account of the future extreme events including floods, may be at risk of damage. The low water footprint of industry results in a lower relative effect as a result of potential temperature and rainfall changes. The environmental reserve may decrease as policy is not implemented adequately, and agriculture is not forced to be efficient.
Scenario 2: Falling off the boat
In this scenario everyone loses. Without a functioning social compact and failing policy implementation, the agricultural industry fails. The economy is affected negatively as a result.
- Dysfunctional social compact
“Walking apart” in the Dinokeng scenarios (2008) is what this scenario may be likened to in terms of the togetherness of society. As cronyism and corruption in government appointments and tenders grows, education and health care deteriorate. A rift widens between government and its citizens as a pact between government, labour and business fails. Polarisation between the “haves” and the “have nots” becomes debilitating.
- Agriculture shrinking
As a result of the growing discontent within society, the agricultural sector begins shrinking. Without certainty around labour, it becomes difficult for agricultural sector cohesion and stability. This is particularly bad for economies dependent on agriculture including the Winelands and Overberg. Mechanism increases as farmers try to deal with labour difficulties. Pockets of success become evident, however in general the industry stagnates and is unable to contribute significantly to the Western Cape economy. Because the Western Cape agricultural sector is strong in the exports market, this may spell chaos for the export economy and foreign exchange earnings for the Province and country as a whole.
- Small but growing extractives industry
As above, in scenario 3, the extractives industry including oil and gas remains important but small in the Province.
- Uncontrolled expansive urbanisation
The urbanisation level in the Western Cape sits at 90%, the second highest after Gauteng. When uncontrolled, urbanisation comes with a number of negative social consequences including the shortage of decent houses and the growth of slums and unemployment

64
(StatsSA, 2006). The City of Cape Town will continue to grow at a rapid pace, without the required services keeping up. As the agricultural sector collapses, the problem of immigration will become more pertinent.
- Environmental Allocation
As the implementation and management of policy is unable to gain solid ground, the environmental allocation of water may in fact increase. Should agriculture shrink, water availability may increase to the environment, particularly if the industrial sector remains small.
- Good government policy but implementation failure
Lack of policy implementation is not a new problem. Regardless of the fact that the legislation and policies drawn up in South Africa are often world-class, implementation is not carried out effectively. Without critical policy management in the Province, urbanisation runs unchecked. The social compact is not managed as the poor and marginalised demand results. In terms of the 2025 Water industry scenarios, the form of governance most alike to this scenario is the ignorant ostrich. Instead of proactively dealing with the failures in governance, we hide away from the problems by sticking our head into the sand. A poor understanding of sustainability and systems thinking; without a clear institutional system in place; result in little concern to security, maintenance and quality. Knowledge and expertise are devalued resulting in poor institutional memory. Summary – impact on water quality and quantity: A proposed summary of potential changes in the water use of each sector are explored for this scenario. The key characteristic of this scenario is the unchecked growth of the extractives industry in particular. As policy implementation is low in this case, water quality may deteriorate substantially. In connection with the growth of the extractives industry, agriculture may slow. As a result of the shrinking agricultural economy, water use may decrease. As with the previous scenario 1 however, urban and industrial water consumption will increase. It is unsure whether or not the environmental reserve will change as the decrease in agricultural water demand may be completely negated by urban and industrial demand. This then does not change the water allocation to the environment. In terms of quality however, the environment will likely suffer as effluent discharge is likely to go unchecked.
- Climate Change
Assuming a significant decrease in rainfall and increase in temperature in central and western Western Cape, increased frequency of extremes including drought and floods and a change in temporal and spatial nature on eastern Western Cape rainfall (but little change to the mean), the following potential effects include:
• Little effect on urban and industrial water requirements. • Coastal urban nodes may be at risk of sea level rise and coastal degradation due to
increased extreme events. • Unsustainable urban design, which does not take account of the future extreme
events including floods, may be at risk of damage. • Extremely negative effect compounding an already shrinking agricultural economy

65
• The failing institutions associated with this scenario result in poorly managed water and wastewater treatment facilities. Pollution emanating from these sources negatively affects the environment. Climate variability compounds these affects further.
Scenario 3: Rushing through the rapids
This scenario results in both winners and losers. Through rapid and reasonably regulated expansion of the extractives industry, economic growth does occur. However, this rapid growth is without inclusion of all the poor and marginalised. Because in many cases gas and oil extraction is not labour intensive, there are fewer social benefits from the expansion of the economy. In addition, the spatial dimension of this scenario is centred upon specific oil and gas rich nodes.
- Large amount of extractives industry including fracking
A select few nodes may experience particularly high growth as a result of their proximity to extractives’ reserves. Saldanha, Mossel Bay, Cape Town and Beaufort West in particular may be targeted through the existence of natural gas, hydraulic fracturing or off-shore reserves. In summary, gas and oil in the Western Cape is a growing economy
- Good government policy and implementation
With regulation on the industrial sector, a number of effects may take place. Firstly, pollution, checked by the relevant authorities may drastically reduce, helping conserve the marine life. A consequence of massive extractives and urban growth is the unsustainable growth in the extractives rich nodes without regard of appropriate expansion strategies which may result in large portions of the population not receiving the minimum service requirements including water and sanitation.
- Increased urbanisation
Urbanisation will be highly localised in areas of energy potential. In addition to Cape Town; Saldanha, Mossel Bay and Beaufort West may experience particularly fast growth.
- Reduction in tourism and agriculture
As the economy grows through the energy industry, tourism and agriculture stagnate and may begin to shrink. This will negatively impact the export economy and influx of foreign exchange. The reduction on tourism will have the same effect on foreign earnings. As the extractives industry gains in purchasing power, it is able to buy off valuable water from the farmers. Alternatively, it is able to desalinate where appropriate. This may promote efficiency gains in irrigation, or it may become preferable for farmers to trade water rights in lieu of farming completely.
- Uneven societal welfare
Due to the nature of the extractives industry, there may be unevenness in the welfare of the Western Cape Province population. Nodes rich in oil and gas industry may grow, however as seen with the recent mine strikes, the distribution of wealth from such an industry is not even.

66
- Environmental Allocation
Where policy implementation is improving in South Africa, environmental allocation is likely to increase. Industry is able to afford high value water to the detriment of the agricultural and environmental sector. With sufficient regulation of policy, industrial production will not be allowed to continue to pollute unchecked. If unchecked, this is a risk to both water quality and quantity, hence the important of policy implementation. Summary – impact on water quality and quantity: A proposed summary of potential changes in the water use of each sector are explored for this scenario. With the explosion of the extractives oil and gas industry, the water requirement for industry will increase significantly. Due to the higher value per m3 of industrial water, this sector will force efficiency gains from agriculture. A decrease in embedded water in the agricultural sector does not mean shrinkage of the economy, but rather, a decrease in irrigation water required. Again the urban demand for water will increase. Environmental allocation may or may not decrease, depending on the policy implementation of the reserve. Should this not be managed correctly, a decrease not only represents a quantity of water no longer available for environmental use, but also quality as a result of increasing industrial use.
- Climate Change
Assuming a significant decrease in rainfall and increase in temperature in central and western Western Cape, increased frequency of extremes including drought and floods and a change in temporal and spatial nature on eastern Western Cape rainfall (but little change to the mean), the following potential effects include:
• Relatively small effects to industrial and urban water allocation because they are proportionally smaller and generally less vulnerable to rainfall shifts (than agriculture).
• Coastal urban nodes may be at risk of sea level rise and coastal degradation due to increased extreme events.
• Unsustainable urban design, which does not take account of the future extreme events including floods, may be at risk of damage.
Scenario 4: A good wind in the sails
This is the preferred scenario. Increased economic growth is sustainable through strategic and controlled growth in both the agricultural and extractives industry. The social compact is strong and environmental allocation is ensured.
- Managed cooperation
Through engagement between the State and business; a formal social pact emerges. This includes political parties, labour, business and citizen’s group. The end result is business shouldering more responsibility in education, infrastructure and health. In addition, this scenario is characterised by an active citizenry where responsibility is shared for policy outcomes and development. The “walking together” scenario of the Dinokeng Scenarios (2008) is most relevant here.

67
- Controlled Urbanisation
There are several planning issues to be considered. The first set of options would be to try and modify the migration processes in the country, which might include attempts to curb the flow of migrants to the cities by adopting migration-control measures to prevent such migratory moves. A second option would be to encourage growth in small and medium-sized towns to divert migration away from the larger cities. A third option could be to build new regional capitals. A more pragmatic approach may be to try and accommodate the spontaneous urbanisation processes in the country. Such an approach will have to involve the Departments of Housing, Health, Transport, Social Development, Education, Provincial and Local Government, the National Treasury and many others.
- Meeting developmental and environmental goals of province through improved implementation of good government policy.
The Dinokeng Scenario (2008) “walk together” helps conceptualise what improved policy implementation may result in. Although the scenario admits difficulties at the start, through addressing out critical economic and social challenges by engaging state, civil society, labour and business; positive changes may take place. Increasing accountability through building the capacity of the state to deliver core public services is critical to this realisation. A common identity and nationhood through rising above narrow self-interests to contribute to the building of our nation is required.
- Efficiency gains and high value agriculture
On recognition of the high value of water, agriculture is forced to carry out efficiency gains. As a result the economy is driven towards high value crops which ensure a greater return on investment.
- A growing extractives industry
Recognition of the strategic importance of the Western Cape as an oil and gas repair port, in addition to the required development of a number of gas-rich nodes including Mossel Bay and Saldanha results in a growing extractives economy. Because of the high value of this sector, the GDP economy is grown. In addition, because of the relatively lower water requirement (excluding the potential adverse effects of fracking), water may still be available for agriculture, tourism and the environmental allocation. Summary – impact on water quality and quantity: A proposed summary of potential changes in the water use of each sector are explored for this scenario. Due to the higher value per m3 of industrial water, this sector will force efficiency gains from agriculture. Therefore, a decrease in embedded water in the agricultural sector does not mean shrinkage of the economy, but rather, a decrease in irrigation water required. Again the urban demand for water will increase. However, unlike in the previous scenarios, where the environmental reserve allocation decreased, in this scenario the opposite is true. This is because sufficient policy and regulation ensure that the environment receives the allocation it requires to function as a healthy ecosystem.

68
- Climate Change
Assuming a significant decrease in rainfall and increase in temperature in central and western Western Cape, increased frequency of extremes including drought and floods and a change in temporal and spatial nature on eastern Western Cape rainfall (but little change to the mean), the following potential effects include:
• Relatively small effects to industrial and urban water allocation because they are proportionally smaller and generally less vulnerable to rainfall shifts (than agriculture).
• Coastal urban nodes may be at risk of sea level rise and coastal degradation due to increased extreme events. Through this scenario, sufficient planning, and importantly, the required implementation are put in place to ensure infrastructure is designed accordingly.
• Agriculture is affected, however, because of strategic planning and adaptive management, the sector is able to adapt according to the changes being experienced, keeping the comparative advantage of agriculture in the Western Cape.
• Sufficient regulation of water consumption and discharge ensures that water for the environment is adequately allocated. Climate change therefore does not have as large an impact as it could have.

69
4 RESULTS OF ANALYSIS AND STAKEHOLDER DIALOGUES
There are a number of cases where understanding the role of water in an economy of a region may be useful. Understanding of the flows of water through an economy may help to build dialogue between different sectors or levels of government. The method of investigating the role of water in the economy is also useful during integrated planning for a region, as the process indicates the linkages between water and the economy. Improved planning of water resources may be enabled through a better understanding of the water requirements of different sectors. Understanding the role of water in the economy has traction through the following areas:
1. Promoting dialogue: Western Cape Economic Development Partnership - Understanding the role of water in the economy is a useful tool in bringing diverse
sectors; from environmental management to export policy makers together. Water is a critical component to a number of elements in the economy, and thus needs to be discussed through a multi-stakeholder platform. The water in the economy process is a useful tool to carry out the mandate of the EDP in bringing partnerships together
2. Water planning: Catchment Management Strategy (CMS) - In order to develop the CMS, the role of water in supporting the economy of the WMA
needs to be understood, as fundamental to the Water for Growth and Development philosophy espoused by DWA. Allocation of the resource without full understanding of how this may affect the resource as well as the public and private sector is limiting. Therefore, going through the process of investigating the role of water in the economy is a useful tool in ensuring a robust CMS is drawn up, in terms of the formulation of the Catchment Vision and the Strategic Objectives to achieve that Vision.
3. Integrated Planning: Spatial Development Framework Planning - Spatial mapping of surface water resources and the economy, although useful, can
be improved through carrying out an understanding of the role of water in the economy. Identifying the supply chains of products by using water foot printing for example; will help better understand spatial development in the province. The spatial nodal focus of the water in the economy analysis allows linkages to the spatial development framework, and also helps in better grasping the interconnectedness of different sectors or economies within a region or couple of regions.
4. National Process Planning: National Water Resources Strategy - Valuable communication between the diverse stakeholders involved in drawing up
the strategy is improved further through allowing the role of water to be communicated clearly to non-water specialists. The complexity of water resources management is often unclear to those who are not involved in the sector. Understand the role of water in the economy of the region will help clarify what the strategically important water sources may be. This is important to ensure representatives from outside the water realm are brought into relevant planning processes. In particular, the process is useful in thinking about broader developmental pathways and possible trade-offs between sectors for allocation purposes.

70
A list of the suggested groups or stakeholders who may potentially be interested in this work is given below according to the groupings mentioned above. This list includes potential stakeholders were identified following recommendations from the Third Steering Committee Meeting in March 2013. Those in bold have been initiated. Dialogues have carried out between the respective groups in an effort to transfer the knowledge and findings of this research process. Further groups and organisations have expressed interest in the findings of this work, and are awaiting the final publication for reference. This list is not exhaustive as there are potentially many more sectors interested in the role of water in the economy of their local region, municipality, river basin, province or even country.
• Promoting Dialogues
• Western Cape Economic Development Partnership (EDP)
• Presented work to the EDP. There was keen interest. Through the EDP, contact was made to Green Cape who has improved on the methodology and has continued with this theme of research.
• Premiers Consultative Forum (PCF)
• DEA&DP and DWA Water Steering Committee Meeting
• Presented work to the Steering Committee Meeting. A number of follow-up interviews were carried out to confirm the methodology and assumptions of the project. Contact made with a range of government departments, which helps support the notion that water footprinting is helpful in linking different sectors or departments.
• Water Planning
• Catchment Management Strategies (CMS): classification/visioning and strategy
• Dam building decision making
• Integrated Planning
• Spatial Development Framework (SDF)
• Integrated Development Plans (IDPs)
• Infrastructure Development Planning (DoT)
• Meeting with the Infrastructure Development Planning Team of the Department of Transport and Public Works to discuss the relevance of this work in their integrated planning.
• Water in the Economy Project (Green Cape)
• Use of project concepts and methods to inform some of the conceptual planning of the Green Cape projects. There was a real opportunity for the Green Cape Projects to learn from the findings of

71
the WRC Project in order to improve on the analysis and methods of the research.
• Western Cape Berg River Study (DEA&DP)
• Presentation at the Berg River Symposium held by DWA and DEA. Again there was interest in the methods used. Reference made to the applicability of ground truthing some of the findings in the respective catchments.
• National Processes
• National Water Resources Strategy (NWRS)
• National Development Plan (NDP)

72
5 DISCUSSION
The Western Cape is a water stressed region, which in many regions is heavily dependent on water in the economy. This is not only true in regions where agriculture is the backbone of further productive activity, but also in terms of tourism, manufacturing (both agriculturally based and industrial) and the tertiary sector. Although the tertiary sector may use little water volumetrically, a large proportion of the services rendered are related to the agricultural sector of the province for example. Also, the quality and assurance of supply need to be higher in comparison to that of agriculture. Not only is the Western Cape economy, but our export economy too, is dependent on water. The Western Cape is characterised by key development nodes. Each of these has distinct relationships with regard to their economies and water; however, they all have same form of relationship between economy and water. Differences between the nodes are related to their relationship between rural and urban areas; or their underlying sectorial value. As a result of the different drivers towards understanding water and the economy in each of the nodes, the management thereof may be nuanced. Each development node is characterised through a particular IDP. There is coherence of the local IDP and the provincial IDP through a dialectic process. Therefore, the economic planning of the province is well integrated vertically through the two-way planning process. In addition, there is a broad consistency with regard to water planning. It is unclear whether this is through accident or design. However, where there is less alignment in the IDPs is through the horizontal alignment of local nodes. This research creates the possibility of water being brought into the planning process through purposeful design, and enables the clear articulation both vertically and horizontally with regard to future development planning. Importantly, it allows water to be brought into the planning process through the lens of the Local Economic Development Plan (LED) and not through water services alone. Observations of interest relating to the previous case study nodes are specific to the priority sector driving the economy and water management area. Following the consideration of economic and hydrological factors in each region, makes the following observations regarding the local priority nodes: - The West Coast Regional Motor is characterised by possible water tensions between the steel processed through the port (which provides 10% of the jobs) and agriculture (which provides 40% jobs). The distinction between the West Coast Regional Motor and the Olifants Agricultural Valley need to be further interrogated to distinguish between the two distinct economies. - The Breede Development Corridor is characterised by a water-based economy through its dependence on agriculture. Agriculture, both irrigated and dry, contributes 15% to the regional economy (and 40% of the jobs). Agricultural manufacturing contributes 20% of the economy and 10% of the jobs, while tourism, which is heavily dependent on the aesthetic value of functioning farms in the region, contributes 10% to the economy (and 45% of the visitors to the Western Cape). Although the towns in the region contribute heavily to the economy (50%), they are unable to function without the support of the agricultural industry.

73
- The Eden District Municipality is characterised by a drought stressed economy (and intermittent floods). Although agriculture is relatively smaller, the region is home to crops which are unable to be grown elsewhere in the country (hops). The manufacturing sector is made up of secondary agriculture and gas processing, while the tourism sector is significantly linked to the aquatic systems of the region. In the Eden District, the tertiary services sector is significant. - Lastly, the development of the City of Cape Town (the City) as a “Global City” is characterised by domestic or urban water use. As a Global City, it is primarily a tertiary City. The City contributes 75% of the provincial GDP and is home to two thirds of the provincial population. The City is a provincial growth driver, and although not dependent on the interior of the province completely, it is an integral part. Therefore, it is clear that for each node there are distinct considerations to be made regarding the economy and water. By bringing water into the forefront of planning in terms of the LED; development planning is able to take cognisance of the resource constraints. Future development scenario, with a clear understanding of how water underlies the economy, will contribute to further development of each node. In terms of Provincial development, it is important for future development scenarios to consider all elements (including the key development nodes), as well as the entire province. Communicating the role of water in the Western Cape economy, and particularly at the local level of the development nodes; assists in the consideration of water as a potential catalyst or constraint of development. The enabling of this conversation at an economic development planning level will contribute to the integration of water into future economic development scenario planning. The process of understanding the role of water in the Western Cape economy is useful in a number of platforms both in government development planning, and partnership building as well as a suite of uses during the CMS process. The use of a single “language” to try and communicate complex water systems to economic policy will help “bring water out of the water box.” Through the ability to understand the impact of water on the economy, and vice versa, headway can be made into more robust decision making with respect to both water allocation and economic development planning. However there are a number of difficulties in calculating the exact water costs of different economic sectors. Difficulties with data availability and the uncertainties with respect to water availability make it difficult to have a set figure indicating the “water footprint” of certain entire industries. Regardless of these difficulties however, the process itself is a useful one, where only through attempting to calculate and understand the flows of water through the economy does one truly being to understand the complexity of water. In essence, it is the narrative of the impacts of the economy on water and that of water on the economy which is useful.
74
6 RECOMMENDATIONS
This water in the economy concept needs to be presented to a number of the platforms and processes further to gauge the usefulness of the concept. In addition, it is suggested that the process be repeated with improved data sources to better the understanding of how water flows through the economy. An in-depth analysis of local level water in the economy implications is required. This is because initial presentations of this work have found the engagement with the private sector less compelling due to the scale of water and economy investigated (district level municipality or water management area). Therefore, a local level investigation into a local municipality economy and water scenarios needs to be carried out in order to better grasp the private sector role in water in the economy. It is assumed that at a local level, the public and private sector responses to understanding the role of water in the economy may be more tangible. Data throughout this project has been a challenge. Recommendations going forward would be to use only standardised databases from government or alike in order to interrogate the nature of the economy in different regions. The use of standardised provincial or national data is necessary to ensure that analyses of regions within the Western Cape are comparable.

75
7 References
Methodology and data:
Elsenberg, 2009; Available at: http://www.elsenburg.com/economics/statistics/start.html
Hoekstra et al., (2011). The Water Footprint Assessment Manual: Setting the global
standard.
Mekonnen, Mesfin M., and Arjen Y. Hoekstra. "National water footprint accounts: the green,
blue and grey water footprint of production and consumption." (2011).
StatsSA: http://beta2.statssa.gov.za/
Western Cape Reconciliation Strategy: http://www.dwa.gov.za/Projects/RS_WC_WSS/
Legislation:
Constitution Act 108 of 1996
Municipal systems Act 32 of 2000
Municipal Structures Act 117 of 1889
Intergovernmental Relations framework Act 13 of 2005
Development Facilitation Act 67 of 1995
Land Use planning Ordinance, 1995
Municipal Finance Management Act 56 of 2003
Division of Revenue Act
National Environmental Management Act 107 of 1998
Conservation of Agricultural Resources Act
National Water Act 36 of 1998
Water Services Act 108 of 1997
Western Cape Growth and Development Strategy (Green Paper), Government Gazette
Notice No. 6385 dated 4 October 2006
Spatial and Integrated Development Plans:
Cape Winelands District Municipality IDP
City of Cape Town IDP (annual review 2011)
Eden District Municipality IDP (annual review for 2010/11 Draft March 2010)
Mossel Bay IDP
Overberg District Municipality IDP
Saldanha Bay IDP
Western Cape Provincial Spatial Development Framework (WCP SDF), 2005. The Western Cape Province Today. Provincial Government of the Western Cape Department of Environmental Affairs and Development Planning,
76
http://www.savebantamsklip.org/docs/development_reports/psdf.pdf Western Cape Provincial Economic Review Outlook 2011. Available at: http://www.westerncape.gov.za/other/2011/9/2011_pero_final_to_printers.pdf Western Cape Provincial Economic Review Outlook 2012. Available at: http://www.westerncape.gov.za/text/2012/9/pero-2012.pdf Western Cape Spatial Development Framework (WC SDF)(2009); http://www.westerncape.gov.za/eng/pubs/public_information/W/186589; accessed 5/5/2012
Scenario Planning:
Water Sector Institutional Scenarios 2025; (2011): http://www.wrc.org.za/Knowledge%20Hub%20Documents/Research%20Reports/TT%20514-11.pdf; accessed 5/11/2012 Shell Scenario Planning Website: http://www.shell.com/home/content/future_energy/scenarios/what_are_scenarios/ www.svp.iwr.usace.army.mil; accessed 15/11/2012 Shell Scenarios Website: http://www.shell.com/home/content/future_energy/scenarios/previous/; accessed 15/11/2012 Shell Scenarios: http://www-static.shell.com/static/aboutshell/downloads/our_strategy/shell_global_scenarios/exsum_23052005.pdf; accessed 15/11/2012 Le Roux et al., (1992). Mont Fleur Scenarios, Deeper News 7(1). Accessed at: http://www.gbn.com/consulting/article_details.php?id=35; accessed 15/11/2012 Peterson, G., Cumming, G., Carpenter, S., 2003. Scenario Planning: a Tool for Conservation in an Uncertain World. Conservation Biology 17(2) 358-366. Shell Guide (2008) http://www-static.shell.com/static/public/downloads/brochures/corporate_pkg/scenarios/explorers_guide.pdf; accessed 15/11/2012 Dinokeng Scenarios (2008), http://www.dinokengscenarios.co.za/; accessed 15/11/2012 Cornelius, P., Van de Putte, A., Romani, M., (2005). Three Decades of Scenario Planning in Shell. California Management Review, 48(10): 92-109. CWP (2009).Managing an Uncertain Future. Volume 1: Strategic Plan.http://www.waterplan.water.ca.gov/docs/cwpu2009/0310final/v1c5_uncertfuture_cwp2009.pdf; accessed 01/11/2012

77
Reports:
Aurecon (2011) Western Cape: IWRM Action Plan. Status Quo report: Final Draft (Chapter 4). Breede Overberg Catchment Management Strategy: Development Futures Paper Version 1.2 (2010); unpublished Breede Overberg Catchment Management Strategy: Issues Session Power point Presentation; unpublished Breede Overberg Catchment Management Strategy: Scenarios Session Power point Presentation; unpublished City of Cape Town (CoCT), 2010. Water Services Development Plan (WSDP) for the City of Cape Town: 2010/11 – 2013/14 Davis, C.L. (2011). Climate Risk and Vulnerability: A Handbook for Southern Africa. Council for Scientific and Industrial Research, Pretoria, South Africa, http://researchspace.csir.co.za/dspace/bitstream/10204/5800/1/Archer2_2011.pdf Department of Water Affairs, South Africa. 2011. Development of Reconciliation Strategies for all Towns in the Southern Planning Region: Provincial Summary Report – Western Cape. Directorate : National Water Resource Planning. DWA Report No. P RSA 000/00/15411 Green Paper: Settlement Framework for the Western Cape Province http://www.westerncape.gov.za/Text/2004/5/gpaper_settlement_framework.pdf; accessed 06/12/2012 Mazibuko G. and Pegram G. (2006) Evaluation of the opportunities for cooperative governance between catchment management agencies and local government. WRC Report No 1433/1/06 Pegasys & BOCMA (August 2010; Version 2).Water Footprint Analysis for the Breede Catchment, South Africa. www.bocma.co.za/ Pegasys & BOCMA (August 2010; Version 2).Water Footprint Analysis for the Breede Catchment, South Africa. www.bocma.co.za/ Pegasys (March 2012). Western Cape Water in the Economy: Strategic description of water in the economy of the Western Cape. Pegasys (March 2012). Western Cape Water in the Economy: Institutional analysis. ArcelorMittal SA Sustainability Report (2009) (http://www.arcelormittalsa.com/Sustainability/SustainabilityReports.aspx) Petro SA (http://www.petrosa.co.za/)
78
StatsSA (2006); Migration and urbanisation in South Africa, http://www.statssa.gov.za/publications/Report-03-04-02/Report-03-04-02.pdf; accessed 5/11/2012 Van Niekerk A; Donaldson R; du Plessis D; Spocter M; 2010. A revision of the 2004 Growth Potential of Towns in the Western Cape Study: Discussion document. Stellenbosch University and CSIR; Available at: http://academic.sun.ac.za/cga/downloads/GPS2010_discussion_document.pdf; Accessed: 23/10/2013 Wesgro; Oil and Gas; (2005) http://www.westerncapebusiness.co.za/pls/cms/ti_secout.secout_prov?p_sid=26&p_site_id=127 Wesgro; Agri-business (2011) http://www.westerncapebusiness.co.za/pls/cms/ti_secout.secout_prov?p_sid=1&p_site_id=127; accessed 5/5/2012

79
8. APPENDICES
8.1 Appendix 1: Mekonnen and Hoekstra (2011) Data
Table 4: Selection from “Water footprint per ton of crop or derived crop product at national and sub-national level (m3/ton) (1996-2005)”
Product code (FAOSTAT)
Product code (HS)
Product code (SITC)
Product description (HS)
Product description (FAOSTAT)
Root product (HS)
Product fraction (pf)
Value fraction (vf)
Province/ state >>>
Cap
e P
rovi
nce
Kw
aZu
lu-N
ata
l
Fre
e S
tate
Tra
nsva
al
Eas
tern
Cap
e
Gau
ten
g
Mpu
mal
ang
a
Nor
ther
n C
ape
Lim
pop
o
CN
TR
Y-
aver
age
414 070820 05457
Beans, shelled or unshelled, fresh or chilled
Beans, green
070820 1.00 1.00 Green 26
4 38
3 47
2 22
2 37
3 40
9 32
4 44
4 14
4 33
3
Blue 34
1 14
0 15
7 44
2 14
1 17
2 39
7 12
9 40
1 25
0
Grey 10
5 11
1 10
4 13
8 10
6 10
6 13
0 10
8 12
3 11
6
463 070990 05459
Vegetables, fresh or chilled nes
Vegetables fresh nes 070990 1.00 1.00 Green
165
269
284
178
244
241
221
261
101
221
Blue 24
8 10
7 15
7 29
1 12
6 17
0 28
7 14
7 26
7 19
0
Grey 39 47 40 67 41 40 56 42 50 48
512 080590 05729
Citrus fruits, fresh or dried, nes
Citrus fruit, nes 080590 1.00 1.00 Green
357
370
416
236
304
319
325
346
248
328
Blue 17
3 18
4 14
9 36
9 23
1 29
6 28
8 22
5 19
6 21
3
Grey 36 36 36 39 36 37 36 36 36 36
515 080810 0574 Apples, fresh Apples 080810 1.00 1.00 Green 25
1 24
4 27
8 19
8 21
9 22
7 21
8 24
2 27
9 25
2
Blue 17
7 20
0 20
2 30
6 22
1 28
5 29
2 23
2 15
3 20
0
Grey 25 25 25 25 25 26 25 25 25 25
619 081090 05798 Fruits, fresh nes
Fruit Fresh Nes 081090 1.00 1.00 Green
672
645
740
383
618
622
565
649
657
604
Blue 46
3 52
6 53
0 89
3 55
2 64
3 79
0 59
6 45
5 60
3
Grey 65 66 65 68 65 65 67 65 65 66
15 100110 / 100190 0411
Wheat (Durum wheat, Wheat nes and meslin) Wheat
100110 / 100190 1.00 1.00 Green
952
462
776
510
783
583
1537
866
808
1040
Blue 22
5 88
6 69
3 78
9 64
0 81
3 16
0 63
6 10
5 23
0
Grey 62 56 64 78 10
1 67 15
1 73 67 98
560 080610 05751 Grapes, fresh Grapes 080610 1.00 1.00 Green
284
257
278
159
192
175
208
228
255
217
Blue 17
7 28
2 25
7 36
6 32
4 42
3 35
4 31
4 10
6 15
7
Grey 54 55 54 55 55 56 54 55 55 48

80
Table 5: Water footprint of animal products (m3/ton). Period 1996-2005
Product description (HS) Product description (SITC)
Root product (HS)
Root product (SITC)
Product
fraction
Value fractio
n Country South Africa
Production system
>> Grazing Mixed
Industrial
Weighted
average
Bovine, live except pure-bred breeding Other bovine animals 010210 00111 1 1 Green 11051.21
5628.829 3952.505 8037.112
0 0 0 0 0 0 Blue 75.03827
95.81945 169.7913 95.86655
0 0 0 0 0 0 Grey 28.42378
40.95442 204.7721 52.13586
Swine, live pure-bred breeding Swine,pure,for breeding 010310 00131 1 1 Green 4715.39
5345.138 4246.224 4976.123
0 0 0 0 0 0 Blue 498.1634
386.9441 309.6066 418.6992
0 0 0 0 0 0 Grey 297.3648
329.8532 261.6177 309.4423
Sheep, live Sheep, live 010410 00121 1 1 Green 6033.16 2686.517 1220.005 4867.733
0 0 0 0 0 0 Blue 179.5019
200.8041 251.1974 189.4334
0 0 0 0 0 0 Grey 7.07751 24.58226 32.88894 13.03966
Goats, live Goats, live 010420 00122 1 1 Green 8263.9 4063.002 1740.16 5992.012
0 0 0 0 0 0 Blue 142.3385
148.0762 189.5692 152.0124
0 0 0 0 0 0 Grey 0.600039
1.769984 5.130851 1.62534
Poultry, live except domestic fowls, weighing not more than 185 g 0 010599 0 1 1 Green
5428.566
3224.134 1999.028 3808.812
0 0 0 0 0 0 Blue 187.8348
114.3485 69.56553 133.3084
0 0 0 0 0 0 Grey 360.7282
214.2437 132.8354 253.0955
Table 6: The water footprint of national consumption per country (Mm3/yr)
Country
Water footprint of consumption of agricultural products Water footprint of consumption
of industrial products Water footprint of domestic
water consumption
Total water footprint of national consumption Ratio external / total
water footpr
int (%)
Internal (WFcons, nat,int, agr) External (WFcons, nat, ext, agr) Internal
(WFcons, nat, int,
ind)
External (WFcons, nat, ext,
ind) Internal (WFcons, nat,int) External (WFcons, nat,ext) Total (WFcons, nat)
Green
Blue Grey Green
Blue
Grey
Blue
Grey
Blue
Grey
blue
grey Green
Blue Grey Green
Blue
Grey Green
Blue Grey
South Africa
35551.6
3466.1
2253.2
10867.1
483.9
566.2
22.6
183.2
48.3
522.9
390.4
2368.3
35551.6
3879.0
4804.7
10867.1
532.1
1089.1
46418.8
4411.1
5893.8 22.0
Table 7: The water footprint of national production (Mm3/yr)
Country Water footprint of crop production*
Water footprint of grazing**
Water footprint of
animal water supply**
Water footprint of industrial production
Water footprint of domestic water supply Total water footprint
Green Blue Grey Green Blue Blue Grey Blue Grey Green Blue Grey
South Africa 35027 6412 3126 10901 282 37.8 308.8 390.4 2368.3 45927 7123 5803
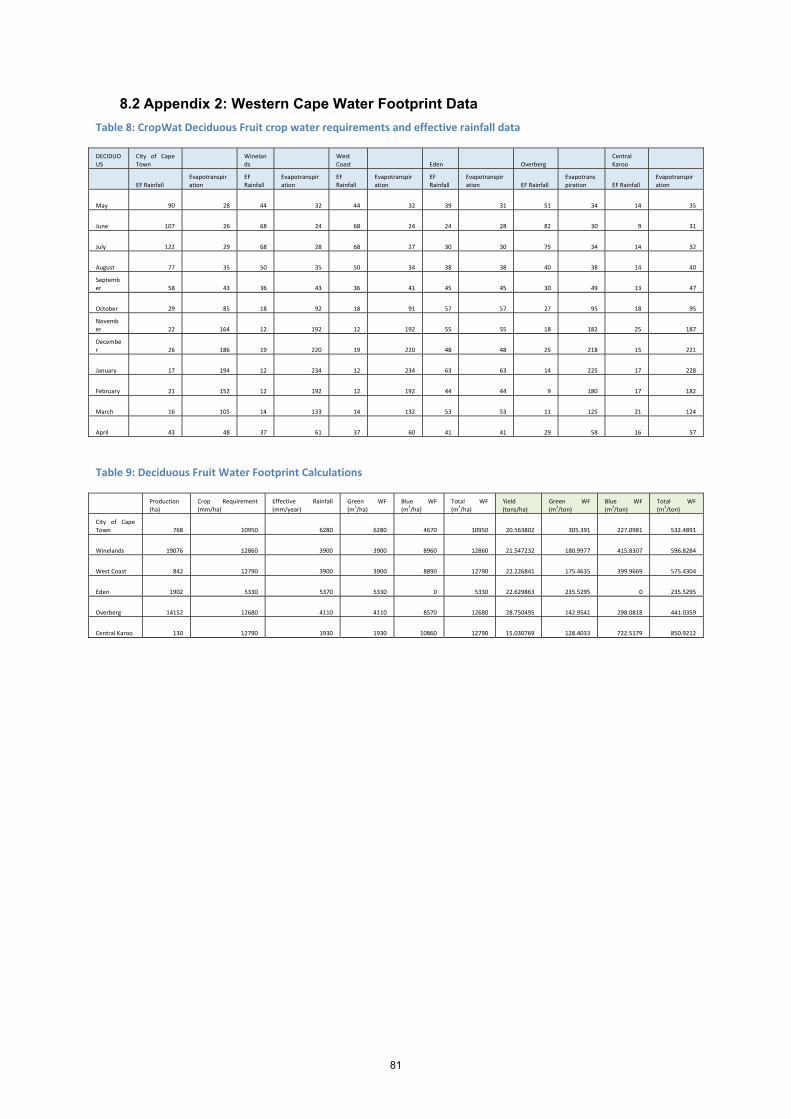
81
8.2 Appendix 2: Western Cape Water Footprint Data
Table 8: CropWat Deciduous Fruit crop water requirements and effective rainfall data
DECIDUOUS
City of Cape Town
Winelands
West Coast Eden Overberg
Central Karoo
EF Rainfall Evapotranspiration
EF Rainfall
Evapotranspiration
EF Rainfall
Evapotranspiration
EF Rainfall
Evapotranspiration EF Rainfall
Evapotranspiration EF Rainfall
Evapotranspiration
May 90 28 44 32 44 32 39 31 51 34 14 35
June 107 26 68 24 68 24 24 28 82 30 9 31
July 122 29 68 28 68 27 30 30 75 34 14 32
August 77 35 50 35 50 34 38 38 40 38 14 40
September 58 43 36 43 36 41 45 45 30 49 13 47
October 29 85 18 92 18 91 57 57 27 95 18 95
November 22 164 12 192 12 192 55 55 18 182 25 187
December 26 186 19 220 19 220 48 48 25 218 15 221
January 17 194 12 234 12 234 63 63 14 225 17 228
February 21 152 12 192 12 192 44 44 9 180 17 182
March 16 105 14 133 14 132 53 53 11 125 21 124
April 43 48 37 61 37 60 41 41 29 58 16 57
Table 9: Deciduous Fruit Water Footprint Calculations
Production (ha)
Crop Requirement (mm/ha)
Effective Rainfall (mm/year)
Green WF (m3/ha)
Blue WF (m3/ha)
Total WF (m3/ha)
Yield (tons/ha)
Green WF (m3/ton)
Blue WF (m3/ton)
Total WF (m3/ton)
City of Cape Town 768 10950 6280 6280 4670 10950 20.563802 305.391 227.0981 532.4891
Winelands 19076 12860 3900 3900 8960 12860 21.547232 180.9977 415.8307 596.8284
West Coast 842 12790 3900 3900 8890 12790 22.226841 175.4635 399.9669 575.4304
Eden 1902 5330 5370 5330 0 5330 22.629863 235.5295 0 235.5295
Overberg 14152 12680 4110 4110 8570 12680 28.750495 142.9541 298.0818 441.0359
Central Karoo 130 12790 1930 1930 10860 12790 15.030769 128.4033 722.5179 850.9212

82
Table 10: Manufacturing sector Water Footprint Calculations
Western Cape Manufacturing GDP Contribution (%) GDP Contribution (ZAR) Per Unit footprint Total Footprint
Sub-sector % of Sector Value (ZAR billion) m3/ZAR Mm3/yr
Food, beverages and tobacco 30 89.1 0.003 267.3
Food 47.3 42.1443 547.8759
Beverages and Tobacco 52.7 46.9557 610.4241
Textiles, clothing and leather goods 6 17.82 231.66
Textiles 31.6 5.63112 73.20456
Wearing Apparel 49.1 8.74962 113.74506
Leather and leather products 4.1 0.73062 9.49806
Footwear 15.1 2.69082 34.98066
Wood, paper, publishing and printing 9 26.73 347.49
Wood and wood products 22.4 5.98752 77.83776
Paper and paper products 25.8 6.89634 89.65242
Printing, publishing and recorded media 51.9 13.87287 180.34731
Petroleum products, chemicals, rubber and plastic 21 62.37 0.0005
249.48
Coke and refined petroleum products 27.7 17.27649 69.10596
Basic Chemicals 14.2 8.85654 35.42616
Other chemicals and man-made fibres 28.2 17.58834 70.35336
rubber products 2.5 1.55925 6.237
plastic products 27.5 17.15175 68.607
other non-metal mineral products
0 0
glass and glass products 23.2 14.46984 57.87936
Other non-metal mineral products 76.8 47.90016 191.60064
Metals, metal products, machinery and equipment 13 38.61 0.004
154.44
Basic iron and Steel 13.6 5.25096 21.00384
Basic non-ferrous metals 8.6 3.32046 13.28184
Metal products excluding machinery 42.8 16.52508 66.10032
Machinery and Equipment 35.1 13.55211 54.20844
Electrical machinery and apparatus 2 5.94 23.76
Electrical Machinery 0 0 0
Radio, TV, instruments, watches and clocks 1 2.97 11.88
Television, radio and communication equipment 49.7 1.47609
5.90436
Professional and scientific equipment 50.3 1.49391 5.97564
Transport equipment 6 17.82 71.28
Motor vehicles, parts and accessories 59.6 10.62072 42.48288
Other transport equipment 40.4 7.19928 28.79712
Furniture and other manufacturing 8 23.76 95.04
Furniture 11.6 2.75616 11.02464
Other Industries 88.4 21.00384 84.01536