warren sm ch.24 final
DESCRIPTION
ini merupakan solution manual untuk pengantar akuntansi buku Warren chapter 24TRANSCRIPT
CHAPTER 24PERFORMANCE EVALUATION FOR
DECENTRALIZED OPERATIONS
EYE OPENERS
1. In the cost center, the department manager is responsible for and has authority over costs only. In a profit center, the manager’s responsibility and authority extend to costs and revenues.
2. The department manager of a profit center has responsibility for and authority over costs and revenues, while the manager of an investment center has responsibility for and authority over investments in assets as well as costs and revenues.
3. The difference in budget performance re-ports prepared for department supervisors and plant managers is the amount of detail provided to each. The departmental supervi-sors require considerable detail to control costs. The report for the plant managers would contain more summarized cost data for the various departments.
4. A cost center manager is not responsible for making decisions concerning sales or the amount of fixed assets invested in the cen-ter.
5. Payroll: Number of checks issued. Accounts payable: Number of invoices paid. Accounts receivable: Number of sales invoices col-lected. Database administration: Number of reports.
6. The major shortcoming of using income from operations as a measure of investment center performance is that it ignores the amount of investment committed to each center. Since investment center managers also control the amount of assets invested in their centers, they should be held account-able for the use of invested assets.
7. Revenues and expenses are considered in computing the rate of return on investment because they directly impact the determina-tion of income from operations. Invested as-sets are considered in computing the rate of return on investment because they are the base by which relative profitability is mea-sured.
8. A division of a decentralized company could be considered the least profitable, even though it earned the largest amount of in-come from operations, when its rate of re-turn on investment is the lowest. In this situ-ation, the division would be considered the least profitable per dollar invested in the divi-sion.
9. By dividing income from operations by the amount of invested assets, each division is placed on a comparable basis of income from operations per dollar invested.
10. East Division. The East Division will return 26 cents (26%) on each dollar of invested assets, while the Central and West divisions will return only 20 cents and 15 cents, re-spectively. Thus, in expanding operations, the East Division should be given priority over the Central and West divisions.
11. A balanced scorecard can indicate the un-derlying causes of financial performance from innovation and learning, customer, in-ternal, and financial perspectives. In addi-tion, a balanced set of measures helps man-agers consider trade-offs between short- and long-term financial performance.
12. The objective of transfer pricing is to encour-age each division manager to work in the best interests of the company. Thus, trans-fer prices should encourage managers to transfer goods between divisions if the over-all company income can be increased.
13. When unused capacity exists in the supply-ing division, the negotiated price approach is preferred over the market price approach.
14. Standard cost prevents the transfer of seller efficiencies or inefficiencies to the purchas-ing division, thus isolating cost performance to each division.
15. The transfer price should be less than the market price but greater than the supplying division’s variable cost per unit.
313313
314314
PRACTICE EXERCISES
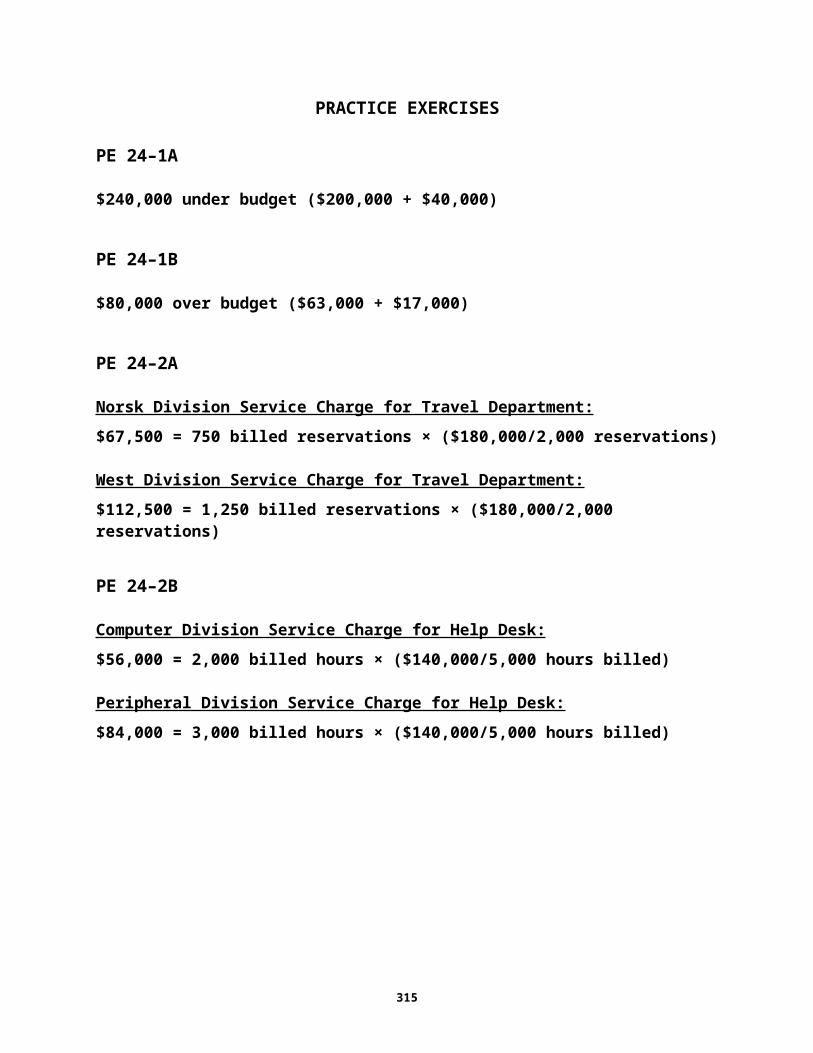
PE 24–1A
$240,000 under budget ($200,000 + $40,000)
PE 24–1B
$80,000 over budget ($63,000 + $17,000)
PE 24–2A
Norsk Division Service Charge for Travel Department:$67,500 = 750 billed reservations × ($180,000/2,000 reservations)
West Division Service Charge for Travel Department:$112,500 = 1,250 billed reservations × ($180,000/2,000 reservations)
PE 24–2B
Computer Division Service Charge for Help Desk:$56,000 = 2,000 billed hours × ($140,000/5,000 hours billed)
Peripheral Division Service Charge for Help Desk:$84,000 = 3,000 billed hours × ($140,000/5,000 hours billed)
315
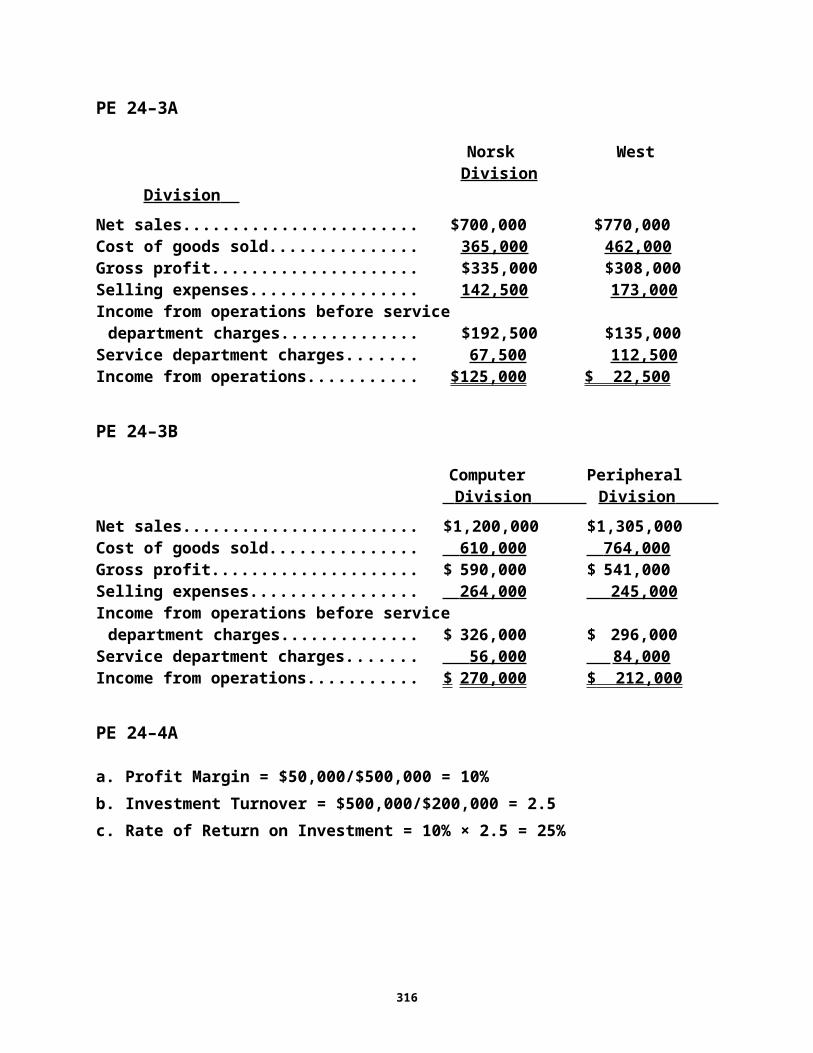
PE 24–3A
Norsk WestDivision Division
Net sales........................................................ $700,000 $770,000Cost of goods sold....................................... 365,000 462,000 Gross profit................................................... $335,000 $308,000Selling expenses........................................... 142,500 173,000 Income from operations before service
department charges................................... $192,500 $135,000Service department charges........................ 67,500 112,500 Income from operations............................... $125,000 $ 22,500
PE 24–3B
Computer Peripheral Division Division
Net sales........................................................ $ 1,200,000 $ 1,305,000Cost of goods sold....................................... 610,000 764,000 Gross profit................................................... $ 590,000 $ 541,000Selling expenses........................................... 264,000 245,000 Income from operations before service
department charges................................... $ 326,000 $ 296,000Service department charges........................ 56,000 84,000 Income from operations............................... $ 270,000 $ 212,000
PE 24–4A
a. Profit Margin = $50,000/$500,000 = 10%b. Investment Turnover = $500,000/$200,000 = 2.5c. Rate of Return on Investment = 10% × 2.5 = 25%
316
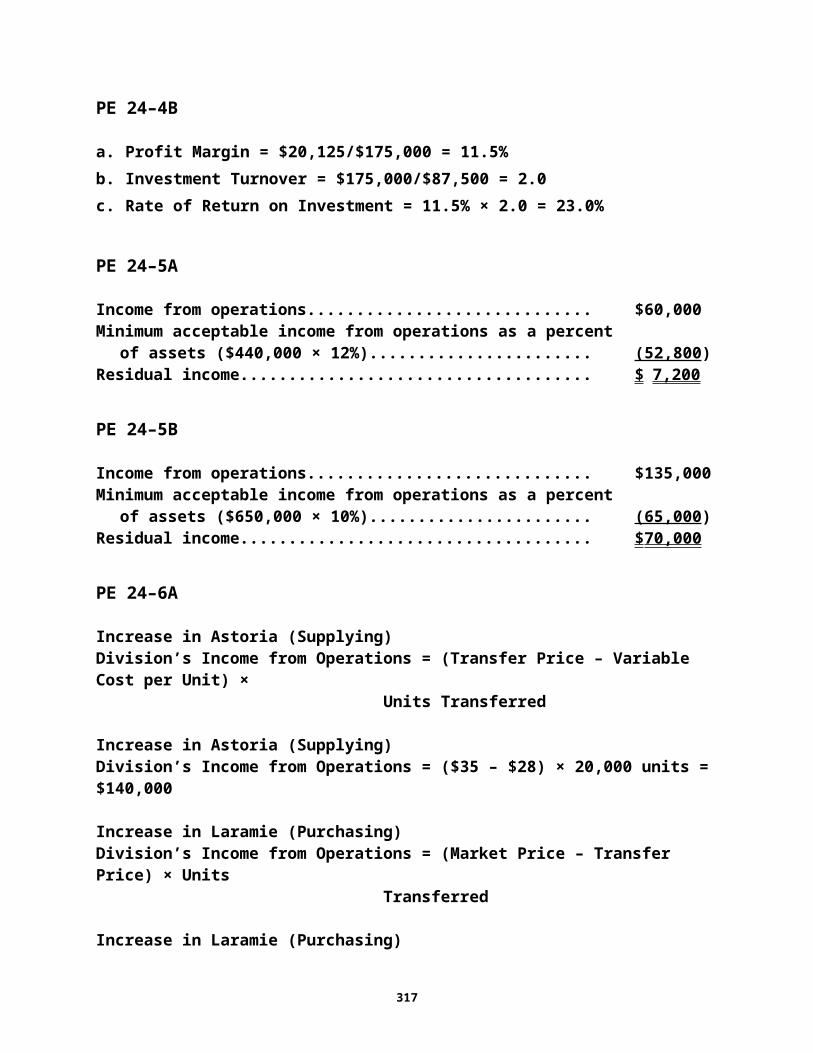
PE 24–4B
a. Profit Margin = $20,125/$175,000 = 11.5%b. Investment Turnover = $175,000/$87,500 = 2.0c. Rate of Return on Investment = 11.5% × 2.0 = 23.0%
PE 24–5A
Income from operations...................................................................... $ 60,000Minimum acceptable income from operations as a percent
of assets ($440,000 × 12%)............................................................ (52,800 )Residual income.................................................................................. $ 7,200
PE 24–5B
Income from operations...................................................................... $135,000Minimum acceptable income from operations as a percent
of assets ($650,000 × 10%)............................................................ (65,000 )Residual income.................................................................................. $ 70,000
PE 24–6A
Increase in Astoria (Supplying)Division’s Income from Operations = (Transfer Price – Variable Cost per Unit) ×
Units Transferred
Increase in Astoria (Supplying)Division’s Income from Operations = ($35 – $28) × 20,000 units = $140,000
Increase in Laramie (Purchasing)Division’s Income from Operations = (Market Price – Transfer Price) × Units
Transferred
Increase in Laramie (Purchasing)Division’s Income from Operations = ($40 – $35) × 20,000 units = $100,000
317

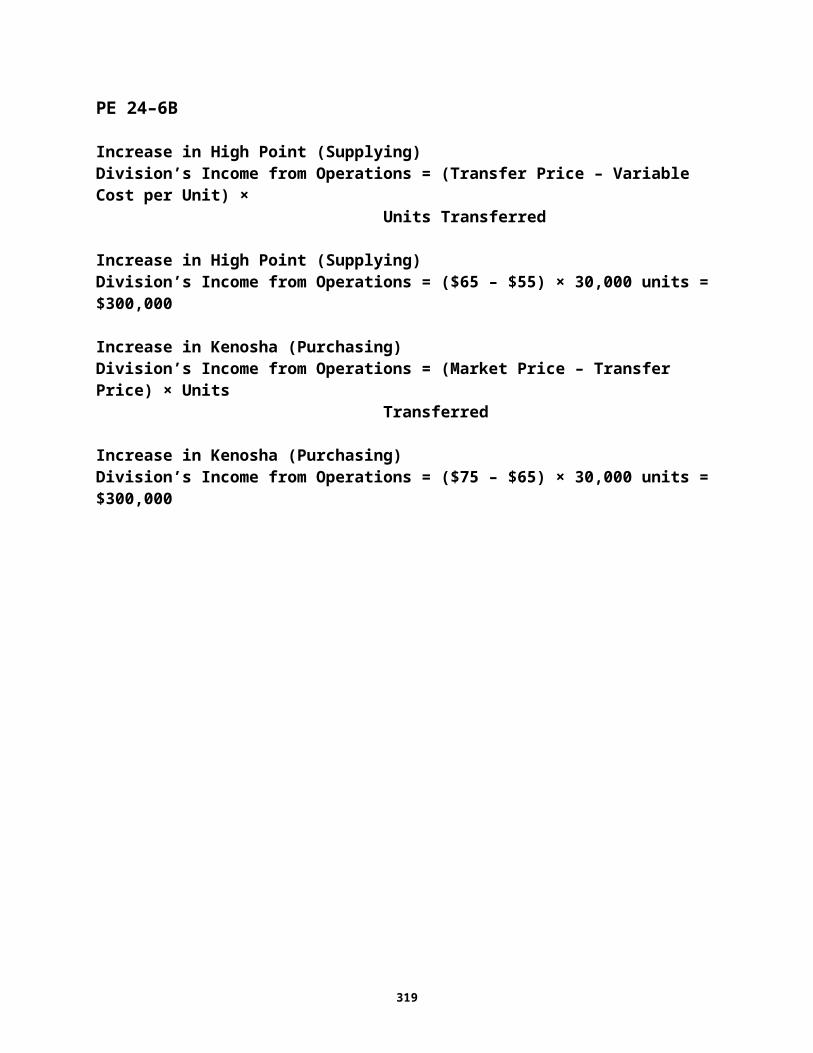
PE 24–6B
Increase in High Point (Supplying)Division’s Income from Operations = (Transfer Price – Variable Cost per Unit) ×
Units Transferred
Increase in High Point (Supplying)Division’s Income from Operations = ($65 – $55) × 30,000 units = $300,000
Increase in Kenosha (Purchasing)Division’s Income from Operations = (Market Price – Transfer Price) × Units
Transferred
Increase in Kenosha (Purchasing)Division’s Income from Operations = ($75 – $65) × 30,000 units = $300,000
318
EXERCISES
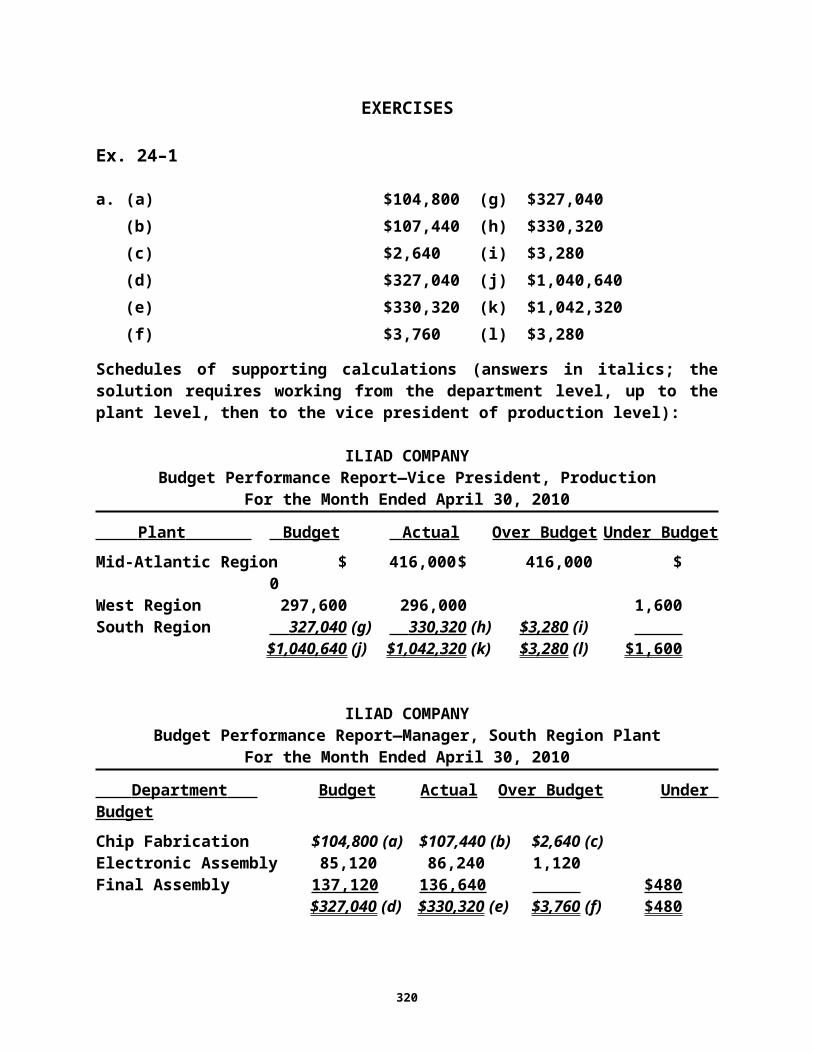
Ex. 24–1
a. (a) $104,800 (g) $327,040(b) $107,440 (h) $330,320(c) $2,640 (i) $3,280(d) $327,040 (j) $1,040,640(e) $330,320 (k) $1,042,320(f) $3,760 (l) $3,280
Schedules of supporting calculations (answers in italics; the solution requires working from the department level, up to the plant level, then to the vice presi -dent of production level):
ILIAD COMPANYBudget Performance Report—Vice President, Production
For the Month Ended April 30, 2010
Plant Budget Actual Over Budget Under BudgetMid-Atlantic Region $ 416,000 $ 416,000 $ 0West Region 297,600 296,000 1,600South Region 327,040 (g) 330,320 (h) $3,280 (i)
$1,040,640 (j) $1,042,320 (k) $3,280 (l) $1,600
ILIAD COMPANYBudget Performance Report—Manager, South Region Plant
For the Month Ended April 30, 2010
Department Budget Actual Over Budget Under BudgetChip Fabrication $104,800 (a) $107,440 (b) $2,640 (c)Electronic Assembly 85,120 86,240 1,120Final Assembly 137,120 136,640 $480
$327,040 (d) $330,320 (e) $3,760 (f) $480
319
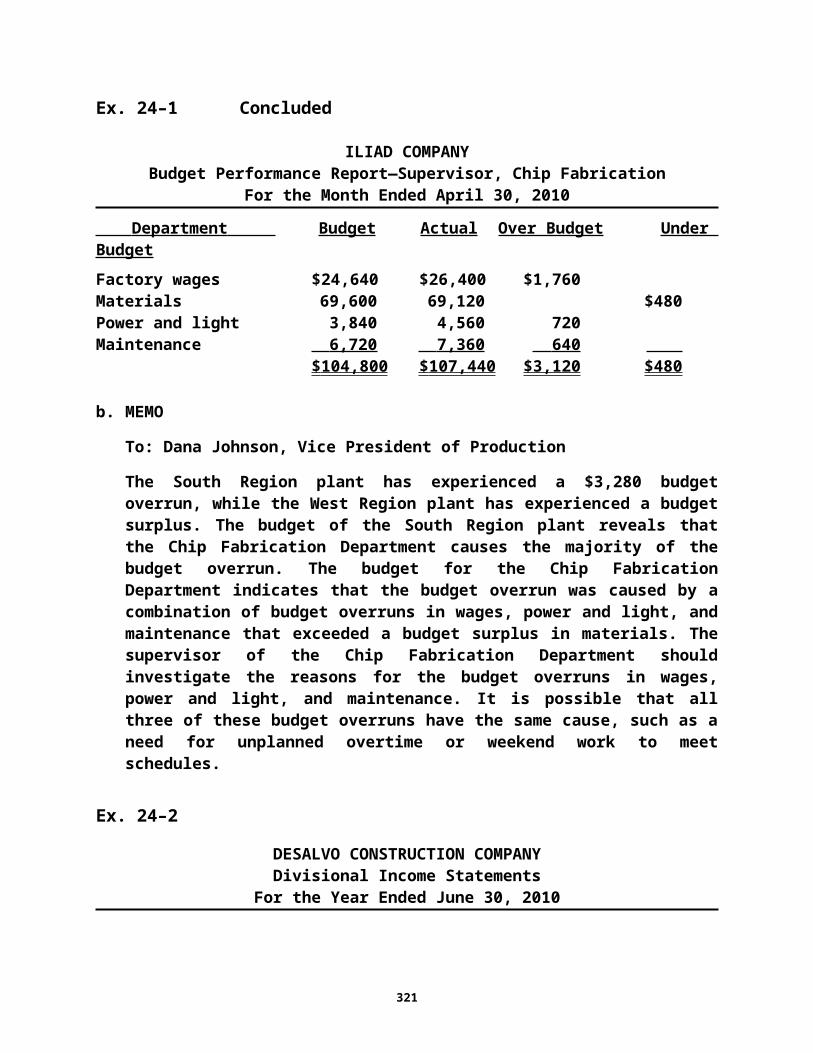
Ex. 24–1 Concluded
ILIAD COMPANYBudget Performance Report—Supervisor, Chip Fabrication
For the Month Ended April 30, 2010
Department Budget Actual Over Budget Under BudgetFactory wages $ 24,640 $ 26,400 $1,760Materials 69,600 69,120 $480Power and light 3,840 4,560 720Maintenance 6,720 7,360 640
$ 104,800 $ 107,440 $3,120 $480
b. MEMO
To: Dana Johnson, Vice President of Production
The South Region plant has experienced a $3,280 budget overrun, while the West Region plant has experienced a budget surplus. The budget of the South Region plant reveals that the Chip Fabrication Department causes the majority of the budget overrun. The budget for the Chip Fabrication Depart-ment indicates that the budget overrun was caused by a combination of bud-get overruns in wages, power and light, and maintenance that exceeded a budget surplus in materials. The supervisor of the Chip Fabrication Depart-ment should investigate the reasons for the budget overruns in wages, power and light, and maintenance. It is possible that all three of these budget overruns have the same cause, such as a need for unplanned overtime or weekend work to meet schedules.
Ex. 24–2
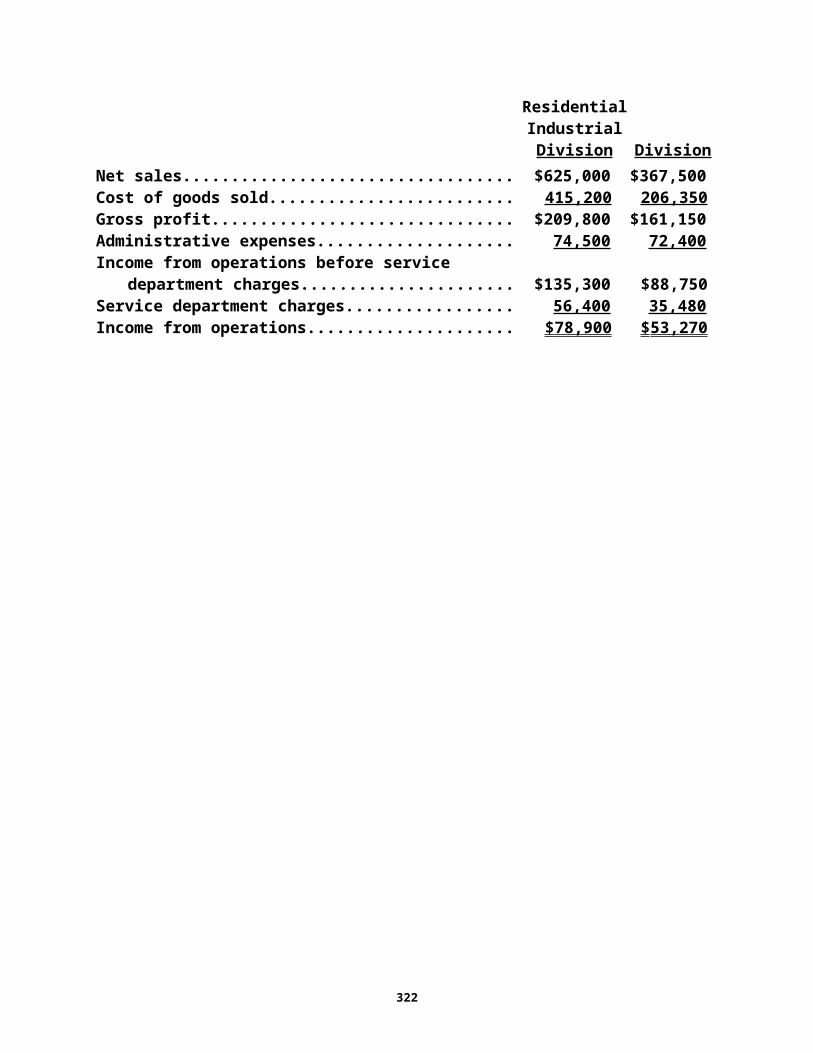
DESALVO CONSTRUCTION COMPANYDivisional Income Statements
For the Year Ended June 30, 2010Residential Industrial Division Division
Net sales.............................................................................. $625,000 $367,500Cost of goods sold............................................................. 415,200 206,350 Gross profit......................................................................... $209,800 $161,150Administrative expenses................................................... 74,500 72,400 Income from operations before service
department charges.................................................... $135,300 $ 88,750Service department charges............................................. 56,400 35,480 Income from operations.................................................... $ 78,900 $ 53,270
320
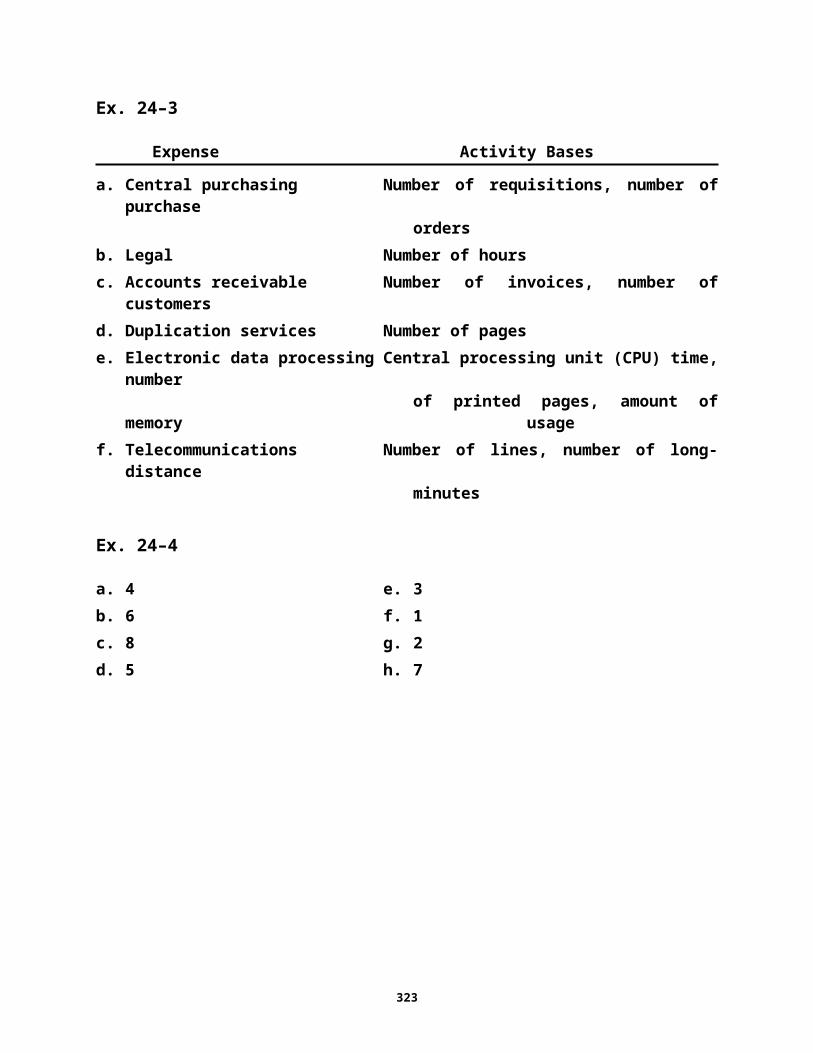
Ex. 24–3
Expense Activity Bases
a. Central purchasing Number of requisitions, number of purchaseorders
b. Legal Number of hoursc. Accounts receivable Number of invoices, number of customersd. Duplication services Number of pagese. Electronic data processing Central processing unit (CPU) time, number
of printed pages, amount of memoryusage
f. Telecommunications Number of lines, number of long-distanceminutes
Ex. 24–4
a. 4 e. 3b. 6 f. 1c. 8 g. 2d. 5 h. 7
321
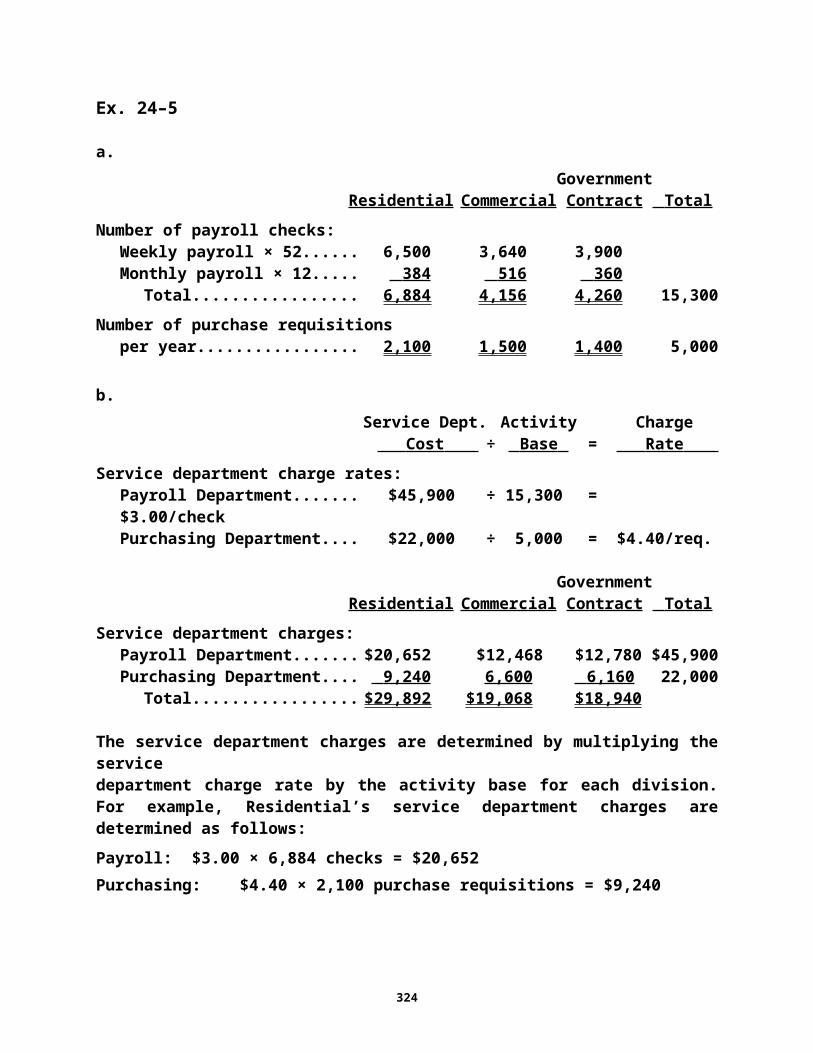
Ex. 24–5
a.Government
Residential Commercial Contract Total Number of payroll checks:
Weekly payroll × 52.................... 6,500 3,640 3,900Monthly payroll × 12.................. 384 516 360
Total....................................... 6,884 4,156 4,260 15,300Number of purchase requisitions
per year....................................... 2,100 1,500 1,400 5,000
b.Service Dept. Activity Charge Cost ÷ Base = Rate
Service department charge rates:Payroll Department.................... $45,900 ÷ 15,300 = $3.00/checkPurchasing Department............. $22,000 ÷ 5,000 = $4.40/req.
GovernmentResidential Commercial Contract Total
Service department charges:Payroll Department.................... $20,652 $12,468 $12,780 $45,900Purchasing Department............. 9,240 6,600 6,160 22,000
Total....................................... $29,892 $19,068 $ 18,940
The service department charges are determined by multiplying the service department charge rate by the activity base for each division. For example, Resi-dential’s service department charges are determined as follows:Payroll: $3.00 × 6,884 checks = $20,652Purchasing: $4.40 × 2,100 purchase requisitions = $9,240
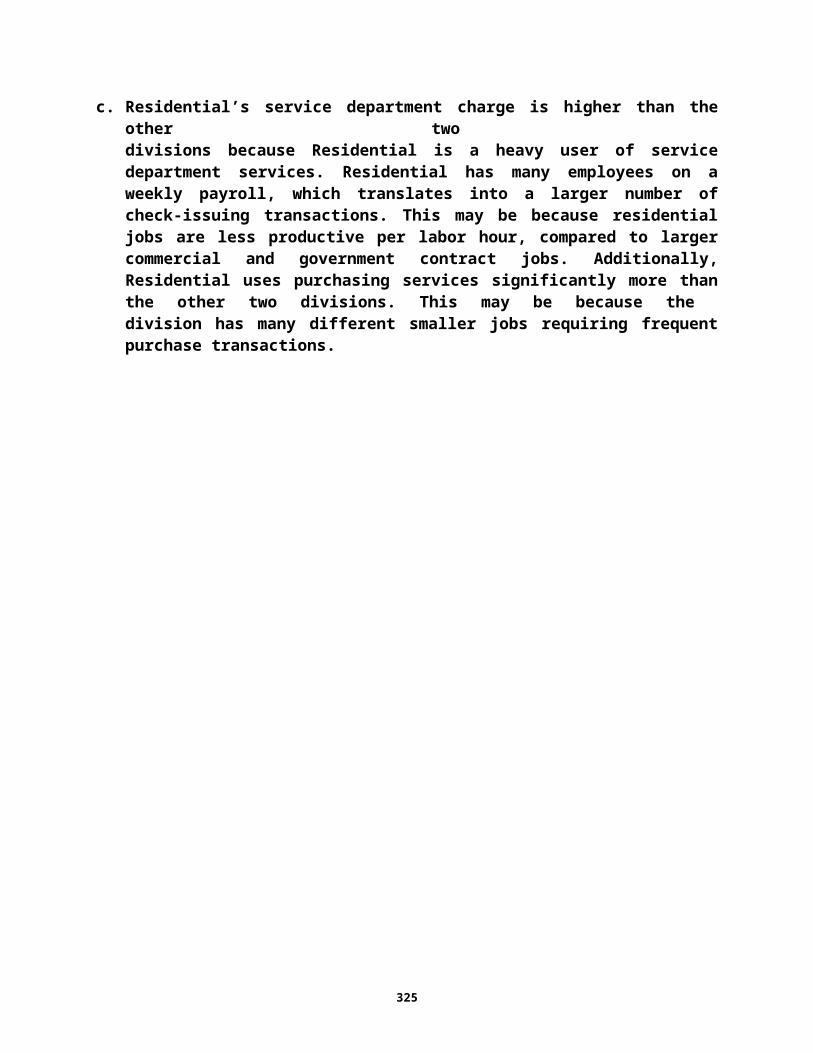
c. Residential’s service department charge is higher than the other two divisions because Residential is a heavy user of service department ser-vices. Residential has many employees on a weekly payroll, which translates into a larger number of check-issuing transactions. This may be because res-idential jobs are less productive per labor hour, compared to larger commer-cial and government contract jobs. Additionally, Residential uses purchasing services significantly more than the other two divisions. This may be be-cause the division has many different smaller jobs requiring frequent purchase transac-tions.
322
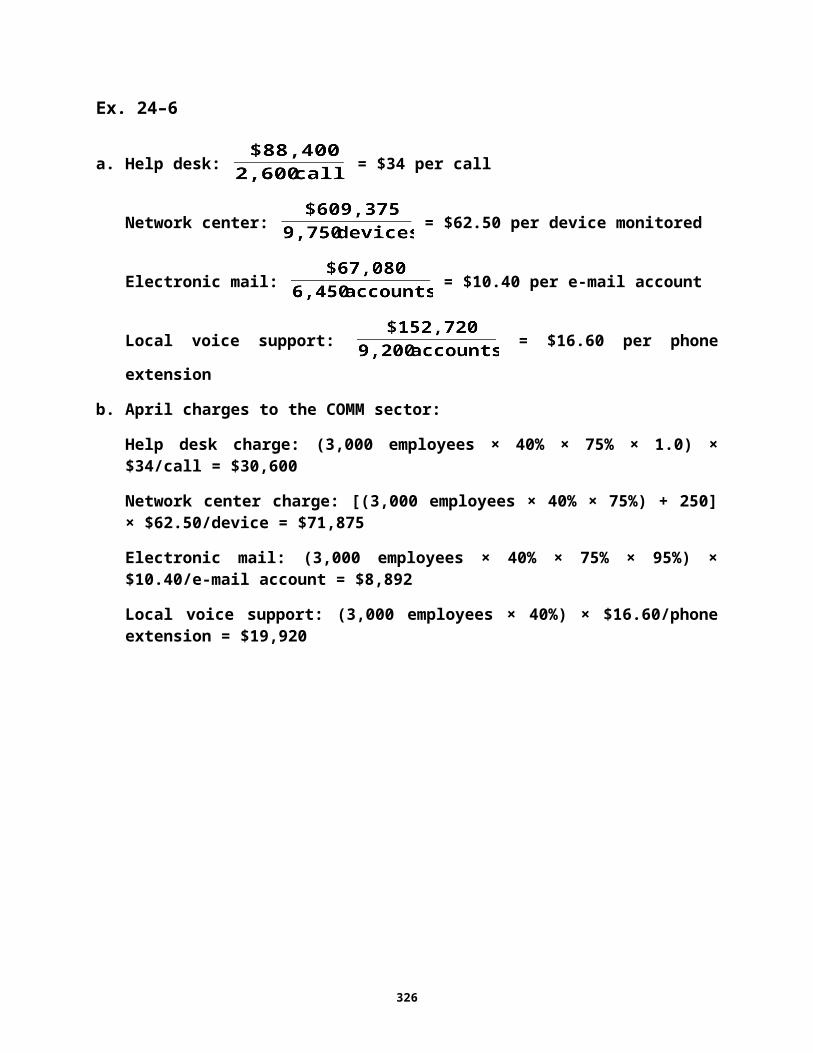
Ex. 24–6
a. Help desk: = $34 per call
Network center: = $62.50 per device monitored
Electronic mail: = $10.40 per e-mail account
Local voice support: = $16.60 per phone extension
b. April charges to the COMM sector:
Help desk charge: (3,000 employees × 40% × 75% × 1.0) × $34/call = $30,600
Network center charge: [(3,000 employees × 40% × 75%) + 250] × $62.50/de-vice = $71,875
Electronic mail: (3,000 employees × 40% × 75% × 95%) × $10.40/e-mail ac-count = $8,892
Local voice support: (3,000 employees × 40%) × $16.60/phone extension = $19,920
323
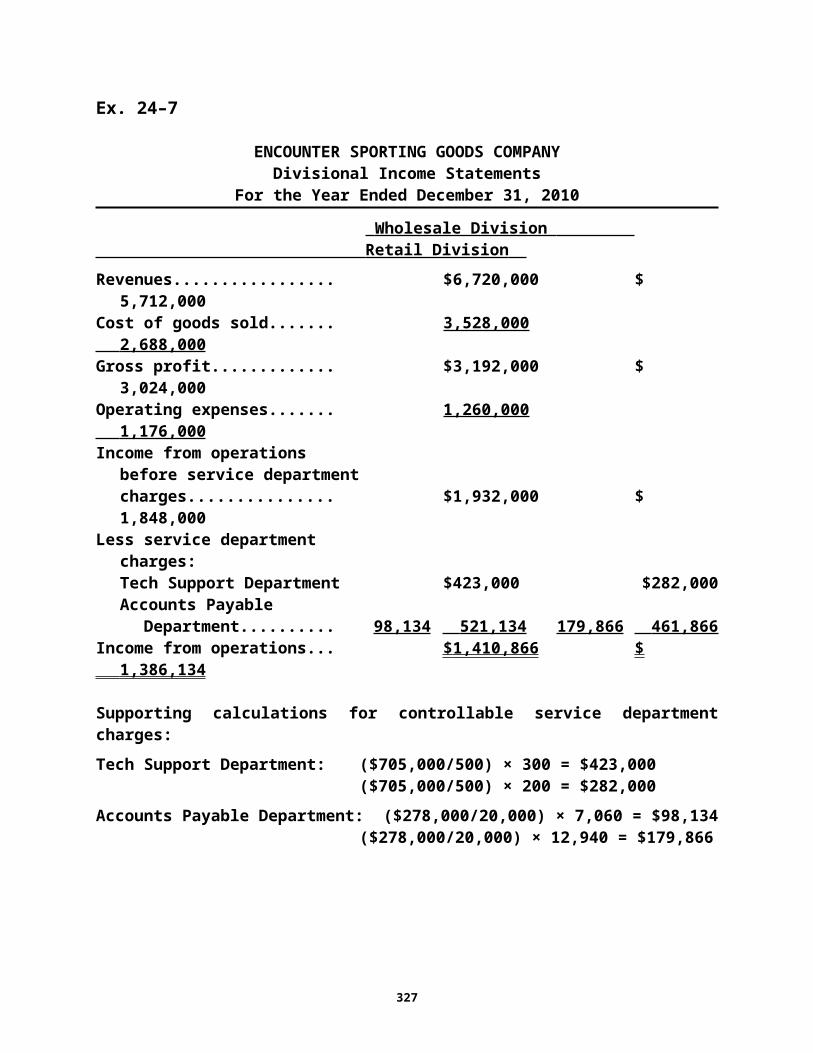
Ex. 24–7
ENCOUNTER SPORTING GOODS COMPANYDivisional Income Statements
For the Year Ended December 31, 2010
Wholesale Division Retail Division Revenues.................................... $ 6,720,000 $ 5,712,000Cost of goods sold.................... 3,528,000 2,688,000 Gross profit................................. $ 3,192,000 $ 3,024,000Operating expenses................... 1,260,000 1,176,000 Income from operations
before service departmentcharges.................................. $ 1,932,000 $ 1,848,000
Less service department charges:Tech Support Department.... $423,000 $282,000Accounts Payable
Department....................... 98,134 521,134 179,866 461,866 Income from operations............ $ 1,410,866 $ 1,386,134
Supporting calculations for controllable service department charges:Tech Support Department: ($705,000/500) × 300 = $423,000
($705,000/500) × 200 = $282,000Accounts Payable Department: ($278,000/20,000) × 7,060 = $98,134
($278,000/20,000) × 12,940 = $179,866
324
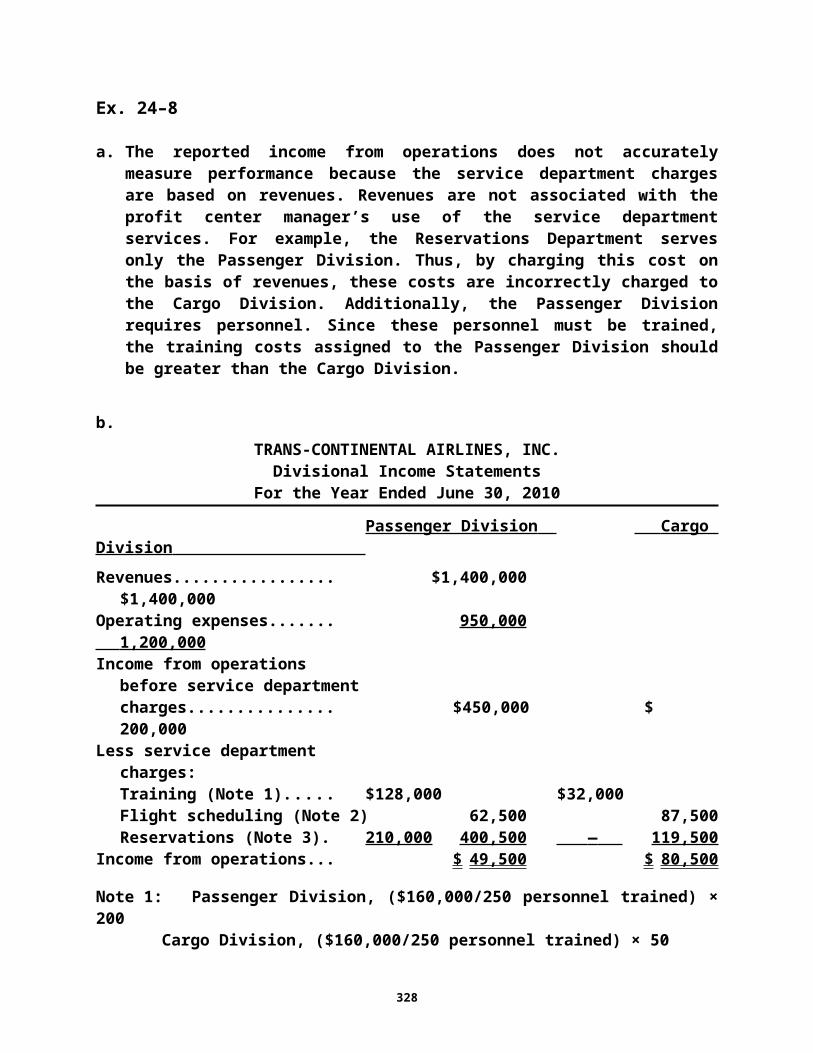
Ex. 24–8
a. The reported income from operations does not accurately measure perfor-mance because the service department charges are based on revenues. Rev-enues are not associated with the profit center manager’s use of the service department services. For example, the Reservations Department serves only the Passenger Division. Thus, by charging this cost on the basis of rev-enues, these costs are incorrectly charged to the Cargo Division. Addition-ally, the Passenger Division requires personnel. Since these personnel must be trained, the training costs assigned to the Passenger Division should be greater than the Cargo Division.
b.TRANS-CONTINENTAL AIRLINES, INC.
Divisional Income StatementsFor the Year Ended June 30, 2010
Passenger Division Cargo Division Revenues.................................... $1,400,000 $1,400,000Operating expenses................... 950,000 1,200,000 Income from operations
before service departmentcharges.................................. $ 450,000 $ 200,000
Less service departmentcharges:Training (Note 1)................... $128,000 $ 32,000Flight scheduling (Note 2). . . 62,500 87,500Reservations (Note 3)........... 210,000 400,500 — 119,500
Income from operations............ $ 49,500 $ 80,500
Note 1: Passenger Division, ($160,000/250 personnel trained) × 200Cargo Division, ($160,000/250 personnel trained) × 50
Note 2: Passenger Division, ($150,000/600 flights) × 250Cargo Division, ($150,000/600 flights) × 350
Note 3: Passenger Division, ($210,000/14,000 reservations) × 14,000Cargo Division, ($210,000/14,000 reservations) × 0
325
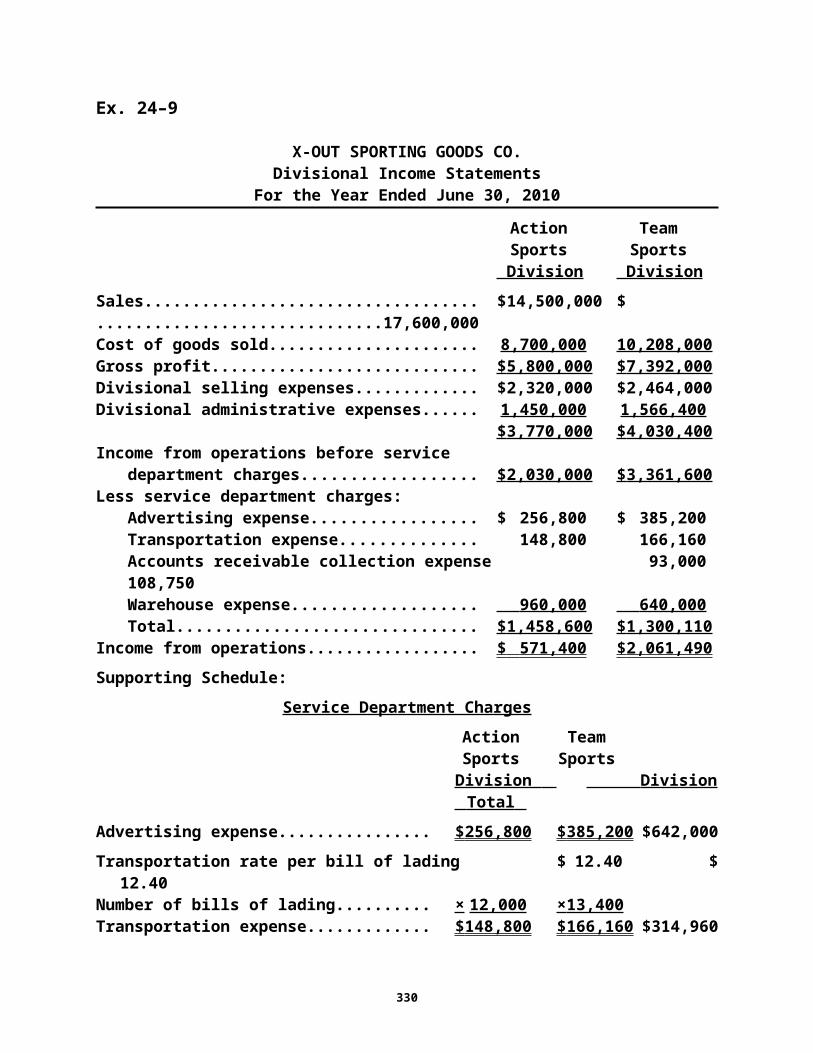
Ex. 24–9
X-OUT SPORTING GOODS CO.Divisional Income Statements
For the Year Ended June 30, 2010
Action TeamSports Sports
Division Division Sales............................................................................ $14,500,000 $17,600,000Cost of goods sold..................................................... 8,700,000 10,208,000 Gross profit................................................................. $ 5,800,000 $ 7,392,000 Divisional selling expenses...................................... $ 2,320,000 $ 2,464,000Divisional administrative expenses.......................... 1,450,000 1,566,400
$ 3,770,000 $ 4,030,400 Income from operations before service
department charges............................................ $ 2,030,000 $ 3,361,600 Less service department charges:
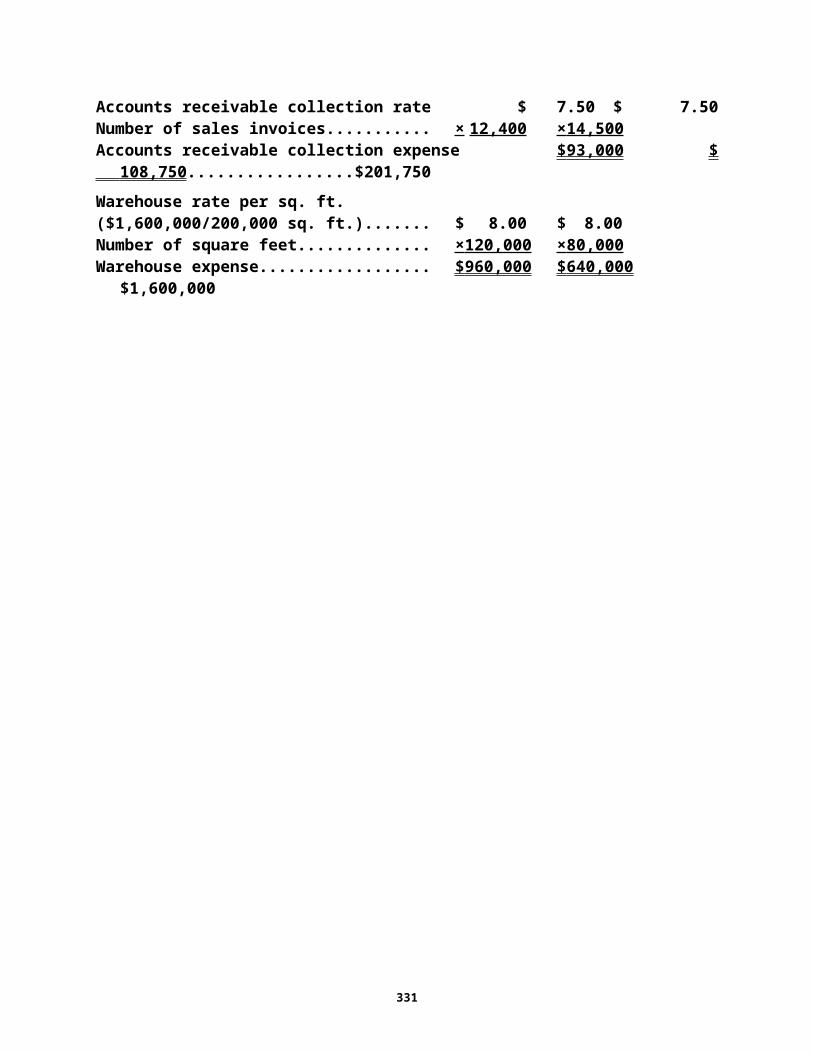
Advertising expense........................................... $ 256,800 $ 385,200Transportation expense..................................... 148,800 166,160Accounts receivable collection expense.......... 93,000 108,750Warehouse expense........................................... 960,000 640,000 Total...................................................................... $ 1,458,600 $ 1,300,110
Income from operations............................................ $ 571,400 $ 2,061,490 Supporting Schedule:
Service Department ChargesAction TeamSports Sports
Division Division Total Advertising expense....................................... $ 256,800 $ 385,200 $642,000Transportation rate per bill of lading............. $ 12.40 $ 12.40Number of bills of lading................................ × 12,000 × 13,400 Transportation expense.................................. $ 148,800 $ 166,160 $314,960Accounts receivable collection rate.............. $ 7.50 $ 7.50Number of sales invoices............................... × 12,400 × 14,500 Accounts receivable collection expense...... $ 93,000 $ 108,750 $201,750Warehouse rate per sq. ft.($1,600,000/200,000 sq. ft.).............................. $ 8.00 $ 8.00Number of square feet.................................... × 120,000 × 80,000 Warehouse expense........................................ $ 960,000 $ 640,000 $1,600,000
326
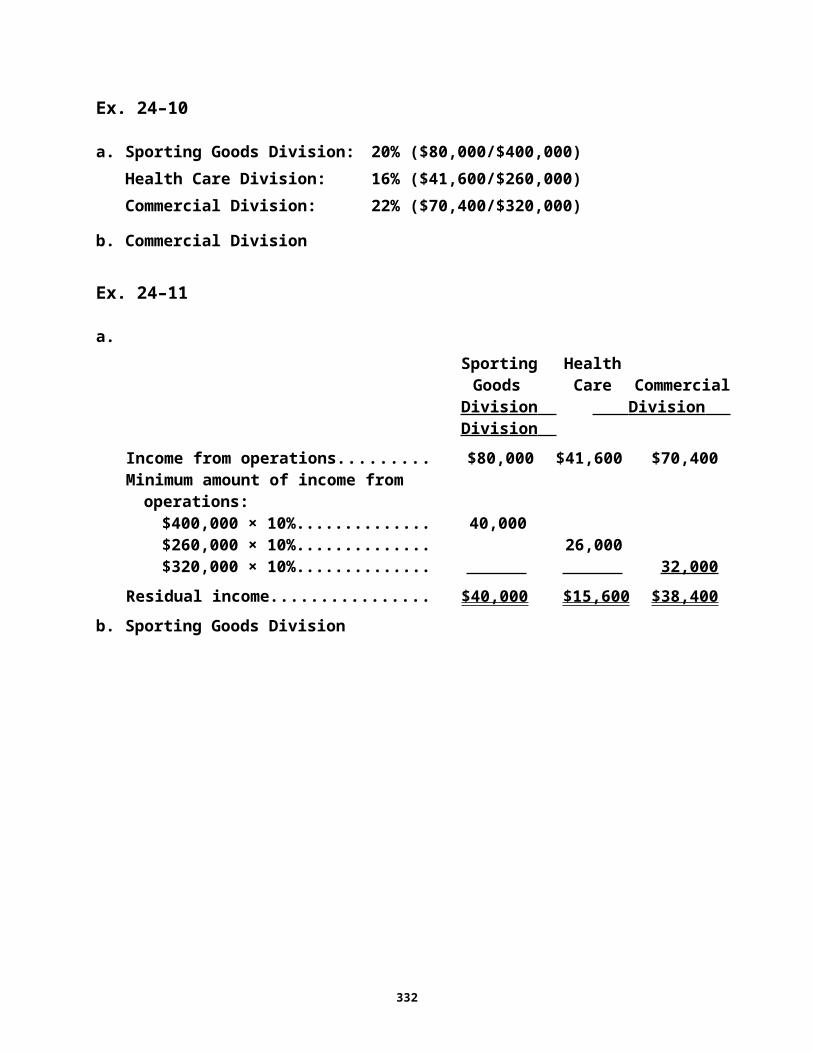
Ex. 24–10
a. Sporting Goods Division: 20% ($80,000/$400,000)Health Care Division: 16% ($41,600/$260,000)Commercial Division: 22% ($70,400/$320,000)
b. Commercial Division
Ex. 24–11
a.Sporting Health
Goods Care Commercial Division Division Division
Income from operations........................... $80,000 $41,600 $70,400Minimum amount of income from
operations:$400,000 × 10%.................................. 40,000$260,000 × 10%.................................. 26,000$320,000 × 10%.................................. 32,000
Residual income....................................... $40,000 $15,600 $38,400b. Sporting Goods Division
327
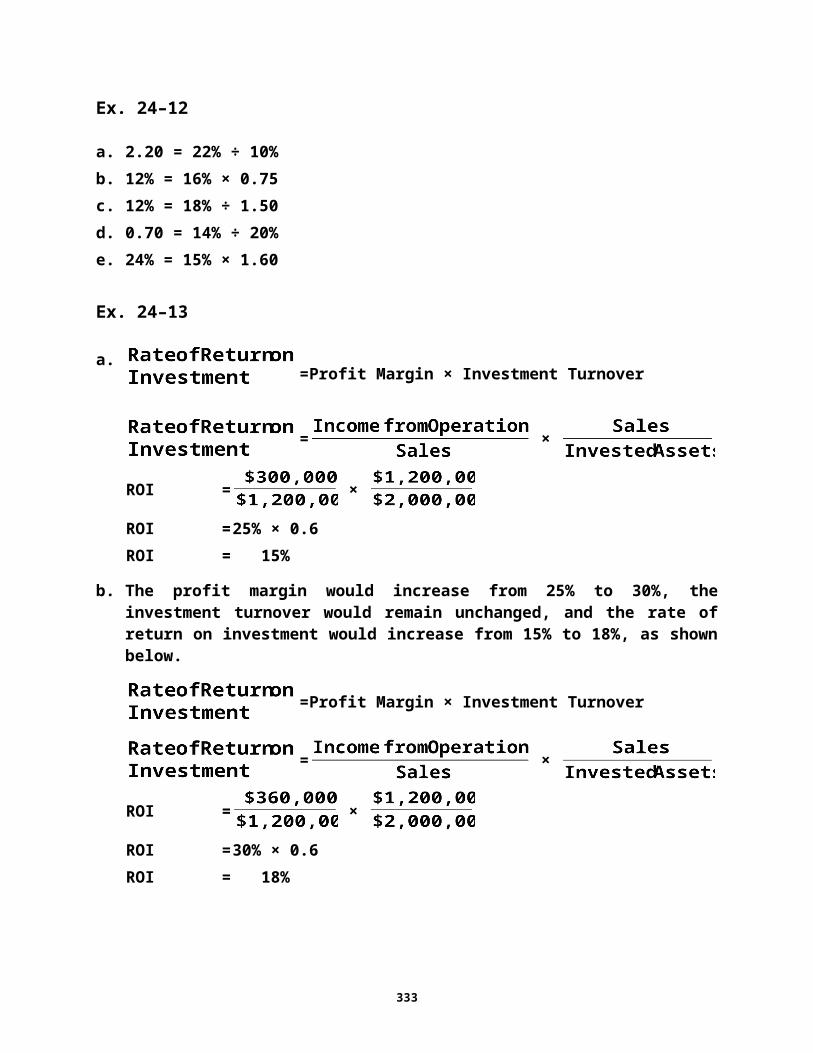
Ex. 24–12
a. 2.20 = 22% ÷ 10%b. 12% = 16% × 0.75c. 12% = 18% ÷ 1.50d. 0.70 = 14% ÷ 20%e. 24% = 15% × 1.60
Ex. 24–13
a.= Profit Margin × Investment Turnover
= ×
ROI = ×
ROI = 25% × 0.6ROI = 15%
b. The profit margin would increase from 25% to 30%, the investment turnover would remain unchanged, and the rate of return on investment would in-crease from 15% to 18%, as shown below.
= Profit Margin × Investment Turnover
= ×
ROI = ×
ROI = 30% × 0.6ROI = 18%
328

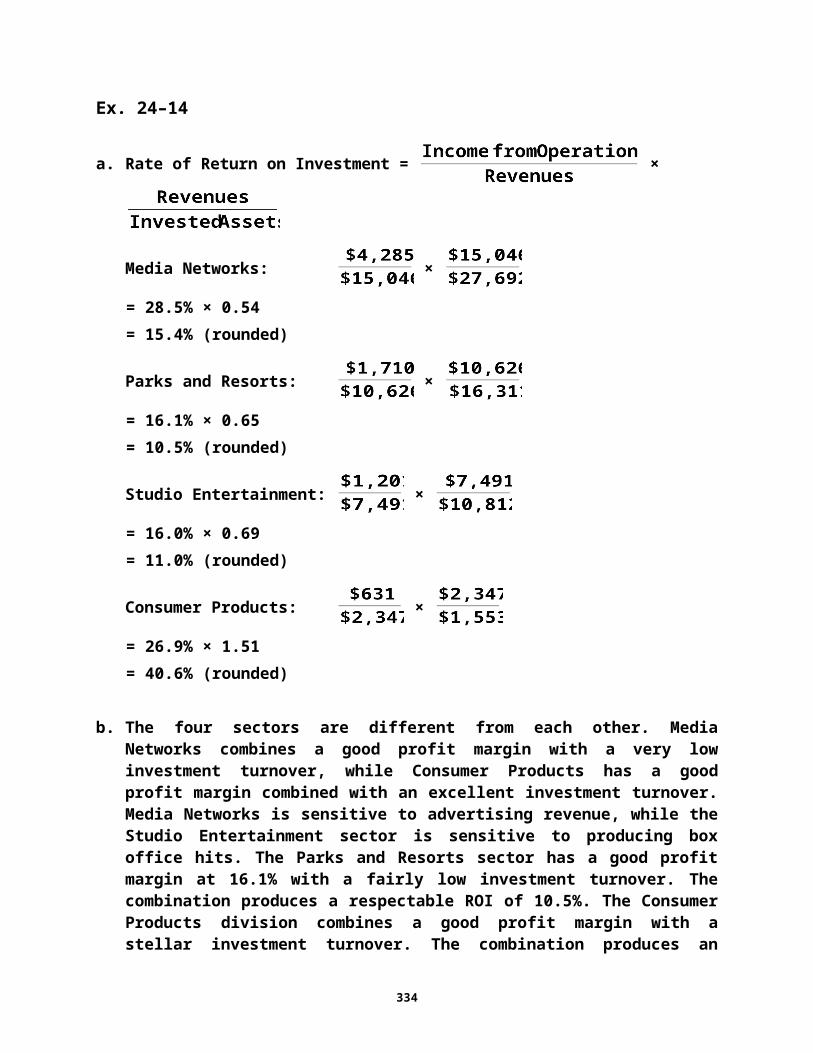
Ex. 24–14
a. Rate of Return on Investment = ×
Media Networks: ×
= 28.5% × 0.54= 15.4% (rounded)
Parks and Resorts: ×
= 16.1% × 0.65= 10.5% (rounded)
Studio Entertainment: ×
= 16.0% × 0.69= 11.0% (rounded)
Consumer Products: ×
= 26.9% × 1.51= 40.6% (rounded)
b. The four sectors are different from each other. Media Networks combines a good profit margin with a very low investment turnover, while Consumer Products has a good profit margin combined with an excellent investment turnover. Media Networks is sensitive to advertising revenue, while the Stu-dio Entertainment sector is sensitive to producing box office hits. The Parks and Resorts sector has a good profit margin at 16.1% with a fairly low invest-ment turnover. The combination produces a respectable ROI of 10.5%. The Consumer Products division combines a good profit margin with a stellar in-vestment turnover. The combination produces an excellent ROI of 40.6%. Much of the consumer product income is produced from licensing the Disney characters and brands, which requires very few assets.
329
Ex. 24–15
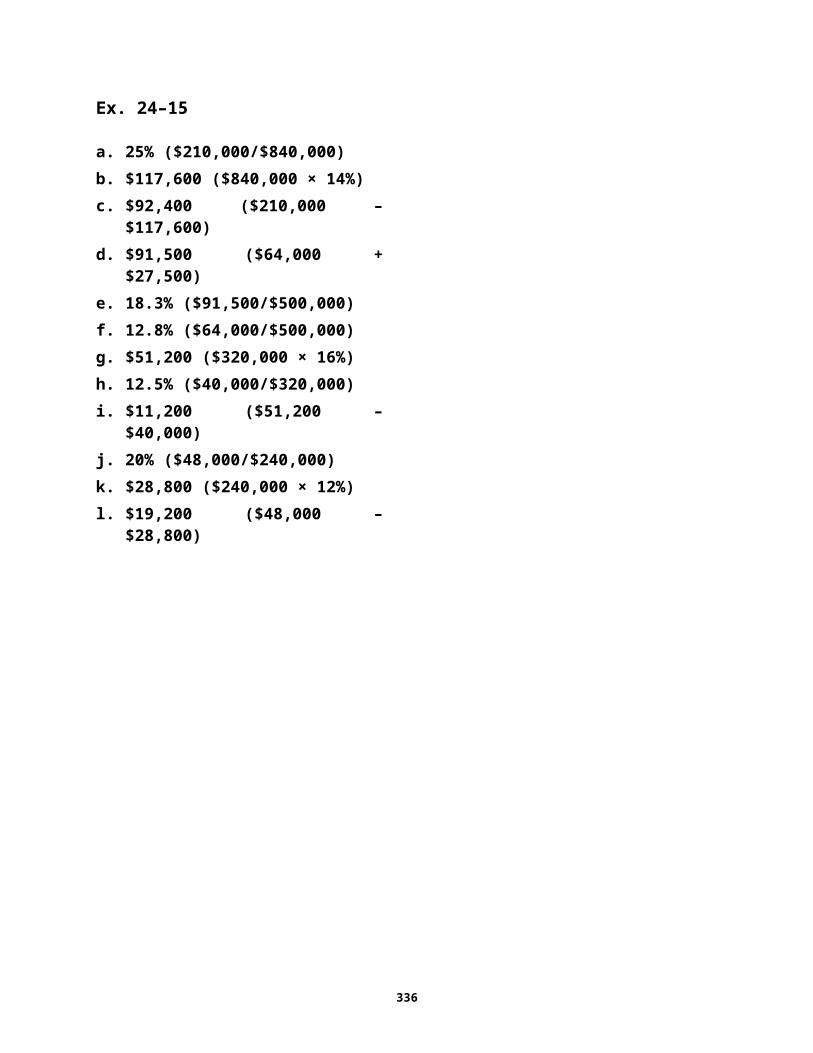
a. 25% ($210,000/$840,000)b. $117,600 ($840,000 × 14%)c. $92,400 ($210,000 – $117,600)d. $91,500 ($64,000 + $27,500)e. 18.3% ($91,500/$500,000)f. 12.8% ($64,000/$500,000)g. $51,200 ($320,000 × 16%)h. 12.5% ($40,000/$320,000)i. $11,200 ($51,200 – $40,000)j. 20% ($48,000/$240,000)k. $28,800 ($240,000 × 12%)l. $19,200 ($48,000 – $28,800)
330
Ex. 24–16
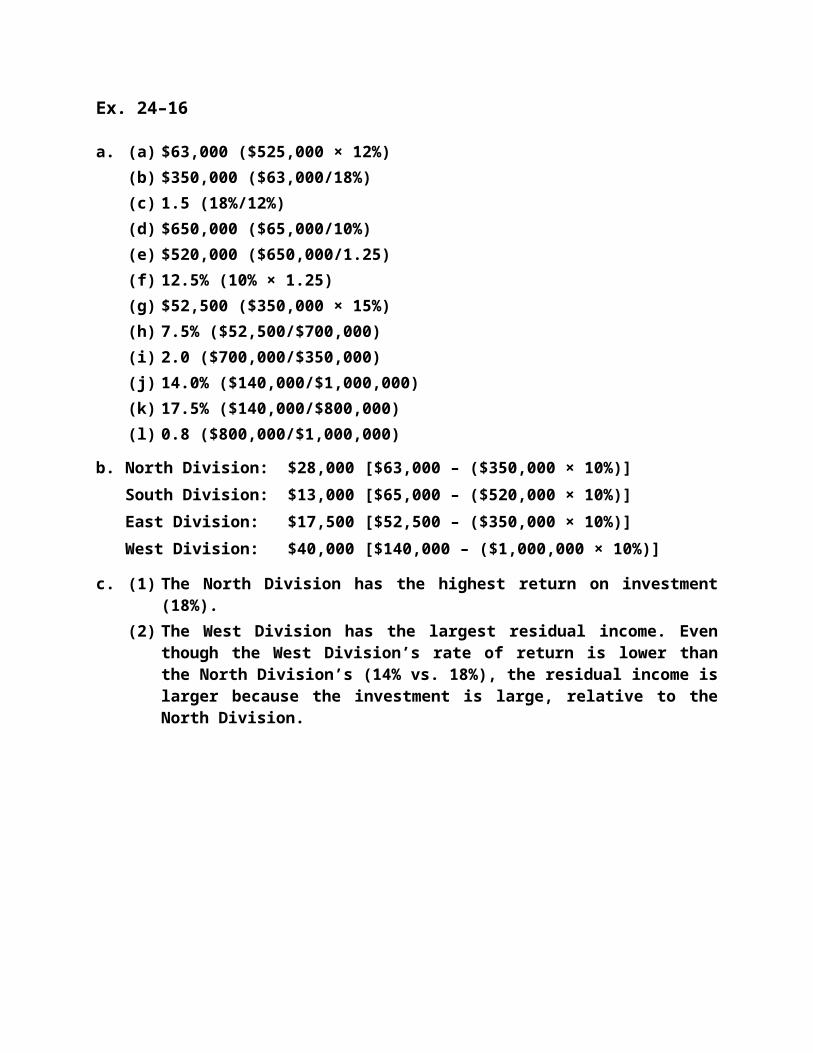
a. (a) $63,000 ($525,000 × 12%)(b) $350,000 ($63,000/18%)(c) 1.5 (18%/12%)(d) $650,000 ($65,000/10%)(e) $520,000 ($650,000/1.25)(f) 12.5% (10% × 1.25)(g) $52,500 ($350,000 × 15%)(h) 7.5% ($52,500/$700,000)(i) 2.0 ($700,000/$350,000)(j) 14.0% ($140,000/$1,000,000)(k) 17.5% ($140,000/$800,000)(l) 0.8 ($800,000/$1,000,000)
b. North Division: $28,000 [$63,000 – ($350,000 × 10%)]South Division: $13,000 [$65,000 – ($520,000 × 10%)]East Division: $17,500 [$52,500 – ($350,000 × 10%)]West Division: $40,000 [$140,000 – ($1,000,000 × 10%)]
c. (1) The North Division has the highest return on investment (18%).(2) The West Division has the largest residual income. Even though the
West Division’s rate of return is lower than the North Division’s (14% vs. 18%), the residual income is larger because the investment is large, rela-tive to the North Division.
Ex. 24–17
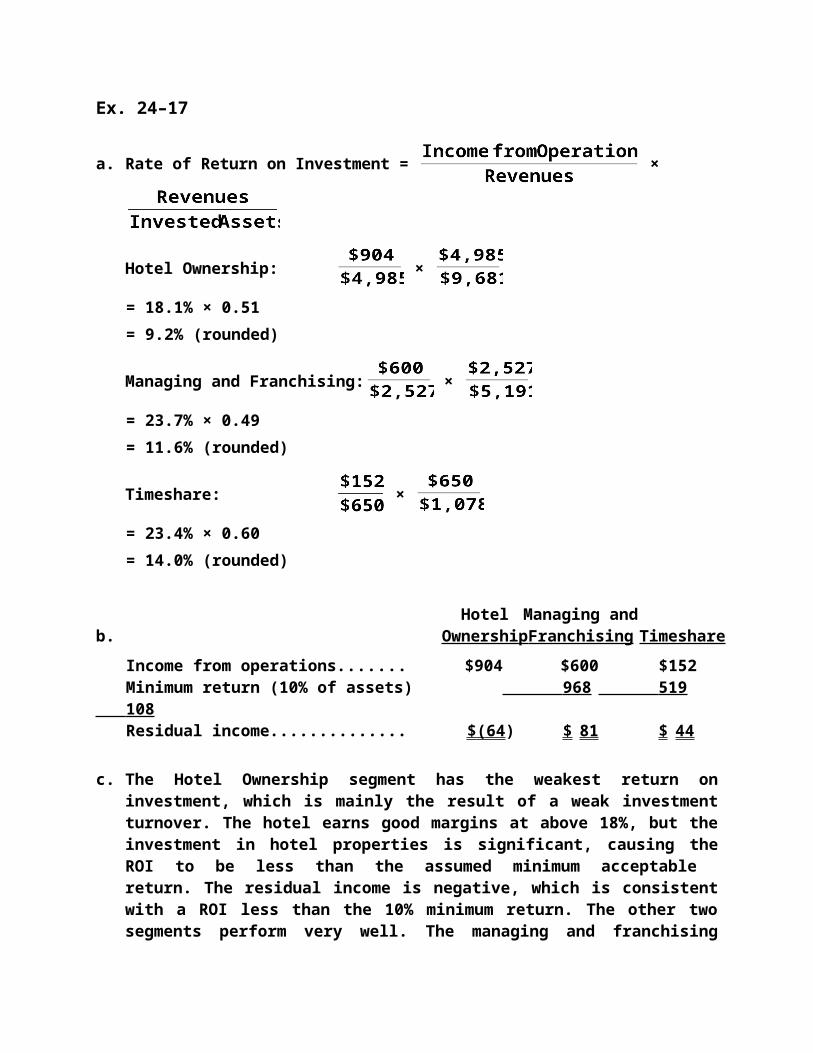
a. Rate of Return on Investment = ×
Hotel Ownership: ×
= 18.1% × 0.51= 9.2% (rounded)
Managing and Franchising: ×
= 23.7% × 0.49= 11.6% (rounded)
Timeshare: ×
= 23.4% × 0.60= 14.0% (rounded)
Hotel Managing andb. Ownership Franchising Timeshare
Income from operations...................... $904 $600 $152Minimum return (10% of assets)........ 968 519 108 Residual income.................................. $ (64 ) $ 81 $ 44
c. The Hotel Ownership segment has the weakest return on investment, which is mainly the result of a weak investment turnover. The hotel earns good mar-gins at above 18%, but the investment in hotel properties is significant, caus-ing the ROI to be less than the assumed minimum acceptable return. The residual income is negative, which is consistent with a ROI less than the 10% minimum return. The other two segments perform very well. The managing and franchising margins are excellent, since managing and franchising hotels is a royalty-based business that has very few associated costs. The asset turnover is low because Hilton is often a joint owner of the franchised or managed hotel. As a result, the ROI for the Managing and Franchising Division is good, and it also has the highest residual income. The Timeshare Division has a slightly stronger asset turnover, since others own the timeshare properties. The division combines the good investment turnover with a very good profit margin. The net result is an excellent ROI of 14%. The residual income for the division is positive, as would be expected for a 14% ROI.
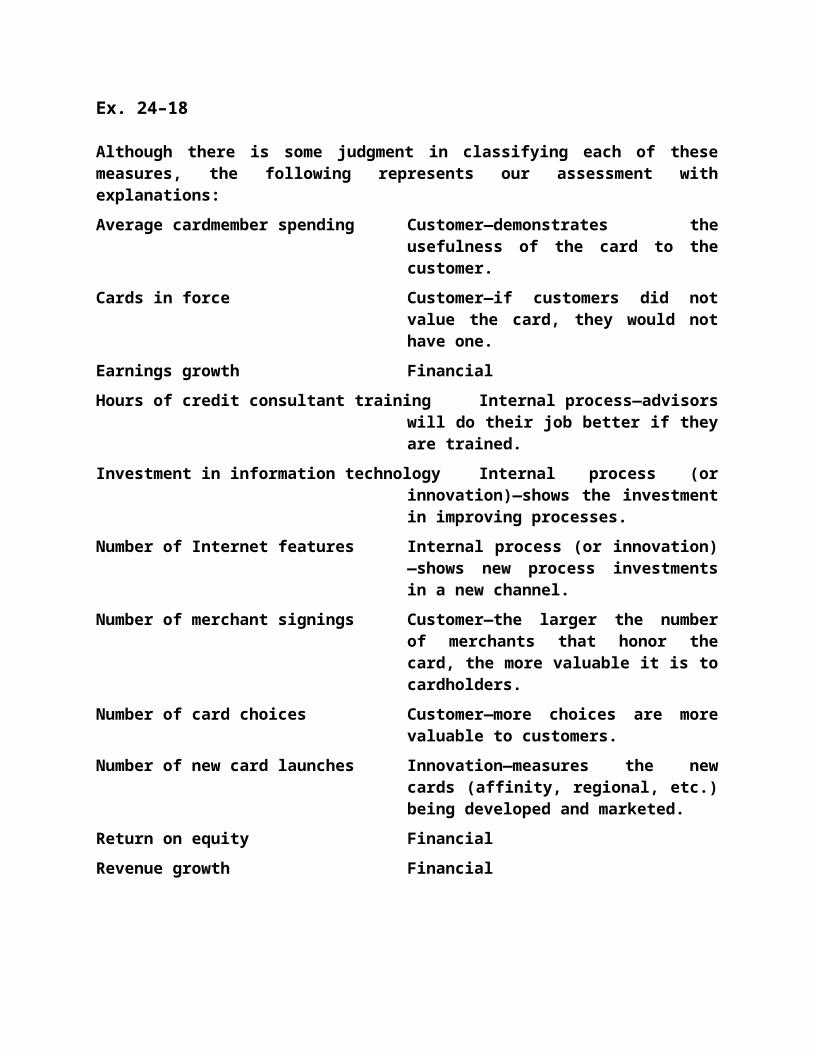
Ex. 24–18
Although there is some judgment in classifying each of these measures, the fol-lowing represents our assessment with explanations:Average cardmember spending Customer—demonstrates the useful-
ness of the card to the customer.Cards in force Customer—if customers did not value
the card, they would not have one.Earnings growth FinancialHours of credit consultant training Internal process—advisors will do their
job better if they are trained.Investment in information technology Internal process (or innovation)—shows
the investment in improving processes.Number of Internet features Internal process (or innovation)—shows
new process investments in a new chan-nel.
Number of merchant signings Customer—the larger the number of merchants that honor the card, the more valuable it is to cardholders.
Number of card choices Customer—more choices are more valu-able to customers.
Number of new card launches Innovation—measures the new cards (affinity, regional, etc.) being developed and marketed.
Return on equity FinancialRevenue growth Financial
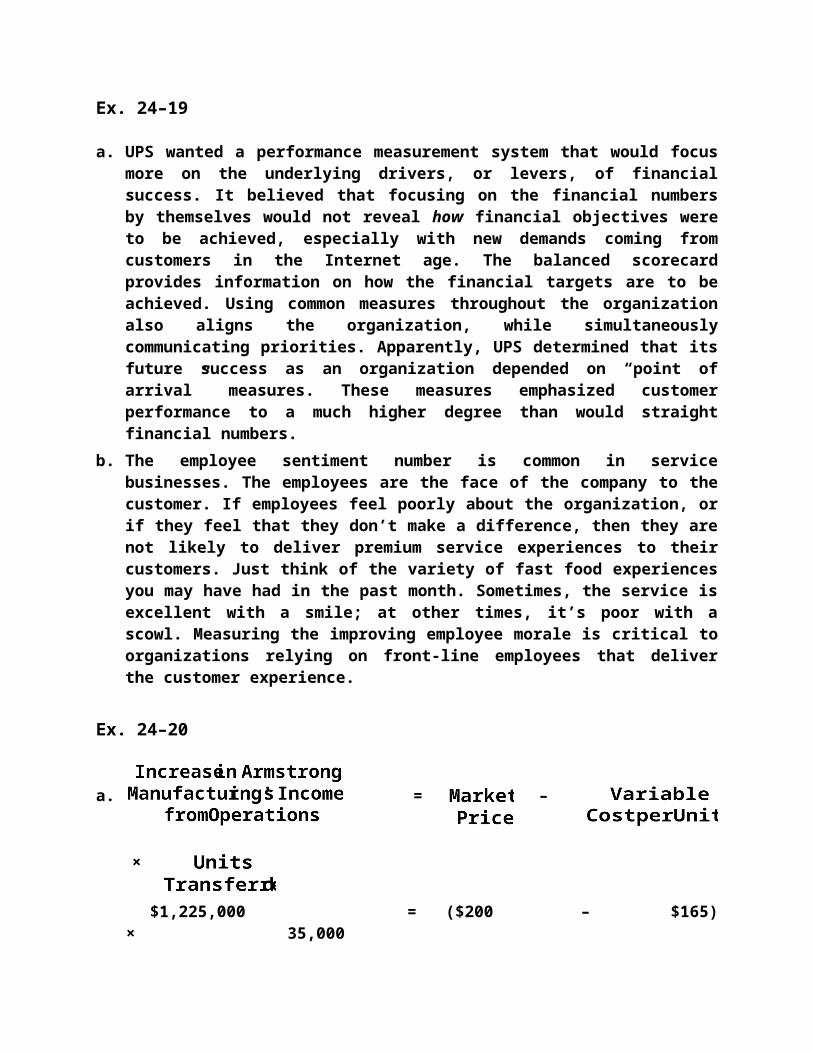
Ex. 24–19
a. UPS wanted a performance measurement system that would focus more on the underlying drivers, or levers, of financial success. It believed that focus-ing on the financial numbers by themselves would not reveal how financial objectives were to be achieved, especially with new demands coming from customers in the Internet age. The balanced scorecard provides information on how the financial targets are to be achieved. Using common measures throughout the organization also aligns the organization, while simultane-ously communicating priorities. Apparently, UPS determined that its future success as an organization depended on “point of arrival” measures. These measures emphasized customer performance to a much higher degree than would straight financial numbers.
b. The employee sentiment number is common in service businesses. The em-ployees are the face of the company to the customer. If employees feel poorly about the organization, or if they feel that they don’t make a differ-ence, then they are not likely to deliver premium service experiences to their customers. Just think of the variety of fast food experiences you may have had in the past month. Sometimes, the service is excellent with a smile; at other times, it’s poor with a scowl. Measuring the improving employee morale is critical to organizations relying on front-line employees that deliver the customer experience.
Ex. 24–20
a. = – ×
$1,225,000 = ($200 – $165) × 35,000
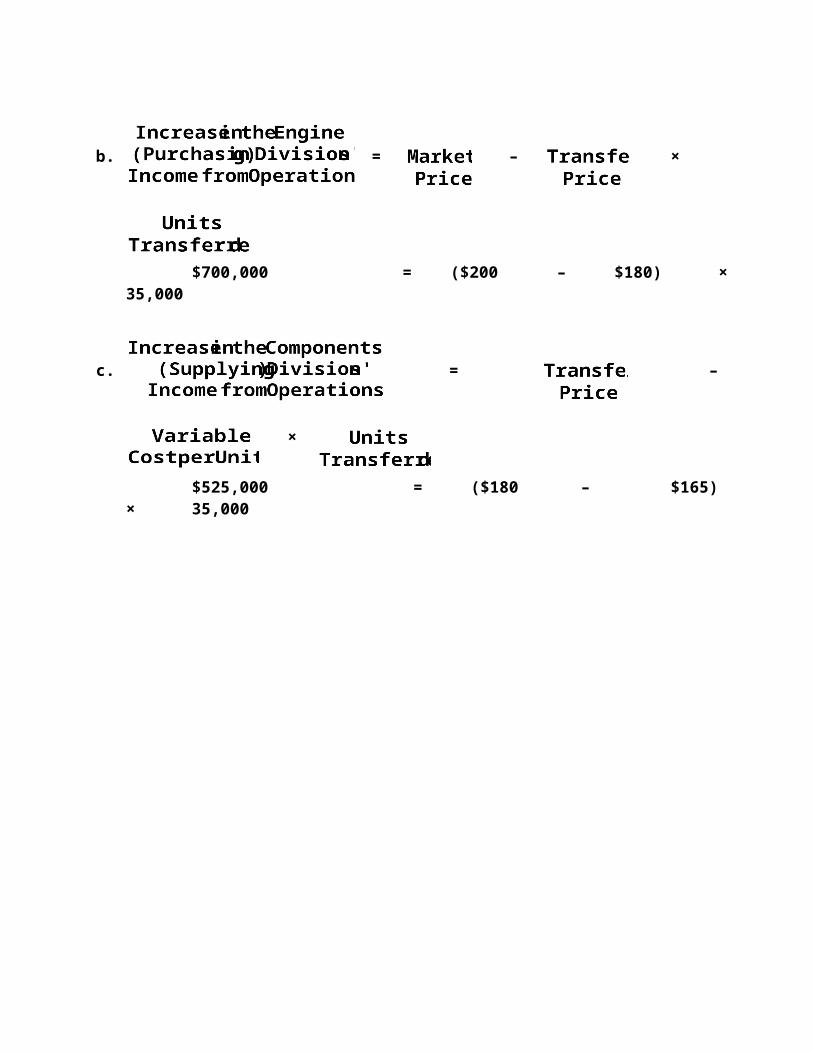
b. = – ×
$700,000 = ($200 – $180) × 35,000
c. = – ×
$525,000 = ($180 – $165) × 35,000

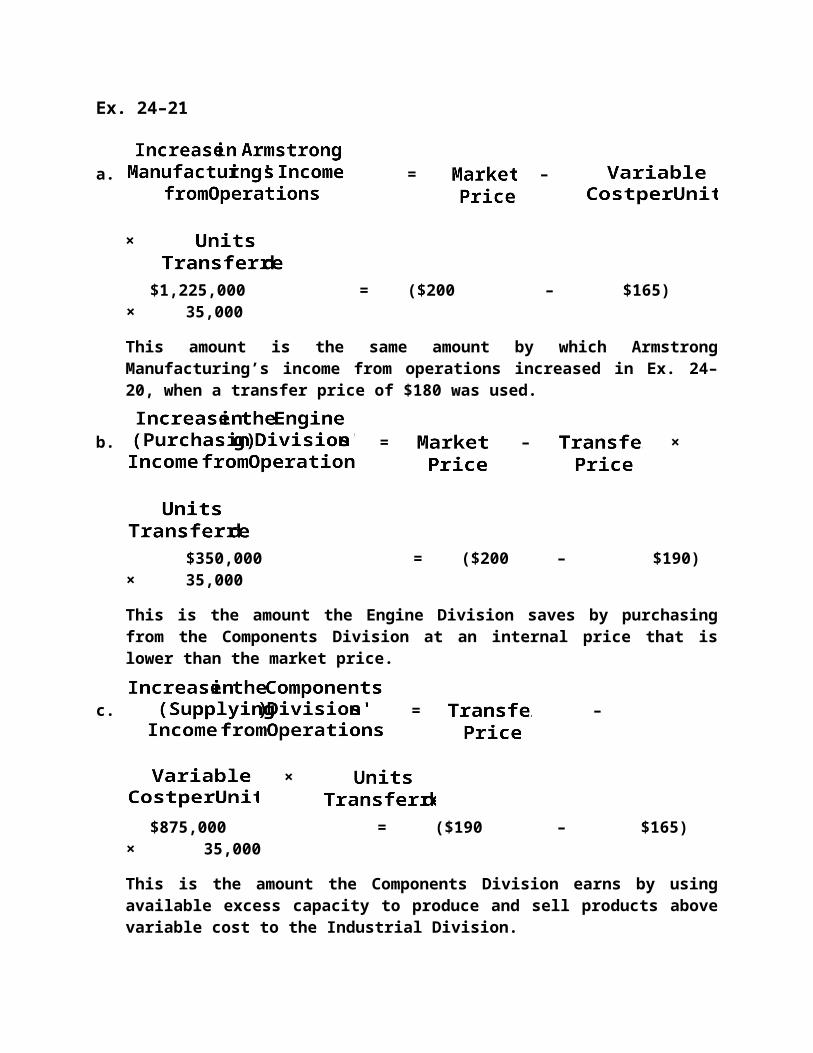
Ex. 24–21
a. = – ×
$1,225,000 = ($200 – $165) × 35,000
This amount is the same amount by which Armstrong Manufacturing’s in-come from operations increased in Ex. 24–20, when a transfer price of $180 was used.
b. = – ×
$350,000 = ($200 – $190) × 35,000
This is the amount the Engine Division saves by purchasing from the Com-ponents Division at an internal price that is lower than the market price.
c. = – ×
$875,000 = ($190 – $165) × 35,000
This is the amount the Components Division earns by using available excess capacity to produce and sell products above variable cost to the Industrial Division.
d. Any transfer price will cause the total income of the company to increase, as long as the supplier division capacity is used toward making materials for products that are ultimately sold to the outside. However, transfer prices should be set between variable cost and selling price in order to give the di -vision managers proper incentives. A transfer price set below variable cost would cause the supplier division to incur a loss, while a transfer price set above market price would cause the purchasing division to incur opportunity costs. Neither situation is an attractive alternative for an investment center manager. Thus, the general rule is to negotiate transfer prices between vari-able cost and selling price when the supplier division has excess capacity. The range of acceptable transfer prices for Armstrong Manufacturing would be between $165 and $200.
PROBLEMS
Prob. 24–1A
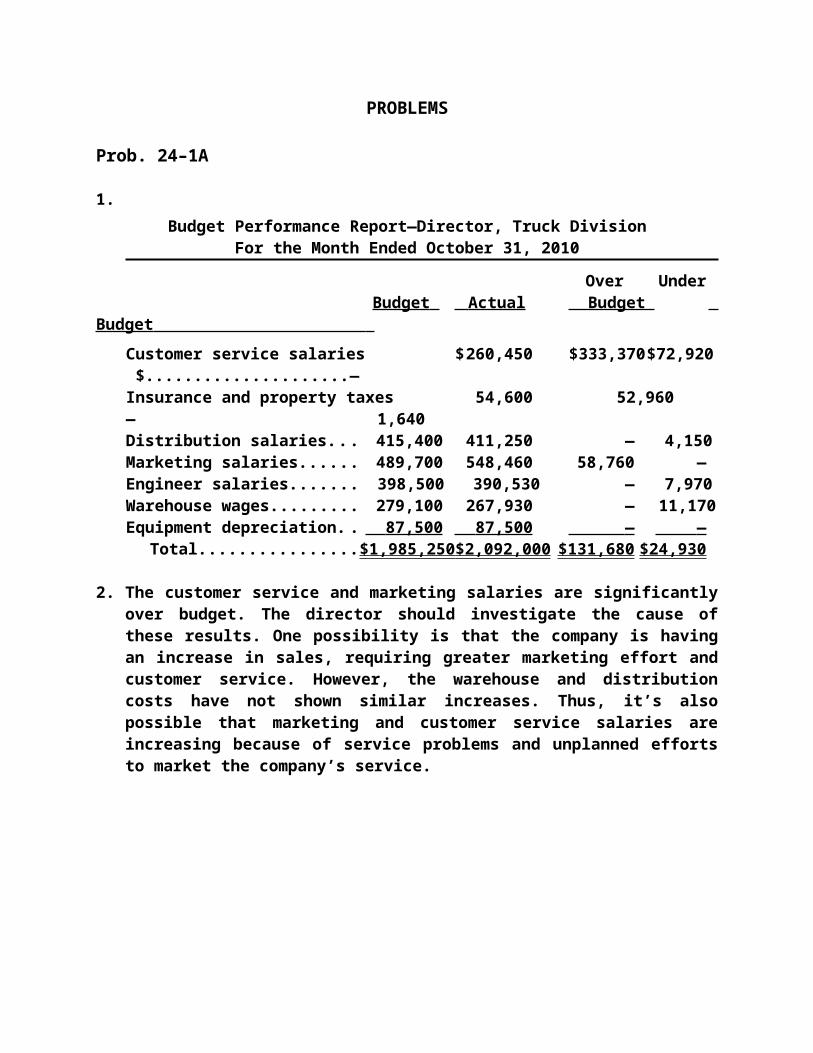
1.Budget Performance Report—Director, Truck Division
For the Month Ended October 31, 2010
Over Under Budget Actual Budget Budget
Customer service salaries....... $ 260,450 $ 333,370 $ 72,920 $ —Insurance and property taxes 54,600 52,960 — 1,640Distribution salaries................. 415,400 411,250 — 4,150Marketing salaries.................... 489,700 548,460 58,760 —Engineer salaries...................... 398,500 390,530 — 7,970Warehouse wages.................... 279,100 267,930 — 11,170Equipment depreciation........... 87,500 87,500 — —
Total...................................... $1,985,250 $2,092,000 $131,680 $24,930
2. The customer service and marketing salaries are significantly over budget. The director should investigate the cause of these results. One possibility is that the company is having an increase in sales, requiring greater marketing effort and customer service. However, the warehouse and distribution costs have not shown similar increases. Thus, it’s also possible that marketing and customer service salaries are increasing because of service problems and unplanned efforts to market the company’s service.
Prob. 24–2A1.
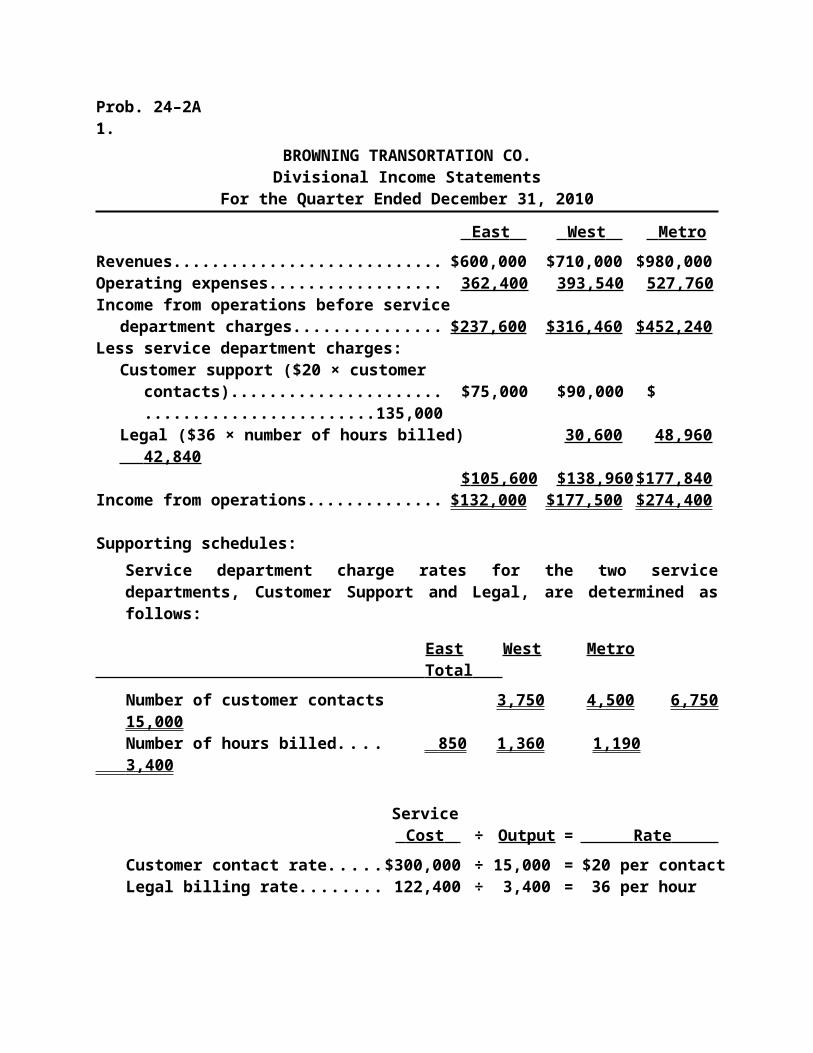
BROWNING TRANSORTATION CO.Divisional Income Statements
For the Quarter Ended December 31, 2010
East West Metro Revenues............................................................ $600,000 $710,000 $980,000Operating expenses........................................... 362,400 393,540 527,760 Income from operations before service
department charges...................................... $237,600 $316,460 $452,240Less service department charges:
Customer support ($20 × customer contacts)................................................... $ 75,000 $ 90,000 $135,000
Legal ($36 × number of hours billed).......... 30,600 48,960 42,840 $ 105,600 $ 138,960 $177,840
Income from operations.................................... $132,000 $177,500 $274,400
Supporting schedules:Service department charge rates for the two service departments, Customer Support and Legal, are determined as follows:
East West Metro Total Number of customer contacts...... 3,750 4,500 6,750 15,000Number of hours billed.................. 850 1,360 1,190 3,400
Service Cost ÷ Output = Rate
Customer contact rate................... $300,000 ÷ 15,000 = $20 per contactLegal billing rate............................. 122,400 ÷ 3,400 = 36 per hour
Note: The Shareholder Relations Department and general corporate officers’ salaries are not controllable by division management and thus are not included in determining division income from operations.
Prob. 24–2A Concluded
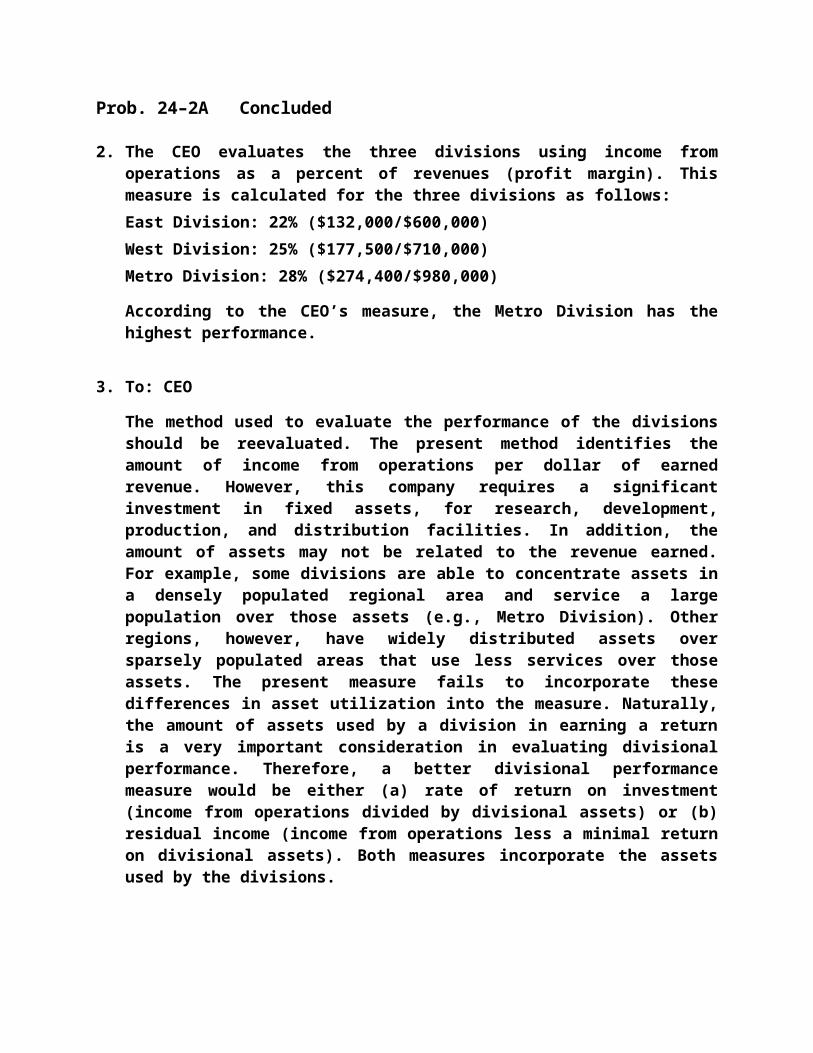
2. The CEO evaluates the three divisions using income from operations as a percent of revenues (profit margin). This measure is calculated for the three divisions as follows:East Division: 22% ($132,000/$600,000)West Division: 25% ($177,500/$710,000)Metro Division: 28% ($274,400/$980,000)
According to the CEO’s measure, the Metro Division has the highest perfor-mance.
3. To: CEO
The method used to evaluate the performance of the divisions should be reevaluated. The present method identifies the amount of income from opera-tions per dollar of earned revenue. However, this company requires a signifi -cant investment in fixed assets, for research, development, production, and distribution facilities. In addition, the amount of assets may not be related to the revenue earned. For example, some divisions are able to concentrate as-sets in a densely populated regional area and service a large population over those assets (e.g., Metro Division). Other regions, however, have widely dis-tributed assets over sparsely populated areas that use less services over those assets. The present measure fails to incorporate these differences in asset utilization into the measure. Naturally, the amount of assets used by a division in earning a return is a very important consideration in evaluating di-visional performance. Therefore, a better divisional performance measure would be either (a) rate of return on investment (income from operations di -vided by divisional assets) or (b) residual income (income from operations less a minimal return on divisional assets). Both measures incorporate the assets used by the divisions.
Prob. 24–3A
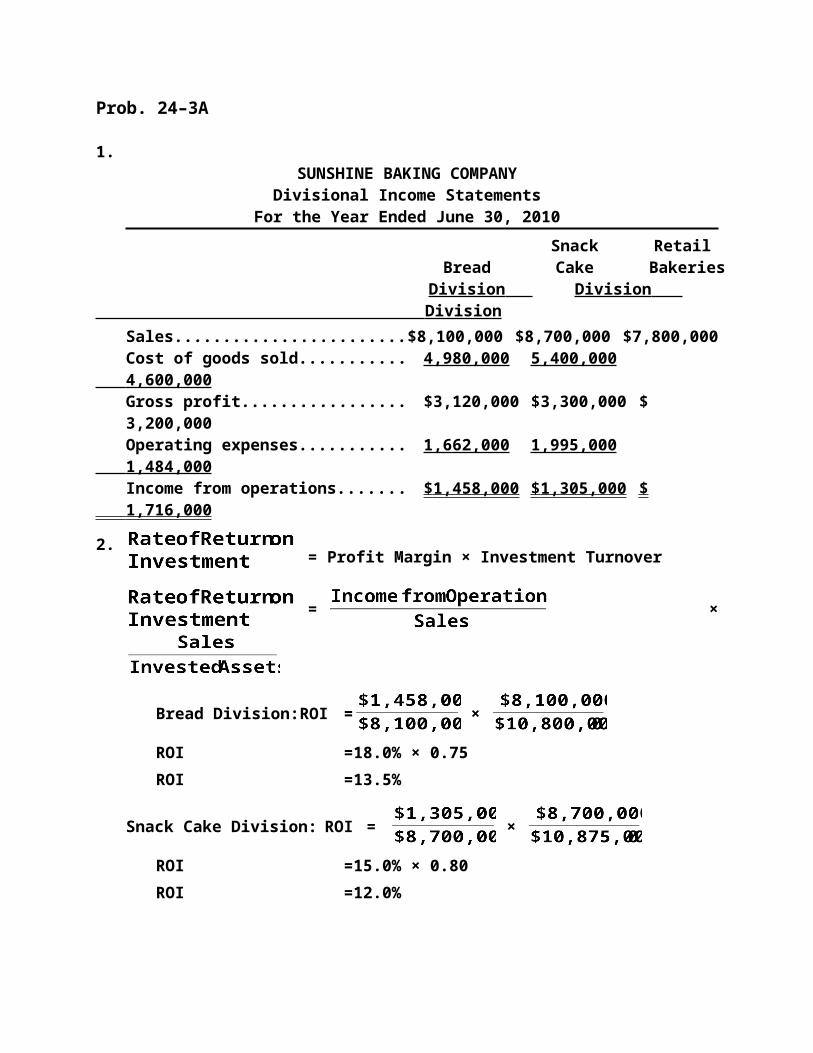
1.SUNSHINE BAKING COMPANYDivisional Income Statements
For the Year Ended June 30, 2010Snack Retail
Bread Cake Bakeries Division Division Division
Sales..................................................... $8,100,000 $8,700,000 $7,800,000Cost of goods sold.............................. 4,980,000 5,400,000 4,600,000 Gross profit.......................................... $3,120,000 $3,300,000 $3,200,000Operating expenses............................ 1,662,000 1,995,000 1,484,000 Income from operations...................... $ 1,458,000 $ 1,305,000 $
1,716,000
2. = Profit Margin × Investment Turnover
= ×
Bread Division: ROI = ×
ROI =18.0% × 0.75ROI =13.5%
Snack Cake Division:ROI = ×
ROI =15.0% × 0.80ROI =12.0%
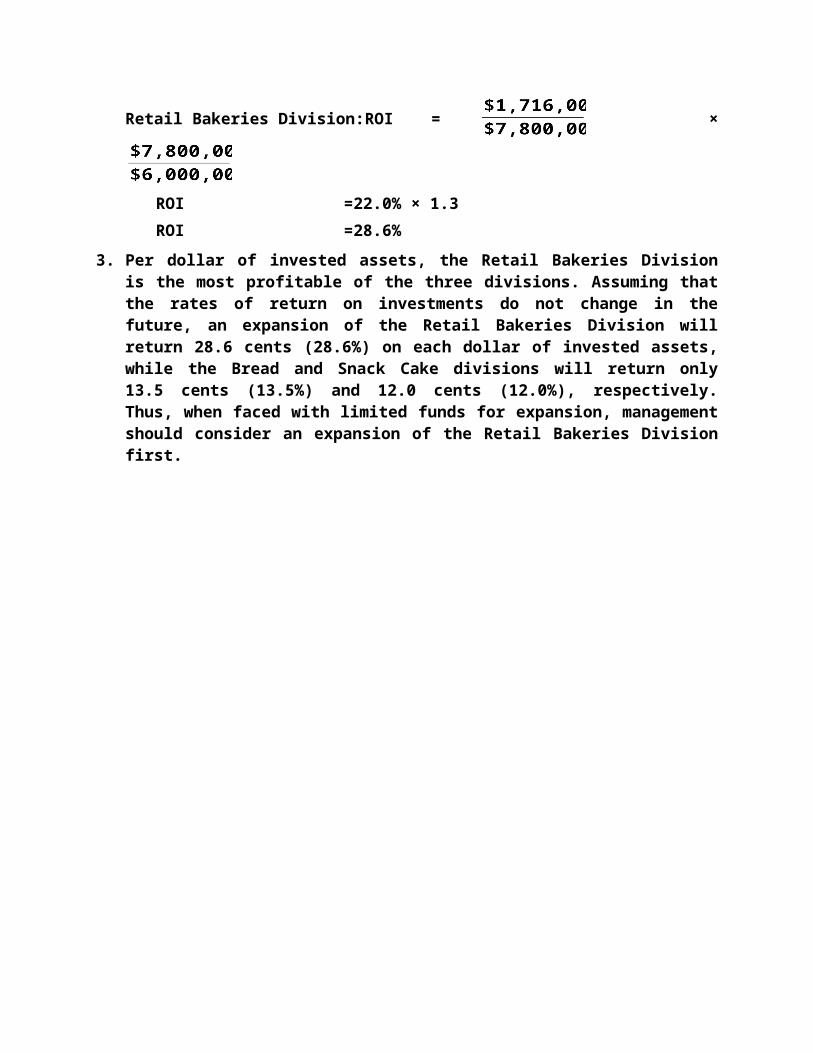
Retail Bakeries Division: ROI = ×
ROI =22.0% × 1.3ROI =28.6%
3. Per dollar of invested assets, the Retail Bakeries Division is the most prof-itable of the three divisions. Assuming that the rates of return on invest-ments do not change in the future, an expansion of the Retail Bakeries Divi-sion will return 28.6 cents (28.6%) on each dollar of invested assets, while the Bread and Snack Cake divisions will return only 13.5 cents (13.5%) and 12.0 cents (12.0%), respectively. Thus, when faced with limited funds for expan-sion, management should consider an expansion of the Retail Bakeries Divi -sion first.
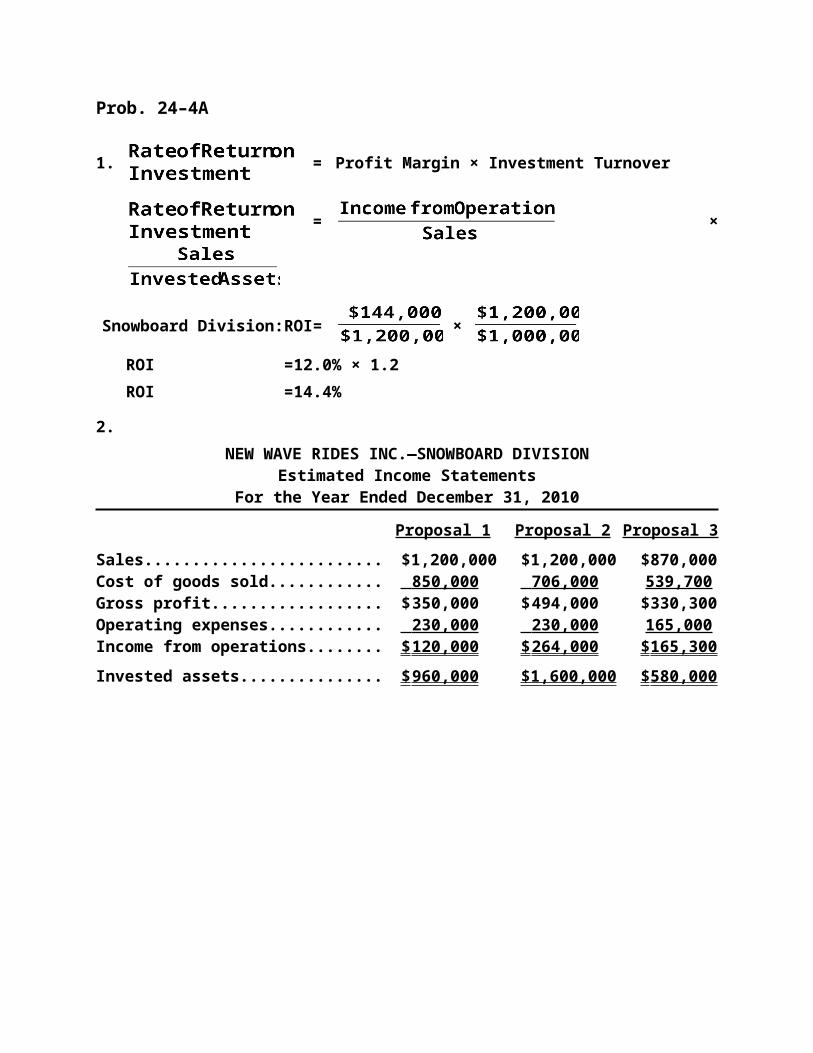
Prob. 24–4A
1. =Profit Margin × Investment Turnover
= ×
Snowboard Division: ROI = ×
ROI =12.0% × 1.2ROI =14.4%
2.NEW WAVE RIDES INC.—SNOWBOARD DIVISION
Estimated Income StatementsFor the Year Ended December 31, 2010
Proposal 1 Proposal 2 Proposal 3Sales....................................................... $1,200,000 $1,200,000 $ 870,000Cost of goods sold............................... 850,000 706,000 539,700 Gross profit........................................... $ 350,000 $ 494,000 $ 330,300Operating expenses............................. 230,000 230,000 165,000 Income from operations....................... $ 120,000 $ 264,000 $ 165,300 Invested assets..................................... $ 960,000 $1,600,000 $ 580,000
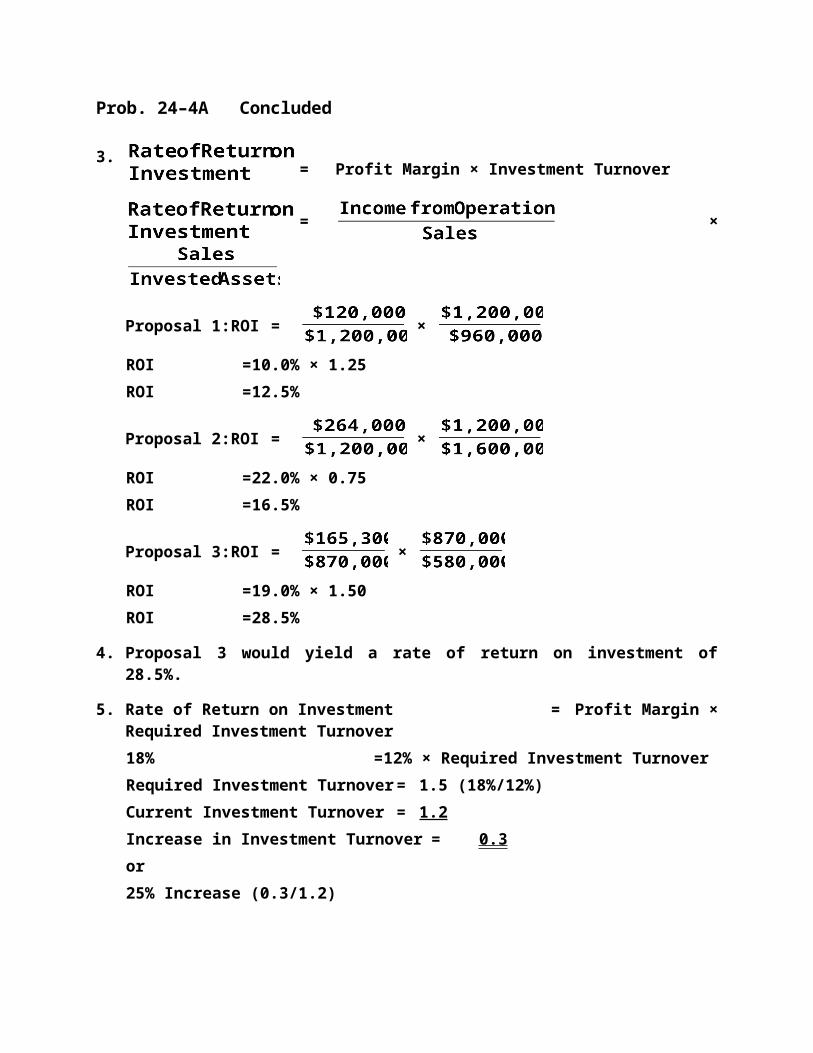
Prob. 24–4A Concluded
3. =Profit Margin × Investment Turnover
= ×
Proposal 1: ROI = ×
ROI =10.0% × 1.25ROI =12.5%
Proposal 2: ROI = ×
ROI =22.0% × 0.75ROI =16.5%
Proposal 3: ROI = ×
ROI =19.0% × 1.50ROI =28.5%
4. Proposal 3 would yield a rate of return on investment of 28.5%.
5. Rate of Return on Investment = Profit Margin × Required Investment Turnover
18% =12% × Required Investment TurnoverRequired Investment Turnover =1.5 (18%/12%)Current Investment Turnover = 1.2Increase in Investment Turnover= 0.3or25% Increase (0.3/1.2)
Prob. 24–5A
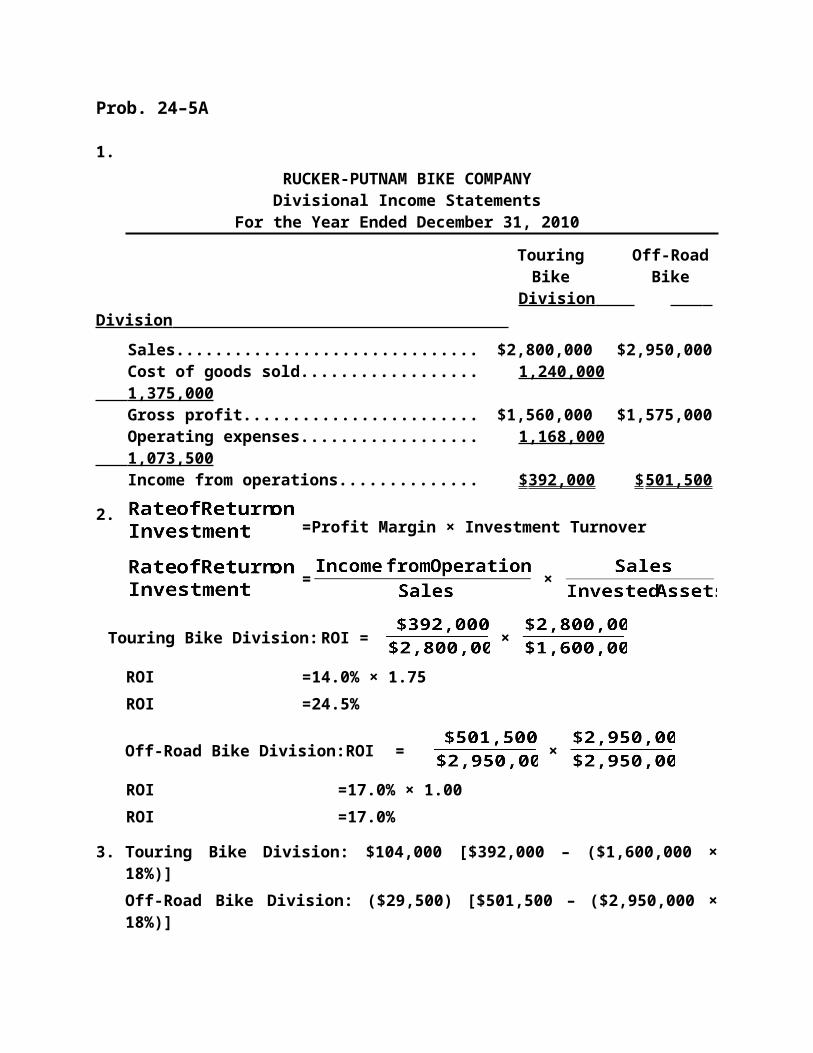
1.RUCKER-PUTNAM BIKE COMPANY
Divisional Income StatementsFor the Year Ended December 31, 2010
Touring Off-RoadBike Bike
Division Division Sales..................................................................... $2,800,000 $2,950,000Cost of goods sold.............................................. 1,240,000 1,375,000 Gross profit.......................................................... $1,560,000 $1,575,000Operating expenses............................................ 1,168,000 1,073,500 Income from operations..................................... $ 392,000 $ 501,500
2. =Profit Margin × Investment Turnover
= ×
Touring Bike Division: ROI = ×
ROI =14.0% × 1.75ROI =24.5%
Off-Road Bike Division: ROI = ×
ROI =17.0% × 1.00ROI =17.0%
3. Touring Bike Division: $104,000 [$392,000 – ($1,600,000 × 18%)]Off-Road Bike Division: ($29,500) [$501,500 – ($2,950,000 × 18%)]
Prob. 24–5A Concluded
4. On the basis of income from operations, the Off-Road Bike Division gener-ated $109,500 more income from operations than did the Touring Bike Divi-sion. However, income from operations does not consider the amount of in-vested assets in each division. On the basis of the rate of return on invest-ment, the Touring Bike Division earned 24.5 cents (24.5%) on each dollar of invested assets, while the Off-Road Bike Division earned only 17.0 cents (17.0%) on each dollar. Although the profit margin of the Off-Road Bike Divi-sion exceeds the Touring Bike Division (17.0% vs. 14.0%), the investment turnover in the Off-Road Bike Division is much less than the Touring Bike Di-vision (1.00 vs. 1.75). The combination of these factors caused the Touring Bike Division to have a higher return on investment than did the Off-Road Bike Division. Residual income can be viewed as a combination of the pre-ceding two performance measures. Residual income considers the absolute dollar amount of income from operations generated by each division and also considers a minimum rate of return to be earned by each division. On the basis of residual income, the Touring Bike Division is the more profitable of the two divisions.
Prob. 24–6A
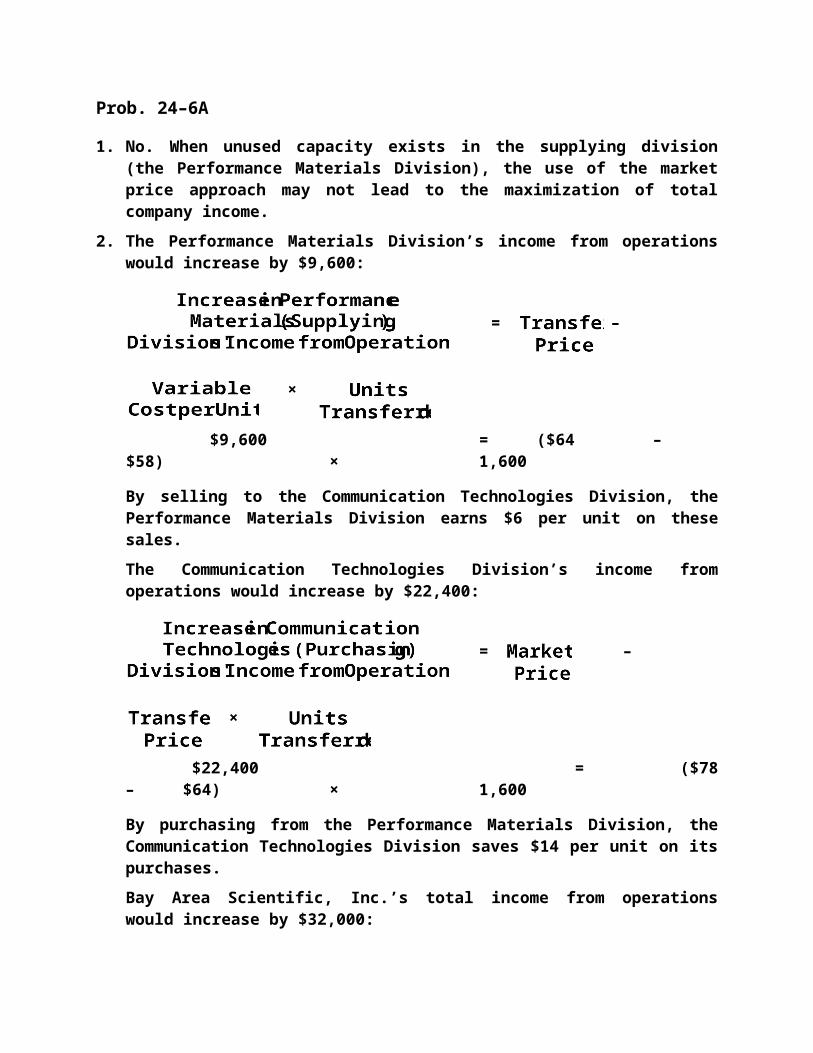
1. No. When unused capacity exists in the supplying division (the Performance Materials Division), the use of the market price approach may not lead to the maximization of total company income.
2. The Performance Materials Division’s income from operations would in-crease by $9,600:
= – ×
$9,600 = ($64 – $58) × 1,600
By selling to the Communication Technologies Division, the Performance Ma-terials Division earns $6 per unit on these sales.The Communication Technologies Division’s income from operations would increase by $22,400:
= – ×
$22,400 = ($78 – $64) × 1,600
By purchasing from the Performance Materials Division, the Communication Technologies Division saves $14 per unit on its purchases.Bay Area Scientific, Inc.’s total income from operations would increase by $32,000:
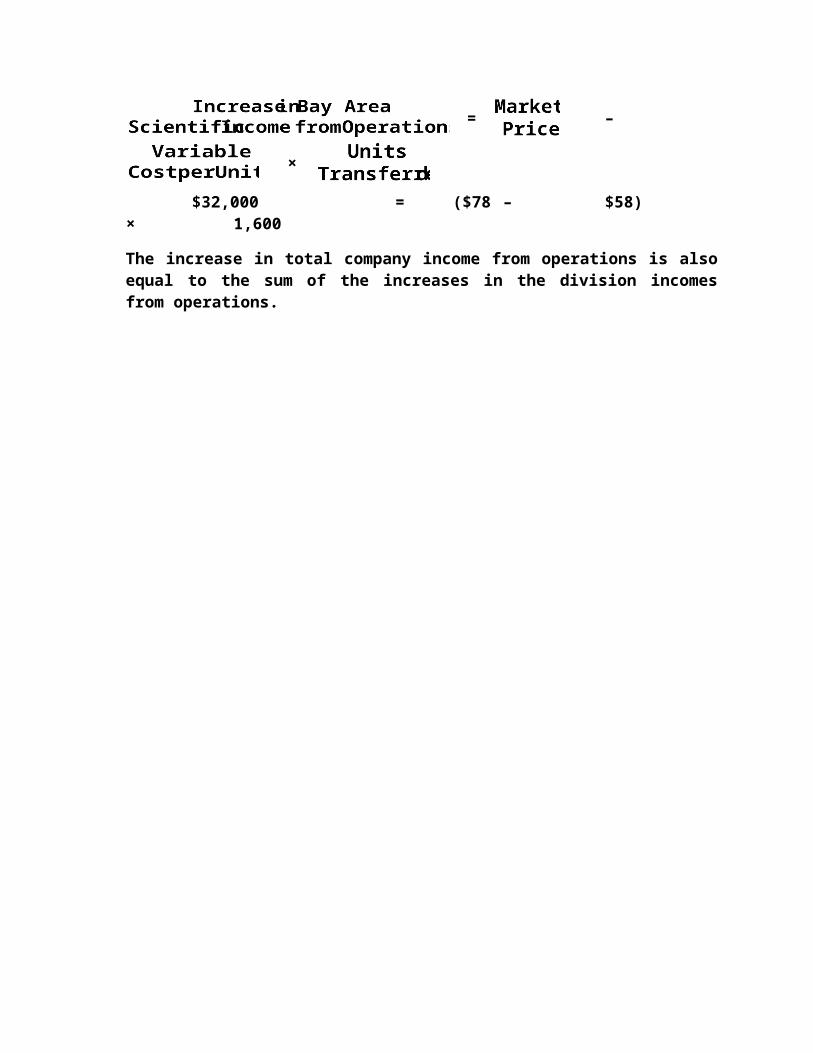
= – ×
$32,000 = ($78 – $58) × 1,600
The increase in total company income from operations is also equal to the sum of the increases in the division incomes from operations.
Prob. 24–6A Continued
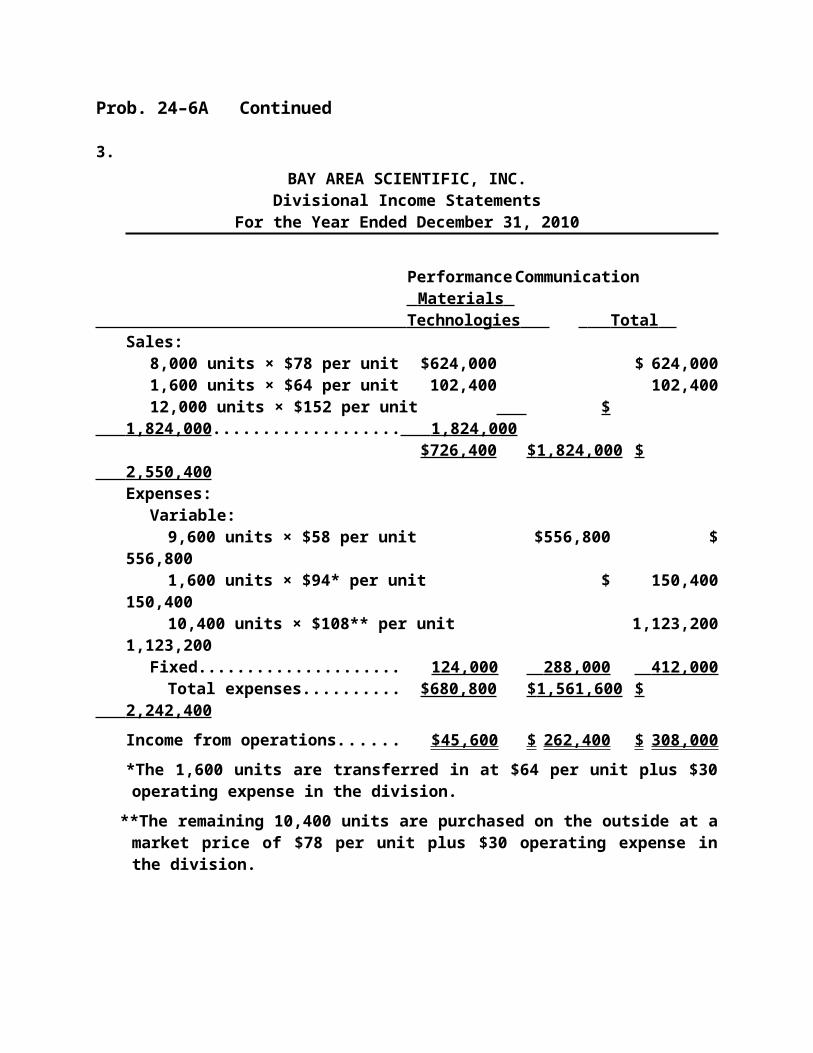
3.BAY AREA SCIENTIFIC, INC.
Divisional Income StatementsFor the Year Ended December 31, 2010
Performance Communication Materials Technologies Total
Sales:8,000 units × $78 per unit............. $624,000 $ 624,0001,600 units × $64 per unit............. 102,400 102,40012,000 units × $152 per unit......... $ 1,824,000 1,824,000
$726,400 $ 1,824,000 $ 2,550,400 Expenses:
Variable:9,600 units × $58 per unit......... $556,800 $ 556,8001,600 units × $94* per unit....... $ 150,400 150,40010,400 units × $108** per unit. . 1,123,200 1,123,200
Fixed.............................................. 124,000 288,000 412,000 Total expenses.......................... $680,800 $ 1,561,600 $ 2,242,400
Income from operations.................... $ 45,600 $ 262,400 $ 308,000 *The 1,600 units are transferred in at $64 per unit plus $30 operating expense in the division.
**The remaining 10,400 units are purchased on the outside at a market price of $78 per unit plus $30 operating expense in the division.
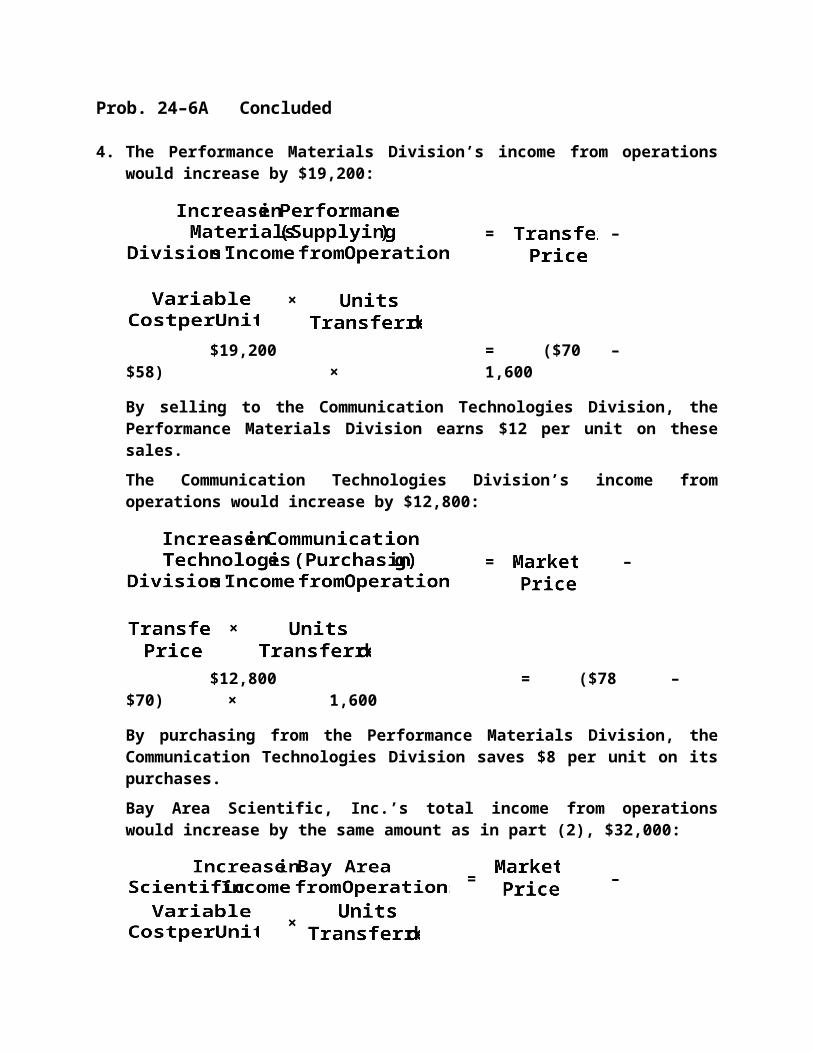
Prob. 24–6A Concluded
4. The Performance Materials Division’s income from operations would in-crease by $19,200:
= – ×
$19,200 = ($70 – $58) × 1,600
By selling to the Communication Technologies Division, the Performance Materials Division earns $12 per unit on these sales.The Communication Technologies Division’s income from operations would increase by $12,800:
= – ×
$12,800 = ($78 – $70) × 1,600
By purchasing from the Performance Materials Division, the Communication Technologies Division saves $8 per unit on its purchases.Bay Area Scientific, Inc.’s total income from operations would increase by the same amount as in part (2), $32,000:
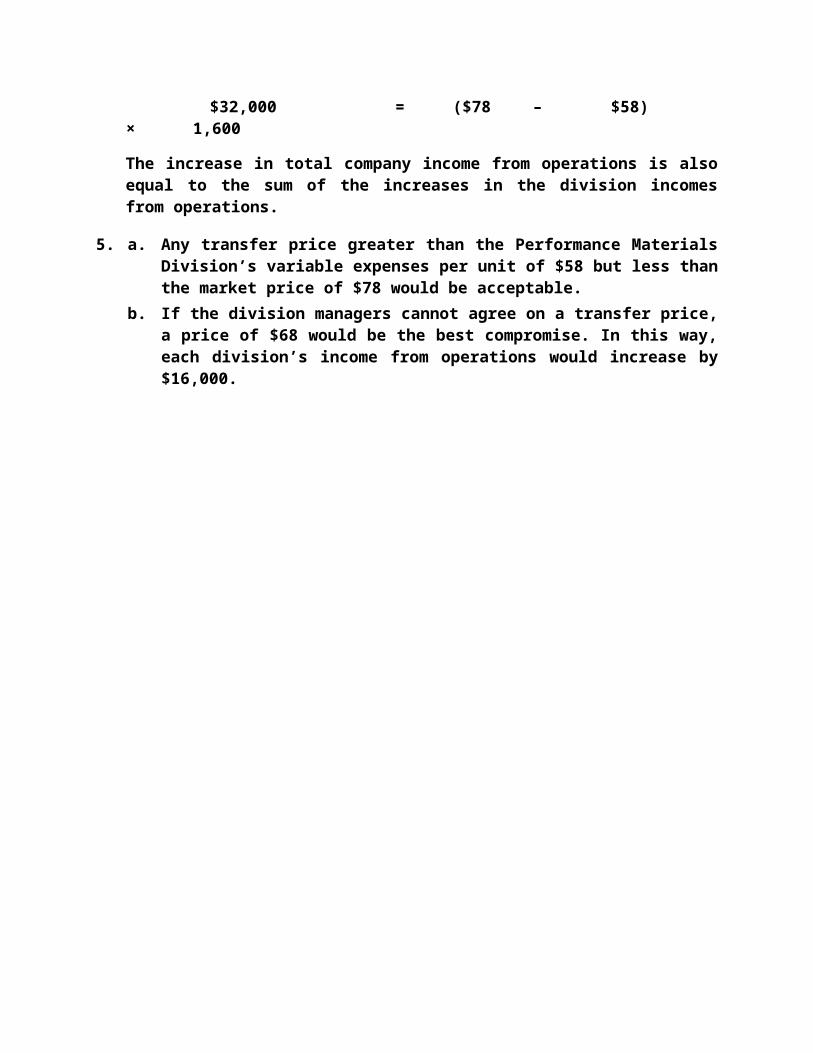
= – ×
$32,000 = ($78 – $58) × 1,600
The increase in total company income from operations is also equal to the sum of the increases in the division incomes from operations.
5. a. Any transfer price greater than the Performance Materials Division’s variable expenses per unit of $58 but less than the market price of $78 would be acceptable.
b. If the division managers cannot agree on a transfer price, a price of $68 would be the best compromise. In this way, each division’s income from operations would increase by $16,000.

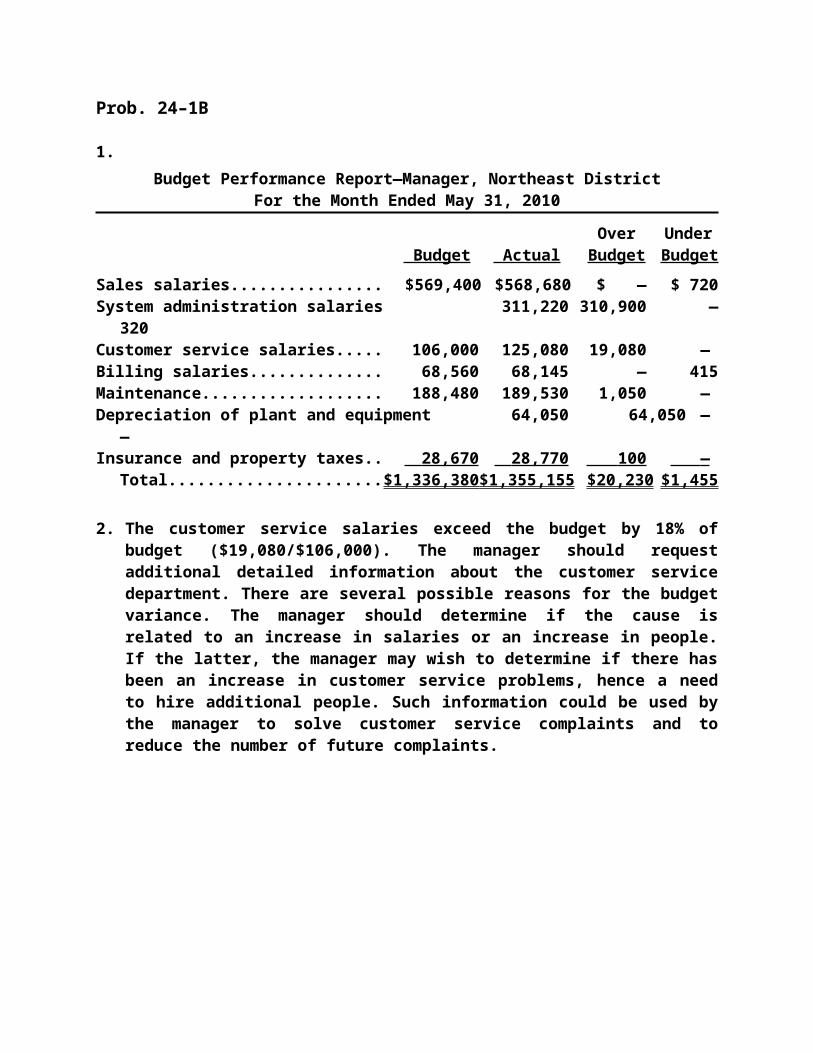
Prob. 24–1B
1.Budget Performance Report—Manager, Northeast District
For the Month Ended May 31, 2010
Over Under Budget Actual Budget Budget
Sales salaries........................................ $ 569,400 $ 568,680 $ — $ 720System administration salaries........... 311,220 310,900 — 320Customer service salaries................... 106,000 125,080 19,080 —Billing salaries....................................... 68,560 68,145 — 415Maintenance.......................................... 188,480 189,530 1,050 —Depreciation of plant and equipment. 64,050 64,050 — —Insurance and property taxes.............. 28,670 28,770 100 —
Total.................................................. $1,336,380 $1,355,155 $20,230 $1,455
2. The customer service salaries exceed the budget by 18% of budget ($19,080/$106,000). The manager should request additional detailed informa-tion about the customer service department. There are several possible rea-sons for the budget variance. The manager should determine if the cause is related to an increase in salaries or an increase in people. If the latter, the manager may wish to determine if there has been an increase in customer service problems, hence a need to hire additional people. Such information could be used by the manager to solve customer service complaints and to reduce the number of future complaints.
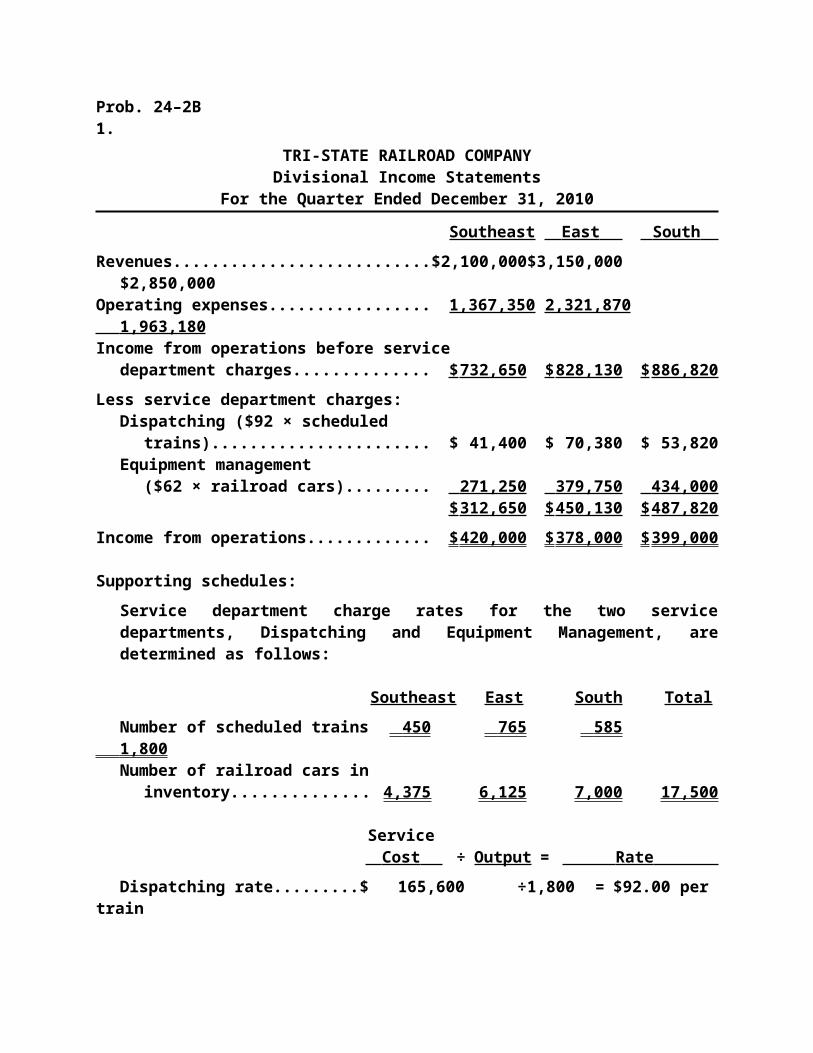
Prob. 24–2B1.
TRI-STATE RAILROAD COMPANYDivisional Income Statements
For the Quarter Ended December 31, 2010
Southeast East South Revenues.......................................................... $2,100,000 $3,150,000 $2,850,000Operating expenses........................................ 1,367,350 2,321,870 1,963,180 Income from operations before service
department charges................................... $ 732,650 $ 828,130 $ 886,820 Less service department charges:
Dispatching ($92 × scheduled trains)..................................................... $ 41,400 $ 70,380 $ 53,820
Equipment management($62 × railroad cars).............................. 271,250 379,750 434,000
$ 312,650 $ 450,130 $ 487,820 Income from operations.................................. $ 420,000 $ 378,000 $ 399,000
Supporting schedules:Service department charge rates for the two service departments, Dispatching and Equipment Management, are determined as follows:
Southeast East South Total Number of scheduled trains........ 450 765 585 1,800 Number of railroad cars in
inventory.................................. 4,375 6,125 7,000 17,500
Service Cost ÷ Output = Rate
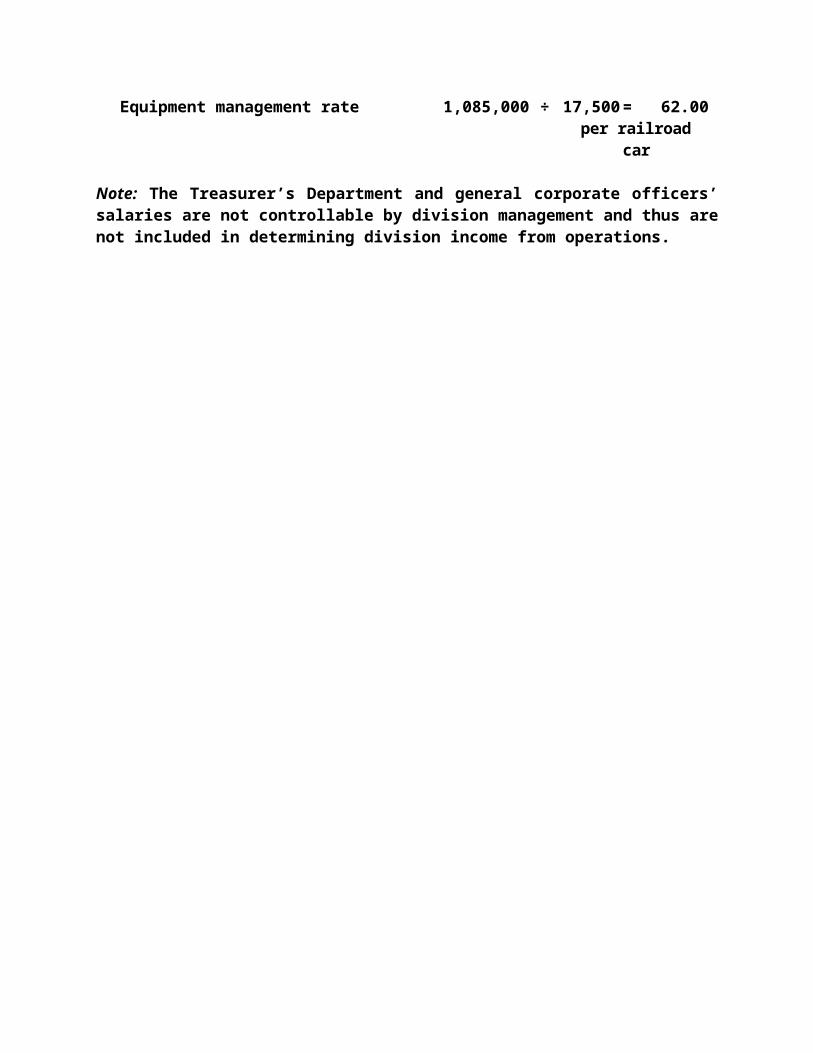
Dispatching rate......................... $ 165,600 ÷ 1,800 = $92.00 per trainEquipment management rate.... 1,085,000 ÷ 17,500 = 62.00 per railroad
car
Note: The Treasurer’s Department and general corporate officers’ salaries are not controllable by division management and thus are not included in determining division income from operations.
Prob. 24–2B Concluded
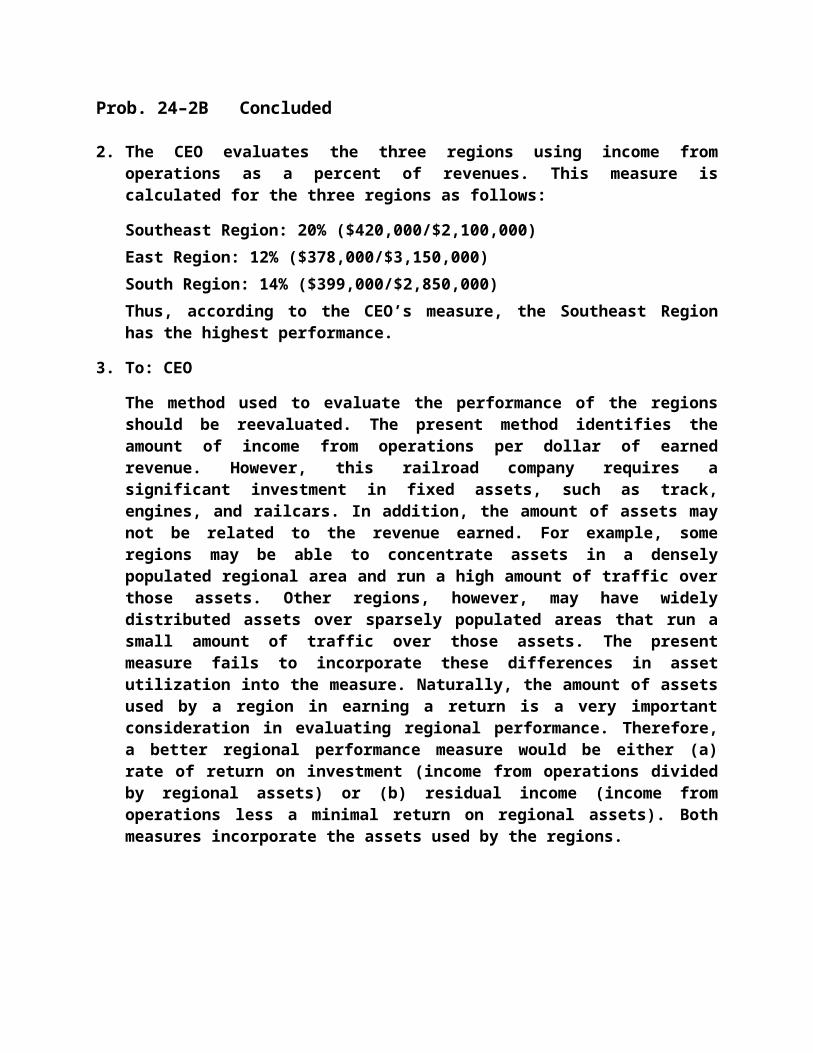
2. The CEO evaluates the three regions using income from operations as a per-cent of revenues. This measure is calculated for the three regions as follows:
Southeast Region: 20% ($420,000/$2,100,000)East Region: 12% ($378,000/$3,150,000)South Region: 14% ($399,000/$2,850,000)Thus, according to the CEO’s measure, the Southeast Region has the highest performance.
3. To: CEO
The method used to evaluate the performance of the regions should be reevaluated. The present method identifies the amount of income from opera-tions per dollar of earned revenue. However, this railroad company requires a significant investment in fixed assets, such as track, engines, and railcars. In addition, the amount of assets may not be related to the revenue earned. For example, some regions may be able to concentrate assets in a densely popu-lated regional area and run a high amount of traffic over those assets. Other regions, however, may have widely distributed assets over sparsely popu-lated areas that run a small amount of traffic over those assets. The present measure fails to incorporate these differences in asset utilization into the measure. Naturally, the amount of assets used by a region in earning a return is a very important consideration in evaluating regional performance. There-fore, a better regional performance measure would be either (a) rate of return on investment (income from operations divided by regional assets) or (b) residual income (income from operations less a minimal return on regional assets). Both measures incorporate the assets used by the regions.
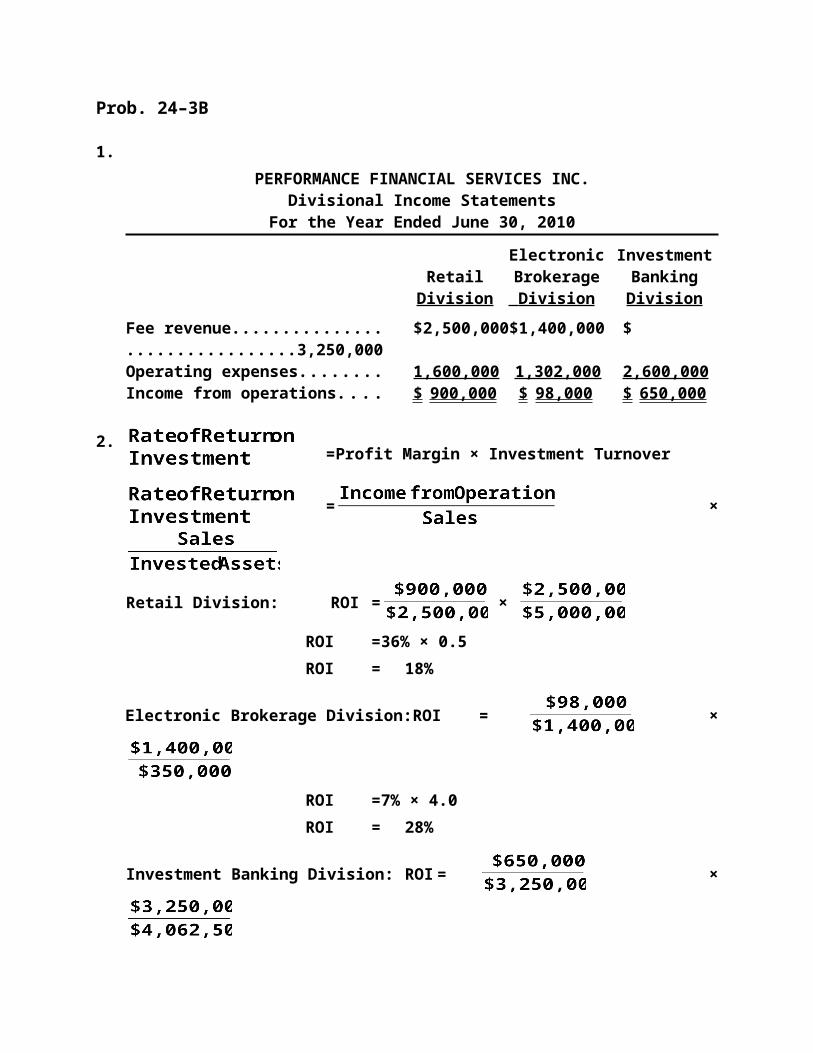
Prob. 24–3B
1.PERFORMANCE FINANCIAL SERVICES INC.
Divisional Income StatementsFor the Year Ended June 30, 2010
Electronic InvestmentRetail Brokerage Banking
Division Division Division Fee revenue.................................... $ 2,500,000 $1,400,000 $ 3,250,000Operating expenses....................... 1,600,000 1,302,000 2,600,000 Income from operations................ $ 900,000 $ 98,000 $ 650,000
2. =Profit Margin × Investment Turnover
= ×
Retail Division: ROI = ×
ROI = 36% × 0.5ROI = 18%
Electronic Brokerage Division: ROI = ×
ROI = 7% × 4.0ROI = 28%
Investment Banking Division:ROI = ×
ROI = 20% × 0.8ROI = 16%
Prob. 24–3B Concluded
3. Per dollar of invested assets, the Electronic Brokerage Division is the most profitable of the three divisions. Assuming that the rates of return on invest-ments do not change in the future, an expansion of the Electronic Brokerage Division will return 28 cents (28%) on each dollar of invested assets, while the Retail and Investment Banking divisions will return only 18 cents (18%) and 16 cents (16%), respectively. Thus, when faced with limited funds for expansion, management should consider an expansion of the Electronic Brokerage Division first.
Note to Instructors: The Retail Division has excellent profit margins, but the investment turnover is very low. The investment in the “bricks and mortar” of the Retail Division offices causes the rate of return on investment to be depressed. However, the Electronic Brokerage Division has very thin margins because the fees earned per trade are very small. However, the assets required to execute trades are much less than the Retail Division because there is no need for offices (trades are executed over the Internet). As a re-sult of the high investment turnover in the Electronic Brokerage Division, the rate of return on investment is much better.
Prob. 24–4B
1. = Profit Margin × Investment Turnover
= ×
Water Sports Division:ROI = ×
ROI =15% × 1.2ROI =18%
2.SOUTH MOUNTAIN SPORTS INC.—WATER SPORTS DIVISION
Estimated Income StatementsFor the Year Ended January 31, 2010
Proposal 1 Proposal 2 Proposal 3Sales................................................. $600,000 $525,000 $600,000Cost of goods sold.......................... 218,000 209,400 206,000 Gross profit...................................... $382,000 $315,600 $394,000Operating expenses........................ 274,000 252,600 274,000 Income from operations.................. $108,000 $ 63,000 $120,000Invested assets................................ $400,000 $350,000 $750,000
Prob. 24–4B Concluded
3. = Profit Margin × Investment Turnover
= ×
Proposal 1: ROI = ×
ROI = 18% × 1.5ROI = 27%
Proposal 2: ROI = ×
ROI = 12% × 1.5ROI = 18%
Proposal 3: ROI = ×
ROI = 20% × 0.8ROI = 16%
4. Proposal 1 would yield a rate of return on investment of 27%.
5. Rate of Return on Investment = Profit Margin × Required Investment Turnover
22% =15% × Required Investment TurnoverRequired Investment Turnover = 1.47 (22%/15%)Current Investment Turnover = 1.20Increase in Investment Turnover= 0.27
or22.5% Increase (0.27/1.20)

Prob. 24–5B
1.SIX LAYER COMPUTERS INC.Divisional Income Statements
For the Year Ended December 31, 2010
Network PersonalEquipment Computing
Division Division Sales..................................................................... $1,400,000 $ 1,120,000Cost of goods sold.............................................. 845,000 690,000 Gross profit.......................................................... $ 555,000 $ 430,000Operating expenses............................................ 345,000 206,000 Income from operations..................................... $ 210,000 $ 224,000
2. =Profit Margin × Investment Turnover
= ×
Network Equipment Division: ROI = ×
ROI = 15% × 1.4ROI = 21%
Personal Computing Division: ROI = ×
ROI = 20% × 0.8ROI = 16%
3. Network Equipment Division: $70,000 [$210,000 – ($1,000,000 × 14%)]Personal Computing Division: $28,000 [$224,000 – ($1,400,000 × 14%)]
Prob. 24–5B Concluded
4. On the basis of income from operations, the Personal Computing Division generated $14,000 more income from operations than did the Network Equip-ment Division. However, income from operations does not consider the amount of invested assets in each division. On the basis of the rate of return on investment, the Network Equipment Division earned 21 cents (21%) on each dollar of invested assets, while the Personal Computing Division earned only 16 cents (16%) on each dollar of invested assets. Although the Personal Computing Division has a higher profit margin than the Network Equipment Division (20% vs. 15%), the Network Equipment Division has a higher invest-ment turnover (1.4 vs. 0.8), which generated its higher rate of return on in-vestment. Residual income can be viewed as a combination of the preceding two performance measures. Residual income considers the absolute dollar amount of income from operations generated by each division and also con-siders a minimum rate of return to be earned by each division. On the basis of residual income, the Network Equipment Division is the more profitable of the two divisions.
Prob. 24–6B
1. No. When unused capacity exists in the supplying division (the Specialized Semiconductors Division), the use of the market price approach may not lead to the maximization of total company income.
2. The Specialized Semiconductors Division’s income from operations would increase by $56,000:
= – ×
$56,000 = ($625 – $485) × 400
By selling to the Navigational Systems Division, the Specialized Semiconduc-tors Division earns $140 per unit on these sales.The Navigational Systems Division’s income from operations would increase by $80,000:
= – ×
$80,000 = ($825 – $625) × 400
By purchasing from the Specialized Semiconductors Division, the Naviga-tional Systems Division saves $200 per unit on its purchases.Knopfler Industries, Inc.’s total income from operations would increase by $136,000:
= – ×
$136,000 = ($825 – $485) × 400
The increase in total company income from operations is also equal to the sum of the increases in the division incomes from operations.
Prob. 24–6B Continued
3. KNOPFLER INDUSTRIES, INC.Divisional Income Statements
For the Year Ended December 31, 2010
Specialized NavigationalSemiconductors Systems Total
Sales:1,600 units × $825 per unit.......... $ 1,320,000 $ 1,320,000400 units × $625 per unit............. 250,000 250,0002,500 units × $1,240 per unit....... $ 3,100,000 3,100,000
$ 1,570,000 $ 3,100,000 $ 4,670,000 Expenses:
Variable:2,000 units × $485 per unit..... $ 970,000 $ 970,000400 units × $775* per unit....... $ 310,000 310,0002,100 units × $975** per unit... 2,047,500 2,047,500
Fixed............................................. 488,000 636,000 1,124,000 Total expenses........................ $ 1,458,000 $ 2,993,500 $ 4,451,500
Income from operations.................... $ 112,000 $ 106,500 $ 218,500 *The 400 units are transferred in at $625 per unit plus $150 operating expenses
in the division.**The remaining 2,100 units are purchased on the outside at a market price of
$825 per unit plus $150 operating expenses in the division.
Prob. 24–6B Concluded
4. The Specialized Semiconductors Division’s income from operations would increase by $86,000:
= – ×
$86,000 = ($700 – $485) × 400
By selling to the Navigational Systems Division, the Specialized Semiconduc-tors Division earns $215 per unit on these sales.The Navigational Systems Division’s income from operations would increase by $50,000:
= – ×
$50,000 = ($825 – $700) × 400
By purchasing from the Specialized Semiconductors Division, the Naviga-tional Systems Division saves $125 per unit on its purchases.Knopfler Industries, Inc.’s total income from operations would increase by the same amount as in (2), $136,000:
= – ×
$136,000 = ($825 – $485) × 400
The increase in total company income from operations is also equal to the sum of the increases in the division incomes from operations.
5. a. Any transfer price greater than the Specialized Semiconductors Divi-sion’s variable expenses per unit of $485 but less than the market price of $825 would be acceptable.
b. If the division managers cannot agree on a transfer price, a price of $655 would be the best compromise. In this way, each division’s income from operations would increase by $68,000.
SPECIAL ACTIVITIES
Activity 24–1
This scenario is a negotiation between two divisions. Dan is not behaving unethically by attempting to get a good price from the Semiconductor Division. He is not behaving unethically because he refuses market price. This may not seem “fair,” but price negotiation is a very typical business activity and is part of Dan’s job. It would be unethical only if the PC Division refused to deal with the Semiconductor Division to purposefully hurt the Semiconductor Division’s per-formance, so that PC could look good in comparison. This claim could only be supported if the PC Division’s refusal to purchase from the Semiconductor Divi-sion was economically unsound. For example, maybe there are no transportation costs because the Semiconductor Division plant is on site. In this case, the total cost to the PC Division would be less by purchasing from the Semiconductor Division. Refusing to do so could be the basis for claiming an ethical breach.The PC Division has overall profit responsibility and authority. This means that the PC Division has the choice of purchasing from the inside or the outside. The PC Division should have incentives to purchase from the inside in order to maxi-mize overall corporate income. This means that the transfer price should be set below market price in order to give Dan an incentive to purchase from the Semi-conductor Division. Jamie’s refusal to budge on market price will likely hurt the Semiconductor Division and the company as a whole. If there are no alternative buyers, the Semiconductor Division should negotiate with the PC Division and accept a price lower than market price. This produces a win-win for both divisions. Thus, although neither party appears to be behaving unethically, Jamie’s price position appears to be the weakest.
Activity 24–2
The department head is responsible for the quantity of service, but not the source of the service (i.e., not the price). Most accountants would hold the de-partment head responsible for the cost by transferring the cost of the brochures to the Customer Service Department, even though the price is 25% higher than could be obtained from the outside. This may not seem fair, but it does control the use of internal services to some degree. If there were no internal transfer price, departments would view the Publications Department as a “free good.” This would likely result in an overdemand for the service, since there would be no pricing discipline on the user groups. This does not mean that all is well. On the contrary, the Publications Department is free to pass on its inefficiencies, since it has a captive client. A possible change in policy would be to allow inter -nal users to go to outside vendors for printing services. This would have the ef -fect of bringing the pressures of competition to the internal service group. It would have to offer the service competitively, or watch its demand disappear. In this way, the internal publications group would have an incentive to be as cost effective as outside printers. Another possible change in policy would be to charge Publications Department services at standard cost. In this way, inefficien -cies in the Publications Department would not be transferred to user depart-ments.
Activity 24–3
1. The rate of return on invested assets is computed as follows:Snack Goods Cereal Frozen Foods
Income from operations..... $ 510,000 $ 720,000 $ 378,000Invested assets.................... ÷ $2,500,000 ÷ $4,800,000 ÷ $1,800,000 ROI........................................ 20.4% 15.0% 21.0% The Frozen Foods Division appears to be making the best use of invested as-sets, since its ROI is the highest.
2. Not all projects that have greater than a 12% rate of return would be ac-cepted. This is because all three divisions have an ROI that is greater than 12%. Thus, any project that is accepted between the 12% minimum and their existing ROI would cause their ROI to drop. This is true because of averag-ing. There would be little incentive to accept such projects if the divisions know they are competing against each other on the basis of ROI.
3. There are two approaches to improving ROI: (1) improving the profit margin or (2) improving the investment turnover. For all three divisions, the profit margin is excellent:
Snack Goods 34% ($510,000/$1,500,000)Cereal 30% rounded ($720,000/$2,400,000)Frozen Foods 28% ($378,000/$1,350,000)
However, the investment turnover is slow in all three divisions. The company doesn’t return many sales dollars per dollar invested in assets, as shown be-low.
Snack Goods 0.60 ($1,500,000/$2,500,000)Cereal 0.50 ($2,400,000/$4,800,000)Frozen Foods 0.75 ($1,350,000/$1,800,000)
The divisions need to work on increasing revenues or reducing invested as-sets in order to improve ROI.
Activity 24–4
1.2008 2009 2010
Profit margin (Income from operations/Sales).................................. 15% 18% 20%
2.2008 2009 2010
Investment turnover (Sales/Invested assets).................................................... 2.0 1.5 0.8
3.2008 2009 2010
Rate of return on investment (Profit margin × Investment turnover)............ 30% 27% 16%
4. Kurt is concerned about the Truck Division because the return on investment appears to be deteriorating over the 2008–2010 operating periods. This is happening even though the profit margin is increasing over this time period. In order for this to occur, the investment turnover must be dropping, which is the case in part (2).The investment turnover is dropping faster than the profit margin is increas-ing. Thus, the rate of return on investment is dropping. It appears as though the Truck Division is making very large investments in the business, but it is not able to reap the returns required to support the investment. Specifically, it appears as if the revenues are not growing fast enough to support the un-derlying asset investment. The invested asset base grew by approximately six times, while the revenues less than doubled over the same time period. The improving profit margins for each revenue dollar were not enough to make up for the revenue shortfall. In addition, the division is not able to maintain the minimum threshold rate of return on investment of 20%. Kurt is concerned because if the trend continues, the division will be earning in the future a rate of return less than the minimum return on investment.
Activity 24–5
1. Rate of Return on Investment =
ROI =
ROI = 15%or
= ×
ROI = ×
ROI =20% × 0.75ROI = 15%
2. $63,000 (7 × $9,000 = $63,000, where 7 = 15% – 8%)
3. Rate of Return on Investment =
ROI =
ROI = 9% or
= ×
ROI = ×
ROI =15% × 0.60ROI = 9%
4. Even though the addition of the new product line would increase the overall company rate of return on investment, its addition would decrease the Apparel Division’s rate of return on investment from 15% to 13% ($5,850,000/$45,000,000). This decrease could negatively influence manage-ment’s evaluation of the division manager. In addition, this decrease in the division’s rate of return on investment would also decrease the division man-ager’s bonus by approximately $18,000 (2 × $9,000, where 2 = 15% – 13%).
Activity 24–5 Concluded
5. Use of residual income as a performance measure and as the basis for grant-ing bonuses would motivate division managers to accept investment oppor-tunities that exceed a minimum rate of return. If the minimum rate of return was set at 8%, the overall company average rate of return, any investment opportunity whose rate exceeded 8% would be viewed as acceptable. If this performance measure had been used, the Apparel Division manager would have increased the division’s residual income by $150,000 through the addi-tion of the new product line, as shown below.Projected income from operations of new product line............ $1,350,000Minimum amount of desired income from operations
($15,000,000 × 8%)................................................................... 1,200,000 Residual income from new product line..................................... $ 150,000 The manager’s bonus could then be calculated as a percent of residual in-come. In this case, a bonus equal to 3% of residual income would achieve a bonus similar to the initial plan:Income from operations............................................................... $4,500,000Minimum desired income (8% × $30,000,000)............................ 2,400,000 Residual income........................................................................... $2,100,000
× Bonus percentage.................................................................. × 3% Bonus............................................................................................. $ 63,000 The new project would add $4,500 ($150,000 × 3%) to the bonus.In addition, nonfinancial performance indicators about product quality and customer satisfaction can be used to supplement the financial numbers.
Activity 24–6
This activity is designed to introduce students to two very popular divisional performance measurement approaches, the balanced scorecard and economic value added (EVA). Both methods are getting very strong support in corporate America. The two consulting firms’ home pages provided in this activity have links to brief descriptions of the two methods. Thus, the student groups should not have trouble completing the first part of the assignment. Hopefully, the students will see that the two methods are different in one very important respect. The balanced scorecard uses multiple financial and nonfinancial mea-sures within the customer, financial, innovation, and internal process dimen-sions to provide a “balanced” perspective of performance. One could argue that the balanced scorecard is probably better able to use the measurement system in communicating strategy through the organization. EVA, in contrast, is a single financial measure that is strongly oriented to maximizing wealth to the share-holder. Hopefully, the students will recognize EVA as a specific application of the residual income concept. EVA’s strength is in its simplicity and its apparent association with wealth maximization (share values). It is interesting to note that the two methods flow from two different philosophies. The balanced scorecard takes a multiple stakeholder perspective, while EVA is taking a stockholder wealth maximization perspective. Both approaches have their supporters. For example, Sears, Roebuck and Co., ExxonMobil Corporation, and FMC Corpora-tion have had success with the balanced scorecard, while The Coca-Cola Company is a notable success story using EVA. This activity should provide some rich classroom discussion comparing the advantages of “balance” versus “stockholder wealth maximization.”