warning a distracted driver: smart phone applications ...€¦ · was that the warnings were...
TRANSCRIPT

Warning a Distracted Driver: Smart Phone Applications, Informative Warnings and
Automated Driving Take-Over Requests
by
Jaimie Christine McNabb
A Dissertation Presented in Partial Fulfillment
of the Requirements for the Degree
Doctor of Philosophy
Approved April 2017 by the
Graduate Supervisory Committee:
Rob Gray, Chair
Russell Branaghan
Vaughn Becker
ARIZONA STATE UNIVERSITY
May 2017
i
ABSTRACT
While various collision warning studies in driving have been conducted, only a
handful of studies have investigated the effectiveness of warnings with a distracted
driver. Across four experiments, the present study aimed to understand the apparent gap
in the literature of distracted drivers and warning effectiveness, specifically by studying
various warnings presented to drivers while they were operating a smart phone.
Experiment One attempted to understand which smart phone tasks, (text vs image) or
(self-paced vs other-paced) are the most distracting to a driver. Experiment Two
compared the effectiveness of different smartphone based applications (app’s) for
mitigating driver distraction. Experiment Three investigated the effects of informative
auditory and tactile warnings which were designed to convey directional information to
a distracted driver (moving towards or away). Lastly, Experiment Four extended the
research into the area of autonomous driving by investigating the effectiveness of
different auditory take-over request signals. Novel to both Experiment Three and Four
was that the warnings were delivered from the source of the distraction (i.e., by either
the sound triggered at the smart phone location or through a vibration given on the wrist
of the hand holding the smart phone). This warning placement was an attempt to break
the driver’s attentional focus on their smart phone and understand how to best re-orient
the driver in order to improve the driver’s situational awareness (SA). The overall goal
was to explore these novel methods of improved SA so drivers may more quickly and
appropriately respond to a critical event.

ii
DEDICATION
I dedicate all my hard work to my family. To my parents, especially, that
encouraged me from a young age to pursue an education and have been there for all my
accomplishments as well as my failures. To my husband, who stood by my side for the
past ten years and supported me even in every way imaginable, even when I felt like
giving up. Lastly, I dedicate my work to my three young daughters. I hope that one day
I may inspire them to work hard and achieve whatever they want in life, even if it seems
impossible. Thank you all so much for all you have done for me, I would not have been
able to do any of this without you!
iii
ACKNOWLEDGMENTS
No one has helped me succeed more in this program than my advisor Dr. Rob
Gray. I want to sincerely thank Dr. Rob Gray for being a wonderful advisor, role model
and friend. Dr. Gray is one of the most humble, down to earth and intelligent people I
know. I feel so honored have been have been taught by the truly best.
I would like to also thank Dr. Russ Branaghan for being an inspiration to me.
Ever since my last year as an undergraduate at ASU I knew I wanted to follow in his
footsteps and pursue my PhD. If it was not for his passion for his career in both
academia and industry, I am not sure I would have attempted this degree program.
Lastly, but not least I want to thank Dr. Vaughn Becker for supporting me
always. As an undergraduate he took me under his wing in his lab to prepare me for my
future. He believed in me, even when I thought I was a failure and encouraged me to
keep trying and pushing forward. Without his encouragement II would have not
believed that I could have accomplished all I have with my education.
Thank you all.
iv
TABLES OF CONTENTS
Page
LIST OF TABLES……………………………………………………………………..vii
LIST OF FIGURES…………………………………………………………………...viii
CHAPTER
1 INTRODUCTION AND LITERATURE REVIEW…………………………....1
Background…………………………………………………………1
Distraction……………..……………………………………………5
Modeling the Effect of Distraction in Driving ……………………..7
Warnings ……………..…………………………………………….8
Visual Warnings………………………………………………..11
Auditory Warnings……………………………………………..13
Tactile Warnings…………………………………………….…15
Crossmodal Warnings………………………………………….17
Other Warning Considerations……………………………………19
Timing ………………………………………………………...20
Location………………………………………………………..23
Information Conveyed…………………………………………25
Distraction and Warnings………………………………………………27
Distraction and Autonomous Vehicles…………………………………28
Summary..……………………………………………………………....29
Current Study…………………………………………………………..30
v
CHAPTER Page
2 EXPERIMENT ONE: Staying Connected on the Road: A Comparison of
Different Types of Smart Phone Use in a Driving Simulator……………….32
Background…………………………………………………………….32
Methods………………………………………………………………...37
Results………………………………………………………………….43
Discussion………………………………………………………………47
3 EXPERIMENT TWO- A Comparison of Different Smart Phone Based
Applications for Mitigating Driver Distraction……………………………...55
Background…………………………………………………………….55
Methods……………………………………………………………..….58
Results………………………………………………………………….60
Discussion……………………………………………………………....64
4 EXPERIMENT THREE- Informative Warnings at the Source of Distraction...68
Background………………………………………………………..…...68
Methods……………………………………………………………..….74
Results……………………………………………………………….…77
Discussion………………………………………………………….…...80
5 EXPERIMENT FOUR- Take-Over Requests while Operating an Autonomous
Vehicle………………………………………………………………………85
Background……………………………………………………………..87
Methods………………………………………………………………...89
Results………………………………………………………………….92
vi
CHAPTER Page
Discussion………………………………………………………………95
6 GENERAL DISCUSSION…………………………………………………….99
Overview of Results…………..………………………………………102
Theoretical Implications………………………………………………105
Practical Applications…………………………………………………107
Limitations…………………………………………………………….109
Future Research……………………………………………………….110
7 CONCLUSION………………………………………………..…………...…111
REFERENCES…………..…………………………………………………………...112
APPENDIX
A NASA-TLX TASK……………………………………………………...……123
B PERMISSION OF USE…….……………………………………………..….125
vii
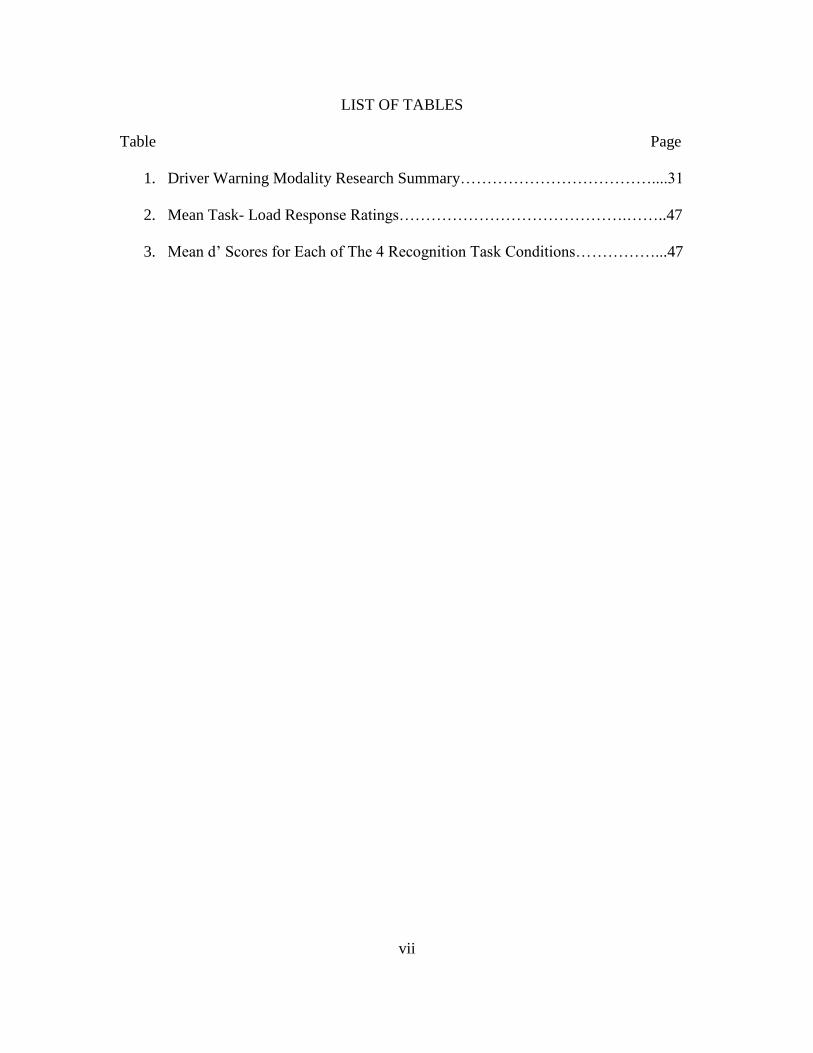
LIST OF TABLES
Table Page
1. Driver Warning Modality Research Summary………………………………....31
2. Mean Task- Load Response Ratings…………………………………….……..47
3. Mean d’ Scores for Each of The 4 Recognition Task Conditions……………...47
viii
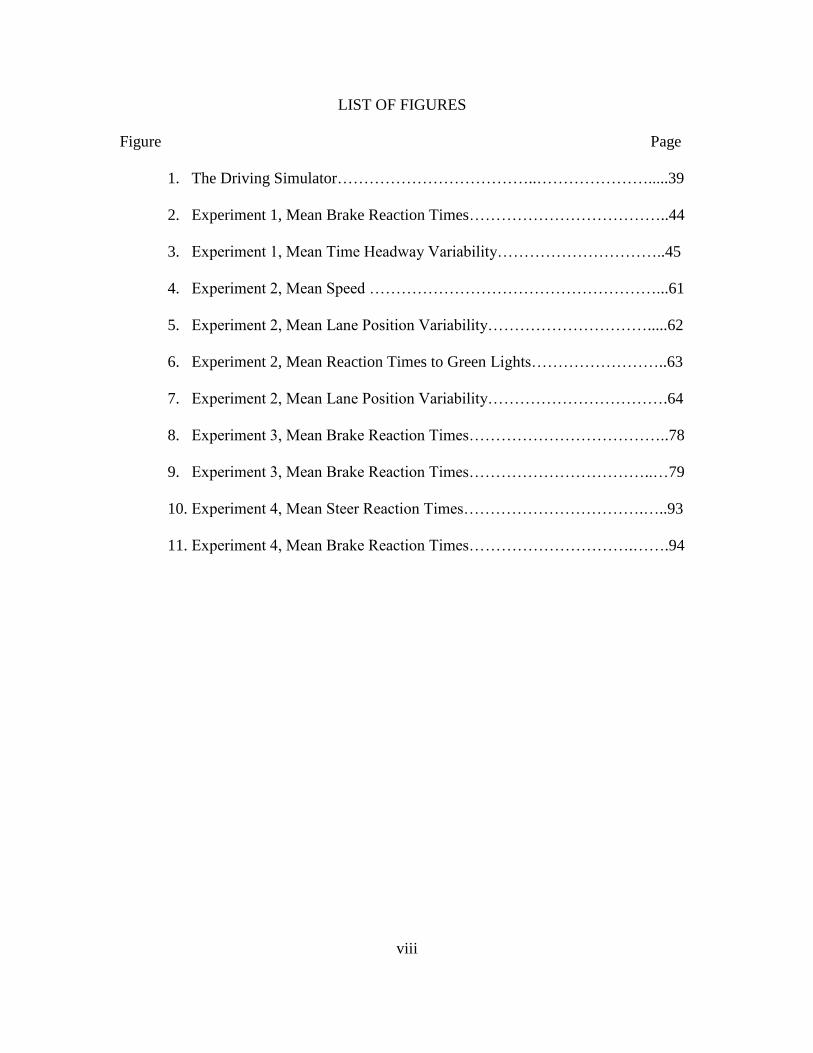
LIST OF FIGURES
Figure Page
1. The Driving Simulator………………………………..………………….....39
2. Experiment 1, Mean Brake Reaction Times………………………………..44
3. Experiment 1, Mean Time Headway Variability…………………………..45
4. Experiment 2, Mean Speed ………………………………………………...61
5. Experiment 2, Mean Lane Position Variability………………………….....62
6. Experiment 2, Mean Reaction Times to Green Lights……………………..63
7. Experiment 2, Mean Lane Position Variability…………………………….64
8. Experiment 3, Mean Brake Reaction Times………………………………..78
9. Experiment 3, Mean Brake Reaction Times……………………………..…79
10. Experiment 4, Mean Steer Reaction Times…………………………….…..93
11. Experiment 4, Mean Brake Reaction Times………………………….…….94
1
CHAPTER 1
INTRODUCTION AND LITERATURE REVIEW
Background
According to the Center of Disease and Control (2015), every day in the United
States, nine people are killed and 1,153 people are injured in crashes that involve driver
distraction. Distracted driving is defined as the diversion of attention away from the
activities critical for safe driving and towards a competing activity (Lee, Regan &
Young, 2008; Regan & Strayer, 2014). Ironically, due to a limited capacity of available
cognitive resources, distracted drivers are unable to recognize their own driving errors
(Kane & Engle, 2003; Watson & Strayer, 2010). Furthermore, drivers self-assessments
combined with their driving performance under distraction suggest that drivers tend to
be overconfident in their distracted driving ability (Horrey, Lesch & Garabet, 2008;
Peters & Peters, 2001). The combination of one’s inability to recognize driving errors
and one’s high confidence of their ability to drive distracted contributes to the large
number of distracted drivers on the road. In fact, distracted driving is responsible for up
to 30% of total crashes (NHTSA, 2013) although, this estimate may be low due to
inaccurate classification of the term distracted driving (Regan & Strayer, 2014).
Regardless, Wilson and Stimpson (2010) reported that fatalities involving driver
distraction rose 28% since 2005. They proposed that an alarming increase in driving
distraction may be attributed to the growing number of drivers using a smart phone,
specifically, texting on a smart phone while driving.
Prior to the introduction of cell phones, contributors of distracted driving
consisted of tasks such as listening to music, talking with passengers, eating,
2
daydreaming or in some cases even grooming. Although these various distractions have
been shown to have a negative impact on driving performance (Stutts, Feaganes,
Rodgman, Hamlett, Reinfurt, Gish & Staplin, 2003), the introduction of the cell phone
in 1995, exacerbated distracted driving (Strayer & Johnston, 2001; Horrey &Wickens,
2006; Caird, Willness, Steel & Scialfa, 2008). From 1999- 2008, the percentage of
Americans that owned a cell phone jumped from 33 to 91% (Wilson & Stimpson,
2010). Due to this boom in cell phone usage over such a short period of time, extensive
research on the impact of cell phone usage on driving performance was imperative.
Research suggests that (though not entirely consistent) cell phone use while driving may
be more detrimental to driving performance than engaging in a conversation with a
passenger, (Drews, Pasupathi & Strayer, 2008; McEvoy, Stevenson & Woodward,
2007), hands-free cell phones provide no benefit over handheld cell phones in
preventing distraction (Stayer & Johnston, 200l; Caird et al., 2008) and additionally,
drivers talking on a cell phone are more likely to experience inattenional blindness
resulting in missed signs, vehicles and even pedestrians (Strayer, Drews & Johnston,
2003; Strayer, Cooper & Drews, 2004; Nasar, Hecht & Wener 2008). In a meta-analysis
including 33 driving studies involving cell phone use, a reliable, perhaps
underestimated, increase in reaction time (RT) of .25 sec to an event (relative to driving
alone baseline conditions) was demonstrated while the control of lateral position
remained relatively unaffected (Caird et al., 2008). Driving performance has been
shown to be negatively affected when drivers use a cell phone for calling, however,
more recent evidence suggest that the distraction problem has been further intensified
with the advancement of cell phone technology (e.g., the text message).
3
Text messaging is both a convenient and popular form of communication that
requires little to no effort once practiced. Due to the lack of effort required of a person
to text message, drivers are led to believe they can simultaneously and successfully text
and drive. Text messaging requires both manual dexterity to hold and press the correct
keys, and visual attention to ensure accurate typing and comprehension. The attentional
demands associated with texting and driving have dangerous repercussions for public
safety. Over the past decade, numerous driving and texting studies have been conducted
to assess the dangers imposed on drivers (Drews, Yazdani, Godfrey, Cooper, & Strayer,
2009; Hosking, Young & Regan, 2009; Caird, Johnston, Willness, Asbridge, & Steel
2014; Young, Rudin-Brown, Patten, Ceci & Lenne, 2014). More recently, Caird et al.
(2014) conducted a meta-analysis of 28 experimental texting and driving studies. The
analysis revealed that both typing and reading text messages while driving produces
increased brake reaction times (BRT’s), increased collisions, as well as having an
adverse effect on the control of lane position, speed and time headway (TH) (i.e., the
temporal gap between the driver’s vehicle the vehicle they are following). These effects
were found when the driver was both typing and reading text messages. A similar
pattern of performance degradation was found regardless of what phone interface was
used to text message e.g., participants using either a touch-screen interface of the smart
phone (lacking tactile feedback) or a hard numeric keypad interface of a standard cell
phone (Young et al., 2014). Additionally, although slightly less detrimental to overall
driving performance, He, Chaparro, Nguyen, Burge, Crandall, Ni and Cao (2014)
recently reported that text messaging using speech-based interfaces also had negative
impacts on driving performance. Overall, these studies together provide evidence that
4
cell phones, and now specifically smart phones, contribute to a major source of
distraction behind the wheel.
Smart phones are not just a “phone” but rather a conglomerate of technological
devices including a phone, camera, video camera, GPS, computer and entertainment
system with over 1 million applications (app’s) available for download. With a constant
4G network, drivers can stay connected to social media apps such as Facebook,
Instagram, or Twitter all while simultaneously operating a vehicle. As of 2014, over
65% of American’s own a smart phone (PRC, 2015) with the majority of them being
young adults (18-49 years old). To date, surprisingly, only a handful of studies have
looked at the negative effects of smart phone use while driving (Basacik, Reed &
Robbins, 2012; Saiprasert, Supakwong, Sangjun & Thajchayapong, 2014). Basacik et
al., (2012) asked participants in a driving simulator to either update their Facebook
status or use Facebook messenger while driving. Relative to an only driving control
condition, Facebook use while operating a vehicle resulted in a significant increase in
the RT to target stimuli (by 0.4 s on average) as well as an increase in the number of
lane departures, increased variability of TH, and increased amount of time with eyes off
the road. Further exploration of the type of task or app platform a driver engages in on
their smart phone may reveal the potential for different consequences on distracted
drivers.
Unfortunately, in today’s technology based society, drivers often use their smart
phones to talk, text or connect to social media apps, making distracted driving
seemingly inevitable. This issue has become a growing concern for roadway officials,
policymakers and automotive industry leaders. Various attempts to mitigate driver
5
distraction have been demonstrated through instantiating laws that restrict various smart
phone uses while driving, e.g. texting, or talking (Sundeen, 2005), developing advanced
infotainment systems using voice-based interactive technologies (Cooper, Ingebretsen,
& Strayer, 2014), as well as detecting driver distraction or drowsiness with the use of an
eye-tracker (Smith, Shah, & Lobo, 2003; Sahayadhas, Sundaraj & Murugappan, 2012).
Whereas these attempts to mitigate distracted driving may initially deter drivers, the
results may not be a lasting solution (McCartt & Geary, 2004). Progressively, car
assistive technologies, while typically integrated in luxury vehicles, have been
successful in reducing rear-end or lane changing collisions (Ben-Yaacov, Maltz &
Shinar, 2002). These assistive technologies include, but are not limited to, collision
avoidance warning systems, lane departure warning systems, blind spot warning
systems, and rear back-up camera warnings. Of specific interest to the current review is
how effective warning systems are when a driver is facing distraction?
Distraction
In order to have a clear understanding of distraction, both as a cognitive process
and as it relates to driving, it is necessary to first recognize the cognitive role of attention.
Attention is defined as a cognitive process that allows a person to selectively concentrate
or attend to specific information in their environment by allocating resources that are able
to process modality specific information (Friedenberg & Silverman, 2011).
Metaphorically expressed, Posner, Snyder and Davidson (1980) ascribe one’s visual
attention to an “attentional spotlight” beam that continually scans the environment and
allocates processing power to stimuli within the beam of focus. The precise cognitive
6
mechanisms and processes performed by the central executive system in maintaining
attention and processing visual and cognitive information within one’s “spotlight” has
been studied and modeled (Kane & Engle, 2002; Baddeley & Hitch, 1974). Results of
these studies reveal that attention is necessary for processing information and is an
essential component to both working memory and long term memory models, but due to
the increased resources required to maintain attention, attention is by nature limited
(Kahneman, 1973). Attentional limitations, throughout cognitive psychology research,
are exemplified in studies that simulate inattention, divided attention (multi-tasking) as
well as mind-wandering tasks (De Pisapia & Braver, 2006; McVay & Kane, 2009). In an
applied driving context, the same attentional limitations a driver experiences tend to
contribute to overall driver distraction and driver inattention (Strayer & Drews, 2007;
Watson & Strayer, 2010). Furthermore, Regan and Strayer (2014) created a driver
inattention taxonomy that attempts to clarify the various levels of driver inattention
through categorizing various instances of driver distractions. They suggest that
distraction is only ONE of the many factors that can contribute to a driver’s inattention
on the roadway. Consequently, as smart phone and advanced infotainment system
technologies progress, drivers become more apt to be distracted visually (i.e., looking
away from the roadway) or distracted cognitively (i.e., thinking about a new alert
message). As both a driver’s visual and cognitive attention demands increase, overall
driver distraction and inattention thereby increase. Due to this increase in driver
distraction, a model (Distract-R) was developed that accounts for a drivers attentional
limitations as they interact with various vehicle interface designs and smart phones. This
7
model attempts to analyze and predict a driver’s behavior and attention as they interact
with current available technologies,
Modeling the Effect of Distraction in Driving
Distract-R was developed by Salvucci, Zuber, Bergovaia and Markley (2005) and
is based on the Adaptive Control of Thought cognitive model (ACT-R) to generate
driving performance predictions. The Distract-R model is based on a modified version of
the ACT-R model, referred to as the ACT-Simple framework, which eliminates the recall
and learning aspect of the original ACT-R model. The ACT-Simple framework is based
on basic perceptual and cognitive operations required for a driver to perceive and
complete a secondary task while driving.
Distract-R consists of five major components that include interfaces, tasks, drivers,
scenarios and lastly the results which are presented in a visual simulation. The interface
component allows a visual prototype to be created and includes the dial, microphone, and
display buttons. For example, each operation on the interface such as speak, press, or
listen requires 300ms of processing time. Also, prior to each operation, a 1200ms
cognitive operator “think” is added. Furthermore, the prep and execution models are
based on assumptions, based on Fitt’s Law models; such that, prep time for each task
consists of 100ms intervals and execution times for each specific task. The tasks
component allows the designer to specify the order in which various tasks are to be
completed, such as, the process for placing a call or turning a knob on the radio. The
driver component allows different parameters to be chosen such as, age (young versus
old), steering style (how aggressively the driver corrects vehicle to center), and stability
8
(based on how unsafe the driver is). Likewise, the scenario component allows for
environment parameters such as speed of the vehicle and behavior of the lead car. Once
all components are satisfied the designer can run the model which outputs results in the
form of BRT, task time, lane violations data at a rate 1000x’s real observed time. This
data generated output can be used as a baseline for potential causes of driving errors and
then matched and compared to real human data. If this model is match to real observed
data then this model has high predictive ability.
While Distract-R is a relevant and efficient way to test new interface designs for
drivers, with the introduction of the smart phone, the model itself needed to be updated.
In order for the Distract-R model to account for visual and touch interfaces that are
consistent with today’s smart phones, Lee (2014) extended the Distract-R model.
Particularly, one of his major contributions to advance the Distract-R model was
introduction of a Saliency Map model. The Saliency Map model fills the visual attention
gap by allocating resources associated with task switching and eye-glance behavior while
engaging in dual tasks. This updated Distract-R model has been shown to be a better
model for making predictions about driving performance based on the smart phone tasks
that a driver is using such as playing music, text messaging or navigating an application.
Warnings
Even when a driver’s attention is fully focused on the task of driving, drivers have
been shown to be prone to perceptual errors and risky behaviors. For example, drivers
fully engaged in driving tasks frequently are unable to accurately judge distance or
speeds on the roadway (e.g., Denton, 1980; Gray, 2005), have a tendency to follow too
9
closely to the car in front of them (vanWinsum & Heino, 1996) and tend to have an over
inflated sense of confidence about their driving abilities (Horrey et al., 2008). These
types of driving inadequacies, along with the high rate of distracted drivers on the
roadway increases one’s chances of being involved in an accident.
For many, autonomous vehicles offers a pragmatic solution to this serious
problem however, there are still many issues that need to be solved before autonomous
vehicles will be commonplace on roadways. These unforeseen issues include, but are not
limited to, issues regarding the situation awareness of drivers with regards to the driver
taking over control from the automation (e.g., Zeeb, Bucher & Schrauf, 2015), the high
costs of purchasing and converting all vehicles to automation, as well as the political
issues associated with accident responsibility (Jones, 2002) i.e., the driver or car
manufacturer responsible if an accident does occur. For these reasons, warnings offer a
more practical approach to mitigate accidents due to the low cost and easier
implementation to vehicles.
Driver warnings are intended to improve safety by way of influencing a person’s
behavior as well as act as a supplement, rather than substitute, for a good design
(Salvendy, 2012). Successful warnings need to be able to quickly alert a driver of an
event and more importantly orient the driver’s attention to the location of the event
(Meng & Spence, 2015). Additionally, more advantageous warning systems may be able
to convey information about the situation such as the urgency required, or the even the
direction in which a driver should expect a potential collision (Gray, Ho & Spence,
2014). Drivers, who are distracted, specifically, by reading or writing text messages may
benefit most from warnings of potential collisions.
10
Various warning modality types e.g., visual, auditory and tactile warnings, have
been shown to be effective in both alerting and orienting a driver’s attention (Edworthy,
1994; Lee, McGehee, Brown & Reyes, 2002; Gray et al., 2014), refer to (Table 1) for a
summary of each warning modalities pros and cons. Visual warnings provide drivers with
pertinent information about a specific situation, although due to a driver’s overloaded
visual demand, visual warnings are typically not as effective when presented in isolation
(Lee et al., 2002; Scott & Gray, 2008). Auditory warnings that consist of auditory icons
i.e., screeching tires, have been shown to immediately capture attention of external
events, especially in cases of high cognitive workload, (Edworthy, 1994; Ho & Spence,
2005) although due to competing sounds, auditory warnings may potentially be masked
or conversely, if too loud or unreliable, may become annoying (Bliss & Acton, 2003).
Tactile warnings, unlike auditory and visual warnings, can be implemented without
substantially increasing a driver’s workload, thus improving reaction times to potential
collisions (van Erp & van Veen, 2004; Scott & Gray, 2008) although due to the physical
contact within a person’s peripersonal space as well as being a rarely used warning
modality type, tactile warnings in a critical event may actually shock or confuse drivers.
Crossmodal warnings, which are combinations of different modality types, such as,
audiovisual, audiotactile and visuotactile bimodal warnings, as well as trimodal (auditory
+ visual + tactile) warnings provide the most promising results. Research has shown
bimodal and trimodal warnings that account for spatial location and timing tend to elicit
faster BRTs to critical events than the same warnings presented in unimodal fashion
(Fitch, Kiefer, Hankey & Kleiner, 2007; Santangelo & Spence, 2007; Lee & Spence,
2008).
11
Although data gathered in driving simulators has been shown to be reliable and
generalizable to real world driving (Kluver, Herrigel, Henrich, Schoner & Hecht, 2016)
warning drivers in the lab may differ from real world situations (Ho, Gray & Spence,
2014). Warning a driver in a lab setting inherently creates a learned response to the
warning in which a driver can prepare and expect a critical event therefore improving
overall reaction times. In a real driving situation, a driver may rarely encounter warnings
leading to longer reaction times in the event of a critical situation. Because of this
potentially low occurrence with warnings it is imperative to implement intuitive and
easily understood warning systems. Successful warning systems need to account for not
only warning modality but location, timing and pertinent information that is specific to a
driver’s environment and situation. I next review each of the different warning modalities
in more detail.
Visual Warnings
Driving is predominantly a visual task requiring a great degree of visual attention.
In order for a driver to successfully navigate the roadway, they need to be able to visually
identify and process other vehicles, nearby pedestrians, current traffic conditions, as well
as interpret traffic signals and warning signs (Strayer et al., 2004). Visual demands placed
on the driver are not limited to demands outside of the vehicle, but are also present within
the vehicle. In-vehicle visual demands consist of, but are not limited to, visual interfaces
including the dashboard, displaying vehicle information such as the speedometer and fuel
level, the center console, providing entertainment, navigation and climate control
information, as well as rear and side mirrors. Additionally, as technology advances, in-
vehicle distractions can come from portable technology sources such as a driver’s smart
12
phone, laptop or tablet. As would be predicted given that driving is primarily a visual
task, visual warnings have been shown to be the least effective modality used to warn a
driver. Scott and Gray (2008) provided clear evidence of this notion by conducting a
study that directly compared auditory, tactile and visual unimodal warnings to a no-
warning condition. Results showed that visual warnings (dashboard flashing lights) were
not as effective in reducing BRT’s as the auditory tones alone or tactile vibrations
embedded in the seatbelt.
To circumvent the problem of drivers missing visual warnings, head-up displays
(HUDs) have been developed. HUDs project on the windshield so that warning signals
and other driving information (e.g., speed) is in the driver’s field of view when they are
looking at the road. HUDs main goals are to minimize the amount of total time spent
looking away from the roadway and effectively reduce information access costs
associated with task switching (Sojourner & Antin, 1990). While HUDs can be beneficial
to a driver, the HUDs overlay of information may obstruct or clutter the driver’s field of
view, and in an unexpected situation may hinder any benefits (Horrey, Wickens &
Alexander, 2003). HUDs as well as in-dashboard displays have also used icons to warn
drivers symbolically (e.g., an image of two cars colliding) or via text messages (e.g., the
word “Stop!”), (Edworthy, Stanton & Hellier, 1995). Although fairly limited, previous
research on visual warnings in this context has demonstrated similar comprehension rates
for both visual symbols and textual words (Hawkings, Womack & Maunce, 1993;
Hanowski & Kantowitz, 1997). Specifically, Hanowski & Kantowitz, (1997) found that
overall, participants had better comprehension for shorter messages and symbols
13
categorized as “very high comprehension” and younger drivers, as compared to older
drivers, were more accurate in interpreting a message’s meaning.
Visual warning comprehension is vital in order to effectively assist drivers in
avoiding hazardous events. Visual warnings may not be detectable or discernible in a
moment of urgency due to the high visual workload in driving. For this reason, visual
warning research has looked at the impact of multiple sources of visual warnings as well
as combining visual warnings with other warning types (Selcon, Taylor & McKenna,
1995; Lee et al., 2002). For instance, Selcon et al. (1995) found redundancy of warnings,
visual verbal + visual spatial e.g., a written word on the correct side of a display, was
more beneficial in reducing response time to an event than a single source e.g., written
word in the center of the display. Similarly, rear end collision warning studies
demonstrated success in implementing a symbolic visual warning (e.g., a vehicle
colliding with the rear of another vehicle), with an auditory warning tone (Kiefer, 2000;
Lee et al., 2002). Furthermore, although visual warnings can provide drivers with
pertinent information about a specific situation, visual warnings unaccompanied by
another modality may not be sufficient to successfully warn drivers.
Auditory Warnings
Auditory warnings, in a driving context, may be a beneficial modality to capture a
driver’s attention and provide critical information of external events (Ho & Spence,
2005). Auditory warnings can be detected and identified quickly resulting in decreased
reaction times to an external event, especially in cases of high cognitive workload
(Edworthy, 1994; Belz, Robinson & Casali, 1999; Graham, 1999). Auditory warnings in
general need to be loud enough for people to hear them, especially drivers who with
14
hearing limitations and those in cars with competing auditory stimuli (e.g., music,
passengers, traffic noise, or cell phone conversations). However, the audio warnings
should not be so loud as to trigger a startle response (Patterson, 1989; Edworthy, 1994).
Auditory warnings are either verbal or nonverbal and each type has advantages as
well as limitations. Verbal warnings (e.g., speech) covey critical information to a driver
in stressful situations though, depending on the length of the verbal warning or the
competing auditory sounds, verbal warnings may take longer to fully process or could
even be misunderstood (Aldrich & Parkin, 1989). Nonverbal warnings can be further
broken into synthetic/abstract sounds (e.g., tones or beeps) that represent a particular
meaning, or representational auditory icons/earcons (e.g., car horn or skidding tire
sound) that represent a naturally occurring sound (Graham, 1999) or looming warnings
that convey critical information through increasing or decreasing the intensity of a sound
(Gray, 2011).
Abstract auditory warnings are easily learned and in certain situations and have
been shown to improve reaction times to an external event (Graham, 1999; Mohebbi
Gray & Tan, 2009). However, when abstract warnings are presented in new situations
they may be indistinguishable or confusing (Belz et al., 1999). Similarly, auditory icons
have been shown to be effective in alerting a driver to an external event (Ho & Spence,
2005). However, auditory icon warnings have the potential to be confused with naturally
occurring stimuli and have been shown to elicit inappropriate responses in some
situations (Gray, 2011). An alternative which seems to capture the benefits of both
abstract and auditory icon warnings are informative warnings that provide an optimal
solution in warning a driver about an impeding collision. For example, looming auditory
15
warnings which use an abstract signal that increases in loudness at a rate that matches the
closing velocity have been shown to result in speeded reaction times and appropriate
responses (Gray, 2011). However, though auditory warnings have shown success in
alerting and informing a driver of a critical situation, auditory warnings alone may not be
the most beneficial modality.
Tactile Warnings
Tactile warnings are used to alert someone of a potentially dangerous situation
through the sense of touch. Tactile warnings, with respect to warning drivers, have
included vibrations via tactors or applied force feedback systems that have been delivered
to the driver through the gas pedal, steering wheel, driver’s seat, seatbelt, or even on the
body such as, a driver’s thighs, waist or back (Ho, Gray & Spence, 2014). Overall, tactile
warnings can be broken down into three types, basic (non-directional), directional and
meaningful signals. Basic (non-directional) tactile warnings are the most simple and
consist of vibrational pulses that do not provide the driver any additional information
about the external collision itself (e.g., Scott & Gray, 2008). Directional tactile warnings
stimulate different parts of the driver’s body to signal events in different locations. For
example, torso/back stimulation to stimulate front-end/rear-end collision (Ho, Reed &
Spence, 2006), left/right leg stimulation to signal lane departures to each side (Navarro,
Mars & Hoc, 2007) or warnings which attempt direct attention to multiple spatial
locations (Gray et al., 2014) e.g., stimulation to left shoulder to get driver to look up and
to the left. Lastly, meaningful tactile looming warnings can convey proximity
information about the driving environment through manipulation of the dynamic qualities
of the vibrations (i.e., signals toward-head or toward-torso and rate of apparent tactile
16
motion, Gray et al., 2014; Ho et al., 2014). Research has investigated whether there is an
intuitive natural mapping to tactile warnings and if meaning can be conveyed by a tactile
warning through manipulating perceived urgency (e.g., changing the intensity, varying
the inter-pulse interval or simulating motion (Ho, et al., 2006; Lee & Spence, 2008). Ho
et al.,(2014) found that the use of three tactors was beneficial in decreasing BRTs as
compared to only using one or two tactors, although the direction of the three tactors,
upwards, downwards or randomized did not convey any additional benefits. Conversely,
in a separate study, when the tactors displayed an upward and towards motion that was
dependent on the closing velocity to the lead car, BRTs were significantly reduced (Gray,
et al., 2014).
The success of tactile warnings are based on the “tap on shoulder” principle, to
which stimulating an individual’s personal space can lead to immediate identification of
an event. Also, tactile warnings alert a driver privately, in a non-obtrusive manner (i.e.,
passengers are unaware) which may be a contributing factor to why participants generally
rate them as being less annoying than other warning types (Fitch et al., 2007). Another
benefit to tactile warnings is that the tactile sense is the most accessible and unburdened
sensory modality available during driving. Unlike auditory and visual warnings, it has
been proposed that because the sense of touch is relatively less involved in the task of
driving, tactile warnings can be implemented without substantially increasing a driver’s
workload. Evidence in support of this idea comes from studies that have shown that as
compared to other warning types, tactile warnings elicit faster reaction times to a
potential collision (van Erp & van Veen, 2004; Fitch et al., 2007; Scott & Gray, 2008;
Meng & Spence, 2015).
17
Equally, there are some drawbacks in an applied setting to using only tactile
warnings. Whereas the “tap on the shoulder” principle is beneficial in creating an
immediate response, the response is not sensitive to spatial localization as an auditory or
visual warning. For example, when someone reaches over and taps a person on the wrong
side of the shoulder and then quickly moves out of the way, the person is “tricked” into
looking in the wrong direction. With regards to tactile warnings, if a tactile warning is
given to the waist of a driver in a critical situation a driver may be more likely to look
down at their waist rather than to an event outside of the vehicle. Secondly, tactile
warnings depend on stimulating a person’s body and may not be detected by the driver if
heavy clothes are worn (i.e., jeans and/or a coat in the winter), if both hands are not
placed on the steering wheel, or if a seatbelt is not worn. Lastly, due to the low
occurrence of potential collisions encountered by the driver, a vibrotactile warning
presented to a driver in an emergency situation may ironically result in confusion and
longer reaction times (Ho et al., 2014). Although tactile warnings can quickly alert a
driver, a combination of warning modalities may be the best option to best warn a driver.
Crossmodal Warnings
As discussed previously, warning drivers via unimodal presentation (e.g.,
auditory, visual or tactile modalities have been shown to reduce response time in driving
situations (e.g., a potential lane departure or rear-end collision). Again, though reliable,
these findings may not be suitable in an applied driving context. For example, if the
modality used to warn a driver is masked, as in the case of the sounds from a noisy car
masking an auditory warning or the vibrations from a bumpy dirt road masking a tactile
warning, a driver might better benefit from a bimodal or even trimodal warning signals
18
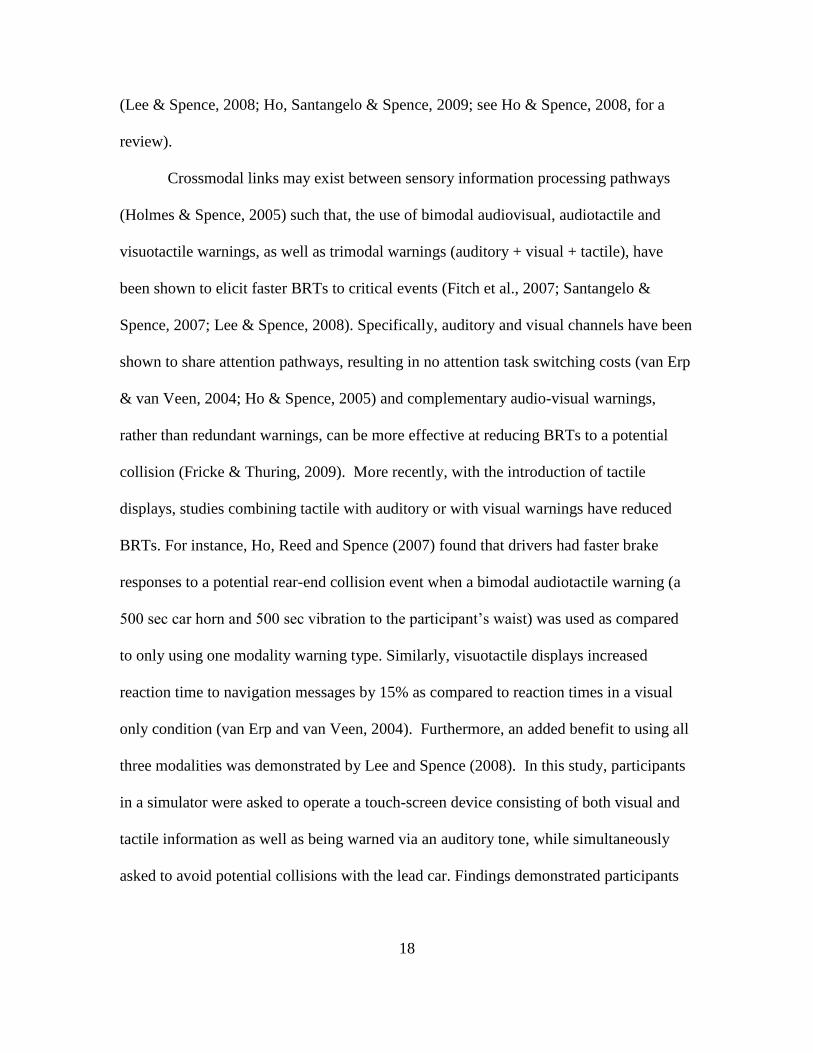
(Lee & Spence, 2008; Ho, Santangelo & Spence, 2009; see Ho & Spence, 2008, for a
review).
Crossmodal links may exist between sensory information processing pathways
(Holmes & Spence, 2005) such that, the use of bimodal audiovisual, audiotactile and
visuotactile warnings, as well as trimodal warnings (auditory + visual + tactile), have
been shown to elicit faster BRTs to critical events (Fitch et al., 2007; Santangelo &
Spence, 2007; Lee & Spence, 2008). Specifically, auditory and visual channels have been
shown to share attention pathways, resulting in no attention task switching costs (van Erp
& van Veen, 2004; Ho & Spence, 2005) and complementary audio-visual warnings,
rather than redundant warnings, can be more effective at reducing BRTs to a potential
collision (Fricke & Thuring, 2009). More recently, with the introduction of tactile
displays, studies combining tactile with auditory or with visual warnings have reduced
BRTs. For instance, Ho, Reed and Spence (2007) found that drivers had faster brake
responses to a potential rear-end collision event when a bimodal audiotactile warning (a
500 sec car horn and 500 sec vibration to the participant’s waist) was used as compared
to only using one modality warning type. Similarly, visuotactile displays increased
reaction time to navigation messages by 15% as compared to reaction times in a visual
only condition (van Erp and van Veen, 2004). Furthermore, an added benefit to using all
three modalities was demonstrated by Lee and Spence (2008). In this study, participants
in a simulator were asked to operate a touch-screen device consisting of both visual and
tactile information as well as being warned via an auditory tone, while simultaneously
asked to avoid potential collisions with the lead car. Findings demonstrated participants
19
had faster responses to the lead car when the trimodal warnings were presented from the
same location, as compared to bimodal or unimodal warning conditions.
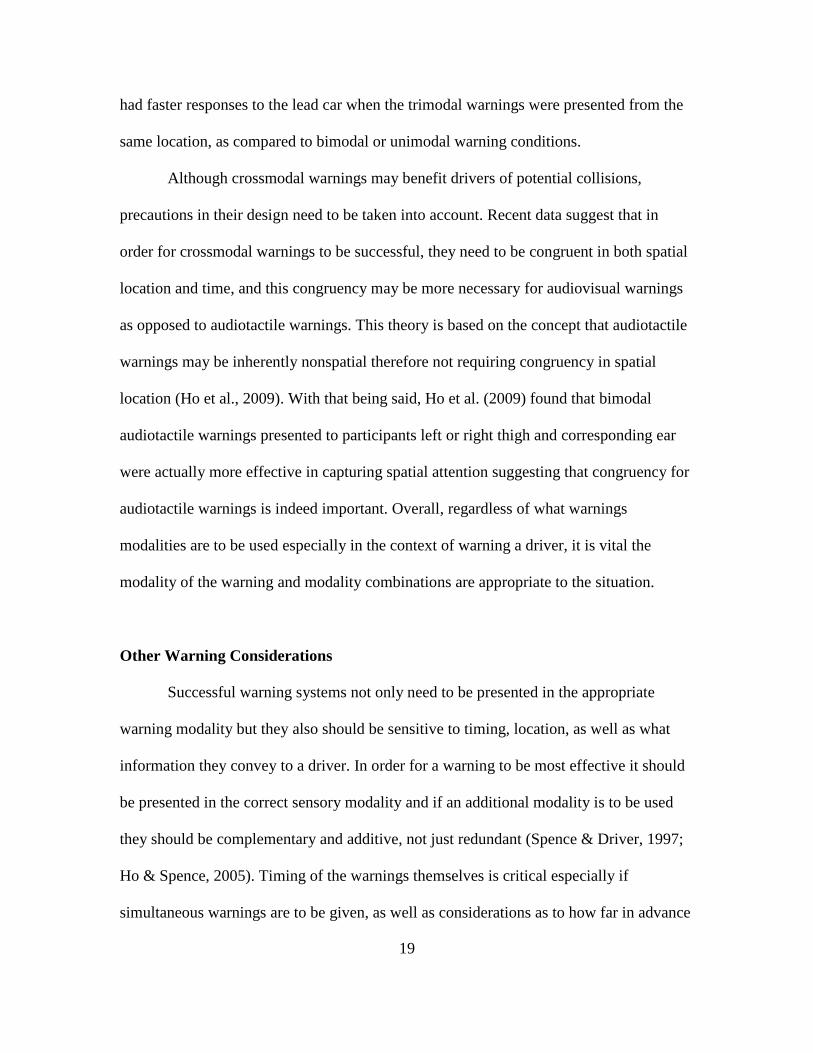
Although crossmodal warnings may benefit drivers of potential collisions,
precautions in their design need to be taken into account. Recent data suggest that in
order for crossmodal warnings to be successful, they need to be congruent in both spatial
location and time, and this congruency may be more necessary for audiovisual warnings
as opposed to audiotactile warnings. This theory is based on the concept that audiotactile
warnings may be inherently nonspatial therefore not requiring congruency in spatial
location (Ho et al., 2009). With that being said, Ho et al. (2009) found that bimodal
audiotactile warnings presented to participants left or right thigh and corresponding ear
were actually more effective in capturing spatial attention suggesting that congruency for
audiotactile warnings is indeed important. Overall, regardless of what warnings
modalities are to be used especially in the context of warning a driver, it is vital the
modality of the warning and modality combinations are appropriate to the situation.
Other Warning Considerations
Successful warning systems not only need to be presented in the appropriate
warning modality but they also should be sensitive to timing, location, as well as what
information they convey to a driver. In order for a warning to be most effective it should
be presented in the correct sensory modality and if an additional modality is to be used
they should be complementary and additive, not just redundant (Spence & Driver, 1997;
Ho & Spence, 2005). Timing of the warnings themselves is critical especially if
simultaneous warnings are to be given, as well as considerations as to how far in advance
20
the warnings are given (Lee et al., 2002; Spence & Squire, 2003; Straughn, et al., 2009).
Ideally, the warning should be spatially congruent with the other warnings as well as
congruent with the critical event (Ho & Spence, 2008). Lastly, if the warnings are to be
informative, attention as to what information should be conveyed to a driver is essential.
Information that may be conveyed includes verbal messages, as well information
containing the urgency of a situation or the direction in which a potential collision may
occur. This can be achieved by manipulating the rate of change or simulated motion
direction of a warning signal. I next review timing, location and information of the
warnings in more detail.
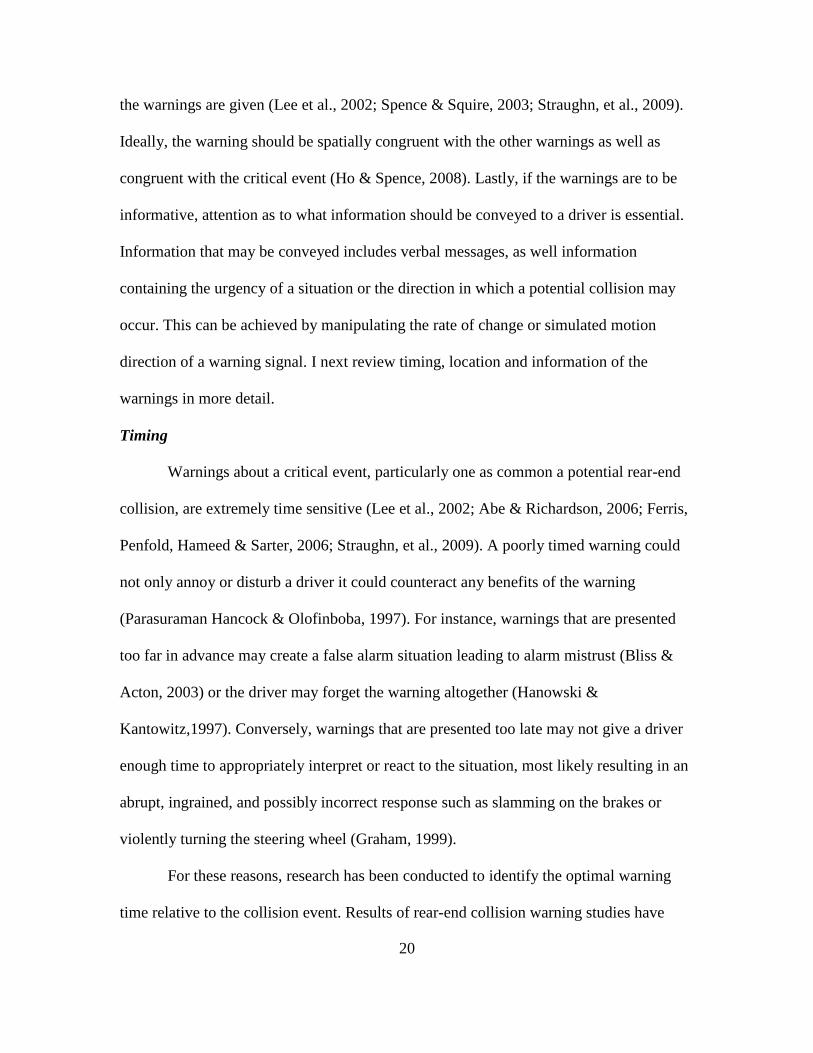
Timing
Warnings about a critical event, particularly one as common a potential rear-end
collision, are extremely time sensitive (Lee et al., 2002; Abe & Richardson, 2006; Ferris,
Penfold, Hameed & Sarter, 2006; Straughn, et al., 2009). A poorly timed warning could
not only annoy or disturb a driver it could counteract any benefits of the warning
(Parasuraman Hancock & Olofinboba, 1997). For instance, warnings that are presented
too far in advance may create a false alarm situation leading to alarm mistrust (Bliss &
Acton, 2003) or the driver may forget the warning altogether (Hanowski &
Kantowitz,1997). Conversely, warnings that are presented too late may not give a driver
enough time to appropriately interpret or react to the situation, most likely resulting in an
abrupt, ingrained, and possibly incorrect response such as slamming on the brakes or
violently turning the steering wheel (Graham, 1999).
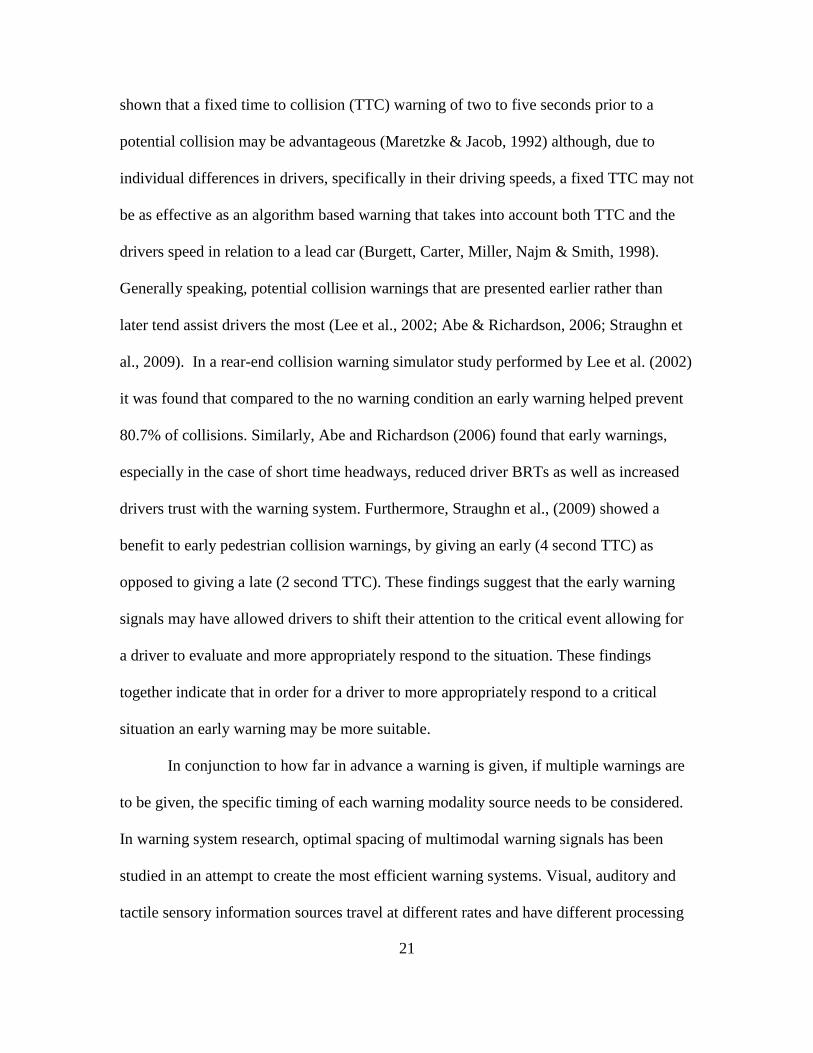
For these reasons, research has been conducted to identify the optimal warning
time relative to the collision event. Results of rear-end collision warning studies have
21
shown that a fixed time to collision (TTC) warning of two to five seconds prior to a
potential collision may be advantageous (Maretzke & Jacob, 1992) although, due to
individual differences in drivers, specifically in their driving speeds, a fixed TTC may not
be as effective as an algorithm based warning that takes into account both TTC and the
drivers speed in relation to a lead car (Burgett, Carter, Miller, Najm & Smith, 1998).
Generally speaking, potential collision warnings that are presented earlier rather than
later tend assist drivers the most (Lee et al., 2002; Abe & Richardson, 2006; Straughn et
al., 2009). In a rear-end collision warning simulator study performed by Lee et al. (2002)
it was found that compared to the no warning condition an early warning helped prevent
80.7% of collisions. Similarly, Abe and Richardson (2006) found that early warnings,
especially in the case of short time headways, reduced driver BRTs as well as increased
drivers trust with the warning system. Furthermore, Straughn et al., (2009) showed a
benefit to early pedestrian collision warnings, by giving an early (4 second TTC) as
opposed to giving a late (2 second TTC). These findings suggest that the early warning
signals may have allowed drivers to shift their attention to the critical event allowing for
a driver to evaluate and more appropriately respond to the situation. These findings
together indicate that in order for a driver to more appropriately respond to a critical
situation an early warning may be more suitable.
In conjunction to how far in advance a warning is given, if multiple warnings are
to be given, the specific timing of each warning modality source needs to be considered.
In warning system research, optimal spacing of multimodal warning signals has been
studied in an attempt to create the most efficient warning systems. Visual, auditory and
tactile sensory information sources travel at different rates and have different processing
22
times in the human perceptual system thus leading to slight perceived temporal offsets
when they are physically presented at the same time (Stein & Meredith, 1993). For
example, the neural processing of auditory information is faster than the neural
processing of visual information because the latter involves a chemical process (Dixon &
Splitz, 1980). Also, tactile information given to the fingertips is processed quicker than
tactile information given to the torso due to more receptors located in a person’s
fingertips (Stein & Meredith, 1993). Although these processing differences between
modalities exist, people are generally unaware of the differences due to our brains ability
to integrate information from the different senses. This smooth integration allows the
perception of synchrony of information presented in different modalities (Spence &
Squire, 2003). In order to achieve a warning system that appears synchronous, a slight
delay (100ms or more) in the presentation of each warning modality, as well as the
appropriate presentation order of each modality i.e., the visual warning precedes the
auditory warning, has been shown to be necessary. Conversely, recent work in an applied
driving context, demonstrates that surprisingly synchronous warnings may be more
optimal. Ho, Gray and Spence (2014) found evidence that synchronous audiovisual cues
facilitated head turning and steering wheel turn response times, whereas asynchronous
audiovisual cues did not. The explanation for these inconsistent findings may be that the
mechanism responsible for an orienting a response rather than an alert response is more
sensitive to temporal synchrony. These findings highlight why it is imperative that
designers of multimodal waring systems consider both accurate timing of the warning as
well as timing of each warning modality.
23
Location
An effective warning may alert a driver, but a more effective warning can both
alert AND orient a driver’s spatial attention to the correct location (Ho & Spence, 2008
for a review). In order for a warning to be most advantageous to a driver it is necessary
that the warning signal be both spatially congruent with the critical driving event (e.g.,
the location of the object that will hit) and spatially congruent with additional warning
modality types (Ho & Spence, 2008). Spatially congruent warnings that have been shown
to effectively orient a driver’s spatial attention to a specific location have consisted of
flashing lights displayed in a critical direction, spatially predictive auditory tones i.e., a
tone given to the left speaker indicative of the left side of a vehicle, as well as tactile
stimulations administered to various locations on a drivers body i.e., torso/back to
indicate a front-end/rear-end collision (Ho & Spence, 2005; Ho et al., 2006; Scott &
Gray, 2008, Ho et al., 2009).
Although spatially congruent warnings have been shown to be successful in
alerting and orienting a driver, the reliability of the signal to indicate the location of the
event may be equally as important. Ho and Spence (2005) investigated this theory by
having participants in a driving simulator complete a cognitively demanding rapid serial
visual presentation (RSVP) task while responding to a reliable or unreliable auditory
warning indicative of either a front-end or rear-end collision. The spatial congruency of
the auditory warnings was manipulated as well as the reliability of the warning in
correctly indicating the direction of the critical event. Findings showed that spatial
congruency of the auditory warnings contributed to improved response times to a critical
event but equally important were that response times improved as the reliability of the
24
warnings increased from 50% to 80%. These results are consistent with previous findings
on warning reliability, such that, as the reliability of a cue increases to 100% valid,
reaction times tend to improve (Bliss & Acton, 2003).
As previously discussed, under conditions of high driver workload unimodal
warnings are not as effective as multimodal warnings. With that being said, more
research is needed on multimodal warning systems. Overall findings on multimodal
warnings propose that, in order for the warnings to be valuable to a driver, each warning
modality should be delivered from a congruent spatial location (Ho & Spence, 2005; Ho
et al., 2007; Fitch et al., 2007; Lee & Spence, 2008; Ho et al., 2009). In fact, many
studies have demonstrated that driver’s reaction times to a critical event are facilitated by
delivering the warnings from spatially congruent locations, although studies have rarely
considered the effect of warning a driver from spatially incongruent locations. To assess
the impact of warning signals delivered from incongruent spatial locations, Ho et al.,
(2009) designed and conducted two experiments that incorporated either unimodal and
bimodal audiotactile warnings that were spatially congruent (spatial tactile vibration and
auditory cue) or spatially incongruent (central tactile vibration with spatial auditory cue).
Results revealed that bimodal audiotactile cues presented from similar spatial directions
were more effective than the use of solely unimodal cues. Additionally, it was observed
that bimodal cues, with no regards to spatial direction, provided no additional benefit to a
driver, suggesting that incongruent bimodal cues may actually eliminate any observed
facilitation effects. Ultimately, research findings indicate that when designing a vehicle
warning system it is essential that the warning signal be spatially congruent to the critical
25
event as well as reliable and if multimodal warnings are to be used, it is imperative that
they originate from the same spatial location.
Information Conveyed
Vehicle warning systems have been shown to successfully alert a driver about a
critical event as well as orient a driver to the location of the event. Of present interest is
the warning systems ability to convey pertinent information about an event itself, such as
urgency or direction of a potential collision. Research addressing this specific topic has
attempted to convey meaning into the warning systems by manipulating various features
of the warning signal such as the intensity, frequency, and the rate of change of intensity
(Gray, 2011; Gray et al., 2013; Ho et al., 2014). For instance, auditory warnings have
been shown to convey urgency to a driver by manipulating the sounds intensity or by
manipulating the rate of change of intensity with respect to the TTC. Gray (2011)
revealed that when the sound intensity of an auditory warning increased as a function of
the decreased distance between a driver’s vehicle and a lead car (looming auditory
warning), the driver’s reaction time to a collision was improved as compared to other
auditory warnings that varied in only their speed or frequency. Additional results
observed that looming auditory warnings were so naturally informative that by altering
the rate of change of intensity to the TTC, drivers could be influenced to respond early or
late to an impending collision. These results, taken together, suggest that looming
auditory warnings may be the most effective way to inform drivers of a potential collision
due to the natural mapping of the looming auditory signal to real-world events.
Building on the findings of the effectiveness of informative auditory warnings, Ho
et al., (2014) recently extended this idea into the vibrotactile warning domain. However,
26
results showed that vibrotactile looming signal (i.e., a vibration from a single tactor that
increased in intensity as a function of the distance to the lead vehicle) alone did not
provide participants any advantage over other non-looming vibrotactile signals (e.g., a
constant intensity vibration). Interestingly, whereas looming virbotactile warnings
themselves did not improve a driver’s response to potential collision, it was found that
simulating motion either upwards, downwards or randomized with three tactors, across
the driver’s body did in fact improve performance. Because the randomized tactor
simulation, which lacked directional information, improved performance to a similar
degree as the directional tactile signal, the findings of this study suggested that
vibrotactile dynamic warnings could not be used to convey meaning to a driver.
To further explore this question, Gray et al. (2014), had participants in a driving
simulator wear three dynamic tactors that delivered a vibrotactile signal that was
dependent on the closing velocity (CV) with the lead car and provided upward or
downward motion information. Results of this study concluded that BRTs were
significantly improved when the vibrotactile warnings were CV-linked and even more
facilitated reaction times were shown when the vibrotactile cues were presented in an
upwards motion, moving towards the drivers head. Overall, these applied driving studies
provide evidence that information can indeed be conveyed to a driver through the use of
auditory looming sounds or dynamic collision linked vibrotactile cues.
27
Distraction and Warnings
Despite the abundant research showing the effectiveness of collision warnings
(reviewed above), one question that has not be studied in detail is whether these warnings
will remain effective under conditions of high driver distraction. Generally speaking,
auditory warnings can be successful in reducing reaction times to a potential collision,
though this effectiveness begins to diminish when a driver is distracted. Mohebbi et al.
(2009) exposed this limitation by having drivers talk on a hands-free cell phone while
receiving either auditory or tactile warnings of an impending rear-end collision. Results
indicated that the task of talking on a cell phone rendered the auditory collision warning
completely ineffective (i.e., it no longer reduced BRT as compared to a no warning
condition) and reduced the effectiveness of the tactile collision warning (i.e., although it
resulted in significantly lower BRTs as compared no warning, this difference was
reduced). The authors proposed that this difference between modalities is that talking on
cell phone increases auditory attentional demands without effecting tactile attention. In a
follow up study, Ahtamad, Spence, Meng, Ho, McNabb & Gray, (under review), recently
investigated the effect of a task relying primarily on the sense of touch (texting with a
smart phone) on warning effectiveness. Results revealed that texting rendered vibrotactile
warnings (either abstract or informative) ineffective (i.e., no reduction in BRT relative to
a no warning condition). Although various real-life scenarios may mitigate the success of
a warning system, such as loud music masking an auditory warning or a bumpy road
masking a vibrotactile warning, these few distraction and warning studies highlight that
warning a driver that is distracted by their smart phone may consequently render any
warning virtually ineffective. Due to these unsettling findings, it is essential to investigate
28
further what warnings or combinations of warnings, if any, might successfully alert a
driver that is indeed engaged in smart phone operations.
Distraction and Autonomous Vehicles
Autonomous vehicles, while an exciting design and obvious solution for many of
today’s roadway problems associated with distracted drivers, do not come without
problems of their own. For instance, the most dangerous circumstance, a driver who is
not in full control of the vehicle physically and has not been monitoring the driving
situation cognitively receives a request from the vehicle to take immediate control to a
time sensitive or critical event. Due to the likely opportunity for some type of control
failure in autonomous vehicles, research in this area has focused on understanding what
level of situation awareness may be most effective in assisting the driver to safely regain
control of the vehicle (Louw, Merat & Jamson, 2014; Louw & Merat, 2014). Overall
findings have demonstrated that drivers should be encouraged to remain driving “in the
loop” both cognitively and physically (Louw, et al., 2014) because drivers that take
advantage of fully automated systems (i.e., attending to their iPad) tend to react slower
and more aggressively to critical events, thus increasing their risk for potential collisions
(Merat & Jamson, 2014). While the findings suggest that the best case scenario in
autonomous driving is that drivers remain as supervisory agents, these findings do not
seem achievable in an applied setting. Specifically, because supervisory drivers that are
physically and cognitively in the “loop” appear to defeat the main intent of an automated
vehicle. For this exact reason, it is necessary to reveal the most effective way to break a
driver’s attention and redirect them to the “loop” (i.e., roadway) as quickly as possible
29
when they have been acting as a supervisory agent. The most favorable solution to this
problem would be to develop a warning system that is effective enough to both alert a
driver of a critical event but additionally provide enough information to the driver that
they can properly assess the situation and appropriately react.
Summary
The seemingly inevitable fact that a large proportion of drivers will use a smart
phone while driving creates immense problems for public safety. Of the various attempts
to mitigate this serious problems, warnings, such as collision avoidance warning systems,
lane departure warning systems, blind spot warning systems, and rear back-up camera
warnings have aimed to provide an inexpensive method to reduce accidents, as well as
diminish fatalities and high financial losses associated with preventable accidents.
Though warnings can be easily added into most vehicles, their effectiveness has shown to
be highly sensitive to the design parameters. First, it is essential that the correct warning
modality types are used and if crossmodal warnings are used the signals for each
modality is properly combined. Second, it is imperative that the location, timing, and
information to be conveyed by the warning are considered. Additionally, due to most
driver’s lack of experience with warning systems (and likely reluctance to go through a
training period before driving a new car off the lot), systems need to be intuitive and
quickly understood in order to ensure the driver makes an appropriate response to a
critical situation.
Even if all of these requirements have been successfully met and the warning
system has been implemented, a major area of concern is how effective a warning may be
30
when a driver is distracted especially given that the bulk of research in this area used low
workload conditions. The limited amount of research that has examined warning
effectiveness when a driver is distracted, being a secondary task, suggests that warnings
may not provide any benefit in reducing potential collisions in such situations. That being
said, it is vital that future research be conducted that not only looks at the use of warnings
on distracted drivers but research that is aimed to discover the best warning
implementations systems to quickly disengage a driver from specific sources of
distraction, (i.e., their smart phones). Equally, as autonomous vehicles become more
commonplace, distraction research needs to be focused on what warning modalities or
combinations of warning modalities can quickly alert and re-orient the attention of a
distracted driver in the event of a critical incident. These as well as other research
questions need to be addressed due to a heightened number of distracted drivers on the
public roadways, consequently, jeopardizing everyone’s safety.
Current Study
While various collision warning studies in driving have been conducted, (Table
1) only a handful of studies have incorporated the effectiveness of warnings with a
distracted driver. Interestingly, to date, only one study has researched the effectiveness
of warnings with a driver that is distracted by a smart phone. The present study (across
four experiments) aims to understand the apparent gap in the literature of distracted
drivers and warning effectiveness, specifically by studying various warnings on drivers
while they are operating a smart phone.
31
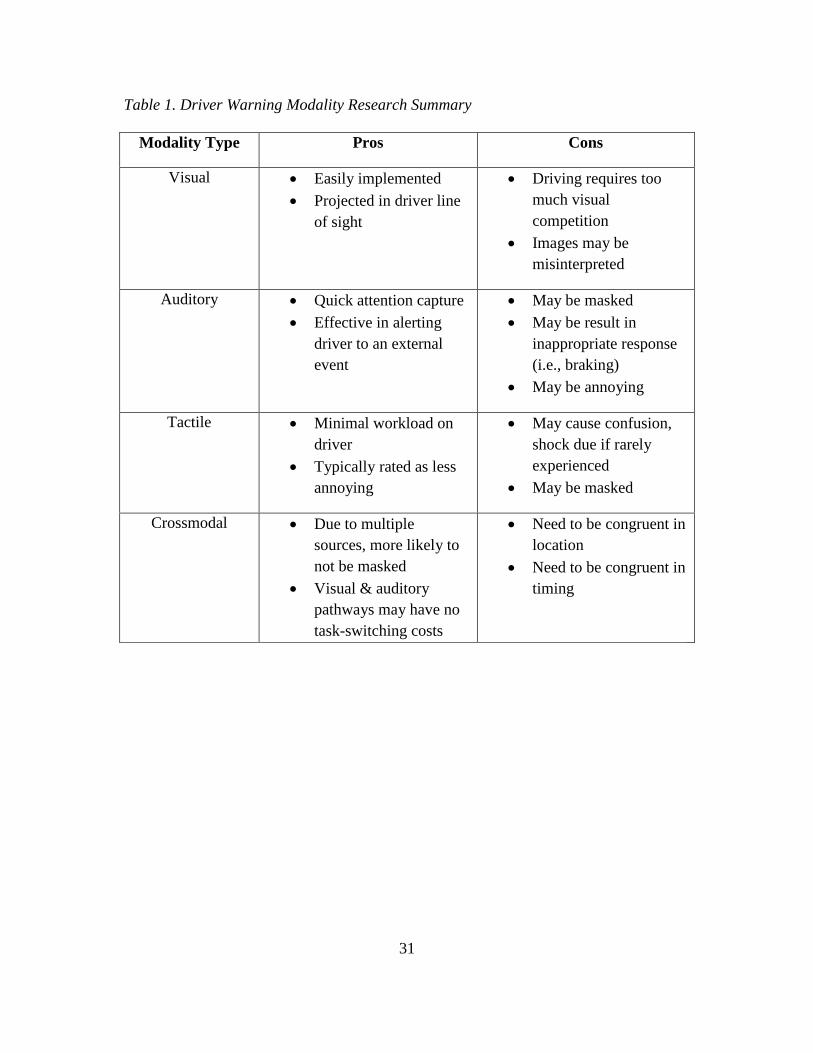
Table 1. Driver Warning Modality Research Summary
Modality Type Pros Cons
Visual
Easily implemented
Projected in driver line
of sight
Driving requires too
much visual
competition
Images may be
misinterpreted
Auditory
Quick attention capture
Effective in alerting
driver to an external
event
May be masked
May be result in
inappropriate response
(i.e., braking)
May be annoying
Tactile
Minimal workload on
driver
Typically rated as less
annoying
May cause confusion,
shock due if rarely
experienced
May be masked
Crossmodal
Due to multiple
sources, more likely to
not be masked
Visual & auditory
pathways may have no
task-switching costs
Need to be congruent in
location
Need to be congruent in
timing
32
CHAPTER 2
EXPERIMENT ONE: Staying Connected on the Road: A Comparison of Different
Types of Smart Phone Use in a Driving Simulator
Abstract
Previous research on smart phone use while driving has primarily focused on
phone calls and texting. Drivers are now increasingly using their phone for other
activities during driving, in particular social media, which have different cognitive
demands. The present study compared the effects of four different smart phone tasks on
car-following performance in a driving simulator. Phone tasks were chosen that vary
across two factors: interaction medium (text vs image) and task pacing (self-paced vs
experimenter-paced) and were as follows: Text messaging with the experimenter
(text/other-paced), reading Facebook posts (text/ self-paced), exchanging photos with the
experimenter via Snapchat (image, experimenter -paced), and viewing updates on
Instagram (image, experimenter -paced). Drivers also performed a driving only baseline.
Brake reaction times (BRTs) were significantly greater in the text-based conditions
(Mean = 1.16 s) as compared to both the image-based conditions (Mean = 0.92 s) and the
baseline (0.88 s). There was no significant difference between BRTs in the image-based
and baseline conditions and there was no significant effect of task-pacing. Similar results
were obtained for Time Headway variability. These results are consistent with the picture
superiority effect found in memory research and suggest that image-based interfaces
could provide safer ways to “stay connected” while driving than text-based interfaces.
33
Background
Although we still call them “smart phones,” the devices most people carry today
serve as a conglomerate of technological devices including a phone, camera, video
camera, GPS, computer and entertainment system with over 1 million applications
(app’s) available for download. Having such power in the palm of our hand creates a
potentially major source of distraction when we are commuting and indeed it is well
documented that the use of smart phones can be a cause of accidents for pedestrians (e.g.,
Hatfield & Murphy, 2007) cyclists (e.g., Ahlstrom & Kircher, Thoslund & Adell, 2015),
and, the interest of the present study, drivers (reviewed in Caird et al., 2008; Caird et al.,
2014).
To date, the vast majority of studies on the effects of smart phone use in driving
have focused on two device functions: talking on the phone and texting/instant
messaging. Research on cell phone use has consistently demonstrated that conversations
while driving significantly increase a driver’s reaction time (RT) to events and stimuli—a
meta-analysis of 33 studies conducted by Caird and colleagues found a mean increase in
RT of .25 s (Caird et al., 2008). As the authors acknowledge, this is likely an
underestimate of the true effect because in most experiments the attentional demands are
unlike those in real driving e.g., drivers are abnormally vigilant to the driving task
because they are being observed (Ho et al., 2014). A key finding of these studies is that
the increase in RT is similar for handheld and hands-free phones. This indicates that the
detrimental effects of talking on a cell phone while driving are due to a reduction in the
attentional and/or working memory resources devoted to driving rather than the
commonly held belief that the impairments are solely due to the physical demands of
34
holding the phone and taking one’s eyes of the road to dial/receive a call. It should be
noted, however, recent naturalistic driving studies have provided data inconsistent with
these findings i.e., no significant increase in the likelihood of an accident when using a
hands-free cell phone while driving (e.g., Fitch, Soccolich, Guo, McClafferty, Fang &
Olson, 2013). Although some studies have reported other (perhaps compensatory) effects
talking on a cell phone while driving on driver behavior including increased time
headway (TH), decreased speed and poorer lateral control, these effects have not been
found consistently (Caird et al., 2014).
Turning to texting, studies have reported similar (and often greater) detrimental
effects on driving performance. In a meta-analysis of 28 studies conducted by Caird and
colleagues (Caird et al., 2014), it was found that texting while driving produces
significantly longer brake RTs (BRT), increased collisions, as well as adversely affecting
lane position, speed and headway regulation. These effects were found both when the
driver was typing and reading text messages. A similar pattern of performance
degradation was also found regardless of what phone interface was used to text message
e.g., participants using either a touch-screen interface (lacking tactile feedback) or a hard
numeric keypad interface (Young, Rudin-Brown, Patten, Cici, & Lenne, 2014).
Additionally, although slightly less detrimental to overall driving performance, He et al.
recently reported that even text messaging via speech-based interfaces negatively
impacted driving performance in simulator (He et al., 2014)
In addition to the texting and talking studies, Kujala and colleagues have
investigated the effects of using a music player and a navigation device on a smart phone
during driving (Kujala, 2013; Kujala & Saarilumo, 2011). Both of these tasks were found
35
to significantly impair driving performance in a simulator (e.g., increases the number of
lane excursions) with the effect magnitude depending on the design of the interface (e.g.,
kinetic vs. button scrolling, grid vs list menu).
As discussed above, smart devices now have many other uses including the main
interest of the present study: social networking (e.g., Facebook, Twitter, etc). To date, we
have been only able to find one study that has specifically focused on the effect of social
networking on driving other than solely texting or instant messaging. Basacik et al.
investigated the effect of Facebook use on driving performance in a simulator (Basacik et
al., 2012). In this study, participants were asked to send and receive messages through
Facebook’s instant messaging system and update their status. Relative to an only driving
control condition, Facebook use resulted in an significant increase in the RT to target
stimuli (by 0.4 s on average), increase in the number of lane departures, increased
variability of TH, and increased amount of time with eyes off the road. Similar effects
were observed for both instant messaging and status updating.
The limited amount of research on the effects of social networking on driving
represents an important gap in the literature for two reasons. First, the frequency of this
behavior is continuing to increase particularly in younger drivers. A State Farm survey
conducted in 2014 (State Farm, 2015) reported that between the years 2009–2014 the
number of drivers reading social media networks while driving increased from 21 to 41%
for the ages 18 to 29 and increased from 9 to 20% across drivers of all ages. Over the
same time period, talking on a hand-held phone while driving has decreased. The second
important issue is that modern social networking apps include a variety of different
methods of interaction that go beyond reading text on a screen and writing text messages.
36
These include exchanging photos (e.g., Snapchat, Instagram) and videos (e.g., YouTube,
Vine) which have been shown to have different memory and attentional demands than
text (e.g., Weldon, Roediger, & Challis, 1989). For example, there is a well-documented
“picture superiority effect” in that memory for images is better than memory for text
Paivio & Csapo, 1973). Finally, unlike the cell phone use and texting tasks used in most
previous driving studies which are typically initiated by someone else, many social
networking apps can be either self or other paced (e.g., Facebook). Previous research has
shown that for self-paced secondary tasks drivers may adapt their driving behaviors and
engage in secondary tasks when a situation is less demanding such as when they are
stopped at a red light or before entering “danger zones” (Metz, Landau, & Just, 2014;
Liang, Horrey & Hoffman, 2014) however these findings have not be entirely consistent
and more research is needed to determine the differences between self and other-paced
secondary tasks in driving. For these reasons the effects of social networking on driving
may not be directly predictable from the research on cell phone use and texting described
above.
The aim of the present study was to compare the effects of four different smart
phone tasks on driving performance. In particular, we were interested in two factors:
interaction medium (text vs image) and interaction type (self-paced vs experimenter-
paced). To achieve this end, drivers were asked to perform four different smart phone
tasks (in separate blocks) while also performing a car-following task in a driving
simulator: Text messaging with the experimenter (text/experimenter-paced), reading
Facebook posts (text/self-paced), exchanging photos with the experimenter via Snapchat
(image, experimenter-paced), and viewing updates on Instagram (image, self-paced). As
37
described below, these tasks were designed so that they required a comparable amount of
manual interaction and off-road glances. Drivers also performed a baseline driving
condition and their performance on the secondary tasks was assessed via post-driving
recognition tests. The experiment was designed to test the following predictions:
1. Driving performance would be impaired (e.g., significantly higher BRTs,
larger variance in TH) in all four smart phone conditions in comparison to
just driving
2. Impairments in driving performance would be significantly greater for the
text-based tasks (texting and Facebook) as compared to the image based
tasks (Snapchat and Instagram) due to the higher processing demands
required for the former (Paivo & Csapo, 1973).
3. Impairments in driving performance would be significantly less for the
self-paced tasks (Facebook and Instagram) as compared to the
experimenter-paced tasks (texting, Snapchat) because, as found in
previous studies, drivers would adapt their behavior to perform the self-
paced tasks in less dangerous intervals
Method
Participants
Eighteen undergraduates from Arizona State University participated for partial
fulfillment of an introductory psychology research requirement. All were native English
speakers with normal or corrected-to-normal vision with a valid driver’s license, were
right-handed and were smart phone users. Participants ranged in age from 18–22 years
38
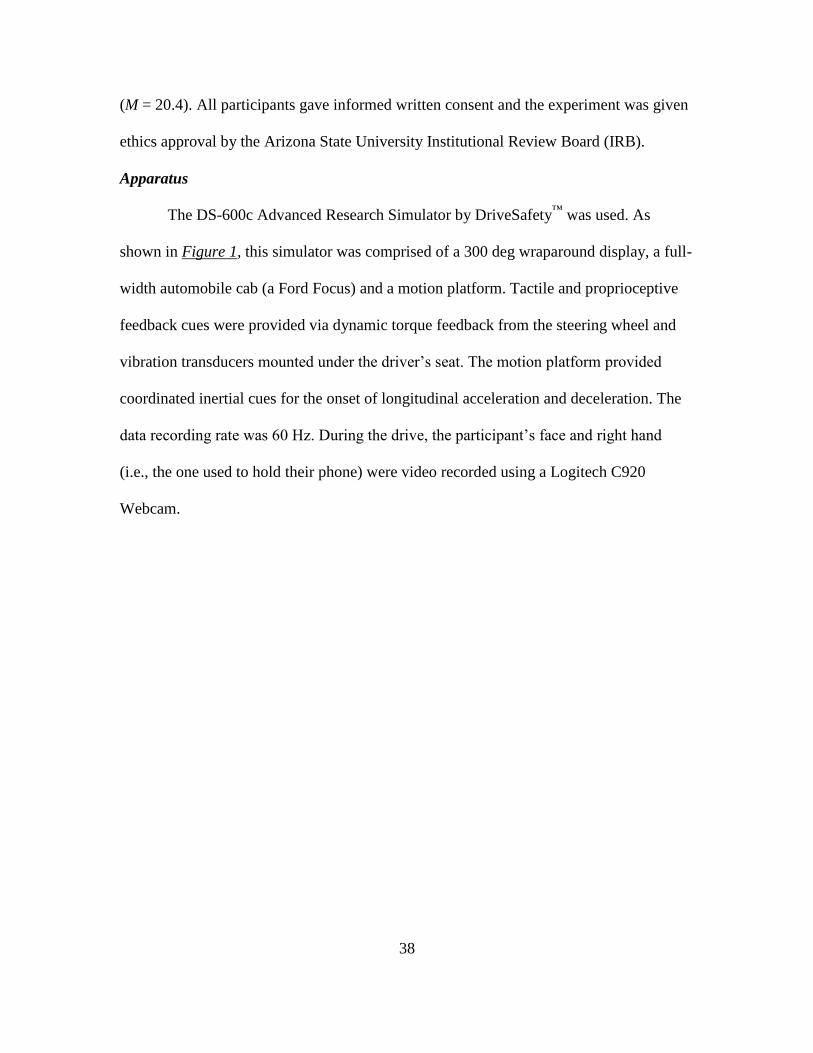
(M = 20.4). All participants gave informed written consent and the experiment was given
ethics approval by the Arizona State University Institutional Review Board (IRB).
Apparatus
The DS-600c Advanced Research Simulator by DriveSafety™
was used. As
shown in Figure 1, this simulator was comprised of a 300 deg wraparound display, a full-
width automobile cab (a Ford Focus) and a motion platform. Tactile and proprioceptive
feedback cues were provided via dynamic torque feedback from the steering wheel and
vibration transducers mounted under the driver’s seat. The motion platform provided
coordinated inertial cues for the onset of longitudinal acceleration and deceleration. The
data recording rate was 60 Hz. During the drive, the participant’s face and right hand
(i.e., the one used to hold their phone) were video recorded using a Logitech C920
Webcam.
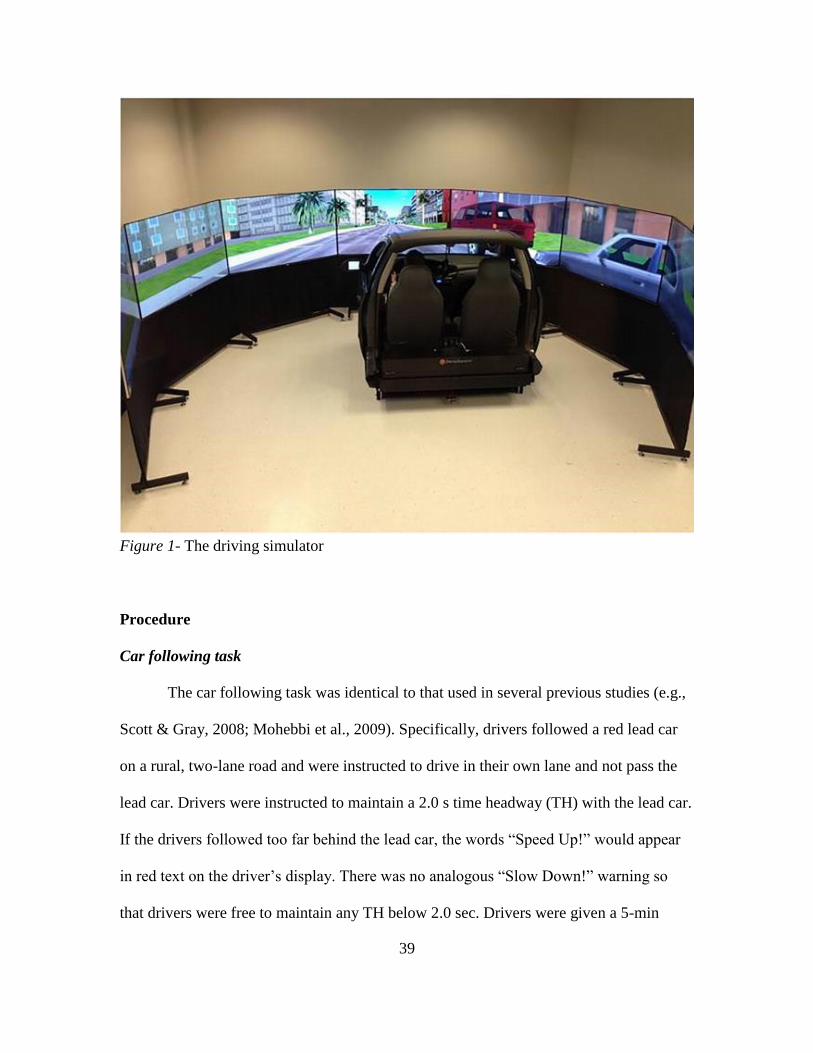
39
Figure 1- The driving simulator
Procedure
Car following task
The car following task was identical to that used in several previous studies (e.g.,
Scott & Gray, 2008; Mohebbi et al., 2009). Specifically, drivers followed a red lead car
on a rural, two-lane road and were instructed to drive in their own lane and not pass the
lead car. Drivers were instructed to maintain a 2.0 s time headway (TH) with the lead car.
If the drivers followed too far behind the lead car, the words “Speed Up!” would appear
in red text on the driver’s display. There was no analogous “Slow Down!” warning so
that drivers were free to maintain any TH below 2.0 sec. Drivers were given a 5-min
40
practice drives (with no secondary tasks) to become familiar with the driving simulator
and the car following task.
The lead car was programmed to unpredictably (to the driver) change speeds at
variable intervals. The lead car traveled between 55 and 65 mph (with an average speed
of 60 mph) with its speed determined by a sum of three sinusoids. The lead car was
programmed to make 8 unpredictable (to the driver) full stops at a -6 m/s2. The behavior
of the lead car made it very difficult for the driver to predict when the lead car would
speed up, slow down, or stop; creating multiple possible rear-end collision situations.
Intermittent opposing roadway traffic was included to more closely simulate real-world
rural driving conditions. If the participant contacted the lead vehicle (i.e., crashed) an
audio file of a crash sound was presented for a duration of 500 msec and lead vehicle
disappeared from the screen.
Each driver completed 5 driving tracks corresponding to the four smart phone
tasks plus the baseline driving condition. Each track had 10 unpredictable full stops of the
lead car, and required roughly 6–7 minutes to complete. The location of the stops was
randomly varied across tracks. Similar to our previous studies (e.g., Scott & Gray, 2008)
drivers always performed the baseline condition first. The order of the 4 smart phone
conditions was partially counterbalanced across participants. In particular, we ensured
that each of the 4 tasks occurred first and last for an equal number of participants.
Participants rested for 5 min between conditions to minimize simulator sickness and
fatigue.
41
Smart phone tasks
After the practice and baseline driving condition participants were next given
instructions about the four smart phone tasks. For all tasks, participants used their own
smart phone and were informed that they would be given a memory test about the content
of the task after the driving was complete. The tasks were designed to produce
comparable levels of manual interaction with the phone and off-road glances and these
variables were analyzed as described below. The four tasks were as follows.
Texting: In this condition, participants were told to imagine that they were selling
their own car on Craigslist and a potential buyer was contacting them to ask
questions. The experimenter then sent several questions (e.g., “what the make,
model and year of your vehicle, how long have you owned it?) to which the
participant was required to write a text response as they typically would respond.
Participants were sent a text once per minute.
Facebook: In this condition, participants were required to scroll through and read
the updates from a Facebook account made up by experimenters. All of the
updates were text only and included no images. Examples were: “A day without
sunshine is like, well, night” and “Whatever you are, be a good one.” There were
a total of 100 possible updates.
Instagram: In this condition, participants were required to scroll through and
view the updates on an Instagram account posted by the experimenters. All of the
updates were images with no text and there was 120 in total.
Snapchat: In this condition, participants were required to view an image sent by
the experimenter and then choose an image from the photo album on their phone
42
that matched in some way (e.g., sending a picture of a dog in response to being
sent a picture of a dog). Prior to the beginning of the experiment, participants
were sent 12 images by the experimenter to save on their phone. Participants were
sent an image once every 30 sec.
After each condition, participants completed the NASA-TLX workload
questionnaire as well as a recognition test. The recognition tests involved 10 images (for
the Snapchat and Instagram conditions) or 10 written statements (for the Facebook and
Texting conditions) in which only 5 items were actually used in the experiment and 5
were not. After completing the 5 tracks participants filled out a demographics sheet, were
debriefed and were given credit for their participation.
Data Analysis
To assess driving performance two dependent variables that have been shown to
be sensitive to distraction in previous studies, BRT and TH variability were used. To
compare the visual and manual demands of the smart phone tasks we calculated total on-
phone glance time and total time in which the participant’s thumb was in contact with
their phone for each condition. These data were analyzed using separate One-Way
Repeated Measures ANOVAs with task condition (baseline, texting, Facebook, Instagram
and Snapchat) as the factor. Planned comparisons were used to test hypotheses (ii) and
(iii) listed above. One-Way Repeated Measures ANOVAs were also performed for the
NASA-TLX and the recognition test data. For all results reported, statistical significance
is set at p<.05. Effect sizes were calculated using partial eta squared (ηp2) for ANOVAs
and Cohen's d for t-tests for all significant findings.
43
Results
Brake Reaction Times
Brake Reaction Times (BRT) Figure 2 shows the mean BRTs for the five
different driving conditions. The one-way ANOVA performance on these data revealed a
significant effect of condition, F(4, 68) = 5.93, p<.001, ηp2 = .26. The first planned
contrast indicated that the combined BRT for the text-based tasks (texting and Facebook,
Mean = 1.16 s) was significantly larger than the combined BRT for the image based tasks
(Snapchat and Instagram, Mean = .92 s), t(17) = 3.47, p = .001, d = 0.75. The second
planned contrast revealed that the combined BRT for the self-paced tasks (Facebook and
Instagram, Mean = 1.04) was not significantly different that the combined mean for the
experimenter-paced tasks (texting, Snapchat, Mean = 1.04), p>.9. Finally, post-hoc t-tests
(with Bonferroni correction, p = 0.0125) were used to compare each of the BRT in each
of the phones conditions with baseline driving. These tests revealed that, in comparison
to the baseline condition (Mean = 0.88 s), the mean BRT was significantly higher in the
Facebook (Mean = 1.18 s, t(17) = 3.30, p = 0.004, d = 1.2) and texting (Mean = 1.14 s,
t(17) = 3.40, p = 0.003, d = 1.15) conditions. The mean BRTs were not significantly
different from the baseline in either the Instagram (Mean = 0.89 s) or Snapchat (Mean =
0.95 s), p’s both >0.25, d’s both <0.25. Finally, there was no significant effect of
condition order on BRT, p>0.25.
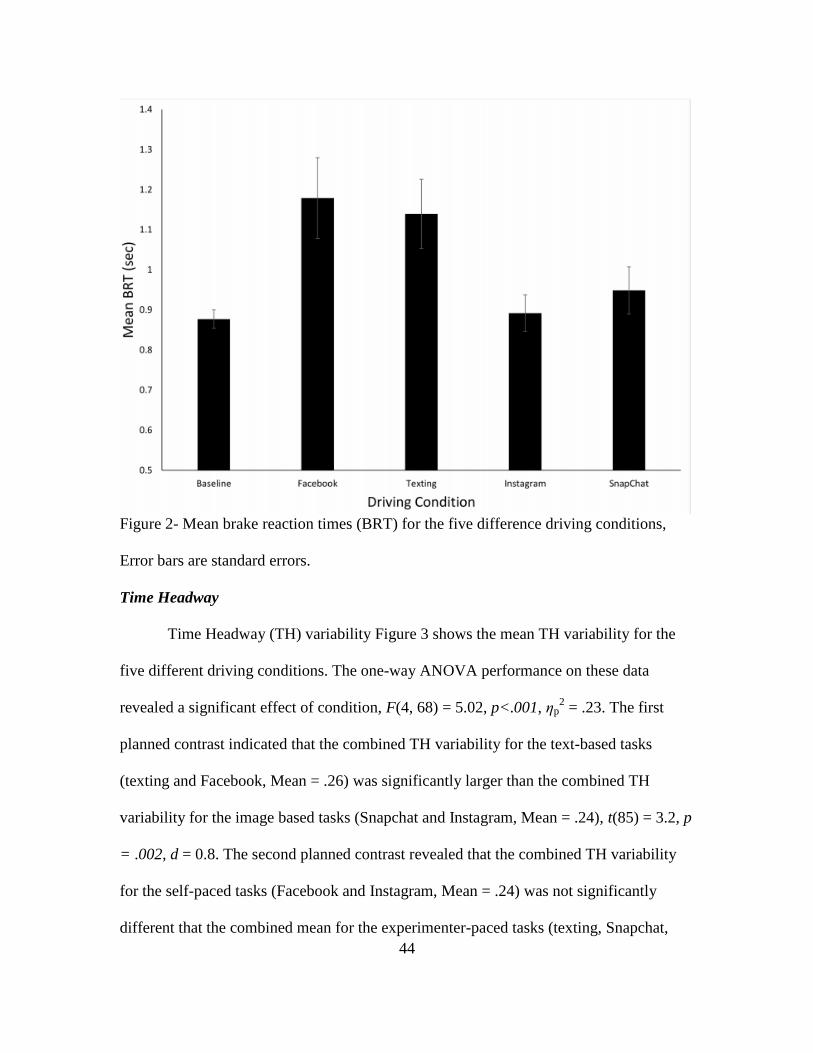
44
Figure 2- Mean brake reaction times (BRT) for the five difference driving conditions,
Error bars are standard errors.
Time Headway
Time Headway (TH) variability Figure 3 shows the mean TH variability for the
five different driving conditions. The one-way ANOVA performance on these data
revealed a significant effect of condition, F(4, 68) = 5.02, p<.001, ηp2 = .23. The first
planned contrast indicated that the combined TH variability for the text-based tasks
(texting and Facebook, Mean = .26) was significantly larger than the combined TH
variability for the image based tasks (Snapchat and Instagram, Mean = .24), t(85) = 3.2, p
= .002, d = 0.8. The second planned contrast revealed that the combined TH variability
for the self-paced tasks (Facebook and Instagram, Mean = .24) was not significantly
different that the combined mean for the experimenter-paced tasks (texting, Snapchat,

45
Mean = .24), p>.9. The post-hoc tests revealed that, in comparison to the baseline
condition (Mean = .23), the TH variability was significantly higher in the Facebook
(Mean = .26, t(17) = 2.97, p = 0.008, d = .71) and texting (Mean = .26, t(17) = 3.02, p =
0.007, d = .74) conditions. The mean TH variability was not significantly different from
the baseline in either the Instagram (Mean = .23) or Snapchat (Mean = .24), p’s both
>0.4, d’s both <0.2. Finally, there was no significant effect of condition order on TH
Variability, p>0.4.
Figure 3- Mean time headway variability (TH) for the five difference driving conditions.
Error bars are standard errors.
46
Gaze and Manual Interaction Behavior
The mean total on-phone glance times were 135.9 (SD = 26.0), 130.9 (SD =
30.1), 121.7 (SD = 27.2), and 146.4 (SD = 28.0) sec for the Facebook, texting, Instagram
and SnapChat conditions respectively. The one-way ANOVA performance on these data
revealed a non-significant effect of condition, p>0.1, ηp2 = .08. The mean total thumb-
phone contact times were 58.9 (SD = 10.3), 62.0 (SD = 16.7), 57.8 (SD = 19.3), and 54.2
(SD = 11.5) sec for the Facebook, texting, Instagram and SnapChat conditions
respectively. The one-way ANOVA performance on these data revealed a non-significant
effect of condition, p>0.25, ηp2 = .07
Questionnaire Data
Table 2 shows the means for mental, physical and temporal demand, as well as
task performance, required effort and overall frustration dimensions of the NASA-TLX
questionnaire. There was a significant effect of task condition on perceived physical
demand [F(4, 68) = 5.89,p = <0.001, ηp2 = .26] and perceived mental demand [F(4, 68) =
3.06, p = 0.022, ηp2 = .15]. As can be seen in Table 3, the baseline condition was rated as
easier than all of the other four conditions. There was no significant effect of task
condition for any of the other NASA-TLX dimensions.
A signal detection analysis was completed for each participant’s four recognition
tests and d-prime (d’) values were calculated. As can be seen in Table 3, the means for all
participants in each of the four task conditions are similar. A one-way ANOVA
performed on the mean d’ values revealed a non-significant effect of condition, p>0.05.
This non-significant effect implies that the tradeoff between the driving and phone tasks
was similar for all conditions.
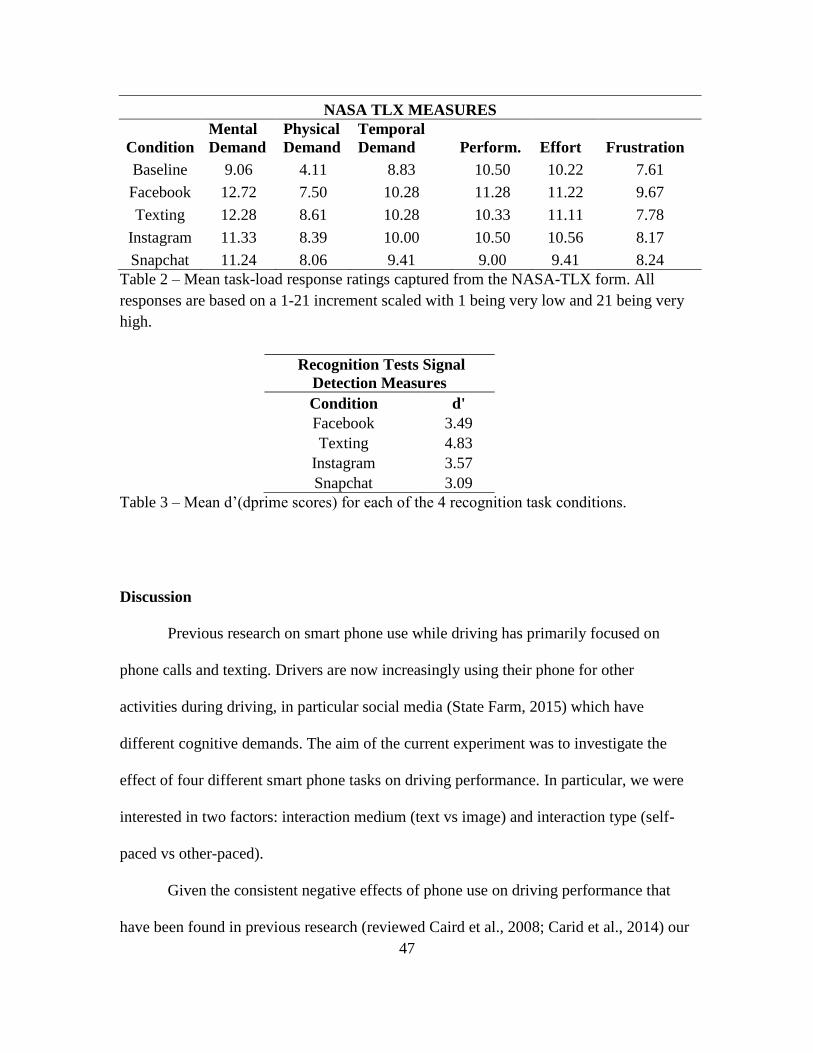
47
NASA TLX MEASURES
Condition
Mental
Demand
Physical
Demand
Temporal
Demand Perform. Effort Frustration
Baseline 9.06 4.11 8.83 10.50 10.22 7.61
Facebook 12.72 7.50 10.28 11.28 11.22 9.67
Texting 12.28 8.61 10.28 10.33 11.11 7.78
Instagram 11.33 8.39 10.00 10.50 10.56 8.17
Snapchat 11.24 8.06 9.41 9.00 9.41 8.24
Table 2 – Mean task-load response ratings captured from the NASA-TLX form. All
responses are based on a 1-21 increment scaled with 1 being very low and 21 being very
high.
Recognition Tests Signal
Detection Measures
Condition d'
Facebook 3.49
Texting 4.83
Instagram 3.57
Snapchat 3.09
Table 3 – Mean d’(dprime scores) for each of the 4 recognition task conditions.
Discussion
Previous research on smart phone use while driving has primarily focused on
phone calls and texting. Drivers are now increasingly using their phone for other
activities during driving, in particular social media (State Farm, 2015) which have
different cognitive demands. The aim of the current experiment was to investigate the
effect of four different smart phone tasks on driving performance. In particular, we were
interested in two factors: interaction medium (text vs image) and interaction type (self-
paced vs other-paced).
Given the consistent negative effects of phone use on driving performance that
have been found in previous research (reviewed Caird et al., 2008; Carid et al., 2014) our
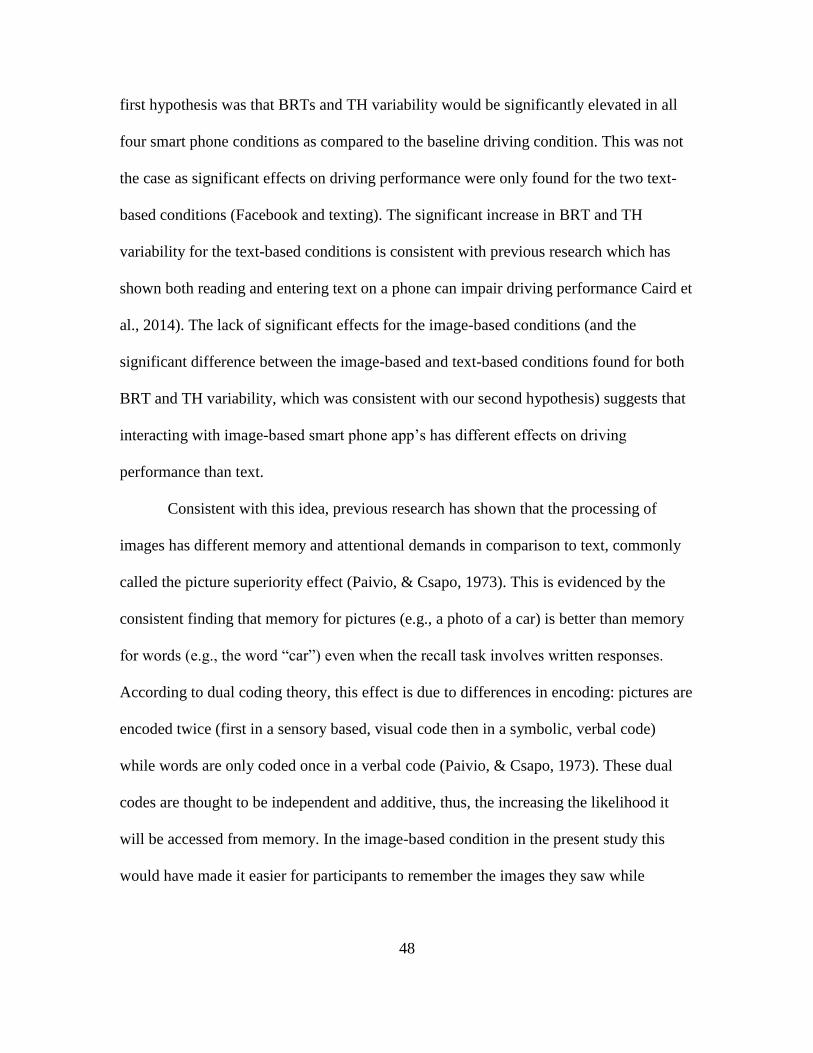
48
first hypothesis was that BRTs and TH variability would be significantly elevated in all
four smart phone conditions as compared to the baseline driving condition. This was not
the case as significant effects on driving performance were only found for the two text-
based conditions (Facebook and texting). The significant increase in BRT and TH
variability for the text-based conditions is consistent with previous research which has
shown both reading and entering text on a phone can impair driving performance Caird et
al., 2014). The lack of significant effects for the image-based conditions (and the
significant difference between the image-based and text-based conditions found for both
BRT and TH variability, which was consistent with our second hypothesis) suggests that
interacting with image-based smart phone app’s has different effects on driving
performance than text.
Consistent with this idea, previous research has shown that the processing of
images has different memory and attentional demands in comparison to text, commonly
called the picture superiority effect (Paivio, & Csapo, 1973). This is evidenced by the
consistent finding that memory for pictures (e.g., a photo of a car) is better than memory
for words (e.g., the word “car”) even when the recall task involves written responses.
According to dual coding theory, this effect is due to differences in encoding: pictures are
encoded twice (first in a sensory based, visual code then in a symbolic, verbal code)
while words are only coded once in a verbal code (Paivio, & Csapo, 1973). These dual
codes are thought to be independent and additive, thus, the increasing the likelihood it
will be accessed from memory. In the image-based condition in the present study this
would have made it easier for participants to remember the images they saw while
49
scrolling in Instagram and the images they have saved in their photo album, thus reducing
the demands of the task consistent with this idea.
Contrary to our third hypothesis, there was no significant effect of pacing of the
phone task (self vs other) on driving performance. The rationale behind this prediction
was previous research which has shown that when drivers engage in self-paced tasks they
are more likely to adapt their driving behaviors to engage in the secondary task when
conditions were deemed as more “safe,” such as when stopped at a red light or before
entering an attention demanding situation Ahlstrom et al., 2015; Metz et al., 2014; Liang
et al., 2014). We would argue that the most likely reason for the lack a pacing effect in
the present study was the nature of the car-followed task used in our study. The task was
a highly dynamic, continuous control task in which there were no clear break periods
(e.g., stop lights or stretches of road with no traffic) which the driver could use for the
phone tasks. For the entire duration of the trial participants were required to maintain a 2
sec TH with vehicle undergoing regular changes in speed and fairly frequent sudden
stops. Therefore, there was very limited opportunity for adaptation of driving behavior. It
will be important for future research to investigate whether similar effects occur when
self-paced adaption is more feasible.
The present study used the task of car following, a driving behavior that has been
modeled in several previous studies, therefore, it is interesting to consider how such
models might be used to understand driver distraction in this situation. First, it has been
proposed in recent models that car following behavior depends on a driver’s memory for
the speed and position at a previous time period (e.g., Yu & Shi, 2015; Yu & Shi, 2015;
Tang, Huang, Zhao & Xu, 2009). Since it well know that memory is strongly linked to
50
attention (review in (Fougine, 2008)), it is likely that distraction from using a smart
phone (which takes a driver’s attention away from the road) will alter this specific
parameter of the model. Second, it has been shown that traffic forecasting information
providing by intelligent transportation systems can have a direct effect on car following
behavior (Tang, Li & Huang, 2010), therefore, it would be interesting to investigate
whether drivers might use such information to mitigate the effects of distraction (e.g., by
deciding when to engage in smart phone tasks). Finally, since most car following models
used parameters such as time headway, speed and reaction time (e.g., Jiang, Wu & Zhu,
2001) that were shown to be influenced by distraction in the present study, it will be
important for future research to attempt to explain and predict the effects of distraction on
car following by directly applying such models.
The findings of the present experiment were limited by certain constraints
imposed through the simulation paradigm (Ho et al., 2014) First, the drivers in the
present experiment were fully expecting the lead car to stop suddenly, so driver responses
recorded in this simulation were likely faster than can be expected in a real driving
situation. However, it is reasonable to expect that the relative differences in BRT between
the different conditions would be the same in real driving. Nonetheless, this needs to be
tested empirically. Second, although we attempt to match the smart phone tasks in terms
of demands, it is possible that the differences between conditions were not solely due to
the differences in interaction medium and pace between conditions. Future research is
needed in which warnings occur at a much lower frequency.
On a practical level, the present findings suggest that image-based interfaces may
provide a relatively safer ways for people to “stay connected” (e.g., interact with social
51
media, instant message friends, etc.) while driving as compared to text-based interfaces–
a function that drivers increasingly want in their vehicle (State Farm, 2015).. In the
present study, viewing image updates and exchanging images with another person on a
smart phone did not have any significant effects on driving performance. Since an
auditory analog of the picture superiority effect has also been found (e.g., a ringing sound
is remembered better than the word “ringing”, (Crutcher, & Beer, 2011), it will be
interesting for future research to investigate whether earcons (Blattner, Sumikawa &
Greenberg, 1989) have a similar advantage over talking over a phone in terms of driver
distraction.
52
References
Ahlstrom, C., Kircher, K., Thorslund, B., & Adell, E. (2016). Bicyclists’ visual strategies
when conducting self-paced vs. system-paced smartphone tasks in
traffic. Transportation research part F: traffic psychology and behaviour, 41,
204-216.
Basacik, D., Reed, N., & Robbins, R. (2012). Smartphone use while driving: a simulator
study (No. PPR592)
Blattner, M. M., Sumikawa, D. A., & Greenberg, R. M. (1989). Earcons and icons: Their
structure and common design principles. Human–Computer Interaction, 4(1), 11-
44.
Caird, J. K., Johnston, K. A., Willness, C. R., Asbridge, M., & Steel, P. (2014). A meta-
analysis of the effects of texting on driving. Accident; Analysis and
Prevention, 71, 311-318. doi:10.1016/j.aap.2014.06.005
Caird, J. K., Willness, C. R., Steel, P., & Scialfa, C. (2008). A meta-analysis of the
effects of cell phones on driver performance. Accident Analysis &
Prevention, 40(4), 1282-1293.
Craik, F. I., & Lockhart, R. S. (1972). Levels of processing: A framework for memory
research. Journal of verbal learning and verbal behavior, 11(6), 671-684.
Distracted Driving. (2015, January 5). Retrieved April 28, 2015, from
https://www.aaafoundation.org/distracteddriving?gclid=CK3QqYT3qsUCFUuTfg
odD7sA3g
Crutcher, R. J., & Beer, J. M. (2011). An auditory analog of the picture superiority
effect. Memory & cognition, 39(1), 63-74.
Distracted Driving Facts & Stats. (2015, January 5). Retrieved April 28, 2015, from
https://www.childrenshospital.vanderbilt.org/services.php?mid=10638
Drews, F. A., Yazdani, H., Godfrey, C. N., Cooper, J. M., & Strayer, D. L. (2009). Text
messaging during simulated driving. Human Factors: The Journal of the Human
Factors and Ergonomics Society, 51(5), 62-762. doi:10.1177/0018720809353319
Fitch, G. M., Soccolich, S. A., Guo, F., McClafferty, J., Fang, Y., Olson, R. L., ... &
Dingus, T. A. (2013). The impact of hand-held and hands-free cell phone use on
driving performance and safety-critical event risk (No. DOT HS 811
757).
53
Fougine D. (2008). The relationship between attention and working memory. In
Johansen, N. B. (Ed.). (2008). New research on short-term
memory. Nova Science Pub Incorporated.
Gray, R. (2011). Looming auditory collision warnings for driving. Human Factors: The
Journal of the Human Factors and Ergonomics Society, 53(1), 63-74
Hatfield, J., & Murphy, S. (2007). The effects of mobile phone use on pedestrian crossing
behaviour at signalised and unsignalised intersections. Accident analysis &
prevention, 39(1), 197-205.
He, J., Chaparro, A., Nguyen, B., Burge, R. J., Crandall, J., Chaparro, B., ... & Cao, S.
(2014). Texting while driving: Is speech-based text entry less risky than handheld
text entry?. Accident Analysis & Prevention, 72, 287-295.
Ho, C., Gray, R., & Spence, C. (2014). To what extent do the findings of laboratory-
based spatial attention research apply to the real-world setting of driving? IEEE
Transactions on Human-Machine Systems, 44, 524-530
Hosking, S. G., Young, K. L., & Regan, M. A. (2009). The effects of text messaging on
young drivers. Human Factors: The Journal of the Human Factors and
Ergonomics Society, 51(4), 582-582. doi:10.1177/0018720809341575
Jiang, R., Wu, Q., & Zhu, Z. (2001). Full velocity difference model for a car-following
theory. Physical Review E, 64(1), 017101.
Kujala T. (2013). Browsing the information highway while driving—Three in-vehicle
touch screen scrolling methods and driver distraction. Personal and Ubiquitous
Computing, 17, 815–823. 10.
Kujala T, Saariluoma P. (2011). Effects of menu structure and touch screen scrolling
method on the variability of in-vehicle glance durations during in-vehicle visual
Lee, J. (2014). Integrating the saliency map with distract-r to assess driver distraction of
vehicle displays (Doctoral dissertation, THE UNIVERSITY OF WISCONSIN-
MADISON).
Liang, Y., Horrey, W. J., & Hoffman, J. D. (2014). Reading Text While Driving
Understanding Drivers’ Strategic and Tactical Adaptation to Distraction. Human
Factors: The Journal of the Human Factors and Ergonomics Society,
0018720814542974.Paivio A, Csapo K (1973)
Metz, B., Landau, A., & Just, M. (2014). Frequency of secondary tasks in driving–
Results from naturalistic driving data. Safety science, 68, 195-203.
54
Mohebbi, R., Gray, R., & Tan, H. Z. (2009). Driver reaction time to tactile and auditory
rear-end collision warnings while talking on a cell phone. Human Factors, 51(1),
102-110.
Saiprasert, C., Supakwong, S., Sangjun, W., & Thajchayapong, S. (2014). Effects of
smartphone usage on driver safety level performance in urban road conditions. 1-
6. doi:10.1109/ECTICon.2014.6839778
Salvucci, D. D., Zuber, M., Beregovaia, E., & Markley, D. (2005, April). Distract-R:
Rapid prototyping and evaluation of in-vehicle interfaces. In Proceedings of the
SIGCHI conference on Human factors in computing systems (pp. 581-589). ACM.
Scott, J. J., & Gray, R. (2008). A comparison of tactile, visual, and auditory warnings for
rear-end collision prevention in simulated driving. Human factors, 50(2), 264-
275.
Six Annual State Farm Distracted Driving Survey (2014). Available
http://www.multivu.com/players/English/7292854-state-farm-distracted-driving-
survey cellphone-use/
Tang, T. Q., Huang, H. J., Zhao, S. G., & Xu, G. (2009). An extended OV model with
consideration of driver's memory. International Journal of Modern Physics
B, 23(05), 743-752.
Tang, T. Q., Li, C. Y., & Huang, H. J. (2010). A new car-
following model with the consideration of the driver's forecast effect. Physics
Letters A, 374(38), 3951-3956.
Weldon, M. S., Roediger, H. L., & Challis, B. H. (1989). The properties of retrieval cues
constrain the picture superiority effect. Memory & Cognition, 17(1), 95-105.
Young, K. L., Rudin-Brown, C. M., Patten, C., Ceci, R., & Lenné, M. G. (2014). Effects
of phone type on driving and eye glance behaviour while text-messaging. Safety
Science, 68, 47-54. doi:10.1016/j.ssci.2014.02.018
Yu, S., & Shi, Z. (2015). An extended car-following model considering vehicular gap
fluctuation. Measurement, 70, 137-147.
Yu, S., & Shi, Z. (2015). An improved car-following model considering headway
changes with memory. Physica A: Statistical Mechanics and its
Applications, 421, 1-14.
55
CHAPTER 3
EXPERIMENT TWO-A Comparison of Different Smart Phone Based
Applications for Mitigating Driver Distraction
Background
Distraction from smart phones while driving is an ever increasing problem in our
society. According to a recent ATT&T study, it was found that 70% of drivers engage in
smart phone activities such as texting (61%), emailing (33%) and even social networking,
mainly checking Facebook (27%) while driving (ATT&T, 2015). Previous research has
demonstrated negative effects produced when drivers talk on a phone while driving
(Caird et al., 2008), text on a phone while driving (Caird et al., 2014) and more recently
when they engage in social media applications (app’s) on their smart phone (i.e.,
Facebook and Instagram) while driving (Basacik, Reed and Robbins, 2012; McNabb &
Gray, 2016, Experiment 1). These effects include delayed brake reaction time (RT) to
collision events and impaired lane position and headway regulation. Depending on the
nature of the task being performed, smart phone use can produce manual, visual and/or
cognitive distraction (Strayer, 2015).
In response to this problem, several smart phone app’s have recently been
developed which attempt to regulate a driver’s use of their smart phone in some way with
a particularly focus on texting (e.g., Drive Now Text Later, DriveSafe Mode, Live2Txt).
In addition, it has been suggested that a special “driving mode” (similar to the existing
“airplane mode”) be a built-in feature of all phones (Simons & Chabris, 2015). These
interventions typically run in the background by linking to the driver’s GPS system and
automatically activating when a threshold speed (e.g. 10 mph) is reached. When the
56
threshold is reached, incoming calls and texts are blocked and the sender is typically sent
a message that the driver is unable to respond. When the driving speed goes below the
threshold (e.g., if the vehicle is stopped at a red light), the messages are allowed to come
through and the driver can then check them. Although well intentioned, there are several
important limitations with these app’s. First, it seems unlikely that the large proportion of
drivers that want to use their phone during driving (ATT&T, 2015), will voluntarily use
an app that will prevent this. Consistent with this idea, it has been shown that even when
drivers experience the benefits of driver-related smart phone applications as research
participants, they stop using the app almost immediately after the study is concluded
(Musicant & Lotan, 2016, Botzer, Musicant & Perry, 2017). Drivers have identified
several issues related to the reluctance to use these apps including potential draining of
the phone battery, use of their data allowance, and dislike of being monitored and
restricted. Second, these types of app’s have the potential to drain the user’s phone
battery and/or use of their data allowance. Finally, and most importantly, the design of
these app’s raise some other possible human factors issues.
First, even when the message blocking in these app’s is activated it is still likely
that the driver will be alerted that they have received a message. For example, visual
notifications (e.g., from an iPhone’s notification center) are not fully disabled in most of
these app’s and some app’s still allow auditory and vibration notifications. It has recently
been shown that receiving a message notification can be distracting and result in impaired
performance on an attentional-demanding task, even when participants did not directly
interact with their smart phone during the task (Stothart, Mitchum & Yehnert, 2015).
The authors proposed that notifications can prompt task-irrelevant thoughts and mind
57
wandering which are also known to impair driving performance (Yanko & Spalek, 2013).
It is possible that this mind wandering will result in more sustained distraction as
compared to if the driver were just allowed to check the message in the first place.
A second potential problem could arise when a driver’s speed drops below the
threshold level and messages are allowed through. If they have been driving for a long
time and/or are highly active on social media it is possible that they could be inundated
with several messages. If they are checking these at a red light these could in turn lead to
slower reaction time to the light changing green and/or impaired awareness of the traffic
environment at the intersection.
The goal of the present study was to compare different smart phone mitigation
methods in a driving simulator. In an attempt to re-create the natural desire drivers have
to check their own personal messages, participants were asked to perform a riddle task
while driving. Specifically, they received texts from the experimenter which were each
clues to a riddle that had to be solved at the end of the drive. The five conditions were as
follows:
Baseline – participants drove around the simulated environment without their
smart phone. They were asked to make sure their phone was on silent and not to bring it
in the vehicle with them.
Airplane Mode – participants drove with their phone sitting face down on the
passenger seat and set in airplane mode (i.e., no messages or notifications). They were
told that they would be receiving messages to the riddle that could be checked once the
drive was completed.
58
On Mode – participants drove with their phone as the normally do while driving
and fully activated. They were told that they could check the incoming text messages
whenever they wished.
Notifications Only Mode - participants drove with their phone face down on the
passenger seat and fully activated. However, they were instructed not to check their
messages until after the drive was complete.
Check at Stop Mode - participants drove with their phone face down on the
passenger seat and fully activated. However, they were instructed to only check their
messages when they were stopped (e.g., at a red light). The experiment was designed to
test the following predictions:
(i) Driving performance would be impaired (e.g., significantly higher
speeds and lane position variability) in On, Notifications Only and
Check at Stop modes relative to the other conditions due to mind
wandering,
(ii) Impairments in driving performance would be significantly greater
for conditions in which drivers were physically allowed to check
messages while driving (On and Red Light) as compared when
they could not (Airplane and Notifications Only) due to the added
visual and manual distraction and
(iii) Driving performance in stopping situations would be impaired
(i.e., longer wait times and slower reaction times) in the Check at
Stop condition.
59
Methods
Participants
Fifteen undergraduates (mean age=20.1) from Arizona State University
participated for partial fulfillment of an introductory psychology research requirement.
All were native English speakers with normal or corrected-to-normal vision with a valid
driver’s license and were smart phone users.
Apparatus
The same apparatus was used as in Experiment 1, (Chapter 2).
Procedure
Driving Task
In all conditions, drivers were asked to drive in a simulated city environment and
were instructed to drive as they normally would while following auditory turn
instructions from a navigation system. They were further instructed to obey the posted
speed limit (30 mph) at all times. Intermittent opposing roadway traffic was included to
more closely simulate real-world driving conditions. Each drive lasted roughly 7 minutes.
Drivers were given a 5-min practice to become familiar with the driving simulator
before the experimental conditions began. The order of conditions was partially counter-
balanced across drivers.
Riddle Task
Drivers were instructed that in the experimental conditions they would be asked to
solve a riddle at the end of each drive. They were further instructed that they would be
receiving the clues to the riddle via text messages sent by the experimenter to their smart
phone which they may or may not be able to check (and begin thinking about the
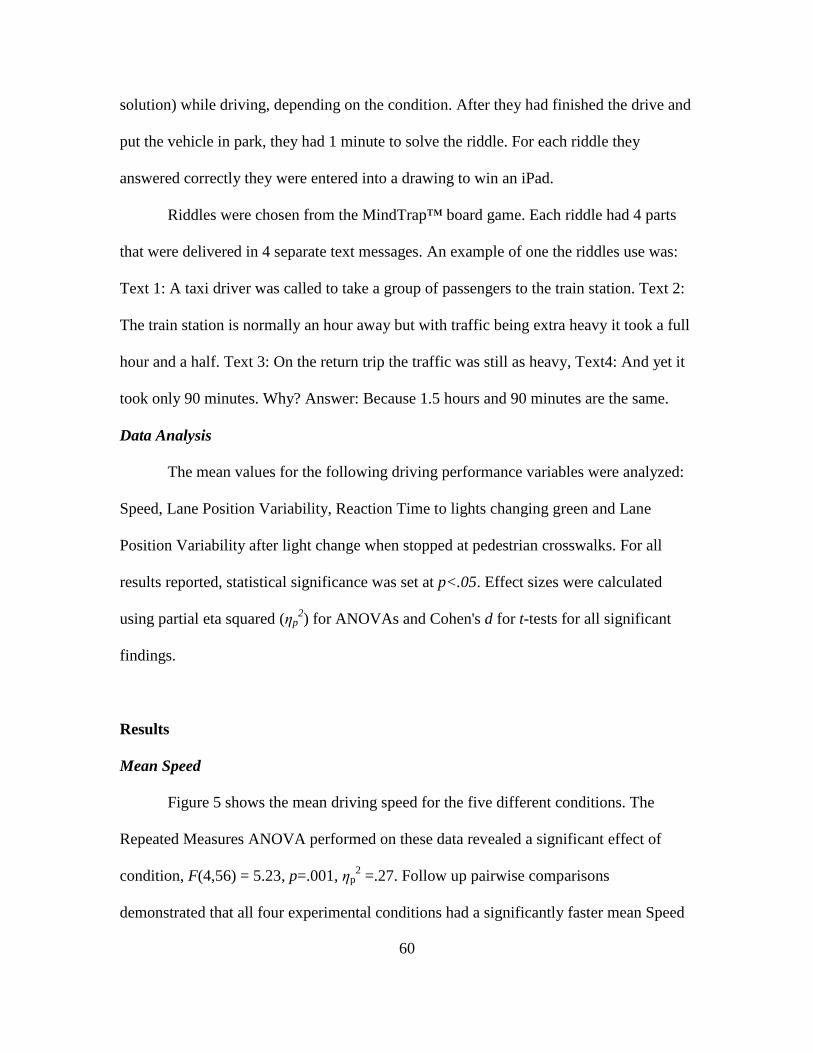
60
solution) while driving, depending on the condition. After they had finished the drive and
put the vehicle in park, they had 1 minute to solve the riddle. For each riddle they
answered correctly they were entered into a drawing to win an iPad.
Riddles were chosen from the MindTrap™ board game. Each riddle had 4 parts
that were delivered in 4 separate text messages. An example of one the riddles use was:
Text 1: A taxi driver was called to take a group of passengers to the train station. Text 2:
The train station is normally an hour away but with traffic being extra heavy it took a full
hour and a half. Text 3: On the return trip the traffic was still as heavy, Text4: And yet it
took only 90 minutes. Why? Answer: Because 1.5 hours and 90 minutes are the same.
Data Analysis
The mean values for the following driving performance variables were analyzed:
Speed, Lane Position Variability, Reaction Time to lights changing green and Lane
Position Variability after light change when stopped at pedestrian crosswalks. For all
results reported, statistical significance was set at p<.05. Effect sizes were calculated
using partial eta squared (ηp2) for ANOVAs and Cohen's d for t-tests for all significant
findings.
Results
Mean Speed
Figure 5 shows the mean driving speed for the five different conditions. The
Repeated Measures ANOVA performed on these data revealed a significant effect of
condition, F(4,56) = 5.23, p=.001, ηp2 =.27. Follow up pairwise comparisons
demonstrated that all four experimental conditions had a significantly faster mean Speed
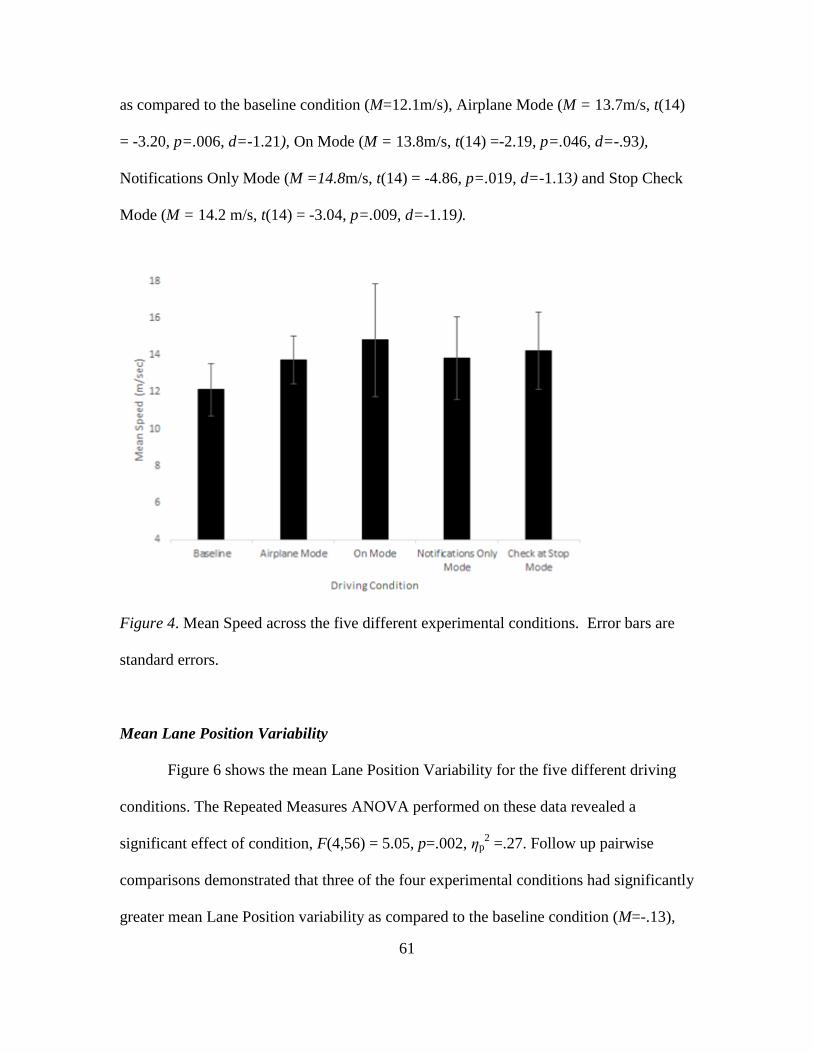
61
as compared to the baseline condition (M=12.1m/s), Airplane Mode (M = 13.7m/s, t(14)
= -3.20, p=.006, d=-1.21), On Mode (M = 13.8m/s, t(14) =-2.19, p=.046, d=-.93),
Notifications Only Mode (M =14.8m/s, t(14) = -4.86, p=.019, d=-1.13) and Stop Check
Mode (M = 14.2 m/s, t(14) = -3.04, p=.009, d=-1.19).
Figure 4. Mean Speed across the five different experimental conditions. Error bars are
standard errors.
Mean Lane Position Variability
Figure 6 shows the mean Lane Position Variability for the five different driving
conditions. The Repeated Measures ANOVA performed on these data revealed a
significant effect of condition, F(4,56) = 5.05, p=.002, ηp2 =.27. Follow up pairwise
comparisons demonstrated that three of the four experimental conditions had significantly
greater mean Lane Position variability as compared to the baseline condition (M=-.13),
62
On Mode (M =-.33, t(14) = 3.89, p=.002, d=-.86), Notifications Only Mode (M =-.38,
t(14) = 3.07, p=.008, d=-.81) and Stop Check Mode (M = -.37, t(14) = 5.07, p=.000, d=-
1.06) were significant while Airplane Mode was approaching significance (M = -.25,
t(14) = 1.80, p=.094, d=-.47),
Figure 5. Mean Lane Position Variability across the five different experimental
conditions. Error bars are standard errors.
Red Light & Pedestrian Delays
Figure 7 shows the mean Reaction Time (i.e., accelerator response) after the
signal light turned to green for the different driving conditions.
The Repeated Measures ANOVA performed on these data revealed a significant
effect of condition, F(3,56) = 19.71, p=.000, ηp2 =.59. Follow up pairwise comparisons
demonstrated that as compared to the baseline condition (M = 2.03 s) only drivers in the
Stop Check Mode had significantly longer Reaction Times to the green light change (M =
3.63 s, t(14) = -7.12, p=.000, d=-2.23) than all other conditions, Airplane Mode (M =
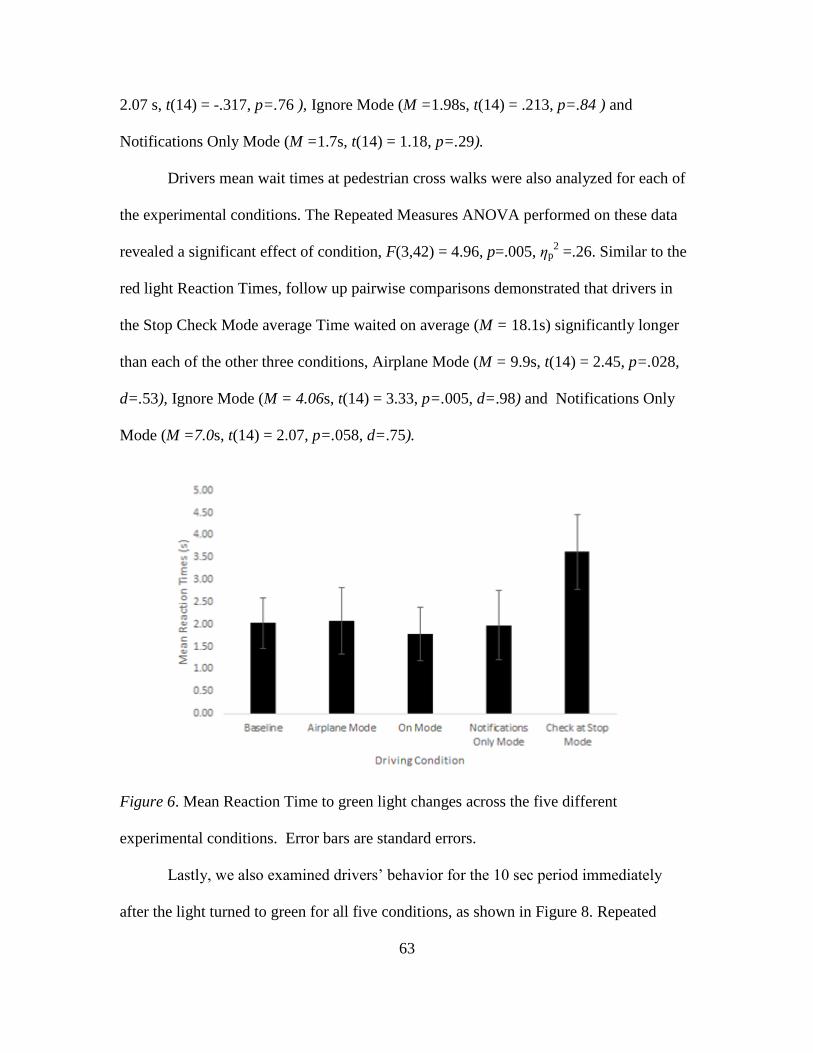
63
2.07 s, t(14) = -.317, p=.76 ), Ignore Mode (M =1.98s, t(14) = .213, p=.84 ) and
Notifications Only Mode (M =1.7s, t(14) = 1.18, p=.29).
Drivers mean wait times at pedestrian cross walks were also analyzed for each of
the experimental conditions. The Repeated Measures ANOVA performed on these data
revealed a significant effect of condition, F(3,42) = 4.96, p=.005, ηp2 =.26. Similar to the
red light Reaction Times, follow up pairwise comparisons demonstrated that drivers in
the Stop Check Mode average Time waited on average (M = 18.1s) significantly longer
than each of the other three conditions, Airplane Mode (M = 9.9s, t(14) = 2.45, p=.028,
d=.53), Ignore Mode (M = 4.06s, t(14) = 3.33, p=.005, d=.98) and Notifications Only
Mode (M =7.0s, t(14) = 2.07, p=.058, d=.75).
Figure 6. Mean Reaction Time to green light changes across the five different
experimental conditions. Error bars are standard errors.
Lastly, we also examined drivers’ behavior for the 10 sec period immediately
after the light turned to green for all five conditions, as shown in Figure 8. Repeated
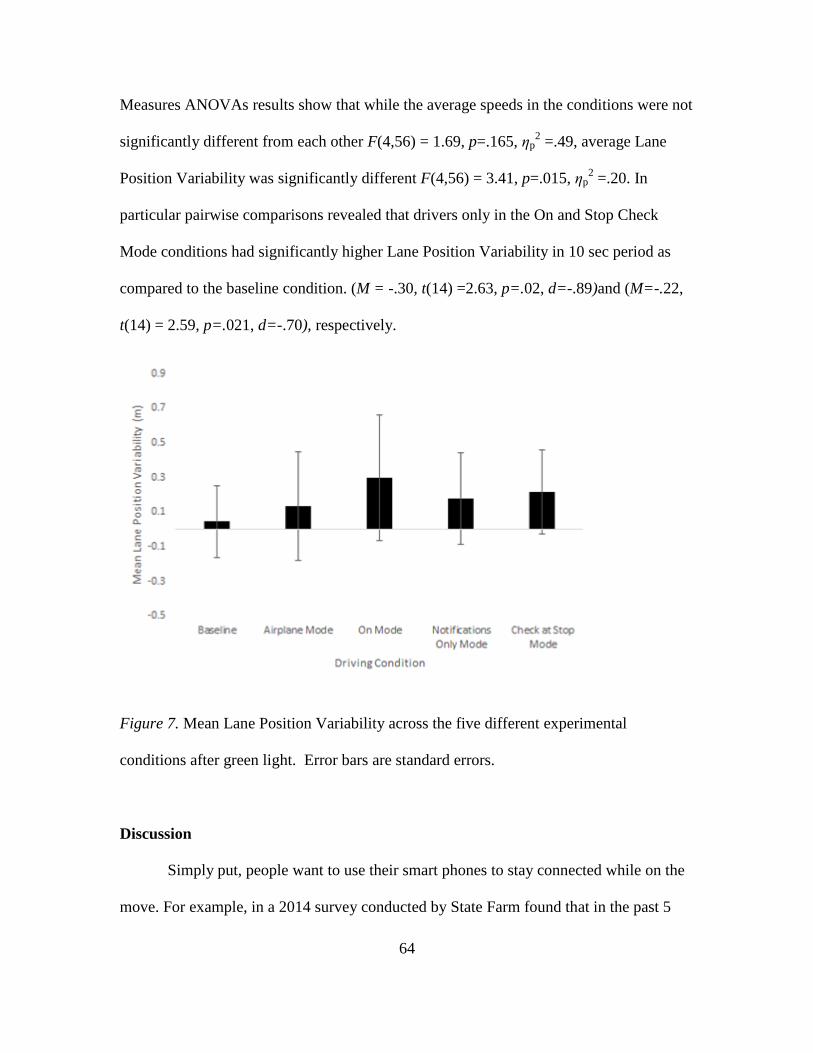
64
Measures ANOVAs results show that while the average speeds in the conditions were not
significantly different from each other F(4,56) = 1.69, p=.165, ηp2 =.49, average Lane
Position Variability was significantly different F(4,56) = 3.41, p=.015, ηp2 =.20. In
particular pairwise comparisons revealed that drivers only in the On and Stop Check
Mode conditions had significantly higher Lane Position Variability in 10 sec period as
compared to the baseline condition. (M = -.30, t(14) =2.63, p=.02, d=-.89)and (M=-.22,
t(14) = 2.59, p=.021, d=-.70), respectively.
Figure 7. Mean Lane Position Variability across the five different experimental
conditions after green light. Error bars are standard errors.
Discussion
Simply put, people want to use their smart phones to stay connected while on the
move. For example, in a 2014 survey conducted by State Farm found that in the past 5
65
years the number of people aged 18-29 that use social media while driving doubled from
21 to 42% (State Farm, 2014). This is, however, worsening one of the single biggest
human factor problems in society today: driver distraction (Strayer, 2015). How can we
satisfy the conflicting forces of connectivity-on-the-go and safe mobility?
An approach that has become popular in more recent years is the development of
smart phone app’s which somehow alter the way in which information is delivered to the
driver (i.e., silencing or blocking an incoming message). Unfortunately, these types of
app’s have potential to introduce safety problems of their own. For instance, if the driver
places their smart phone within viewing distance, the incoming messages may still be
visually displayed on the screen (i.e., the notifications bar of an iPhone) and additionally
some app’s may not completely silence the incoming alert sound. Most concerning is
how the speed threshold operates. For example, when a driver is stopped at red lights or
slowed down due to traffic the app interprets the driver as having stopped. This could
potentially causing the phone to be inundated with messages although they are still
behind the wheel. This could result in delayed reactions/impaired situation awareness
when a driver at a routine stop attempts to read a large number of messages during
various traffic stops. Lastly, these app’s may exacerbate off-task, mind wandering
thoughts when drivers feel restricted and inhibited from receiving messages as well as
contribute to distracted driving. The goal of the present study was to evaluate these
specific issues associated with safe driving app’s.
Unexpectedly, in the present study, driving performance was significantly (and
negatively) affected in all conditions for which drivers had their phone in the car,
regardless of the mode. In particular, both driving speed and lane position variability
66
were significantly higher as compared to the baseline condition in which the driver did
not have their phone. We would argue that most likely explanation for this effect is that
drivers in the present study engaged in off-task thoughts about potential messages. For
instance, the observed negative effects in the Airplane, Notifications Only and Check at
Stop modes were most likely due to the cognitive resources taken up by off-task thoughts
about what messages they would be receiving i.e., participants knew that were receiving
message relevant to the riddle task but were not allowed to check them. These findings
are consistent with a recent study showing that the cognitive distraction imposed by a
simple alert, not the physical interaction with the smart phone can influence performance
on a sustained attention task (Yanko & Spalek, 2013; Stothart et al., 2015). For the On
mode, it is likely that negative effects observed were due to both the visual and manual
distraction produced by the driver physically interacting with their phone while driving,
consistent with previous research on texting and driving (Caird et al., 2014).
As predicted, allowing drivers to check stored messages at traffic stops produced
negative effects on driving performance. Specifically, driver’s reaction times to green
lights and wait times at crossings were significantly longer for the Check at Stop mode
than all other conditions. Furthermore, after participants finished checking their messages
and began driving the overall average Speeds for each condition remained consistent
whereas lane position variability was negatively impacted. Only the Check at Stop mode
and On mode lane position variability were significantly different from the Baseline
mode reflecting that restricted drivers receiving messages at the stop light suffer the same
performance decrements drivers that have no imposed phone restrictions. These findings
are consistent with previous research that engaging with a smart phone, even if only at
67
stop lights may contribute to inattentional blindness or in more extreme cases a loss of
situational awareness as demonstrated by delays in reaction times to relevant traffic
situations (Caird et al., 2014).
In summary, the present study provides evidence that the presence of a smart
phone in a driver’s vehicle, regardless of a driver’s physical interaction with the device,
can be distracting, enough so, as to negatively impact a drivers driving performance (i.e.,
Speed, Lane Position Variability, RT’s). Surprisingly, even the expectancy of receiving
an important message, without an auditory notification seems to create enough cognitive
distraction through mind-wandering to impact a driver’s performance. Paradoxically,
when drivers are restricted to only looking at their incoming messages at red lights or
crossings they may become so overly absorbed with their phones they actually suffer the
same or worse performance decrements as an unrestricted driver. In sum, app’s which
restrict incoming messages in some manner do not seem to an effective method for
mitigating driver distraction problems
68
CHAPTER 4
Experiment Three- Informative Warnings at the Source of Distraction
Background
Driver distraction has contributed to accidents on the roadways since the
introduction of vehicles (Graham-Little, 1934). Over time, as technology has progressed,
distractions from smart phones have become one of the biggest concerns regarding driver
safety. While drivers are not likely to admit that they use their smart phone while driving,
it was revealed that a majority of drivers have confidence in their own abilities to use
their phone while driving although ironically they fear other driver’s capabilities relative
to their own (Sanbonmatsu, Strayer, Behrends, Ward & Watson, 2016). Furthermore, as
shown in Experiment 2, when a driver’s smart phone is put away, there can still be
cognitive mind-wandering disturbances that hinder driving performance, as driver’s may
experience a phenomenon known as a Fear of Missing Out (FoMO) (Przybylski,
Murayama, DeHaan & Gladwell, 2013). Driver’s experiencing FoMO while driving may
be preoccupied by various thoughts about what they could be missing out on such as the
most recent social updates, current events or work related activities (Mason, Norton, Van
Horn, Wegner & Macrae, 2007; Stohart, et al., 2015). From the observed increase in
dependency and emotional attachment to smart devices it remains unlikely that drivers,
even while driving, will disconnect from their devices.
Due to the driver always being connected, it becomes crucial to find new methods
to warn a distracted driver. With the expectations that future technology will allow a
smart phone to have the ability to collect, interpret and display data about the driver’s
behavior, the driver’s vehicle as well as pertinent information about nearby vehicles on
69
the roadway, the goal of this study was to investigate whether a warning given on or near
the location of the smart phone as well as conveying apparent motion can improve
reaction times to a critical event. In order to achieve this goal, we investigated a novel
approach of using a driver’s smart phone, the main cause of distraction within a vehicle,
as the source of the warning to the driver.
Driver distraction typically has been understood in terms of competing or limited
attentional resources. More recent, an emerging theoretical perspective from Lee (2014)
considers the attentional dynamics of distraction as the ability to “manage interruptions.”
Specifically, within this conceptual interruption model there are four stages known as,
detection, interpretation, shifting of attention and then resumption of the task. For our
study in particular, the focus was on the first three stages of Lee’s (2014) model.
Primarily, this study focused on how to introduce a warning that is detectable under
distraction. Secondly, this study was aimed to reveal if the warning signal could be easily
interpreted by attempting to convey movement in the warning signal to match the real
world situation. Lastly, this study investigated if the warning signal could potentially shift
a driver’s attention from their smart phone to the roadway.
In terms of the first stage, numerous warning studies have been conducted with
respect to a driver successfully detecting a collision warning while driving (Ho, Reed &
Spence, 2006: Spence & Ho, 2008). Reaction time benefits have been observed with
auditory, visual, tactile and multisensory warnings (Lee et al., 2002). While auditory
and tactile warning modalities have shown the most success, various factors such as
loud noises in the vehicle (Edworthy, 1994) talking on the phone (Mohebbi et al., 2009)
or even a bumpy road (Spence & Ho, 2008) may reduce their detectability.
70
Additionally, fewer studies have determined if a driver can detect these same types of
warnings while engaged with their smart phone for uses other than talking (i.e.,
checking Facebook). Ahtamad et al., (under review) recently investigated the effect of a
task relying primarily on the sense of touch (texting with a smart phone) on tactile
warning effectiveness. Results revealed that texting on the smart phone while receiving
a tactile warning on the opposite hand/arm rendered the tactile warnings ineffective
(i.e., no reduction in BRT relative to a no warning condition). In order for a driver to
successfully detect a warning, it may be necessary that the warning is emitted from or
near the smart phone, the area of attentional focus, due to the required interaction with a
smart phone (i.e., holding the phone with one hand and eye fixation at the screen).
Secondly, the interpretation of the interruption to improve a driver’s reaction to a
critical event is vital. Traditional warning studies have been conducted in driving
research that focus on understanding the timing implications of the warning (Lee et al.,
2002; Spence & Squire, 2003; Straughn et al., 2009), and the optimal location of the
warning (Ho & Spence, 2008). More recently, warning studies have begun to investigate
what information might be conveyed or interpreted in the warning signal to increase a
driver’s overall situation awareness (SA) of a critical event (Gray, 2011; Ho, Gray &
Spence, 2014). Auditory looming warnings and vibrotactile apparent motion signals have
been shown to successfully convey urgency when the warning signal parallels the
incoming information about the closing velocity (CV) with the lead car or when the
warning simulates apparent movement that is presented as moving towards the driver’s
head or torso (Gray, 2011; Meng, Gray, Ho, Ahtamad & Spence, 2015). In order for the
driver to effectively interpret an interruption from the warning signal it is worthwhile to
71
investigate if the warning from a smart phone could convey pertinent information to the
driver before any head or eye movement is necessary.
Lastly, re-orienting a driver or shifting a driver’s attention from their smart phone
may prove more difficult than expected. One prominent aspect of the interruption
perspective is task preservation (Zeigarnik, 1938), where a driver fails to interrupt their
interaction with a task (i.e., smart phone) and return their attention to the road or warning
system due to their fixation with completing a goal on the smart phone. Unfortunately,
smart phones have the ability absorb the user in a multitude of ways with unlimited goals
that can cause the user to lose track of both time and their surroundings (Wickens,
Martin-Emerson, Larish, 1993). An alert given at the location of the driver’s smart phone
may successfully interrupt the driver, consequently shifting their attentional focus to the
forward position of the roadway. Conversely, an alert given at their smart phone may
cause a driver to be unnecessarily oriented to the smart phone longer (i.e., processing the
sound or vibration coming from the device) (Posner, 1980). Due to these unknown
implications on warnings involving smart phone distraction, it is valuable to investigate if
the apparent motion could be used to successfully re-orient the driver to the forward
facing direction.
Aforementioned, simulating apparent motion as moving towards the driver has
resulted as an effective method for alerting drivers (Ho, Spence & Gray, 2013; Meng et
al., 2015). In the case of a warning a distracted driver, little is known if the towards
motion will remain the more effective option. In line with previous research, the apparent
motion simulating movement towards a driver may allow the driver to successfully
process and react to the warning information prior to looking forward at the roadway.
72
Conversely, the reverse result may occur. When a distracted driver is presented an
apparent motion warning appearing to move towards them, because the initial sound or
vibration is presented outside a driver’s area of attention or focus (i.e., a speaker on the
dash, or vibration to their non-dominant hand) a driver to be less inclined to break their
attentional focus with their smart phone. Although counter to previous research on
apparent motion, simulated motion away from a driver that is distracted may be as or
more efficient in improving a driver’s reaction time. For example, when a driver is
looking away from the road, down at their smart phone, motion that appears to have
initiated from their device may be more successful in breaking a driver’s attentional focus
with their smart phone. Furthermore, the secondary sound or vibration simulating the
“away” motion (i.e., a speaker on the dash, or vibration to their non-dominant hand)
could potentially create a faster and accurate orientation of the driver’s attention to the
forward facing position and towards the location of the critical event.
Current Study
A literature review revealed that no study to date has used the smart phone as the
source for the warning. In the current study both the auditory and tactile warnings that
conveyed direction were presented on or near the source of the driver’s smart phone (i.e.,
via a speaker that produced a tone next to the hand they held their smart phone with or a
vibration given to the wrist of the hand that held their smart phone). Drivers were asked
to perform a car-following task while simultaneously using their smart phone to watch a
video. The driving simulator would trigger an auditory or tactile warning when a driver’s
time to collision (TTC) and the lead car approached less than 3 seconds. Additionally, for
both the auditory and tactile warning conditions participants were given sound or
73
vibrations that appeared to be moving either towards the driver, away from the driver, or
presented in a non-informative, static manner at the smart phone location only. This
experiment was designed to test the following predictions.
(i) Driving performance to a potential rear-end collision will be improved
(faster brake reaction times (BRT’s) in conditions with warnings
relative to the non-warning baseline condition.
(ii) The benefits of the tactile warnings (i.e., changes in BRT relative to
the non-warning condition) will be significantly greater than for the
auditory warning due to the notion that the secondary task had an
auditory component (listening to video) and no tactile component.
(iii) If interpretation of the warning (i.e., signalling an approaching object)
is more beneficial to the driver, then warnings that simulate motion
towards the driver will be significantly faster (i.e., changes in BRT
relative to the no warning baseline) versus the away and static
movement conditions. If re-orienting of the warning is more beneficial
to the driver, then warnings that simulate motion away from the driver
will be significantly faster (i.e., changes in BRT relative to the no
warning baseline) versus the toward and static movement conditions.
74
Method
Participants
Fifteen undergraduates (mean age= 20.13) from Arizona State University
participated for partial fulfillment of an introductory psychology and human systems
engineering research requirement. All participants had corrected-to-normal vision, held a
valid driver’s license, were right-handed and owned a smart phone.
Apparatus
Simulator
The same apparatus was used as in Experiment 1, (Chapter 2).
Procedure
Car following task
The same car-following task as Experiment 1 was used. Each driver completed 7
driving tracks corresponding to the 6 smart phone warning conditions tasks plus the 1
non-warning baseline condition. Each track had 10 unpredictable full stops of the lead
car, and required about 6–7 minutes to complete. The locations of the stops were
randomly varied across tracks. The 7 smart phone warning conditions order were
counterbalanced across participants, such that each participant participated in one of three
block randomization presentation orders (tactile, non-warning, auditory: auditory, tactile,
non-warning: and non-warning, tactile, auditory). Additionally, within each of the
conditions the order of warning trials (towards, away or static) was partially
counterbalanced such that each participant was given one of three blocked orders
75
(towards, away, static; away, towards, static; static, towards, away). Each participant was
given a 3-minute practice trial to get acquainted with the simulator. Participants were able
to rest as long as needed between conditions to minimize simulator sickness and fatigue.
Driving Conditions
Drivers were instructed that in all the experimental conditions they would be
driving around a track while watching a YouTube science video of their choice and
simultaneously receiving warnings, either auditory or tactile. Drivers were informed they
would be given a quiz about the video at the end of the drive, so they needed to try to
maintain an appropriate balance of their attention, as best as they could, between driving
the vehicle and watching the video. Drivers were asked to hold their smart phone in their
right hand, in a comfortable position that was lower than the center of the steering wheel
while keeping their left hand on the steering wheel at all times.
The warning types drivers received were either auditory or tactile and given in
either a static, toward or away motion. The warnings were only triggered when the
drivers TTC with the lead car reached the threshold of 3 seconds or less and repeated
every second until the driver’s TTC was greater than 3 seconds.
Auditory Static: A 250-hz tone was given for a total of 700msec on the right
speaker that was placed near the driver’s smart phone.
Auditory Away: A 250-hz tone was given for a total of 300msec to the right
speaker (near driver’s right hand) followed by 100msec of silence and then a 250-
hz tone presented to the left speaker (left side of dash) for a total of 300msec.
76
Auditory Toward: A 250-hz tone was given for a total of 300msec to the left
speaker (near dash) followed by 100msec of silence and then a 250-hz tone
presented to the right speaker (near driver’s right hand) for a total of 300msec.
Tactile Static: A 250-hz tone was given for a total of 700msec via a tactor that
was velcroed onto the participant’s right wrist.
Tactile Away: A 250-hz tone was given for a total of 300msec via a tactor that
was velcroed onto the participant’s right wrist, followed by 100msec pause, and
then another 250-hz tone that was presented for 300msec to the left wrist.
Auditory Toward: A 250-hz tone was given for a total of 300msec via a tactor
that was velcroed onto the participants left wrist, followed by 100msec pause and
then another 250-hz tone that was presented for 300msec to the right wrist.
Data Analysis
To assess driving performance two dependent variables that have been shown to
be sensitive to distraction in previous studies, BRT and TH variability were used. These
data were analyzed using a Repeated Measures ANOVAs with warning modality
(auditory or tactile) and direction (static, towards, away) as the two factors. Planned
comparisons (using pairwise t-tests) between each warning type and the no warning
condition were used to test hypotheses (i) listed above. For all results reported, statistical
significance is set at p<.05. Effect sizes were calculated using partial eta squared (ηp2) for
ANOVAs and Cohen's d for t-tests for all significant findings.
77
Results
Brake Reaction Times
Figure 9 shows the mean BRTs for the seven different driving conditions. The
repeated measures ANOVA performed on these data revealed a significant main effect of
modality, F(1,28) = 9.03, p<.009, ηp2 = .39, such that the BRT for the auditory warnings
(Mean = .60 s) was significantly faster than the BRT for the tactile warnings (Mean = .73
s). Contrary to our predictions, the main effect for direction and the modality by direction
interaction were not significant, F(1,28) = .46, p=.64, ηp2 = .31 and F(1,28) = .03, p=.97,
ηp2 = .00, respectively.
Follow-up paired samples t-tests, comparing the non-warning baseline condition
(Mean = 0.82 s) to each of the six experimental conditions, were run. Results
demonstrated that each of the mean auditory conditions BRT’s were significantly faster
than no warning, auditory away (Mean = 0.61 s, t(14) = -3.28, p = 0.005, d=.82) auditory
towards (Mean = 0.58 s, t(14) = -8.14, p = 0.000, d=1.11) and auditory static (Mean =
.60 s, t(14) = -4.26, p = 0.001, d=.93) conditions. Additionally, for the tactile conditions it
was revealed that only the tactile towards condition BRT’s were significantly faster than
the non-warning condition (Mean = .70 s, t(14) = -2.78, p = 0.015, d=.55) while the
tactile away (Mean = 0.74 s) and tactile static (Mean = 0.75 s) were not significantly
different from the non-warning condition p’s all >0.005.
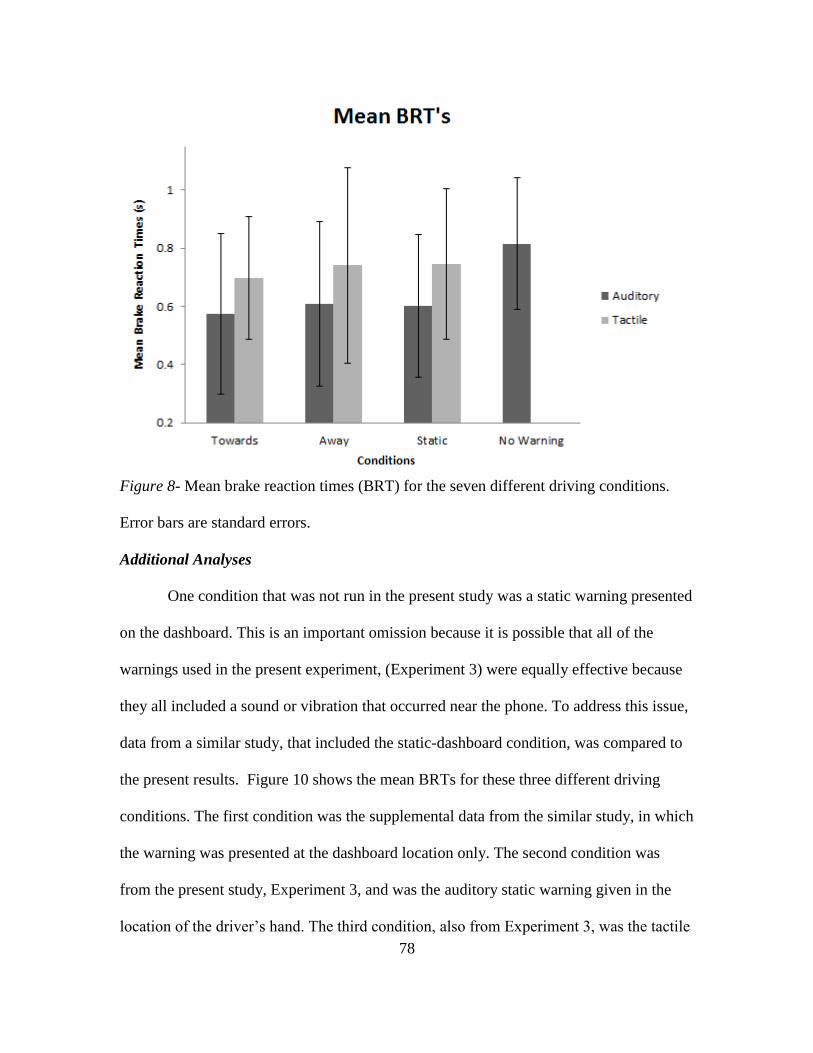
78
Figure 8- Mean brake reaction times (BRT) for the seven different driving conditions.
Error bars are standard errors.
Additional Analyses
One condition that was not run in the present study was a static warning presented
on the dashboard. This is an important omission because it is possible that all of the
warnings used in the present experiment, (Experiment 3) were equally effective because
they all included a sound or vibration that occurred near the phone. To address this issue,
data from a similar study, that included the static-dashboard condition, was compared to
the present results. Figure 10 shows the mean BRTs for these three different driving
conditions. The first condition was the supplemental data from the similar study, in which
the warning was presented at the dashboard location only. The second condition was
from the present study, Experiment 3, and was the auditory static warning given in the
location of the driver’s hand. The third condition, also from Experiment 3, was the tactile
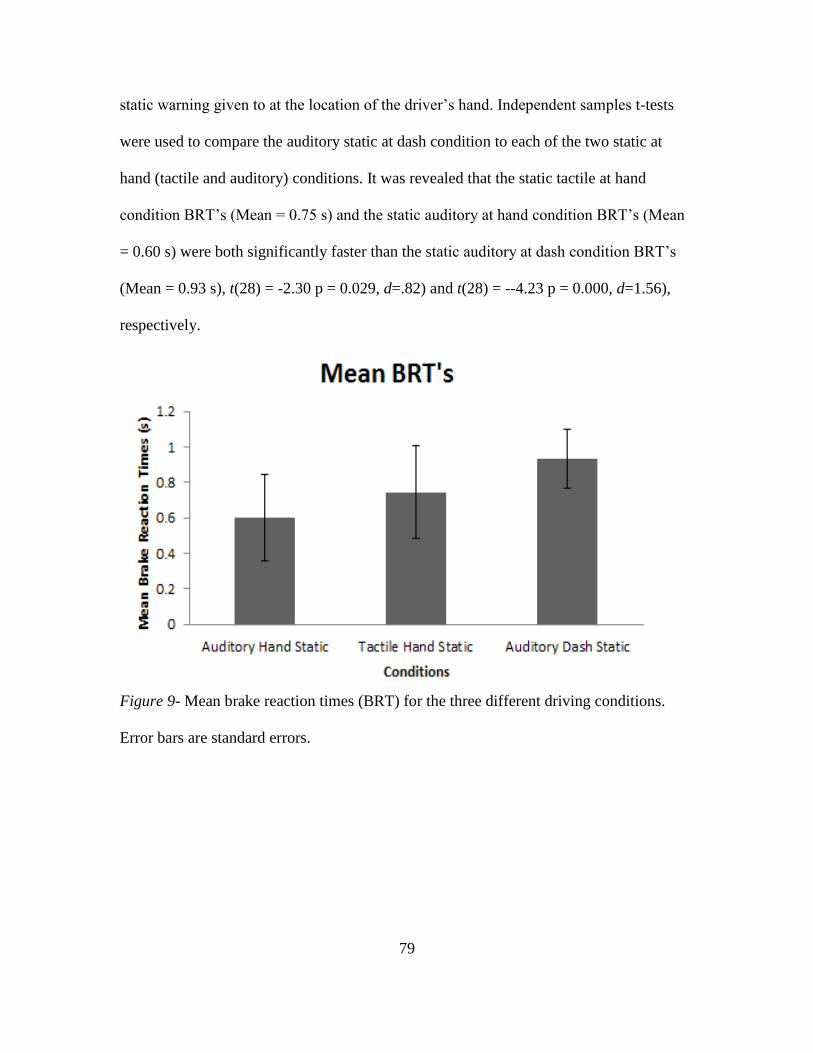
79
static warning given to at the location of the driver’s hand. Independent samples t-tests
were used to compare the auditory static at dash condition to each of the two static at
hand (tactile and auditory) conditions. It was revealed that the static tactile at hand
condition BRT’s (Mean = 0.75 s) and the static auditory at hand condition BRT’s (Mean
= 0.60 s) were both significantly faster than the static auditory at dash condition BRT’s
(Mean = 0.93 s), t(28) = -2.30 p = 0.029, d=.82) and t(28) = --4.23 p = 0.000, d=1.56),
respectively.
Figure 9- Mean brake reaction times (BRT) for the three different driving conditions.
Error bars are standard errors.
80
Discussion
Previous research on warning drivers have found both auditory looming and
apparent motion tactile modalities can be used to improve driver’s reaction times to
critical events (Gray, 2011; Ho et al., 2014). Interestingly, these same warnings have
been shown to be nearly rendered ineffective when drivers are simultaneously distracted
by their smart phone (Athamad et al., under review). In an applied setting, a driver’s
increased dependency with their smart phone, combined with the potential for a driver to
experience FoMo, sets the stage for a driver’s inability to disconnect both physically and
cognitively while driving (as observed in Experiment 2). For this reason, the overarching
aim of this study was to explore practical ways to warn a distracted driver, specifically,
by implementing the warning near the location of their smart phone. In particular, we
were interested in two factors for the warning: modality (auditory vs tactile) and direction
of apparent motion (towards vs away vs static).
Given that overall warning studies tend to show warnings improve driver’s
reaction times to a critical event (Ho et al., 2013), our first hypothesis was that the BRT’s
would be significantly faster when drivers were given a warning as compared to the non-
warning condition. Interestingly, the findings support our first hypothesis for the BRT’s,
all conditions involving the auditory warning decreased a driver’s BRT as compared to
the non-warning condition, consistent with previous research on auditory looming
warnings (Gray, 2011). For the tactile apparent motion warning conditions, results found
that only the tactile warning presented as moving towards the driver had the ability to
improve a driver’s BRT as compared to non-warning conditions. These findings are
partially consistent with both previous research findings that tactile warnings can be
81
rendered ineffective when given to a distracted driver (Ahtamad et al., under review) and
research findings that the most effective apparent tactile motion warning is when the
motion is presented as moving towards the driver (Ho et al., 2014).
In line with the notion that the secondary task was highly demanding, both with
respect to the visual and auditory processing, the second hypothesis was that the tactile
warnings would significantly reduce BRT’s as compared to the auditory warnings. This
hypothesis was based on the premise that the tactile warnings would not be directly
competing for a driver’s attention with the visual and auditory modalities thus allowing a
driver to more quickly process the tactile warning information. Surprisingly, the results
suggest the opposite effect for the driver’s BRT’s. The BRT data revealed that the
auditory warnings actually improved reaction times to the critical event as compared to
the tactile warnings. Upon further consideration, this observed benefit may have been
more pronounced in this study due to again, the nature of the secondary task. Although
the auditory warnings were competing for the driver’s attention with the secondary task,
the secondary task of listening and watching a video was, in essence, more passive as
compared to past studies requiring driver’s to actively engage in conversations with a
passenger or on talk on their cell phone (Mohebbi et al., 2009). The passive interaction
drivers maintained with watching a video displayed on their smart phone while driving,
albeit a common use of the smart phone, may have allowed drivers to become more
receptive to an auditory signal as they were enhancing their auditory channel required by
listening to the video. In turn, this auditory receptiveness may have contributed to a
driver’s ability to react more quickly to the auditory warning as compared to the tactile
warning.
82
Furthermore, and contrary to our third hypothesis, there was no benefit of
direction on BRT when simulated as moving toward the driver as compared to when the
motion was simulated as moving away or those that were static. The rationale for this
hypothesis was with past research success from presenting informative warnings, that
either increase in sound and intensity as a driver approaches a lead car or tactile
vibrations that move towards a driver’s head (e.g., Gray, 2011). Additionally, from
studies that demonstrate motion simulated as moving away from the driver may
potentially aid in reorienting their attention to the collision event (Gray & Tan, 2002).
Further investigation on the effectiveness of the warning location was considered. For the
static conditions, follow-up analysis combined this experiment with data from a previous
static auditory warning experiment. Results revealed that BRT’s were significantly faster
when the static auditory or tactile warnings were given near the participant’s hand
holding the smart phone as compared to an auditory warning presented at the dash only.
These findings support the notion that giving an initial warning near the location of the
smart phone is more likely to break the driver’s attentional focus with their smart phone
rather as opposed to orienting them to the smart phone longer. Future research to
investigate if auditory information can convey informative information or re-orient a
driver by using 3D looming audio or a secondary auditory sound presented in the
direction of the critical event is worth exploring.
There is a large body of literature discussing the various ways that can
successfully warn a driver, although most are without consideration of warning a driver
that is distracted by their smart phone. Overall, these data are in line with the previous
findings that distracted drivers given a tactile warning while simultaneously distracted by
83
their smart phone had the equivalent reaction times as not warning a driver in the first
place (Ahthamad et al., under review). Notably, results of this study did reveal that the
auditory modality can be used to improve a driver’s BRT although apparent motion
information was unable to provide any benefit. From Lee’s (2014) perspective of a driver
being able to “manage interruptions” these results demonstrate the driver was able to
detect the auditory warning more so than the tactile warnings although they were unable
to accurately interpret the directional information provided in the warning. One potential
reason for the interpretation discrepancy may be attributed to our warning presentation
methodology. Unlike typical warning studies, where the warning presentation is given at
the dash, our warnings were presented near a speaker at the driver’s smart phone. Again,
the rationale for this warning presentation method was that due to more applied real
world driving conditions in which a driver is being distracted by their smart phone, this
location may increase potential to improve a driver’s reaction time to the critical event.
Future research is necessary to explore how information to a driver can be best
conveyed for a driver to both quickly interpret and most effectively shift their attention to
the roadway. As technology increases and has the capability to keep drivers connected at
all times there become more challenges in convincing drivers to disconnect. From the
perspective that drivers ARE engaging with their smart phone while driving, the goal of
this study was an exploratory investigation on novel methods to warn a distracted driver.
Warnings were presented to a distracted driver from sounds or vibrations that were given
near the source of the distraction, their smart phone, in hopes to reveal a potential
solution of using a driver’s smart phone as a source of the warning to convey event
information. While warning a distracted driver proves to be challenging, hopefully more

84
applied studies such as these may shed light on alternative, novel and beneficial methods
for alerting a distracted driver.
85
CHAPTER 5
EXPERIMENT 4- Take-Over Request Signals while Operating an Autonomous
Vehicle
Background
Autonomous vehicles pose a solution to issues associated with distracted driving
although inadvertently the autonomous vehicles may create unforeseen issues with a
driver’s ability to maintain proper situation awareness (SA). Naturally, a driver of an
autonomous vehicle will inherit a more passive supervisory control role that requires a
driver to monitor the system and only intervene with the system when necessary or urgent
(Endsley & Kaber, 1999; Lee & See, 2004). A supervisory control role can lead drivers to
boredom and fatigue due to low cognitive workload required to operate the vehicle
(Parasuraman & Riley, 1997), thus leading to an increase in a driver’s engagement with
other tasks (i.e., smart phone tasks). A driver’s engagement with tasks, other than the
main task of driving, consequently may decrease a driver’s overall SA (Endsley, 1995;
Ma & Kaber, 2005). In general, a reduction of a driver’s SA while monitoring an
autonomous vehicle may not pose an absolute risk but in an unexpected critical situation,
the driver being “out-of-the-loop” (OOTL) may have detrimental or even deadly
consequences.
Situation awareness (SA), as defined by Endsley (1995), is the “perception of
elements in the environment within a volume of time and space, the comprehension of
their meaning and the projection of their status in the near future.” For drivers to achieve
proper SA they need to be able to recognize and process relevant information in their
driving environment, such as their location in relationship to other vehicles, to accurately

86
respond to a critical situation. Moreover, SA has been extensively studied in the driving
domain. Results of these studies have found that engaging in distracting secondary tasks,
such as cell phone use, can reduce a driver’s overall SA thus leading to drivers missing
warning signs as well as an overall decrease in driving performance (Strayer & Johnston,
2001; Kass, Cole & Stanny, 2007). Additionally, drivers engaged in secondary tasks
(e.g., watching a video on their smart phone) while monitoring fully automated systems
tend to react slower and more inappropriately respond to critical events, thus increasing
their risk for potential collisions (Merat & Jamson, 2014). For these reasons, drivers of
autonomous vehicles are encouraged to increase SA during driving by remaining “in-the-
loop” both physically (e.g., hands on the steering wheel) and cognitively (i.e., looking
forward at the roadway to process the situation) though the evidence suggests the latter is
far more imperative (Louw, Merat, Jamson, 2015; Zeeb,et al., 2015).
OOTL automated driving studies have focused on understanding what level of a
drivers SA is required for a driver to more accurately regain control of the vehicle during
a take-over request (TOR) situation (Louw, et al., 2014). A TOR is a situation in which
the automated system has been deactivated (e.g. due to sensor loss) and the driver needs
to initiate steering and braking control (Gold, Dambock, Lorenz & Bengler, 2013).
Overall findings reveal challenges in assessing drivers SA levels in this situation as a
drivers eyes being forward towards the roadway are not always an accurate assessment of
SA and even more so if the driver is engaged in other cognitive tasks (Radlmayr, Gold,
Lorenz, Faird & Bengler, 2014). Moreover, when distracted drivers are redirected quickly
to the forward direction of the roadway they are not as always able to cognitively process
the situation in a timely manner, resulting in more brake responses rather than accurate
87
maneuvers to the critical event (Gold et al., 2014). Due to the ambiguity of SA, indirect
measures of SA have been developed that analyze not just the reaction times and
response types to critical situations, but evaluate the driver’s glance behaviors towards
latent hazards on simulated driving roadways (Gibson, Lee, Venkatraman, Price, Lewis,
Montgomery & Mutlu, 2016). While these measures give some insight to the driver’s
overall level of SA at the TOR, methods for enhancing a driver’s SA, especially through
a warning given in conjunct or prior to the TOR becomes imperative.
Various studies have attempted to design and analyze different methods of
enhancing a drivers SA at the time of take-over through the use of warnings. Auditory
warnings have been shown to not only be able to orient a driver to the roadway but
orient a driver to the specific location of a critical event. Specifically, Straughn et al.,
(2009) had participants drive along a three lane simulated highway where pedestrians
randomly walked from the sidewalk to one side of the road. Findings revealed that
drivers SA could be successfully improved by orienting a driver to either the danger or
safe lane of travel depending on the timing of the auditory warning. Similarly, although
to a lesser extent, improving SA at the TOR for a distracted driver in the realm of
automated driving has been attempted. Lorenz, Kerschblaum and Schumann (2014)
designed a novel augmented reality overlay on an autonomous driving simulation that
either illuminated the roadway as green or red. The red color was indicative of the
accident location and the green color was indicative of the safe location. They found
that participants were influenced by these colors, not in their reaction take-over times
but in the appropriateness of their decision making. Similarly, Beller, Heesen &
Vollrath (2013) implemented an uncertainty symbol on the dash that was presented to
88
drivers when the automation was “uncertain” in conjunction with varying the reliability
of the automation system. With regard to SA, it was found that in the uncertain
conditions in which the drivers were given the uncertainty symbol, drivers increased
their overall SA by decreasing their engagement (e.g., performance) with the secondary
task.
As automated driving becomes more mainstream it becomes necessary to
investigate the most effective way enhance a drivers SA while simultaneously directing
their attention back to the roadway (i.e., the “loop”) as quickly as possible. One
potential solution to this problem would be to develop a warning system on the smart
phone (or other infotainment device that a driver might use while the automation is
engaged) that is effective enough to both alert a driver of a critical event (as shown in
Experiment 3) but additionally, to provide enough SA information about the critical
event to the driver that they can quickly assess the situation and appropriately react.
The aim of the current study was to compare different types of auditory
warnings designed to signal a take-over event in an automated driving scenario. To test
this, drivers were asked to take-over control from the automated vehicle in response to
obstacles on the roadway which required them to steer to the left or right around the
obstacle or bring the vehicle to a stop in front of it. We were primarily interested in two
questions. First, similar to the results of our Experiment 3, would take-over signals be
more effective when presented at the location the driver was attending (i.e., their smart
phone) as compared to signals presented at the location of the danger? Second, would
responses to take-over requests be more effective when the signal contained apparent
motion oriented towards the location of the obstacle on the roadway as compared to
89
non-directional signals as has been shown in manual driving conditions (e.g., Straughn,
et al., 2009)? Specifically, this experiment was designed to test the following
predictions.
(i) Take-over performance will be improved (faster brake reaction and
steering response times) in conditions with take-over request signals
relative to the no signal baseline condition.
(ii) Take-over performance will be significantly better for apparent motion
signals as compared to signals that are static (i.e., no movement) as
predicted by the observed benefits from auditory looming signals
(Gray, 2011).
(iii) Take-over performance will be significantly better for directional
apparent motion signals (i.e., that are oriented towards to location of
the obstacle) as compared to non-directional apparent motion signals
(i.e., that are always just oriented towards the center of the road).
Method
Participants
13 undergraduates (mean age=22.4) from Arizona State University participated
for partial fulfillment of an introductory psychology research requirement. All were
native English speakers with normal or corrected-to-normal vision with a valid driver’s
license and were smart phone users.
Apparatus
The same apparatus was used as in Experiment 1, (Chapter 2).
90
Procedure
Driving Task
In the automated driving scenario, the vehicle’s lateral position and speed was
controlled by the simulator as the autonomous vehicle followed a lead vehicle on a
straight stretch of a 3-lane road with intermittent road construction. On each drive, at a
random time between 2-6 minutes, a critical event, TOR was programmed to occur. The
critical events were designed so that they required the driver to make a decision about
how to respond. They involved the lead car braking in response to lane closures and the
control of the participant’s vehicle switching from automated to manual. For some
events, only two of the lanes were blocked and one was left open while for others all
three lanes were closed. Drivers were instructed to steer into an open lane if there was
one available or brake and come to a stop if there was not. In all conditions (described
below), an auditory take-over signal was presented “early warning” given about 5
seconds prior to the control switching to back to manual. This timing is consistent with
previous research that early warnings are more beneficial when the driver is signaled to
the location of the danger because they assist in the driver’s assessment of the situation
(Straughn et al., 2009). Drivers were told that they would receive an auditory warning
sound shortly before the automated vehicle switch to manual control in a critical
situation. Drivers was told that task in these situation was to either: steer into an open
lane (if possible) or if both lanes were blocked to brake as quickly as possible.
During each drive, participants were asked to perform a secondary task of
watching a video on their smart phone. Participant’s had a choice of watching one of
three science video’s that were presented on their phone via YouTube. Additionally, they
91
were asked to hold their smart phone with their right hand and at a level no higher than
the steering wheel and to divide/shift their attention between the simulated roadway and
phone as they felt most comfortable. They were informed they would be given a quiz
about the video at the end of the experiment.
Takeover Request Signals
Four different auditory signals were compared to a no signal (NS) condition as follows:
Device to Danger (DD) – a 250-hz auditory tone was first presented from a
speaker near smart phone location for a total of 300msec. After a delay of
100msec, a second auditory tone of the same frequency and duration was
presented from a speaker mounted in the dashboard on the same side as the lane
obstruction.
Device to Front (DF) - this warning was identical to the DD condition except
that the second tone was always presented from a speaker mounted in the center
of the dashboard.
Device Only (DO) - a 250-hz auditory tone was presented from a speaker near
smart phone location. Note this warning was designed to have the same total
duration (700msec) as the DD and DF warnings described above.
Front Only (FO) - a 250-hz auditory tone was presented from a speaker on a
speaker mounted in the center of the dashboard. Note this warning was designed
to have the same total duration (700msec) as the DD and DF warnings described
above.
92
Data Analysis
Brake reaction times and steering reaction times were the dependent variables
used to assess take-over performance. Note, under all conditions, drivers steering
response was in the correct direction (i.e., towards the open lane) so we did not analyze
steering accuracy. Furthermore, initial analyses revealed there was no significant effect of
the side of the obstacle (i.e., left vs right). Therefore, steering and braking data were
analyzed using separate One Way repeated measures ANOVAs with signal condition
(DF, DO, FO, DD, No Signal) as the factors. Paired samples t-tests were used to test
hypotheses (i, ii, & iii) listed above. For all results reported, statistical significance was
set at p<.05. Effect sizes were calculated using partial eta squared (ηp2) for ANOVAs and
Cohen's d for t-tests.
Results
Steering Reaction Times
Figure 11 shows the mean Steering Reaction Times (SRT) for the five different
driving conditions. The ANOVA performed on these data revealed a significant main
effect of condition, F(1,12) = 65.97, p<.000, ηp2 = .85. Consistent with hypothesis (i),
SRT’s were significantly slower in the non-warning baseline condition (Mean = 2.04 s)
as compared to combined mean for all warning conditions (Mean = 1.35 s) revealed, t(12)
= -7.43, p < 0.000, d=2.03).. Additionally, SRTs were significantly faster in conditions
involving an apparent motion take-over signals (DF & DD, Combined Mean = 1.05 s) as
compared to conditions with static signals (DO & FO, Combined Mean = 1.64 s), t(25) =
-12.94, p < 0.000, d=3.09), supporting hypothesis (ii). Finally, SRT’s were significantly
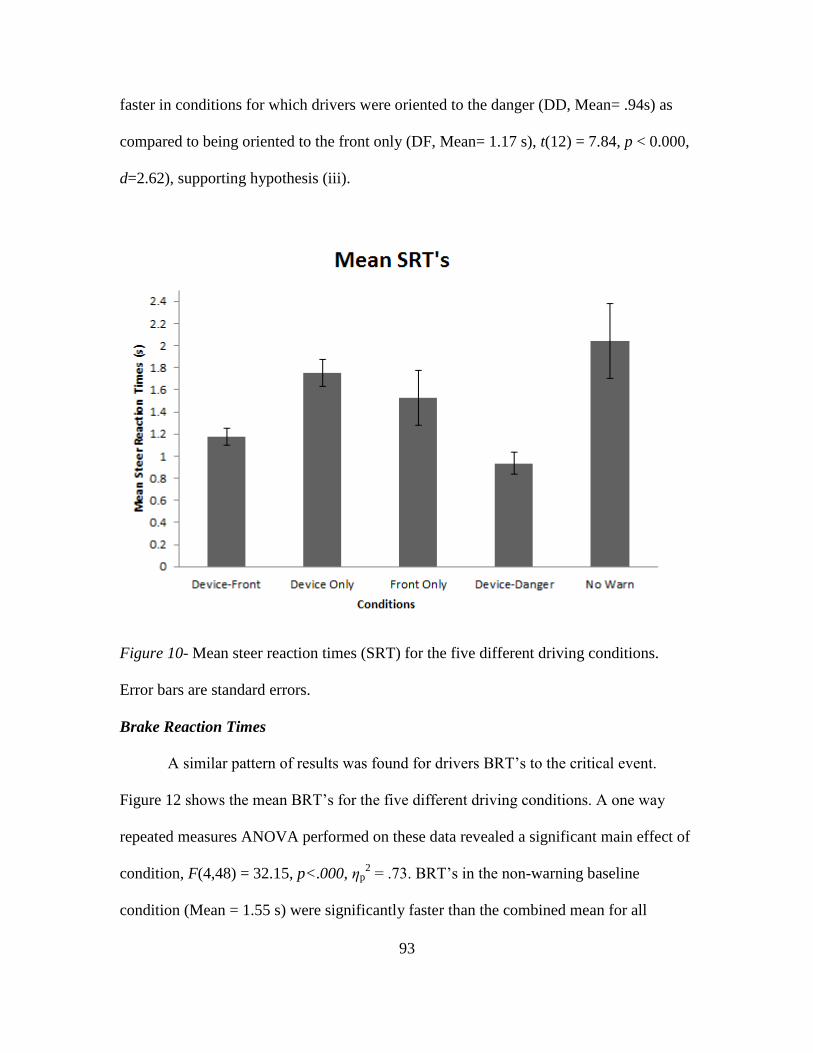
93
faster in conditions for which drivers were oriented to the danger (DD, Mean= .94s) as
compared to being oriented to the front only (DF, Mean= 1.17 s), t(12) = 7.84, p < 0.000,
d=2.62), supporting hypothesis (iii).
Figure 10- Mean steer reaction times (SRT) for the five different driving conditions.
Error bars are standard errors.
Brake Reaction Times
A similar pattern of results was found for drivers BRT’s to the critical event.
Figure 12 shows the mean BRT’s for the five different driving conditions. A one way
repeated measures ANOVA performed on these data revealed a significant main effect of
condition, F(4,48) = 32.15, p<.000, ηp2 = .73. BRT’s in the non-warning baseline
condition (Mean = 1.55 s) were significantly faster than the combined mean for all
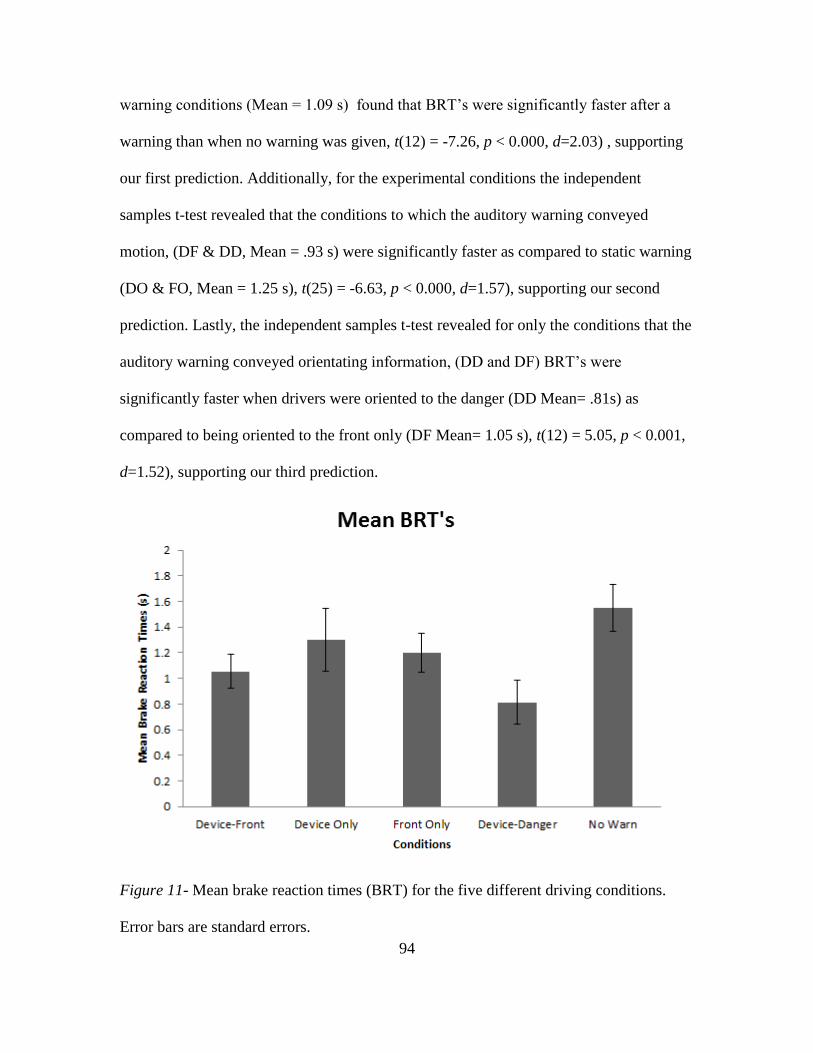
94
warning conditions (Mean = 1.09 s) found that BRT’s were significantly faster after a
warning than when no warning was given, t(12) = -7.26, p < 0.000, d=2.03) , supporting
our first prediction. Additionally, for the experimental conditions the independent
samples t-test revealed that the conditions to which the auditory warning conveyed
motion, (DF & DD, Mean = .93 s) were significantly faster as compared to static warning
(DO & FO, Mean = 1.25 s), t(25) = -6.63, p < 0.000, d=1.57), supporting our second
prediction. Lastly, the independent samples t-test revealed for only the conditions that the
auditory warning conveyed orientating information, (DD and DF) BRT’s were
significantly faster when drivers were oriented to the danger (DD Mean= .81s) as
compared to being oriented to the front only (DF Mean= 1.05 s), t(12) = 5.05, p < 0.001,
d=1.52), supporting our third prediction.
Figure 11- Mean brake reaction times (BRT) for the five different driving conditions.
Error bars are standard errors.
95
Discussion
Recent research on distracted drivers supervising automated vehicles has started
to investigate a driver’s level of situation awareness (SA) at the time of request (TOR)
(Ma et al., 2005; Gold et al., 2013, Louw, et al., 2014). In general, driving take-over
performance when drivers are supervising an automated vehicle demonstrates that
drivers tend to not fully take-over control when requested (de Waard, van der Hulst,
Hoedemaeker, & Brookhuis, 1999). Additionally, it has been observed that the amount
of time it takes for a driver to gain complete control of the vehicle after a TOR can be
excessive. For instance, drivers can take 35-40 seconds to fully assess and appropriately
respond to the situation (Merat et al., 2014). The goal of Experiment 4 was improve the
responses of drivers in this critical situation by using an informative TOR signal, similar
to those that have been employed for distracted manual driving. Specially, different
auditory warnings, ones that conveyed motion and/or oriented the driver to the danger,
were compared in terms of their ability to improve a driver’s SA, by observing the
drivers BRT’s and SRT’s to the critical event.
Given that general warning studies tend to show an improvement in BRT’s to a
critical event (Ho et al., 2013), our first hypothesis was that take-over performance
would be improved (faster BRT’s and SRT’s) in conditions with take-over request
signals relative to the no signal baseline condition. As expected, this hypothesis was
supported for both dependent variables. Not only did the auditory warnings improve
drivers BRT but also aided in a driver’s ability to make a swerve decision faster (SRT)
when there was a foreseen obstacle. These findings are consistent with previous
research on auditory warnings (Scott & Gray, 2008; Mohebbi et al., 2009) and
96
consistent with our Experiment 3 results, in which auditory warnings remained an
effective modality, even when drivers were distracted by their smart phone.
Our second hypothesis, that take-over performance would be significantly better
for apparent motion signals as compared to signals that are static (i.e., no movement)
was also supported. This prediction was based on previous findings that warning signals
that are able to convey some type of information about the critical event, such as
motion, would be able to improve the reaction time and decision of the driver. These
findings have been demonstrated in auditory looming signal research (Gray, 2011) as
well as tactile warnings research in which the apparent that is presented as moving
towards the driver’s head or torso (Meng et al., 2015). Our results demonstrated that
drivers that were given warnings that conveyed motion as compared to a static non-
motion were effective in reducing BRT’s and SRT’s.
Lastly, our third hypothesis, that take-over performance would be significantly
better for directional apparent motion signals (i.e., that are oriented towards the location
of the obstacle) as compared to non-directional apparent motion signals (i.e., that are
always just oriented towards the center of the road) was supported. This prediction was
based on previous findings that attentive drivers can benefit from auditory warnings that
provide SA information, specifically SA information that orient the driver to the danger
(Straughn et al., 2009). Additionally, this work is congruent to previous findings such
that simulating motion as moving away from the driver may potentially aid in
reorienting a driver’s attention to the collision event (Gray & Tan, 2002).
The pattern of BRT and SRT results in this experiment did not appear to reveal
any significance or improvement when the take-over signals were presented at the
97
location the driver was attending (i.e., their smart phone) as compared to signals
presented at the location outside their focus (i.e., the danger or dash). These results are
not entirely consistent with Experiment 3’s supplemental analysis, in which the location
of the static auditory warning presented at the location the driver was attending (i.e.,
their smart phone) did make a difference. The reason for this discrepancy between
experiments may be attributed to the experimental design differences, such that in the
current study drivers were acting as a supervisor and not an active driver. Potential
explanations for this discrepancy will be further explored and discussed in the overall
general discussion. For this experiment, the significant finding was that the informative
motion warnings improve BRT and SRT more so than the static non-informative
warning.
There is a large body of research that attempts to warn a manual driver while
simultaneously improving the driver’s SA (Ho & Spence, 2005; Gray, Ho & Spence,
2014). Research on drivers being warned while supervising autonomous vehicles, are
not as common. This experiment revealed similar results to previous work, such that,
auditory warnings can be used to both alert an autonomous driver of the critical event,
but that the warnings can convey information (Gray, 2011; Ho, Spence & Gray, 2013).
Additionally, it was found that an autonomous driver can benefit from the information
conveyed in the warning signal to improve their cognitive decision making when
responding to the critical event. These findings suggest informative warnings that
convey motion can not only orient a driver back to the main task of driving, but
informative warnings that convey direction of the danger can be used to improve a
drivers SA and quickly reorient them back “in-the-loop.” While these results have

98
potential to apply to autonomous vehicle safety, future work is necessary to improve
upon this concept
99
CHAPTER 6
GENERAL DISCUSSION
Distracted driving is defined as the diversion of attention away from the
activities critical for safe driving and towards a competing activity (Lee, et al., 2008;
Regan & Strayer, 2014). As previously discussed, due to a limited capacity of a driver’s
available cognitive resources, distracted driving is responsible for up to 30% of total
crashes (NHTSA, 2013). Since 1995, distracted driving has been exacerbated by the
development of the cell phone. Not only is the cell phone distracting when it is used for
calling (Strayer & Johnston, 2001; Horrey & Wickens, 2006; Caird et al., 2008) but
more recent evidence suggest that the distraction problem is further intensified with the
advancement of smart phone technology (e.g., the text message, social media app’s).
This issue has become a growing concern for roadway officials, policymakers and
automotive industry leaders leading to a variety of different attempts to mitigate driver
distraction. Potential solutions have involved car assistive technologies including
collision avoidance warning systems, lane departure warning systems, blind spot
warning systems, and rear back-up camera warnings. Of specific interest to the current
experiments was the question of how to best warn a distracted driver, an issue that has
received surprisingly little research attention.
Previous research suggests that engaging in a secondary tasks while driving such
as talking on the cell phone or text messaging may consequently render any warning
virtually ineffective, despite the modality of the warning that is used (Mohebbi et al.,
2009; Ahtamad et al., 2015). Although autonomous vehicles are able to offer a potential
solution to many of the distracted driving issues, discovering methods to alert and re-
100
orient a driver is also important in automated driving (e.g., when the driver is required
to take-over due to a control failure). The present research not only looked at the use of
warnings on distracted drivers but aimed to discover the best warning implementation
systems to quickly disengage a driver from specific sources of distraction, (i.e., their
smart phones) and re-orient the driver’s attention in the event of a critical incident. The
present set of studies, across four experiments, aimed to tackle this problem from
multiple angles.
Experiment 1 examined the relative degree of distraction produced by a set of
commonly used smart phone tasks. In particular, we were interested in comparing app’s
or tasks that were primarily text- based (i.e., scrolling through Facebook, Twitter
newsfeeds) with image- based (i.e., Instagram, Snapchat) apps. Additionally, we wanted
to understand how task pacing (i.e., either responding at their leisure, or being required
to respond to the experimenter immediately) impacted driving performance. Results
revealed that text conditions created significantly longer BRT’s and larger TH
variability as compared to image-based conditions. Interestingly, we did not observe
any significant effect of task pacing (e.g., self vs experimenter) on driving performance.
These overall findings were consistent with the general finding that smart phone use is
distracting and impairs driving performance. Based on the prevalence of smart phones
as well as the availability of many text- based applications on the market (e.g.,
Facebook, Twitter, etc.) the next logical step was to investigate potential solutions to
mitigate driver smart phone distraction.
Experiment 2 was concerned with mitigating driver distraction through safe
driving smart phone apps. Several smart phone app’s have recently been developed that
101
attempt to regulate a driver’s use of their smart phone in some manner. We were
interested in how people use and interact with these various safe driving app’s and how
these app’s might impact a driver’s driving performance. In this experiment, we
simulated four different application modes, and compared them to a baseline, no phone
condition. The modes varied by either allowing drivers to check their messages or not
and whether or not the driver heard an audible alert of the received messages. While
driving around a simulated urban environment, participants received text messages from
an experimenter that were clues to a riddle. Results demonstrated that for all conditions
in which drivers had their phone in the car (regardless of mode), mean driving speed
and lane positive variability were significantly higher. Additionally, allowing drivers to
check their messages when stopped (e.g. at a red light) produced significant delays in
reaction times and higher lane position variability when driving started again, as
compared to the other modes. These results are consistent with research using a simple
laboratory task which has shown that when phones that are turned off or blocked they
can still cause distracting task-irrelevant thoughts produced by the expectation of
receiving an important message (Stothart et al., 2015). They also suggest that restricting
smart phone use is not an effective method for reducing the effects of distraction on
driving performance.
Unfortunately, as demonstrated in Experiment 2, even app’s that help to regulate
incoming information can be a source of distraction. Drivers want to stay connected as
much as possible. Due to the likelihood that drivers will engage with their smart phones
at some point in their drive, a potential solution for warning a distracted driver needs to
be explored. This was attempted, in Experiment 3, in which both auditory and tactile
102
warnings were given to drivers while they were watching a movie on their smart phone.
The warnings attempted to convey directional information of either moving towards or
away from the driver and were compared to a no movement condition. Results revealed
that only the auditory warnings produced a significant reduction in BRT’s to the critical
event and there was no significant effect of simulated movement direction. A follow-up
analysis found that drivers benefited from a warning presented at the location of their
smart phone as compared to warnings delivered from the dashboard, as is typically
done in most existing collision warning systems. Overall, these results suggest that a
warning given at the source of distraction (i.e., near the location of the driver’s attential
focus) may be the most effective method for mitigating driver distraction.
The goal of Experiment 4 was to extend the present research beyond the topic of
driver distraction during manual driving to consider the related issue of take-over
requests (TOR) in automated driving. Specifically, In Experiment 4, drivers were asked
to take-over control from a simulated automated vehicle in response to obstacles on the
roadway. Similar to Experiment 3, auditory warnings that conveyed motion information
(in this case, either moving towards the location of danger of towards the center of the
roadway) were used and were compared to a static warnings (delivered either on the
dashboard or at the location of the smart phone). Results revealed that drivers of an
autonomous vehicle benefited from the use of an informative motion warning.
Specifically, an auditory warning that was first triggered at the location of the smart
phone and then in the location of the danger, lead to significantly larger reductions in
BRT’s to a critical event as compared to all other warnings.
103
Experiments 1 and 2 were a starting point in understanding which smart phone
tasks are the most distracting to a driver as well as investigating the effectiveness of
different types of smart phone apps which restrict phone usage during driving. These
two studies together demonstrated that drivers are most distracted by text-based app’s
(i.e., reading Facebook status updates) and even when the smart phone is turned off
(i.e., using an blocking app) driving performance is still significantly impaired as
compared to when their smart phone is turned off. From these findings, Experiment 3
and 4 explored new methods for warning a distracted driver. Novel to these studies was
presenting warnings from the source of the distraction, using either a sound triggered at
the smart phone location or presenting a vibration given on the wrist of the hand
holding the smart phone. The goal was to explore the possibility of breaking the driver’s
attentional focus on their smart phone as well as finding the best methods to improve
the driver’s situation awareness by conveying direction and location information in the
warning itself.
Experiment 3 and 4 found that warning a distracted driver was achievable,
primarily by using auditory warnings. Interestingly, Experiment 3 found no benefit of
conveying motion in the warning to the driver, while Experiment 4 did. Also,
Experiment 3 found that warning a driver near their location of attentional focus (i.e.,
the smart phone) versus outside of their area of attentional focus (i.e., the dash)
improved a driver’s BRT, while Experiment 4 found no such benefit. The likely reason
for this discrepancy between experiments is differences in the nature of the driving task.
In Experiment 3, drivers were actively engaged in controlling the vehicle while in
Experiment 4, drivers were passively supervising the vehicle until the takeover request
104
was issued. Differences in how a driver responded to the warnings in the present
experiments may have been attributed to their level of responsibility in maintaining
control of the vehicle. Due to the active engagement and high level of responsibility in
Experiment 3, the perceptual-cognitive demands of the task (both driving and using
their smart phone) may have been too high to allow them to fully process the motion
information contained in the warning. On the contrary, the passive nature of Experiment
4 may have given the driver the necessary processing resources to utilize the motion
information contained in the warning. Additionally, driver controlling the vehicle
manually, as in Experiment 3, may have been more conscious of their lack of attention
on the roadway resulting in quicker responses to warnings when presented closer to
their area of focus, near their smart phone. Conversely, a driver passively monitoring an
automated vehicle, as in Experiment 4, may have reacted similarly in ALL warning
conditions based on the assumption that they are not fully responsible for the driving
performance of the vehicle.
Moreover, the differences between the outcomes in both Experiments 3 and 4
may have been attributable to the warning timing. In Experiment 3 drivers were given a
relatively late warning (e.g., TTC less than 3 seconds) while in Experiment 4 drivers
were given a relatively early warning (e.g., TTC of 5 seconds). As Straughn et al.
(2009) demonstrated, the timing of a warning prior to the critical event can make a
difference how a driver may react. When the warning is given early enough, drivers are
more able to assess the situation and act in a more appropriate manner as compared to
drivers given late warnings who must react immediately without fully assessing the
situation. Experiment 3’s late warning may have contributed to drivers reacting in a
105
more erratic manner as well as causing drivers to become more reliant on the
origination of the warning’s location for the response. Conversely, Experiment 4’s early
warning may have contributed to drivers reacting in a more calm manner due to more
processing time to process the information that was conveyed as well as allowing
drivers to respond to any warning despite the location it originated.
Theoretical Implications
Lee (2014) proposed an account of warning a distracted driver which involves
“managing interruptions.” Of the four stages, our study is concerned with the first three;
detect, interpret, and shift attention. The present results have several important
implications for this theory. First, the results of the present experiments suggest that a
driver’s ability to successfully detect a warning is highly dependent on the nature of the
secondary task being performed. While drivers in previous research have been found to
not respond to auditory warnings when engaging in auditory tasks, these tasks were
generally active in nature, such as talking with a passenger or on their cell phone
(Mohebbi, et al., 2009). In the present experiments, drivers were passively processing
auditory information from videos which may have essentially given them more
processing capacity to detect auditory warnings Similarly, the tactile warnings used in
the present study (which have shown to be highly effective in previous research
involving hands-free secondary tasks) were ineffective in reducing BRTs. Thus, that
act of having to actively hold an object (e.g., their smart phone) may change a driver’s
ability to detect tactile warnings.
106
Secondly, in this set of experiments, distracted drivers differed in their ability to
accurately interpret directional information conveyed in the warning based on their
driving task responsibility (i.e., manual or passive driving) as well as the timing of the
warnings (i.e., early or late). When drivers were a passive supervisor of an autonomous
vehicle and given an early warning, they were more likely to benefit from the warnings
that conveyed motion versus static warnings. There was no such warning benefit when
drivers controlled the vehicle manually and were given a late warning. These findings
suggest that the nature of the driving task may directly influence the interpretation of
warning signals.
Similarly, these findings revealed that distracted drivers differed in their ability
to shift their attentional focus depending on, again, the driver responsibility type. For
manual drivers, a warning that was given at the location near the driver’s smart phone,
as compared to given on the dash was more likely to have the ability to re-orient the
driver’s attention to the roadway, not towards the phone, as would be predicted by
Posner (1980). On the other hand, for passive drivers, the origination location did not
appear to improve re-orientation ability (i.e., demonstrated by brake and steer reaction
times in response to static warnings). These findings illustrate that the level of
responsibility/control may have an influence on how a driver re-orients their attention.
Thirdly, one of the most intriguing findings to come from these experiments was
that drivers of autonomous vehicles were able to improve SA through the use of an
informative warning. Specifically, with informative auditory warnings were given (e.g.
that originated at the source of distraction and ended at the location of the danger)
drivers significantly improved their brake and steer reaction times to a critical event.
107
This finding suggests that the signal aided in their ability to quickly evaluate the
situation and has theoretical implications for the theory of SA in which informative
warnings may be able to successfully improve one’s SA when supervising an
autonomous vehicle. Further testing should be explored to understand these capabilities
and limitations.
Lastly, the results of these experiments have theoretical implications for the
theory of mind-wandering while driving (McVay & Kane, 2009). Our results were
consistent with Stothart et al., (2015) findings that a person may show performance
decrements after hearing an alert on their phone while engaged with a primary task as
well as consistent with Yanko and Spalek’s (2013) findings that notifications while
driving can prompt task-irrelevant thoughts. These results extended these theories such
that, a drivers overall driving performance was shown to be reduced when drivers
THINK about the possibility of receiving a message, but do not actually hear the alert.
These findings are in accordance with the FoMo theory (Przybylsk et al., 2013) and
extend to drivers on their smart phones.
Practical Implications
The present set of experiments had important practical guidelines for automotive
design for information presentation. These were as follows (1) when presenting
information to a driver via a visual display use images instead of text whenever
possible. (2) When attempting to restrict incoming messages or alerts to a driver be
aware of the timing they are received by the driver as well as the implications for
108
withholding their ability to engage with the device. These findings will are important to
take into account when designing how to present information to a driver.
Furthermore, these experiments had practical guidelines for how to design
warnings for a driver, specifically, a distracted MANUAL driver that is engaged with a
device. (1)Warnings given near the location of their attentional focus can be beneficial
method to break a driver’s attention with their device. (2) Drivers using their smart
phone for audio/visual tasks will respond quicker to an auditory alert than a tactile alert.
(3) Static warnings are equally beneficial as warnings that convey motion. These
findings will be important to take into account when designing and implementing new
methods to warn a manual distracted driver.
In the near future, the prevalence of autonomous vehicles on the roadways will
increase. Therefore, understanding how drivers respond during a take-over request with
an autonomous vehicle will increasingly important issue. This research was aimed at
understanding and applying warnings to drivers of autonomous vehicles that are
distracted, as they may differ from manual driving distracted and waring behaviors.
These findings too have practical implications for warning design of autonomous
vehicles in the future. Specifically (1) an automated drivers SA might actually be
improved by giving them an informative motion warning and (2) improved SA at TOR
can be accomplished by warning the driver first near or at their device and then near the
location of the danger.
109
Limitations
Although these set of experiments contained many interesting findings they are
not without limitations. First, it would have been beneficial to have included an analysis
of eye gaze and eye glance behavior via an eye-tracking system. Gaze and glance
behavior has been shown to provide insight as to what a driver’s level of trust in a
system as well as an indicator of their level of SA. Our main focus for assessing a
driver’s distraction level in these experiments was the overall brake reaction and steer
reaction times. If we had the analysis of the time it took drivers to look up after getting
an alert this would have provided a more complete picture of the re-orienting response.
Furthermore, it would have allowed us to determine whether the responses to the
warnings differed depending on whether the driver was looking at their phone or at the
roadway.
Another potential limitation of these experiments was the frequency of the
events that the driver was required to respond to. In Experiments 1-3, a potential rear-
end collision occurred roughly once every 2 minutes while in Experiment 4, the take-
over request from the automated driving system occurred after 2-6 minutes of driving.
These are; of course, at much higher frequencies than we would expect in real driving
and thus may have made drivers in the present study unnaturally attentive (Ho, Gray &
Spence, 2014).
110
Future Research
Future research is necessary to explore how information can be best conveyed so
that a driver may quickly interpret and most effectively shift their attention to the
roadway in a critical event. Different warning methods that aim to improve a driver’s SA
are worth future investigation, such as manipulating the informative warning or
combining modalities. The auditory modality could be improved to provide more tones or
auditory messages with explicit instructions on what is happening or through the use of
auditory 3-D mapping. Future research could also investigate the use of visual warning
modalities such as visual LED strips to direct attention, visual messages on the phone
itself, or hologram visual images overlaid on the windshield. The tactile modality could
be more heavily explored such as stronger tactile warnings embedded in the seat belt,
embedded in the driver’s seat or in a contained in a glove or mounted to the back of the
smart phone. A wide range of options could result in faster reaction times and may be
used in conjunction with a novel app design.
As we discovered, a driver’s perceived responsibility with the vehicle (i.e., either
manual or automated control) plays a role in how they respond to the warnings. Future
research that manipulates the driver’s expectancies and responsibilities while
simultaneously being warned is worthwhile. This could achieved by either providing
instructions about the vehicles capabilities prior to engagement or by alternating the
mode (i.e., either manual or automated) after they begin their driving session.
111
CHAPTER 7
CONCLUSION
The prevalence of drivers engaging with a smart phone for a variety of tasks is
becoming a real world concern. From the perspective that drivers ARE engaging with
their smart phone while driving, the goal of this study was to determine the most
effective methods for warning a distracted dirver. First, we were interested in what
smart phone tasks are the most distracting to the driver. Our results demonstrated that
text-based app’s/tasks contributed to the worst driving performance. Also, we found
additional evidence that is consistent with the notion that people do not want to be
removed from social connectivity or disconnected form work productivity (FoMo,
Przybylsk et al., 2013). Our results revealed that as engagement with app’s that block or
restrict incoming information that drivers are thinking about can actually lead to
impaired driving performance.
Once these initial findings were established, we had drivers engage in a
distracting task of watching videos on their smart phone while driving either manually
or as a supervisor of an autonomous vehicle. Novel to the warnings design was that they
were presented to a distracted driver via sounds or vibrations that were given near the
source of the distraction, their smart phone, in hopes to reveal an increase in their
reaction times to a critical event. The warnings attempted to convey directional
information of either moving towards the driver, away from the driver or no movement
and to understand what modality (auditory or tactile) was most effective. Specifically,
results found that warnings that were presented near a driver’s smart phone were only
beneficial to manual drivers (Experiment 3) and that simulated motion were only

112
beneficial to drivers in an autonomous vehicle (Experiment 4). While warning a
distracted driver proves to be challenging, hopefully more applied studies such as these
may shed light on alternative, novel and beneficial methods for alerting a distracted
driver.
113
References
Abe, G., & Richardson, J. (2006). Alarm timing, trust and driver expectation for forward
collision warning systems. Applied Ergonomics, 37(5), 577-586.
Ahtamad, Spence, Meng, Ho, McNabb & Gray (under review). Examining the effect of
driver distraction and tactor location on the effectiveness of tactile collision
warnings.
Aldrich, F. K., & Parkin, A. J. (1989). Listening at speed. British Journal of Visual
Impairment, 7(1), 16-18.
ATT&T Newsroom. (2015, October). Retrieved from
http://about.att.com/story/smartphone_use_while_driving_grows_beyond_texting.
html
Baddeley, A. D., & Hitch, G. J. (1974). Working memory. The psychology of learning
and motivation, 8, 47-89.
Basacik, D., Reed, N., & Robbins, R. (2012). Smartphone use while driving: a simulator
study. Berkshire, UK: Transport Research Laboratory.
Belz, S. M., Robinson, G. S., & Casali, J. G. (1999). A new class of auditory warning
signals for complex systems: Auditory icons. Human Factors: The Journal of the
Human Factors and Ergonomics Society, 41(4), 608-618.
Ben-Yaacov, A., Maltz, M., & Shinar, D. (2002). Effects of an in-vehicle collision
avoidance warning system on short-and long-term driving performance. Human
Factors: The Journal of the Human Factors and Ergonomics Society,44(2), 335-
342.
Bliss, J. P., & Acton, S. A. (2003). Alarm mistrust in automobiles: how collision alarm
reliability affects driving. Applied ergonomics, 34(6), 499-509.
Botzer, A., Musicant, O. & Perry, A. (2017). Driver behavior with a smartphone collision
warning application – A field study. Safety Science, 91, 361-372.
Burgett, A. L., Carter, A., Miller, R. J., Najm, W. G., & Smith, D. L. (1998, June). A
collision warning algorithm for rear-end collisions. In 16th International
Technical Conference on Enhanced Safety of Vehicles (ESV), Windsor, Canada.
Caird, J. K., Johnston, K. A., Willness, C. R., Asbridge, M., & Steel, P. (2014). A meta-
analysis of the effects of texting on driving. Accident Analysis & Prevention, 71
(October), 311-318.
114
Caird, J. K., Willness, C. R., Steel, P., & Scialfa, C. (2008). A meta-analysis of the
effects of cell phones on driver performance. Accident Analysis &
Prevention, 40(4), 1282-1293.
Centers for Disease Control and Prevention. Injury Prevention & Control: Motor Vehicle
Safety, Distracted Driving. Available at
http://www.cdc.gov/motorvehiclesafety/distracted_driving/ Accessed June 7,
2015
Cooper, J. M., Ingebretsen, H., & Strayer, D. L. (2014). Mental Workload of Common
Voice-Based Vehicle Interactions across Six Different Vehicle Systems.
Denton, G. G. (1980). The influence of visual pattern on perceived speed. Perception,
9(4), 393-402.
De Pisapia, N., & Braver, T. S. (2006). A model of dual control mechanisms through
anterior cingulate and prefrontal cortex interactions. Neurocomputing,69(10),
1322-1326.
Dixon, N. F., & Spitz, L. (1980). The detection of auditory visual desynchorony.
Perception, 9(6),719-721.
Drews, F. A., Pasupathi, M., & Strayer, D. L. (2008). Passenger and cell phone
conversations in simulated driving. Journal of Experimental Psychology:
Applied, 14(4), 392.
Drews, F. A., Yazdani, H., Godfrey, C. N., Cooper, J. M., & Strayer, D. L. (2009). Text
messaging during simulated driving. Human Factors: The Journal of the Human
Factors and Ergonomics Society, 51(5), 62-762. doi:10.1177/0018720809353319
Edworthy, J. (1994). The design and implementation of non-verbal auditory warnings.
Applied ergonomics, 25(4), 202-210.
Edworthy, J., Stanton, N., & Hellier, E. (1995). Warnings in research and practice.
Ergonomics 38(11), 2145-2154.
Ferris, T., Penfold, R., Hameed, S., & Sarter, N. (2006, October). The implications of
crossmodal links in attention for the design of multimodal interfaces: A driving
simulation study. In Proceedings of the Human Factors and Ergonomics Society
Annual Meeting (Vol. 50, No. 3, pp. 406-409). Sage Publications.
Fitch, G. M., Kiefer, R. J., Hankey, J. M., & Kleiner, B. M. (2007). Toward developing
an approach for alerting drivers to the direction of a crash threat. Human Factors:
The Journal of the Human Factors and Ergonomics Society,49(4), 710-720.
115
Fricke, N., & Thüring, M. (2009, October). Complementary audio-visual collision
warnings. Proceedings of the Human Factors and Ergonomics Society Annual
Meeting (Vol. 53, No. 23, pp. 1815-1819). Sage Publications.
Friedenberg, J., & Silverman, G. (2011). Cognitive science: An introduction to the study
of mind. Sage.
Graham-Little, E. (1934). The Human Factor in Road Accidents. British medical journal,
1(3824), 730.
Graham, R. (1999). Use of auditory icons as emergency warnings: evaluation within a
vehiclecollision avoidance application. Ergonomics, 42(9), 1233-1248.
Gray, R. (2005). The use and misuse of visual information for “go/no-go” decisions in
driving. Hennessy, D. & Wiesenthal, D. (Eds.).Contemporary Issues in Traffic
Research and Road User Safety. pp. 125-133. New York: Nova Science
Publishers.
Gray, R. (2011). Looming auditory collision warnings for driving. Human Factors: The
Journal of the Human Factors and Ergonomics Society, 53(1), 63-74.
Gray, R., Ho, C., & Spence, C. (2014). A comparison of different informative vibrotactile
forward collision warnings: Does the warning need to be linked to the collision
event? PLoS ONE 9(1): e87070. doi:10.1371/journal.pone.0087070
Gray, R., & Tan, H. Z. (2002). Dynamic and predictive links between touch and
vision. Experimental Brain Research, 145(1), 50-55.
Hanowski, R., & Kantowitz, B. (1997). Driver memory retention of in-vehicle
information system messages. Transportation Research Record: Journal of the
Transportation Research Board, (1573), 8-16.
Hawkins Jr, H., Womack, K. N., & Mounce, J. M. (1993). Driver comprehension of
regulatory signs, warning signs, and pavement markings. Transportation research
record, (1403).
He, J., Chaparro, A., Nguyen, B., Burge, R. J., Crandall, J., Chaparro, B., ... & Cao, S.
(2014). Texting while driving: Is speech-based text entry less risky than handheld
text entry?. Accident Analysis & Prevention, 72, 287-295.
Ho, C. C., Gray, R., & Spence, C. (2014). Reorienting driver attention with dynamic
tactile cues. Haptics, IEEE Transactions on, 7(1), 86-94.
116
Ho, C., Gray, R., & Spence, C. (2014). To what extent do the findings of laboratory-
based spatial attention research apply to the real-world setting of driving? IEEE
Transactions on Human-Machine Systems, 44, 524-530
Ho, C., Santangelo, V., & Spence, C. (2009). Multisensory warning signals: when spatial
correspondence matters. Experimental Brain Research, 195(2), 261-272.
Ho, C., & Spence, C. (2005). Assessing the effectiveness of various auditory cues in
capturing a driver's visual attention. Journal of experimental psychology:
Applied, 11(3), 157.
Ho, C. and C. Spence (2008). The multisensory driver: Implications for ergonomic car
interface design. Aldershot: Ashgate.
Ho, C., Spence, C., & Gray, R. (2013). Looming auditory and vibrotactile collision
warnings for safe driving. Proceedings of 7th International Driving Symposium
on Human Factors in Driver Assessment, Training, and Vehicle Design, 551-557,
Bolton Landing, NY.
Ho, C., Reed, N., & Spence, C. (2006). Assessing the effectiveness of “intuitive”
vibrotactile warning signals in preventing front-to-rear-end collisions in a driving
simulator. Accident Analysis & Prevention, 38(5), 988-996.
Ho, C., Reed, N., & Spence, C. (2007). Multisensory in-car warning signals for collision
avoidance. Human Factors: The Journal of the Human Factors and Ergonomics
Society, 49(6), 1107-1114.
Holmes, N. P., & Spence, C. (2005). Multisensory integration: space, time and
superadditivity. Current Biology, 15(18), R762-R764.
Horrey, W. J., Lesch, M. F., & Garabet, A. (2008). Assessing the awareness of
performance decrements in distracted drivers. Accident Analysis &
Prevention,40(2), 675-682.
Horrey, W. J., & Wickens, C. D. (2006). Examining the impact of cell phone
conversations on driving using meta-analytic techniques. Human Factors: The
Journal of the Human Factors and Ergonomics Society, 48(1), 196-205.
Horrey, W. J., Wickens, C. D., & Alexander, A. L. (2003). The effects of head-up
display clutter and in-vehicle display separation on concurrent driving
performance. In Proceedings of the Human Factors and Ergonomics Society
Annual Meeting (Vol. 47, No. 16, pp. 1880-1884). SAGE Publications.
117
Hosking, S. G., Young, K. L., & Regan, M. A. (2009). The effects of text messaging on
young drivers. Human Factors: The Journal of the Human Factors and
Ergonomics society, 51(4), 582-582.
Jones, W. D. (2002). Building safer cars. Spectrum, IEEE, 39(1), 82-85.
Kahneman, D. (1973). Attention and effort (p. 246). Englewood Cliffs, NJ: Prentice-Hall.
Kane, M. J., & Engle, R. W. (2002). The role of prefrontal cortex in working-memory
capacity, executive attention, and general fluid intelligence: An individual-
differences perspective. Psychonomic bulletin & review, 9(4), 637-671.
Kane, M. J., & Engle, R. W. (2003). Working-memory capacity and the control of
attention: the contributions of goal neglect, response competition, and task set to
Stroop interference. Journal of experimental psychology: General, 132(1), 47.
Klüver, M., Herrigel, C., Heinrich, C., Schöner, H. P., & Hecht, H. (2016). The
behavioral validity of dual-task driving performance in fixed and moving base
driving simulators. Transportation research part F: traffic psychology and
behaviour, 37, 78-96.
Kiefer, R. J. (2000). Developing a forward collision warning system timing and interface
approach by placing drivers in realistic rear-end crash situations. In Proceedings
of the XIVth Triennial Congress of the International Ergonomics Association and
44th Annual Meeting of the Human Factors and Ergonomics Society (Vol. 3, pp.
308–311). Santa Monica, CA: Human Factors and Ergonomics Society
Lee, J. D. (2014). Dynamics of driver distraction: The process of engaging and
disengaging. Annals of advances in automotive medicine, 58, 24.
Lee, J. (2014). Integrating the saliency map with distract-r to assess driver distraction of
vehicle displays (Doctoral dissertation, THE UNIVERSITY OF WISCONSIN-
MADISON).
Lee, J. D., McGehee, D. V., Brown, T. L., & Reyes, M. L. (2002). Collision warning
timing, driver distraction, and driver response to imminent rear-end collisions in a
high-fidelity driving simulator. Human Factors: The Journal of the Human
Factors and Ergonomics Society, 44(2), 314-334.
Lee, J. D., Regan, M. A. & Young, K. L. (2008). Defining driver distraction. Driver
distraction: Theory, effects, and mitigation, 31-40.

118
Lee, J. H., & Spence, C. (2008, September). Assessing the benefits of multimodal
feedback on dual-task performance under demanding conditions. In Proceedings
of the 22nd British HCI Group Annual Conference on People and Computers:
Culture, Creativity, Interaction-Volume 1 (pp. 185-192). British Computer
Society.
Louw, T., Merat, N., & Jamson, H. (2015). Engaging with highly automated driving: to
be or not to be in the loop. In 8th International Driving Symposium on Human
Factors in Driver Assessment, Training and Vehicle Design.
Louw, T., & Merat, N. (2017). Are you in the loop? Using gaze dispersion to understand
driver visual attention during vehicle automation. Transportation Research Part
C: Emerging Technologies, 76, 35-50.
Maretzke, J., & Jacob, U. (1992). Distance warning and control as a means of increasing
road safety and ease of operation. In XXIV FISITA CONGRESS, 7-11 JUNE 1992,
LONDON. HELD AT THE AUTOMOTIVE TECHNOLOGY SERVICING
SOCIETY. TECHNICAL PAPERS. SAFETY, THE VEHICLE AND THE ROAD.
VOLUME 1 (IMECHE NO C389/359 AND FISITA NO 925214).
Mason, M. F., Norton, M. I., Van Horn, J. D., Wegner, D. M., Grafton, S. T., & Macrae,
C. N. (2007). Wandering minds: the default network and stimulus-independent
thought. Science, 315(5810), 393-395.
McCartt, A. T., & Geary, L. L. (2004). Longer term effects of New York State’s law on
drivers’ handheld cell phone use. Injury prevention, 10(1), 11-15.
McEvoy, S. P., Stevenson, M. R., & Woodward, M. (2007). The contribution of
passengers versus mobile phone use to motor vehicle crashes resulting in hospital
attendance by the driver. Accident Analysis & Prevention, 39(6), 1170-1176.
McNabb, J., & Gray, R. (2016). Staying connected on the road: a comparison of different
types of smart phone use in a driving simulator. PLoS one, 11(2), e0148555.
McVay, J. C., & Kane, M. J. (2009). Conducting the train of thought: working memory
capacity, goal neglect, and mind wandering in an executive-control task. Journal
of Experimental Psychology: Learning, Memory, and Cognition,35(1), 196.
Meng, F., Gray, R., Ho, C., Ahtamad, M., & Spence, C. (2015). Dynamic vibrotactile
signals for forward collision avoidance warning systems. Human factors, 57(2),
329-346.
Meng, F., & Spence, C. (2015). Tactile warning signals for in-vehicle systems. Accident
Analysis & Prevention, 75, 333-346.
119
Merat, N., Jamson, A. H., Lai, F. C., Daly, M., & Carsten, O. M. (2014). Transition to
manual: Driver behaviour when resuming control from a highly automated
vehicle. Transportation research part F: traffic psychology and behaviour, 27,
274-282.
Mohebbi, R., Gray, R., & Tan, H. Z. (2009). Driver reaction time to tactile and auditory
rear-end collision warnings while talking on a cell phone. Human Factors: The
Journal of the Human Factors and Ergonomics Society, 51(1), 102-110.
Musicant, O. & Lotan, T. (2016). Can novice drivers be motivated to use a smartphone
based app that monitors their behavior? Transportation Research Part F: Traffic
Psychology and Behaviour, 42, 544–557
Nasar, J., Hecht, P., & Wener, R. (2008). Mobile telephones, distracted attention, and
pedestrian safety. Accident Analysis & Prevention, 40(1), 69-75.
National Highway Traffic Safety Administration. (2013). Traffic safety facts 2013: A
compilation of motor vehicle crash data from the fatality analysis reporting
system and the general estimates system (NHTSA Publication No. DOT- HS-810-
818). Washington, DC: U.S. Department of Transportation.
Navarro, J., Mars, F., & Hoc, J. M. (2007). Lateral control assistance for car drivers: a
comparison of motor priming and warning systems. Human Factors: The Journal
of the Human Factors and Ergonomics Society, 49(5), 950-960.
Parasuraman, R., Hancock, P. A., & Olofinboba, O. (1997). Alarm effectiveness in
driver-centred collision-warning systems. Ergonomics, 40(3), 390-399.
Patterson, R. D. (1989). Guidelines for the design of auditory warning sounds.
In Proceedings of the Institute of Acoustics 1989 Spring Conference (Vol. 11, No.
5, pp. 17-24).
Peters, G. A., & Peters, B. J. (2001). The distracted driver. The journal of the Royal
Society for the Promotion of Health, 121(1), 23-28.
Pew Research http://www.pewinternet.org/fact-sheets/mobile-technology-fact-sheet/
Posner, M. I. (1980). Orienting of attention. Quarterly journal of experimental
psychology 32(1), 3-25.
Posner, M. I., Snyder, C. R., & Davidson, B. J. (1980). Attention and the detection of
signals. Journal of experimental psychology: General, 109(2), 160.
120
Przybylski, A. K., Murayama, K., DeHaan, C. R., & Gladwell, V. (2013). Motivational,
emotional, and behavioral correlates of fear of missing out. Computers in Human
Behavior, 29(4), 1841-1848.
Regan, M. A., & Strayer, D. L. (2014). Towards an understanding of driver inattention:
taxonomy and theory. Annals of advances in automotive medicine, 58, 5.
Sahayadhas, A., Sundaraj, K., & Murugappan, M. (2012). Detecting driver drowsiness
based on sensors: a review. Sensors, 12(12), 16937-16953.
Sanbonmatsu, D. M., Strayer, D. L., Behrends, A. A., Ward, N., & Watson, J. M. (2016).
Why drivers use cell phones and support legislation to restrict this practice.
Accident Analysis & Prevention, 93, 22-33
Santangelo, V., & Spence, C. (2007). Multisensory cues capture spatial attention
regardless of perceptual load. Journal of Experimental Psychology: Human
Perception and Performance, 33(6), 1311.
Saiprasert, C., Supakwong, S., Sangjun, W., & Thajchayapong, S. (2014). Effects of
smartphone usage on driver safety level performance in urban road conditions. 1-
6. doi:10.1109/ECTICon.2014.6839778
Salvendy, G. (2012). Handbook of human factors and ergonomics. John Wiley & Sons.
Salvucci, D. D., Zuber, M., Beregovaia, E., & Markley, D. (2005, April). Distract-R: Rapid
prototyping and evaluation of in-vehicle interfaces. In Proceedings of the SIGCHI
conference on Human factors in computing systems (pp. 581-589). ACM.
Scott, J. J. & Gray, R. (2008). Comparison of visual, auditory and tactile warnings for
rear-end collision prevention in driving. Human Factors, 50, 264-275.
Selcon, S. J., Taylor, R. M., & McKenna, F. P. (1995). Integrating multiple information
sources: Using redundancy in the design of warnings. Ergonomics,38(11), 2362-
2370.
Simons, D. J., Chabris, C. F., (2015, October). A Simple Solution for Distracted Driving.
The Wall Street Journal. Retrieved from http://www.wsj.com/articles/a-simple-
solution-for-distracted-driving-1446218317
Six Annual State Farm Distracted Driving Survey (2014).
http://www.multivu.com/players/English/7292854-state-farm-distracted-driving-
survey cellphone-use/
121
Smith, P., Shah, M., & da Vitoria Lobo, N. (2003). Determining driver visual attention
with one camera. IEEE Transactions on Intelligent Transportation Systems, 4(4),
205-218. doi:10.1109/TITS.2003.821342
Sojourner, R. J., & Antin, J. F. (1990). The effects of a simulated head-up display
speedometer on perceptual task performance. Human Factors: The Journal of the
Human Factors and Ergonomics Society, 32(3), 329-339.
Spence, C., & Driver, J. (1997). Cross-modal links in attention between audition, vision,
and touch: Implications for interface design. International Journal of Cognitive
Ergonomics, 1(4), 351-373.
Spence, C., & Ho, C. (2012). The multisensory driver: Implications for ergonomic car
interface design. Ashgate Publishing, Ltd..
Spence, C., & Squire, S. (2003). Multisensory integration: maintaining the perception of
synchrony. Current Biology, 13(13), R519-R521.
Stein, B. E., & Meredith, M. A. (1993). The merging of the senses. The MIT Press.
Stothart, C., Mitchum, A., & Yehnert, C. (2015). The attentional cost of receiving a cell
phone notification. Journal of experimental psychology: human perception and
performance,41(4), 893.
Straughn, S. M., Gray, R., & Tan, H. Z. (2009). To go or not to go: Stimulus-response
compatibility for tactile and auditory pedestrian collision warnings. Haptics,
IEEE Transactions on, 2(2), 111-117.
Strayer, D. L. (2015). Is the Technology in Your Car Driving You to Distraction?. Policy
insights from the behavioral and brain sciences, 2(1), 157-165.
Strayer, D. L., Cooper, J. M., & Drews, F. A. (2004, September). What do drivers fail to
see when conversing on a cell phone?. In Proceedings of the Human Factors and
Ergonomics Society Annual Meeting (Vol. 48, No. 19, pp. 2213-2217). SAGE
Publications.
Strayer, D. L., & Drews, F. A. (2007). Cell-phone–induced driver distraction.Current
Directions in Psychological Science, 16(3), 128-131.
Strayer, D. L., Drews, F. A., & Johnston, W. A. (2003). Cell phone-induced failures of
visual attention during simulated driving. Journal of experimental psychology:
Applied, 9(1), 23.
Strayer, D. L., & Johnston, W. A. (2001). Driven to distraction: Dual-task studies of
simulated driving and conversing on a cellular telephone. Psychological
science, 12(6), 462-466.
122
Stutts, J., Feaganes, J., Rodgman, E., Hamlett, C., Reinfurt, D., Gish, K., ... & Staplin, L.
(2003). The causes and consequences of distraction in everyday driving.
In Annual Proceedings/Association for the Advancement of Automotive
Medicine (Vol. 47, p. 235). Association for the Advancement of Automotive
Medicine.
Sundeen, M. (2005). Cell Phones and Highway Safety. In National conference of state
legislatures (p. 2).
Van Erp, J. B., & Van Veen, H. A. (2004). Vibrotactile in-vehicle navigation system.
Transportation Research Part F: Traffic Psychology and Behaviour,7(4), 247-
256.
vanWinsum, W., & Heino, A. (1996). Choice of time-headway in car-following and the
role of time- to- collision information in braking. Ergonomics, 39(4), 579-592.
Watson, J. M., & Strayer, D. L. (2010). Supertaskers: Profiles in extraordinary
multitasking ability. Psychonomic Bulletin & Review, 17(4), 479-485.
Wickens, C. D., Martin-Emerson, R., & Larish, I. (1993). Attentional tunneling and the
head-up display.
Wilson, F. A., & Stimpson, J. P. (2010). Trends in fatalities from distracted driving in the
United States, 1999 to 2008. American journal of public health,100(11), 2213-
2219.
Yanko, M. R., & Spalek, T. M. (2013). Driving with the wandering mind the effect that
mind-wandering has on driving performance. Human Factors: The Journal of the
Human Factors and Ergonomics Society, 0018720813495280.
Young, K. L., Rudin-Brown, C. M., Patten, C., Ceci, R., & Lenné, M. G. (2014). Effects
of phone type on driving and eye glance behaviour while text-messaging. Safety
Science, 68, 47-54. doi:10.1016/j.ssci.2014.02.018
Zeeb, K., Buchner, A., & Schrauf, M. (2015). What determines the take-over time? An
integrated model approach of driver take-over after automated driving. Accident
Analysis & Prevention, 78, 212-221.
Zeigarnik, B. (1938). On finished and unfinished tasks. A source book of Gestalt
psychology, 1, 300-314.

123
APPENDIX A
NASA-TLX TASK

124

125
APPENDIX B
PERMISSION OF USE

126
Co-author, Rob Gray, has granted his permission of use of Chapter 1 publication.
McNabb, J., & Gray, R. (2016). Staying connected on the road: a comparison of different
types of smart phone use in a driving simulator. PLoS one, 11(2), e0148555.