warm-up. graphing inequalities less than fewer than greater than more than exceeds less than or...
TRANSCRIPT
WARM-UP Write the values that would make the inequality true, and the values that would make the inequality false.
1.
2.
3.
Define what each symbol means and give an example of it being used.
4.
5.
6.
7.
GRAPHING INEQUALITIES
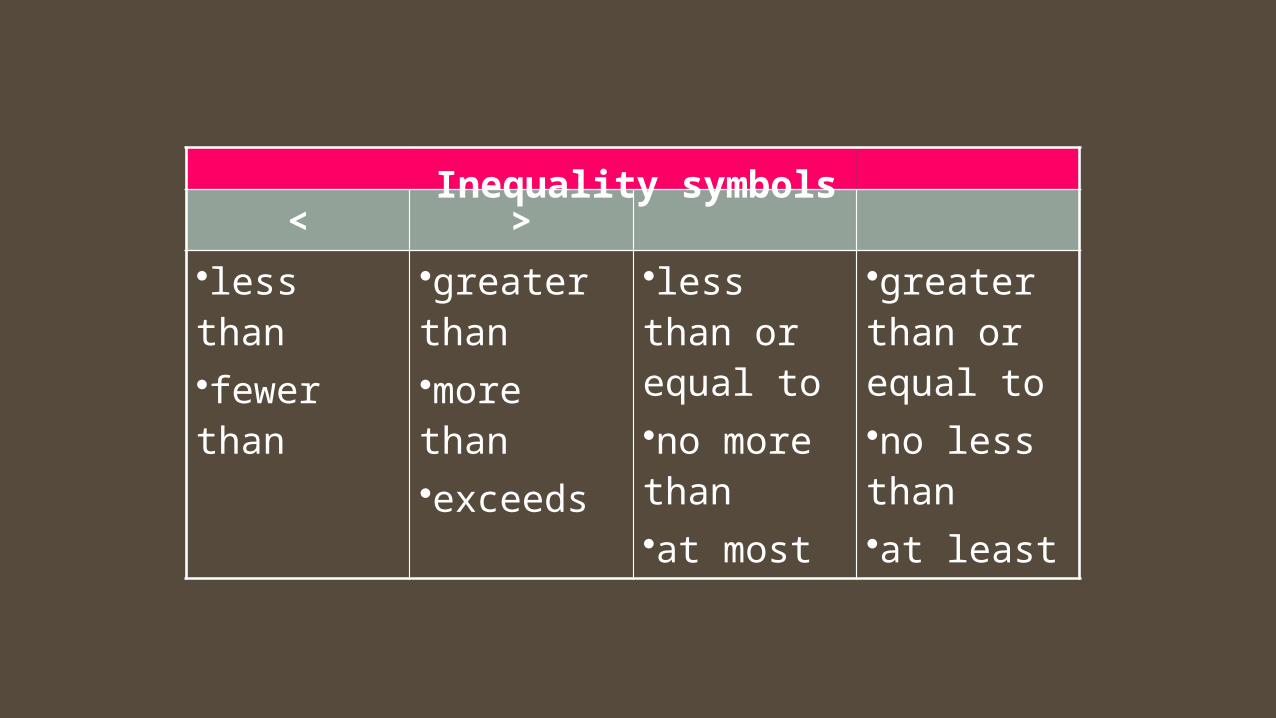
< >•less than•fewer than
•greater than•more than•exceeds
•less than or equal to•no more than•at most
•greater than or equal to•no less than•at least
Inequality symbols
GRAPHING INEQUALITIES
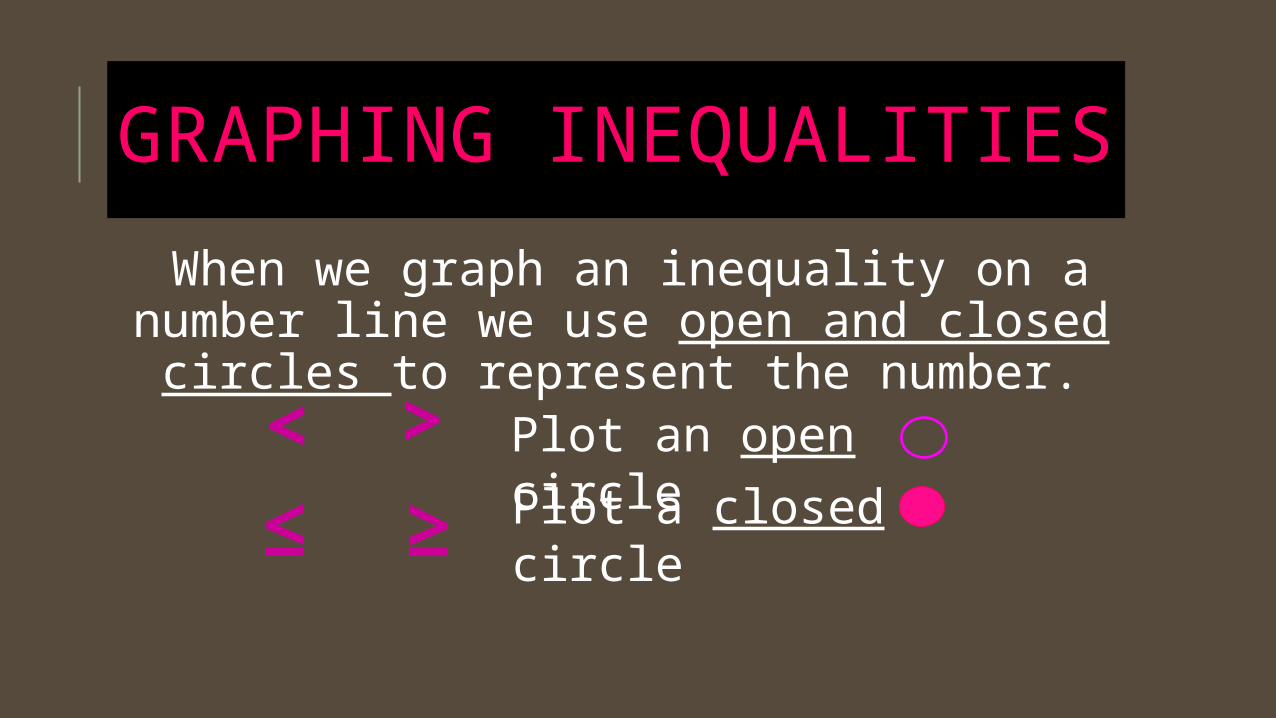
When we graph an inequality on a number line we use open and closed
circles to represent the number.<
<
Plot a closed circle≤ ≥Plot an open circle
Graphing Inequalities
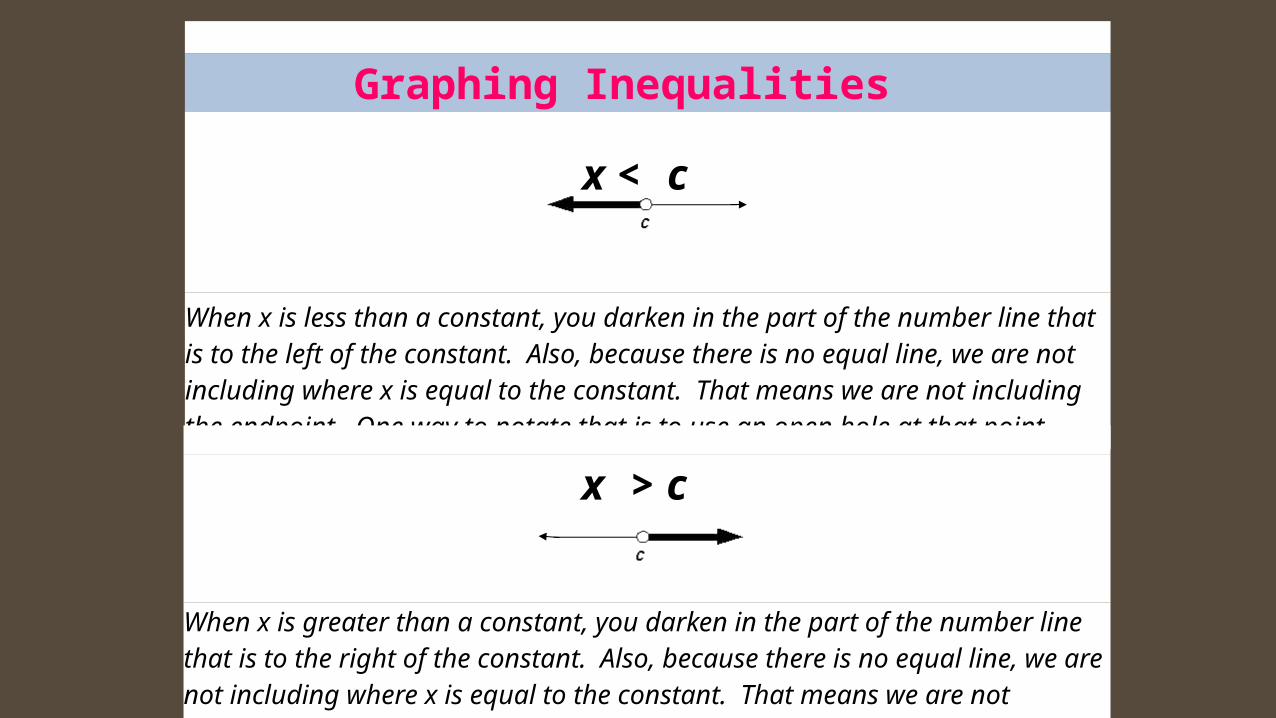
x < c
When x is less than a constant, you darken in the part of the number line that is to the left of the constant. Also, because there is no equal line, we are not including where x is equal to the constant. That means we are not including the endpoint. One way to notate that is to use an open hole at that point.
x > c
When x is greater than a constant, you darken in the part of the number line that is to the right of the constant. Also, because there is no equal line, we are not including where x is equal to the constant. That means we are not including the endpoint. One way to notate that is to use an open hole at that point.
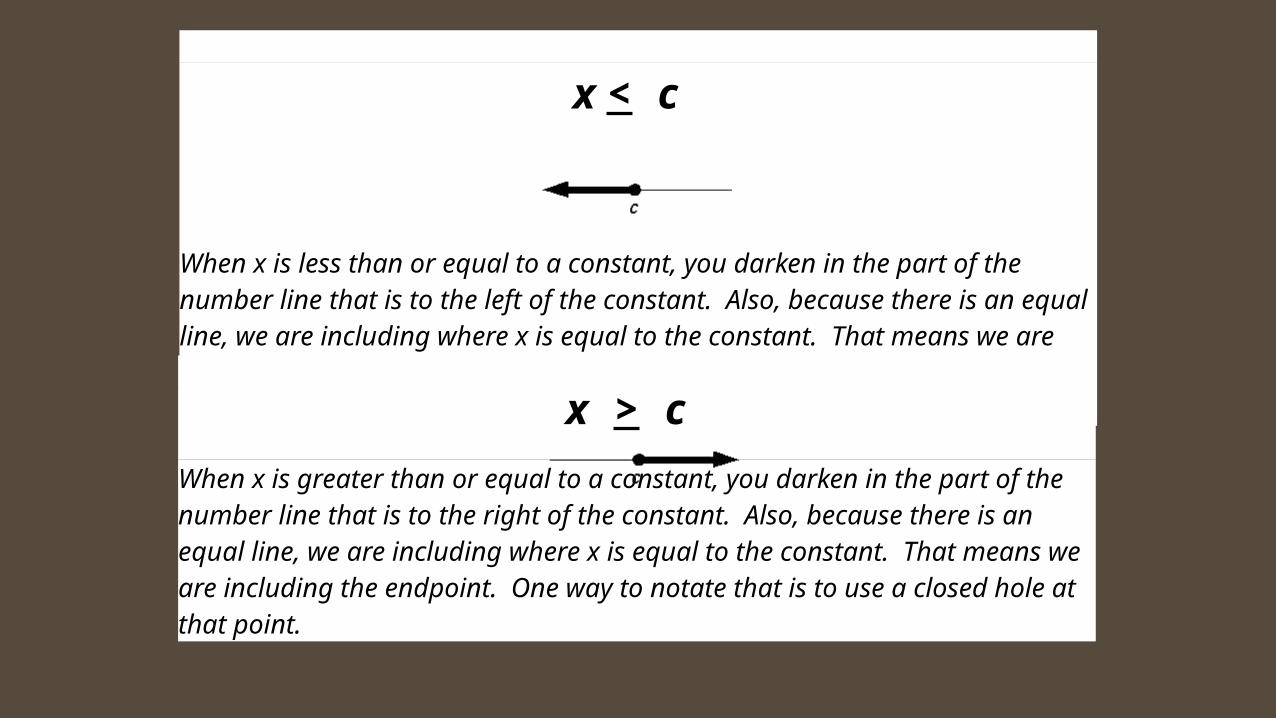
x < c
When x is less than or equal to a constant, you darken in the part of the number line that is to the left of the constant. Also, because there is an equal line, we are including where x is equal to the constant. That means we are including the endpoint. One way to notate that is to use an closed hole at that point.
x > c
When x is greater than or equal to a constant, you darken in the part of the number line that is to the right of the constant. Also, because there is an equal line, we are including where x is equal to the constant. That means we are including the endpoint. One way to notate that is to use a closed hole at that point.
x > c
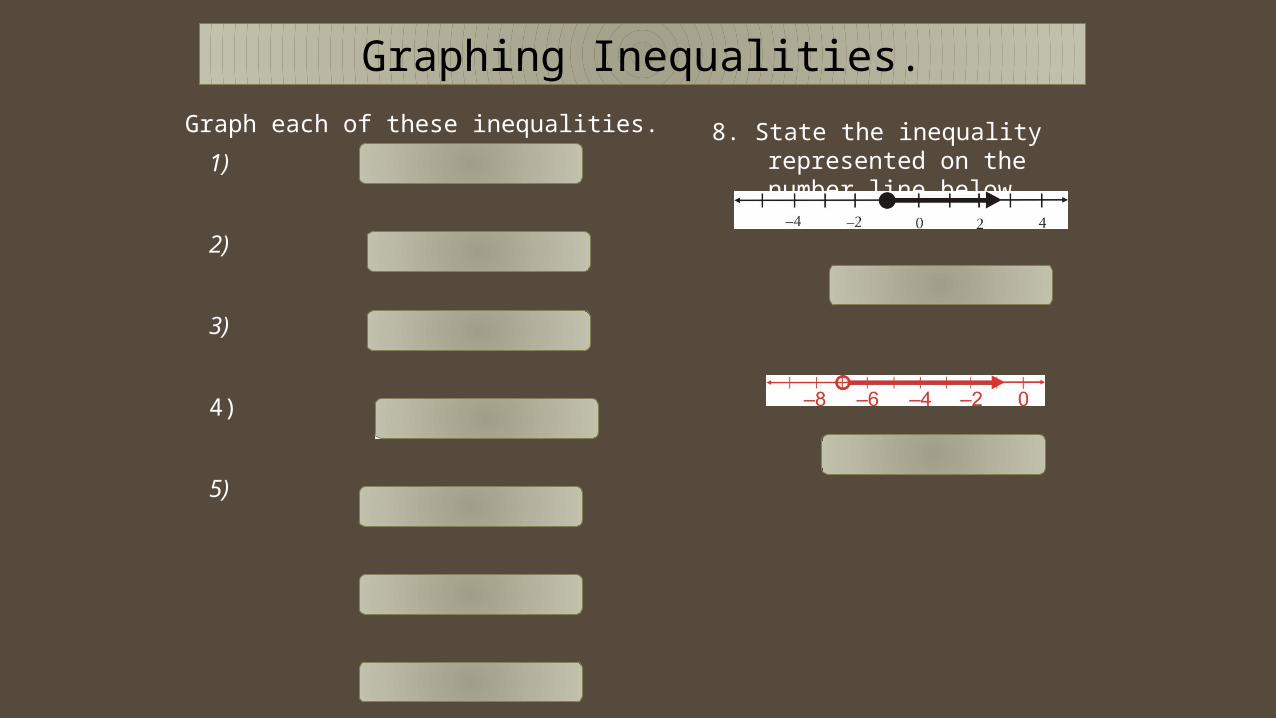
Graph each of these inequalities.
Graphing Inequalities.
1)
2)
3)
4)
5)
8. State the inequality represented on the number line below.
𝒙≥ −𝟏
−7<𝑦
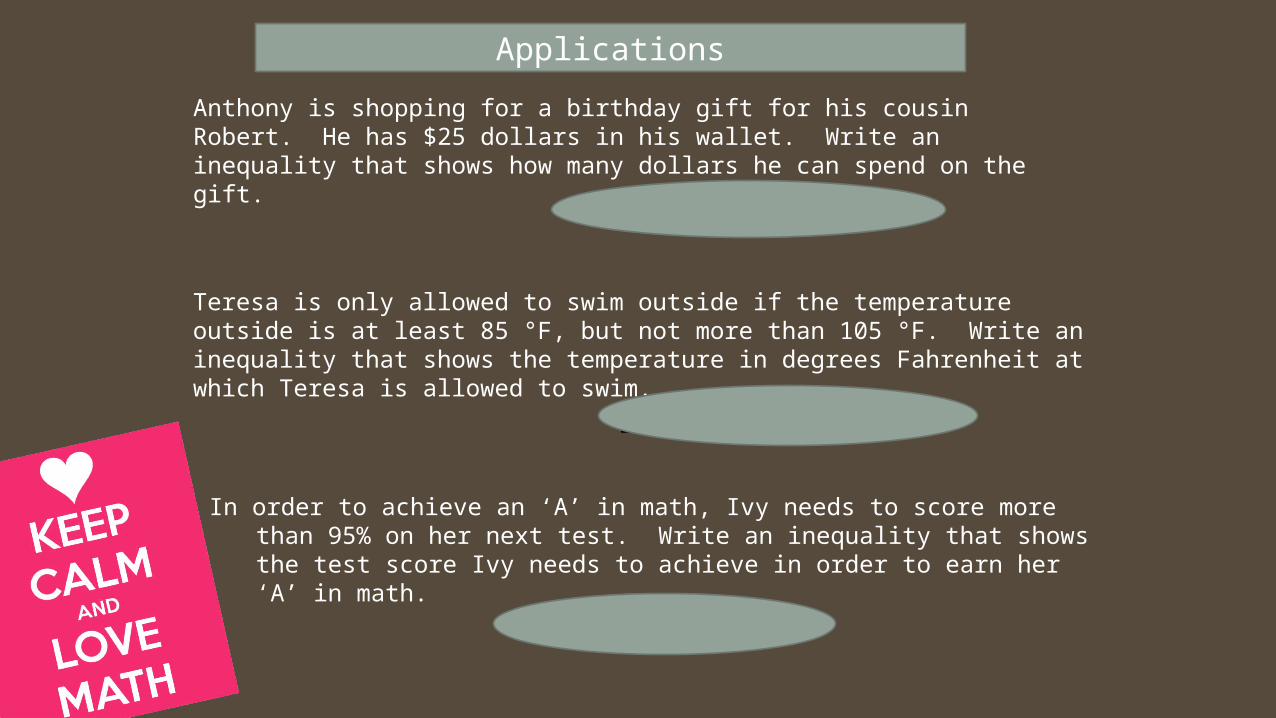
Anthony is shopping for a birthday gift for his cousin Robert. He has $25 dollars in his wallet. Write an inequality that shows how many dollars he can spend on the gift.
Teresa is only allowed to swim outside if the temperature outside is at least 85 °F, but not more than 105 °F. Write an inequality that shows the temperature in degrees Fahrenheit at which Teresa is allowed to swim.
𝟏𝟎𝟓>𝒕≥𝟖𝟓
In order to achieve an ‘A’ in math, Ivy needs to score more than 95% on her next test. Write an inequality that shows the test score Ivy needs to achieve in order to earn her ‘A’ in math.
𝒔>𝟗𝟓
Applications
Jim needs to build a house on Minecraft with at least 20 diamond ore blocks; however, he can’t use more than the 35 he has mined.
In order to build a certain fort on Minecraft, Kaylee can’t use more than 80 wooden plank blocks. But in order to make a decent fort to survive the zombies, Kaylee needs to use more than 50 wooden plank blocks.
𝟖𝟎>𝒃>𝟓𝟎Caden is remodelling his home on Minecraft. He has at least $40 to spend on the
remodel, but can’t spend more than $150.
𝟏𝟓𝟎≥ 𝒔≥𝟒𝟎
Applications