walla walla – 17070102 - usda · pdf filewalla walla – 17070102 8-digit hydrologic...
TRANSCRIPT

Walla Walla – 17070102 8-Digit Hydrologic Unit Profile
AUGUST 2005
FINAL
Introduction
The Oregon portion of the Walla Walla 8-Digit Hydrologic Unit Code (HUC) subbasin consists of 308,100 acres, of which 97 percent is in Umatilla County. Eighty percent of the subbasin is privately owned. Operations more than 500 acres in size make up 14 percent of all the farms and ranches in this part of the subbasin. These farms and ranches are used primarily for dryland crops and as rangeland and forestland. Mid-size operations consist primarily of irrigated hay and pasture, and the smaller but much more numerous operations (65 percent of total), are used mainly for horse pastures, row crops, orchards, and vineyards.
WA
Resource concerns include sheet and rill erosion, surface water contamination, inadequate irrigation water management, and poor habitat for fish and wildlife. Social concerns related to resource management include unreliable profitability and inadequate cost share programs. Conservation assistance in Oregon is provided by one NRCS service center, two soil and water conservation districts, the Columbia Blue Mountain Resource Conservation and Development (RC&D) office, and the Mission satellite office, which serves the Umatilla Indian Reservation.
Profile Contents Introduction
Produced by the Water Resources Planning Team Portland, OR
The United States Department of Agriculture (USDA) prohibits discrimination in all its programs and activities on the basis of race, color, national origin, sex, religion, age, disability, political beliefs, sexual orientation, and marital or family status. (Not all prohibited bases apply to all programs.) Persons with disabilities who require alternative means for communication of program information (Braille, large print, audiotape, etc.) should contact USDA’s TARGET Center at 202-720-2600 (voice and TDD).
To file a complaint of discrimination, write USDA, Director, Office of Civil Rights, Room 326W, Whitten Building, 14th and Independence Avenue, SW, Washington DC 20250-9410 or call (202) 720-5964 (voice and TDD). USDA is an equal opportunity provider and employer.
WA
Physical DescriptionLand Use Map & Precipitation Map Common Resource Area
Resource ConcernsCensus and Social Data Progress/StatusFootnotes/Bibliography
Relief Map

Walla Walla – 17070102
8-Digit Hydrologic Unit Profile AUGUST 2005
FINAL
Physical Description Back to Contents
AALLLL NNUUMMBBEERRSS IINN TTHHIISS PPRROOFFIILLEE AARREE FFOORR OORREEGGOONN OONNLLYY
Ownership - (2003 Draft BLM Surface Map Set/1)
Public Private Tribal Land Cover/Land Use
(NLCD/2) Acres % Acres % Acres %
Totals %
Forest 44,000 14% 51,700 17% 0 0% 95,700 31%
Grain Crops --- * 81,000 26% 0 0% 81,500 26%
Conservation Reserve Program Land a
--- * 17,100 6% 0 0% 17,100 6%
Grass/Pasture/Hay 5,800 2% 30,800 10% 0 0% 36,600 12%
Orchards/Vineyards 0 0% 3,300 1% 0 0% 3,300 1%
Row Crops 0 0% 7,600 2% 0 0% 7,600 2%
Shrub/Rangelands 9,400 3% 52,900 17% 0 0% 62,300 20%
Water/Wetlands/Developed/Barren --- * 3,800 1% 0 0% 3,800 1%
Oregon HUC Totals b 59,900 19% 248,200 81% 0 0% 308,100 100%
*: Less than one percent of total acres. See below for special considerations. a: Estimate from Farm Service Agency records and includes CRP/CREP. b: Totals are approximate due to rounding and small unknown acreages.
Special Considerations for this 8-Digit HUC:
Both irrigated and dryland wheat are grown in the watershed.
Row crops are grown in rotation with irrigated wheat. Row crops include corn, potatoes, and
onions.
Approximately 50 percent of the private forestland is under industrial forest ownership.
Type of Land ACRES % of
Irrigated Lands % of HUC
Cultivated Cropland 25,100 85% 8%
Uncultivated Cropland 4,600 15% 1%
Pastureland 0 0% 0%
Irrigated Lands
(1997 NRI/3 Estimates for Non-Federal Lands Only)
Total Irrigated Lands 29,700 100% 9%
(Continued on the following pages)
2 of 12 Last printed 3/13/2006 1:22 PM March 13, 2006

Walla Walla – 17070102
8-Digit Hydrologic Unit Profile AUGUST 2005
FINAL
Back to Contents
3 of 12 Last printed 3/13/2006 1:22 PM March 13, 2006
Walla Walla – 17070102
8-Digit Hydrologic Unit Profile AUGUST 2005
FINAL
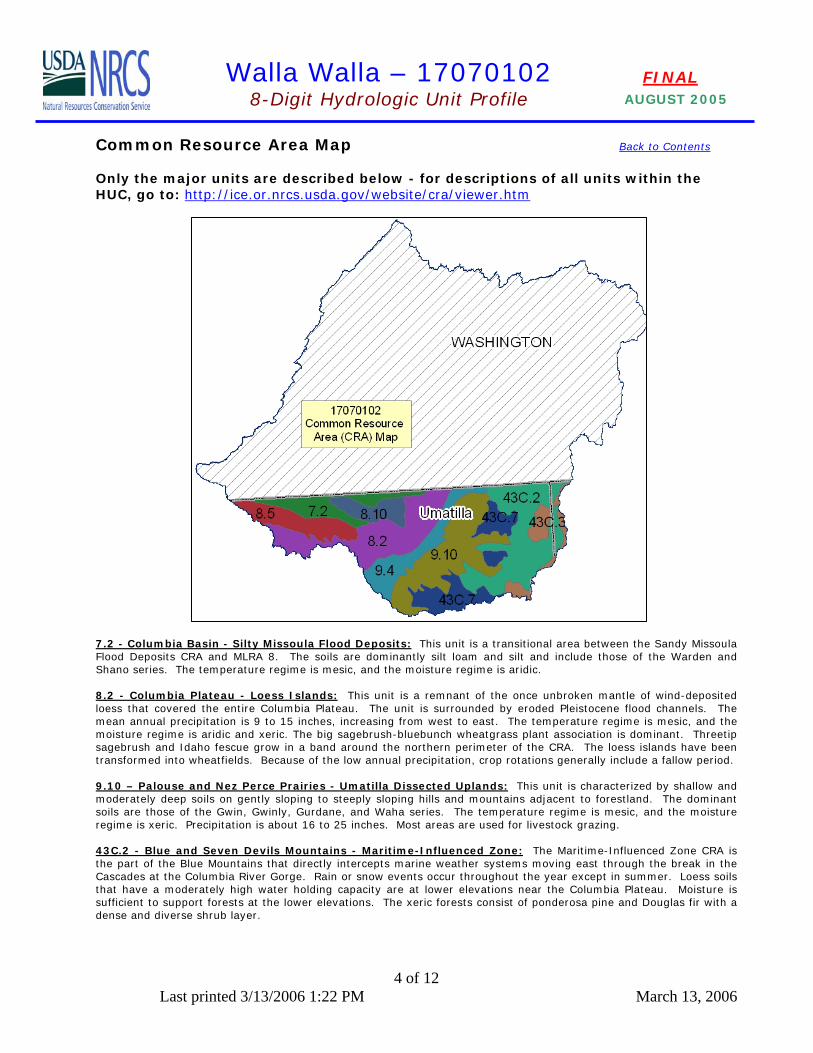
Common Resource Area Map Back to Contents
Only the major units are described below - for descriptions of all units within the HUC, go to: http://ice.or.nrcs.usda.gov/website/cra/viewer.htm
7.2 - Columbia Basin - Silty Missoula Flood Deposits: This unit is a transitional area between the Sandy Missoula Flood Deposits CRA and MLRA 8. The soils are dominantly silt loam and silt and include those of the Warden and Shano series. The temperature regime is mesic, and the moisture regime is aridic. 8.2 - Columbia Plateau - Loess Islands: This unit is a remnant of the once unbroken mantle of wind-deposited loess that covered the entire Columbia Plateau. The unit is surrounded by eroded Pleistocene flood channels. The mean annual precipitation is 9 to 15 inches, increasing from west to east. The temperature regime is mesic, and the moisture regime is aridic and xeric. The big sagebrush-bluebunch wheatgrass plant association is dominant. Threetip sagebrush and Idaho fescue grow in a band around the northern perimeter of the CRA. The loess islands have been transformed into wheatfields. Because of the low annual precipitation, crop rotations generally include a fallow period. 9.10 – Palouse and Nez Perce Prairies - Umatilla Dissected Uplands: This unit is characterized by shallow and moderately deep soils on gently sloping to steeply sloping hills and mountains adjacent to forestland. The dominant soils are those of the Gwin, Gwinly, Gurdane, and Waha series. The temperature regime is mesic, and the moisture regime is xeric. Precipitation is about 16 to 25 inches. Most areas are used for livestock grazing. 43C.2 - Blue and Seven Devils Mountains - Maritime-Influenced Zone: The Maritime-Influenced Zone CRA is the part of the Blue Mountains that directly intercepts marine weather systems moving east through the break in the Cascades at the Columbia River Gorge. Rain or snow events occur throughout the year except in summer. Loess soils that have a moderately high water holding capacity are at lower elevations near the Columbia Plateau. Moisture is sufficient to support forests at the lower elevations. The xeric forests consist of ponderosa pine and Douglas fir with a dense and diverse shrub layer.
4 of 12 Last printed 3/13/2006 1:22 PM March 13, 2006

Walla Walla – 17070102
8-Digit Hydrologic Unit Profile AUGUST 2005
FINAL
Physical Description – Continued Back to Contents
ACRES ACRE-FEET
Surface 26,349 87,650
Well 28,209 93,836 Irrigated Adjudicated Water Rights (OWRD/4)
Total Irrigated Adjudicated Water Rights 54,558 181,485
Total Avg. Yield 414,370 Stream Flow Data
USGS 14018500 WALLA WALLA RIVER, NEAR TOUCHET, WA
May – Sept. Yield 65,659
MILES PERCENT
Total Miles – Major (100K Hydro GIS Layer) 205 ---
303d/TMDL Listed Streams (DEQ) 96.7 47%
Anadromous Fish Presence (StreamNet) 60.6 30%
Stream Data/5 *Percent of Total Miles of Streams in HUC
Bull Trout Presence (StreamNet) 113.4 55%
ACRES PERCENT
Forest 4,830 34%
Grain Crops 2,910 21%
Grass/Pasture/Hay 1,543 11%
Orchards/Vineyards 169 1%
Row Crops 640 5%
Shrub/Rangelands – Includes CRP Lands 3,684 26%
Water/Wetlands/Developed/Barren 419 2%
Land Cover/Use/2
Based on a 100-foot stretch on both sides of all streams in the 100K Hydro GIS Layer
Total Acres of 100-Foot Stream Buffers 14,195 100%
1 – slight limitations 1,200 1%
2 – moderate limitations 49,700 44%
3 – severe limitations 22,800 20%
4 – very severe limitations 30,300 27%
5 – no erosion hazard, but other limitations 0 0%
6 – severe limitations; unsuitable for cultivation; limited to pasture, range, forest 9,700 9%
7 – very severe limitations; unsuitable for cultivation; limited to grazing, forest, wildlife habitat 0 0%
8 – miscellaneous areas; limited to recreation, wildlife habitat, water supply 0 0%
Land Capability Class
(Croplands & Pasturelands Only)
(1997 NRI/3 Estimates for Non-Federal Lands Only)
Total Croplands and Pasturelands 113,700 ---
Confined Animal Feeding Operations – Oregon CAFO Permit – 12/2004
Animal Type Dairy Feedlot Poultry Swine Mink Other
No. of Permitted Farms 3 0 0 0 0 0
No. of Permitted Animals 9,615 0 0 0 0 0
5 of 12 Last printed 3/13/2006 1:22 PM March 13, 2006

Walla Walla – 17070102
8-Digit Hydrologic Unit Profile AUGUST 2005
FINAL
Resource Concerns Back to Contents
Sheet and rill erosion by water on the subbasin croplands and pasturelands have been reduced by nearly 540,000 tons of soil per year from 1982 to 1997.
2002 Water Quality Concerns303d list and TMDL Parameters
96.7 96.7
37.8
0
20
40
60
80
100
120
All Listed Parameters Temperature Iron
Stre
am M
iles
NRI estimates indicate that 67,100 acres of the subbasin agricultural lands still had water erosion rates above a sustainable level in 1997.
Controlling erosion not only sustains the long-term productivity of the land, but it also affects the amount of soil, pesticides, fertilizer, and other substances that move into the Nation’s waters.
Through NRCS programs many farmers and ranchers have applied conservation practices to reduce the effects of erosion by water. As a result, erosion rates on cultivated cropland fell 37 percent, from 12.0 tons per acre per year to 7.6 tons per acre per year from 1982 to 1997.
Tons of Soil Loss by Water Erosion
Water Areas
1.3%
1982 1987 1992 1997
Soil
Loss
(Ton
s/Y
ear)
800,000
1,200,000
400,000
1,600,000
All of the 303d listed stream miles exceed State water quality standards for temperature. Elevated stream temperatures may be due to inadequate riparian shade, stream channel widening, warm irrigation return flows, and other anthropogenic or natural causes.
Conservation practices that can be used to
address these water quality issues include grazing management, irrigation water management, and use of riparian buffers.
Watershed Projects, Plans, Studies and Assessments
NRCS Watershed Projects6 NRCS Watershed Plans, Studies, and Assessments7
Name Status Name Status None None
ODEQ TMDL’s8 ODA Agricultural Water Quality Management Plans9
Name Status Name Status None Walla Walla Completed
OWEB Watershed Council10Watershed Council Assessments
11 NWPCC Subbasin Plans and Assessments18
Walla Walla Watershed Council None Walla Walla Subbasin Plan
(Continued on page 8)
6 of 12 Last printed 3/13/2006 1:22 PM March 13, 2006

Walla Walla – 17070102
8-Digit Hydrologic Unit Profile AUGUST 2005
FINAL
Map Footnote /17
7 of 12 Last printed 3/13/2006 1:22 PM March 13, 2006
Walla Walla – 17070102
8-Digit Hydrologic Unit Profile AUGUST 2005
FINAL
Resource Concerns - Continued Back to Contents
Grass/Pasture/Hay • Irrigation water management in areas of pasture commonly receives less attention than in areas of other
crops. Grain Crops
• Sheet and rill erosion remains a resource concern. • Some fields are cropped to the edge of streams, leaving little riparian vegetation for shade and habitat. • Growers producing irrigated wheat commonly use older irrigation systems that are in need of repair or
replacement. Row and Perennial Crops
• Both row and perennial crops generally are well managed; however, one or two criteria for quality, such as nutrient or pest management, commonly are not met.
• Chemical drift from pesticide application on orchards commonly remains a concern. Rangeland
• Invasive weeds (yellow star-thistle, knapweed, etc.) reduce the value of grazing land. • Grazing management commonly is a concern in areas of rangeland.
Forest • Much of the private forestlands are managed by private industrial owners who generally comply with State
forest practices. • Private non-industrial forestlands commonly are associated with small woodlots or rural homesites, which are
not actively managed for timber production. • Private woodlots commonly suffer from hygrading (harvesting the best trees) or poor stand management
(overstocking). General
• Tribal interest in management of their ceded area is perceived by some as a deterrent to conservation on private lands.
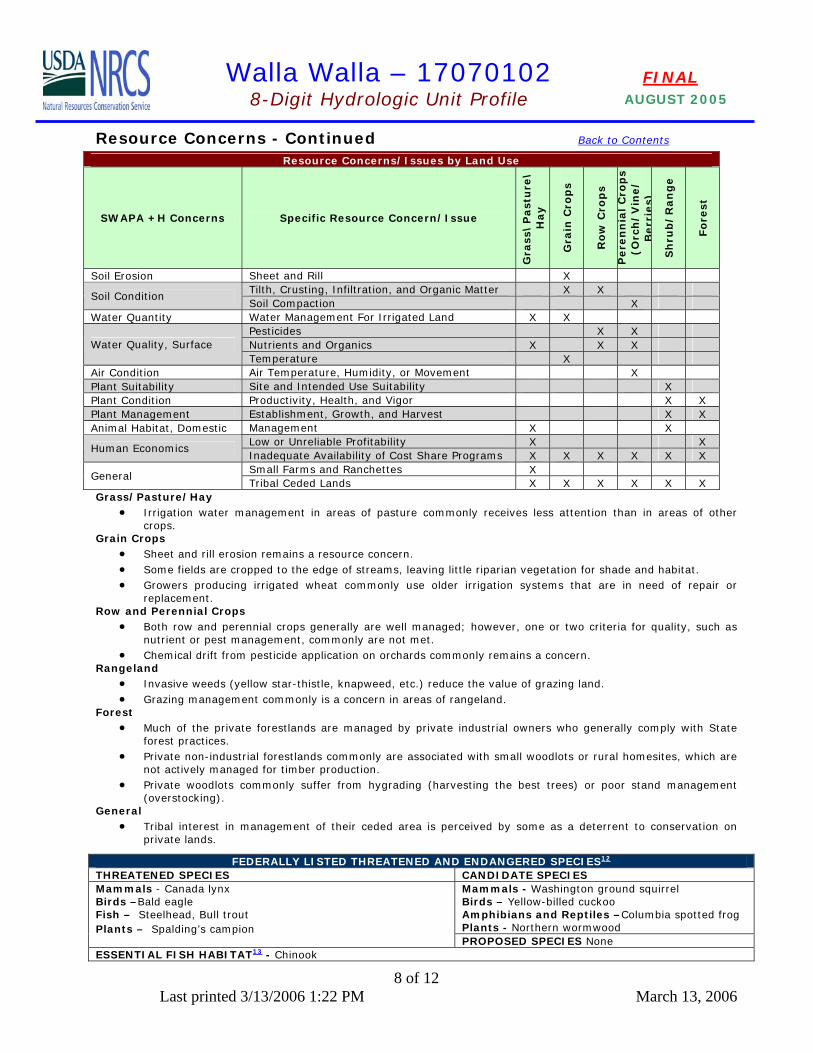
Resource Concerns/Issues by Land Use
SWAPA +H Concerns Specific Resource Concern/Issue
Gra
ss\
Past
ure
\H
ay
Gra
in C
rop
s
Ro
w C
rop
s
Pere
nn
ial
Cro
ps
(Orc
h/
Vin
e/
B
err
ies)
Sh
rub
/R
an
ge
Fo
rest
Soil Erosion Sheet and Rill X Tilth, Crusting, Infiltration, and Organic Matter X X
Soil Condition Soil Compaction X
Water Quantity Water Management For Irrigated Land X X Pesticides X X Nutrients and Organics X X X Water Quality, Surface Temperature X
Air Condition Air Temperature, Humidity, or Movement X Plant Suitability Site and Intended Use Suitability X Plant Condition Productivity, Health, and Vigor X X Plant Management Establishment, Growth, and Harvest X X Animal Habitat, Domestic Management X X
Low or Unreliable Profitability X X Human Economics
Inadequate Availability of Cost Share Programs X X X X X X Small Farms and Ranchettes X
General Tribal Ceded Lands X X X X X X
FEDERALLY LISTED THREATENED AND ENDANGERED SPECIES12
THREATENED SPECIES CANDIDATE SPECIES Mammals - Washington ground squirrel Birds – Yellow-billed cuckoo Amphibians and Reptiles –Columbia spotted frog Plants - Northern wormwood
Mammals - Canada lynx Birds –Bald eagle Fish – Steelhead, Bull trout Plants – Spalding’s campion
PROPOSED SPECIES None ESSENTIAL FISH HABITAT13 - Chinook
8 of 12 Last printed 3/13/2006 1:22 PM March 13, 2006
Walla Walla – 17070102
8-Digit Hydrologic Unit Profile AUGUST 2005
FINAL
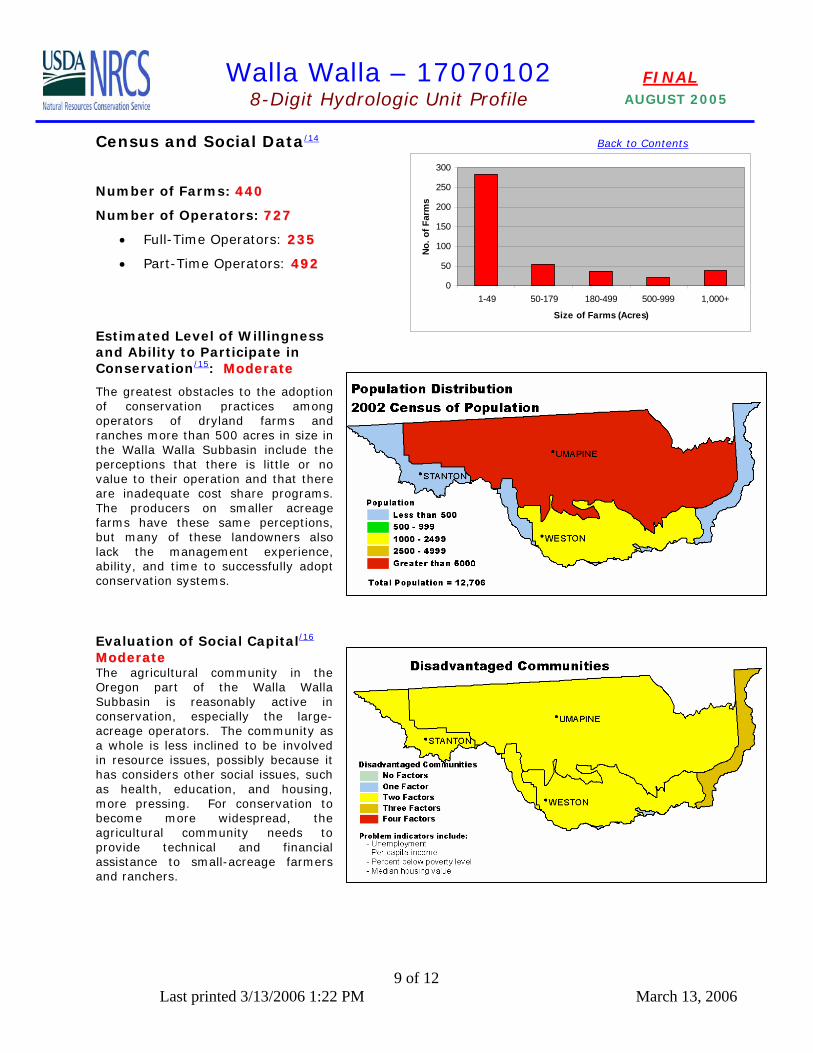
Census and Social Data/14 Back to Contents
0
50
100
150
200
250
300
1-49 50-179 180-499 500-999 1,000+
Size of Farms (Acres)
No. o
f Far
ms
Number of Farms: 444400
Number of Operators: 772277
• Full-Time Operators: 223355
• Part-Time Operators: 449922
Estimated Level of Willingness and Ability to Participate in Conservation/15: MMooddeerraattee
The greatest obstacles to the adoption of conservation practices among operators of dryland farms and ranches more than 500 acres in size in the Walla Walla Subbasin include the perceptions that there is little or no value to their operation and that there are inadequate cost share programs. The producers on smaller acreage farms have these same perceptions, but many of these landowners also lack the management experience, ability, and time to successfully adopt conservation systems.
Evaluation of Social Capital/16 MMooddeerraattee The agricultural community in the Oregon part of the Walla Walla Subbasin is reasonably active in conservation, especially the large- acreage operators. The community as a whole is less inclined to be involved in resource issues, possibly because it has considers other social issues, such as health, education, and housing, more pressing. For conservation to become more widespread, the agricultural community needs to provide technical and financial assistance to small-acreage farmers and ranchers.
9 of 12 Last printed 3/13/2006 1:22 PM March 13, 2006

Walla Walla – 17070102
8-Digit Hydrologic Unit Profile AUGUST 2005
FINAL
Progress/Status Back to Contents
PRMS Data FY99 FY00 FY01 FY02 FY03 Avg/Year Total
Total Conservation Systems Planned (Acres) 3 1,295 9,030 5,678 6,679 4,537 22,685
Total Conservation Systems Applied (Acres) 0 1,159 3,999 2,204 5,974 2,667 13,336
Conservation Treatment
Waste Management (number) 0 0 0 0 0 0 0
Buffers (acres) 0 0 0 0 0 0 0
Erosion Control (acres) 0 1,955 3,747 6,858 5,416 3,595 17,976
Irrigation Water Management (acres) 0 0 0 0 0 0 0
Nutrient Management (acres) 0 0 931 571 964 493 2,466
Pest Management (acres) 0 1,469 1,451 732 1,098 950 4,750
Prescribed Grazing (acres) 0 0 0 0 495 99 495
Trees & Shrubs (acres) 0 40 103 55 114 62 312
Conservation Tillage (acres) 0 1,000 1,306 215 2,597 1,024 5,118
Wildlife Habitat (acres) 3 3,210 731 1,890 5,847 2,336 11,681
Wetlands (acres) 0 0 0 0 0 0 0
Progress over the last 5 years has been
focused on: Resource Status Cumulative Conservation Application on Private Lands
0% 20% 40% 60% 80% 100%
Row Crops
Grain Crops
CRP/CREP
Orch/Vine/Berries
Grass-Pasture-Hay
Rangeland-Shrub
Forest
RMS Level Progressive Benchmark
o Erosion control, management of nutrients and pests, and conservation tillage in areas of grain and row crops.
o Wildlife habitat improvement. Many operators are using older irrigation
systems that need to be rehabilitated or replaced to achieve good irrigation water management.
Chemical drift from pesticide application in orchards remains a concern.
Small operators commonly lack the knowledge to properly manage pasturelands.
Plant productivity is low due to invasive weeds, such as medusahead, that are difficult and costly to control.
Most private industrial timber owners are doing good conservation work and are satisfying State forest practice requirements.
Some private non-industrial forests that are not managed for timber do not meet State forest practice requirements.
Estimates are based on information received from local conservationists in the watershed.
Lands Removed from Production through Farm Bill Programs
Conservation Reserve Program (CRP): 17,076 acres
Wetland Restoration Program (WRP): None
Conservation Reserve Enhancement Program (CREP): 43 acres
10 of 12 Last printed 3/13/2006 1:22 PM March 13, 2006

Walla Walla – 17070102
8-Digit Hydrologic Unit Profile AUGUST 2005
FINAL
Footnotes/Bibliography Back to Contents
All data is provided “as is.” There are no warranties, express or implied, including the warranty of fitness for a particular purpose, accompanying this document. Use for general planning purposes only.
1. Ownership Layer – Source: The 1:24,000 scale public ownership layer is the land
ownership/management for public entities, including Federal, Tribal, State, and local entities. This is a seamless, statewide Oregon Public Ownership vector layer composed of fee ownership of lands by Federal, State, Tribal, county, and city agencies. The layer is comprised of the best available data compiled at 1:24,000 scale or larger, and the line work matches GCDB boundary locations and ORMAP standards where possible. The layer is available from the State of Oregon GIS Service Center: http://www.gis.state.or.us/data/alphalist.html. For current ownership status, consult official records at appropriate Federal, State, and county offices. Ownership classes grouped to calculate Federal ownership vs. non-Federal ownership by the Water Resources Planning Team.
2. National Land Cover Dataset (NLCD) - Originator: U.S. Geological Survey (USGS);
Publication date: 19990631; Title: Oregon Land Cover Data Set, Edition: 1; Geospatial data presentation form: Raster digital data; Publisher: U.S. Geological Survey, Sioux Falls, SD, USA; Online linkage: http://edcwww.cr.usgs.gov/programs/lccp/nationallandcover.html; Abstract: These data can be used in a geographic information system (GIS) for any number of purposes, such as assessing wildlife habitat, water quality, pesticide runoff, land use change, etc. The State data sets are provided with a 300-meter buffer beyond the State border to facilitate combining the State files into larger regions.
3. ESTIMATES FROM THE 1997 NRI DATABASE (REVISED DECEMBER 2000) REPLACE ALL PREVIOUS
REPORTS AND ESTIMATES. Comparisons made using data published for the 1982, 1987, or 1992 NRI may produce erroneous results. This is because of changes in statistical estimation protocols and because all data collected prior to 1997 were simultaneously reviewed (edited) as 1997 NRI data were collected. All definitions are available in the glossary. In addition, this December 2000 revision of the 1997 NRI data updates information released in December 1999 and corrects a computer error discovered in March 2000. For more information: http://www.nrcs.usda.gov/technical/NRI/
4. Irrigated Adjudicated Water Rights – Water Rights Information System (WRIS), Oregon Water
Resources Department, http://www.wrd.state.or.us/maps/wrexport.shtml 5. StreamNet is a cooperative venture of the Pacific Northwest's fish and wildlife agencies and tribes
and is administered by the Pacific States Marine Fisheries Commission. StreamNet provided data and data services in support of the region's fish and wildlife program and other efforts to manage and restore the region's aquatic resources. Official StreamNet website: http://www.streamnet.org/
6. Natural Resources Conservation Service, Watershed Projects Planned and Authorized,
http://www.nrcs.usda.gov/programs/watershed/Purpose.
7. Natural Resources Conservation Service, Watershed Plans, Studies, and Assessments completed, http://www.nrcs.usda.gov/programs/watershed/Surveys_Plng.html#Watershed%20Surveys%20and%20Plan
8. Oregon Department of Environmental Quality Total Maximum Daily Loads,
http://www.deq.state.or.us/wq/TMDLs/TMDLs.htm 9. Oregon Department of Agriculture, Agricultural Water Quality Management Plans,
http://www.oregon.gov/ODA/NRD/water_agplans.shtml
11 of 12 Last printed 3/13/2006 1:22 PM March 13, 2006

Walla Walla – 17070102
8-Digit Hydrologic Unit Profile AUGUST 2005
FINAL
Footnotes/Bibliography Continued Back to Contents
All data is provided “as is.” There are no warranties, express or implied, including the warranty of fitness for a particular purpose, accompanying this document. Use for general planning purposes only.
10. Oregon Watershed Enhancement Board, http://oregon.gov/OWEB/WSHEDS/index.shtml
11. Watershed Assessments completed by local watershed councils following the Oregon Watershed
Assessment Manual, http://oregon.gov/OWEB/docs/pubs/ws_assess_manual.shtml.
12. NRCS Field Office Technical Guide, Section II, Threatened and Endangered List. 13. Magnuson-Stevens Fishery Conservation and Management Act, Public Law 94-265. As amended
through October 11, 1996.
14. Data were taken from the 2002 Agricultural Census and adjusted by percent of HUC in the county or by percent of zip code area in the HUC, depending on the level of data available. Data were also taken from the U.S. Population Census, 2000.
15. Conservation participation was estimated using NRCS Social Sciences Technical Note 1801, Guide
for Estimating Participation in Conservation, 2004. Four categories of indicators were evaluated: Personal characteristics, farm structural characteristics, perceptions of conservation, and community context. Estimates are based on information received from local conservationists in the watershed.
16. Social capital is an indicator of the community’s ability and willingness to work together to solve
problems. A high amount of social capital helps a community to be physically healthy, socially progressive, and economically vigorous. A low amount of social capital typically results in community conflict, lack of trust and respect, and unsuccessful attempts to solve problems. The evaluation is based on NRCS Technical Report Release 4.1, March, 2002: Adding Up Social Capital: An Investment in Communities. Local conservationists provided information to measure social capital. Scores range from 0 to 76.
17. Surface and Groundwater Resource Protection Map
a. 2002 303d Listed Streams designated by Oregon Department of Environmental Quality and approved by the Environmental Protection Agency, Section 303d Clean Water Act, http://www.deq.state.or.us/wq/303dlist/303dpage.htm
b. Groundwater Management Areas designated by the Oregon Department of Environmental Quality, Oregon Revised Statutes – Ground Water ORS 468B.150 to ORS 468B.190, http://www.deq.state.or.us/wq/groundwa/wqgw.htm
c. Groundwater Restricted Areas designated by Oregon Water Resources Commission, Oregon Department of Water Resources, http://egov.oregon.gov/OWRD/PUBS/aquabook_protections.shtml
d. The Sole Source Aquifer (SSA) Protection Program is authorized by Section 1424(e) of the Safe Drinking Water Act of 1974 (Public Law 93-523, 42 U.S.C. 300 et. seq), http://www.epa.gov/safewater/ssanp.html
18. Subbasin assessments and plans are developed by local groups (SWCDs, watershed councils,
tribes, and others) as part of the Northwest Power and Conservation Council’s fish and wildlife program in the Columbia River Basin. This program is funded and implemented by the Bonneville Power Administration. http://www.nwcouncil.org/fw/subbasinplanning/Default.htm.
12 of 12 Last printed 3/13/2006 1:22 PM March 13, 2006