wa horticulture export markets horticulture export markets — where we can make a diff erence 1...
TRANSCRIPT
WA horticulture export markets — Where we can make a diff erence 1
Department ofAgriculture and Food
WA horticulture export markets
Where we can make a diff erence

June 2017
DisclaimerWhile all reasonable care has been taken in the preparation of the information in this document, the Chief Executive Officer of the Department of Agriculture and Food and its officers and the State of Western Australia accept no responsibility for any errors or omissions it may contain, whether caused by negligence or otherwise, or for any loss, however caused, arising from reliance on, or the use or release of, this information or any part of it.© Western Australian Agriculture Authority, 2017
Copies of this document are available in alternative formats upon request.3 Baron-Hay Court, South Perth WA 6151 Tel: (08) 9368 3333 Email: [email protected]
WA horticulture export markets — Where we can make a diff erence 3
Department ofAgriculture and Food
WA horticulture export marketsWhere we can make a diff erenceManju RadhakrishnanResearch economist
WA horticulture export markets — Where we can make a diff erence4
AcknowledgementsAnne Bennett, Kim James, Vicki McAllister, John Ruprecht, Geoff Strickland, Jennifer Tiong, David Windsor, Vilaphonh Xayavong, Kirrily Palmer and Megan Hele.
WA horticulture export markets — Where we can make a diff erence 5
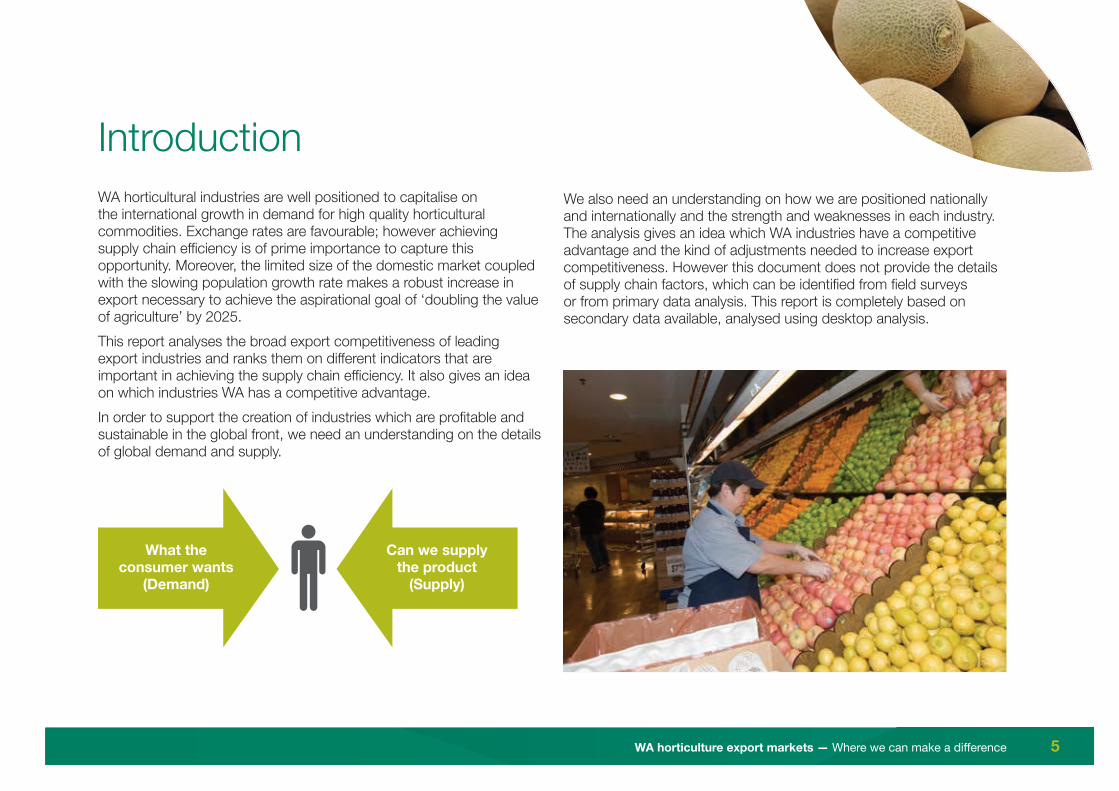
IntroductionWA horticultural industries are well positioned to capitalise on the international growth in demand for high quality horticultural commodities. Exchange rates are favourable; however achieving supply chain effi ciency is of prime importance to capture this opportunity. Moreover, the limited size of the domestic market coupled with the slowing population growth rate makes a robust increase in export necessary to achieve the aspirational goal of ‘doubling the value of agriculture’ by 2025. This report analyses the broad export competitiveness of leading export industries and ranks them on diff erent indicators that are important in achieving the supply chain effi ciency. It also gives an idea on which industries WA has a competitive advantage. In order to support the creation of industries which are profi table and sustainable in the global front, we need an understanding on the details of global demand and supply.
We also need an understanding on how we are positioned nationally and internationally and the strength and weaknesses in each industry. The analysis gives an idea which WA industries have a competitive advantage and the kind of adjustments needed to increase export competitiveness. However this document does not provide the details of supply chain factors, which can be identifi ed from fi eld surveys or from primary data analysis. This report is completely based on secondary data available, analysed using desktop analysis.
What the consumer wants
(Demand)
Can we supplythe product
(Supply)

WA horticulture export markets — Where we can make a diff erence6
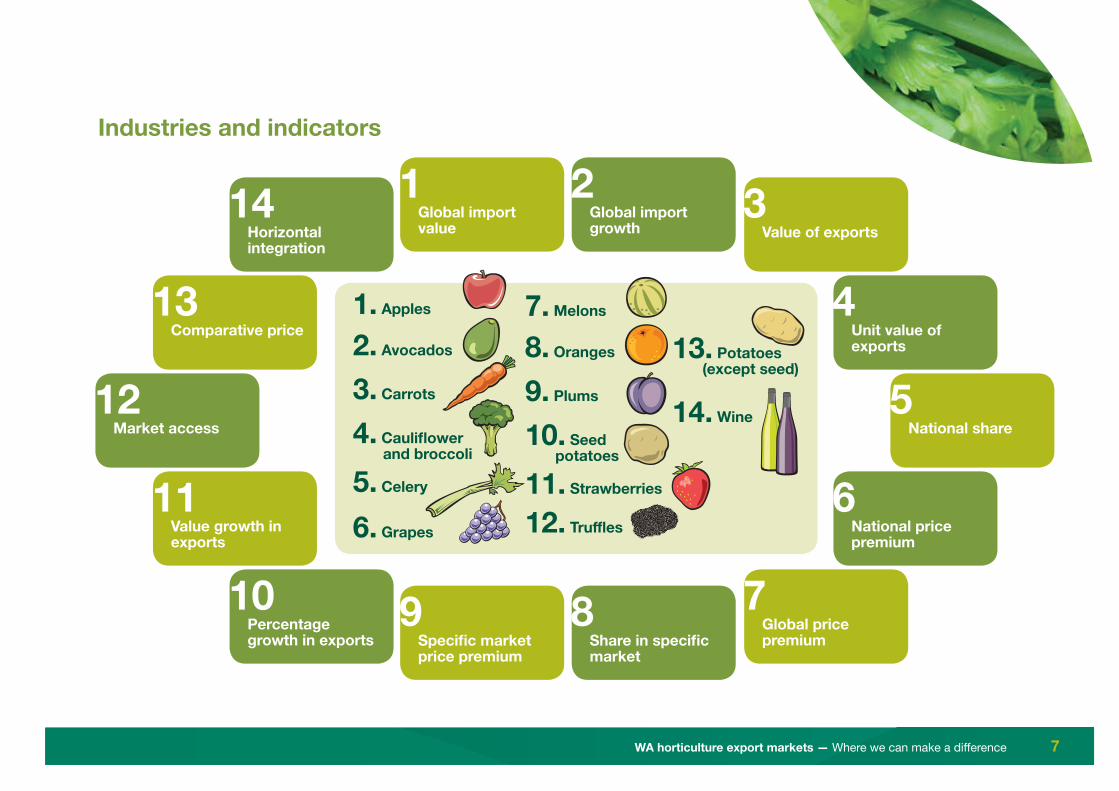
MethodSelection of industries Industries with an export value more than $1million are selected for this analysis. Grapes and apples are also included because grapes have good supply expansion in WA and apples are identifi ed as a potential industry by Coriolis (Reference 2). Fourteen industries are selected according to this criterion.
Indicators Fourteen indicators which include factors relating to both demand and supply side are used to rank these industries to identify the strength and weaknesses in each industry. Factors from global growth in imports to horizontal integration are analysed.Fourteen industries are analysed on fourteen indicators to identify the details on global demand, what we are good at now and what needs to improve.Details on industries and indicators are shown in the fi gure below. The fi rst fi gure shows a broad outline of the industries and indicators, while the second fi gure shows more structured overview of the indicators used.
WA horticulture export markets — Where we can make a diff erence 7
Industries and indicators
13 Comparative price
4 Unit value of exports
11 Value growth in exports
6 National price premium
12 Market access
5 National share
10 Percentage growth in exports
7 Global price premium
14 Horizontal integration
3 Value of exports
1 Global import value
1. Apples 7. Melons
3. Carrots 9. Plums
5. Celery
14. Wine
11. Strawberries
6. Grapes 12. Truffl es
2. Avocados 8. Oranges
4. Caulifl ower and broccoli
13. Potatoes (except seed)
10. Seed potatoes
2 Global import growth
9 Specifi c market price premium
8 Share in specifi c market
WA horticulture export markets — Where we can make a diff erence8
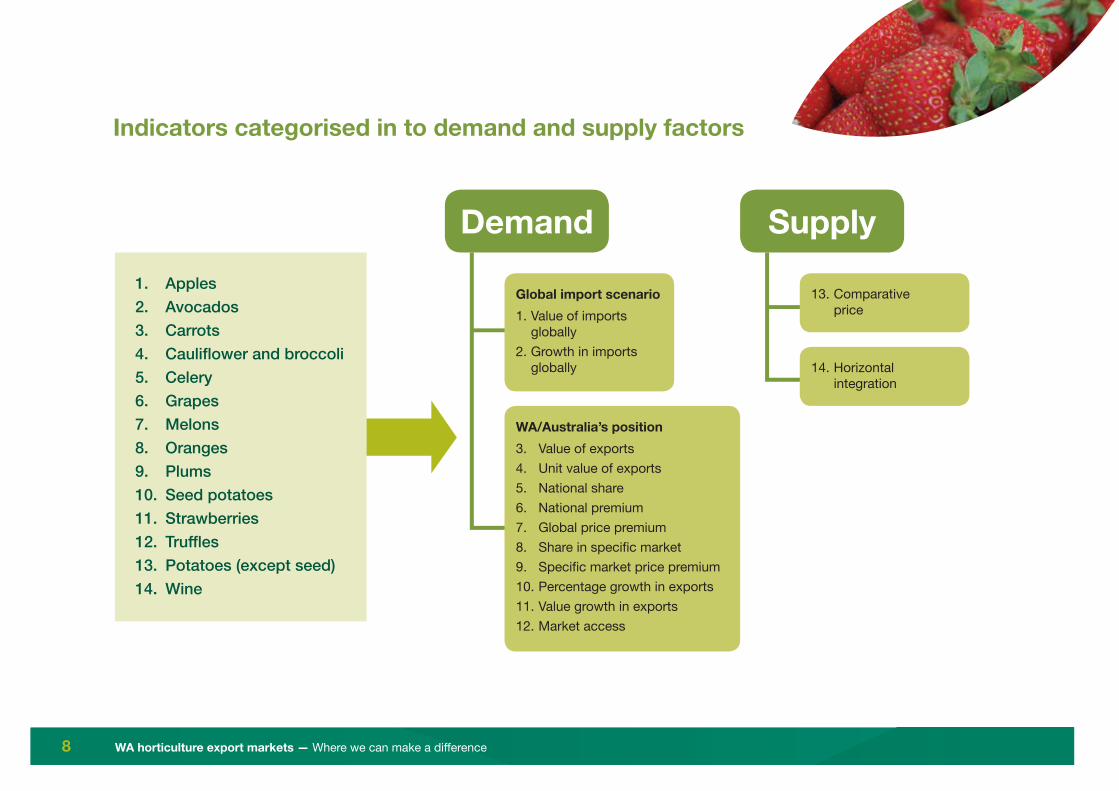
Indicators categorised in to demand and supply factors
1. Apples2. Avocados3. Carrots4. Caulifl ower and broccoli5. Celery6. Grapes7. Melons8. Oranges9. Plums10. Seed potatoes11. Strawberries12. Truffl es13. Potatoes (except seed)14. Wine
Demand Supply
Global import scenario1. Value of imports
globally2. Growth in imports
globally
13. Comparative price
14. Horizontal integration
WA/Australia’s position3. Value of exports4. Unit value of exports5. National share6. National premium7. Global price premium8. Share in specifi c market9. Specifi c market price premium10. Percentage growth in exports11. Value growth in exports12. Market access

WA horticulture export markets — Where we can make a diff erence 9
Key results• Industries such as plums, melons and grapes will benefi t from
horizontal integration, while carrots and apples will benefi t from identifying value add opportunities.
• Avocados and strawberries have a high ranking on a lot of indicators; however market access barriers are prevailing. Intervention to gain market access will benefi t these industries greatly.
• Potatoes (except seed) achieved a price premium nationally globally and against major suppliers in specifi c market, but global growth in imports is the lowest.
• Apples have a good share in global imports as well as high global growth; however the competition is very high and WA apple supply is limited.
• Celery is a horizontally integrated industry. However diversifi cation of markets to include premium value importers will benefi t the industry.
• Seed potato will benefi t from diversifying the export markets.
Detailed information on the strength and weakness of each industry based on the analysed indicators are furnished in the report. Interventions needed seem to be diff erent for diff erent industries. This analysis can serve as a tool to identify the strength and weakness of each analysed industry in order to plan what kind of adjustment is needed to make the supply chain more effi cient.
Results and discussionsResults on each indicator is discussed separately, and combined as a table to give the strength and weakness. Further ranking is given to summarise the fi ndings.
WA horticulture export markets — Where we can make a diff erence10
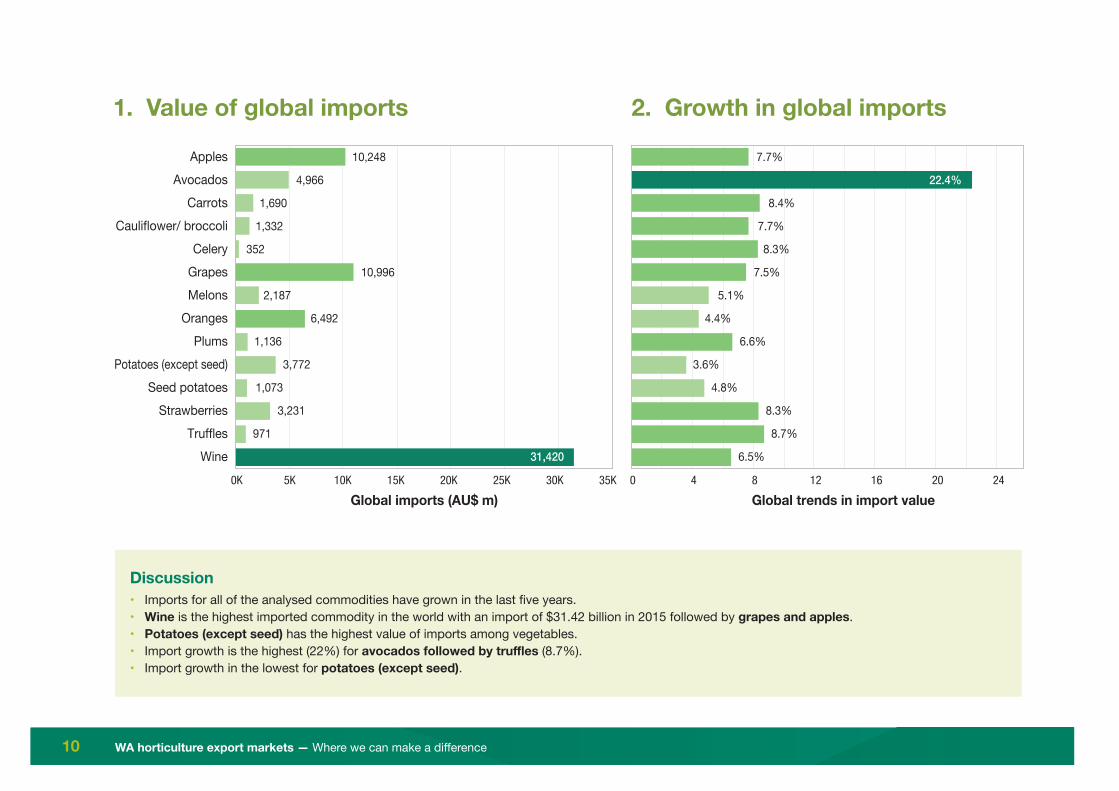
1. Value of global imports 2. Growth in global imports
Discussion• Imports for all of the analysed commodities have grown in the last fi ve years.• Wine is the highest imported commodity in the world with an import of $31.42 billion in 2015 followed by grapes and apples.• Potatoes (except seed) has the highest value of imports among vegetables.• Import growth is the highest (22%) for avocados followed by truffl es (8.7%).• Import growth in the lowest for potatoes (except seed).
Global imports (AU$ m) Global trends in import value0K 5K 10K 15K 20K 25K 30K 35K 40 8 12 16 20 24
ApplesAvocados
CarrotsCauliflower/ broccoli
CeleryGrapesMelons
OrangesPlums
Potatoes (except seed)Seed potatoes
StrawberriesTruffles
Wine
10,248
10,996
31,420
4,966
3,772
3,231
6,492
1,690
1,332
1,073
352
2,187
1,136
971
7.7%
7.5%
6.5%
22.4%
3.6%
8.3%
4.4%
8.4%
7.7%
4.8%
8.3%
5.1%
6.6%
8.7%
WA horticulture export markets — Where we can make a diff erence 11
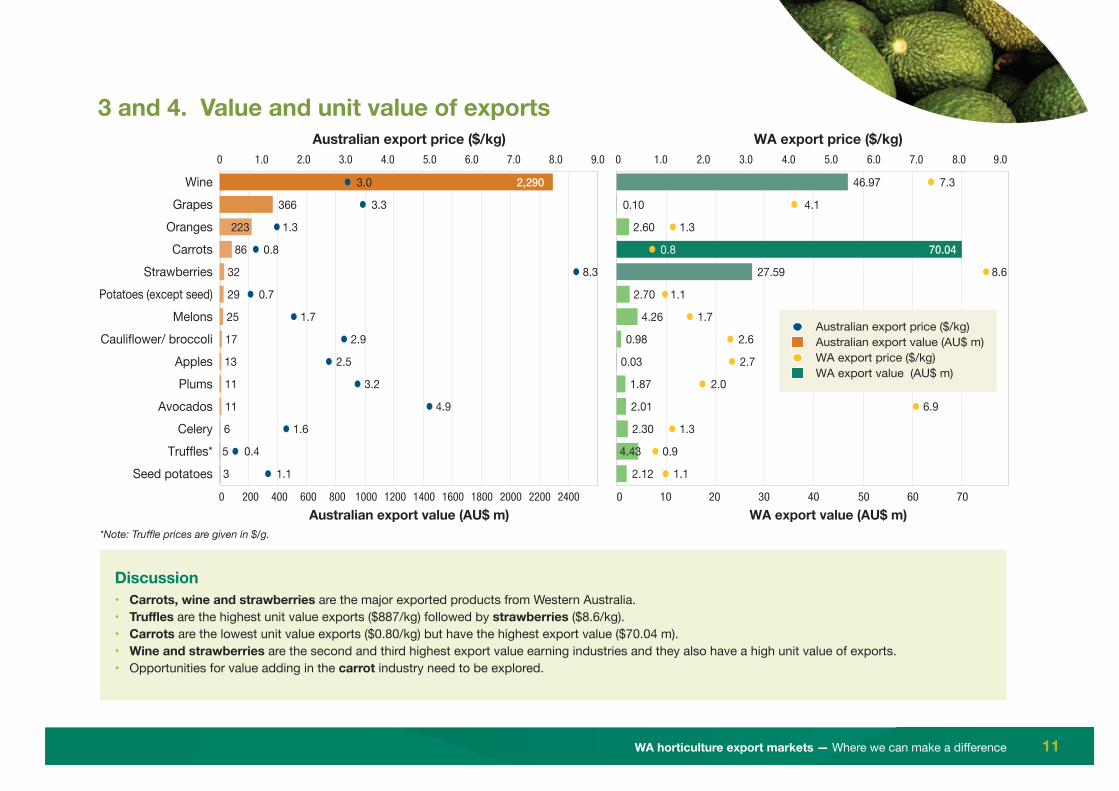
3 and 4. Value and unit value of exports
Discussion• Carrots, wine and strawberries are the major exported products from Western Australia.• Truffl es are the highest unit value exports ($887/kg) followed by strawberries ($8.6/kg).• Carrots are the lowest unit value exports ($0.80/kg) but have the highest export value ($70.04 m).• Wine and strawberries are the second and third highest export value earning industries and they also have a high unit value of exports.• Opportunities for value adding in the carrot industry need to be explored.
Australian export value (AU$ m) WA export value (AU$ m)
Australian export price ($/kg) WA export price ($/kg)
WineGrapes
OrangesCarrots
StrawberriesPotatoes (except seed)
MelonsCauliflower/ broccoli
ApplesPlums
AvocadosCelery
Truffles*Seed potatoes
46.97
2.70
2.12
0.10
1.87
2.30
0.98
2.60
2.01
27.59
4.26
0.03
29
3
366
11
6
17
86
11
32
25
13
2,2903.0
5
0.7
1.1
3.3
3.2
1.6
2.9
1.3
0.8
4.9
8.3
1.7
2.5
0.4
7.3
1.1
4.1
2.0
1.3
2.6
1.3
0.8
6.9
8.6
1.7
2.7
0 200 400 600 800 1000 1200 1400 1600 1800 2000 2200 2400 0 10 20 30 40 50 60 70
0 1.0 2.0 3.0 4.0 5.0 6.0 7.0 8.0 9.00 1.0 2.0 3.0 4.0 5.0 6.0 7.0 8.0 9.0
70.04
4.43
223
1.1
0.9
Australian export price ($/kg)Australian export value (AU$ m)WA export price ($/kg)WA export value (AU$ m)
*Note: Truffl e prices are given in $/g.

WA horticulture export markets — Where we can make a diff erence12
5. WA’s share in national export 6. WA’s price premium nationally
Discussion• WA has clear advantage in truffl es and strawberries achieving a premium
price and maintaining the leading position. WA has a leading position in the supply of carrots and seed potatoes and achieving almost the same price as the Australian average. WA achieved a clear price premium in avocados with a reasonable share. A clear price premium is achieved for wine even through WA is not a major supplier of wine in the national front.
Share of WA in national exports (%) Difference in export price (WA and Australia) (%)0 20 40 60 80 100 -50 0 50 100 150
ApplesAvocados
CarrotsCauliflower/ broccoli
CeleryGrapesMelons
OrangesPlums
Potatoes (except seed)Seed potatoes
StrawberriesTruffles
Wine
0.2%
0%
2.1%
18.2% 41.4%
9.4%
87.6%
1.2%
81.2%
5.7%
79.5%
38.6%
17.2%
16.3%
92.9%
4.7%
23.3%
143.4%
52.0%
2.8%
-3.6%
-4.5%
-9.7%
-1.7%
-18.2%
-2.5%
-38.9%
141.5%
• WA supply price of plums is almost 40% less than the Australian average. The WA supply price for celery is almost 20% less than the average Australian price. However, in celery WA has a considerable market share; WA is the second highest exporter of celery from Australia after Victoria. In Plums WA do not have a quantity or price advantage.
• Plums are a highly disaggregated industry (please refer the section titled ‘ horizontal integration’), this could be a contributing factor not realising a premium price in export markets. If China becomes open for Australian and WA plums, it may create a good opportunity as China is the number one importer of plums in the world. But the industry has to be equipped, to capture the opportunity.
WA horticulture export markets — Where we can make a diff erence 13
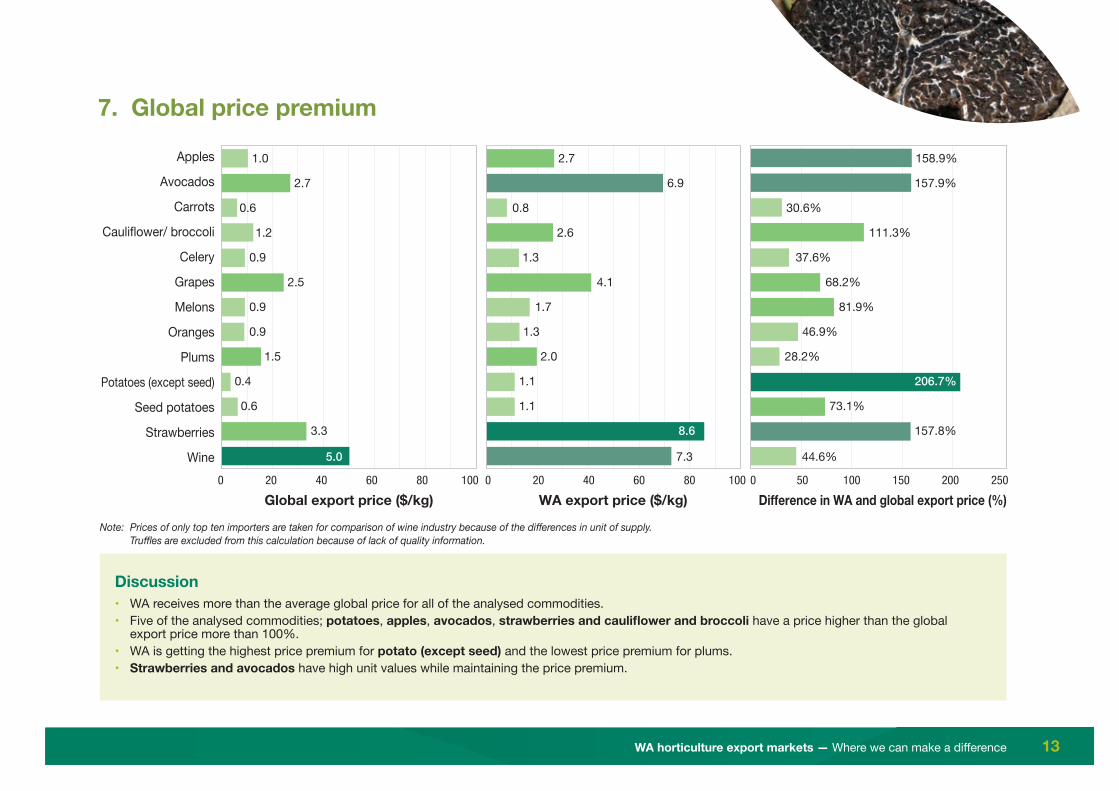
7. Global price premium
Discussion• WA receives more than the average global price for all of the analysed commodities.• Five of the analysed commodities; potatoes, apples, avocados, strawberries and caulifl ower and broccoli have a price higher than the global
export price more than 100%.• WA is getting the highest price premium for potato (except seed) and the lowest price premium for plums.• Strawberries and avocados have high unit values while maintaining the price premium.
0 20 40 60 80 1000 20 40 60 80 100 0 50 100 150 200 250
Apples
Avocados
Carrots
Cauliflower/ broccoli
Celery
Grapes
Melons
Oranges
Plums
Potatoes (except seed)
Seed potatoes
Strawberries
Wine
1.0
2.5
5.0
2.7
0.4
3.3
0.9
0.6
1.2
0.6
0.9
0.9
1.5
2.7
4.1
7.3
6.9
1.1
8.6
1.3
0.8
2.6
1.1
1.3
1.7
2.0
158.9%
68.2%
44.6%
157.9%
206.7%
157.8%
46.9%
30.6%
111.3%
73.1%
37.6%
81.9%
28.2%
Global export price ($/kg) WA export price ($/kg) Difference in WA and global export price (%)
Note: Prices of only top ten importers are taken for comparison of wine industry because of the diff erences in unit of supply. Truffl es are excluded from this calculation because of lack of quality information.
WA horticulture export markets — Where we can make a diff erence14
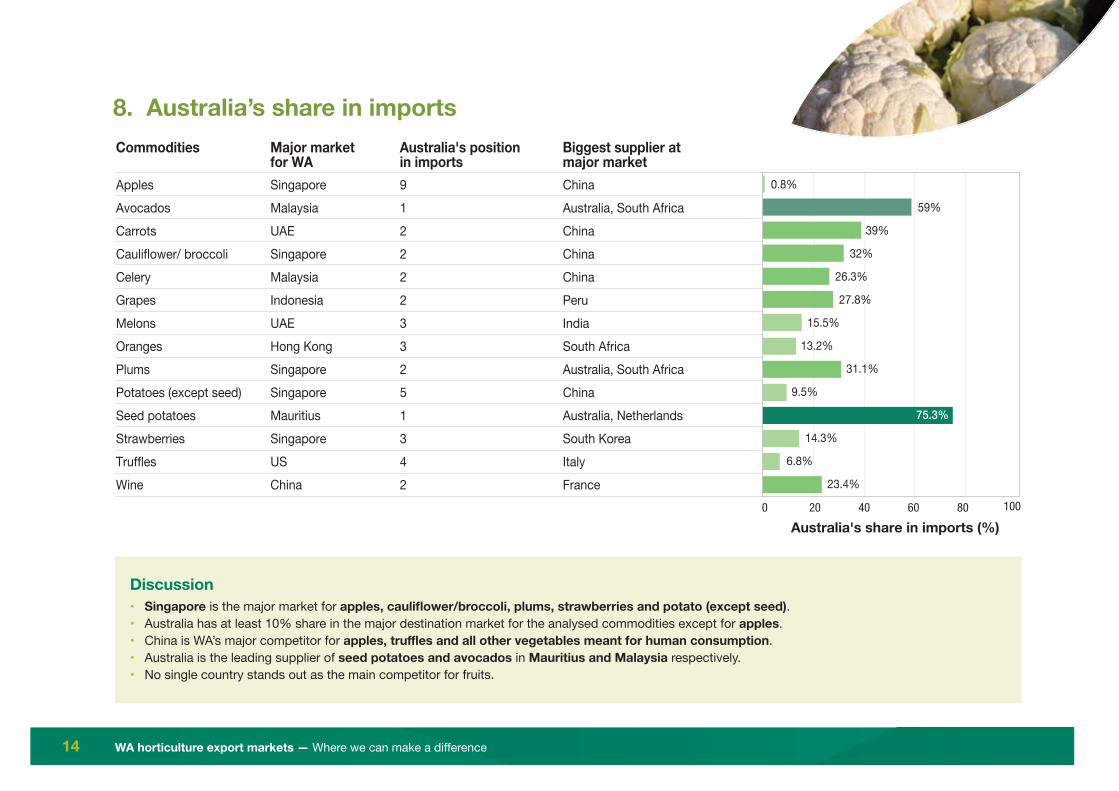
8. Australia’s share in importsCommodities
ApplesAvocadosCarrotsCauliflower/ broccoliCeleryGrapesMelonsOrangesPlumsPotatoes (except seed)Seed potatoesStrawberriesTrufflesWine
Major market for WASingaporeMalaysiaUAESingaporeMalaysiaIndonesiaUAEHong KongSingaporeSingaporeMauritiusSingaporeUSChina
Australia's position in imports91222233251342
Biggest supplier at major marketChinaAustralia, South AfricaChinaChinaChinaPeruIndiaSouth AfricaAustralia, South AfricaChinaAustralia, NetherlandsSouth KoreaItalyFrance
200 40 60 80 100
Australia's share in imports (%)
0.8%
27.8%
23.4%
59%
9.5%
14.3%
13.2%
39%
32%
75.3%
26.3%
15.5%
31.1%
6.8%
Discussion• Singapore is the major market for apples, caulifl ower/broccoli, plums, strawberries and potato (except seed).• Australia has at least 10% share in the major destination market for the analysed commodities except for apples.• China is WA’s major competitor for apples, truffl es and all other vegetables meant for human consumption.• Australia is the leading supplier of seed potatoes and avocados in Mauritius and Malaysia respectively.• No single country stands out as the main competitor for fruits.
WA horticulture export markets — Where we can make a diff erence 15
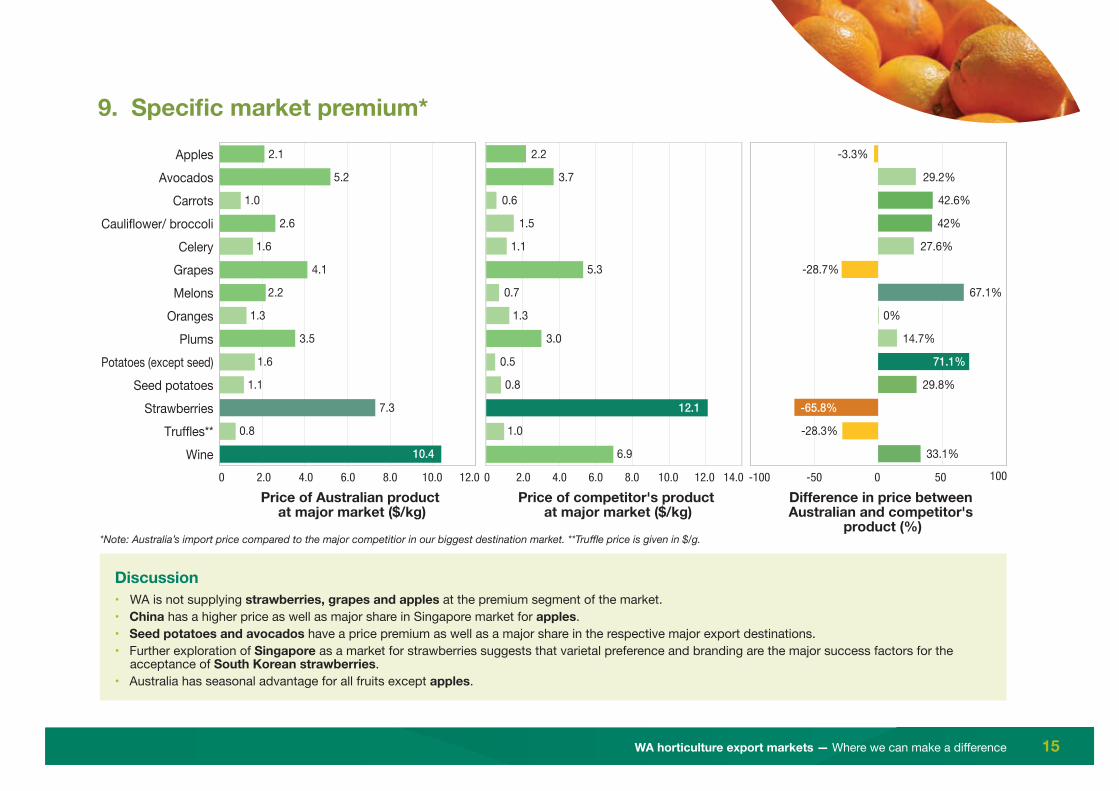
9. Specifi c market premium*
Discussion• WA is not supplying strawberries, grapes and apples at the premium segment of the market.• China has a higher price as well as major share in Singapore market for apples.• Seed potatoes and avocados have a price premium as well as a major share in the respective major export destinations.• Further exploration of Singapore as a market for strawberries suggests that varietal preference and branding are the major success factors for the
acceptance of South Korean strawberries.• Australia has seasonal advantage for all fruits except apples.
ApplesAvocados
CarrotsCauliflower/ broccoli
CeleryGrapesMelons
OrangesPlums
Potatoes (except seed)Seed potatoes
StrawberriesTruffles**
Wine-100 0-50 50 100
Difference in price between Australian and competitor's
product (%)
Price of competitor's product at major market ($/kg)
2.00 4.0 6.0 8.0 10.0 12.0 2.00 4.0 6.0 8.0 10.0 12.0 14.0
Price of Australian product at major market ($/kg)
2.1
4.1
10.4
5.2
1.6
7.3
1.3
1.0
2.6
1.1
1.6
2.2
3.5
0.8
2.2
5.3
6.9
3.7
0.5
12.1
1.3
0.6
1.5
0.8
1.1
0.7
3.0
1.0
-3.3%
-28.7%
33.1%
29.2%
71.1%
-65.8%
0%
42.6%
42%
29.8%
27.6%
67.1%
14.7%
-28.3%
*Note: Australia’s import price compared to the major competitior in our biggest destination market. **Truffl e price is given in $/g.
WA horticulture export markets — Where we can make a diff erence16
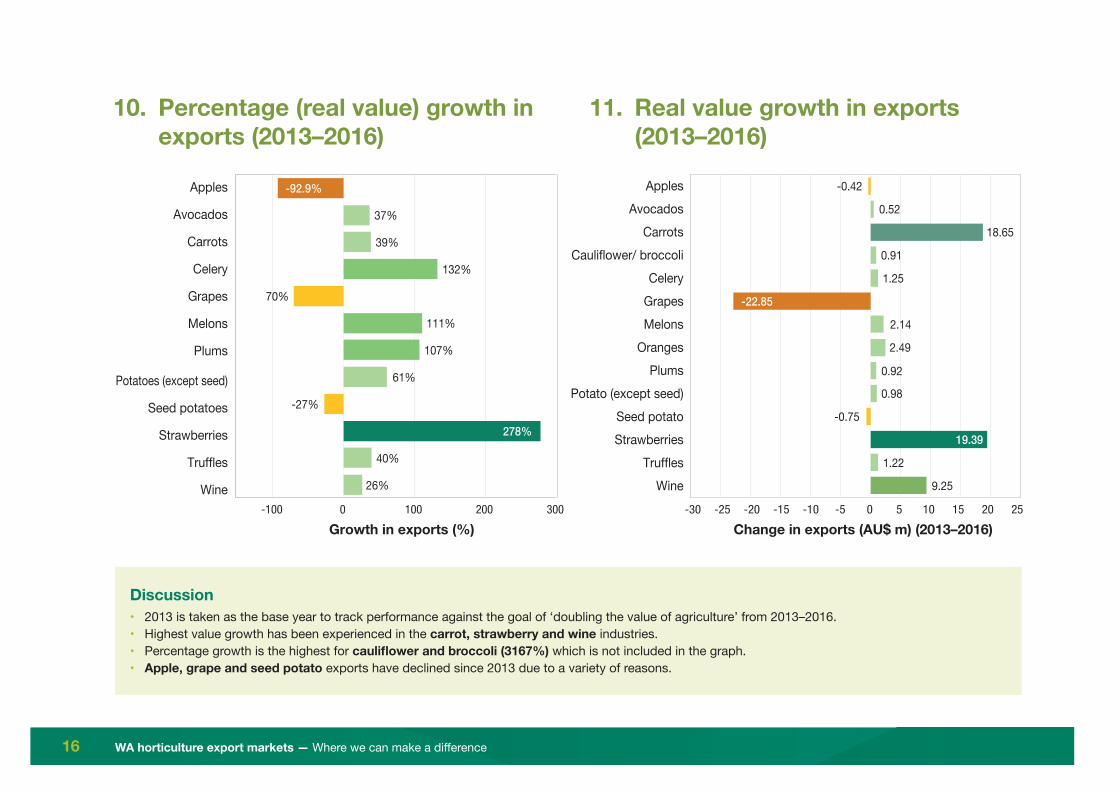
10. Percentage (real value) growth in exports (2013–2016)
11. Real value growth in exports (2013–2016)
-100 0 100 200 300
Apples
Avocados
Carrots
Celery
Grapes
Melons
Plums
Potatoes (except seed)
Seed potatoes
Strawberries
Truffles
Wine
Growth in exports (%)-30 -25 -20 -15 -10 -5 0 155 10 20 25
Change in exports (AU$ m) (2013–2016)
ApplesAvocados
CarrotsCauliflower/ broccoli
CeleryGrapesMelons
OrangesPlums
Potato (except seed)Seed potatoStrawberries
TrufflesWine
37%
-92.9%
111%
-27%
40%
61%
39%
132%
278%
70%
107%
26%
0.52
-0.42
-22.85
9.25
0.98
0.92
19.39
2.49
18.65
0.91
-0.75
1.25
2.14
1.22
Discussion• 2013 is taken as the base year to track performance against the goal of ‘doubling the value of agriculture’ from 2013–2016.• Highest value growth has been experienced in the carrot, strawberry and wine industries.• Percentage growth is the highest for caulifl ower and broccoli (3167%) which is not included in the graph.• Apple, grape and seed potato exports have declined since 2013 due to a variety of reasons.

WA horticulture export markets — Where we can make a diff erence 17
12. Market access details
Discussion• Apples, avocados and plum appear to have the highest market access issues.• Vegetables have less restrictions than fruits.• Hong Kong, Singapore and Malaysia are the most easily accessible markets and China is relatively diffi cult to access.• All the high value markets such as Japan, South Korea and China have high restrictions.• Market access issues in Japan, South Korea and China need to be addressed to realise the full potential of the recent trade agreements.
2 40 2 40 2 40 2 40 2 40 2 40 2 40 2 40 2 40 2 40 2 40 2 40 2 40 2 40 2 40 2 40
ApplesAvocados
CarrotsCauliflower/ broccoli
CeleryGrapesMelons
OrangesPlums
Potatoes (except seed)Seed potatoes
StrawberriesTruffles
Wine
Average
China
European
Union
Hong KongInd
onesia
Japan
Malaysi
aMaur
itius
Middle East
New Zeal
andSouth
Korea
Taiwan
Thailan
dUnite
d Kingdom
United Stat
es
Vietnam
*Note: 0 = Information not available; 1 = No access for WA; 4 = No restrictions.
WA horticulture export markets — Where we can make a diff erence18
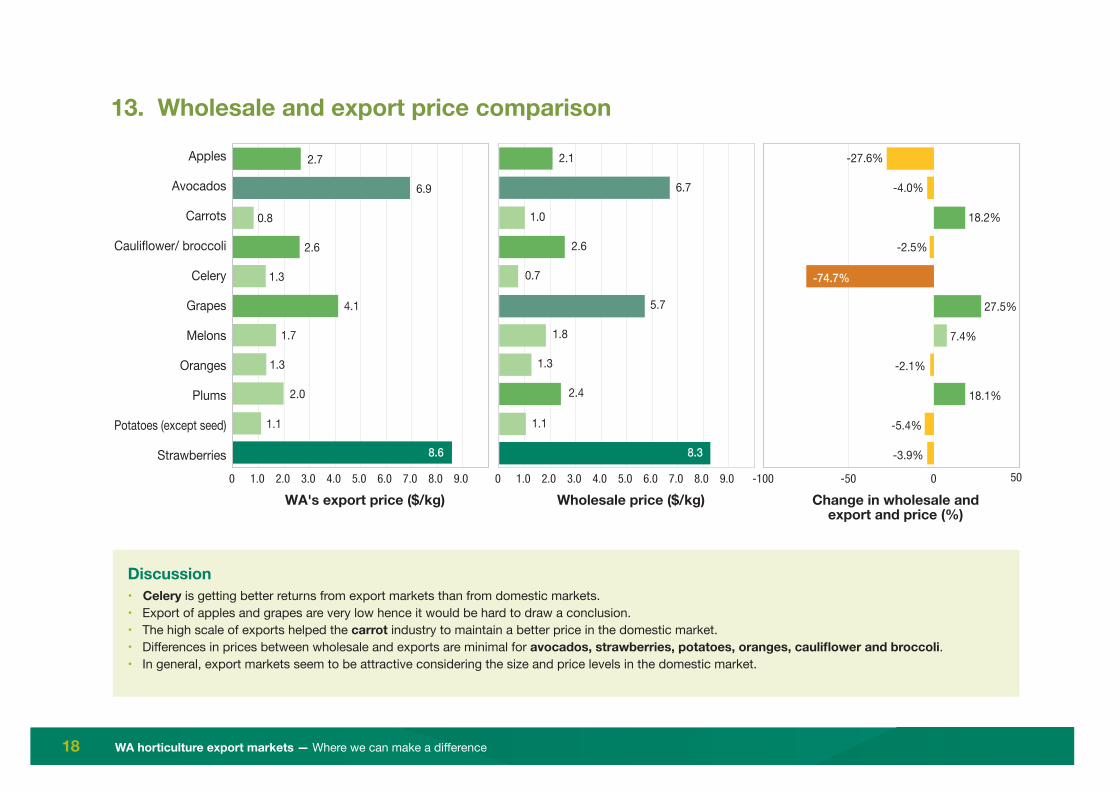
13. Wholesale and export price comparison
Discussion• Celery is getting better returns from export markets than from domestic markets.• Export of apples and grapes are very low hence it would be hard to draw a conclusion.• The high scale of exports helped the carrot industry to maintain a better price in the domestic market.• Diff erences in prices between wholesale and exports are minimal for avocados, strawberries, potatoes, oranges, caulifl ower and broccoli.• In general, export markets seem to be attractive considering the size and price levels in the domestic market.
Apples
Avocados
Carrots
Cauliflower/ broccoli
Celery
Grapes
Melons
Oranges
Plums
Potatoes (except seed)
Strawberries-100 0-50 50
Change in wholesale andexport and price (%)
Wholesale price ($/kg)2.00 4.0 6.0 8.01.0 3.0 5.0 7.0 9.0 2.00 4.0 6.0 8.01.0 3.0 5.0 7.0 9.0
WA's export price ($/kg)
2.7
4.1
8.6
6.9
1.1
1.3
0.8
2.6
1.3
1.7
2.0
2.1
5.7
8.3
-74.7%
6.7
1.1
1.3
1.0
2.6
0.7
1.8
2.4
-27.6%
-2.1%
-3.9%
-4.0%
18.1%
18.2%
-2.5%
27.5%
7.4%
-5.4%
WA horticulture export markets — Where we can make a diff erence 19
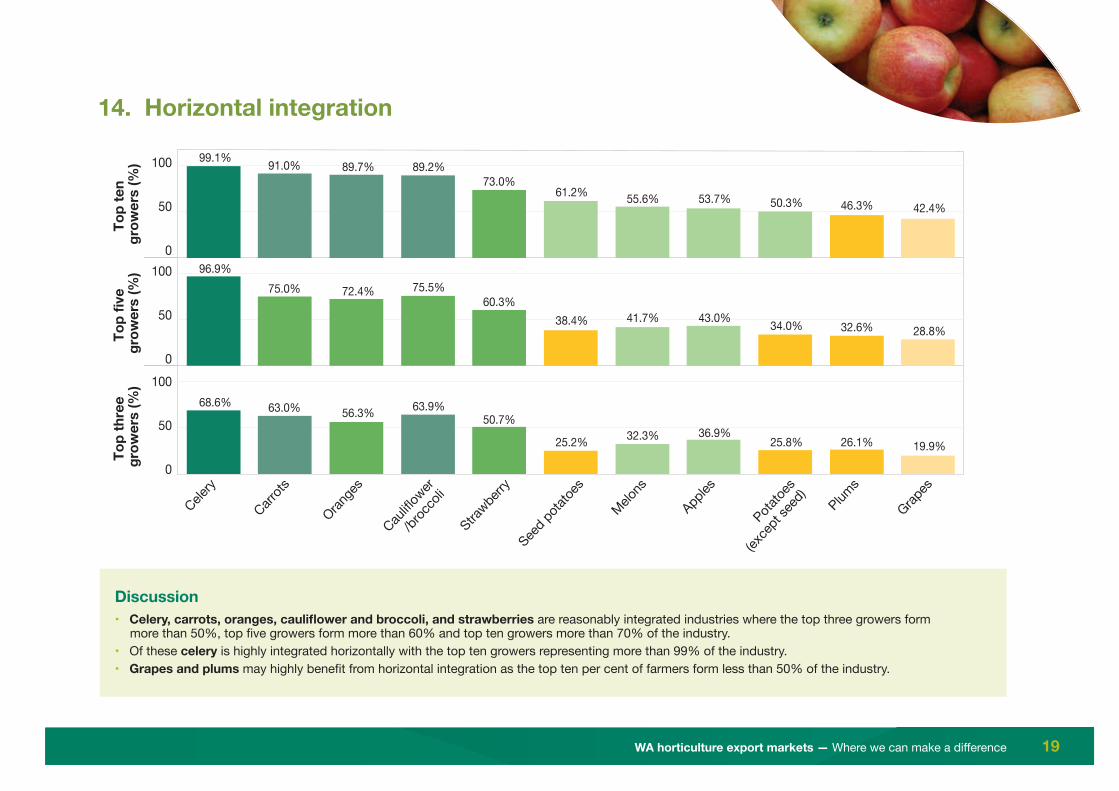
14. Horizontal integration
100
50
0100
50
0100
50
0
Celery
Carrots
Orange
s
Cauliflo
wer/br
occo
liStra
wberry
Seed p
otatoe
s
Melons
Apples
Potatoe
s
(exce
pt se
ed)
Plums
Grapes
Top
ten
grow
ers
(%)
Top
five
grow
ers
(%)
Top
thre
e gr
ower
s (%
)99.1%
96.9%
68.6%
91.0%
75.0%
63.0%
89.2%
75.5%
63.9%
89.7%
72.4%
56.3%
73.0%
60.3%
50.7%
61.2%
38.4%
25.2%
55.6%
41.7%
32.3%
53.7%
43.0%
36.9%
50.3%
34.0%
25.8%
46.3%
32.6%
26.1%
42.4%
28.8%
19.9%
Discussion• Celery, carrots, oranges, caulifl ower and broccoli, and strawberries are reasonably integrated industries where the top three growers form
more than 50%, top fi ve growers form more than 60% and top ten growers more than 70% of the industry.• Of these celery is highly integrated horizontally with the top ten growers representing more than 99% of the industry.• Grapes and plums may highly benefi t from horizontal integration as the top ten per cent of farmers form less than 50% of the industry.
WA horticulture export markets — Where we can make a diff erence20
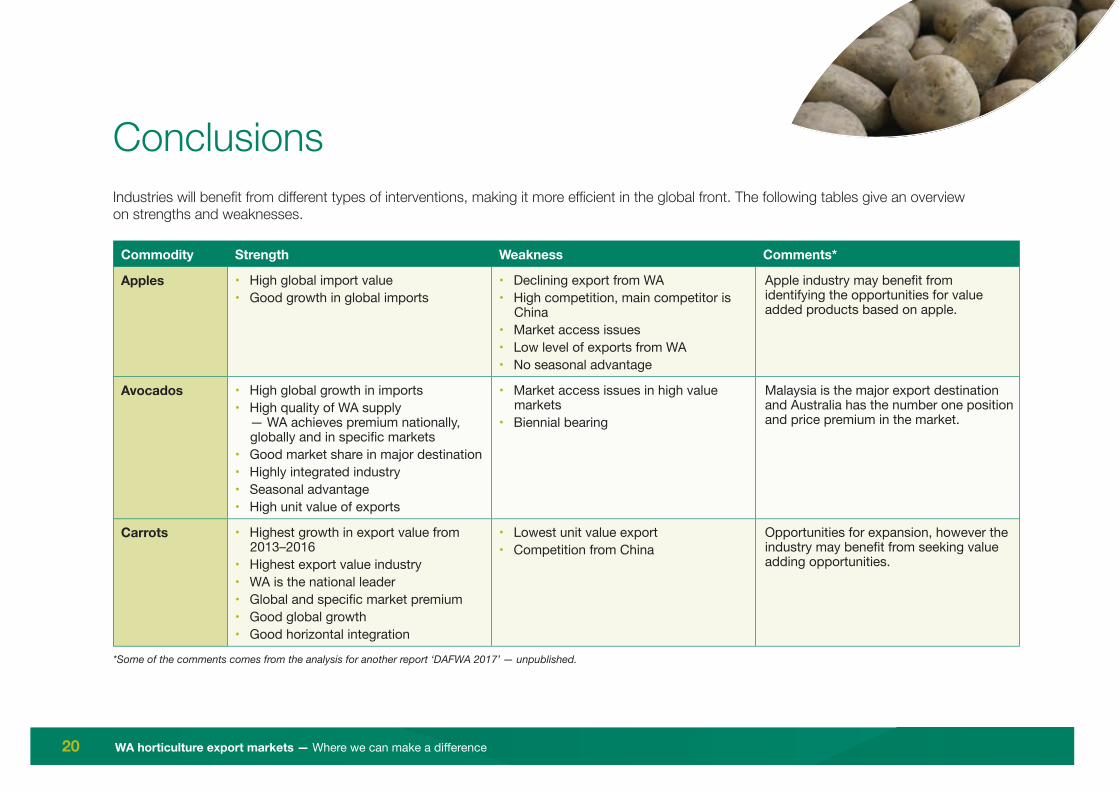
ConclusionsIndustries will benefi t from diff erent types of interventions, making it more effi cient in the global front. The following tables give an overview on strengths and weaknesses.
Commodity Strength Weakness Comments*
Apples • High global import value• Good growth in global imports
• Declining export from WA• High competition, main competitor is
China• Market access issues• Low level of exports from WA• No seasonal advantage
Apple industry may benefi t from identifying the opportunities for value added products based on apple.
Avocados • High global growth in imports• High quality of WA supply
— WA achieves premium nationally, globally and in specifi c markets
• Good market share in major destination• Highly integrated industry• Seasonal advantage• High unit value of exports
• Market access issues in high value markets
• Biennial bearing
Malaysia is the major export destination and Australia has the number one position and price premium in the market.
Carrots • Highest growth in export value from 2013–2016
• Highest export value industry• WA is the national leader• Global and specifi c market premium• Good global growth• Good horizontal integration
• Lowest unit value export• Competition from China
Opportunities for expansion, however the industry may benefi t from seeking value adding opportunities.
*Some of the comments comes from the analysis for another report ‘DAFWA 2017’ — unpublished.

WA horticulture export markets — Where we can make a diff erence 21
Commodity Strength Weakness Comments*
Caulifl ower and broccoli
• Highest growth in export percentage from 2013-2016
• Price premium globally and in specifi c markets
• Reasonable growth in global imports• Less market access issues
• Exports in small scale• Competition from China
Industry may grow better once scale is reached.
Celery • Highly integrated horizontally• Good national share• Price premium globally and in specifi c
markets• Clear advantage in exporting rather
than supplying at domestic market• Reasonable growth in global imports• Good share nationally• Less market access issues
• Lowest share in global import value among analysed industries showing not a highly consumed commodity at the global front
• Global price premium received are not high
Industry may benefi t from eff orts to supply at premium market and premium end of the current market. Australian supply to UAE is at $3.29/kg, which is not a current market for WA. Australian supply to Malaysia which is the major market for WA and Australian celery is at $ 1.37/kg while WA supply to Malaysia is at $1.29/kg.Diversifi cation or expansion of markets to include more premium value importers would be benefi cial.
Grapes • Supply at high price points• Highest global share• Good global growth• Seasonal advantage• Price premium received nationally
and globally
• Highly fragmented• Low scale of export• Decline in value of export since 2013• Cold treatment required in high value
markets• Australian supply is at lower price
points than competitors
Industry may benefi t from horizontal integration and increasing the scale. Receiving a clear price premium at the major destination indicating the quality of the product, even though import is at low scale.
Melons • Price premium globally and at specifi c market
• Clear price advantage compared to competitor in the major market
• Good growth in exports
• Competition from low cost importers during WA season
• Large number of growers and highly disaggregated
Industry may benefi t from horizontal integration and diversifying market destination, especially exploring the opportunities in the premium market.

WA horticulture export markets — Where we can make a diff erence22
Commodity Strength Weakness Comments*
Oranges • Good horizontal integration• Good growth in exports from WA• Australia has good share in major
destination country• Seasonal advantage
• Low share nationally• High value markets need cold treatment
Industry can improve by increasing the scale and targeting the premium segment in the destination market.
Plums • Seasonal advantage• Specifi c market premium
• Lowest global market premium• WA supply at below average price
compared to national supply• Market access issues• Highly disaggregated
Industry will benefi t from horizontal integration. If China market becomes open to WA plums, it may create a good opportunity, but the industry has to be supply ready to capitalise this opportunity.
Seed potatoes • Market premium nationally, globally and in specifi c markets
• Good share in the major destination market
• Seasonal advantage• Reputation in quality
• Export has declined from 2013 Good opportunity globally as we have the seasonal advantage. Industry may benefi t from diversifying the export markets.
Strawberry • High unit value of export• High growth in exports from WA since
2013• Good price premium nationally and
globally• National leader• Seasonal advantage• Reasonable level of integration• Good global demand• Low competition
• Not realising the price premium in the major destination market
• Market access issues, high value markets are not open to WA strawberries
• Availability of runners
Varietal advantage and branding are the strength of South Korea; WA’s main competitor in the largest destination market. WA may benefi t from expanding on varieties and working on market promotional activities. The industry has good seasonal advantage. Strawberry will benefi t from resolving the market access barriers in high value markets such as Japan.
WA horticulture export markets — Where we can make a diff erence 23
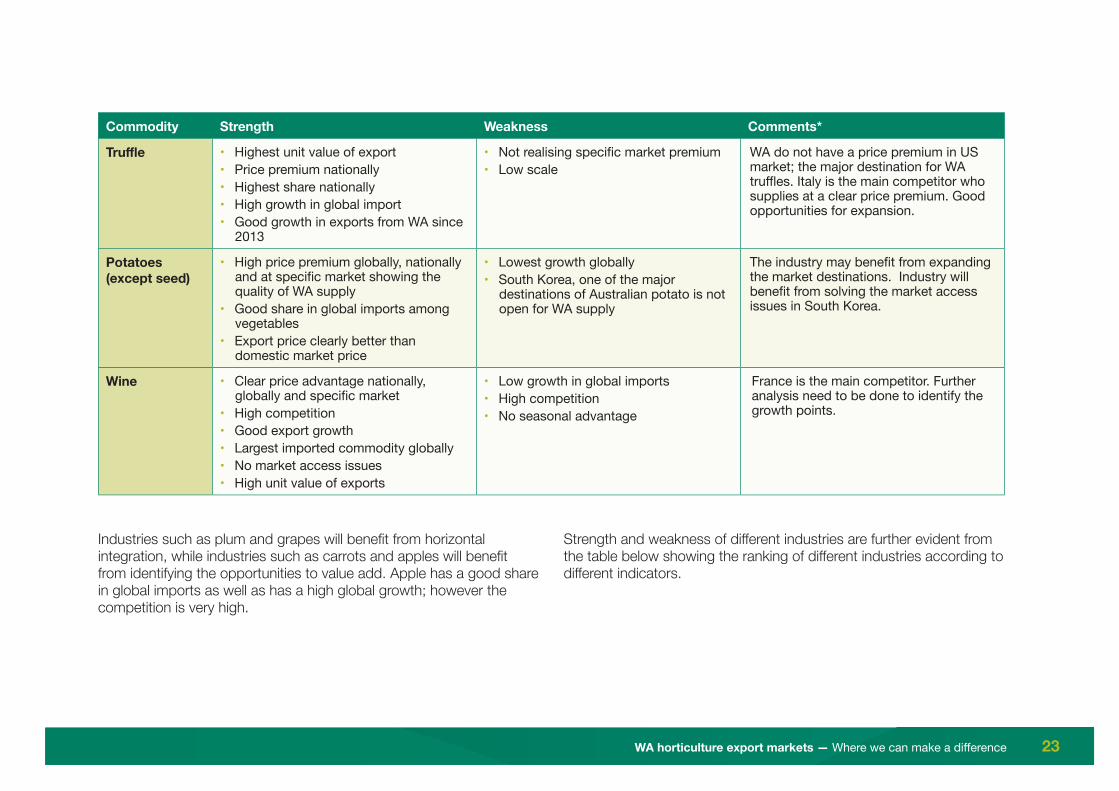
Commodity Strength Weakness Comments*
Truffl e • Highest unit value of export• Price premium nationally• Highest share nationally• High growth in global import• Good growth in exports from WA since
2013
• Not realising specifi c market premium• Low scale
WA do not have a price premium in US market; the major destination for WA truffl es. Italy is the main competitor who supplies at a clear price premium. Good opportunities for expansion.
Potatoes (except seed)
• High price premium globally, nationally and at specifi c market showing the quality of WA supply
• Good share in global imports among vegetables
• Export price clearly better than domestic market price
• Lowest growth globally• South Korea, one of the major
destinations of Australian potato is not open for WA supply
The industry may benefi t from expanding the market destinations. Industry will benefi t from solving the market access issues in South Korea.
Wine • Clear price advantage nationally, globally and specifi c market
• High competition• Good export growth• Largest imported commodity globally• No market access issues• High unit value of exports
• Low growth in global imports• High competition• No seasonal advantage
France is the main competitor. Further analysis need to be done to identify the growth points.
Industries such as plum and grapes will benefi t from horizontal integration, while industries such as carrots and apples will benefi t from identifying the opportunities to value add. Apple has a good share in global imports as well as has a high global growth; however the competition is very high.
Strength and weakness of diff erent industries are further evident from the table below showing the ranking of diff erent industries according to diff erent indicators.
WA horticulture export markets — Where we can make a diff erence24
Ran
king
Glo
bal i
mpo
rt
valu
e
Glo
bal i
mpo
rt
grow
th
WA’
s ex
port
va
lue
WA’
s un
it va
lue
of e
xpor
t
Nat
iona
l sha
re
Nat
iona
l pric
e pr
emiu
m
Glo
bal p
rice
prem
ium
Shar
e in
sp
ecifi
c m
arke
t
Spec
ifi c
mar
ket
pric
e pr
emiu
m
Perc
enta
ge
grow
th in
ex
port
s
Valu
e gr
owth
in
exp
orts
Mar
ket a
cces
s
Com
para
tive
pric
e
Hor
izon
tal
inte
grat
ion
1 Wine Avocados Carrots Truffl es Truffl es Wine Potatoes (not seed)
Seed potatoes
Potatoes (not seed)
Caulifl ower and broccoli
Strawberries Wine Celery Celery
2 Grapes Truffl es Wine Strawberries Strawberries Truffl es Apples Avocados Melons Strawberries Carrots Caulifl ower and broccoli
Apples Carrots
3 Apples Carrots Strawberries Wine Carrots Potatoes (not seed)
Avocados Carrots Carrots Celery Wine Celery Potatoes (not seed)
Oranges
4 Oranges Strawberries Truffl es Avocados Seed potatoes
Avocados Strawberries Caulifl ower and broccoli
Caulifl ower and broccoli
Melons Oranges Seed potatoes
Avocados Caulifl ower and broccoli
5 Avocados Celery Melons Grapes Celery Grapes Caulifl ower and broccoli
Plums Wine Plums Melons Carrots Strawberries Strawberries
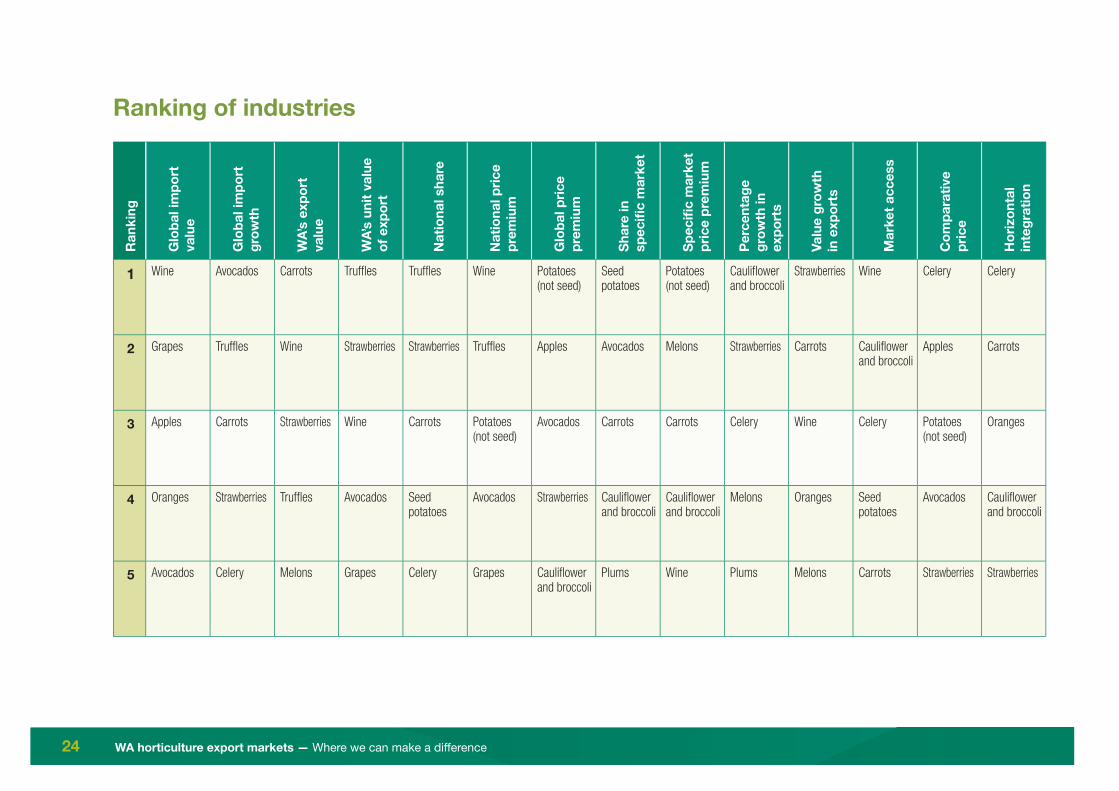
Ranking of industries

WA horticulture export markets — Where we can make a diff erence 25
Ran
king
Glo
bal i
mpo
rt
valu
e
Glo
bal i
mpo
rt
grow
th
WA’
s ex
port
va
lue
WA’
s un
it va
lue
of e
xpor
t
Nat
iona
l sha
re
Nat
iona
l pric
e pr
emiu
m
Glo
bal p
rice
prem
ium
Shar
e in
sp
ecifi
c m
arke
t
Spec
ifi c
mar
ket
pric
e pr
emiu
m
Perc
enta
ge
grow
th in
ex
port
s
Valu
e gr
owth
in
exp
orts
Mar
ket a
cces
s
Com
para
tive
pric
e
Hor
izon
tal
inte
grat
ion
6 Potatoes (not seed)
Caulifl ower and broccoli
Potatoes (not seed)
Apples Avocados Apples Melons Grapes Seed potatoes
Potatoes (not seed)
Truffl es Grapes Caulifl ower and broccoli
Seed potatoes
7 Strawberries Apples Oranges Caulifl ower and broccoli
Melons Strawberries Seed potatoes
Celery Avocados Truffl es Celery Oranges Oranges Melons
8 Melon Grapes Celery Plums Plums Seed potatoes
Grapes Wine Celery Carrots Potatoes (not seed)
Strawberries Melons Apples
9 Carrots Plums Seed potatoes
Melons Potatoes (not seed)
Melons Oranges Melons Plums Avocados Plums Ware potatoes
Plums Ware potatoes
10 Caulifl ower and broccoli
Wine Avocados Oranges Caulifl ower and broccoli
Oranges Wine Strawberries Oranges Wine Caulifl ower and broccoli
Melons Carrots Plums
WA horticulture export markets — Where we can make a diff erence26
Ran
king
Glo
bal i
mpo
rt
valu
e
Glo
bal i
mpo
rt
grow
th
WA’
s ex
port
va
lue
WA’
s un
it va
lue
of e
xpor
t
Nat
iona
l sha
re
Nat
iona
l pric
e pr
emiu
m
Glo
bal p
rice
prem
ium
Shar
e in
sp
ecifi
c m
arke
t
Spec
ifi c
mar
ket
pric
e pr
emiu
m
Perc
enta
ge
grow
th in
ex
port
s
Valu
e gr
owth
in
exp
orts
Mar
ket a
cces
s
Com
para
tive
pric
e
Hor
izon
tal
inte
grat
ion
11 Plums Melons Plums Celery Wine Carrots Celery Oranges Apples Seed potato Avocados Avocados Grapes Grapes
12 Seed potatoes
Seed potatoes
Caulifl ower and broccoli
Seed potatoes
Oranges Caulifl ower and broccoli
Carrots Potatoes(not seed)
Grapes Grapes Grapes Plums
13 Truffl es Oranges Grapes Potatoes (not seed)
Apples Celery Plums Truffl e Strawberries Apples Apples Apples
14 Celery Potatoes (not seed)
Apples Carrots Grapes Plums Apples Seed potatoes
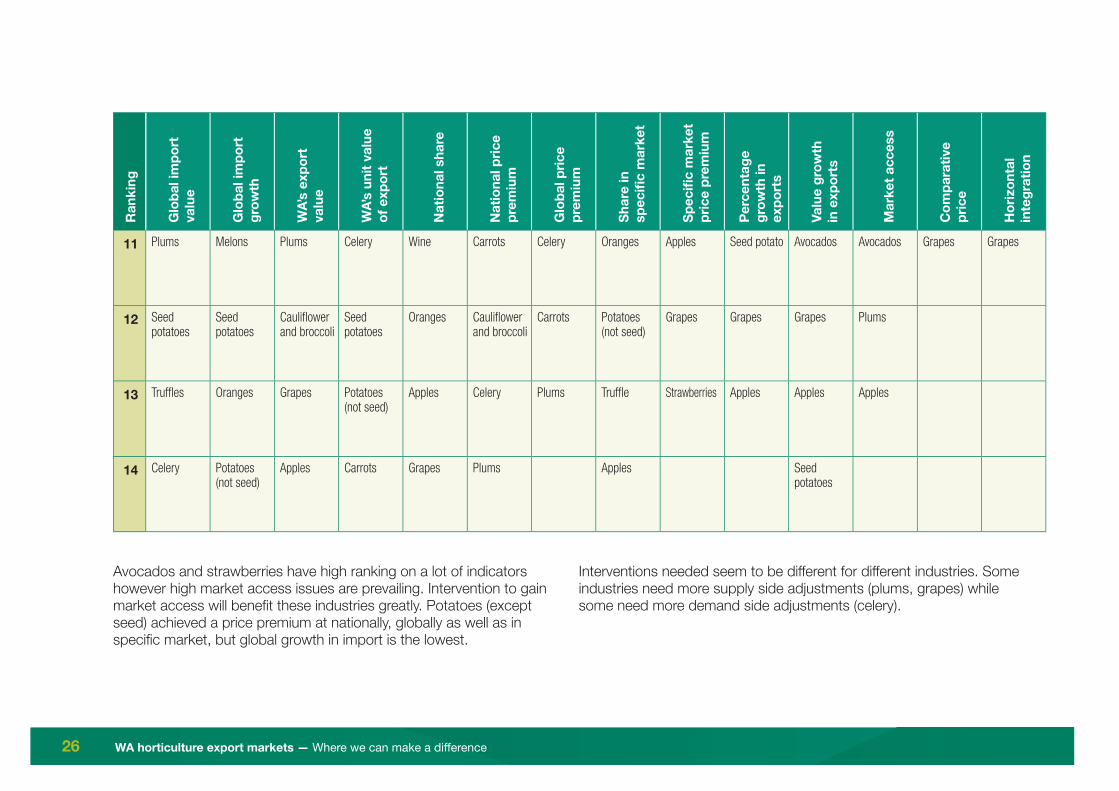
Avocados and strawberries have high ranking on a lot of indicators however high market access issues are prevailing. Intervention to gain market access will benefi t these industries greatly. Potatoes (except seed) achieved a price premium at nationally, globally as well as in specifi c market, but global growth in import is the lowest.
Interventions needed seem to be diff erent for diff erent industries. Some industries need more supply side adjustments (plums, grapes) while some need more demand side adjustments (celery).
WA horticulture export markets — Where we can make a diff erence 27
Reference1. Agricultural Produce Commission2. Coriolis 2016. Target market opportunities in Asia for Western
Australian premium products3. DAFWA 2017 Market opportunities for Western Australian fruits
(unpublished)4. Food and Agriculture Organisation5. Global Trade Atlas6. International Trade Centre

Department ofAgriculture and Food
South Perth head offi ce3 Baron-Hay CourtSouth Perth WA 6151
Phone: +61 (0)8 9368 3333Fax: +61 (0)8 9474 2405agric.wa.gov.au