(w14) 07-11 july 2014 equity market update, thisistomorrow
DESCRIPTION
“This Is Tomorrow, Equity Markets Update” is a research based on new approach toquantitative analysis in which the goal is to develop better understanding of marketmovements and risk management. This is a practical solution and comprehensivepicture of certain security with a view to improve investment performance. It offers asmart trading capability along with a disciplined approach.TRANSCRIPT

This Is Tomorrow Equity Markets Update
07-11 July 2014
█ “This Is Tomorrow, Equity Markets Update” is a research based on new approach to
quantitative analysis in which the goal is to develop better understanding of market
movements and risk management. This is a practical solution and comprehensive
picture of certain security with a view to improve investment performance. It offers a
smart trading capability along with a disciplined approach.

█This Is Tomorrow | Equity Markets Update
Page 2| 07-11 July 2014
█Table 1: Summary
Indices(UPDATED) All three indices we examine here, has structured a fast growing upward trend which indicates a continuation of 7-week rising streak. It is predicted that the major indices move upward or at least stay well above the June low during July. Cycle analysis suggests that indices are approaching to the end of medium-term rising cycle which means it is likely to see a correction during late June or early August 2014.
⍟SPX: the short-term rising trend is headed toward 2000 with high rate of
growth. Short term target is reached at 1985 and as long as the price is above 1970, demand may push the price higher around 2000.A closing price below 1970 can be the first sign of change in current up-trend. A possible short-term correction is likely to take place up to 1961 and then 1930. A closing price below 1925 will indicate that a downward move may stretch up to 1850.
⍟RUT: Recent uptrend is headed toward to 1210 and it is likely higher levels
during June; however a decrease in price may take place around 1180.
Technology(UPDATED) ⍟FB: The uptrend may be headed toward 71.4 over July; however a two-
month rising uptrend may halt if a closing price below 65.7 takes place.
⍟HPQ: Despite the fact that it is expected to primary uptrend stretched up
to 38.4 and 42 over the next six months; however before that it is likely to see a price depreciation up to 33 and 31.8
⍟MSFT: As long as price is closed above 40.9, the recent rising trend will
continue over July. Strong demands are clustered around 41 and 40.3. The short-term cycle is about to take hold above 41.5. Overall an increase in price up to 44.3 and 47 is forecast over the coming six months. A closing price below 41 suggests a period of back and forth action between 39.8 and 41.6 which may take two months.
Technology(UPDATED) ⍟AAPL: The uptrend is headed toward 96.7. Recently new short-term rising
trend snapped back from 91. Demand may push the price higher during July near to 97 as long as a closing price is above 92.7. The mid-term rising uptrend may go above 100 this year, if a closing price stays well above 89.
⍟AMZN: The uptrend is headed toward 365 over this quarter. Recently new
short-term rising trend if formed. Demand may drive the price higher during July near to 348 as long as a closing price is above 337.7.
⍟GOOGL: The uptrend is headed toward 611.
Financial(UPDATED) ⍟WFC: The recent rally is headed toward 55 by the end of the quarter.
However before reaching this level, a Short correction may be took place up to 51.9 and then 50.8 over July.
⍟BAC: The new short-term upward cycle is set to reach 16.4 and then 17.4
levels. Supply in short-term is clustered around 16.5 and it is likely to cause a drop in price up to 15.8. Having bottomed out, the security is about to trade between 15 and 17.4 during the third quarter.
Non-Cyclical Consumer (UPDATED)
⍟MO: The long term bull market will likely be on course. A short-term
correction may take place within the coming week. A closing price below 41.5 suggests price depreciation up to 39.6.
⍟Strong-Buy ⍟Buy ⍟Natural ⍟Sell ⍟Strong-Sell
█This Is Tomorrow | Equity Markets Update
Page 3| 07-11 July 2014
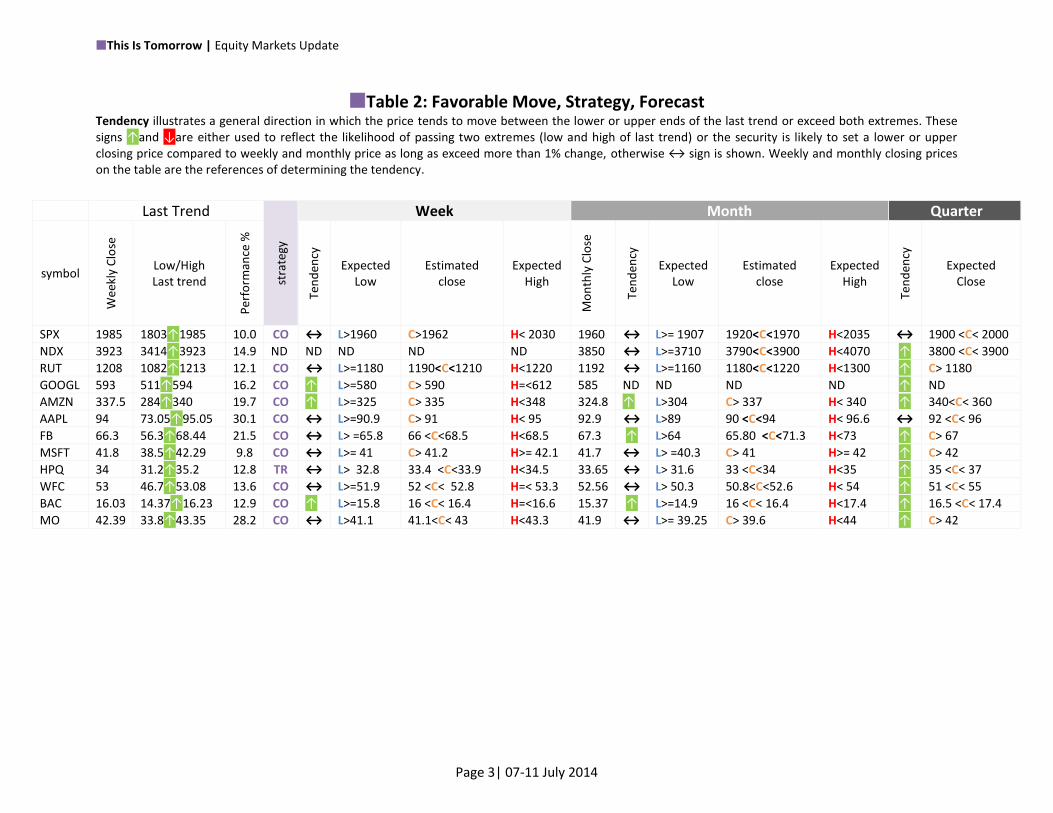
█Table 2: Favorable Move, Strategy, Forecast Tendency illustrates a general direction in which the price tends to move between the lower or upper ends of the last trend or exceed both extremes. These signs ↑and ↓are either used to reflect the likelihood of passing two extremes (low and high of last trend) or the security is likely to set a lower or upper closing price compared to weekly and monthly price as long as exceed more than 1% change, otherwise ↔ sign is shown. Weekly and monthly closing prices on the table are the references of determining the tendency.
Last Trend
stra
tegy
Week Month Quarter
symbol
Wee
kly
Clo
se
Low/High Last trend
Per
form
ance
%
Ten
den
cy
Expected Low
Estimated close
Expected High
Mo
nth
ly C
lose
Ten
den
cy
Expected Low
Estimated close
Expected High
Ten
den
cy
Expected Close
SPX 1985 1803↑1985 10.0 CO ↔ L>1960 C>1962 H< 2030 1960 ↔ L>= 1907 1920<C<1970 H<2035 ↔ 1900 <C< 2000
NDX 3923 3414↑3923 14.9 ND ND ND ND ND 3850 ↔ L>=3710 3790<C<3900 H<4070 ↑ 3800 <C< 3900
RUT 1208 1082↑1213 12.1 CO ↔ L>=1180 1190<C<1210 H<1220 1192 ↔ L>=1160 1180<C<1220 H<1300 ↑ C> 1180
GOOGL 593 511↑594 16.2 CO ↑ L>=580 C> 590 H=<612 585 ND ND ND ND ↑ ND
AMZN 337.5 284↑340 19.7 CO ↑ L>=325 C> 335 H<348 324.8 ↑ L>304 C> 337 H< 340 ↑ 340<C< 360
AAPL 94 73.05↑95.05 30.1 CO ↔ L>=90.9 C> 91 H< 95 92.9 ↔ L>89 90 <C<94 H< 96.6 ↔ 92 <C< 96
FB 66.3 56.3↑68.44 21.5 CO ↔ L> =65.8 66 <C<68.5 H<68.5 67.3 ↑ L>64 65.80 <C<71.3 H<73 ↑ C> 67
MSFT 41.8 38.5↑42.29 9.8 CO ↔ L>= 41 C> 41.2 H>= 42.1 41.7 ↔ L> =40.3 C> 41 H>= 42 ↑ C> 42
HPQ 34 31.2↑35.2 12.8 TR ↔ L> 32.8 33.4 <C<33.9 H<34.5 33.65 ↔ L> 31.6 33 <C<34 H<35 ↑ 35 <C< 37
WFC 53 46.7↑53.08 13.6 CO ↔ L>=51.9 52 <C< 52.8 H=< 53.3 52.56 ↔ L> 50.3 50.8<C<52.6 H< 54 ↑ 51 <C< 55
BAC 16.03 14.37↑16.23 12.9 CO ↑ L>=15.8 16 <C< 16.4 H=<16.6 15.37 ↑ L>=14.9 16 <C< 16.4 H<17.4 ↑ 16.5 <C< 17.4
MO 42.39 33.8↑43.35 28.2 CO ↔ L>41.1 41.1<C< 43 H<43.3 41.9 ↔ L>= 39.25 C> 39.6 H<44 ↑ C> 42
█This Is Tomorrow | Equity Markets Update
Page 4| 07-11 July 2014
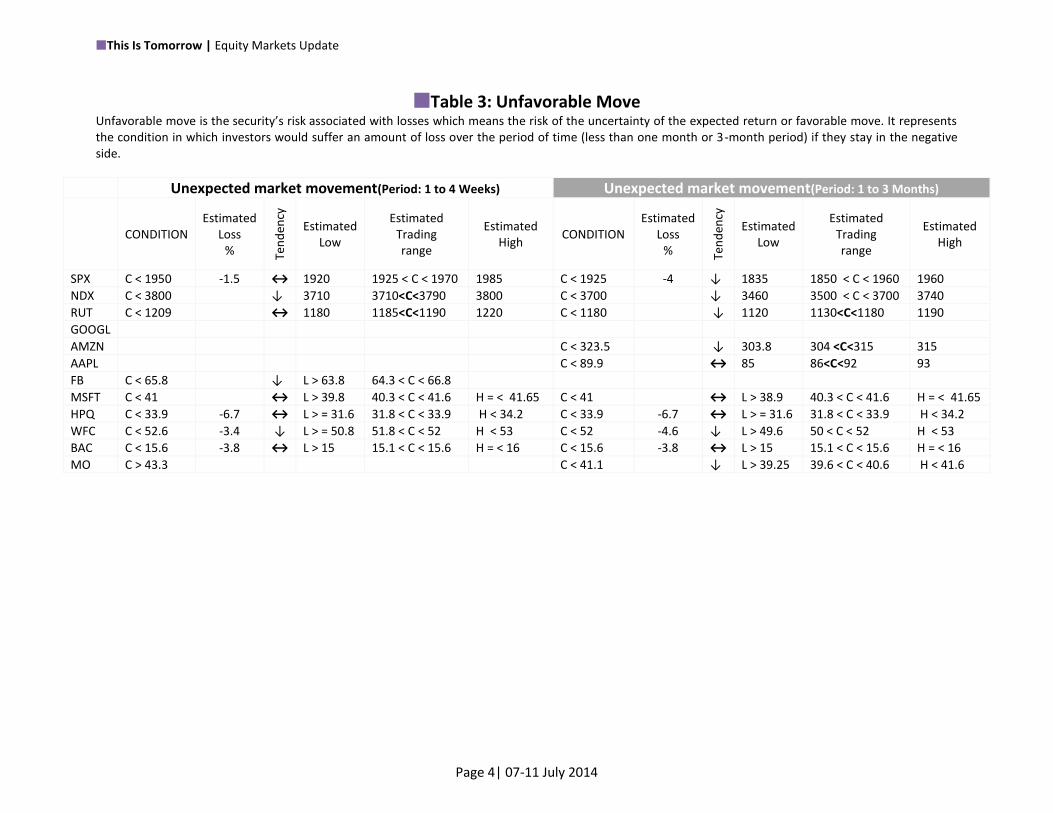
█Table 3: Unfavorable Move Unfavorable move is the security’s risk associated with losses which means the risk of the uncertainty of the expected return or favorable move. It represents the condition in which investors would suffer an amount of loss over the period of time (less than one month or 3-month period) if they stay in the negative side.
Unexpected market movement(Period: 1 to 4 Weeks) Unexpected market movement(Period: 1 to 3 Months)
CONDITION Estimated
Loss % Te
nd
ency
Estimated Low
Estimated Trading range
Estimated High
CONDITION Estimated
Loss % Te
nd
ency
Estimated Low
Estimated Trading range
Estimated High
SPX C < 1950 -1.5 ↔ 1920 1925 < C < 1970 1985 C < 1925 -4 ↓ 1835 1850 < C < 1960 1960
NDX C < 3800 ↓ 3710 3710<C<3790 3800 C < 3700 ↓ 3460 3500 < C < 3700 3740
RUT C < 1209 ↔ 1180 1185<C<1190 1220 C < 1180 ↓ 1120 1130<C<1180 1190
GOOGL
AMZN C < 323.5 ↓ 303.8 304 <C<315 315
AAPL C < 89.9 ↔ 85 86<C<92 93
FB C < 65.8 ↓ L > 63.8 64.3 < C < 66.8
MSFT C < 41 ↔ L > 39.8 40.3 < C < 41.6 H = < 41.65 C < 41 ↔ L > 38.9 40.3 < C < 41.6 H = < 41.65
HPQ C < 33.9 -6.7 ↔ L > = 31.6 31.8 < C < 33.9 H < 34.2 C < 33.9 -6.7 ↔ L > = 31.6 31.8 < C < 33.9 H < 34.2
WFC C < 52.6 -3.4 ↓ L > = 50.8 51.8 < C < 52 H < 53 C < 52 -4.6 ↓ L > 49.6 50 < C < 52 H < 53
BAC C < 15.6 -3.8 ↔ L > 15 15.1 < C < 15.6 H = < 16 C < 15.6 -3.8 ↔ L > 15 15.1 < C < 15.6 H = < 16
MO C > 43.3 C < 41.1 ↓ L > 39.25 39.6 < C < 40.6 H < 41.6

█This Is Tomorrow | Equity Markets Update
Page 5| 07-11 July 2014
█Table 4: Risk and Warning levels What is the downside risk? An estimation of a security's potential to experience a drop in price. Risk explains a rate of growth within a trend and future cash flows.
Downside Risk Upside Beta
Last
●Warning (Short-term)
Initial Warning
● Risk (Short-term) Daily Close
● Risk (Mid-term)
Weekly Close
● WCS Worst Case
Scenario
●Warning (Short-term)
Initial Warning
● Risk (Short-term) Daily Close
● Risk (Mid-term)
Weekly Close
● WCS Worst Case
Scenario
SPX 1985 C<1964 C < 1955 C <1925 L = 1835 L >1975 C> 1975 H = 2035
NDX 3923 C <3800 C < 3705 C < 3705 L = 3460
RUT 1208 C < 1209 C <1180 C <1154 L = 1120 C > 1209 H = 1290
GOOGL 593 C < 580 C < 568
AMZN 337.5 C < 325 C < 320 C < 320 L = 303.8 C > 337.7
AAPL 94 C < 92.7 C < 89.1 C < 89.1 L = 85.8 C > 96.7 H = 101
FB 66.3 L < 65.7 C <65.8 C <62.05 L = 59.8 C > 71.4
MSFT 41.8 C <41.6 C <41 C <40.3 L = 39.65
HPQ 34 C < 33.9 C <33.9 C < 31.6 L= 31.6
WFC 53 C <52.6 C < 52.05 C <50 L = 49.8
BAC 16.03 L < 15.7 C < 15.6 C < 15.05 L= 15.05 L = 16.6 C > 16.4 C > 15.8 H = 17.4
MO 42.39 C <41.95 C < 41.1 C <43 L = 39.25

█This Is Tomorrow | Equity Markets Update
Page 6| 07-11 July 2014
█Table 5: Trend Analysis
Symbol Last UP TREND ▲ DOWN TREND ▼ Market State Trend Strength %
MIN SEC INT PRI GRA SUP MIN SEC INT PRI GRA SUP Bias Stage Phase Overall MIN SEC INT PRI GRA
SPX 1985 1949 1850 1420 1370 1500 1576 - - - - - - 6 TN +1 41.1 1.8 5.4 30.3 3.6 -8.7
NDX 3923 3800 3740 3635 2800 2240 4800 - - - - - - 6 TN +1 62.6 3.2 1.6 2.9 29.8 25.0
RUT 1208 1180 1140 1180 870 615 855 - - - - - - 6 TN +1 78.2 1.0 3.5 -3.4 35.6 41.5
GOOGL 593 575 540 465 315 380 - - - - - - - 6 TN +1 25.7 3.1 6.5 16.1 47.6 -17.1
AMZN 337.5 330 315 405 246 - - - 337 - - - - 3 TN +1 -15.2 2.3 4.8 -22.2 64.6 -
AAPL 94 93 82.2 82.2 100 29 5.4 - - - - - - 6 TN +3 238 -1.1 7.8 5.0 -17.8 244
FB 66.3 64.15 71.4 32.3 - - - - - - - - - 5 TN +2 114.3 3.4 -10.2 121.1 - -
MSFT 41.8 41.6 41 33 31.5 37.5 60 38.9 - - - - 6 TN +4 30.9 0.5 1.5 24.2 4.8 -16.0
HPQ 34 34.1 33.9 30.1 27.8 54.7 78 - - - - - - 5 CO +3 -27.7 0.6 12.6 8.3 -49.2 -29.9
WFC 53 52.6 50 44.8 34.6 38 44.7 51.65 51.1 - - - - 6 TN +4 37.3 5.2 11.6 29.5 -8.9 -15.0
BAC 16.03 15.3 15.3 17.4 18.25 19.9 44.5 14.86 15.6 - - - - 2 TN +1 -12.0 4.8 0.0 -12.1 -4.7 -8.3
MO 42.39 41.6 37.3 38.5 36.3 29.8 25 - - - - - - 6 CO +8 16.4 1.9 11.5 -3.1 6.1 21.8
Trend = TN, Side Way=SW, Correction = CO, Consolidation=CN
Underway-Ongoing, the closing price above(Uptrend side)/below (Downtrend side) this level is forecast during the three coming weeks
New trend may be about to take hold
The trend is already ended
The trend may be ended soon
A warning that the trend may be halted(unsuitable level)
Bias: +6 +5 +4 +3 +2 +1 0 -1 -2 -3 -4 -5 -6

█This Is Tomorrow | Equity Markets Update
Page 7| 07-11 July 2014
█Table 6: Cycle Analysis
Minor Secondary Intermediate Primary Grand Super
Cyc
le
Phase
Hea
ded
to
Cyc
le
Phase
Hea
ded
to
Cyc
le
Phase
Hea
ded
to
Cyc
le
Phase
Hea
ded
to
Cyc
le
Ph
ase
Hea
ded
to
Cyc
le
Ph
ase
Hea
ded
to
SPX +2 1800↑1985 2030 +3 1738↑1985 2060 +2 1340↑1985 2030 +2 1075↑1985 2500 +1 ↑ +2 ↑
NDX +3 ↑ +1 ↑ 4100 +3 ↑ +2 ↑ +1 ↑ +2 ↑
RUT +2 ↑ +1 ↑ +3 ↑ +2 ↑ +1 ↑ +2 ↑
GOOGL +2 ↑ +1 ↑ +2 ↑ +2 ↑ +2 ↑ +1 ↑
AMZN +3 321.0↑338.3 348 +1 290.3↑340.7 365 +3 245↑405 +2 38.80↑408.0 +2 ↑ +1 ↑
AAPL +3 89.05↑94.10 94.25 +4 71.30↑95.05 96.7 +1 55.00↑95.05 96.7 +3 55.00↑95.05 >100.7 +1 ↑ +2 ↑
FB +3 ↑ +3 ↑ +2 ↑ +1 ↑ +1 ↑ +1 ↑
MSFT +2 ↑ +4 ↑ +2 ↑ +2 ↑ +1 ↑ +2 ↑
HPQ +1 ↑ +2 ↑ +1 ↑ +2 ↑ +1 ↑ +2 ↑
WFC +2 ↑ +3 ↑ +2 ↑ +2 ↑ +1 ↑ +2 ↑
BAC +2 ↑ +1 ↑ +3 ↑ +1 ↑ +1 ↑ +2 ↑
MO +2 ↑ +2 ↑ +1 ↑ +1 ↑ +2 ↑ +3 ↑
; The cycle may be ended (Warning stage, for confirmation new data is need) ↑;the cycle may be ended (based on New evidence and data)↑ The cycle is already ended ↑A new cycle may be about to take hold (the likelihood of failure should be considered)↑, the cycle remains intact (ongoing) ↑,

█This Is Tomorrow | Equity Markets Update
Page 8| 07-11 July 2014
█Table7: Demand – Supply Study, Probability Distribution
Probability 4 12 33 68 84 Last 84 68 33 12 4
SPX 2050 2035 2000 1995 1987 1985 ●1970 1960 ●1949 1925 ●1850
S S P S S P OB D1 BL UTR D2 D3 OS
NDX 4140 4080 4000 3905 3865 3845 ●3800 3775 3750 ●3710 ●3695
S S S S OB S D1 BL D1 OS D10 R BL
RUT 1340 1290 1255 1212 ●1209 1208 1190 ●1180 1168 ●1154 ●1120
S S S P S D1 D2 R BL D2 D1 R OS
GOOGL 658 642 637 611 600 594 585 ●577 ●568 560 540
S S S P S D4 BL UT D2 R D2 UT
AMZN 365 362 359 348 ●333.7 337.4 335.7 330 ●325 ●320 312
S S S S P P D5 BL D10 BL R W
AAPL 100.7 97.3 ●96.7 95.05 94.25 94.03 ●92.7 ●92 91 89.65 ●89.1
P S S P S P UT D3 BL OS R
FB 72.6 ●71.4 69.6 ●68 66.85 66.3 ●66.2 ●65.8 63.8 ●62.05 ●61.8
P S S S P2 BS P D4 BL D D5 BL OS W
MSFT 46 44.7 44.3 42.9 41.9 41.8 ●41.60 41.2 ●41 40.35 ●39.6
S S S S S P D1 D2 R BL D3 R BL OS
HPQ 37.7 37 ●35.05 34.5 ●34.1 34 33.9 33.1 ●32.8 32.65 ●●31.6
S S S S P P D2 BL D3 D9 OS D10 R BL
WFC 55 54.6 54 53.3 53.05 53 ●52.6 ●52.05 50.85 ●50 ●49.8
S S S S OB P UT P2 R BL D4 R BL OS W
BAC 18 17.4 ●16.6 16.4 16.23 16.03 15.95 ●15.8 ●15.6 15.3 ●15.05
S S3 OB S2 S P D3 D4 BL UT R D OS W
MO 45.3 44.1 ●43.3 43 42.7 42.39 ●41.55 41.35 ●41.1 39.6 ●39.3
S S P R S8 SL S UT D1 P R D10 BL R OS
UP-TREND=UT, DOWN-TREND=DT, RISK=R, Worst Case Scenario= W, Supply=S, Demand=D, Pivot=P, Sell Limit=SL, Sell Stop=SS, Buy Limit=BL, Buy Stop=BS Overbought=OB, Oversold=OS

█This Is Tomorrow | Equity Markets Update
Page 9| 07-11 July 2014
█Table 8: Rate of change, OB, OS, Key levels
Key levels Quarter Month Rate of change (Momentum)
Demand Supply Over
bought Over sold
Over bought
Over sold
Normal (Fast growing)
Short term
Medium term
Long term
SPX 1850 1980 1820 1980 1850 0.97 13% 2.54 34% 1.7 23% 0.59 8%
NDX 3700 3710
RUT
GOOGL
AMZN
AAPL
FB
MSFT 40.3 39.8 39.8 0.024 53% 0.07 58% 0.045 47% 0.013 26%
HPQ 31.65 37.7 37.7 31.65 35 33.1
WFC 50.3 49.8 50.8 0.11 85% 0.07 53% 0.02 35%
BAC 17.4 18 15 17.4 15.6
MO 39.1 39.25 39.6
Short-term: less than 4 weeks, Medium-term: between 1 and 3 months, Long-term: more than 9 months (Percentage figures are compounded and annualized)

█This Is Tomorrow | Equity Markets Update
Page 10| 07-11 July 2014
█Table 9: Closing Price Forecast
JUL AUG SEP DEC MAR JUN SEP DEC DEC DEC DEC DEC DEC
14 14 14 14 15 15 15 15 16 17 18 19 20
SPX 1920 1850 1850 1850 1800 1800 1800 1780 1780 1780 2000 2500
1970 1980 1950 1950 2050 2150 2150 2150 2250 2250 2500 3000
NDX 3700 3700 3800
3900 3900 4000 4150 4150 4150 4150 4150 4150 4150 4800 4800
RUT 1180 1180 1180
1250 1250 1250 1400 1400 1400 1400
GOOGL 535 580
615 615
AMZN 325 320 320 330
345 339 360 360
AAPL 88 84 84
96 96 97 97 100 100 100
FB 59.8
72 72 72 85 85 85 93
MSFT 40.3 40.3
42 44 47 47 47 47 47 47 48 52 75
HPQ 33 34 35 35 35 36 37 37 38 38
34 37 39 39 42 42 42 47.8 54 54
WFC 50.8 50 51 51 51.3 51.6 52 52 53 55 57 63 69
53 53 55 55 56.4 56.4 56.4 56.4 58.3 60 66 80 150
BAC 15.05 15.6 15.6 16
16.5 17.4 17.4 18 18 18 20 20 20 20 22 24 39
MO 39.6 39.6
43 43 45 45 47 47 47 47 47 50 62 73 90

█This Is Tomorrow | Equity Markets Update
Page 11| 07-11 July 2014
█Table 10: Scenario Analysis Cycle SPX NDX RUT GOOGL AMZN AAPL FB MSFT HPQ WFC BAC MO
Grand <10 years
From 63.3 41 33.5 50.78 15.15 41.55
To 175 87 67 120 37 93
% 176.4 109.9 100 136 144.2 123.8
Primary > 1 year
From 1960 3736 1165 41 33.5 50.78 15.15 41.55
To 3000 6400 1800 60 54 80 25 57
% 53 71.3 54.5 44.8 61.1 57.5 65 37.0
Intermediate > 3 months
From 1960 3736 1165 90.4 63.3 41 33.5 50.78 15.15 41.55
To 2490 4800 1340 101.4 93 50 41.8 66 20 48
% 27 28.5 15.0 10.1 46.7 20.6 24.7 30 32 15.5
Secondary < 3 months
From 1960 3736 571 312.5 90.4 63.3 41 33.5 50.78 15.15 41.55
To 2130 4150 609 337 96.7 71.4 47 37.7 60 17.4 44.5
% 8.6 11.1 6.7 7.8 5.0 12.8 13.4 12.5 18.1 14.8 2.4
Minor 1-3 weeks
From 1960 3700 1165 41 31.6 50.8 15.35
To 2035 4000 1210 44 37.7 55 16.5
% 3.8◄ 8.1◄ 3.8◄ 7.3◄ 19.3◄ 8.2◄ 7.4◄
Correction 1-3 months
From 1960 4140 34.5
To 1850 3500 31.6
% -5.9◄ -15.5 -8.1
Correction 1-3 weeks
From 1985 34.5 16.5 43.1
To 1925 32.8 15.8 41.6
% -3.0◄ -5.1 -4.2 -3.4◄
Trading 1-8 weeks
From 1960 33.1 50.85 15.8 41.6
To 1980 34.1 53 16.4 43.1
% 1.0◄ 3.0◄ 4.2◄ 3.7◄ 3.6◄
Trading 1-8 weeks
From 52.05 41.9
To 53 43.1
% 2◄ 2.8◄
█This Is Tomorrow | Equity Markets Update
Page 12| 07-11 July 2014
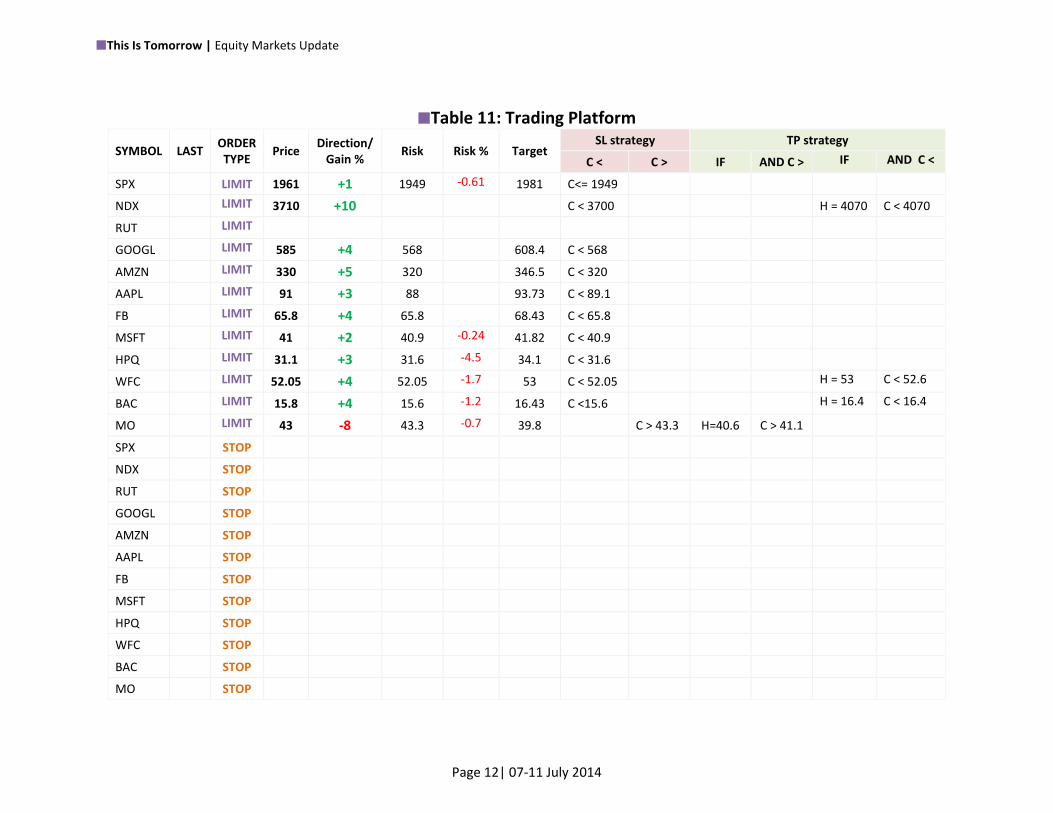
█Table 11: Trading Platform
SYMBOL LAST ORDER TYPE
Price Direction/
Gain % Risk Risk % Target
SL strategy TP strategy
C < C > IF AND C > IF AND C <
SPX LIMIT 1961 +1 1949 -0.61 1981 C<= 1949
NDX LIMIT 3710 +10 C < 3700 H = 4070 C < 4070
RUT LIMIT
GOOGL LIMIT 585 +4 568 608.4 C < 568
AMZN LIMIT 330 +5 320 346.5 C < 320
AAPL LIMIT 91 +3 88 93.73 C < 89.1
FB LIMIT 65.8 +4 65.8 68.43 C < 65.8
MSFT LIMIT 41 +2 40.9 -0.24 41.82 C < 40.9
HPQ LIMIT 31.1 +3 31.6 -4.5 34.1 C < 31.6
WFC LIMIT 52.05 +4 52.05 -1.7 53 C < 52.05 H = 53 C < 52.6
BAC LIMIT 15.8 +4 15.6 -1.2 16.43 C <15.6 H = 16.4 C < 16.4
MO LIMIT 43 -8 43.3 -0.7 39.8 C > 43.3 H=40.6 C > 41.1
SPX STOP
NDX STOP
RUT STOP
GOOGL STOP
AMZN STOP
AAPL STOP
FB STOP
MSFT STOP
HPQ STOP
WFC STOP
BAC STOP
MO STOP

█This Is Tomorrow | Equity Markets Update
Page 13| 07-11 July 2014
█Table 12: Pending Orders (more than 10% expected gain)
SYMBOL LAST ORDER TYPE
Direction %
SL strategy TP strategy
Price Risk % Risk Target C < C > IF AND C > IF AND C <
GOOGL LIMIT
AMZN LIMIT +10 325
AAPL LIMIT
FB LIMIT
MSFT LIMIT +10 40.3 40.3 0.0 44.33 C <40.3
H = 41.6 C < 41.6
HPQ LIMIT +15 31.7 31.6 -0.3 36.45 C < 31.6 H = 35 C < 35
WFC LIMIT +10 50.8 50.8 0.0 45.8 C < 50.8 H = 53 C < 53
BAC LIMIT
MO LIMIT +20 39.6 39.20 -1.02 47.1 C < 39.20
H = 43 C < 42.5
GOOGL STOP
AMZN STOP
AAPL STOP
FB STOP
MSFT STOP
HPQ STOP
WFC STOP -2
BAC STOP
MO STOP

█This Is Tomorrow | Equity Markets Update
Page 14| 07-11 July 2014
█SPX Forecast

█This Is Tomorrow | Equity Markets Update
Page 15| 07-11 July 2014
█Research Analyst: Rayan Massah █Email Contact: [email protected]
█ “This Is Tomorrow, Financial Markets Update” is a research based on new approach to quantitative analysis in which the goal is to develop better understanding of market movements and risk management. This is a practical solution and comprehensive picture of certain security with a view to improve investment performance. It offers a smart trading capability along with a disciplined approach.
This Is Tomorrow FINANCIAL MARKETS UPDATE