vuillemin, a., friese, a., alawi, m., henny, c...
TRANSCRIPT

Originally published as:
Vuillemin, A., Friese, A., Alawi, M., Henny, C., Nomosatryo, S., Wagner, D., Crowe, S. A., Kallmeyer, J. (2016):Geomicrobiological Features of Ferruginous Sediments from Lake Towuti, Indonesia. - Frontiers in Microbiology, 7.
DOI: http://doi.org/10.3389/fmicb.2016.01007

fmicb-07-01007 July 12, 2016 Time: 16:55 # 1
ORIGINAL RESEARCHpublished: 30 June 2016
doi: 10.3389/fmicb.2016.01007
Edited by:David Emerson,
Bigelow Laboratory for OceanSciences, USA
Reviewed by:John Senko,
The University of Akron, USAEric Roden,
University of Wisconsin-Madison,USA
*Correspondence:Jens Kallmeyer
†These authors have contributedequally to this work.
Specialty section:This article was submitted to
Microbiological Chemistryand Geomicrobiology,
a section of the journalFrontiers in Microbiology
Received: 03 March 2016Accepted: 13 June 2016Published: 30 June 2016
Citation:Vuillemin A, Friese A, Alawi M,
Henny C, Nomosatryo S, Wagner D,Crowe SA and Kallmeyer J (2016)
Geomicrobiological Featuresof Ferruginous Sediments from Lake
Towuti, Indonesia.Front. Microbiol. 7:1007.
doi: 10.3389/fmicb.2016.01007
Geomicrobiological Features ofFerruginous Sediments from LakeTowuti, IndonesiaAurèle Vuillemin1†, André Friese1†, Mashal Alawi1, Cynthia Henny2, Sulung Nomosatryo2,Dirk Wagner1, Sean A. Crowe3,4 and Jens Kallmeyer1*
1 GFZ German Research Centre for Geosciences, Helmholtz Centre Potsdam, Section 5.3 Geomicrobiology, Potsdam,Germany, 2 Research Center for Limnology, Indonesian Institute of Sciences, Cibinong, Indonesia, 3 Department ofMicrobiology and Immunology, University of British Columbia, Vancouver, BC, Canada, 4 Department of Earth, Ocean,and Atmospheric Sciences, University of British Columbia, Vancouver, BC, Canada
Lake Towuti is a tectonic basin, surrounded by ultramafic rocks. Lateritic soils formthrough weathering and deliver abundant iron (oxy)hydroxides but very little sulfate tothe lake and its sediment. To characterize the sediment biogeochemistry, we collectedcores at three sites with increasing water depth and decreasing bottom water oxygenconcentrations. Microbial cell densities were highest at the shallow site—a feature weattribute to the availability of labile organic matter (OM) and the higher abundance ofelectron acceptors due to oxic bottom water conditions. At the two other sites, OMdegradation and reduction processes below the oxycline led to partial electron acceptordepletion. Genetic information preserved in the sediment as extracellular DNA (eDNA)provided information on aerobic and anaerobic heterotrophs related to Nitrospirae,Chloroflexi, and Thermoplasmatales. These taxa apparently played a significant rolein the degradation of sinking OM. However, eDNA concentrations rapidly decreasedwith core depth. Despite very low sulfate concentrations, sulfate-reducing bacteriawere present and viable in sediments at all three sites, as confirmed by measurementof potential sulfate reduction rates. Microbial community fingerprinting supported thepresence of taxa related to Deltaproteobacteria and Firmicutes with demonstratedcapacity for iron and sulfate reduction. Concomitantly, sequences of Ruminococcaceae,Clostridiales, and Methanomicrobiales indicated potential for fermentative hydrogenand methane production. Such first insights into ferruginous sediments showed thatmicrobial populations perform successive metabolisms related to sulfur, iron, andmethane. In theory, iron reduction could reoxidize reduced sulfur compounds anddesorb OM from iron minerals to allow remineralization to methane. Overall, we foundthat biogeochemical processes in the sediments can be linked to redox differences inthe bottom waters of the three sites, like oxidant concentrations and the supply of labileOM. At the scale of the lacustrine record, our geomicrobiological study should providea means to link the extant subsurface biosphere to past environments.
Keywords: bottom waters, iron-rich sediment, sedimentary microbes, extracellular DNA, sulfate reduction, ironreduction, Lake Towuti
Frontiers in Microbiology | www.frontiersin.org 1 June 2016 | Volume 7 | Article 1007

fmicb-07-01007 July 12, 2016 Time: 16:55 # 2
Vuillemin et al. Geomicrobiology of Ferruginous Sediments
INTRODUCTION
Lake Towuti is a tropical 200 m deep tectonic lake seated inophiolitic rocks and surrounded by lateritic soils (Lehmusluotoet al., 1995; Russell and Bijaksana, 2012). It is part of the MaliliLakes system, comprising several interconnected lakes, includingLake Matano, the 10th deepest lake in the world (∼600 m).Its location on Sulawesi, Indonesia (Figure 1A) renders LakeTowuti’s sediments prime recorders of paleoclimatic changes inthe tropical Western Pacific warm pool (Russell et al., 2014). Thetropical climate and the lateritic weathering of the (ultra)maficcatchment of the Malili Lakes system (Figure 1B) cause a strongflux of iron to the lake. Surrounding lateritic soils are typicallyrelated to limonite types, with mostly goethite (α-FeOOH) andferrihydrite (Fe2O3·0.5H2O) transported to the basin (Croweet al., 2004; Golightly, 2010) as well as some hematite (Fe2O3)and detrital magnetite (Fe3O4). High iron fluxes to the lake mayexert a decisive constraint on bioavailable phosphorus in theepilimnion as it is scavenged by iron (hydr)oxides, likely drivingLake Towuti’s water column toward severely nutrient-limitedconditions. However, anoxia in stratified water column can leadto iron reduction and partial release of adsorbed P into the waterat the oxycline and below (Zegeye et al., 2012). Biogeochemicaland microbiological data gathered from nearby Lake Matanoreveal persistent anoxia in the deeper part of Lake Matano’s watercolumn (Crowe et al., 2008b; Jones et al., 2011) with organicmatter (OM) degradation through methanogenesis (Katsev et al.,2010; Crowe et al., 2011). Although Lake Towuti is anoxic atgreater depths as well, it is less deep and can mix periodically
(Haffner et al., 2001), presumably causing transient bottom wateroxygenation (Costa et al., 2015).
Once buried, ferruginous sediments likely support microbialcommunities, which can utilize a range of metalliferous substrates(Crowe et al., 2007). Although microbial activity decreasesdramatically below the water–sediment interface and withincreasing sediment depth (Kallmeyer et al., 2012), even thislow activity can have an appreciable impact on both sedimentcomposition and biogeochemical cycles over long-time periods(Berner, 1980; Freudenthal et al., 2001; Horsfield and Kieft,2007). In addition, iron minerals are also suspected to stronglyadsorb DNA (Cecchio et al., 2005; He et al., 2008). Upon celllysis, nucleic acids are released into the surrounding water andsediment and partitioned between sorption to reactive Fe surfaces(Pietramellara et al., 2008; Ceccherini et al., 2009) and uptakeor degradation via microbial metabolisms (Corinaldesi et al.,2007, 2008). Binding to metal oxides and colloids (Ceccheriniet al., 2009; Cleaves et al., 2011) could result in preservationand persistence of extracellular DNA (eDNA) in the lacustrinerecord (Pietramellara et al., 2008), providing a valuable archiveof genetic information (Corinaldesi et al., 2011). However,since metal-reducing bacteria have the capacity to solubilizestructural Fe and utilize adsorbed nutrients (Dong et al., 2003;Crowe et al., 2007), the sediment-bound eDNA should notbe totally recalcitrant (Baldwin, 2013 and references therein)and could serve as a labile organic substrate for sedimentarymicrobes (Corinaldesi et al., 2007). Its concentrations shouldthen depend on the complex interplay between these processes(Dell’Anno and Corinaldesi, 2004). Altogether, Lake Towuti
FIGURE 1 | Lake Towuti location and settings. (A) Map of Asia and Oceania displaying the location of Sulawesi Island. (B) Map of Sulawesi illustrating thegeological context of the Malili lake system (modified after Calvert and Hall, 2007). (C) Bathymetric map of Lake Matano and Lake Towuti (modified after Herderet al., 2006) displaying the three sites at which gravity cores were retrieved. Sites 1–3 correspond respectively to water depths of 153, 200, and 60 m, withoxygenation conditions at the water–sediment interface decreasing with water depth.
Frontiers in Microbiology | www.frontiersin.org 2 June 2016 | Volume 7 | Article 1007
fmicb-07-01007 July 12, 2016 Time: 16:55 # 3
Vuillemin et al. Geomicrobiology of Ferruginous Sediments
provides the opportunity to examine microbial populations in aniron-dominated and sulfate-poor ecosystem with dynamic redoxconditions and infer sorption and diagenetic processes arisingfrom subsurface microbial activity.
In order to investigate the relationship between biogeo-chemistry and microbial processes in these iron-rich anoxicsediments, we retrieved short sediment cores from Lake Towutiin 2013 and 2014 at three different depths (Figure 1C). Thesediment was analyzed for pore water geochemistry, total cellcounts and potential sulfate reduction rates (SRR) as well aseDNA and intracellular DNA (iDNA). These data provide abackground for geomicrobiological and biogeochemical analysisof the long (>100 m) drill cores that were retrieved duringthe ICDP (International Continental Scientific Drilling Program)Towuti drilling campaign in spring/summer 2015.
MATERIALS AND METHODS
Site DescriptionLake Towuti (2.5S, 121E) is the largest lake within the MaliliLake System, a chain of five tectonic lakes in Sulawesi, Indonesia(Lehmusluoto et al., 1995). It has a surface area of 560 km2
and a maximum water depth of 203 m (Haffner et al., 2001).Lake Towuti has a tropical humid climate, with an annualaverage air temperature of 26C and little variations in monthlytemperatures. Precipitation averages 2540 mm year−1, with nodistinct dry season (Aldrian and Susanto, 2003). The MahalonaRiver, which is the main inflow to the north, drains the extensivecatchments of Lakes Matano and Mahalona, while the LaronaRiver constitutes the only outflow to the west (Figure 1C). LakeTowuti is weakly conductive (210 µS cm−1) and circumneutral(pH ∼7.8) with a chemistry dominated by Mg and HCO3
−
(Lehmusluoto et al., 1995). Surface water temperatures arecommonly 28–29C, with weak thermal stratification of the watercolumn (i.e., 28–31C; Figure 2). Unlike upstream Lake Matano,which is permanently stratified and anoxic below 110 m waterdepth due to its great depth (600 m) and steep slopes (Croweet al., 2008b; Katsev et al., 2010), the entire water column ofLake Towuti is reported to mix at least occasionally (Haffneret al., 2001; Costa et al., 2015). Lake Towuti is usually oxygen-depleted below 130 m depth (Figure 2). As a result of sedimentaryP trapping due to large amounts of iron oxides derived fromlateritic soils being transported into the basin (Zegeye et al.,2012), productivity in the water column is expected to be limited(Bramburger et al., 2008).
Sample ProcessingWater temperature, oxygen concentration, light fluorescencereemitted by chlorophyll a (Leeuw et al., 2013), and lighttransmission profiles were collected on site using a submersibleconductivity-temperature-depth probe (CTD; Sea-Bird, SBE-19;Sea-Bird Electronics, Bellevue, WA, USA). Temperature profilesshowed that the water column of Lake Towuti is indeed weaklystratified while oxygen concentrations indicated that the water–sediment interface at the bottom of Lake Towuti is variablyoxygenated depending on water depth, with anoxia in waters
below 130 m (Figure 2). Several sediment cores (<0.5 m)estimated to cover ca. 1750 years of sedimentation history(Tamuntuan et al., 2015; Vogel et al., 2015) were retrieved atthree sites with increasing water depth (60, 153, and 200 m;Figure 1C) and different oxidation states in overlying waters(Figure 2), the intermediate site (153 m depth) was chosen tobe the main site of the ICDP Towuti Drilling Project. The coreswere sampled for pore water geochemistry, total cell counts,potential SRR and small subunit (16S) rRNA gene fingerprintinganalyses.
Pore water sampling was carried out on site under anoxicconditions, using a glove bag flushed with nitrogen gas inorder to prevent oxidation of the sediment. Using an asepticspatula, we sectioned the sediment cores in 0.5, 1, and 2 cmresolution for the upper 1, 1–10, and below 10 cm, respectively.Sediment samples were transferred into 50 mL centrifuge tubesand Rhizon Pore Water Samplers (Rhizon CSS, Rhizosphereresearch products, Dolderstraat, Netherlands) were inserted intothe sediment through a hole in the lid. For each depth interval,10 mL of pore water was collected in syringes, filtered through0.2 µm pore size cellulose acetate membrane syringe filters(Minisart, Sartorius Stedim Biotech) to remove all particles andmost microorganisms, transferred into 2 mL twist top vials andstored at room temperature for analysis in the home lab.
Samples for total cell counts were preserved in a 0.2 µmfiltered fixative solution of lake water amended with formalin(final concentration 2%). For each sample, 2 cm3 of sedimentwas retrieved with a sterile 3 mL cut-off syringe, placed in 15 mLcentrifuge tube filled with 8 mL of fixative solution and shakenfor complete homogenization. The tubes were sealed and storedat 4C until analysis in the home lab.
For nucleic acid analyses, entire short cores were sampledinside the nitrogen-filled glove bag. Using an aseptic spatula,we sectioned the cores into 1, 2, and 5 cm intervals for thefirst 10 cm, between 10 and 20 cm and below 20 cm depth,respectively. Samples were packed into gas-tight aluminum foilbags, flushed with nitrogen gas and heat-sealed to keep themunder anoxic conditions. Until DNA extraction in the homelab the samples were stored at room temperature. Since laketemperatures are ca. 28C throughout the year, we consideredthis storage appropriate to minimize cell lysis or potential shiftsin the microbial assemblage due to refrigeration. Freezing wasnot an option as it would cause cell lysis and therefore artificiallyincrease the eDNA pool.
Samples for potential SRR measurements were collected intriplicate using glass barrels with approximately 5 cm3 volume.The glass barrels were used to retrieve small sub-cores fromthe undisturbed inner part of the core, sealed with a butylrubber stopper and stored in sealed, nitrogen-flushed gas-tightaluminum foil bags at room temperature until incubation in thehome lab.
Laboratory ProceduresTotal Organic Carbon and Total NitrogenTotal nitrogen (TN) and total carbon (TC) were measured,using a Vario EL III CHNOS elemental analyzer (ElementarAnalysensysteme, Hanau, Germany). Each sample tin cup was
Frontiers in Microbiology | www.frontiersin.org 3 June 2016 | Volume 7 | Article 1007

fmicb-07-01007 July 12, 2016 Time: 16:55 # 4
Vuillemin et al. Geomicrobiology of Ferruginous Sediments
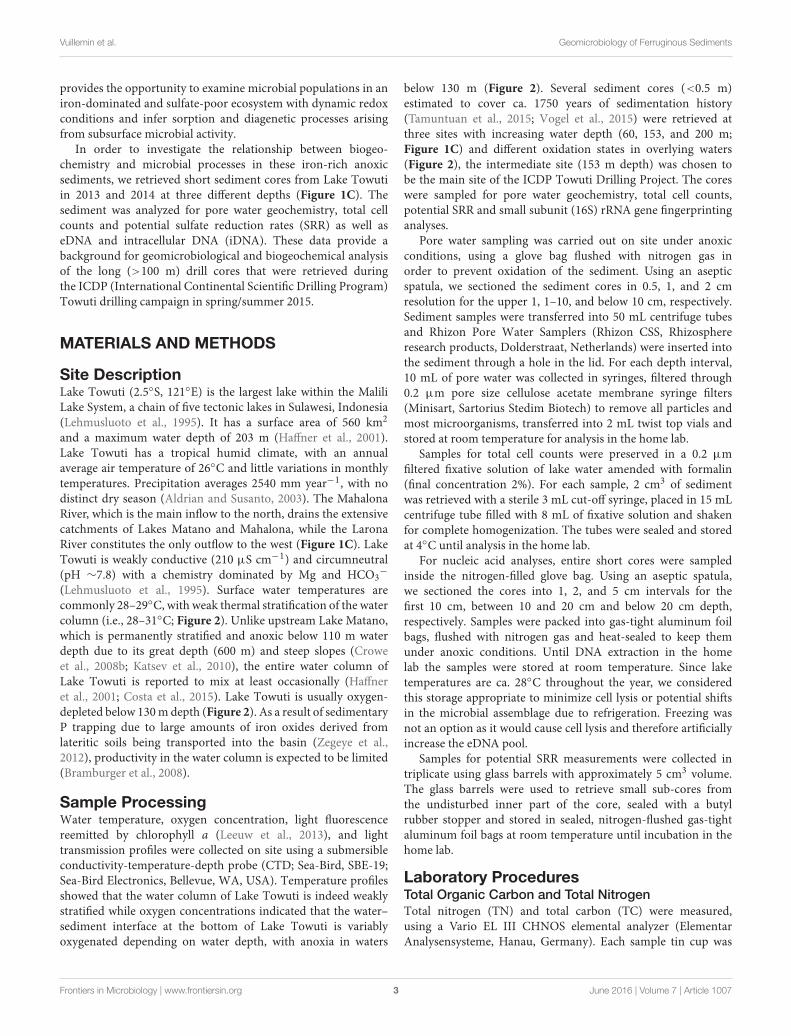
FIGURE 2 | Water column profiles. CTD casts for temperatures (C), oxygen concentrations (µM), chlorophyll a (µg × L−1), and light transmission [%] measuredin the water column of Lake Towuti at each of the three sites. Results show that Lake Towuti is weakly thermally stratified with an oxycline occurring in between 90and 130 m depth. Chlorophyll a peaks up at 50 m depth, while the presence of suspended particles can be inferred from the transmission decrease at 130 m depth.
loaded with 8–9 mg of freeze-dried, powdered sediment plus aspatula tip of tungsten oxide (WO3) to enhance the combustion,and then combusted at 1150C. Detection limit is below 0.1%. TCresults were used to calibrate volumes of sample required for totalorganic carbon (TOC) measurements. For TOC analysis, between30 and 70 mg of sediment powder were loaded into a crucible andburnt at 580C (sensitive carbon T for non-calcareous samples),850 and 1150C (intensive carbon T for calcareous samples)using a Vario MAX cube elemental macro analyzer (ElementarAnalysensysteme), equipped with the soliTIC option for thedetermination of the total organically bound and inorganiccarbon in the sample. Pretreatment of samples with HCl (5%),as is normally done for standard elemental analyzers (Byerset al., 1978) is not needed with this device. TOC and TN wererecalculated to the content of the whole sample to present resultsin dry mass %. TOC and TN values were then corrected by theirrespective atomic weights (i.e., 14/12) and used to calculate molarCorg/N ratios.
Iron SpectrophotometryDissolved iron concentrations in pore water were measured inthe field via spectrophotometry (Viollier et al., 2000). Directlyafter pore water retrieval, we aliquoted 1 mL of pore watersample to 1.6 mL Rotilabo single-use cells (Carl Roth, Karlsruhe,Germany) and stabilized dissolved Fe2+ by adding 100 µLof Ferrozine Iron Reagent (Sigma-Aldrich Chemie, Munich,Germany). To avoid oxidation during handling, all samplehandling was carried out inside the nitrogen-filled glove bag.Absorbance of the colored solution was measured at 562 nm with
a DR 3900 spectrophotometer (Hach, Düsseldorf, Germany).Detection limit of the method is 0.25 µM.
Ion ChromatographyCation and anion concentrations in pore water samples wereanalyzed using an ion chromatography (IC) system (SykamChromatographie, Fürstenfeldbruck, Germany). Injected samplevolume was 50 µL for both anions and cations. For cations,the IC system consisted of a S5300 sample injector (Sykam),a 4.6 × 125 mm Reprosil CAT column (Dr. Maisch HPLC,Ammerbuch-Entringen, Germany) and a S3115 conductivitydetector (Sykam). The eluent was 2.5 mM HNO3. Flow ratewas set at 1 mL min−1 and column oven temperature at 45C.A Cation Multi-Element Standard (Carl Roth) was diluted fivetimes for calibration. Based on a respective signal-to-noise (S/N)ratio of 3 and 10 (Schibler et al., 2007), the detection andquantification limits were calculated for each ion and are asfollows: Li+ (10.5 µM; 63.5 µM), Na+ (5.8 µM; 35 µM), K+(9.1 µM; 54.7 µM), Mg2+ (9.6 µM; 44.6 µM), Ca2+ (8.3 µM;38.5 µM) and NH4
+ (11.3 µM; 67.6 µM). Samples weremeasured in triplicates. During each run, nine standards weremeasured to check for drift. Reproducibility was always betterthan 5% for each ion. Concentrations are given as average valuesbased on triplicates, error bars are one standard deviation.
Anions were analyzed by suppressed IC using a SeQuantSAMS anion IC suppressor (EMD Millipore, Billerica,Massachusetts), a S5200 sample injector, a 3.0 × 250 mmlithocholic acid (LCA) 14 column and a S3115 conductivitydetector (all Sykam). The eluent was 5 mM Na2CO3 with20 mg L−1 4-hydroxybenzonitrile and 0.2% methanol. Flow
Frontiers in Microbiology | www.frontiersin.org 4 June 2016 | Volume 7 | Article 1007

fmicb-07-01007 July 12, 2016 Time: 16:55 # 5
Vuillemin et al. Geomicrobiology of Ferruginous Sediments
rate was set to 1 mL min−1 and column oven temperature to50C. A multi-element anion standard (Sykam) containingF− (263.2 µM), Cl− (564.1 µM), Br− (250.3 µM), NO2
−
(434.7 µM), PO43− (210.6 µM), NO3
− (806.4 µM), and SO42−
(520.5 µM) was diluted 10 times and measured every 10 samples.Respective minimum detection (S/N = 3) and quantificationlimits (S/N = 10) are as follows: F− (2.3 µM; 13.3 µM), Cl−(5.7 µM; 16.17 µM), NO2
− (4.1 µM; 14.14 µM), Br− (3 µM;10.2 µM), NO3
− (2.8 µM; 9.3 µM), PO43− (4.3 µM; 14.3 µM)
and SO42− (2 µM; 8.4 µM). The reproducibility was always
better than 3% for each ion.For ammonium (NH4
+) concentrations, the cation IC systemwas converted to a flow injection analysis system (Hall and Aller,1992) using a second pump and a dialysis cell (Skalar Products,Breda, Netherlands) instead of a separation column. First, NH4
+
is quantitatively converted into NH3 by injecting the sample intoan alkaline release solution containing 53.75 g L−1 citric acid and70 g L−1 sodium hydroxide. The NH3 diffuses through a Teflonmembrane into a capture solution made of 1 g L−1 boric acidand reacts to form ammonium borate. The associated changein conductivity is measured with a conductivity detector. Theflow rate for release and capture solution was 0.1 and 0.3 mLmin−1, respectively. For 100 µL injection volume, the minimumdetection (S/N = 3) and quantification limits (S/N = 10) are 5and 12.2 µM, respectively. Samples were measured in triplicates,the reproducibility was always below 10%.
Potential Sulfate Reduction Rate QuantificationPotential SRR quantification was performed according toJørgensen (1978) and Kallmeyer et al. (2004). In brief, 3 kBq of35SO4
2− radiotracer were injected into each sediment plug andincubated for 24 h in the dark close to situ temperature (ca.30C). Incubated sediments were transferred into 10 mL of 20%(w/v) zinc acetate and homogenized to precipitate free sulfideas zinc sulfide and stop microbial activity. The sample slurrywas centrifuged (4000 × g, 20 min) and 1 mL of supernatanttransferred into a 7 mL scintillation vial with 4 mL of Ultima GoldCocktail (Perkin Elmer, Waltham, MA, USA) for quantificationof unreacted 35SO4
2−. The remaining sediment was flushed outwith 20 mL dimethylformamide into a four-neck glass flask.Non-radioactive zinc sulfide was added as a carrier, followedby injection of 8 mL of 6 N HCl and 16 mL of 1 M CrCl2solution and stirring of the sample for 2 h under a constantflow of nitrogen gas. The released H2S was guided through atrap filled with 7 mL of 0.1 M of a buffered citric acid/Na-citratesolution to trap 35SO4
2−-containing aerosols. A second trap filledwith 7 mL of 5% (w/v) zinc acetate was used to precipitate H2Sas zinc sulfide. At the end of the distillation, the zinc acetatesolution was quantitatively transferred into a scintillation vialwith 8 mL of Ultima Gold Cocktail (Perkin Elmer). Radioactivityof radiolabeled sulfide was quantified using a Tri Carb 2500 TRliquid scintillation counter (Packard Instruments, Meriden, CT,USA).
Total Cell CountsCell counts were performed using a modification of theprocedure of Kallmeyer et al. (2008). In brief, 50 µL of
sediment slurry were mixed with 50 µL of detergent mix(i.e., 36.8 g L−1 Na2 EDTA × 2 H2O, 22.3 g L−1 Na-pyrophosphate × 10 H2O and 5 mL TWEEN 80), 50 µL ofmethanol and 350 µL of ultrapure H2O. This mixture wasvortexed for 30 min and sonicated 4× 1 s at 10% amplitude, usinga Sonopuls HD 3200 ultrasonic homogenizer equipped with amicrotip probe (Bandelin Electronic, Berlin, Germany). Fiftymicroliters of this solution were mixed with 5 µL of 1% hydrogenfluoride (HF) to dissolve fine mineral particles (Morono et al.,2009). After 10 minutes, the solution was filtered onto black0.2 µm polycarbonate track-etched membrane filters (Ø 25 mmCyclopore, Whatman International Ltd, Maidstone, UK). Cellswere stained with SYBR Green I (Molecular Probes Inc., Eugene,OR, USA), mounted and counted by epifluorescence microscopy(Leica DM2000 microscope, 100× magnification) with a bluefilter set (Leica Filter Cube F1/RH, excitation filter λ = 490/15to 560/25 nm, suppression filter at λ = 525/20 to 605/30 nm)and non-fluorescent immersion oil (Leica type F oil, ne
23= 1.518,
ve = 46).
Intracellular and Extracellular DNA Extraction andQuantificationThe procedure of Alawi et al. (2014) was applied to extracteDNA and iDNA separately from single sediment samples. Allextractions were performed in duplicates along with a negativecontrol. In brief, we mixed 1.0 g of fresh sediment with 0.2 gof acid washed polyvinylpolypyrrolidone (PVPP) and 2.5 mL of0.1 M sodium phosphate buffer (Na-P-buffer). The sample slurrywas centrifuged and the supernatant decanted off twice for a finalvolume of 7.5 mL. The supernatant was centrifuged for 45 minat 4700 × g to separate the iDNA (i.e., cell pellet, also containingviral particles) from the eDNA (i.e., supernatant). To avoid anyDNA adsorption onto the rubber, we used 10 mL syringes withoutrubber and filtered the supernatant through 0.2 µm celluloseacetate syringe filters (Sartorius, Göttingen, Germany) to removeany residual PVPP. The filtrate was mixed with three times itsvolume of 6 M guanidine hydrochloride. Sixty microliters of silicaparticles were added to adsorb eDNA (Boom et al., 1990). Aftercentrifugation, the supernatant was discarded and the eDNA-containing silica pellet rinsed in 150 µL of absolute ethanol andTris-EDTA in equal amounts and centrifuged twice for completedrying. To desorb the eDNA, 150 µL of Tris-EDTA buffer (1 mM)were added to the silica pellet, vortexed and centrifuged. The finaleDNA-containing supernatant was decanted off and stored. Thedesorption step was repeated to reach a final volume of 300 µL ofeDNA extract.
The iDNA extraction was performed using the MobioPowerSoil DNA extraction and isolation kit. The content of thePowerBead Tube with 60 µL of solution C1 and 500 µL of Na-P-buffer were added to a 15 mL centrifuge tube containing thecell pellet. The mixture was vortexed, sonicated for 6 min, heatedtwice for 5 min at 70C to lyse cells and centrifuged for 15 minat 4700 × g. The supernatant was processed in the same asthe eDNA fraction adding 50 µL of silica particles. Final iDNAelution volume was 100 µL.
DNA concentrations of all samples were measured using aQubit 2.0 fluorometer (Invitrogen, Carlsbad, CA, USA) with
Frontiers in Microbiology | www.frontiersin.org 5 June 2016 | Volume 7 | Article 1007

fmicb-07-01007 July 12, 2016 Time: 16:55 # 6
Vuillemin et al. Geomicrobiology of Ferruginous Sediments
10 µL of DNA template, 1 µL of reagent and 190 µL of buffersolution. The Qubit fluorescent dye targets DNA specifically,as compared to UV absorbance techniques which measure anycompound absorbing at 260 nm (i.e., DNA, RNA, protein, freenucleotide, and excess salt). Measurements were performed induplicates and the results are given as the average, error bars areone standard deviation.
Polymerase Chain ReactionDNA extracts were purified following the Mobio PowerSoilexperienced user protocol (www.mobio.com) and eluted in100 µL for eDNA and 65 µL for iDNA. Purified DNA extractswere diluted 20 and 10 times for eDNA and iDNA, respectively,and used as templates in polymerase chain reaction (PCR)amplifications. PCR was performed with 2.5 µL of DNA template,12.5 µL of MangoMix (Bioline, Life Science Company, London,UK), 0.5 µmol L−1 of each of the primers, 1 µL of MgCl2(25 mM) and 8 µL of Ultra-pure 18.2 MΩ PCR Water (Bioline).Negative controls were added to all PCR sets with 2.5 µLof molecular grade water as template. Amplifications of thebacterial small subunit (16S) rRNA gene were performed usingthe bacterial universal primer pair GC-Uni331F (5′-CGC CCGCCG CGC GCG GCG GGC GGG GCG GGG GCA CGG GGGGTC CTA CGG GAG GCA GCA GT-3′) and Eub797R (5′-GGACTA CCA GGG TAT CTA ATC CTG TT-3′; Brands et al., 2009).PCR cycles were run as follows: 30 cycles of 95C for 1 min, 57Cfor 1 min, and 72C for 1 min, with a final extension step of10 min at 72C. Amplifications of the archaeal 16S rRNA genewere performed using the archaeal universal primer pair GC-UA751F (5′-CGC CCG CCG CGC GCG GCG GGC GGG GCGGGG GCA CGG GGG GCC GAC GGT GAG RGR YGA A-3′)and UA1204R (5′-TTM GGG GCA TRC IKA CCT-3′; Baker andCowan, 2004). PCR cycles were run as follows: 35 cycles of 95Cfor 1.5 min, 60C for 1.5 min, and 72C for 1.5 min, with afinal extension step of 10 min at 72 C. For denaturing gradientgel electrophoresis (DGGE), 120 µL archaeal PCR product wereconcentrated to 25 µL using the Hi Yield PCR Clean-up andGel-Extraction Kit (SLG Südlabor, München, Germany).
Denaturing Gradient Gel Electrophoresis AnalysisEight percent polyacrylamide gels were prepared with a lineargradient from 35 to 60% of the denaturants urea and formamide.The 100% gradient solution was prepared using 1 mL ofTAE (50×), 21 g urea, 20 mL of formamide, 10 mL of 40%acrylamide/bis-acrylamide, and molecular grade water for a finalvolume of 50 mL. The 0% gradient solution was prepared withouturea or formamide. Gels were prepared with 17.5 mL of eachsolution, plus 50 µL ammonium persulfate solution (APS) and50 µL tetramethylethylenediamine (TEMED) for polymerization.Twenty microliters of PCR product and 20 µL of blue stainwere loaded for each sample. Ten microliters of standard (i.e., 13previously selected bands) with 10 µL of blue stain were loadedin the center and on each side of the gels to reference bandpositions. Electrophoresis was run at 100 V for 16 h in 1× TAEbuffer at 60C. Gels were stained for 30 min in 2.5 µL of SYBRGold nucleic acid gel stain (10,000 time concentrates, Invitrogen)diluted in 25 mL 1× TAE buffer. Gels were photographed
under UV light. The Strati-Signal software (Vuillemin et al.,2011; Ndiaye et al., 2012) was then used to analyze DGGE gelpictures. Band numbers, intensity values and pattern lengths wereextracted (Supplementary Material) to calculate Shannon indices.The Shannon index is calculated as follows: Shannon = −6(ni/N) × log (ni/N), where ni is the height of each peak and Nthe sum of all peak heights extracted from red green blue (RGB)intensity curves of each sample (Boon et al., 2001; Fromin et al.,2002).
Band Sequencing and Phylogenetic AnalysisIn total, 131 bands were excised from DGGE gels under UV light.Gel bands were eluted in 20 µL MΩ PCR Water (Bioline) andused as templates in PCR mixtures as described above withoutGC-clamp on the forward primers. PCR cycles were run asfollows: three cycles of 95C for 1 min, 57C for 1 min, and 72Cfor 1 min followed by 27 cycles of 95C for 30 s, 57C for 30 s,and 72C for 30 s with a final extension step of 10 min at 72C forBacteria, and 35 cycles of 95C for 50 s, 58C for 50 s, and 72Cfor 50 s with a final extension step of 10 min at 72C for Archaea.PCR products were run on 1% agarose gels and targeted DNAbands excised under UV light to remove residual dimers. DNAbands were purified using the Hi Yield PCR Gel-Extraction Kit(SLG Südlabor) with final elution in 25 µL of Ultra-pure 18.2 MΩ
PCR Water (Bioline). DNA concentrations were checked ona NanoPhotometer P330 (Implen, München, Germany) andDNA extracts sent to GATC Biotech AG (European CustomSequencing Centre, Köln, Germany) for Sanger sequencing usingprimers Eub797R and UA751F. Sequences were aligned onSequencher v. 5.1 (Gene Codes Corporation, Ann Arbor, MI,USA) and primers selectively cut off. Chimeras were detectedusing the online program Bellerophon (Huber et al., 2004). AllDGGE sequences have been deposited in the GenBank databaseunder accession numbers KR091588 to KR091718.
The SINA online v.1.2.11 (Pruesse et al., 2007, 2012) wasused to align, search and classify our sequences. Closestmatch sequences were downloaded from the SILVA database astaxonomic references, uploaded on the ARB platform and plottedinto phylogenetic trees using the maximum-likelihood methodwith the RAxML algorithm with advanced bootstrap refinementfrom 100 replicates (Ludwig et al., 2004). DGGE fragmentsequences were added to the RAxML tree using the bacteriapositional variability by parsimony algorithm. Two separatephylogenetic trees were plotted for Bacteria and Archaea withiDNA and eDNA sequences together (Supplementary Material).Sequences from representative taxa were then selected to buildone single tree based on 15 eDNA and 15 iDNA fragments(Figure 4).
RESULTS
Water ColumnCTD water column profiles (Figure 2) obtained at each siteprovided evidence for weak thermal stratification occurringaround 25 m water depth with a corresponding drop of 1.5C.Below this depth, water column temperatures did not vary
Frontiers in Microbiology | www.frontiersin.org 6 June 2016 | Volume 7 | Article 1007

fmicb-07-01007 July 12, 2016 Time: 16:55 # 7
Vuillemin et al. Geomicrobiology of Ferruginous Sediments
significantly, with less than 1C decrease in the subsequent 175 m.Oxygen profiles indicated that the water column is fully oxic(250 µM) down to 60 m depth where oxygen concentrationdeclines gradually over the following 70 m, the deepest part ofthe water column is anoxic. Thus, the water–sediment interfacecould be considered oxic at the shallow site (i.e., 60 m depth)and anoxic at the intermediate (i.e., 153 m depth) and deepsites (i.e., 200 m depth). Chlorophyll a fluorescence profilesshowed that phytoplankton biomass is highest at 50 m waterdepth. Transmission profiles revealed negative peaks around 50and 130 m depth indicating higher concentrations of suspendedparticles in these depth intervals.
Pore Water GeochemistrySodium (Na+), calcium (Ca2+), and magnesium (Mg2+) werethe only cations we were able to detect in the pore water byIC, only Ca2+ and Mg2+ were quantified. Ca2+ and Mg2+
profiles (Figure 3A) did not show much variability with depth,concentrations were around 25 µM and 130 µM for Ca2+ andMg2+, respectively. The intermediate site displays one singlesignificant peak at about 20 cm depth. At the deep site, Mg2+
values tend to increase slightly with depth to values around150 µM. NH4
+ concentrations in the uppermost pore watersample were similar at all three sites (ca. 22 µM) and showeda general increase with depth, the gradient became increasinglysteeper from the shallow to the deep site (Figure 3A), leadingto concentrations of 40, 60, and 130 µM at the bottom ends ofthe cores, respectively. Similarly, dissolved Fe2+ concentrationsincreased from the shallow to the deep site and with sedimentdepth, with values ranging from 0, 5, and 35 µM in surfacesediment to 10, 20, and 50 µM at the bottom of the core,respectively. The Fe2+ profile of the deep site exhibits a slightexcursion to lower values in the upper 10 cm of sediment, belowthis depth values increase constantly like at the other sites.
Chloride (Cl−) and sulfate (SO42−) were the main inorganic
anions in the pore water. Nitrate, nitrite, and phosphate werebelow detection limit. Profiles for Cl− (Figure 3A) displayedconstant concentrations around 40 to 20 µM with little differencebetween sites although with a general decrease with increasingwater depth. Some minor peaks up to 60 µM could be observed inthe upper 15 cm at all sites. SO4
2− concentrations were mainly inthe single µM range and often close to the quantification (5 µM)and detection (2 µM) limits. At the shallow site, concentrationswere generally higher, with values about 20 µM in the uppermost4 cm, but decreasing gradually to values between 2 and 5 µMat the base of the core. At the intermediate site, sulfate wasdetectable at all depths but the measurements were close to orbelow the quantification limit, except for two peaks of 40 and15 µM at 0.5 and 22.5 cm depth, respectively. At the deep site,all SO4
2− concentrations were around the detection limit.Respective ion concentrations measured directly above the
water–sediment interface in cores from the shallow, intermediate,and deep site are given in Table 1.
Potential Sulfate Reduction RatesPotential rates of sulfate reduction and their depth distribution(Figure 3A) differed significantly between sites. At the shallow
site, we found maximum rates of ca. 7 nmol cm−3 day−1
within the upper 10 cm of sediment. Below this depth, SRRdecreased sharply to ca. 2 nmol cm−3 day−1. The intermediatesite displayed two peaks of elevated SRR of ca. 11 and8 nmol cm−3 day−1 at 2 and 22 cm depth which correspondsto anomalous peaks in sulfate concentrations; at all otherdepths, rates were minimal <2 nmol cm−3 day−1. At the deepsite, rates were generally lower than at the other sites (1 tomaximum 3 nmol cm−3 day−1). Altogether, the measurementsdemonstrated that viable sulfate-reducing bacteria (SRB) werepresent at all three sites, but were more active at the shallowsite. The results also showed a general decrease in SRR withincreasing water depth due to decreasing bottom water SO4
2−
concentrations and hence lower diffusive fluxes of sulfate intothe sediment. Because SO4
2− concentrations were in many casesbarely detectable (>2 µM) and well below the lower limit ofquantification (5 µM), the absolute values of the potential SRRhave to be carefully considered. We also acknowledge that ourmeasured rates may differ from those on-site due to somebiologically unavailable background SO4
2− (Roden and Tuttle,1993; Roden and Wetzel, 1996). However, the data clearly showthat the sulfate pool is turned over within days, implying stronginternal recycling. In the absence of available SO4
2− in the porewater, the necessity to turn to reduced sulfur compounds alsoimplies that SO4
2− reduction processes are slowed down.
Organic MatterTOC values (Figure 3B) increased from the shallow to the deepsite. The shallow site had TOC contents around 2% in theupper few centimeters with a subsequent increase by about 1%and constant values over the rest of the core. The intermediatesite exhibited oscillating values between 4.5 and 3.5% in theuppermost 10 cm, continuing with lower and more constantvalues of ca. 3–3.5% down to the base of the record. At thedeep site, TOC concentrations decreased gradually from 4.5%in the uppermost section to 3% at the base of the core. Inparallel to these results, TC peaks around 5 cm depth at boththe intermediate and deep site indicated the likely presence ofauthigenic carbonates (Figure 3B).
The Corg/N ratio profiles resembled those of TOC, with valuesgenerally increasing from the shallow site to the deep site. Overall,values increased gradually from 8.5 to 12.5 at the shallow siteand varied in between 10.5 and 12.5 at the intermediate site.At the deep site, the ratios ranged from 10.5 to 15.5 in theuppermost samples and gradually decrease to 11.5 in the lowerpart. Altogether, TOC and Corg/N ratio profiles appear to reflectthe different bottom water oxygenation conditions at the threesites as values generally increase with water depth.
Total Cell CountsTotal cell counts (Figure 3B) were much higher at the shallow sitethan at the other sites. At all three sites, numbers declined steeplyin the upper 5 cm, followed by a more gradual decrease overthe remainder of the core. Compared to the other two sites, cellconcentrations at the shallow site were up to 31 times higher inthe 0–1 cm depth interval (i.e., log10 = 9.6, 8.4, and 8.1) and still
Frontiers in Microbiology | www.frontiersin.org 7 June 2016 | Volume 7 | Article 1007

fmicb-07-01007 July 12, 2016 Time: 16:55 # 8
Vuillemin et al. Geomicrobiology of Ferruginous Sediments
FIGURE 3 | Multiple profiles established on short sediment cores. For consistency, results for the three different sites are displayed vertically according to theirwater depths. (A) From left to right: Total organic carbon and total carbon (wt%); molar Corg/N ratio measured in bulk sediments; calcium, magnesium, chloride, andsulfate concentrations (µM) measured in the pore water; potential sulfate reduction rates (nmol × cm−3 day−1) obtained after 24 h incubation experiments;ammonium concentrations (µM) in the pore water measured by cell dialysis. (B) From left to right: Cell counts in log scale (log10 cells × cm−3); concentrations ofextracellular DNA (gray dots) and total DNA (black squares) (µg × g wet sediment−1), with distance between the two curves corresponding to intracellular DNAconcentrations; Shannon index established from bacterial and archaeal DGGE gel features, with eDNA (gray dots) and iDNA (black squares) displayed separately;range-weighted richness index for bacterial DNA (square) and archaeal DNA (dots), with eDNA (gray) and iDNA (black) displayed separately.
Frontiers in Microbiology | www.frontiersin.org 8 June 2016 | Volume 7 | Article 1007

fmicb-07-01007 July 12, 2016 Time: 16:55 # 9
Vuillemin et al. Geomicrobiology of Ferruginous Sediments
TABLE 1 | Bottom water geochemistry of Lake Towuti.
Geochemistry of bottom waters (µM)
Site Depth (m) Ca2+ Mg2+ Cl− SO42− NH4
+
Shallow 60 28.6 ± 6.1 145.4 ± 8.9 37.3 ± 0.9 20.2 ± 0.7 <6
Intermediate 153 25.3 ± 0.1 134.8 ± 7.0 38.4 ± 1.9 11.9 ± 0.4 20.3 ± 0.8
Deep 200 23.8 ± 2.6 148.7 ± 4.3 20.5 ± 0.5 11.8 ± 0.2 13.8 ± 0.2
Water samples were retrieved at the water–sediment interface in cores from the shallow, intermediate and deep site and measured by ion chromatography. Values aredisplayed in [µM] followed by one standard deviation.
up to three times higher at the base of the cores (i.e., log10 = 8.2,7.8, and 7.7). The profiles from the intermediate and deep sitewere very similar, although values were generally lower at thedeep site.
Intracellular and Extracellular DNAConcentrationsConcentrations of eDNA (Figure 3B) were very similar at allthree sites, with concentrations around 0.6 µg g−1 in theuppermost layer, decreasing to ca. 0.2 µg g−1 at 10 cm depth anda final decline to minimum values (<0.1 µg g−1) at the bottomof the core. Total DNA (tDNA = eDNA + iDNA) concentrationprofiles mimic those of eDNA, with concentrations of 1.6, 1.2,1.2 µg g−1 in the surface layer and 0.4, 0.2, and 0.3 µg g−1 inthe bottom layer for the shallow, intermediate, and deep site,respectively. Results showed that concentrations of eDNA andiDNA display similar trends and that iDNA was the dominantfraction in total DNA.
In order to assess the recovery rate of cells and respectiveamount of extracted iDNA with this procedure, iDNAconcentrations were divided by the corresponding cell densitiesof each sample and results reported in femtogram (fg) ofDNA per cell. Averaged values per site were 1.0, 3.7, and6.5 fg DNA cell−1 at the shallow, intermediate and deep site,respectively (data not shown). Published values range from1.6 to 8.9 fg DNA cell−1 (Bakken and Olsen, 1989; Buttonand Robertson, 2001). In nearby Lake Matano, phosphoruslimitation resulted in reduced RNA concentrations per cell (Yaoet al., 2016). Similarly in Lake Towuti, the variable sorptioncapacity of the sediment could influence P availability and DNAconcentration per cell. Concerning the presence of viral DNA(Torti et al., 2015), protein capsids are not quantified as DNAwith a Qubit 2.0 fluorometer. Moreover, sediment particlesalso strongly adsorb virions and multiple studies of freshwatersediments showed a low impact of viruses on bacterial mortality(Filippini and Middelboe, 2007 and references therein). Weacknowledge that viral DNA should be found in our extracts,albeit as a minor fraction as we did not use a specifically adaptedextraction protocol necessary to lyse the capsids (Danovaro andMiddelboe, 2010).
Bacterial and Archaeal FingerprintingDGGE provided an assessment of the relative preservation ofeDNA at the three sites along with a first fingerprinting ofbacterial and archaeal diversity associated with both eDNA
and iDNA fractions. In general, eDNA gel features faded withincreasing sample depth and led to the transformation of clearbands into smears and further disappearance (SupplementaryMaterial). At all three sites, Shannon indices of bacterialeDNA (Figure 3B) decreased almost linearly with depth,whereas those of bacterial iDNA display different trendsat each site. Values increased within the upper part ofthe core before gradually decreasing at the shallow site,decreased linearly at the intermediate site and sharply droppedin the lower half of the core at the deep site. Valuesof archaeal eDNA (Figure 3B) rapidly declined in theupper 20 cm and stayed minimal below that depth at theshallow site, showed high scatter and little decrease at theintermediate site and dropped at ca. 20 cm followed byconstant values at the deep site. Shannon values of archaealiDNA were similar for each site, with fluctuations in uppersediments and gradual decrease in lower sediments, althoughthe intermediate site generally displayed lower values. Richnessindices (Supplementary Material) clearly demonstrated thepredominance of Bacteria over Archaea.
Phylogeny of Sequenced DGGEFragmentsSequences of eDNA were mainly representative of aerobicand anaerobic heterotrophs, with taxa identified asActinobacteria, Nitrospirae, Chloroflexi, and Thermoplasmatales(Supplementary Material). Taking into account the localconditions of the sediment, these sequences were likely relatedto microorganisms evolving in the water column and preservedas eDNA in the sediment. However, Actinobacteria are knownubiquists in soils, aquatic habitats and sediments and could alsoreflect a terrestrial origin arising from eroded soils transportedto the lake. We considered eDNA sequences clustering amongiDNA-related taxa to derive from cell lysis in the sediment(e.g., Betaproteobacteria, Deltaproteobacteria, Firmicutes).Additionally, planktonic species in the bottom waters couldbecome benthic at the water–sediment interface before beingburied and could, thus, also be preserved as iDNA.
Taxa identified from iDNA fragments were mostlyrelated to Beta- and Deltaproteobacteria, Firmicutes, andMethanomicrobiales (Figure 4 and Supplementary Material).Sequences of Betaproteobacteria plotted among Rhodocyclaceaewith closest cultivated taxa represented by Thiobacillus andDenitratisoma. Sequences of Deltaproteobacteria were closestto Desulfovibrio, Desulfuromonas, Deferrisoma, Geobacter, and
Frontiers in Microbiology | www.frontiersin.org 9 June 2016 | Volume 7 | Article 1007

fmicb-07-01007 July 12, 2016 Time: 16:55 # 10
Vuillemin et al. Geomicrobiology of Ferruginous Sediments
FIGURE 4 | Phylogenetic tree established for intracellular and extracellular DNA fragments obtained from DGGE gels. Among 131 sequences, 30 wereselected as representative taxa to build a maximum-likelihood RAxML tree. Extracellular DNA sequences (green) are indicative of aerobic and anaerobicheterotrophs, among which some can be assigned to the lake oxic (e.g., Nitrospirae, Actinobacteria) and anoxic water column (e.g., Chloroflexi, Firmicutes).Intracellular DNA sequences (red) are closely affiliated with known sulfate and iron reducers (e.g., Deltaproteobacteria, Firmicutes). Concomitant presence of taxarelated to Clostridiales and Methanomicrobiales indicates a potential for heterotrophic production of fermentative hydrogen and methane. Boldface types signifydatabase references with sequence accession numbers in parentheses.
candidate order Sva0485. Together with the potential SRR, thesesequences provided evidence for the presence of sedimentarySRB along with microorganisms capable of dissimilatorysulfur and ferric iron reduction at all three sites. Sequences ofFirmicutes related to Thermincola supported the presence ofiron-reducing bacteria. Finally, taxa among Ruminococcaceaeand Clostridiales were representative of heterotrophic anaerobes,whose concomitance with Methanomicrobiales indicatedthat fermentative hydrogen can be produced via ferredoxinreduction and used during methanogenesis (Hallenbeck,2009).
DISCUSSION
Water Column Conditions and OrganicMatter SedimentationVarying oxygenation levels in the water column, especially atthe water–sediment interface are expected to lead to differencesin production, degradation, and burial of OM in sediments atthe three sites (Katsev and Crowe, 2015 and references therein).Chlorophyll a concentrations are highest around 50 m waterdepth, while transmission profiles indicate suspended matter
Frontiers in Microbiology | www.frontiersin.org 10 June 2016 | Volume 7 | Article 1007

fmicb-07-01007 July 12, 2016 Time: 16:55 # 11
Vuillemin et al. Geomicrobiology of Ferruginous Sediments
close to the oxycline at 130 m water depth (Figure 2), pointingtoward a redox interface similar to the one observed in the watercolumn of nearby Lake Matano, although less steep (Crowe et al.,2008a). At the intermediate site, a long-term shift in the oxyclinewas recorded during the mid-Holocene in the form of elevatedferric iron and siderite (i.e., FeCO3) concentrations (Costa et al.,2015). Due to the low sedimentation rates (i.e., 2 mm year−1;Vogel et al., 2015), redox fluctuations would be hard to detect atour sampling resolution.
TOC contents indicate increased OM burial from the shallowto the deep site (Figure 3A), associated with a shift towardmore recalcitrant OM composition (i.e., higher Corg/N ratio).Although degradation processes in an anoxic water column aregenerally slower (Katsev and Crowe, 2015), iron reduction belowthe oxycline can foster desorption of labile OM and microbialuptake of nitrogen and phosphorus (Zegeye et al., 2012),thereby increasing carbon burial linked to bacterial production.Remineralization of organic compounds leads to the productionof NH4
+, which can be oxidized or accumulate, dependingon the presence of suitable reactants in the water column.NH4
+ concentrations in bottom waters (Table 1) indicate thatdegradation of sinking particulate OM is indeed continuous inthe water column, leading to the accumulation of less reactiveorganic material at the deep site (Amon and Benner, 1996). Thisinterpretation is also consistent with the diverse taxa identifiedfrom our eDNA sequences, which corresponded to both aerobicand anaerobic heterotrophs, namely Actinobacteria, Nitrospirae,Chloroflexi, and Thermoplasmatales, and secondarily Alpha- andGammaproteobacteria (Figure 4; and Supplementary Material).However, final discrimination of eDNA sources cannot beachieved. For example, Actinobacteria could originate fromsoils eroded from the catchment, transported to the lake andpreserved within refractory OM. Although we did not detectany photoautotrophs, certain elements can still be assignedto planktonic assemblages coming from the epilimnion (e.g.,Nitrospirales) and hypolimnion (e.g., Anaerolineales). Ourinterpretation is that labile OM from primary producers israpidly degraded by heterotrophic species that are active inthe water column, resulting in the preferential preservationof heterotrophic over phototrophic sequences in the eDNA(Vuillemin et al., 2016). This is also consistent with thetransmission decrease at the oxycline (i.e., 130 m), which weinterpret as iron reduction leading to desorption of phosphoruscompounds and thereby promoting anaerobic heterotrophicprocesses. Data from Lake Matano show that dissolution ofparticulate Fe3+ occurs at and below the pycnocline along withthe liberation of phosphorus and concomitant production ofmethane and ammonia (Crowe et al., 2008b; Katsev et al., 2010).
Pore Water GeochemistryHigh Ca2+ and Mg2+ concentrations in pore waters (Figure 3A)likely reflect continued weathering of mafic/ultramafic mineralsderived from the catchment of the Malili Lake system(Kadarusman et al., 2004). Although fairly constant, variationsin these profiles could possibly imply precipitation and/ordissolution of authigenic carbonates (i.e., Ca–Mg–FeCO3) withinthe sediment. At the intermediate and deep site, the presence of
authigenic carbonates can be inferred from peaks in TC profiles.The diagenetic sequence known for freshwater sediments inrelation to pore water geochemistry (i.e., Ca–Mg siderite, calcite,ankerite, dolomite) suggests the formation of early diageneticsiderite (Berner, 1980; Matsumoto and Iijima, 1981), which isconsistent with the decline in dissolved Fe2+ concentrations atthe deep site. Lake Matano and Lake Towuti are both iron-rich but also extremely low-sulfate environments, far lower thanmost aquatic environments studied to date (Crowe et al., 2014).Moreover, microbial reduction processes in the water columnlikely take place at or directly below the oxycline, as shown forSO4
2− concentrations in Lake Matano, which decrease drasticallyalong with a rapid increase of dissolved Fe2+ (Crowe et al.,2008a). In Lake Towuti, SO4
2− concentrations measured at thewater/sediment interface decreased from the shallow to the deepsite (Table 1), supporting our assumption that sulfate reductionalready takes place in the anoxic bottom water of the intermediateand deep site. As a result pore water SO4
2− concentrations inthe uppermost sediment samples decreased toward the deep siteand were rapidly depleted with sediment depth at all sites. Porewater Fe2+ concentrations show the opposite trend, increasingfrom the shallow to the deep site and with core depth, showing anincreasingly steeper gradient between sites with maximum valuesaround 45 µM (Figure 3A). The production, consumption, anddynamics of NH4
+ in bottom waters seemed to differ betweenthe three sites as indicated by their respective concentrations (i.e.,<6, 20, and 13 µM) and the very similar NH4
+ concentrationsin the uppermost sediment sample at all three sites (ca. 25 µM).The NH4
+ profile of the deep site is indeed the only one thatclearly indicates NH4
+ diffusion out of the sediment into thebottom waters. Whereas nitrification could take place in the oxicbottom waters of the shallow site, the potential accumulation ofNH4
+ in the anoxic bottom waters of the two other sites remainsunclear.
Sediment Microorganisms andExtracellular DNA RemineralizationSeveral studies showed that bacterial abundance and diversityin lake sediments correlate with environmental parameters suchas salinity, pH, OM content, and sediment depth (Nam et al.,2008; Zeng et al., 2009; Borsodi et al., 2012), and can also reflectclimatic variations due to forcing of conditions during sedimentdeposition (Dong et al., 2010; Vuillemin et al., 2013, 2014). LakeTowuti’s surface sediments are characterized by comparativelyhigh cell densities that decrease from the shallow to the deepsite. At all sites, cell counts decrease by one order of magnitudeover the uppermost 5 cm below the water–sediment interface andremain more or less constant over the rest of the core (Figure 3B).The corresponding iDNA concentrations follow a similar trend,whereas Shannon indices show more variability between the threesites. Potential SRR measurements with radiotracer (Figure 3A)further demonstrate that SRB are present and viable at allsites, but are more active at the shallow site, showing somecorrespondence to Shannon indices. We interpret these data asthe positive response of bacterial populations to geochemicalconditions corresponding with higher bottom water SO4
2−
Frontiers in Microbiology | www.frontiersin.org 11 June 2016 | Volume 7 | Article 1007

fmicb-07-01007 July 12, 2016 Time: 16:55 # 12
Vuillemin et al. Geomicrobiology of Ferruginous Sediments
concentrations and increased burial of labile OM and reactiveferric iron into the sediment.
With regard to recording of past lake conditions by eDNA,water temperatures of Lake Towuti are approximately 28Cthroughout the year, which is rather unfavorable for eDNApreservation (Lindahl, 1993; Renshaw et al., 2015). Althoughsorption capacities in the sediment were expected to varybetween the three sampling sites, eDNA distribution patternsare similar, displaying a rapid decrease in the uppermost 5 cmfollowed by constant but low concentrations over the rest of thecores (Figure 3B). The decline of eDNA Shannon indices alsoindicates a gradual loss of genetic information associated withthe degradation and shortening of eDNA sequences over time(Corinaldesi et al., 2008). Such decrease as a function of sedimentdepth can be attributed to a combination of sediment sorptioncapacity, microbial uptake, and degradation as well as rates ofcell lysis. We argue that the observed lower eDNA concentrationsresult from an overall decrease in metabolic activity and cell lysisrate, along with the immediate degradation of the free eDNAfraction resulting in diminishing Shannon values. In the long-term, eDNA preservation would greatly depend on metabolicturnover rates and its potential stabilization by ferric mineralphases (Glasauer et al., 2003; Pinchuk et al., 2008). In this context,preliminary results indicate that reactive ferric iron persists downto 15 m sediment depth at concentrations up to nearly 2 wt%(Simister et al., 2016).
Phylogeny of Intracellular DNA andPresumed Metabolic ProcessesMicrobial fingerprinting (Figure 4; and Supplementary Material)revealed the presence of microorganisms related to taxacommonly known for iron and sulfate reduction as well asmethanogenesis, indicating that the autochthonous microbialcommunities have the metabolic capacity for these processes.Among Proteobacteria, certain taxa were affiliated withDenitratisoma (Fahrbach et al., 2006), Thiobacillus (Schedeland Trüper, 1980; Haaijer et al., 2006), and Acidiferrobacter(Hallberg et al., 2011), indicating putative capacity for bothlithotrophic and organotrophic processes driven through useof reduced sulfur and iron as electron donors. However, theseBeta- and Gammaproteobacteria typically exhibit metabolicversatility with the capacity to shift between different modes offacultative metabolisms (Masters and Madigan, 1983; Hiraishiand Hoshino, 1984; Ferguson et al., 1987), making it impossibleto assess metabolism from taxonomic information alone. Thiscould also indicate that these taxa are planktonic in the bottomwaters, then benthic at the water–sediment interface until burial.
Interestingly, sequences of Deltaproteobacteria at the shallowand intermediate site included taxa assigned to the candidateorder Sva0485 and Desulfovibrio, which are often reportedas part of SRB consortia (Kleindienst et al., 2014; Bar-Oret al., 2015). These sequences were correspondingly identified insediments with the highest measured SRR. In addition, detectionof Desulfuromonas M20-Pitesti, Deferrisoma and Geobacter-related sequences may indicate that the metabolic capacity toreduce sulfur and iron is evenly distributed across all three
sites (Slobodkina et al., 2012; Greene, 2014). DGGE fragmentsaffiliated with Thermincola also point at a metabolic potential foriron reduction (Zavarzina et al., 2007). In addition, taxa relatedto Ruminococcaceae and Clostridiales were representative ofheterotrophic anaerobes that can produce fermentative hydrogenvia ferredoxin (i.e., Fe2S2 protein cluster) reduction (Hallenbeck,2009). Their concomitance with Methanomicrobiales suggeststhat H2/CO2 reduction is a likely pathway for methaneproduction (Thauer et al., 2008; Kaster et al., 2009), althoughformate and alcohols could also be used (Ohren, 2014).
Together, our measurements of potential sulfate reductionand our findings of microbial taxa commonly involved inmicrobial sulfate and iron reduction suggest that ferruginoussediments support microorganisms that degrade OM via sulfatereduction, in spite of the extremely low sulfate concentrations,in collaboration with diverse iron-reducing bacteria, fermenters,and methanogens. Seemingly, such complementary metabolismsimply desorption of OM following iron reduction and itsremineralization to methane. The low pore water SO4
2−
concentrations (single µM) and the relatively high potentialSRR (single to tens of nmol cm−3 day−1) also demonstratethat the sulfate pool is turned over within days. This suggeststhat reoxidation of reduced sulfur compounds occurs througha cryptic S-cycle driven by iron (Norði et al., 2013; Hanselet al., 2015) in order to maintain these high SRR. A likelymechanism for such recycling is the disproportionation ofelemental sulfur linked to ferric iron reduction (Thamdrup et al.,1993; Holmkvist et al., 2011). Moreover, unless methanogens arebeing outcompeted by iron reducers (Roden and Wetzel, 1996),the persistence of ferric iron in deeper sediment could be seenas an indicator for processes involved in anaerobic oxidation ofmethane (Hallam et al., 2004).
CONCLUSION
Stratification of Lake Towuti’s water column gave rise todifferent biogeochemical conditions in deeper parts of thewater column and at the water–sediment interface at thethree study sites. Respiration processes led to the gradualdepletion of electron acceptors with increasing water depth,with microbial Fe3+ and SO4
2− reduction occurring belowthe oxycline. As a result of microbial uptake of nitrogen andphosphorus, carbon burial increased with water depth whileNH4
+ accumulated in anoxic bottom waters. Sediments atthe shallow site exhibited more labile OM as well as higherpore water SO4
2− concentrations and, consequently, harboredthe highest cell densities and potential SRR. Retrieved eDNAsequences confirmed the role of microbial degradation within thewater column, with some aerobic and anaerobic heterotrophicelements potentially linked to the epilimnion and hypolimnion.Nevertheless, eDNA was substantially degraded in the uppermostsediment layers at all three sites, leading to the gradual lossof genetic information. Fingerprinting of iDNA revealed taxacommon in SRB consortia, along with known iron reducers andmethanogens at all sites. Our results attest that Lake Towuti’ssediments support microorganisms displaying complementary
Frontiers in Microbiology | www.frontiersin.org 12 June 2016 | Volume 7 | Article 1007

fmicb-07-01007 July 12, 2016 Time: 16:55 # 13
Vuillemin et al. Geomicrobiology of Ferruginous Sediments
metabolic capabilities related to sulfur, iron and methane cycling.Relatively high SRR could be maintained in these ferruginoussediments through a cryptic sulfur cycle driven by iron reduction.The related loss of the sedimentary OM sorption capacity overtime would then promote OM remineralization to methane.However, ferric iron phases may persist in deeper sediment layers,questioning the availability of organic substrates rather than thatof reactive iron. To conclude whether they be related to climateor in-lake processes, redox changes in the water column appearto lead to variable burial of OM, electron acceptors and reactivemetal species in the sediments. Regarding the entire lacustrinerecord, a long-term shift to more oxic conditions would lead topersistence of electron acceptors in deeper sediments and couldpromote metabolic activity by the subsurface biosphere.
AUTHOR CONTRIBUTIONS
AV performed DNA extractions, DGGE procedure, genetic andimage analyses, designed the figures, and led the writing ofthe present manuscript. AF sampled during field campaign,performed geochemical analyses and cell counts. MA designedand supervised DNA extractions and genetic analyses. SACsampled during field campaign and conducted the CTDcast measurements. CH and SN fulfilled the research permitprocedure and sampled during field campaign. DW providedimportant financial and technical support and supervised geneticanalyses. JK designed the study, sampled during field campaign,supervised geochemical analyses and cell counts. All authorshave taken part in the manuscript revisions and agreed with itsscientific content.
FUNDING
This study was financially and logistically supported by theICDP priority program of the Deutsche Forschungsgemeinschaft(DFG Schwerpunktprogramm) through grants to JK (KA2293/8-1) and AV (VU 94/1-1); the Swiss National ScienceFoundation (SNSF Grant P2GEP2_148621 to AV); theHelmholtz Center Potsdam, German Research Center forGeoscience (GFZ), and an NSERC Discovery grant (0487) toSC.
ACKNOWLEDGMENTS
We thank Tri Widiyanto and his staff from the IndonesiaResearch Center for Limnology for their administrativesupport in obtaining the Scientific Research Permit. JanAxel Kitte, Carriayne Jones, and Céline C. P. Michielsare thanked for their assistance during sampling at LakeTowuti, and PT Vale Indonesia for field support. MariaSchindler’s help in the cell extraction procedure and DykeScheidemann’s assistance in elemental analysis are kindlyacknowledged.
SUPPLEMENTARY MATERIAL
The Supplementary Material for this article can be foundonline at: http://journal.frontiersin.org/article/10.3389/fmicb.2016.01007
REFERENCESAlawi, M., Schneider, B., and Kallmeyer, J. (2014). A procedure for separate
recovery of extra- and intracellular DNA from a single marine sediment sample.J. Microbiol. Methods 104, 36–42. doi: 10.1016/j.mimet.2014.06.009
Aldrian, E., and Susanto, R. D. (2003). Identification of three dominant rainfallregions within Indonesia and their relationship to sea surface temperature. Int.J. Climatol. 23, 1435–1452. doi: 10.1002/joc.950
Amon, R. M. W., and Benner, R. (1996). Bacterial utilization of differentsize classes of dissolved organic matter. Limnol. Oceanogr. 41, 41–51. doi:10.4319/lo.1996.41.1.0041
Baker, G., and Cowan, D. A. (2004). 16 S rDNA primers and the unbiasedassessment of thermophile diversity. Biochem. Soc. Trans. 32, 218–221. doi:10.1042/BST0320218
Bakken, L. R., and Olsen, R. A. (1989). DNA-content of soil bacteria of differentcell size. Soil Biol. Biochem. 21, 789–793. doi: 10.1016/0038-0717(89)90172-7
Baldwin, D. S. (2013). Organic phosphorus in the aquatic environment. Environ.Chem. 10, 439–454. doi: 10.1079/9780851998220.0309
Bar-Or, I., Ben-Dov, E., Kushmaro, A., and Sivan, O. (2015). Methane-relatedchanges in prokaryotes along geochemical profiles in sediments of LakeKinneret (Israel). Biogeosciences 12, 2847–2860. doi: 10.5194/bg-12-2847-2015
Berner, R. A. (1980). Early Diagenesis: A Theoretical Approach. Princeton, NJ:Princeton University Press, 256.
Boom, R., Sol, C. J., Salimans, M. M., Jansen, C. L., Wertheim-van Dillen, P. M.,and van der Noordaa, J. (1990). Rapid and simple method for purification ofnucleic acids. J. Clin. Microbiol. 28, 495–503.
Boon, N., De Windt, W., Verstraete, W., and Top, E. M. (2001). Evaluationof nested-PCR-DGGE (denaturing gradient gel electrophoresis) with group-specific 16 rRNA primers for the analysis of bacterial diversities from
different wastewater treatment plants. FEMS Microbiol. Ecol. 39, 101–112. doi:10.1111/j.1574-6941.2002.tb00911.x
Borsodi, A. K., Felföldi, T., Máthé, I., Bognár, V., Knáb, M., Krett, G., et al. (2012).Phylogenetic diversity of bacterial and archaeal communities inhabiting thesaline Lake Red located in Sovata, Romania. Extremophiles 17, 87–98. doi:10.1007/s00792-012-0496-2
Bramburger, A. J., Hamilton, P. B., Hehanussa, P. E., and Haffner, G. D.(2008). Processes regulating the community composition and relativeabundance of taxa in the diatom communities of the Malili Lakes, SulawesiIsland, Indonesia. Hydrobiologia 615, 215–224. doi: 10.1007/s10750-008-9562-2
Brands, B., Vianna, M. E., Seyfarth, I., Conrads, G., and Horz, H. P. (2009).Complementary retrieval of 16S rRNA gene sequences using broad-rangeprimers with inosine at the 3’-terminus: implications for the study ofmicrobial diversity. FEMS Microbiol. Ecol. 71, 157–167. doi: 10.1111/j.1574-6941.2009.00786.x
Button, D. K., and Robertson, B. R. (2001). Determination of DNA content ofaquatic bacteria by flow cytometry. Appl. Environ. Microbiol. 67, 1636–1645.doi: 10.1128/AEM.67.4.1636-1645.2001
Byers, S. C., Mills, E. L., and Stewart, P. L. (1978). A comparison of methodsof determining organic carbon in marine sediments, with suggestions for astandard method. Hydrobiologia 58, 43–47. doi: 10.1007/BF00018894
Calvert, S. J., and Hall, R. (2007). Cenozoic evolution of the Lariang and Karamaregions, North Makassar Basin, western Sulawesi, Indonesia. Petrol. Geosci. 13,353–368. doi: 10.1144/1354-079306-757
Ceccherini, M. T., Ascher, J., Agnelli, A., Borgogni, F., Pantani, O. L.,and Pietramellara, G. (2009). Experimental discrimination and molecularcharacterization of the extracellular soil DNA fraction. Antonie VanLeeuwenhoek 96, 653–657. doi: 10.1007/s10482-009-9354-3
Frontiers in Microbiology | www.frontiersin.org 13 June 2016 | Volume 7 | Article 1007

fmicb-07-01007 July 12, 2016 Time: 16:55 # 14
Vuillemin et al. Geomicrobiology of Ferruginous Sediments
Cecchio, C., Ruggiero, P., Curci, M., Colombo, C., Palumbo, G., and Stotzky, G.(2005). Binding of DNA from Bacillus subtilis on montmorillonite-humic acids-aluminium or iron hydroxypolymers: effects on transformation and protectionagainst DNase. Soil Sci. Soc. Am. J. 69, 834–841. doi: 10.2136/sssaj2004.0166
Cleaves, H. J., Crapster-Pregont, E., Jonsson, C. M., Jonsson, C. L., Sverjensky,D. A., and Hazen, R. A. (2011). The adsorption of short single-strandedDNA oligomers to mineral surfaces. Chemosphere 83, 1560–1567. doi:10.1016/j.chemosphere.2011.01.023
Corinaldesi, C., Barucca, M., Luna, G. M., and Dell’Anno, A. (2011). Preservation,origin and genetic imprint of extracellular DNA in permanently anoxic deep-sea sediments. Mol. Ecol. 20, 642–654. doi: 10.1111/j.1365-294X.2010.04958.x
Corinaldesi, C., Beolchini, F., and Dell’Anno, A. (2008). Damage and degradationrates of extracellular DNA in marine sediments: implications for thepreservation of gene sequences. Mol. Ecol. 17, 3939–3951. doi: 10.1111/j.1365-294X.2008.03880.x
Corinaldesi, C., Dell’Anno, A., and Danovaro, R. (2007). Early diagenesis andtrophic role of extracellular DNA in different benthic ecosystems. Limnol.Oceanogr. 52, 1710–1717. doi: 10.4319/lo.2007.52.4.1710
Costa, K. M., Russell, J. M., Vogel, H., and Bijaksana, S. (2015). Hydrologicalconnectivity and mixing of Lake Towuti, Indonesia, in response to paleoclimaticchanges over the last 60,000 years. Palaeogeogr. Palaeoclimatol. Palaeoecol. 417,467–475. doi: 10.1016/j.palaeo.2014.10.009
Crowe, S. A., Jones, C. A., Katsev, S., Magen, C., O’Neill, A., Sturm, A., et al. (2008a).Photoferrotrophs thrive in an Archean Ocean analogue. Proc. Natl. Acad. Sci.U.S.A. 105, 15938–15943. doi: 10.1073/pnas.0805313105
Crowe, S. A., Katsev, S., Hehanussa, P., Haffner, G. D., Sundby, B., Mucci, A.,et al. (2008b). The biogeochemistry of tropical lakes: a case study from LakeMatano, Indonesia. Limnol. Oceanogr. 53, 319–331. doi: 10.4319/lo.2008.53.1.0319
Crowe, S. A., Katsev, S., Leslie, K., Sturm, A., Magen, C., Nomosatryo, S., et al.(2011). The methane cycle in ferruginous Lake Matano. Geobiology 9, 61–78.doi: 10.1111/j.1472-4669.2010.00257.x
Crowe, S. A., Pannalal, S. J., Fowle, D. A., Cioppa, M. T., Symons, D. T. A., Haffner,G. D., et al. (2004). Biogeochemical cycling in Fe-rich sediments from LakeMatano, Indonesia. Int. Symp. Water Rock Interact. 11, 1185–1189.
Crowe, S. A., Paris, G., Katsev, S., Jones, C. A., Kim, S. T., Zerkle, A. L., et al. (2014).Sulfate was a trace constituent of Archaean seawater. Science 346, 735–739. doi:10.1126/science.1258966
Crowe, S. A., Roberts, J. A., Weisener, C. G., and Fowle, D. A. (2007). Alterationof iron-rich lacustrine sediments by dissimilatory iron-reducing bacteria.Geobiology 5, 63–73. doi: 10.1111/j.1472-4669.2006.00086.x
Danovaro, R., and Middelboe, M. (2010). “Separation of free virus particles fromsediments in aquatic systems,” in Manual of Aquatic Viral Ecology, eds S. W.Wilhelm, M. G. Weinbauer, and C. A. Suttle (Waco, TX: American Society ofLimnology and Oceanography, Inc.), 74–81.
Dell’Anno, A., and Corinaldesi, C. (2004). Degradation and turnover ofextracellular DNA in marine sediments: ecological and methodologicalconsiderations. Appl. Environ. Microbiol. 70, 4384–4386. doi:10.1128/AEM.70.7.4384-4386.2004
Dong, H., Jiang, H., Yu, B., Liu, X., and Zhang, C. (2010). Impacts of environmentalchange and human activity on microbial ecosystems on the Tibetan Plateau,NW China. GSA Today 20, 4–10. doi: 10.1130/GSATG75A.1
Dong, H., Kukkadapu, R. K., Fredrickson, J. K., Zachara, J. M., Kennedy, D. W.,and Kostandarithes, H. M. (2003). Microbial reduction of structural Fe(III) inillite and goethite. Environ. Sci. Technol. 37, 1268–1276. doi: 10.1021/es020919d
Fahrbach, M., Kuever, J., Meinke, R., Kämpfer, P., and Hollender, J. (2006).Denitratisoma oestradiolicum gen. nov., sp. nov., a 17β-oestradiol-degrading,denitrifying betaproteobacterium. Int. J. Syst. Evol. Microbiol. 56, 1547–1552.doi: 10.1099/ijs.0.63672-0
Ferguson, S. J., Jackson, B., and McEwan, A. G. (1987). Anaerobic respiration inthe Rhodospirillaceae: characterisation of pathways and evaluation of roles inredox balancing during photosynthesis. FEMS Microbiol. Rev. 46, 117–143. doi:10.1111/j.1574-6968.1987.tb02455.x
Filippini, M., and Middelboe, M. (2007). Viral abundance and genomesize distribution in the sediment and water column of marine andfreshwater ecosystems. FEMS Microbiol. Ecol. 60, 397–410. doi: 10.1111/j.1574-6941.2007.00298.x
Freudenthal, T., Wagner, T., Wenzhöfer, F., Zabel, M., and Wefer, G. (2001). Earlydiagenesis of organic matter from sediments of the eastern subtropical Atlantic:evidence from stable nitrogen and carbon isotopes. Geochim. Cosmochim. Acta65, 1795–1808. doi: 10.1016/S0016-7037(01)00554-3
Fromin, N., Hamelin, J., Tarnawski, S., Roesti, D., Jourdain-Miserez, K.,Forestier, N., et al. (2002). Statistical analysis of denaturing gel electrophoresis(DGE) fingerprinting patterns. Environ. Microbiol. 4, 634–643. doi:10.1046/j.1462-2920.2002.00358.x
Glasauer, S., Weidler, P. G., Langley, S., and Beveridge, T. J. (2003). Controlsof Fe reduction and mineral formation by a subsurface bacterium. Geochim.Cosmochim. Acta 67, 1277–1288. doi: 10.1016/S0016-7037(02)01199-7
Golightly, J. P. (2010). “Progress in understanding the evolution of nickel laterites,”in The Challenge of Finding New Mineral Resources – Global Metallogeny,Innovative Exploration, and New Discoveries, eds R. J. Goldfarb, E. E. Marsh, andT. Monecke (Littleton, CO: Society of Economic Geologists Special Publication15), 451–485.
Greene, A. C. (2014). “The family desulfuromonadaceae,” in The Prokaryotes,eds E. Rosenberg, E. F. DeLong, S. Lory, E. Stackebrandt, and F. Thompson(Heidelberg: Springer Berlin), 143–155. doi: 10.1007/978-3-642-39044-9_380
Haaijer, S. C. M., Van der Welle, M. E. W., Schmid, M. C., Lamers, L. P. M., Jetten,M. S. M., and Op den Camp, H. J. M. (2006). Evidence for the involvementof betaproteobacterial Thiobacilli in the nitrate-dependent oxidation of ironsulfide minerals. FEMS Microbiol. Ecol. 58, 439–448. doi: 10.1111/j.1574-6941.2006.00178.x
Haffner, G. D., Hehanussa, P. E., and Hartoto, D. (2001). “The biology and physicalprocesses of large lakes of Indonesia: Lakes Matano and Towuti,” in The GreatLakes of the World (GLOW): Food-Web, Health, and Integrity, eds M. Munawarand R. E. Hecky (Leiden: Blackhuys), 183–194.
Hall, P. O. J., and Aller, R. C. (1992). Rapid small-volume, flow injection analysis for6CO2 and NH4+ in marine and freshwaters. Limnol. Oceanogr. 37, 1113–1119.doi: 10.4319/lo.1992.37.5.1113
Hallam, S. J., Putnam, N., Preston, C. M., Detter, J. C., Rokhsar, D., Richardson,P. M., et al. (2004). Reverse methanogenesis: testing the hypothesis withenvironmental genomics. Science 305, 1457–1462. doi: 10.1126/science.1100025
Hallberg, K. B., Hedrich, S., and Johnson, D. B. (2011). Acidiferrobacterthiooxydans, gen. nov. sp. nov.; an acidophilic, thermo-tolerant, facultativelyanaerobic iron- and sulfur-oxidizer of the family Ectothiorhodospiraceae.Extremophiles 15, 271–279. doi: 10.1007/s00792-011-0359-2
Hallenbeck, P. C. (2009). Fermentative hydrogen production: principles,progress and prognosis. Int. J. Hydrogen Energy 34, 7379–7389. doi:10.1016/j.ijhydene.2008.12.080
Hansel, C. M., Lentini, C. J., Tang, Y., Johnston, D. T., Wankel, S. D., and Jardine,P. M. (2015). Dominance of sulfur-fueled iron oxide reduction in low-sulfatefreshwater sediments. ISME J. 9, 2400–2412. doi: 10.1038/ismej.2015.50
He, J., Zhang, L., Jin, S., Zhu, Y., and Liu, F. (2008). Bacterial communities insideand surrounding soil iron-manganese nodules. Geomicrobiol. J. 25, 14–24. doi:10.1080/01490450701829014
Herder, F., Nolte, A. W., Pfaender, J., Schwarzer, J., Hadiaty, R. K., and Schliewen,U. K. (2006). Adaptive radiation and hybridization in Wallace’s Dreamponds:evidence from sailfin silversides in the Malili Lakes of Sulawesi. Proc. Biol. Sci.7, 2209–2217. doi: 10.1098/rspb.2006.3558
Hiraishi, A., and Hoshino, Y. (1984). Distribution of rhodoquinone inRhodospirillaceae and its taxonomic implications. J. Gen. Appl. Microbiol. 30,435–448. doi: 10.2323/jgam.30.435
Holmkvist, L., Ferdelman, T. G., and Jørgensen, B. B. (2011). A cryptic sulfur cycledriven by iron in the methane zone of marine sediment (Aarhus Bay, Denmark).Geochim. Cosmochim. Acta 75, 3581–3599. doi: 10.1016/j.gca.2011.03.033
Horsfield, B., and Kieft, T. L. (2007). “The GeoBiosphere,” in Continental ScientificDrilling: A Decade of Progress, and Challenges for the Future, eds U. Harms, C.Koeberl, and M. D. Zoback (Heidelberg: Springer), 163–212. doi: 10.1007/978-3-540-68778-8
Huber, T., Faulkner, G., and Hugenholtz, P. (2004). Bellerophon: a program todetect chimeric sequences in multiple sequence alignments. Bioinformatics 20,2317–2319. doi: 10.1093/Bioinformatics/Bth226
Jones, C. A., Crowe, S. A., Sturm, A., Leslie, K. L., MacLean, L. C. W., Katsev, S.,et al. (2011). Biogeochemistry of manganese in ferruginous Lake Matano,Indonesia. Biogeosciences 8, 2977–2991. doi: 10.5194/bg-8-2977-2011
Frontiers in Microbiology | www.frontiersin.org 14 June 2016 | Volume 7 | Article 1007

fmicb-07-01007 July 12, 2016 Time: 16:55 # 15
Vuillemin et al. Geomicrobiology of Ferruginous Sediments
Jørgensen, B. B. (1978). A comparison of methods for the quantification of bacterialsulfate reduction in coastal marine sediments. I. Measurements with radiotracertechniques. Geomicrobiol. J. 1, 11–27. doi: 10.1080/01490457809377721
Kadarusman, A., Miyashita, S., Maruyama, S., Parkinson, C. D., and Ishikawa,A. (2004). Petrology, geochemistry and paleogeographic reconstruction ofthe East Sulawesi Ophiolite, Indonesia. Tectonophysics 392, 55–83. doi:10.1016/j.tecto.2004.04.008
Kallmeyer, J., Ferdelman, T. G., Weber, A., Fossing, H., and Jørgensen, B. B. (2004).A cold chromium distillation procedure for radiolabeled sulfide applied tosulfate reduction measurements. Limnol. Oceanogr. Methods 2, 171–180. doi:10.4319/lom.2004.2.171
Kallmeyer, J., Pockalny, R., Adhikari, R. R., Smith, D. C., and D’Hondt, S.(2012). Global distribution of microbial abundance and biomass insubseafloor sediment. Proc. Natl. Acad. Sci. U.S.A. 109, 16213–16216. doi:10.1073/pnas.1203849109
Kallmeyer, J., Smith, D. C., Spivack, A. J., and D’Hondt, S. (2008). New cellextraction procedure applied to deep subsurface sediments. Limnol. Oceanogr.Methods 6, 236–245. doi: 10.4319/lom.2004.2.171
Kaster, A.-K., Moll, J., Parey, K., and Thauer, R. K. (2009). Coupling of ferredoxinand heterodisulfide reduction via electron bifurcation in hydrogenotrophicmethanogenic archaea. Proc. Natl. Acad. Sci. U.S.A. 108, 2981–2986. doi:10.1073/pnas.101676110
Katsev, S., and Crowe, S. A. (2015). Organic carbon burial efficiencies in sediments:the power law of carbon mineralization revisited. Geology 43, 607–610. doi:10.1130/G36626.1
Katsev, S., Crowe, S. A., Mucci, A., Sundby, B., Nomosatryo, S., Haffner, G. D., et al.(2010). Mixing and its effects on biogeochemistry in the persistently stratified,deep, tropical Lake Matano, Indonesia. Limnol. Oceanogr. 55, 763–776. doi:10.4319/lo.2010.55.2.0763
Kleindienst, S., Herbst, F.-A., Stagars, M., von Netzer, F., von Bergen, M.,Seifert, J., et al. (2014). Diverse sulfate-reducing bacteria of theDesulfosarcina/Desulfococcus clade are the key alkane degraders at marineseeps. ISME J. 8, 2029–2044. doi: 10.1038/ismej.2014.51
Leeuw, T., Boss, E. S., and Wright, D. L. (2013). In situ measurements ofphytoplankton fluorescence using low cost electronics. Sensors 13, 7872–7883.doi: 10.3390/s130607872
Lehmusluoto, P., Machbub, B., Terangna, N., Rusmiputro, S., Achmad, F., Boer, L.,et al. (1995). National Inventory of the Major Lakes and Reservoirs in Indonesia.Helsingfors: Edita Publishing Oy.
Lindahl, T. (1993). Instability and decay of the primary structure of DNA. Nature362, 709–715. doi: 10.1038/362709a0
Ludwig, W., Strunk, O., Westram, R., Richter, L., Meier, H., Yadhukumar, et al.(2004). ARB: a software environment for sequence data. Nucleic Acids Res. 32,1363–1371. doi: 10.1093/nar/gkh293
Masters, R. A., and Madigan, M. (1983). Nitrogen metabolism in the phototrophicbacteria Rhodocyclus purpureus and Rhodospirillum tenue. J. Bacteriol. 155,222–227.
Matsumoto, R., and Iijima, A. (1981). Origin and diagenetic evolution of Ca-Mg-Fe carbonates in some coalfields of Japan. Sedimentology 28, 239–259. doi:10.1111/j.1365-3091.1981.tb01678.x
Morono, Y., Terada, T., Masui, N., and Inagaki, F. (2009). Discriminative detectionand enumeration of microbial life in marine subsurface sediments. ISME J. 3,503–511. doi: 10.1038/ismej.2009.1
Nam, Y. D., Sung, Y., Chang, H. W., Roh, S. W., Kim, K. H., Rhee, S. K., et al. (2008).Characterization of the depth-related changes in the microbial communities inLake Hovsgol sediment by 16S rRNA gene-based approaches. J. Microbiol. 46,125–136. doi: 10.1007/s12275-007-0189-1
Ndiaye, M., Davaud, E., Ariztegui, D., and Fall, M. (2012). A semi automatedmethod for laminated sediments analysis. Int. J. Earth Sci. 3, 206–210. doi:10.4236/ijg.2012.31023
Norði, K. A., Thamdrup, B., and Schubert, C. J. (2013). Anaerobic oxidation ofmethane in an iron-rich Danish freshwater lake sediment. Limnol. Oceanogr.58, 546–554. doi: 10.4319/lo.2013.58.2.0546
Ohren, A. (2014). “The family methanomicrobiaceae,” in The Prokaryotes, edsE. Rosenberg, E. F. DeLong, S. Lory, E. Stackebrandt, and F. Thompson(Heidelberg: Springer), 231–246. doi: 10.1007/978-3-642-38954-2
Pietramellara, G., Ascher, J., Borgogni, F., Ceccherini, M. T., Guerri, G., andNannipieri, P. (2008). Extracellular DNA in soil and sediment: fate and
ecological relevance. Biol. Fertil. Soils 45, 219–235. doi: 10.1007/s00374-008-0345-8
Pinchuk, G. E., Ammons, C., Culley, D. E., Li, S.-M. W., McLean, J. S., Romine,M. F., et al. (2008). Utilization of DNA as a sole source of phosphorus, carbon,and energy by Shewanella spp.: ecological and physiological implications fordissimilatroy metal reduction. Appl. Environ. Microbiol. 74, 1198–1208. doi:10.1128/AEM.02026-07
Pruesse, E., Peplies, J., and Glöckner, F. O. (2012). SINA: accurate high-throughputmultiple sequence alignment of ribosomal RNA genes. Bioinformatics 28, 1823–1829. doi: 10.1093/bioinformatics/bts252
Pruesse, E., Quast, C., Knittel, K., Fuchs, B. M., Ludwig, W., Peplies, J., et al.(2007). SILVA: a comprehensive online resource for quality checked and alignedribosomal RNA sequence data compatible with ARB. Nucleic Acids Res. 35,7188–7196. doi: 10.1093/nar/gkm864
Renshaw, M. A., Olds, B. P., Jerde, C. J., McVeigh, M. M., and Lodge, D. M. (2015).The room temperature preservation of filtered environmental DNA samplesand assimilation into a phenol-chloroform-isoamyl acohol DNA extraction.Mol. Ecol. Resour. 15, 168–176. doi: 10.1111/1755-0998.12281
Roden, E. E., and Tuttle, J. H. (1993). Inorganic sulfur turnover in oligohalineestuarine sediments. Biogeochemistry 22, 81–105. doi: 10.1007/BF00002706
Roden, E. E., and Wetzel, R. G. (1996). Organic carbon oxidation and suppressionof methane production by microbial Fe(III) oxide reduction in vegetated andunvegetated freshwater wetland sediments. Limnol. Oceanogr. 41, 1733–1748.doi: 10.4319/lo.1996.41.8.1733
Russell, J. M., and Bijaksana, S. (2012). The Towuti drilling project:paleoenvironments, biological evolution, and geomicrobiology of a tropicalPacific lake. Sci. Dril. 14, 68–71. doi: 10.2204/iodp.sd.14.11.2012
Russell, J. M., Vogel, H., Konecky, B. L., Bijaksana, S., Huang, Y., Melles, M., et al.(2014). Glacial forcing of central Indonesian hydroclimate since 60,000 y B.P.Proc. Natl. Acad. Sci. U.S.A. 111, 5100–5105. doi: 10.1073/pnas.1402373111
Schedel, M., and Trüper, H. G. (1980). Anaerobic oxidation of thiosulfate andelemental sulfur in Thiobacillus denitrificans. Arch. Microbiol. 124, 205–210.doi: 10.1007/BF00427728
Schibler, J., Moore, D., and De Borba, B. (2007). Setting Meaningful Detection andQuantitation Limits for Chromatography Methods. Sunnyvale, CA: PITTCON2007 Presentation, Dionex Corporation.
Simister, R., Bauer, K., Vuillemin, A., Fowle, D., Russell, J., Kallmeyer, J., et al.(2016). Biogeochemistry of Ferruginous Sediments from Lake Towuti, Indonesia.Abstract No. Gold2016: Abs: 4994. Available at: http://goldschmidt.info/2016/abstracts/abstractView?abstractId=4994
Slobodkina, G. B., Reysenbach, A.-L., Panteleeva, A. N., Kostrikina, N. A., Wagner,I. D., Bonch-Osmolovskaya, E. A., et al. (2012). Deferrisoma camini gen. nov.,sp. nov., a moderately thermophilic, dissimilatory iron(III)-reducing bacteriumfrom a deep-sea hydrothermal vent that forms a distinct phylogenetic branchin the Deltaproteobacteria. Int. J. Syst. Evol. Microbiol. 62, 2463–2468. doi:10.1099/ijs.0.038372-0
Tamuntuan, G., Bijaksana, S., King, J., Russell, J., Fauzi, U., Maryunani, K., et al.(2015). Variation of magnetic properties in sediments from Lake Towuti,Indoensia, and its paleoclimatic significance. Palaeogeogr. Palaeoclimatol.Palaeoecol. 420, 163–172. doi: 10.1016/j.palaeo.2014.12.008
Thamdrup, B., Finster, K., Hansen, J. W., and Bak, F. (1993). Bacterialdisproportionation of elemental sulfur coupled to chemical reduction of ironand manganese. Appl. Environ. Microbiol. 59, 101–108.
Thauer, R. K., Kaster, A.-K., Seedorf, H., Buckel, W., and Hedderich, R. (2008).Methanogenic archaea: ecologically relevant differences in energy conservation.Nat. Rev. Microbiol. 6, 579–591. doi: 10.1038/nrmicro1931
Torti, A., Lever, M. A., and Jørgensen, B. B. (2015). Origin, dynamics andimplications of extracellular DNA pools in marine sediments. Mar. Genomics24, 185–196. doi: 10.1016/j.margen.2015.08.007
Viollier, E., Inglett, P. W., Hunter, K., Roychoudhury, A. N., and Van Cappellen, P.(2000). The ferrozine method revisited: Fe(II)/Fe(III) determination in naturalwaters. Appl. Geochem. 15, 785–790. doi: 10.1016/S0883-2927(99)00097-9
Vogel, H., Russell, J. M., Cahyarini, S. Y., Bijaksana, S., Wattrus, N., Rethemeyer, J.,et al. (2015). Depositional modes and lake-level variability at Lake Towuti,Indonesia, during the past ∼29 kyr BP. J. Paleolimnol. 54, 359–377. doi:10.1007/s10933-015-9857-z
Vuillemin, A., Ariztegui, D., Leavitt, P. R., Bunting, L., and The Pasado ScienceTeam (2016). Recording of climate and diagenesis through sedimentary DNA
Frontiers in Microbiology | www.frontiersin.org 15 June 2016 | Volume 7 | Article 1007

fmicb-07-01007 July 12, 2016 Time: 16:55 # 16
Vuillemin et al. Geomicrobiology of Ferruginous Sediments
and fossil pigments at Laguna Potrok Aike, Argentina. Biogeosciences 13,2475–2492. doi: 10.5194/bg-13-2475-2016
Vuillemin, A., Ariztegui, D., Lücke, A., Mayr, C., and The Pasado ScienceTeam (2014). Paleoenvironmental conditions define current sustainability ofmicrobial populations in Laguna Potrok Aike sediments, Argentina. Aquat. Sci.76, 101–114. doi: 10.1007/s00027-013-0317-4
Vuillemin, A., Ariztegui, D., and the Pasado Science Team (2013).Geomicrobiological investigations in subsaline maar lake over the last1500 years. Quat. Sci. Rev. 71, 119–130. doi: 10.1016/j.quascirev.2012.04.011
Vuillemin, A., Ndiaye, M., Martini, R., and Davaud, E. (2011). Cement stratigraphy:image probes of cathodoluminescence facies. Swiss J. Geosci. 104, 55–66. doi:10.1007/s00015-010-0047-8
Yao, M., Elling, F. J., Jones, C., Nomosatryo, S., Long, C. P., Crowe, S. A.,et al. (2016). Heterotrophic bacteria from an extremely phosphate-poor lakehave conditionally reduced phosphorus demand and utilize diverse sources ofphosphorus. Environ. Microbiol. 18, 656–667. doi: 10.1111/1462-2920.13063
Zavarzina, D. G., Sokolova, T. G., Tourova, T. P., Chernyh, N. A., Kostrikina,N. A., and Bonch-Osmolovskaya, E. A. (2007). Thermincola ferriaceticasp. nov., a new anaerobic, thermophilic, facultatively chemolithoautotrophicbacterium capable of dissimilatory Fe(III) reduction. Extremophiles 11, 1–7. doi:10.1007/s00792-006-0004-7
Zegeye, A., Bonneville, S., Benning, L. G., Sturm, A., Fowle, D. A., Jones,C. A., et al. (2012). Green rust formation controls nutrient availabilityin a ferruginous water column. Geology 40, 599–602. doi: 10.1130/G32959.1
Zeng, J., Yang, L., Li, J., Liang, Y., Xiao, L., Jiang, L., et al. (2009). Verticaldistribution of bacterial community structure in the sediments of twoeutrophic lakes revealed by denaturing gradient gel electrophoresis (DGGE)and multivariate analysis techniques. World J. Microbiol. Biotechnol. 25, 225–233. doi: 10.1007/s11274-008-9883-3
Conflict of Interest Statement: The authors declare that the research wasconducted in the absence of any commercial or financial relationships that couldbe construed as a potential conflict of interest.
Copyright © 2016 Vuillemin, Friese, Alawi, Henny, Nomosatryo, Wagner, Crowe andKallmeyer. This is an open-access article distributed under the terms of the CreativeCommons Attribution License (CC BY). The use, distribution or reproduction inother forums is permitted, provided the original author(s) or licensor are creditedand that the original publication in this journal is cited, in accordance with acceptedacademic practice. No use, distribution or reproduction is permitted which does notcomply with these terms.
Frontiers in Microbiology | www.frontiersin.org 16 June 2016 | Volume 7 | Article 1007