volume ii sediment tmdls for the accotink creek watershed ......sediment tmdls for the accotink...
TRANSCRIPT
Volume II
Sediment TMDLs
for the Accotink Creek Watershed,
Fairfax County, Virginia
Prepared for
Virginia Department of Environmental Quality
Prepared by Interstate Commission on the Potomac River Basin
August 30, 2017
Cover Photo
Accotink Creek near Hooes Road, Virginia. 2008. Photo by Virginia Department of Environmental
Quality
Disclaimer
The opinions expressed in this report are those of the authors and should not be construed as
representing the opinions or policies of the United States government or the signatories or
Commissioners to ICPRB.
Final: 08/30/2017
Sediment TMDLs for Accotink Creek Watershed i
Table of Contents
List of Tables ....................................................................................................................................................................... iv
List of Figures ................................................................................................................................................................... viii
Acronyms ............................................................................................................................................................................... x
Units of Measure .............................................................................................................................................................. xii
Executive Summary ................................................................................................................................................................ 1
1 Introduction ................................................................................................................................................................. 1-1
1.1 Applicable Water Quality Standards ........................................................................................................ 1-3
1.1.1 Designated Uses ...................................................................................................................................... 1-3
1.1.2 Water Quality Criteria .......................................................................................................................... 1-3
1.1.3 Aquatic Life Use ....................................................................................................................................... 1-4
1.2 Impairment Listings ....................................................................................................................................... 1-4
1.3 Results of the Stressor Identification Analysis for the Accotink Creek Watershed.............. 1-7
1.3.1 Evidence for a Sediment Impairment in the Accotink Creek Watershed ........................ 1-9
2 Watershed Description ............................................................................................................................................ 2-1
2.1 Watershed Description and Identification ............................................................................................ 2-1
2.1.1 Topography ............................................................................................................................................... 2-3
2.1.2 Hydrogeomorphic Regions ................................................................................................................. 2-4
2.1.3 Soils .............................................................................................................................................................. 2-5
2.1.4 Land Use ..................................................................................................................................................... 2-9
2.1.5 Population and Households .............................................................................................................2-15
2.2 Permitted Facilities .......................................................................................................................................2-15
2.2.1 Facilities with Individual Permits ..................................................................................................2-16
2.2.2 Facilities with General Permits .......................................................................................................2-19
2.2.3 Municipal Separate Storm Sewer Systems (MS4s) .................................................................2-22
2.2.4 Construction Permits ..........................................................................................................................2-25
2.2.5 Sewers .......................................................................................................................................................2-25
3 TMDL Development .................................................................................................................................................. 3-1
3.1 Overview of the Generalized Watershed Loading Functions (GWLF) Model ......................... 3-1
3.1.1 Simulation of Watershed Hydrology .............................................................................................. 3-2
3.1.2 Simulation of Erosion and Sediment Transport ........................................................................ 3-3
Final: 08/30/2017
Sediment TMDLs for Accotink Creek Watershed ii
3.1.3 Seasonal Variability and Critical Conditions ............................................................................... 3-4
3.1.4 Implementation of GWLF in the Accotink Creek Watershed ................................................ 3-4
3.2 Hydrology Calibration.................................................................................................................................... 3-6
3.2.1 Hydrology Parameter Optimization ............................................................................................... 3-7
3.2.2 Extreme Events........................................................................................................................................ 3-8
3.2.3 Hydrology Calibration Results ........................................................................................................3-10
3.3 Sediment Calibration Targets ...................................................................................................................3-12
3.3.1 Developed Land Sediment Concentrations Targets ...............................................................3-13
3.3.2 Land under Construction ..................................................................................................................3-14
3.3.3 Estimation of Total Sediment Loads .............................................................................................3-14
3.3.4 Fairfax County Load Estimates .......................................................................................................3-19
3.4 Development of GWLF Models of Upper Accotink Creek, Lower Accotink Creek, and Long
Branch ................................................................................................................................................................3-21
3.4.1 Land Use ...................................................................................................................................................3-22
3.4.2 Sediment Delivery Ratio ....................................................................................................................3-23
3.4.3 USLE Parameters ..................................................................................................................................3-23
3.4.4 Streambank Erosion ............................................................................................................................3-24
3.4.5 Best Management Practices .............................................................................................................3-25
3.4.6 Loads from Permitted Process Water Dischargers ................................................................3-29
3.4.7 Lake Accotink Trapping Efficiency ................................................................................................3-30
3.5 Summary of Average Annual Baseline Loads, All-Forest Loads, and Sediment TMDLs ...3-30
3.5.1 Comparison of Sediment Load Estimates ...................................................................................3-31
3.5.2 Average Annual Baseline Sediment Loads, All-Forest Loads, and TMDLs ....................3-32
4 TMDL Allocations ....................................................................................................................................................... 4-1
4.1 Margin of Safety ................................................................................................................................................ 4-1
4.2 Wasteload Allocation ..................................................................................................................................... 4-1
4.3 Load Allocation ................................................................................................................................................. 4-7
4.4 Allocations for Individual Impairments ................................................................................................. 4-7
4.5 Daily Load Expressions ...............................................................................................................................4-13
5 TMDL Implementation ............................................................................................................................................ 5-1
5.1 Continuing Planning Process and Water Quality Management Planning ................................. 5-1
5.2 Staged Implementation ................................................................................................................................. 5-1
5.3 Implementation of Wasteload Allocations ............................................................................................ 5-2
5.3.1 Wastewater Treatment Plants and Process Water from Industrial Facilities ............... 5-2
Final: 08/30/2017
Sediment TMDLs for Accotink Creek Watershed iii
5.3.2 Stormwater ............................................................................................................................................... 5-3
5.3.3 Insignificant Dischargers ..................................................................................................................... 5-4
5.3.4 TMDL Modifications for New or Expanding Dischargers....................................................... 5-4
5.4 Implementation of Load Allocations ........................................................................................................ 5-5
5.4.1 Implementation Plan Development ................................................................................................ 5-5
5.4.2 Staged Implementation Scenarios ................................................................................................... 5-6
5.4.3 Link to Ongoing Restoration Efforts ............................................................................................... 5-6
5.4.4 Implementation Funding Sources ................................................................................................... 5-8
5.5 Follow-Up Monitoring.................................................................................................................................... 5-8
5.6 Attainability of Designated Uses ..............................................................................................................5-12
6 Public Participation ................................................................................................................................................... 6-1
Appendix A ................................................................................................................................................................................. 1
ALLFORX Approach for the Accotink Creek Sediment TMDLs ............................................................................. 1
Introduction ......................................................................................................................................................................... 1
Watershed Selection ......................................................................................................................................................... 1
MapShed ................................................................................................................................................................................ 3
GWLF 4
Hydrology Calibration and Verification................................................................................................................ 6
All-Forest Model Runs ................................................................................................................................................. 8
Calculate AllForX ................................................................................................................................................................ 8
AllForX Regression ............................................................................................................................................................ 9
Current Scenario GWLF Inputs for Each Comparison Watershed .............................................................. 11
Goose Creek .................................................................................................................................................................... 11
Clark’s Run ...................................................................................................................................................................... 11
Dry Mill Branch ............................................................................................................................................................. 12
Little River ...................................................................................................................................................................... 12
North Fork Beaverdam Creek ................................................................................................................................. 13
North Fork Catoctin .................................................................................................................................................... 13
South Fork Catoctin .................................................................................................................................................... 14
Tributary to Cedar Run ............................................................................................................................................. 14
References .................................................................................................................................................................................. 1
Final: 08/30/2017
Sediment TMDLs for Accotink Creek Watershed iv
List of Tables
Table ES-1: Accotink Creek Benthic Impairments ..................................................................................................... 3
Table ES-2: Hydrology Calibration Statistics ............................................................................................................... 6
Table ES-3: Sediment Concentration Calibration Targets for Accotink Creek Watershed ....................... 7
Table ES-4: Average Annual Sediment Loads in the Accotink Creek Watershed ........................................ 10
Table ES-5: Average Annual Sediment TMDLs (tons/yr) for Accotink Creek Watersheds with
Upstream Allocations from Impaired Watersheds Removed ................................................................. 13
Table ES-6: Summary of Basis for Calculating Annual Wasteload Allocations for Permitted
Facilities ........................................................................................................................................................................ 16
Table ES-7: Upper Accotink Creek Average Annual TMDL Allocations .......................................................... 18
Table ES-8: Upper Accotink Creek Aggregated MS4 Wasteload Allocations ................................................ 18
Table ES-9: Upper Accotink Creek Sediment Permitted Stormwater Water and Process Water
Wasteload Allocations............................................................................................................................................. 19
Table ES-10: Upper Accotink Creek Load Allocations by Source Type ........................................................... 19
Table ES-11: Lower Accotink Creek Average Annual TMDL Allocations ....................................................... 20
Table ES-12: Lower Accotink Creek Aggregated MS4s Wasteload Allocations ........................................... 20
Table ES-13: Lower Accotink Creek Sediment Permitted Stormwater Water and Process
Water Wasteload Allocations ............................................................................................................................... 21
Table ES-14: Lower Accotink Creek Load Allocations by Source Type ........................................................... 21
Table ES-15: Long Branch Average Annual TMDL Allocations .......................................................................... 22
Table ES-16: Long Branch Aggregated MS4 Wasteload Allocations ................................................................ 22
Table ES-17: Long Branch Sediment Permitted Process Water Wasteload Allocations .......................... 22
Table ES-18: Long Branch Load Allocations by Source Type .............................................................................. 22
Table ES-19: Maximum Daily Loads for Upper Accotink Creek ......................................................................... 23
Table ES-20: Maximum Daily Loads for Lower Accotink Creek ......................................................................... 24
Table ES-21: Maximum Daily Loads for Long Branch ............................................................................................ 24
Table 1-1: Accotink Creek Benthic Impairments ................................................................................................... 1-5
Table 1-2: Accotink Creek Watershed VSCI Scores ............................................................................................... 1-5
Table 1-3: Categorization of Potential Stressors in Accotink Creek Watershed ....................................... 1-8
Table 1-4: Habitat Metrics (Burton and Gerritsen, 2003) ................................................................................1-10
Table 1-5: Stages of Channel Evolution Model (CEM) ........................................................................................1-11
Table 1-6: Summary of Channel Evolution Model Assessment of Accotink Creek Watershed .........1-12
Final: 08/30/2017
Sediment TMDLs for Accotink Creek Watershed v
Table 2-1: Soils Series in Accotink Creek Watersheds ......................................................................................... 2-5
Table 2-2: Descriptions of Soil Hydrologic Groups................................................................................................ 2-7
Table 2-3: Soil Hydrologic Groups in Accotink Creek Watersheds ................................................................. 2-7
Table 2-4: Classification of Land Use Categories based on Fairfax County Zoning .................................. 2-9
Table 2-5: Classification of Land Use Categories based on the City of Fairfax Existing Land Use ...2-11
Table 2-6. Land Use in Upper Accotink Creek Watershed1 ..............................................................................2-13
Table 2-7. Land Use in Lower Accotink Creek Watershed1 ..............................................................................2-13
Table 2-8. Land Use in Long Branch Watershed ...................................................................................................2-13
Table 2-9: Percent Imperviousness by Watershed and Jurisdiction ............................................................2-14
Table 2-10: 2010 Census Data Summary for the Accotink Creek Watersheds ........................................2-15
Table 2-11: Individual VPDES Industrial Permits within Accotink Creek Watershed..........................2-17
Table 2-12: Cooling Water, Car Wash and Concrete General VPDES Permitted Facilities within
Accotink Creek Watershed ................................................................................................................................2-20
Table 2-13: Industrial Stormwater General VPDES Permitted Facilities within Accotink Creek
Watershed ................................................................................................................................................................2-20
Table 2-14: MS4 Permits within Accotink Creek Watershed ..........................................................................2-22
Table 2-15: Construction Stormwater Permits within Accotink Creek Watershed (December,
2014) ..........................................................................................................................................................................2-25
Table 3-1: Hydrology Simulation Parameters Optimized Using PEST ......................................................... 3-7
Table 3-2: Cumulative Precipitation (cm) at Reagan Airport and Mantua over Duration of
Selected Extreme Events ...................................................................................................................................... 3-9
Table 3-3: Hydrology Calibration Statistics ............................................................................................................3-10
Table 3-4: Sediment Concentration Calibration Targets for Accotink Creek Watershed ....................3-14
Table 3-5: Regression Parameters and Statistics for Relation between Sediment and Flow,
Accotink Creek near Annandale ......................................................................................................................3-16
Table 3-6: Regression Parameters and Statistics for Relation between Sediment and Flow,
Long Branch near Annandale ...........................................................................................................................3-18
Table 3-7: Guidelines for Visual Determination of Lateral Erosion Rate (Steffen, 1982) ...................3-20
Table 3-8: Streambank, and Total Sediment Loads (tons/yr) from the Accotink Creek
Watershed Management Plan ..........................................................................................................................3-21
Table 3-9: Land Use in Baseline GWLF Models of Upper Accotink Creek, Lower Accotink
Creek, and Long Branch .....................................................................................................................................3-22
Table 3-10: Baseline USLE Factors for Open Space for Accotink Creek GWLF Models .......................3-24
Final: 08/30/2017
Sediment TMDLs for Accotink Creek Watershed vi
Table 3-11: All-Forest USLE Factors for Accotink Creek GWLF Models .....................................................3-24
Table 3-12: Baseline GWLF Streambank Erosion Factors ................................................................................3-25
Table 3-13: All-Forest GWLF Streambank Erosion Factors .............................................................................3-25
Table 3-14: BMP Sediment Reduction Efficiencies ..............................................................................................3-28
Table 3-15: BMP Effective Impervious Area and Sediment Reductions .....................................................3-29
Table 3-16: Average Annual Process Water Sediment Loads in the Accotink Creek Watershed .....3-30
Table 3-17: Average Annual Baseline Sediment Loads, All-Forest Loads, and TMDL for Long
Branch........................................................................................................................................................................3-33
Table 3-18: Average Annual Baseline Sediment Loads, All-Forest Loads, and TMDL for Upper
Accotink Creek .......................................................................................................................................................3-35
Table 3-19: Average Annual Baseline Sediment Loads, All-Forest Loads, and TMDL for Lower
Accotink Creek .......................................................................................................................................................3-37
Table 4-1: Summary of Basis for Calculating Allocations for Permitted Facilities ................................... 4-5
Table 4-2: Percent of Impervious Area in Impaired Watersheds within MS4 Combined Service
Area by Jurisdiction ............................................................................................................................................... 4-6
Table 4-3: Remaining Allocation (RA), Percent of Remaining Allocation (PRA), and Wasteload
Allocations for Aggregated MS4s ...................................................................................................................... 4-7
Table 4-4: Upper Accotink Creek Average Annual TMDL Allocations ........................................................... 4-8
Table 4-5: Upper Accotink Creek Aggregated MS4 Wasteload Allocations ................................................. 4-8
Table 4-6: Upper Accotink Creek Sediment Permitted Stormwater Water and Process Water
Wasteload Allocations........................................................................................................................................... 4-9
Table 4-7: Upper Accotink Creek Load Allocations ............................................................................................... 4-9
Table 4-8: Lower Accotink Creek Average Annual TMDL Allocations ........................................................4-10
Table 4-9: Lower Accotink Creek Aggregated MS4s Wasteload Allocations ............................................4-10
Table 4-10: Lower Accotink Creek Sediment Permitted Stormwater Water and Process Water
Wasteload Allocations.........................................................................................................................................4-11
Table 4-11: Lower Accotink Creek Load Allocations ..........................................................................................4-11
Table 4-12: Long Branch Average Annual TMDL Allocations .........................................................................4-12
Table 4-13: Long Branch Aggregated MS4 Wasteload Allocations ...............................................................4-12
Table 4-14: Long Branch Sediment Permitted Process Water Wasteload Allocations ........................4-12
Table 4-15: Long Branch Load Allocations .............................................................................................................4-12
Table 4-16: Components of Maximum Daily Load Calculations for MS4s, Stormwater, and LAs ...4-15
Table 4-17: Maximum Daily Loads for Upper Accotink Creek ........................................................................4-16
Final: 08/30/2017
Sediment TMDLs for Accotink Creek Watershed vii
Table 4-18: Maximum Daily Loads for Lower Accotink Creek .......................................................................4-16
Table 4-19: Maximum Daily Loads for Long Branch...........................................................................................4-17
Table 5-1: DEQ Water Quality Monitoring Stations in the Accotink Creek Watershed ........................5-11
Table A-1: Comparison Watershed Characteristics .................................................................................................. 3
Table A-2: Current Scenario Land Uses for the Comparison Watersheds, Generated by
Mapshed Using 2011 NLCD Data (acres). ......................................................................................................... 4
Table A-3: Animal Numbers for the Comparison Watersheds (USDA, 2012). ............................................... 5
Table A-4: Construction Permit Summary Information, Including Developed and Disturbed
Areas, by Comparison Watershed. There are no construction permits in effect in the
North Fork Catoctin and the Tributary to Cedar Run watersheds and are therefore left
out of this table. ........................................................................................................................................................... 6
Table A-5: GWLF non-point source (NPS) and point source (PS) sediment loads and average
VSCI scores used to calculate AllForX values for each watershed. ......................................................... 8
Final: 08/30/2017
Sediment TMDLs for Accotink Creek Watershed viii
List of Figures
Figure ES-1: Location of the Impaired Segments in Accotink Creek Watershed .................................... ES-2
Figure ES-2: Scatter Plot of Observed and Simulated Monthly Flow, Accotink Creek near
Annandale.. .............................................................................................................................................................. ES-7
Figure ES-3: Comparison of Sediment Load Estimates in Accotink Creek Watershed ......................... ES-9
Figure ES-4: Contribution of Sources to Sediment Load in Long Branch ................................................ ES-10
Figure ES-5: Contribution of Sources to Sediment Load in Upper Accotink Creek ............................. ES-11
Figure ES-6: Contribution of Sources to Sediment Load in Lower Accotink Creek ............................ ES-11
Figure ES-7: Regression of VSCI Scores against AllForX Multipliers ........................................................ ES-12
Figure 1-1: Location of the Impaired Segments in Accotink Creek Watershed ......................................... 1-2
Figure 1-2: Average VSCI Scores for Upper Accotink Creek, Lower Accotink Creek, and Long
Branch.......................................................................................................................................................................... 1-6
Figure 2-1: Location and Boundaries of the Accotink Creek Watersheds ................................................... 2-2
Figure 2-2: Accotink Creek Watersheds with Hydrogeomorphic Regions .................................................. 2-4
Figure 2-3: Soil Hydrologic Groups in Accotink Creek Watersheds ............................................................... 2-8
Figure 2-4: Land Use in Accotink Creek Watershed............................................................................................2-12
Figure 2-5: Location of Facilities with Individual and General VPDES Permits within Accotink
Watershed ................................................................................................................................................................2-18
Figure 2-6: Location of Industrial Stormwater General Permits within Accotink Watershed ..........2-21
Figure 2-7: Individual MS4 Service Areas ...............................................................................................................2-23
Figure 2-8: Combined MS4 Service Areas ...............................................................................................................2-24
Figure 3-1: Location of Reagan National Airport (USW00013743) and Mantua (VAFX0037)
Weather Stations with respect to Hydrology Calibration Watershed .............................................. 3-6
Figure 3-2: Cumulative Precipitation (cm), September 5-10, 2011, at NOAA GHCND Stations
in or near Accotink Creek Watershed............................................................................................................. 3-9
Figure 3-3: Scatter Plot of Observed and Simulated Monthly Flows, Accotink Creek near
Annandale. (The red line represents a one-to-one relationship.) ....................................................3-11
Figure 3-4: Time Series of Observed and Simulated Monthly Flows, Accotink Creek near
Annandale ................................................................................................................................................................3-11
Figure 3-5: Observed and Simulated Average Monthly Flows, Accotink Creek near Annandale .....3-12
Figure 3-6: Relation between log Suspended Sediment and log Flow, Accotink Creek near
Annandale ................................................................................................................................................................3-16
Final: 08/30/2017
Sediment TMDLs for Accotink Creek Watershed ix
Figure 3-7: Annual Sediment Loads from Accotink Creek and Long Branch Regression Models ....3-17
Figure 3-8: Comparison of Sediment Concentrations used in the Accotink Creek STEPL Model,
compared to the Concentrations used in the Accotink Creek GWLF Models ...............................3-19
Figure 3-9: Comparison of Sediment Load Estimates in Accotink Creek Watershed ...........................3-31
Figure 3-10: Contribution of Sources to Sediment Load in Long Branch ...................................................3-34
Figure 3-11: Contribution of Sources to Sediment Load in Upper Accotink Creek ................................3-35
Figure 3-12: Contribution of Sources to Sediment Load in Lower Accotink Creek ...............................3-38
Figure 5-1: DEQ Water Quality Monitoring Stations in the Accotink Creek Watershed ......................5-10
Figure A-1: Location of Comparison Watersheds (orange and green) in relation to the
Accotink watershed (dark grey). ...................................................................................................................... A-2
Figure A-2: Observed Versus Simulated Monthly Flows, Goose Creek (cfs) (1996-2015) ................... A-7
Figure A-3: Observed Versus Simulated Monthly Flows, Catoctin Creek (cfs) (1996-2015) .............. A-7
Figure A-4: Comparison Watersheds, AllForX Versus VSCI scores. ................................................................ A-9
Figure A-5: Regression of AllForX values against corresponding VSCI scores. ......................................... A-9
Final: 08/30/2017
Sediment TMDLs for Accotink Creek Watershed x
Acronyms
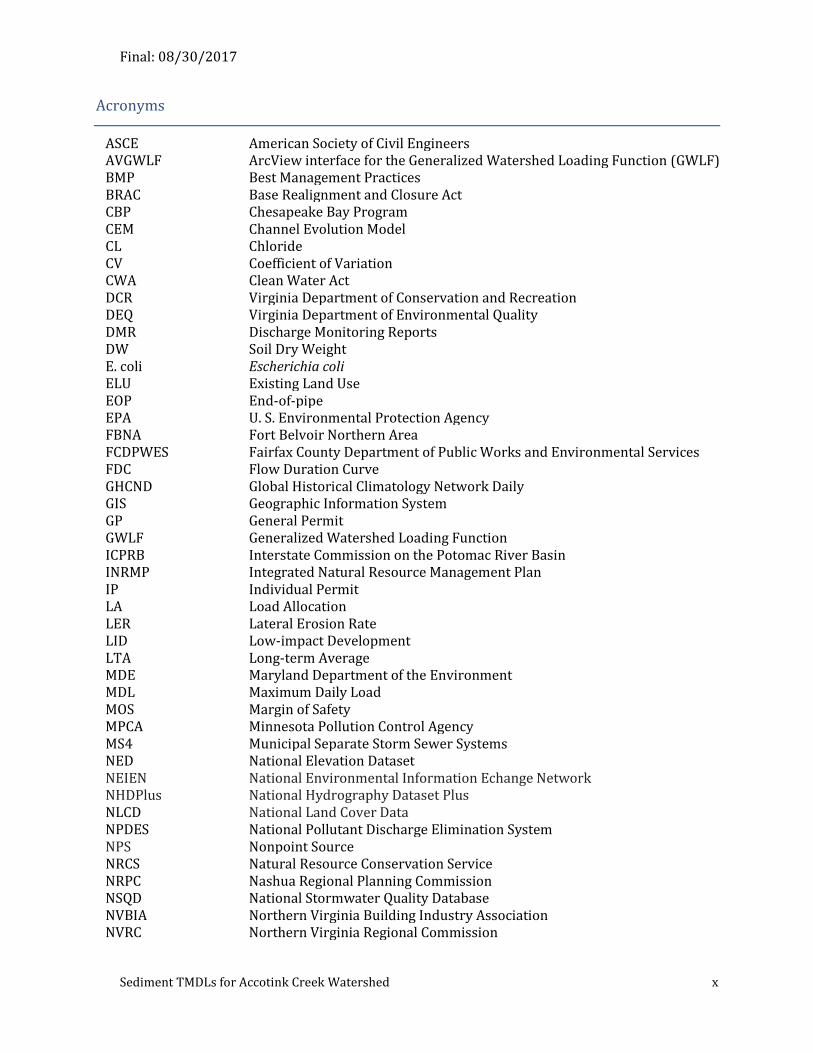
ASCE American Society of Civil Engineers AVGWLF ArcView interface for the Generalized Watershed Loading Function (GWLF) BMP Best Management Practices BRAC Base Realignment and Closure Act CBP Chesapeake Bay Program CEM Channel Evolution Model CL Chloride CV Coefficient of Variation CWA Clean Water Act DCR Virginia Department of Conservation and Recreation DEQ Virginia Department of Environmental Quality DMR Discharge Monitoring Reports DW Soil Dry Weight E. coli Escherichia coli ELU Existing Land Use EOP End-of-pipe EPA U. S. Environmental Protection Agency FBNA Fort Belvoir Northern Area FCDPWES Fairfax County Department of Public Works and Environmental Services FDC Flow Duration Curve GHCND Global Historical Climatology Network Daily GIS Geographic Information System GP General Permit GWLF Generalized Watershed Loading Function ICPRB Interstate Commission on the Potomac River Basin INRMP Integrated Natural Resource Management Plan IP Individual Permit LA Load Allocation LER Lateral Erosion Rate LID Low-impact Development LTA Long-term Average MDE Maryland Department of the Environment MDL Maximum Daily Load MOS Margin of Safety MPCA Minnesota Pollution Control Agency MS4 Municipal Separate Storm Sewer Systems NED National Elevation Dataset NEIEN National Environmental Information Echange Network NHDPlus National Hydrography Dataset Plus NLCD National Land Cover Data NPDES National Pollutant Discharge Elimination System NPS Nonpoint Source NRCS Natural Resource Conservation Service NRPC Nashua Regional Planning Commission NSQD National Stormwater Quality Database NVBIA Northern Virginia Building Industry Association NVRC Northern Virginia Regional Commission
Final: 08/30/2017
Sediment TMDLs for Accotink Creek Watershed xi
PADEP Pennsylvania Department of Environmental Protection PCB Polychlorinated Biphenyl PEST Model-Independent Parameter Estimation Package POC Pollutants of Concern PS Point Source Q Flow QA/QC Quality Assurance/Quality Control R2 Coefficient of Determination RA Remaining Allocation SaMS Salt Management Strategy SCS Soil Conservation Service SDR Sediment Delivery Ratio SI Stressor Identification Analysis SPA Stream Physical Assessment SS Suspended Sediment SSURGO Soil Survey Geographic Database STEPL Spreadsheet Tool for the Estimation of Pollutant Loads SWCB State Water Control Board TAC Technical Advisory Committee TMDL Total Maximum Daily Loads TSS Total Suspended Solids UAA Use Attainability Analysis UNT Unnamed Tributary USGS U. S. Geological Survey USLE Universal Soil Loss Equation VDOT Virginia Department of Transportation VDP Vision and Development Plan VPDES Virginia Pollutant Discharge Elimination System VSCI Virginia Stream Condition Index VSMP Virginia Stormwater Management Program WLA Wasteload Allocation WQIF Virginia Water Quality Improvement Fund WQMP Water Quality Management Plan WSSI Wetland Studies and Solutions, Inc.
Final: 08/30/2017
Sediment TMDLs for Accotink Creek Watershed xii
Units of Measure
cfs Cubic feet per second cm Centimeter du/ac Dwelling unit per acre FNU Formazin nephelometric units ft Foot ft/yr Feet per year kg Kilogram kg/m3 Kilogram per cubic meter km Kilometer m Meter m3/s Cubic meter per second mg/l Milligrams per liter MGD Million gallons per day mi Miles mi2 Square mile tons/d Tons per day tons/ft3 Tons per cubic feet tons/yr Tons per year
Final: 08/30/2017
Sediment TMDLs for Accotink Creek Watershed ES-1
Executive Summary
Introduction
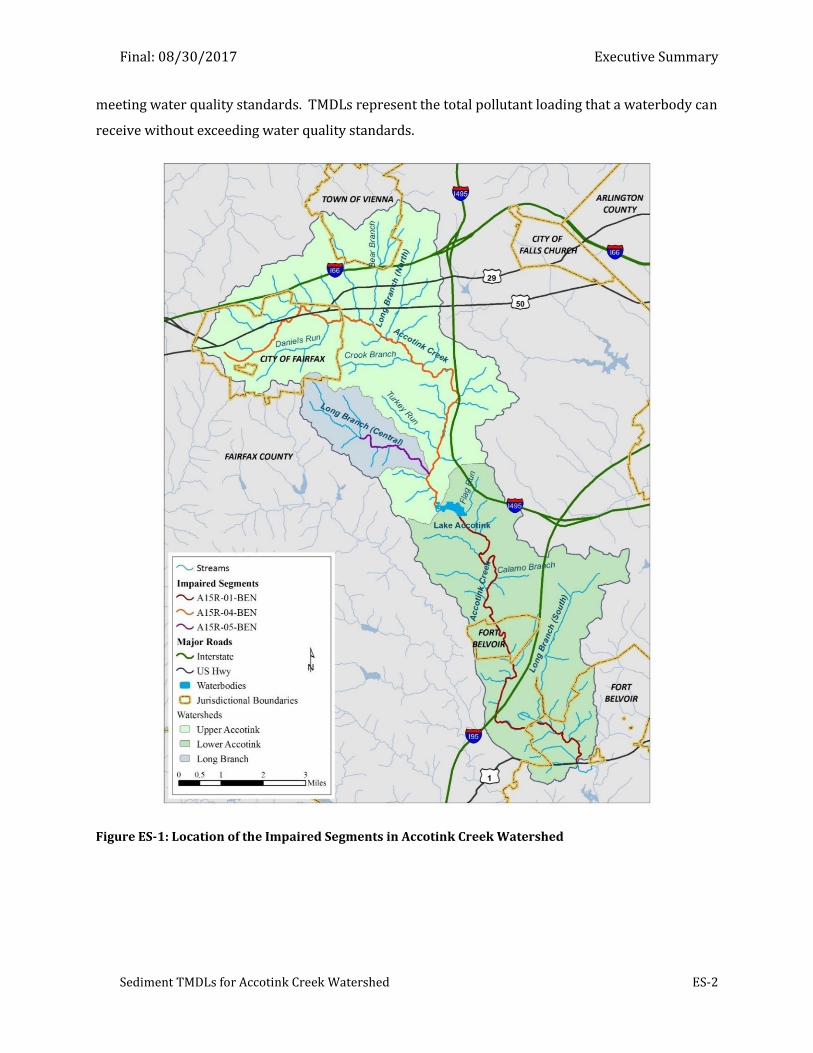
Accotink Creek drains 52 square miles (mi2) of Northern Virginia before entering first Accotink
Bay, then Gunston Cove, an embayment on the tidal Potomac River. Figure ES-1 shows the location
of Accotink Creek. The study area for this project is the watershed draining the non-tidal portion of
Accotink Creek upstream of Route 1, as shown in Figure ES-1.
The Accotink Creek watershed is highly developed. Overall, 87% of the watershed draining to
non-tidal Accotink Creek consists of commercial, industrial, transportation, or residential land.
Impervious surface covers 28% of the non-tidal watershed.
Biological Impairments in Accotink Creek
Virginia Department of Environmental Quality (DEQ) uses biological monitoring of benthic
macroinvertebrate communities as one way to assess the ecological health of wadeable freshwater
streams and to determine whether the Aquatic Life Use is supported. DEQ has conducted biological
assessments of the mainstem of Accotink Creek at four locations. In addition, DEQ has conducted
biological assessments in Long Branch (Central), a tributary of Accotink Creek that joins the
mainstem just upstream of Lake Accotink, an impoundment on Accotink Creek. While there are
three tributaries named Long Branch in the Accotink Creek watershed, the tributary focused on in
this study is Long Branch (Central), hereafter simply referred to as Long Branch. Based on benthic
macroinvertebrate monitoring and assessments in the Accotink Creek watershed, DEQ has placed
Accotink Creek, both above and below Lake Accotink, and Long Branch on Virginia’s List of
Impaired Waters (Category 5 of the Integrated List) because they are not supporting their Aquatic
Life Use. Figure ES-1 shows the location of the impaired stream segments. Hereafter, impaired
segment A15R-01-BEN, as shown in Figure ES-1, will be referred to as lower Accotink Creek,
segment A15R-04-BEN as upper Accotink Creek, and A15R-05-BEN as Long Branch. Table ES-1
summarizes the impairment listings for upper Accotink Creek, lower Accotink Creek, and Long
Branch in Virginia’s 2014 Integrated Report.
Section 303(d) of the Clean Water Act (CWA) and the United States Environmental Protection
Agency’s (EPA) Water Quality Planning and Management Regulations (40 CFR part 130) generally
require states to develop Total Maximum Daily Loads (TMDLs) for waterbodies that are not
Final: 08/30/2017 Executive Summary
Sediment TMDLs for Accotink Creek Watershed ES-2
meeting water quality standards. TMDLs represent the total pollutant loading that a waterbody can
receive without exceeding water quality standards.
Figure ES-1: Location of the Impaired Segments in Accotink Creek Watershed
Final: 08/30/2017 Executive Summary
Sediment TMDLs for Accotink Creek Watershed ES-3
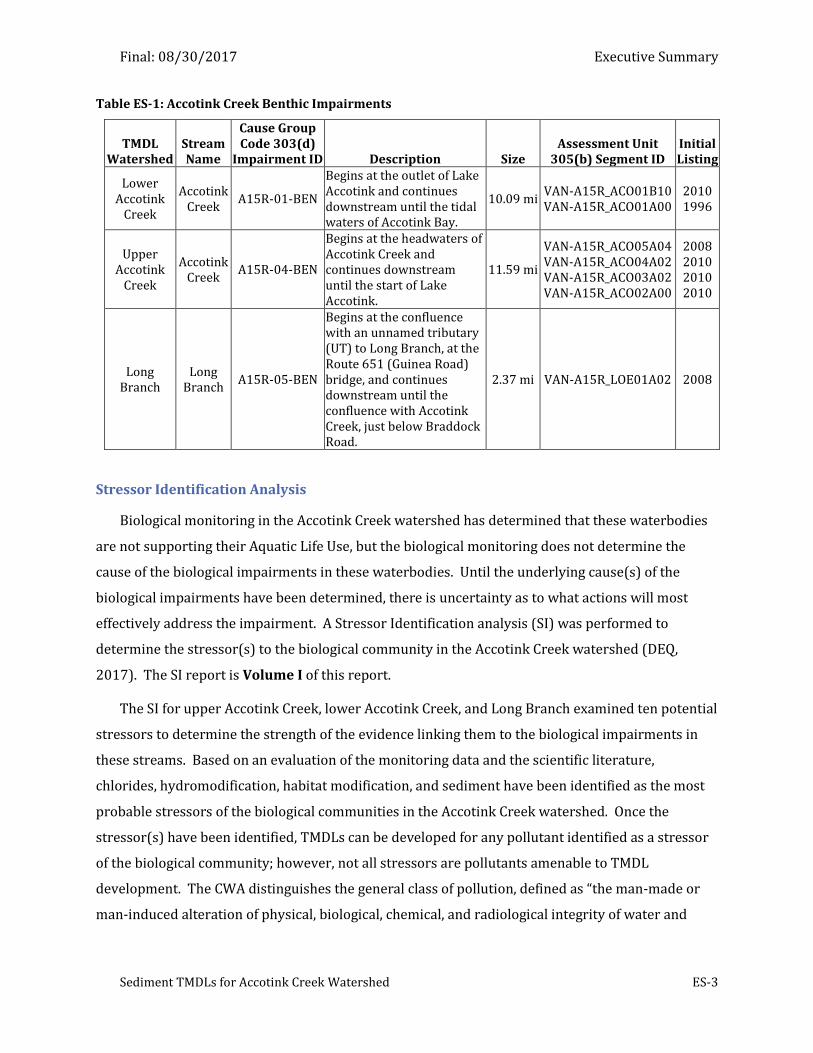
Table ES-1: Accotink Creek Benthic Impairments
TMDL Watershed
Stream Name
Cause Group Code 303(d)
Impairment ID Description Size Assessment Unit
305(b) Segment ID Initial Listing
Lower Accotink
Creek
Accotink Creek
A15R-01-BEN
Begins at the outlet of Lake Accotink and continues downstream until the tidal waters of Accotink Bay.
10.09 mi VAN-A15R_ACO01B10 VAN-A15R_ACO01A00
2010 1996
Upper Accotink
Creek
Accotink Creek
A15R-04-BEN
Begins at the headwaters of Accotink Creek and continues downstream until the start of Lake Accotink.
11.59 mi
VAN-A15R_ACO05A04 VAN-A15R_ACO04A02 VAN-A15R_ACO03A02 VAN-A15R_ACO02A00
2008 2010 2010 2010
Long Branch
Long Branch
A15R-05-BEN
Begins at the confluence with an unnamed tributary (UT) to Long Branch, at the Route 651 (Guinea Road) bridge, and continues downstream until the confluence with Accotink Creek, just below Braddock Road.
2.37 mi VAN-A15R_LOE01A02 2008
Stressor Identification Analysis
Biological monitoring in the Accotink Creek watershed has determined that these waterbodies
are not supporting their Aquatic Life Use, but the biological monitoring does not determine the
cause of the biological impairments in these waterbodies. Until the underlying cause(s) of the
biological impairments have been determined, there is uncertainty as to what actions will most
effectively address the impairment. A Stressor Identification analysis (SI) was performed to
determine the stressor(s) to the biological community in the Accotink Creek watershed (DEQ,
2017). The SI report is Volume I of this report.
The SI for upper Accotink Creek, lower Accotink Creek, and Long Branch examined ten potential
stressors to determine the strength of the evidence linking them to the biological impairments in
these streams. Based on an evaluation of the monitoring data and the scientific literature,
chlorides, hydromodification, habitat modification, and sediment have been identified as the most
probable stressors of the biological communities in the Accotink Creek watershed. Once the
stressor(s) have been identified, TMDLs can be developed for any pollutant identified as a stressor
of the biological community; however, not all stressors are pollutants amenable to TMDL
development. The CWA distinguishes the general class of pollution, defined as “the man-made or
man-induced alteration of physical, biological, chemical, and radiological integrity of water and
Final: 08/30/2017 Executive Summary
Sediment TMDLs for Accotink Creek Watershed ES-4
other media (CWA, Section 502, General Definitions),” from pollutants, which are restricted to
“[d]redged spoil, solid waste, incinerator residue, sewage, garbage, sewage sludge, munitions,
chemical wastes, biological materials, radioactive materials, heat, wrecked or discarded equipment,
rock, sand, cellar dust and industrial, municipal, and agricultural waste discharge into water (CWA,
Section 502, General Definitions).” TMDLs can only be developed for pollutants.
Of the four most probable stressors, only chloride (CL) and sediment are pollutants. TMDLs are
being developed for sediment and chloride for each of the three impaired segments in the Accotink
Creek watershed. The chloride TMDLs are described in Volume III of this report. This volume,
Volume II, describes the development of sediment TMDLs for upper Accotink Creek, lower
Accotink Creek, and Long Branch, to help address the biological impairments in those watersheds.
TMDL Development
Virginia does not have numeric water quality criteria for sediment to protect aquatic life.
TMDLs developed for sediment in Virginia use the reference watershed approach, in which the
sediment loads from unimpaired watersheds, which are similar in other respects to the impaired
watershed, are used to set the TMDL for the impaired watershed. The current implementation of
the reference watershed approach is the AllForX approach (Benham et al., 2014; Yagow et al.;
2015a; Yagow et al., 2015b). An all-forest load multiplier (AllForX) is the ratio of current sediment
loads to the loads which would occur under all-forested conditions. In other words, the AllForX
multiplier is an indication of how much higher current sediment loads are above an undeveloped
condition. These multipliers are calculated for both impaired watersheds and a set of unimpaired
watersheds, and the Virginia Stream Condition Index (VSCI) scores are then regressed against the
AllForX values. Using the regression line, a threshold multiplier is identified for a VSCI score of 60,
which is the assessment threshold that indicates a healthy benthic macroinvertebrate community.
That AllForX threshold, multiplied by the all-forested sediment load of an impaired watershed,
becomes the TMDL endpoint for the impaired watershed.
Loading rates for both the impaired and unimpaired watersheds are determined using the
Generalized Watershed Loading Functions (GWLF) model (Haith and Shoemaker, 1987; Haith et al.,
1992). GWLF is a continuous simulation model that can be used to represent streamflow, sediment
loads, and nitrogen and phosphorus loads from point and nonpoint sources on a watershed basis.
GWLF’s strength is that it uses accepted engineering practices and techniques to calculate key
variables like runoff and erosion. The simulation of runoff is based on the Natural Resource
Final: 08/30/2017 Executive Summary
Sediment TMDLs for Accotink Creek Watershed ES-5
Conservation Service (NRCS) Curve Number method, and the simulation of erosion is based on the
Universal Soil Loss Equation (USLE). AVGWLF, a version of GWLF developed by Pennsylvania State
University (Evans et al., 2003) for use in Pennsylvania’s nonpoint source TMDLs, added a channel
erosion component to the original GWLF model.
GWLF is best characterized as a planning level model that does not require as much input data
as many continuous simulation models, nor does it require the calibration of model parameters.
Although GWLF is supposed to require little or no calibration, the models used for the Accotink
Creek watersheds were adjusted in the following manner:
Hydrology parameters were calibrated using the parameter estimation software, PEST
(Doherty, 2001);
All land uses in Accotink Creek except open space and construction were calibrated to
average event mean concentrations taken from the National Stormwater Quality
Database (NSQD) (Pitt et al., 2004);
Target sediment loads for land under construction were taken from the most recent
Chesapeake Bay Program estimate of sediment exported under current sediment and
erosion controls; and
Total sediment loads were compared to sediment load estimates from Fairfax County’s
Watershed Management Plan for Accotink Creek and to sediment load estimates based
on monitoring data collected at the USGS gauge on Accotink Creek near Annandale
(01654000) and the gauge on Long Branch near Annandale (01654500).
Four GWLF models simulating baseline conditions were developed: a model used primarily to
calibrate the hydrology parameters, which represents the Accotink Creek watershed above the
USGS gauge on Accotink Creek near Annandale (01654000); and a model for each of the three
watersheds draining to the impaired sections of upper Accotink Creek, lower Accotink Creek, and
Long Branch. The model for calibration of hydrology was used to parameterize the three models
for the impaired watersheds. The models for upper Accotink Creek, lower Accotink Creek, and
Long Branch were used to simulate baseline loads for the TMDL calculations for the corresponding
impairments. The upper Accotink Creek model also includes Long Branch, although the TMDL
allocations for Long Branch were excluded from the TMDL allocations for upper Accotink Creek.
The lower Accotink Creek model is simulated separately from the upper Accotink Creek watershed;
sediment loads from the upper Accotink Creek are input into lower Accotink Creek as a point
source after sediment trapping in Lake Accotink is taken into account. An average trapping
Final: 08/30/2017 Executive Summary
Sediment TMDLs for Accotink Creek Watershed ES-6
efficiency of 47% was used for Lake Accotink, based on an analysis performed by Wetland Studies
and Solutions, Inc. (WSSI) (2016) for the Fairfax County Park Authority. All four baseline models
take into account the effect of the current (2015) level of implementation of Best Management
Practices (BMPs).
There are also three GWLF models representing upper Accotink Creek, lower Accotink Creek,
and Long Branch under all-forested conditions. The all-forested models do not include BMP effects.
Both the models simulating baseline conditions and the models simulating all-forested conditions
use the streambank erosion formulation from AVGWLF.
Hydrology Simulation. The simulation period for the four Accotink Creek GWLF models is
April 1, 1996 through March 31, 2016. The hydrology simulation requires daily precipitation and
average daily temperature as inputs. These were obtained from Washington Reagan National
Airport (00013743). The GWLF hydrology simulation was calibrated against monthly flow data
collected at the USGS gauge on Accotink Creek near Annandale (01654000). Because of the
potential for a large degree of local variation in precipitation during extreme events, the daily
precipitation from the Global Historical Climatology Network Daily (GHCND) gauge at Mantua, VA,
was substituted for the precipitation record at Reagan National Airport for three storms: a June,
2006, storm; Tropical Storm Hanna in September, 2008; and Tropical Storm Lee in September
2011.
The PEST optimization, supplemented by the adjustment in monthly evapotranspiration cover
coefficients and the substitution of Mantua precipitation for Reagan National data during extreme
events, produced a satisfactory simulation of monthly flow volumes, when compared to the
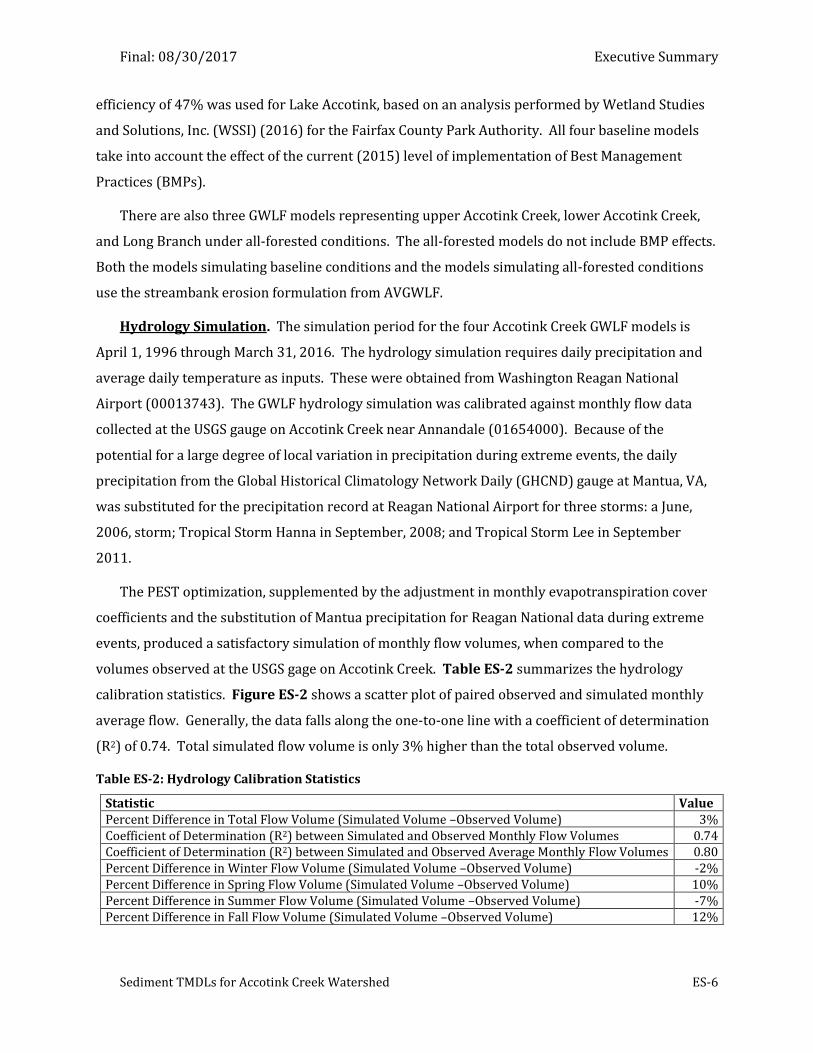
volumes observed at the USGS gage on Accotink Creek. Table ES-2 summarizes the hydrology
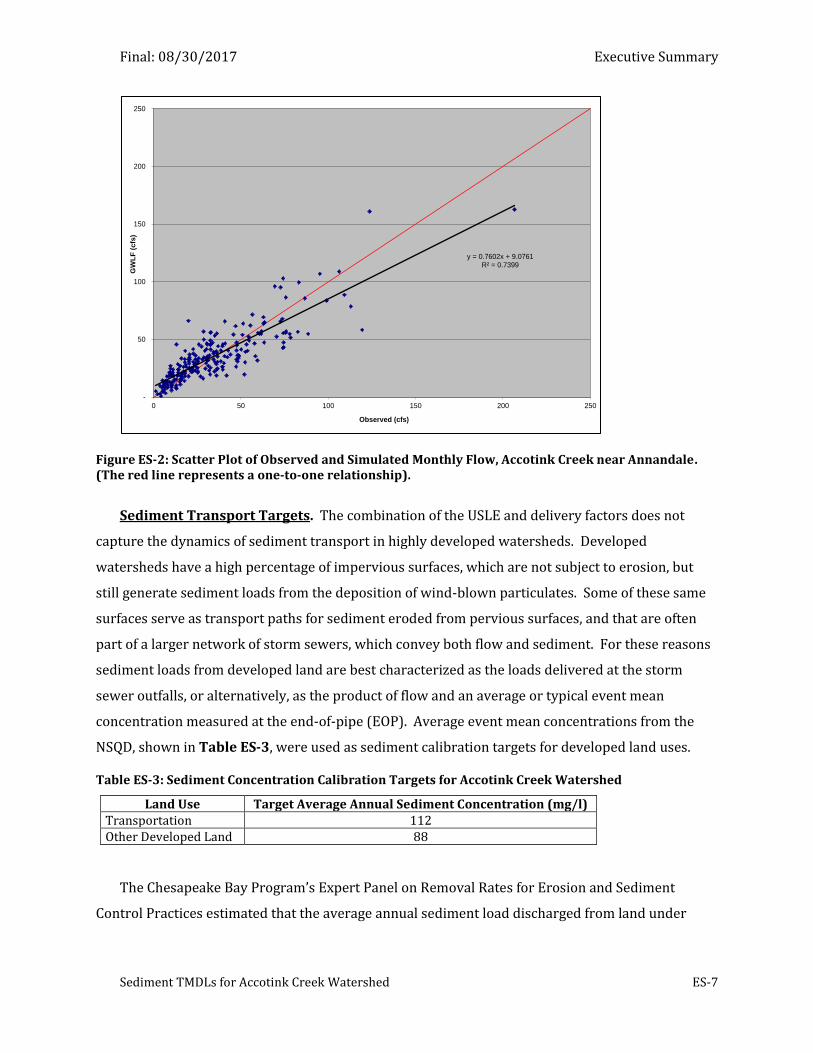
calibration statistics. Figure ES-2 shows a scatter plot of paired observed and simulated monthly
average flow. Generally, the data falls along the one-to-one line with a coefficient of determination
(R2) of 0.74. Total simulated flow volume is only 3% higher than the total observed volume.
Table ES-2: Hydrology Calibration Statistics
Statistic Value Percent Difference in Total Flow Volume (Simulated Volume –Observed Volume) 3% Coefficient of Determination (R2) between Simulated and Observed Monthly Flow Volumes 0.74 Coefficient of Determination (R2) between Simulated and Observed Average Monthly Flow Volumes 0.80 Percent Difference in Winter Flow Volume (Simulated Volume –Observed Volume) -2% Percent Difference in Spring Flow Volume (Simulated Volume –Observed Volume) 10% Percent Difference in Summer Flow Volume (Simulated Volume –Observed Volume) -7% Percent Difference in Fall Flow Volume (Simulated Volume –Observed Volume) 12%
Final: 08/30/2017 Executive Summary
Sediment TMDLs for Accotink Creek Watershed ES-7
Figure ES-2: Scatter Plot of Observed and Simulated Monthly Flow, Accotink Creek near Annandale. (The red line represents a one-to-one relationship).
Sediment Transport Targets. The combination of the USLE and delivery factors does not
capture the dynamics of sediment transport in highly developed watersheds. Developed
watersheds have a high percentage of impervious surfaces, which are not subject to erosion, but
still generate sediment loads from the deposition of wind-blown particulates. Some of these same
surfaces serve as transport paths for sediment eroded from pervious surfaces, and that are often
part of a larger network of storm sewers, which convey both flow and sediment. For these reasons
sediment loads from developed land are best characterized as the loads delivered at the storm
sewer outfalls, or alternatively, as the product of flow and an average or typical event mean
concentration measured at the end-of-pipe (EOP). Average event mean concentrations from the
NSQD, shown in Table ES-3, were used as sediment calibration targets for developed land uses.
Table ES-3: Sediment Concentration Calibration Targets for Accotink Creek Watershed
Land Use Target Average Annual Sediment Concentration (mg/l) Transportation 112 Other Developed Land 88
The Chesapeake Bay Program’s Expert Panel on Removal Rates for Erosion and Sediment
Control Practices estimated that the average annual sediment load discharged from land under
y = 0.7602x + 9.0761R² = 0.7399
-
50
100
150
200
250
0 50 100 150 200 250
GW
LF
(c
fs)
Observed (cfs)
Final: 08/30/2017 Executive Summary
Sediment TMDLs for Accotink Creek Watershed ES-8
construction operating under current erosion and sediment control regulations is 1.8
tons/acre/year (Clark et al., 2014).
Comparison of Estimates of Total Sediment Load. Total sediment loads were estimated
using monitoring data collected at the USGS gauge on Accotink Creek near Annandale (01654000)
and the gauge on Long Branch near Annandale (01654500) using a two-step method. The first step
is to estimate a regression model that predicts suspended sediment concentration as a function of
flow and/or turbidity; the second step is to estimate loads as the product of the estimated
concentrations, measured flow or turbidity, and suitable conversion factors1. For Accotink Creek, a
regression model was developed relating suspended sediment concentrations to instantaneous
flows, and, using that model, sediment loads were estimated from continuous flow monitoring data.
For Long Branch, the regression model related suspended sediment concentrations to both
turbidity and flow, so that sediment loads could be estimated from continuous monitoring data of
flow and turbidity.
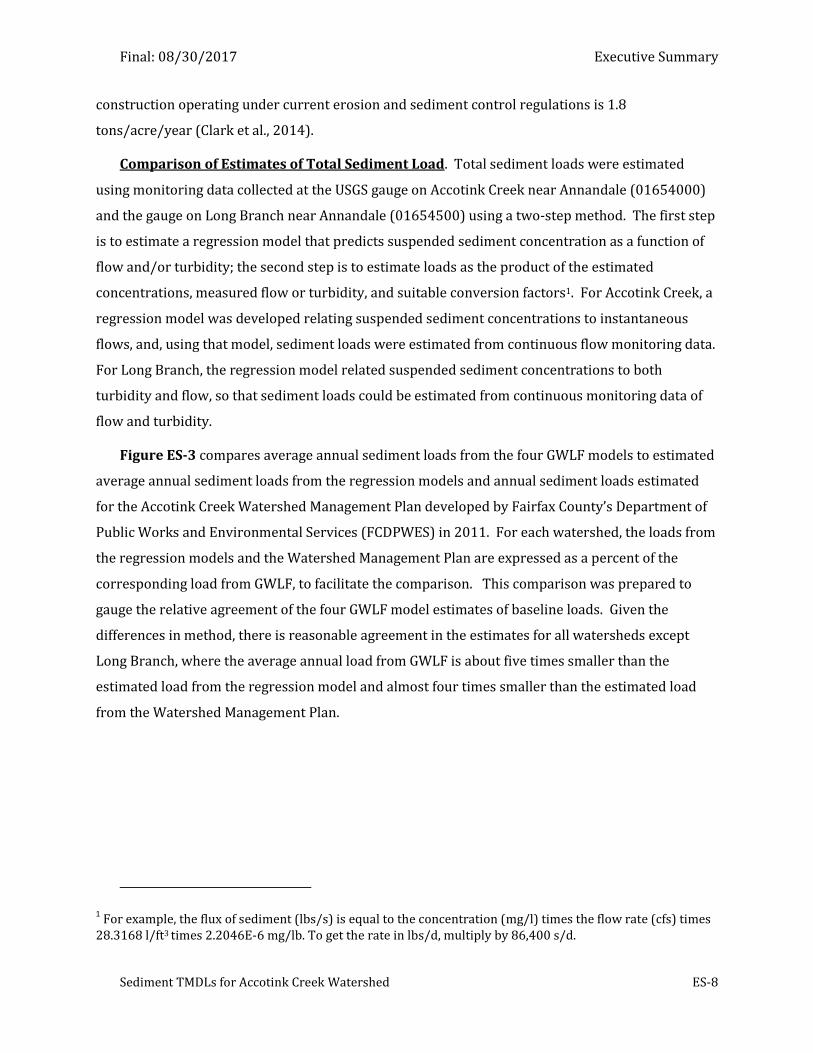
Figure ES-3 compares average annual sediment loads from the four GWLF models to estimated
average annual sediment loads from the regression models and annual sediment loads estimated
for the Accotink Creek Watershed Management Plan developed by Fairfax County’s Department of
Public Works and Environmental Services (FCDPWES) in 2011. For each watershed, the loads from
the regression models and the Watershed Management Plan are expressed as a percent of the
corresponding load from GWLF, to facilitate the comparison. This comparison was prepared to
gauge the relative agreement of the four GWLF model estimates of baseline loads. Given the
differences in method, there is reasonable agreement in the estimates for all watersheds except
Long Branch, where the average annual load from GWLF is about five times smaller than the
estimated load from the regression model and almost four times smaller than the estimated load
from the Watershed Management Plan.
1 For example, the flux of sediment (lbs/s) is equal to the concentration (mg/l) times the flow rate (cfs) times
28.3168 l/ft3 times 2.2046E-6 mg/lb. To get the rate in lbs/d, multiply by 86,400 s/d.
Final: 08/30/2017 Executive Summary
Sediment TMDLs for Accotink Creek Watershed ES-9
Figure ES-3: Comparison of Sediment Load Estimates in Accotink Creek Watershed2
The difference between the Watershed Management Plan’s estimate and GWLF for Long Branch
seems to reside in their estimates of streambank erosion. For Long Branch, GWLF estimates that
the average annual sediment load from land-based sources is 282 tons/yr, which is comparable to
the estimate of land-based sources in the Watershed Management Plan of 312 tons/yr. The GWLF
streambank erosion rate, on the other hand, is over five times smaller than the erosion rate
calculated for the Management Plan.
To bring the GWLF loads for Long Branch in line with the other estimates, the streambank
erosion rate in Long Branch was adjusted so that the average annual load equals the adjusted
average annual load estimated by the regression model. The streambank adjustment factor for
Long Branch was 7.45. The streambank adjustment factor was also applied to streambank erosion
loads under the all-forested conditions. All Long Branch sediment loads presented in the remainder
of the Executive Summary have the streambank adjustment factor applied.
GWLF Results for Accotink Creek. Table ES-4 shows the average annual sediment load for
upper Accotink Creek, lower Accotink Creek, and Long Branch under baseline conditions and all-
2 GWLF loads shown here do not have the streambank adjustment factor applied.
0%
100%
200%
300%
400%
500%
600%
Accotink Creek near Annandale Long Branch Upper Accotink Creek Lower Accotink Creek
Sed
ime
nt
Load
Exp
ress
ed
as
Pe
rce
nt
of
Co
rre
spo
nd
ing
GW
LF L
oad
GWLF Watershed Management Plan Regression
Final: 08/30/2017 Executive Summary
Sediment TMDLs for Accotink Creek Watershed ES-10
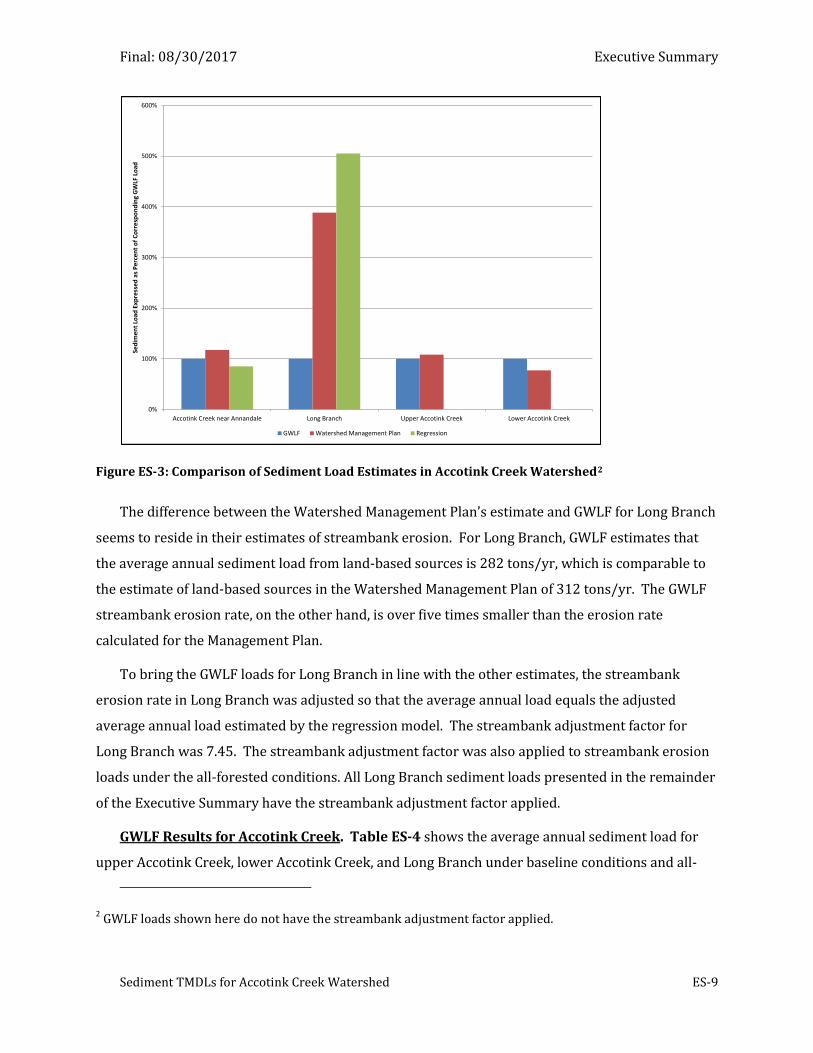
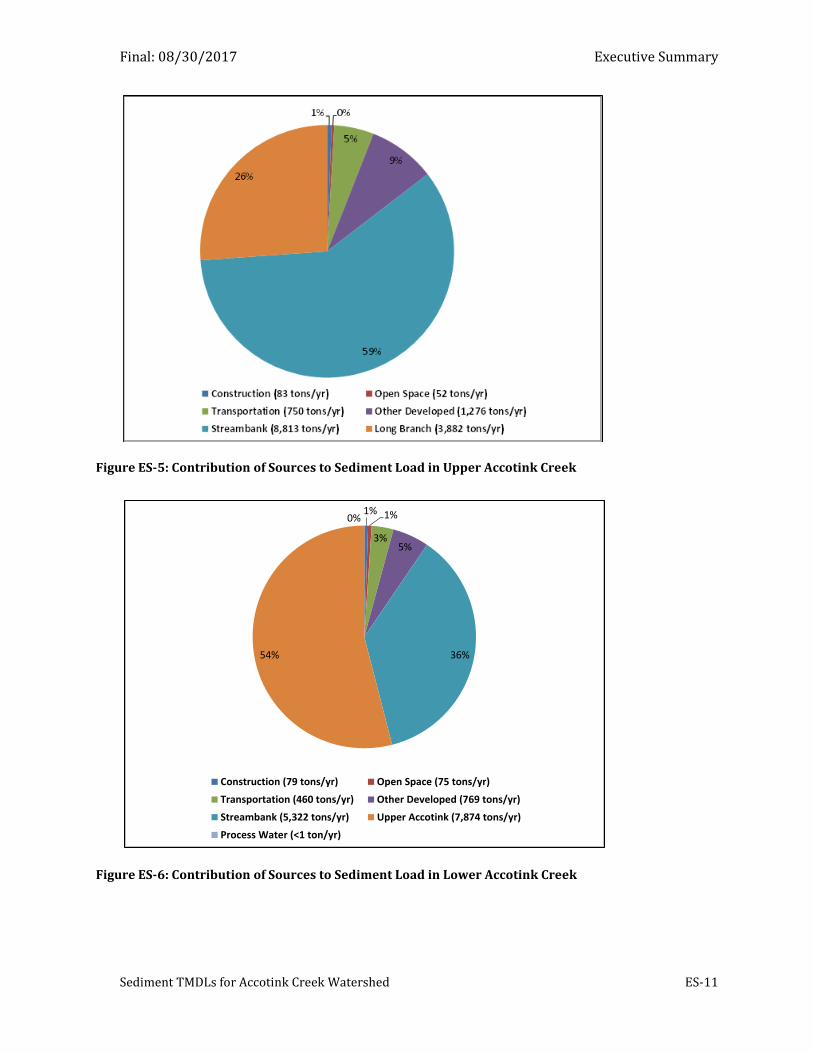
forested conditions. It also shows the AllForX multiplier for each impairment. Figures ES-4, ES-5,
and ES-6 show the contribution of sources to total baseline load, for Long Branch, upper Accotink
Creek, and lower Accotink Creek, respectively. The dominant source of sediment generated in each
watershed is streambank erosion.
Table ES-4: Average Annual Sediment Loads in the Accotink Creek Watershed
Watershed Baseline Conditions (tons/yr)
All-Forested Conditions (tons/yr)
AllForX (unitless ratio)
Upper Accotink Creek1 14,856 811 18.31 Lower Accotink Creek2 14,579 1,241 11.75 Long Branch 3,882 226 17.16 1Includes loads from Long Branch 2Includes loads from Upper Accotink Creek and Long Branch with a 47% reduction due to trapping of
sediment in Lake Accotink under the baseline condition
Figure ES-4: Contribution of Sources to Sediment Load in Long Branch
0% 0%
3%4%
93%
Construction (2 tons/yr) Open Space (7 tons/yr)
Transportation (121 tons/yr) Other Developed (175 tons/yr)
Streambank (3,595 tons/yr)
Final: 08/30/2017 Executive Summary
Sediment TMDLs for Accotink Creek Watershed ES-11
Figure ES-5: Contribution of Sources to Sediment Load in Upper Accotink Creek
Figure ES-6: Contribution of Sources to Sediment Load in Lower Accotink Creek
1% 1%
3%5%
36%54%
0%
Construction (79 tons/yr) Open Space (75 tons/yr)
Transportation (460 tons/yr) Other Developed (769 tons/yr)
Streambank (5,322 tons/yr) Upper Accotink (7,874 tons/yr)
Process Water (<1 ton/yr)
Final: 08/30/2017 Executive Summary
Sediment TMDLs for Accotink Creek Watershed ES-12
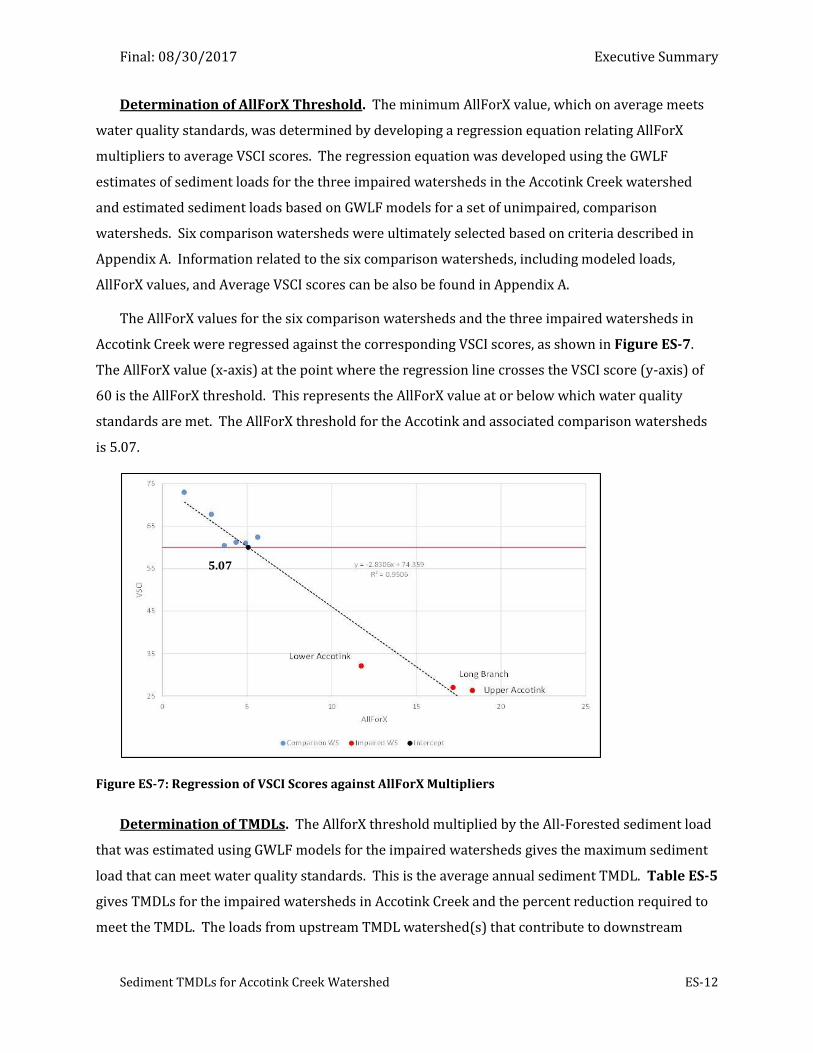
Determination of AllForX Threshold. The minimum AllForX value, which on average meets
water quality standards, was determined by developing a regression equation relating AllForX
multipliers to average VSCI scores. The regression equation was developed using the GWLF
estimates of sediment loads for the three impaired watersheds in the Accotink Creek watershed
and estimated sediment loads based on GWLF models for a set of unimpaired, comparison
watersheds. Six comparison watersheds were ultimately selected based on criteria described in
Appendix A. Information related to the six comparison watersheds, including modeled loads,
AllForX values, and Average VSCI scores can be also be found in Appendix A.
The AllForX values for the six comparison watersheds and the three impaired watersheds in
Accotink Creek were regressed against the corresponding VSCI scores, as shown in Figure ES-7.
The AllForX value (x-axis) at the point where the regression line crosses the VSCI score (y-axis) of
60 is the AllForX threshold. This represents the AllForX value at or below which water quality
standards are met. The AllForX threshold for the Accotink and associated comparison watersheds
is 5.07.
Figure ES-7: Regression of VSCI Scores against AllForX Multipliers
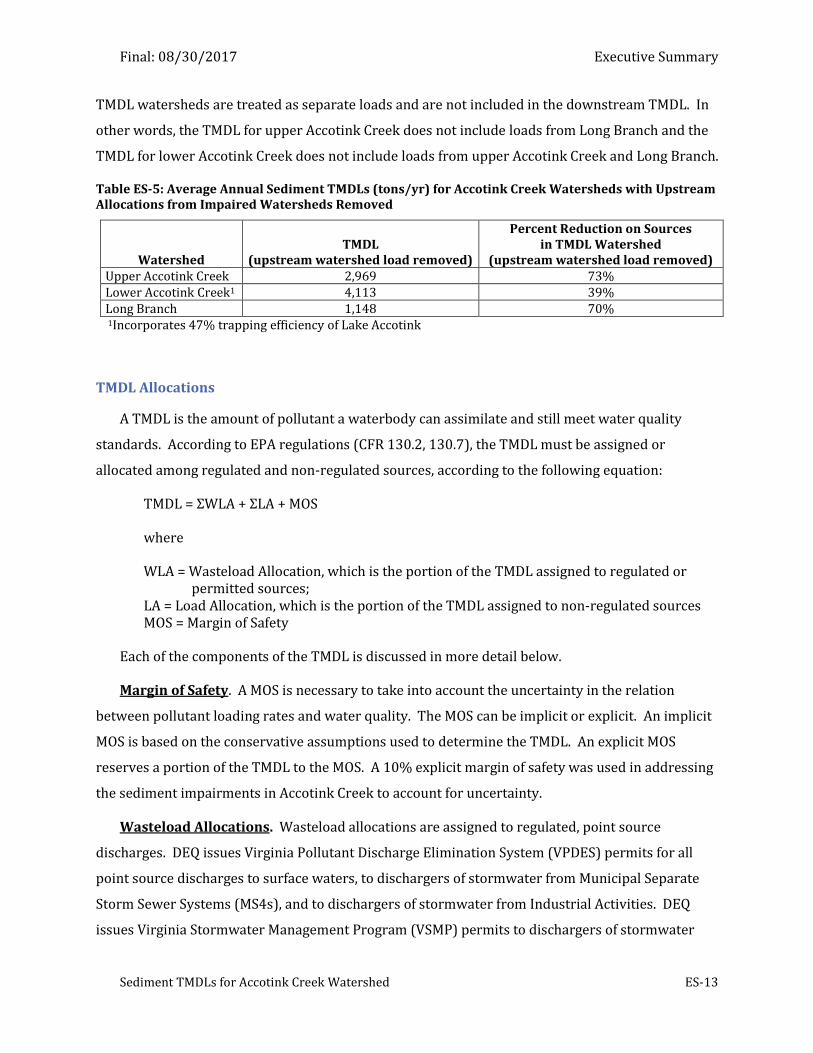
Determination of TMDLs. The AllforX threshold multiplied by the All-Forested sediment load
that was estimated using GWLF models for the impaired watersheds gives the maximum sediment
load that can meet water quality standards. This is the average annual sediment TMDL. Table ES-5
gives TMDLs for the impaired watersheds in Accotink Creek and the percent reduction required to
meet the TMDL. The loads from upstream TMDL watershed(s) that contribute to downstream
5.07
Final: 08/30/2017 Executive Summary
Sediment TMDLs for Accotink Creek Watershed ES-13
TMDL watersheds are treated as separate loads and are not included in the downstream TMDL. In
other words, the TMDL for upper Accotink Creek does not include loads from Long Branch and the
TMDL for lower Accotink Creek does not include loads from upper Accotink Creek and Long Branch.
Table ES-5: Average Annual Sediment TMDLs (tons/yr) for Accotink Creek Watersheds with Upstream Allocations from Impaired Watersheds Removed
Watershed TMDL
(upstream watershed load removed)
Percent Reduction on Sources in TMDL Watershed
(upstream watershed load removed) Upper Accotink Creek 2,969 73% Lower Accotink Creek1 4,113 39% Long Branch 1,148 70% 1Incorporates 47% trapping efficiency of Lake Accotink
TMDL Allocations
A TMDL is the amount of pollutant a waterbody can assimilate and still meet water quality
standards. According to EPA regulations (CFR 130.2, 130.7), the TMDL must be assigned or
allocated among regulated and non-regulated sources, according to the following equation:
TMDL = ΣWLA + ΣLA + MOS
where
WLA = Wasteload Allocation, which is the portion of the TMDL assigned to regulated or permitted sources;
LA = Load Allocation, which is the portion of the TMDL assigned to non-regulated sources MOS = Margin of Safety
Each of the components of the TMDL is discussed in more detail below.
Margin of Safety. A MOS is necessary to take into account the uncertainty in the relation
between pollutant loading rates and water quality. The MOS can be implicit or explicit. An implicit
MOS is based on the conservative assumptions used to determine the TMDL. An explicit MOS
reserves a portion of the TMDL to the MOS. A 10% explicit margin of safety was used in addressing
the sediment impairments in Accotink Creek to account for uncertainty.
Wasteload Allocations. Wasteload allocations are assigned to regulated, point source
discharges. DEQ issues Virginia Pollutant Discharge Elimination System (VPDES) permits for all
point source discharges to surface waters, to dischargers of stormwater from Municipal Separate
Storm Sewer Systems (MS4s), and to dischargers of stormwater from Industrial Activities. DEQ
issues Virginia Stormwater Management Program (VSMP) permits to dischargers of stormwater
Final: 08/30/2017 Executive Summary
Sediment TMDLs for Accotink Creek Watershed ES-14
from Construction Activities. There are two broad types of discharge permits; individual permits
and general permits.
DEQ issues individual permits to both municipal and industrial facilities. Permit requirements,
special conditions, effluent limitations and monitoring requirements are determined for each
facility on a site specific basis in order to meet applicable water quality standards. General permits
are written for a general class of dischargers where operations and activities are similar. These
permits are also prepared to protect and maintain applicable water quality standards. In Virginia,
general permits are adopted as regulations.
Within the Accotink Creek watershed, there are seven individual permits authorizing
discharges to surface waters. Five of the individual permits are classified as industrial discharges.
Four of these permits govern the discharges from bulk petroleum storage facilities. One permit
governs the industrial stormwater discharges from Fort Belvoir. Lastly, there are two individual
permits issued to Municipal Separate Storm Sewer Systems (MS4) which govern the stormwater
discharges from municipal operations. Fairfax County currently has an individual permit; it is
anticipated that the Virginia Department of Transportation (VDOT) will have an individual permit
by the completion of this TMDL study.
There are discharges from eight general permit categories authorized in the Accotink Creek
watershed. These include:
three (3) Vehicle Wash and Laundry facilities;
one (1) Non-contact Cooling Water permittees;
three (3) Concrete Products Facilities;
two (2) permittees under the Domestic Sewage Discharge of Less Than or Equal to
1,000 Gallons per Day;
two (2) facilities authorized under the permit for Petroleum Contaminated Sites and
Hydrostatic Tests;
12 permits for Discharges of Stormwater Associated with Industrial Activity;
numerous transitory permits for stormwater discharges associated with land
disturbance or construction activities;
five (5) MS4 general permits issued to either small or non-traditional MS4 entities.
Not all of the authorized general permit discharges are considered to discharge the pollutant of
concern (e.g. sediment) in significant amounts which may cause or contribute to the impairments in
Final: 08/30/2017 Executive Summary
Sediment TMDLs for Accotink Creek Watershed ES-15
the Accotink Creek watershed. Accordingly, insignificant discharges are not assigned wasteload
allocations. Additionally, there is a distinction recognized throughout this document that
authorized discharges may result from stormwater (e.g. precipitation) and/or process water. An
example of a process water discharge is that resulting from the mixing and preparing of concrete
products, or the blow-down from a heating and air conditioning ventilation system. These
discharges are not related to a storm event.
The following sources will receive sediment wasteload allocations:
Municipal separate storm sewer systems (MS4s) discharges authorized under both
individual and general permits;
Individual VPDES permitted facilities;
Industrial stormwater discharges authorized under the general permit as contained in
9VAC25-151 (VAR05) - Discharges of Stormwater Associated with Industrial Activity;
Concrete product facilities authorized to discharge under the general permit 9VAC25-
193 (VAG11) - Concrete Products Facilities;
Carwash facilities authorized to discharge under the general permit 9VAC25-194
(VAG75) - Vehicle Wash and Laundry Facilities;
Domestic sewage discharges less than 1000 gallons per day authorized under 9VAC25-
110 (VAG40) - Domestic Sewage Discharges of Less Than or Equal To 1,000 Gallons Per
Day;
Stormwater discharges associated with land disturbance, or construction activities,
authorized under 9VAC25-880 - General VPDES Permit for Discharges of Stormwater
from Construction Activities.
Note that the regulatory citations for the general permits noted above are current as of the
preparation of this TMDL. The established WLA for each facility is applicable to the regulated
discharge(s) and shall remain valid should the regulatory citation for a given permit category be
updated or changed in the future.
Additionally, it is important to note that the WLA also includes an allocation for future growth.
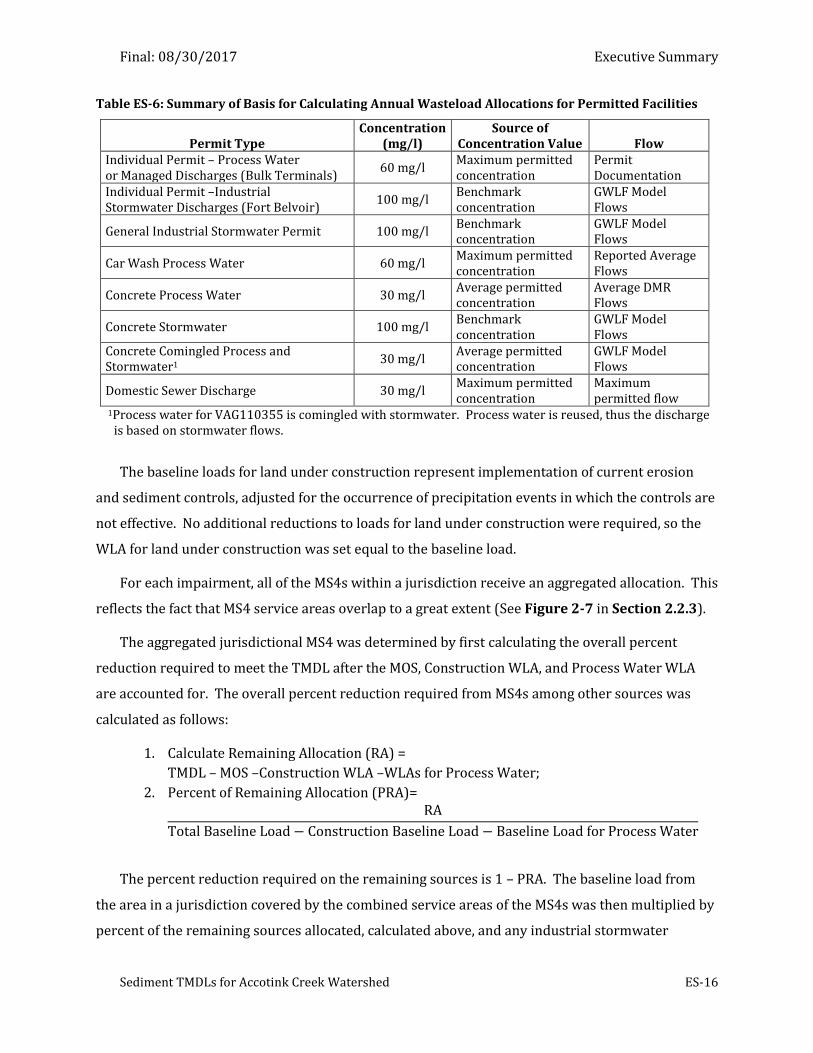
For industrial stormwater discharges and process water discharges from permitted facilities,
the allocation is determined as the product of an established concentration and the estimated
average annual flow. The sources for the concentration and flows are discussed below, and
summarized in Table ES-6.
Final: 08/30/2017 Executive Summary
Sediment TMDLs for Accotink Creek Watershed ES-16
Table ES-6: Summary of Basis for Calculating Annual Wasteload Allocations for Permitted Facilities
Permit Type Concentration
(mg/l) Source of
Concentration Value Flow Individual Permit – Process Water or Managed Discharges (Bulk Terminals)
60 mg/l Maximum permitted concentration
Permit Documentation
Individual Permit –Industrial Stormwater Discharges (Fort Belvoir)
100 mg/l Benchmark concentration
GWLF Model Flows
General Industrial Stormwater Permit 100 mg/l Benchmark concentration
GWLF Model Flows
Car Wash Process Water 60 mg/l Maximum permitted concentration
Reported Average Flows
Concrete Process Water 30 mg/l Average permitted concentration
Average DMR Flows
Concrete Stormwater 100 mg/l Benchmark concentration
GWLF Model Flows
Concrete Comingled Process and Stormwater1
30 mg/l Average permitted concentration
GWLF Model Flows
Domestic Sewer Discharge 30 mg/l Maximum permitted concentration
Maximum permitted flow
1Process water for VAG110355 is comingled with stormwater. Process water is reused, thus the discharge is based on stormwater flows.
The baseline loads for land under construction represent implementation of current erosion
and sediment controls, adjusted for the occurrence of precipitation events in which the controls are
not effective. No additional reductions to loads for land under construction were required, so the
WLA for land under construction was set equal to the baseline load.
For each impairment, all of the MS4s within a jurisdiction receive an aggregated allocation. This
reflects the fact that MS4 service areas overlap to a great extent (See Figure 2-7 in Section 2.2.3).
The aggregated jurisdictional MS4 was determined by first calculating the overall percent
reduction required to meet the TMDL after the MOS, Construction WLA, and Process Water WLA
are accounted for. The overall percent reduction required from MS4s among other sources was
calculated as follows:
1. Calculate Remaining Allocation (RA) =
TMDL – MOS –Construction WLA –WLAs for Process Water;
2. Percent of Remaining Allocation (PRA)= RA
Total Baseline Load − Construction Baseline Load − Baseline Load for Process Water
The percent reduction required on the remaining sources is 1 – PRA. The baseline load from
the area in a jurisdiction covered by the combined service areas of the MS4s was then multiplied by
percent of the remaining sources allocated, calculated above, and any industrial stormwater
Final: 08/30/2017 Executive Summary
Sediment TMDLs for Accotink Creek Watershed ES-17
allocations from facilities within the combined service area in that jurisdiction were subtracted
from the product, to obtain the final aggregated MS4 WLA for that jurisdiction. In other words
3. MS4 Allocation = PRA*MS4 Baseline Load – Industrial Stormwater Allocation within
combined service area
Baseline loads within a combined service area were determined from the GWLF model
simulation. Land-use loads were determined using the acreage of land use in the combined service
area. Construction loads were excluded from MS4 baseline loads, because the WLA for land under
construction applies to not just current but future land disturbance activity and therefore it cannot
be determined whether that activity will take place inside of a service area. Sediment loads from
streambank erosion were allocated to MS4s (or to the LA) in proportion to the percent of the total
impervious surface in the impaired watershed that was in the combined service area in each
jurisdiction. Impervious area, rather than total area, was used because impervious surfaces are
primarily responsible for the increased magnitude and frequency of peak flow events which
reshape stream channels in developed areas.
In the upper Accotink Creek and lower Accotink Creek watersheds, future growth was
accounted for by setting aside 5% of the TMDL for the creation of new point sources and any
growth in MS4 service areas or other regulated stormwater. A future growth of 5% was chosen due
to the large proportion of these watersheds that are already covered by MS4 service areas and the
anticipated expansion in regulated stormwater. However, in the Long Branch watershed, since
there is little room for MS4s or other regulated stormwater to grow, a future growth of 1% of the
TMDL was used to account for any future growth in point sources. Most of these watersheds are
highly developed. Therefore, any potential expansion of an MS4 service area or other regulated
stormwater would not likely entail a change in existing land-use. Rather, it would simply be a
reallocation of loadings from the LA portion of the TMDL to the WLA component. Accordingly, in all
three watersheds the future growth was taken from the LA and provides flexibility to the
permitting authority to implement changes to regulated stormwater as they occur over time.
Load Allocation. The load allocation primarily covers loads from areas outside either MS4
service areas or the drainage areas to industrial stormwater outfalls. The formula for the LA is
LA = TMDL – MOS – WLA
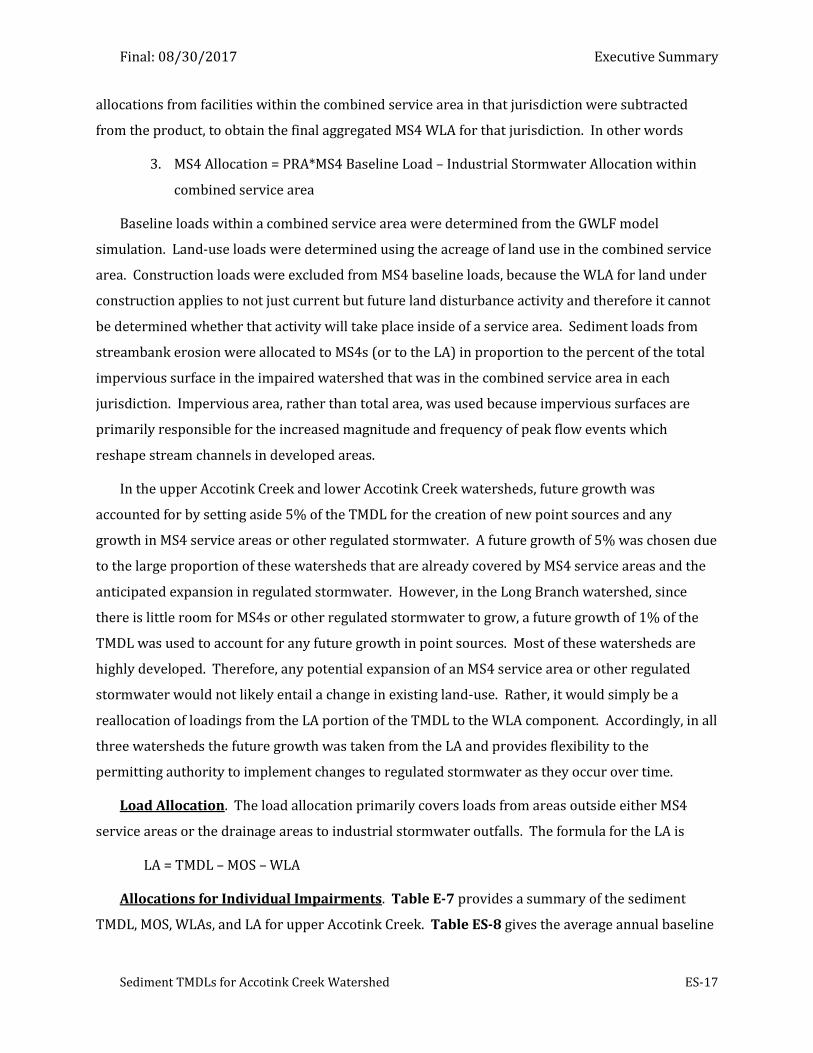
Allocations for Individual Impairments. Table E-7 provides a summary of the sediment
TMDL, MOS, WLAs, and LA for upper Accotink Creek. Table ES-8 gives the average annual baseline
Final: 08/30/2017 Executive Summary
Sediment TMDLs for Accotink Creek Watershed ES-18
MS4 loads, aggregated MS4 WLAs, and MS4 percent reduction from baseline conditions. Table ES-
9 gives the wasteload allocations for facilities for permitted process water and permitted
stormwater. Table ES-10 gives the average annual baseline loads for nonregulated lands by source
type, in addition to the LAs and percent reduction from baseline conditions by source type.
Table ES-7: Upper Accotink Creek Average Annual TMDL Allocations
Source Load (tons/yr) Percent of TMDL
Total WLA 2,338 79%
City of Fairfax Aggregate MS4 WLA 634 21%
Fairfax County Aggregate MS4 WLA 1,282 43%
Town of Vienna Aggregate MS4 WLA 174 6%
Total Process Water WLA <1 <1%
Total Industrial Stormwater WLA 16 1%
Construction 83 3%
Future Growth 148 5%
LA 334 11%
MOS 297 10%
TMDL (not including Long Branch) 2,969 100%
Long Branch Upstream TMDL 1,148 NA1
Total TMDL (including Long Branch) 4,116 NA1
1Not Applicable
Table ES-8: Upper Accotink Creek Aggregated MS4 Wasteload Allocations
Jurisdiction Permit No Facility Name
Baseline Load
(tons/yr) WLA
(tons/yr) Percent
Reduction
Fairfax County
VA0088587 Fairfax County
5,394 1,282 76% VA0092975
Virginia Department of Transportation
VAR040095 Northern Virginia Community College
VAR040104 Fairfax County Public Schools
City of Fairfax VA0092975
Virginia Department of Transportation 2,667 634 76%
VAR040064 City of Fairfax
Town of Vienna VA0092975
Virginia Department of Transportation 733 174 76%
VAR040066 Town of Vienna
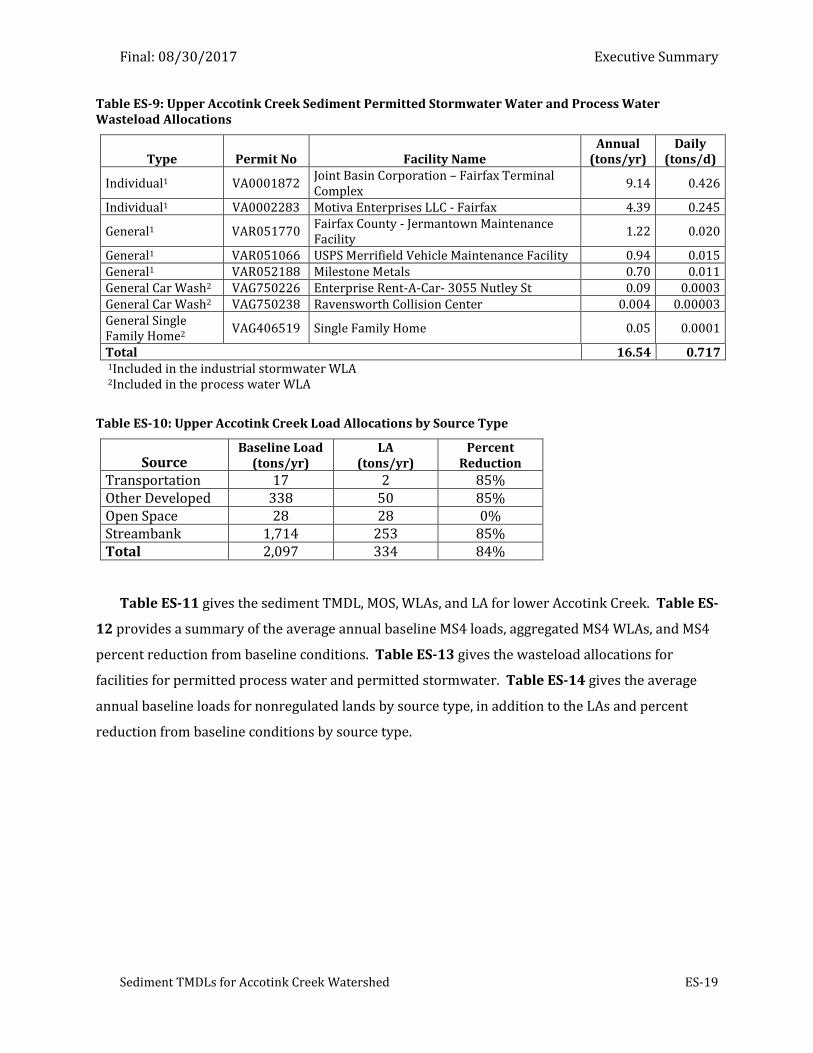
Final: 08/30/2017 Executive Summary
Sediment TMDLs for Accotink Creek Watershed ES-19
Table ES-9: Upper Accotink Creek Sediment Permitted Stormwater Water and Process Water Wasteload Allocations
Type Permit No Facility Name Annual
(tons/yr) Daily
(tons/d)
Individual1 VA0001872 Joint Basin Corporation – Fairfax Terminal Complex
9.14 0.426
Individual1 VA0002283 Motiva Enterprises LLC - Fairfax 4.39 0.245
General1 VAR051770 Fairfax County - Jermantown Maintenance Facility
1.22 0.020
General1 VAR051066 USPS Merrifield Vehicle Maintenance Facility 0.94 0.015 General1 VAR052188 Milestone Metals 0.70 0.011 General Car Wash2 VAG750226 Enterprise Rent-A-Car- 3055 Nutley St 0.09 0.0003 General Car Wash2 VAG750238 Ravensworth Collision Center 0.004 0.00003 General Single Family Home2
VAG406519 Single Family Home 0.05 0.0001
Total 16.54 0.717 1Included in the industrial stormwater WLA 2Included in the process water WLA
Table ES-10: Upper Accotink Creek Load Allocations by Source Type
Source Baseline Load
(tons/yr) LA
(tons/yr) Percent
Reduction
Transportation 17 2 85% Other Developed 338 50 85% Open Space 28 28 0% Streambank 1,714 253 85% Total 2,097 334 84%
Table ES-11 gives the sediment TMDL, MOS, WLAs, and LA for lower Accotink Creek. Table ES-
12 provides a summary of the average annual baseline MS4 loads, aggregated MS4 WLAs, and MS4
percent reduction from baseline conditions. Table ES-13 gives the wasteload allocations for
facilities for permitted process water and permitted stormwater. Table ES-14 gives the average
annual baseline loads for nonregulated lands by source type, in addition to the LAs and percent
reduction from baseline conditions by source type.
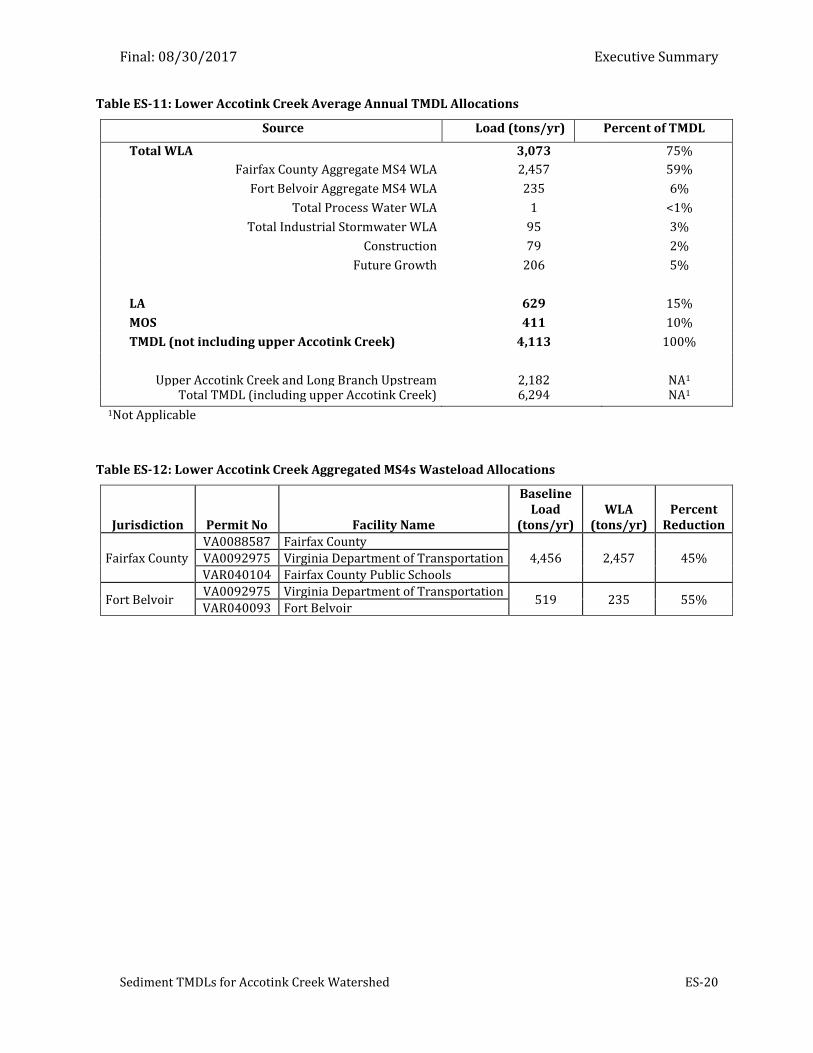
Final: 08/30/2017 Executive Summary
Sediment TMDLs for Accotink Creek Watershed ES-20
Table ES-11: Lower Accotink Creek Average Annual TMDL Allocations
Source Load (tons/yr) Percent of TMDL
Total WLA 3,073 75%
Fairfax County Aggregate MS4 WLA 2,457 59%
Fort Belvoir Aggregate MS4 WLA 235 6%
Total Process Water WLA 1 <1%
Total Industrial Stormwater WLA 95 3%
Construction 79 2%
Future Growth 206 5%
LA 629 15%
MOS 411 10%
TMDL (not including upper Accotink Creek) 4,113 100%
Upper Accotink Creek and Long Branch Upstream
TMDLs
2,182 NA1 Total TMDL (including upper Accotink Creek) 6,294 NA1
1Not Applicable
Table ES-12: Lower Accotink Creek Aggregated MS4s Wasteload Allocations
Jurisdiction Permit No Facility Name
Baseline Load
(tons/yr) WLA
(tons/yr) Percent
Reduction
Fairfax County
VA0088587 Fairfax County
4,456 2,457 45% VA0092975 Virginia Department of Transportation
VAR040104 Fairfax County Public Schools
Fort Belvoir VA0092975 Virginia Department of Transportation
519 235 55% VAR040093 Fort Belvoir
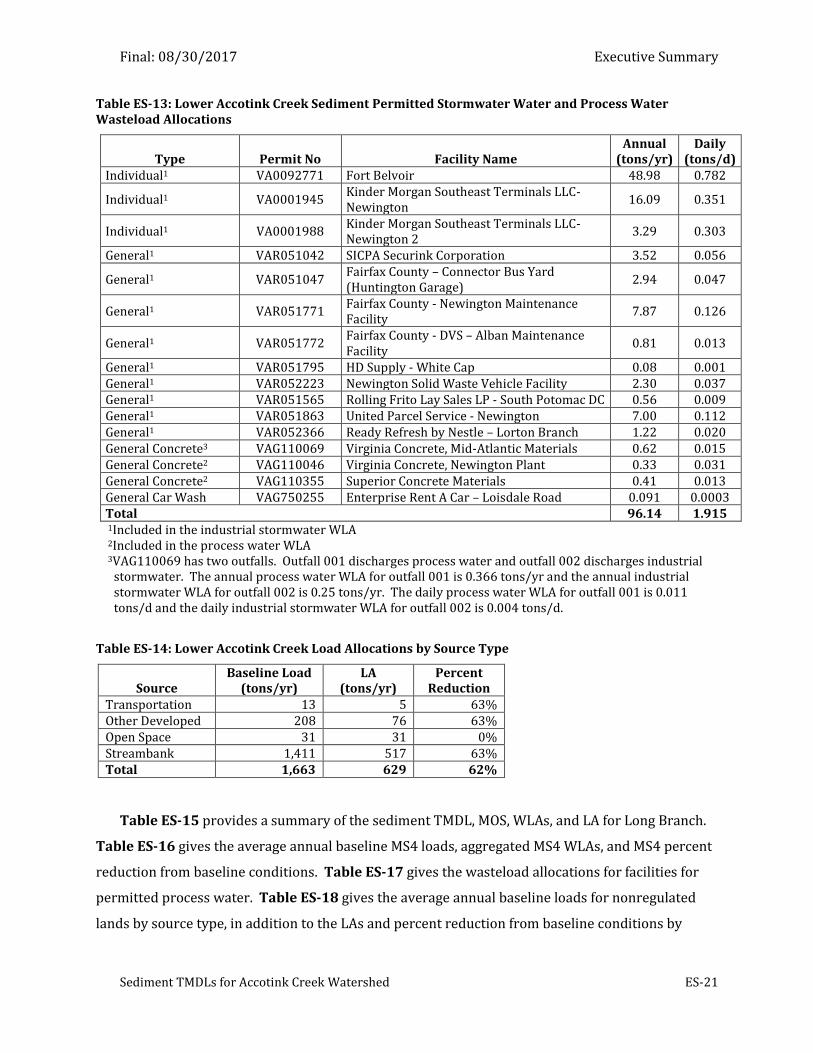
Final: 08/30/2017 Executive Summary
Sediment TMDLs for Accotink Creek Watershed ES-21
Table ES-13: Lower Accotink Creek Sediment Permitted Stormwater Water and Process Water Wasteload Allocations
Type Permit No Facility Name Annual
(tons/yr) Daily
(tons/d) Individual1 VA0092771 Fort Belvoir 48.98 0.782
Individual1 VA0001945 Kinder Morgan Southeast Terminals LLC-Newington
16.09 0.351
Individual1 VA0001988 Kinder Morgan Southeast Terminals LLC-Newington 2
3.29 0.303
General1 VAR051042 SICPA Securink Corporation 3.52 0.056
General1 VAR051047 Fairfax County – Connector Bus Yard (Huntington Garage)
2.94 0.047
General1 VAR051771 Fairfax County - Newington Maintenance Facility
7.87 0.126
General1 VAR051772 Fairfax County - DVS – Alban Maintenance Facility
0.81 0.013
General1 VAR051795 HD Supply - White Cap 0.08 0.001 General1 VAR052223 Newington Solid Waste Vehicle Facility 2.30 0.037 General1 VAR051565 Rolling Frito Lay Sales LP - South Potomac DC 0.56 0.009 General1 VAR051863 United Parcel Service - Newington 7.00 0.112 General1 VAR052366 Ready Refresh by Nestle – Lorton Branch 1.22 0.020 General Concrete3 VAG110069 Virginia Concrete, Mid-Atlantic Materials 0.62 0.015 General Concrete2 VAG110046 Virginia Concrete, Newington Plant 0.33 0.031 General Concrete2 VAG110355 Superior Concrete Materials 0.41 0.013 General Car Wash VAG750255 Enterprise Rent A Car – Loisdale Road 0.091 0.0003 Total 96.14 1.915 1Included in the industrial stormwater WLA 2Included in the process water WLA 3VAG110069 has two outfalls. Outfall 001 discharges process water and outfall 002 discharges industrial
stormwater. The annual process water WLA for outfall 001 is 0.366 tons/yr and the annual industrial stormwater WLA for outfall 002 is 0.25 tons/yr. The daily process water WLA for outfall 001 is 0.011 tons/d and the daily industrial stormwater WLA for outfall 002 is 0.004 tons/d.
Table ES-14: Lower Accotink Creek Load Allocations by Source Type
Source Baseline Load
(tons/yr) LA
(tons/yr) Percent
Reduction Transportation 13 5 63% Other Developed 208 76 63% Open Space 31 31 0% Streambank 1,411 517 63% Total 1,663 629 62%
Table ES-15 provides a summary of the sediment TMDL, MOS, WLAs, and LA for Long Branch.
Table ES-16 gives the average annual baseline MS4 loads, aggregated MS4 WLAs, and MS4 percent
reduction from baseline conditions. Table ES-17 gives the wasteload allocations for facilities for
permitted process water. Table ES-18 gives the average annual baseline loads for nonregulated
lands by source type, in addition to the LAs and percent reduction from baseline conditions by
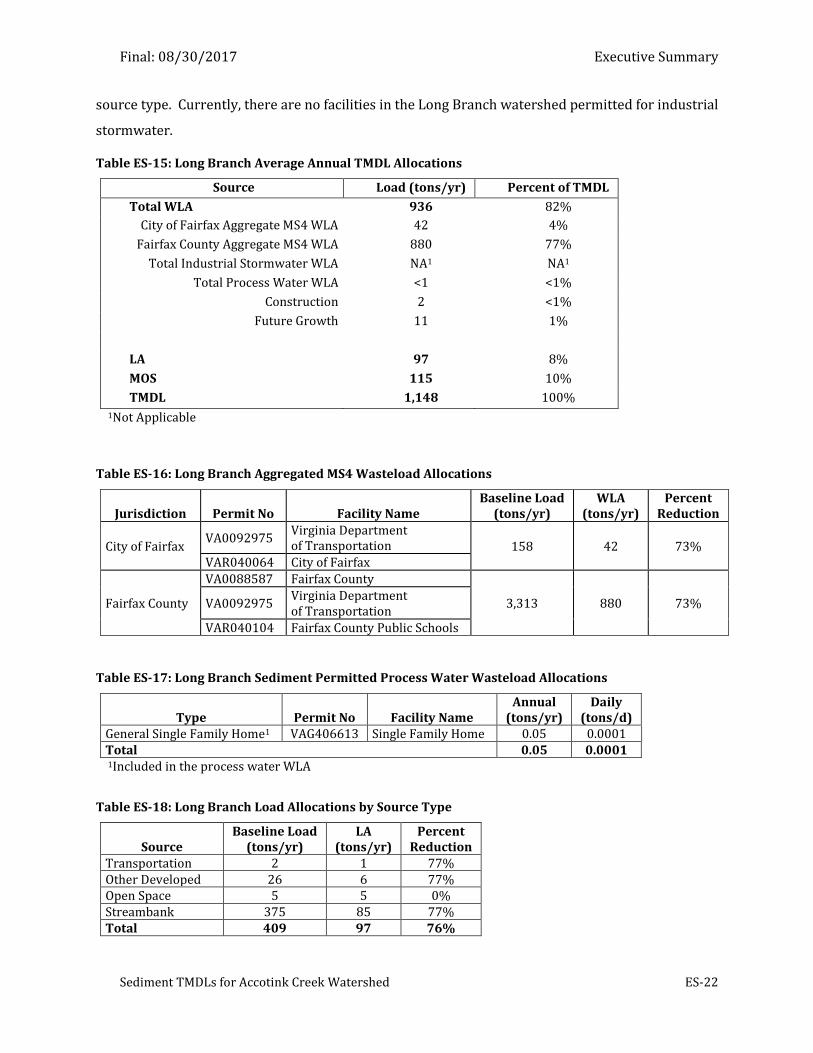
Final: 08/30/2017 Executive Summary
Sediment TMDLs for Accotink Creek Watershed ES-22
source type. Currently, there are no facilities in the Long Branch watershed permitted for industrial
stormwater.
Table ES-15: Long Branch Average Annual TMDL Allocations
Source Load (tons/yr) Percent of TMDL
Total WLA 936 82%
City of Fairfax Aggregate MS4 WLA 42 4%
Fairfax County Aggregate MS4 WLA 880 77%
Total Industrial Stormwater WLA NA1 NA1
Total Process Water WLA <1 <1%
Construction 2 <1%
Future Growth 11 1%
LA 97 8%
MOS 115 10%
TMDL 1,148 100% 1Not Applicable
Table ES-16: Long Branch Aggregated MS4 Wasteload Allocations
Jurisdiction Permit No Facility Name Baseline Load
(tons/yr) WLA
(tons/yr) Percent
Reduction
City of Fairfax VA0092975
Virginia Department of Transportation 158 42 73%
VAR040064 City of Fairfax
Fairfax County
VA0088587 Fairfax County
3,313 880 73% VA0092975 Virginia Department of Transportation
VAR040104 Fairfax County Public Schools
Table ES-17: Long Branch Sediment Permitted Process Water Wasteload Allocations
Type Permit No Facility Name Annual
(tons/yr) Daily
(tons/d) General Single Family Home1 VAG406613 Single Family Home 0.05 0.0001 Total 0.05 0.0001 1Included in the process water WLA
Table ES-18: Long Branch Load Allocations by Source Type
Source Baseline Load
(tons/yr) LA
(tons/yr) Percent
Reduction Transportation 2 1 77% Other Developed 26 6 77% Open Space 5 5 0% Streambank 375 85 77% Total 409 97 76%
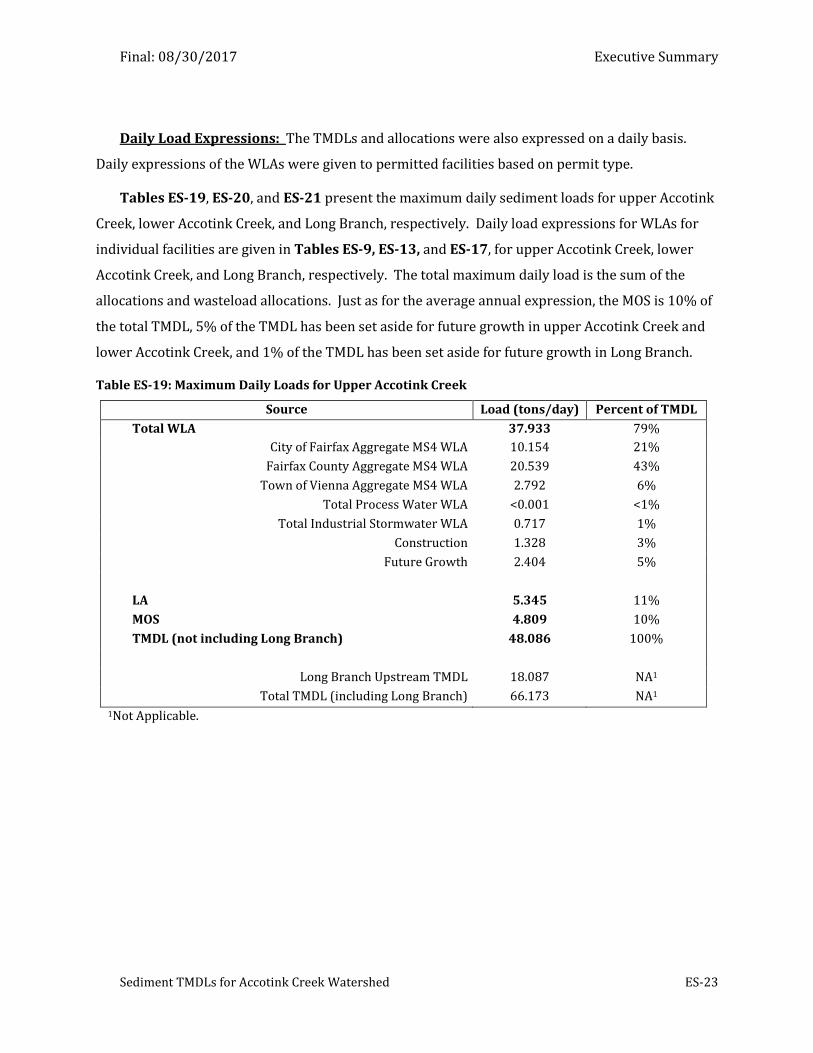
Final: 08/30/2017 Executive Summary
Sediment TMDLs for Accotink Creek Watershed ES-23
Daily Load Expressions: The TMDLs and allocations were also expressed on a daily basis.
Daily expressions of the WLAs were given to permitted facilities based on permit type.
Tables ES-19, ES-20, and ES-21 present the maximum daily sediment loads for upper Accotink
Creek, lower Accotink Creek, and Long Branch, respectively. Daily load expressions for WLAs for
individual facilities are given in Tables ES-9, ES-13, and ES-17, for upper Accotink Creek, lower
Accotink Creek, and Long Branch, respectively. The total maximum daily load is the sum of the
allocations and wasteload allocations. Just as for the average annual expression, the MOS is 10% of
the total TMDL, 5% of the TMDL has been set aside for future growth in upper Accotink Creek and
lower Accotink Creek, and 1% of the TMDL has been set aside for future growth in Long Branch.
Table ES-19: Maximum Daily Loads for Upper Accotink Creek
Source Load (tons/day) Percent of TMDL
Total WLA 37.933 79%
City of Fairfax Aggregate MS4 WLA 10.154 21%
Fairfax County Aggregate MS4 WLA 20.539 43%
Town of Vienna Aggregate MS4 WLA 2.792 6%
Total Process Water WLA <0.001 <1%
Total Industrial Stormwater WLA 0.717 1%
Construction 1.328 3%
Future Growth 2.404 5%
LA 5.345 11%
MOS 4.809 10%
TMDL (not including Long Branch) 48.086 100%
Long Branch Upstream TMDL 18.087 NA1
Total TMDL (including Long Branch) 66.173 NA1 1Not Applicable.
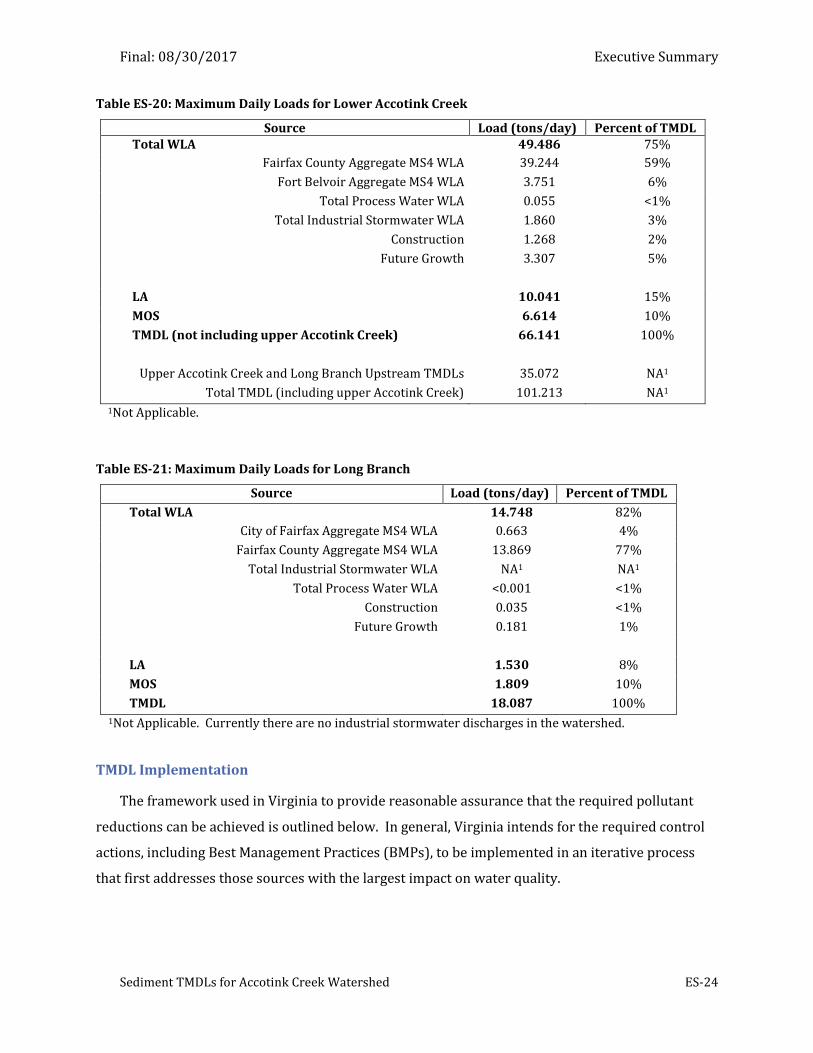
Final: 08/30/2017 Executive Summary
Sediment TMDLs for Accotink Creek Watershed ES-24
Table ES-20: Maximum Daily Loads for Lower Accotink Creek
Source Load (tons/day) Percent of TMDL Total WLA 49.486 75%
Fairfax County Aggregate MS4 WLA 39.244 59%
Fort Belvoir Aggregate MS4 WLA 3.751 6%
Total Process Water WLA 0.055 <1%
Total Industrial Stormwater WLA 1.860 3%
Construction 1.268 2%
Future Growth 3.307 5%
LA 10.041 15%
MOS 6.614 10%
TMDL (not including upper Accotink Creek) 66.141 100%
Upper Accotink Creek and Long Branch Upstream TMDLs 35.072 NA1
Total TMDL (including upper Accotink Creek) 101.213 NA1
1Not Applicable.
Table ES-21: Maximum Daily Loads for Long Branch
Source Load (tons/day) Percent of TMDL
Total WLA 14.748 82%
City of Fairfax Aggregate MS4 WLA 0.663 4%
Fairfax County Aggregate MS4 WLA 13.869 77%
Total Industrial Stormwater WLA NA1 NA1
Total Process Water WLA <0.001 <1%
Construction 0.035 <1%
Future Growth 0.181 1%
LA 1.530 8%
MOS 1.809 10%
TMDL 18.087 100% 1Not Applicable. Currently there are no industrial stormwater discharges in the watershed.
TMDL Implementation
The framework used in Virginia to provide reasonable assurance that the required pollutant
reductions can be achieved is outlined below. In general, Virginia intends for the required control
actions, including Best Management Practices (BMPs), to be implemented in an iterative process
that first addresses those sources with the largest impact on water quality.
Final: 08/30/2017 Executive Summary
Sediment TMDLs for Accotink Creek Watershed ES-25
For the implementation of the WLA component of the TMDL, the Commonwealth utilizes the
Virginia Pollutant Discharge Elimination System (VPDES) program and the Virginia Stormwater
Management Program (VSMP). There are no municipal wastewater treatment plants in the
Accotink Creek watershed. Process water discharged from concrete plants, car washes, or other
activities regulated by general permits are required to meet the sediment concentration limits at
the point of discharge as stipulated in the VPDES permit.
DEQ authorizes the discharges of stormwater associated with industrial activities, construction
sites, and MS4s through the issuance of VPDES permits. Authorization for the issuance of VPDES
permits to address stormwater discharges from construction sites and MS4s is included in the
VSMP Regulation. While the authorization to issue VPDES permits is housed in two different
regulations, permits allowing the discharge of industrial stormwater, construction stormwater, and
municipal stormwater all implement the requirements of the federal NPDES program. All new or
revised permits must be consistent with the assumptions and requirements of any applicable TMDL
WLA.
For MS4/VSMP individual and general permits, DEQ expects the permittee to specifically
address the TMDL wasteload allocations (WLA) for stormwater through the iterative
implementation of BMPs to the maximum extent practicable. Permittee implementation of an
individual control strategy includes determining BMP effectiveness. The implementation of the
WLAs for MS4 permits will be through the iterative implementation of structural and programmatic
BMPs aimed at meeting the designated percent reductions from baseline conditions.
To implement the load allocation from nonpoint sources, a TMDL implementation plan will be
developed that addresses, at a minimum, the requirements specified in the Code of Virginia, Section
62.1-44.19.7. State law directs the State Water Control Board to “develop and implement a plan to
achieve fully supporting status for impaired waters.” The listed elements include implementation
actions/management measures, timelines, legal or regulatory controls, time required to attain
water quality standards, monitoring plans, and milestones for attaining water quality standards.
DEQ expects that implementation of the sediment TMDLs will occur in stages, and that full
implementation of the TMDLs is a long-term goal. The measures for nonpoint source reductions,
which can include the use of better technology and the adoption of BMPs, are implemented in an
iterative process that is described along with specific BMPs in the TMDL implementation plan.
Many of the BMPs that address sediment also address the two non-pollutant stressors
Final: 08/30/2017 Executive Summary
Sediment TMDLs for Accotink Creek Watershed ES-26
hydromodification and habitat modification. If the measures to reduce sediment also address the
non-pollutant stressors, then they should be considered priority BMPs for implementing this TMDL.
Implementation of this TMDL will contribute to on-going water quality improvement efforts
aimed at restoring water quality in the Accotink Creek watershed, the Potomac River, and the
Chesapeake Bay. Fairfax County, the City of Fairfax, and the Town of Vienna all have adopted
Chesapeake Bay Program Ordinances, which require stormwater BMPs for all new development or
redevelopment. Under their MS4 permits, these jurisdictions are also required to develop Action
Plans to address attaining reductions in sediment under the Chesapeake Bay TMDLs. The Fairfax
County Board of Supervisors approved a Watershed Plan for Accotink Creek on February 8, 2011.
The plan identifies a list of structural projects and non-structural actions that could be
implemented in the next 25 years (FCDPWES, 2011). The plan will help identify strategies to
control stormwater runoff and its associated pollutant loads, which will help meet the load
reductions set forth in this TMDL and the overall biological goals of this TMDL and water quality
standards.
Public Participation
Public participation was an essential element in the development of the sediment TMDLs for
upper Accotink Creek, Lower Accotink Creek, and Long Branch. Three public meetings and six
Technical Advisory Committee (TAC) meetings were held over the course of the project. The
following agencies, businesses, and organizations attended TAC meetings and participated in the
development of the TMDLs for the Accotink Creek watershed:
Final: 08/30/2017 Executive Summary
Sediment TMDLs for Accotink Creek Watershed ES-27
Representation in Attendance at TAC Meetings
Braddock District Board of Supervisors1 Joint Basin Corporation - Fairfax Terminal Complex
Buckeye Partners1 Metropolitan Council of Governments
Catholic Diocese of Arlington Northern Virginia Community College
Chesapeake Bay Foundation Northern Virginia Building Industry Association (NVBIA) - Fairfax Chapter
City of Fairfax Northern Virginia Regional Commission (NVRC)
Fairfax County Department of Public Works and Environmental Services
Stantec1
Fairfax County Department of Transportation Town of Vienna - Public Works
Fairfax County Department of Vehicle Services United Parcel Service - Newington
Fairfax County Park Authority United States Geological Survey (USGS)
Fort Belvoir Department of Public Works VA Department of Environmental Quality
Friends of Accotink Creek Virginia Concrete Company Inc.
Friends of Lake Accotink Park Virginia Department of Forestry
GKY & Associates, Inc.1 Virginia Department of Transportation (VDOT)
Regency Centers Watershed residents1
Interstate Commission on the Potomac River Basin
Wetland Studies and Solutions, Inc.1
1Not official TAC members, but attended at least one meeting
Final: 08/30/2017
Sediment TMDLs for Accotink Creek Watershed 1-1
1 Introduction
The Clean Water Act (CWA) requires that all waters of the United States support swimming,
sustain and protect aquatic life, and maintain other beneficial uses such as water supply or shellfish
propagation and harvest. Virginia has adopted water quality standards to meet the goals of the
CWA. These standards specify (1) designated uses for waterbodies, such as a primary contact
recreation use, to support swimming, or an aquatic life use, to sustain and protect aquatic life; (2)
the water quality criteria necessary to support these uses; and (3) antidegradation policy to
preserve existing uses, maintain waters whose quality exceeds standards, and protect waters of
exceptional quality. The CWA also requires states to assess their waters to determine if they are
meeting water quality standards. Waterbodies not meeting standards, i.e. impaired waterbodies,
are documented in a state’s biennial Integrated Assessment on the state’s Integrated List
(305(b)/303(d)).
Accotink Creek drains 52 square miles of Northern Virginia before entering first Accotink Bay,
then Gunston Cove, on the tidal Potomac River. Long Branch (Central) is a tributary to Accotink
Creek, joining it just upstream of Lake Accotink, an impoundment on Accotink Creek. While there
are three tributaries named Long Branch in the Accotink Creek watershed, the tributary focused on
in this study is Long Branch (Central), hereafter simply referred to as Long Branch. Based on
benthic macroinvertebrate monitoring and assessments in the Accotink Creek watershed, the
Virginia Department of Environmental Quality (DEQ) has placed Accotink Creek, both above and
below Lake Accotink, and Long Branch on Virginia’s 303(d) List of Impaired Waters (Category 5 of
the Integrated List) because they are not supporting their Aquatic Life Use. Figure 1-1 shows the
location of the monitoring stations used in the assessment and the impaired stream segments.
Hereafter, impaired segment A15R-01-BEN, as shown in Figure 1-1, will be referred to as lower
Accotink Creek, segment A15R-04-BEN as upper Accotink Creek, and A15R-05-BEN as Long Branch.
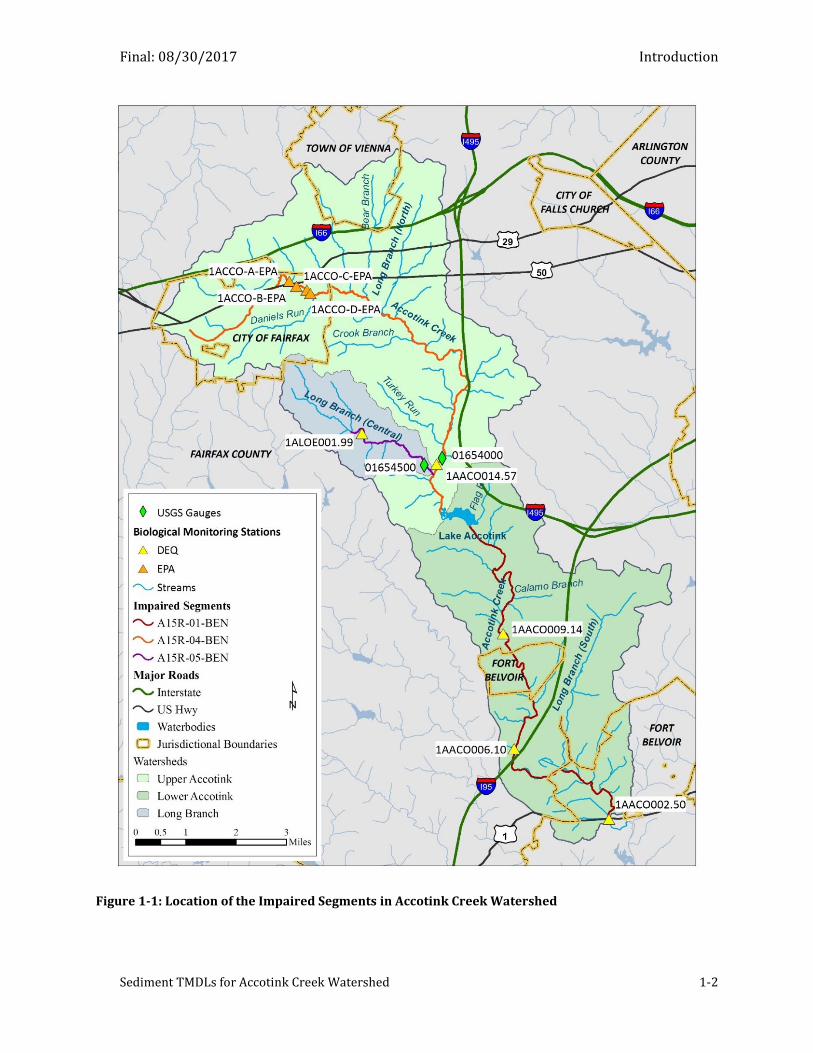
Final: 08/30/2017 Introduction
Sediment TMDLs for Accotink Creek Watershed 1-2
Figure 1-1: Location of the Impaired Segments in Accotink Creek Watershed
Final: 08/30/2017 Introduction
Sediment TMDLs for Accotink Creek Watershed 1-3
Because the benthic macroinvertebrate monitoring demonstrates that upper Accotink Creek,
lower Accotink Creek, and Long Branch are not supporting their Aquatic Life Use, a Stressor
Identification analysis (SI) was performed to determine the stressor(s) to the biological community
in the Accotink Creek watershed (DEQ, 2017). SI is an analysis of evidence provided by monitoring
data and scientific literature which attempts to identify the most likely stressors to the biological
community, i.e. the causes of the biological impairment. While presented in detail as Volume I of
this report, Section 1.3 summarizes the results of the SI. Additionally, Section 1.1 discusses the
regulatory background to listing upper Accotink Creek, lower Accotink Creek, and Long Branch as
biologically impaired, whereas Section 1.2 reviews the biological impairment listing.
1.1 Applicable Water Quality Standards
Virginia’s water quality standards consist of designated uses for a waterbody and water quality
criteria necessary to support those designated uses. The standards applicable to the impairments
in upper Accotink Creek, lower Accotink Creek, and Long Branch are discussed below.
1.1.1 Designated Uses
Designated uses are statutory management objectives for a waterbody. The CWA specifies that
all waters must be “fishable and swimmable,” that is, support their use for contact recreation and
for sustaining a healthy aquatic community. According to Virginia water quality standards (9 VAC
25-260-5):
“all state waters are designated for the following uses: recreational uses (e.g. swimming and
boating); the propagation and growth of a balanced indigenous population of aquatic life, including
game fish, which might be reasonably expected to inhabit them; wildlife; and the production of
edible and marketable natural resources (e.g. fish and shellfish).”
1.1.2 Water Quality Criteria
Water quality criteria can be numerical or narrative. The General Standard defined in Virginia
water quality standards (9 VAC 25-260-20) provides general, narrative criteria for the protection of
designated uses from substances that may interfere with attainment of such uses. The General
Standards states:
“All state waters, including wetlands, shall be free from substances attributable to sewage,
industrial waste, or other waste in concentrations, amounts, or combinations which contravene
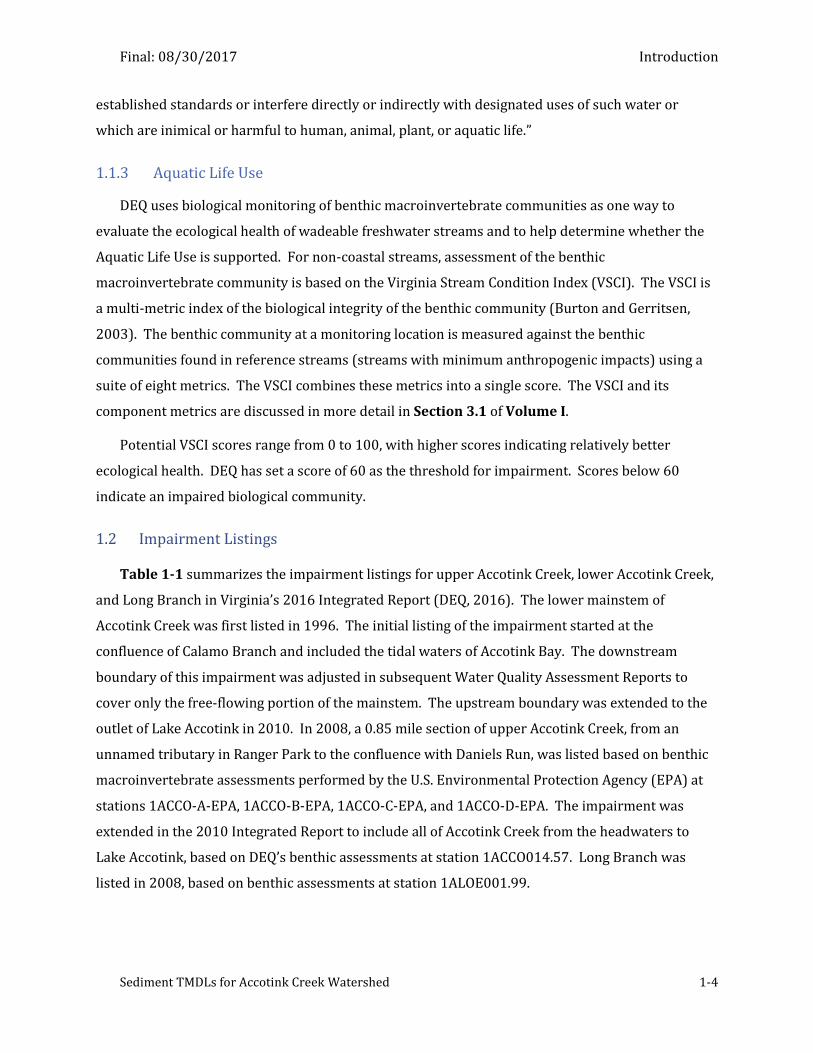
Final: 08/30/2017 Introduction
Sediment TMDLs for Accotink Creek Watershed 1-4
established standards or interfere directly or indirectly with designated uses of such water or
which are inimical or harmful to human, animal, plant, or aquatic life.”
1.1.3 Aquatic Life Use
DEQ uses biological monitoring of benthic macroinvertebrate communities as one way to
evaluate the ecological health of wadeable freshwater streams and to help determine whether the
Aquatic Life Use is supported. For non-coastal streams, assessment of the benthic
macroinvertebrate community is based on the Virginia Stream Condition Index (VSCI). The VSCI is
a multi-metric index of the biological integrity of the benthic community (Burton and Gerritsen,
2003). The benthic community at a monitoring location is measured against the benthic
communities found in reference streams (streams with minimum anthropogenic impacts) using a
suite of eight metrics. The VSCI combines these metrics into a single score. The VSCI and its
component metrics are discussed in more detail in Section 3.1 of Volume I.
Potential VSCI scores range from 0 to 100, with higher scores indicating relatively better
ecological health. DEQ has set a score of 60 as the threshold for impairment. Scores below 60
indicate an impaired biological community.
1.2 Impairment Listings
Table 1-1 summarizes the impairment listings for upper Accotink Creek, lower Accotink Creek,
and Long Branch in Virginia’s 2016 Integrated Report (DEQ, 2016). The lower mainstem of
Accotink Creek was first listed in 1996. The initial listing of the impairment started at the
confluence of Calamo Branch and included the tidal waters of Accotink Bay. The downstream
boundary of this impairment was adjusted in subsequent Water Quality Assessment Reports to
cover only the free-flowing portion of the mainstem. The upstream boundary was extended to the
outlet of Lake Accotink in 2010. In 2008, a 0.85 mile section of upper Accotink Creek, from an
unnamed tributary in Ranger Park to the confluence with Daniels Run, was listed based on benthic
macroinvertebrate assessments performed by the U.S. Environmental Protection Agency (EPA) at
stations 1ACCO-A-EPA, 1ACCO-B-EPA, 1ACCO-C-EPA, and 1ACCO-D-EPA. The impairment was
extended in the 2010 Integrated Report to include all of Accotink Creek from the headwaters to
Lake Accotink, based on DEQ’s benthic assessments at station 1ACCO014.57. Long Branch was
listed in 2008, based on benthic assessments at station 1ALOE001.99.
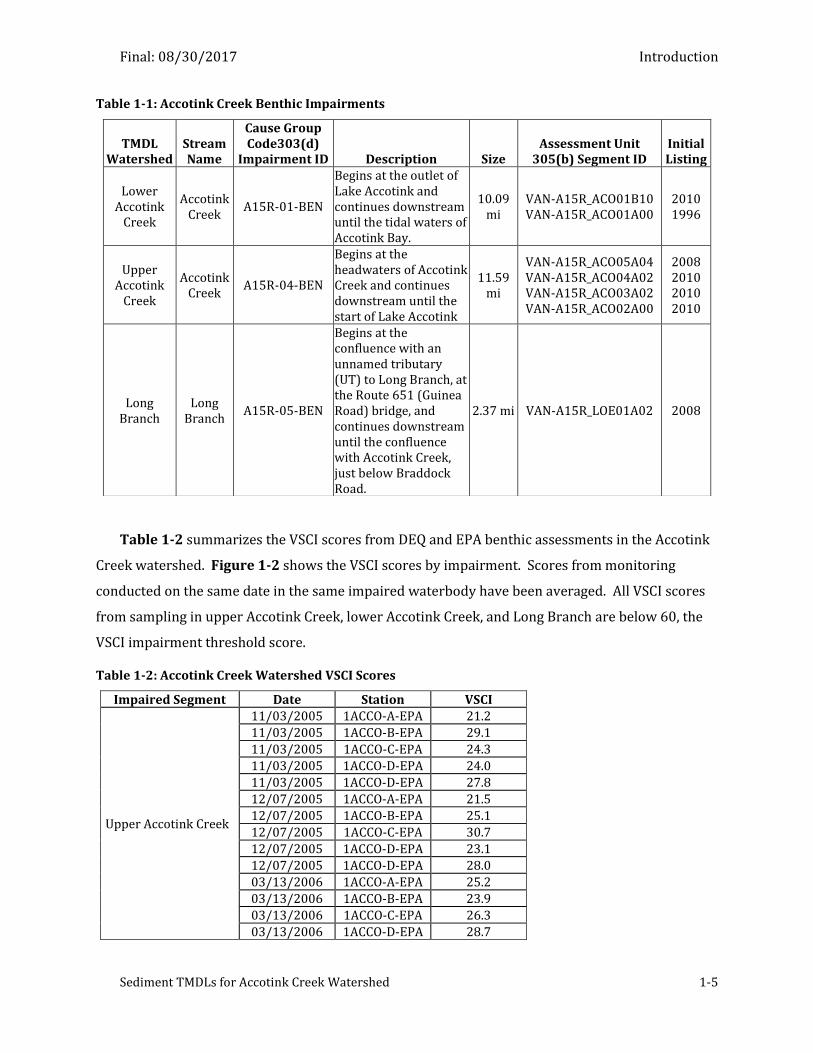
Final: 08/30/2017 Introduction
Sediment TMDLs for Accotink Creek Watershed 1-5
Table 1-1: Accotink Creek Benthic Impairments
Table 1-2 summarizes the VSCI scores from DEQ and EPA benthic assessments in the Accotink
Creek watershed. Figure 1-2 shows the VSCI scores by impairment. Scores from monitoring
conducted on the same date in the same impaired waterbody have been averaged. All VSCI scores
from sampling in upper Accotink Creek, lower Accotink Creek, and Long Branch are below 60, the
VSCI impairment threshold score.
Table 1-2: Accotink Creek Watershed VSCI Scores
Impaired Segment Date Station VSCI
Upper Accotink Creek
11/03/2005 1ACCO-A-EPA 21.2
11/03/2005 1ACCO-B-EPA 29.1
11/03/2005 1ACCO-C-EPA 24.3
11/03/2005 1ACCO-D-EPA 24.0
11/03/2005 1ACCO-D-EPA 27.8
12/07/2005 1ACCO-A-EPA 21.5
12/07/2005 1ACCO-B-EPA 25.1
12/07/2005 1ACCO-C-EPA 30.7
12/07/2005 1ACCO-D-EPA 23.1
12/07/2005 1ACCO-D-EPA 28.0
03/13/2006 1ACCO-A-EPA 25.2
03/13/2006 1ACCO-B-EPA 23.9
03/13/2006 1ACCO-C-EPA 26.3
03/13/2006 1ACCO-D-EPA 28.7
TMDL Watershed
Stream Name
Cause Group Code303(d)
Impairment ID Description Size Assessment Unit
305(b) Segment ID Initial Listing
Lower Accotink
Creek
Accotink Creek
A15R-01-BEN
Begins at the outlet of Lake Accotink and continues downstream until the tidal waters of Accotink Bay.
10.09 mi
VAN-A15R_ACO01B10 VAN-A15R_ACO01A00
2010 1996
Upper Accotink
Creek
Accotink Creek
A15R-04-BEN
Begins at the headwaters of Accotink Creek and continues downstream until the start of Lake Accotink
11.59 mi
VAN-A15R_ACO05A04 VAN-A15R_ACO04A02 VAN-A15R_ACO03A02 VAN-A15R_ACO02A00
2008 2010 2010 2010
Long Branch
Long Branch
A15R-05-BEN
Begins at the confluence with an unnamed tributary (UT) to Long Branch, at the Route 651 (Guinea Road) bridge, and continues downstream until the confluence with Accotink Creek, just below Braddock Road.
2.37 mi VAN-A15R_LOE01A02 2008
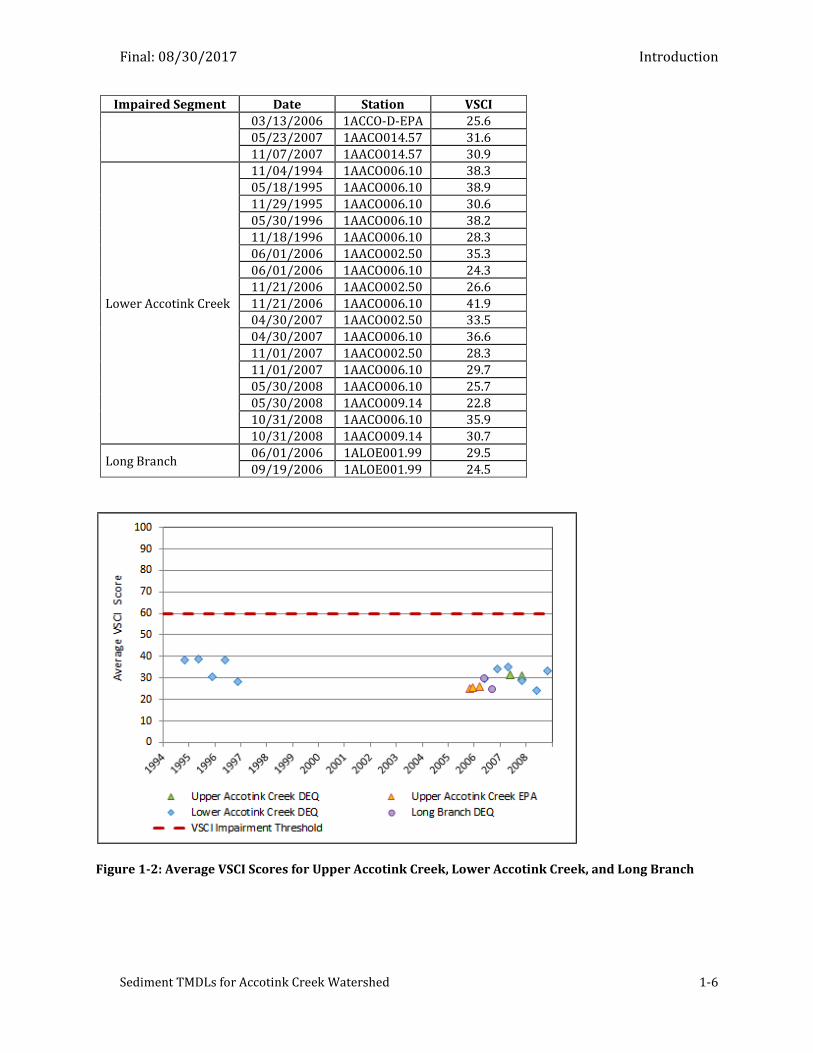
Final: 08/30/2017 Introduction
Sediment TMDLs for Accotink Creek Watershed 1-6
Impaired Segment Date Station VSCI
03/13/2006 1ACCO-D-EPA 25.6
05/23/2007 1AACO014.57 31.6
11/07/2007 1AACO014.57 30.9
Lower Accotink Creek
11/04/1994 1AACO006.10 38.3
05/18/1995 1AACO006.10 38.9
11/29/1995 1AACO006.10 30.6
05/30/1996 1AACO006.10 38.2
11/18/1996 1AACO006.10 28.3
06/01/2006 1AACO002.50 35.3
06/01/2006 1AACO006.10 24.3
11/21/2006 1AACO002.50 26.6
11/21/2006 1AACO006.10 41.9 04/30/2007 1AACO002.50 33.5
04/30/2007 1AACO006.10 36.6
11/01/2007 1AACO002.50 28.3
11/01/2007 1AACO006.10 29.7
05/30/2008 1AACO006.10 25.7
05/30/2008 1AACO009.14 22.8
10/31/2008 1AACO006.10 35.9
10/31/2008 1AACO009.14 30.7
Long Branch 06/01/2006 1ALOE001.99 29.5
09/19/2006 1ALOE001.99 24.5
Figure 1-2: Average VSCI Scores for Upper Accotink Creek, Lower Accotink Creek, and Long Branch
Final: 08/30/2017 Introduction
Sediment TMDLs for Accotink Creek Watershed 1-7
The 2014 Integrated Report identifies other impairments in the Accotink Creek watershed.
Lake Accotink is not meeting its Fish Consumption Use because of mercury and polychlorinated
biphenyls (PCBs) in fish tissue. Both of these impairments were first listed in 2010. Accotink Creek
from the outlet of Lake Accotink downstream to tidal waters is also not meeting its Fish
Consumption Use because of PCBs in fish tissue. This impairment was also first listed in 2010. The
Fish Consumption Use impairments in Lake Accotink and lower Accotink Creek remain on the
303(d) list and will be addressed at a future date.
Other impairments, identified in previous Assessment Reports, have already been addressed.
Total Maximum Daily Loads (TMDLs) have been developed for fecal coliform in upper Accotink
Creek and E. coli in lower Accotink Creek to address Recreational Use impairments. The impaired
segment in upper Accotink Creek was first listed in 1998. It extended from the confluence with
Crook Branch to Lake Accotink. The TMDL for fecal coliform was approved by the EPA in 2002.
The impairment in lower Accotink Creek extended from Calamo Branch to tidal waters. It was first
listed in 2004. The EPA approved the TMDL for E. coli in 2008. Tidal Accotink Creek, which was
not meeting its Fish Consumption Use because of PCBs in fish tissue, was included in an interstate
TMDL developed to address PCB impairments in the tidal Potomac River and its embayments. That
TMDL was approved by the EPA in 2007.
1.3 Results of the Stressor Identification Analysis for the Accotink Creek Watershed
Section 303(d) of the CWA and the EPA’s Water Quality Planning and Management Regulations
(40 CFR part 130) generally require states to develop TMDLs for waterbodies that are not meeting
water quality standards. TMDLs represent the total pollutant loading that a waterbody can receive
without exceeding water quality standards. Impaired waterbodies requiring TMDLs are listed in
Category 5 of the Integrated Report. Currently, upper Accotink Creek, lower Accotink Creek, and
Long Branch are listed for aquatic life use impairments in Category 5 on Virginia’s Integrated
Report.
Biological monitoring in the Accotink Creek watershed has determined that these waterbodies
are not supporting their Aquatic Life Use, but the biological monitoring does not determine the
cause of the biological impairments in these waterbodies. Until the underlying cause(s) of the
biological impairments have been determined, there is no way of knowing what actions will most
effectively address the impairment. A Stressor Identification analysis (SI) was performed to
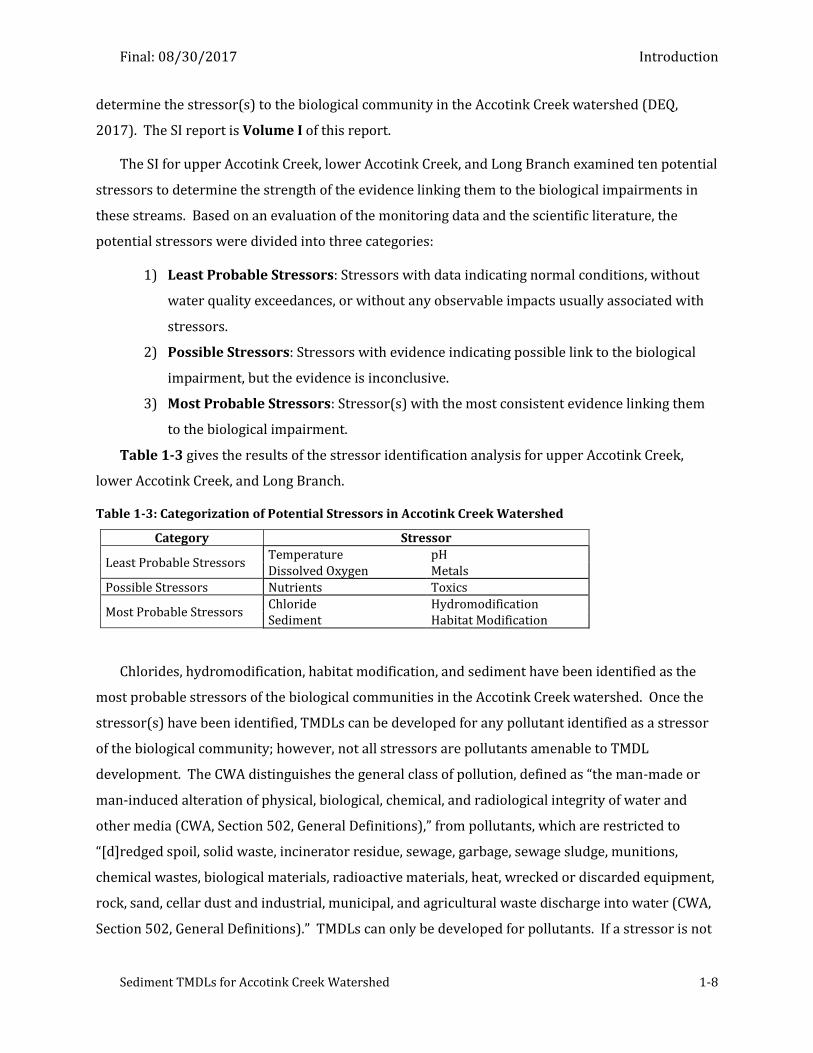
Final: 08/30/2017 Introduction
Sediment TMDLs for Accotink Creek Watershed 1-8
determine the stressor(s) to the biological community in the Accotink Creek watershed (DEQ,
2017). The SI report is Volume I of this report.
The SI for upper Accotink Creek, lower Accotink Creek, and Long Branch examined ten potential
stressors to determine the strength of the evidence linking them to the biological impairments in
these streams. Based on an evaluation of the monitoring data and the scientific literature, the
potential stressors were divided into three categories:
1) Least Probable Stressors: Stressors with data indicating normal conditions, without
water quality exceedances, or without any observable impacts usually associated with
stressors.
2) Possible Stressors: Stressors with evidence indicating possible link to the biological
impairment, but the evidence is inconclusive.
3) Most Probable Stressors: Stressor(s) with the most consistent evidence linking them
to the biological impairment.
Table 1-3 gives the results of the stressor identification analysis for upper Accotink Creek,
lower Accotink Creek, and Long Branch.
Table 1-3: Categorization of Potential Stressors in Accotink Creek Watershed
Category Stressor
Least Probable Stressors Temperature pH Dissolved Oxygen Metals
Possible Stressors Nutrients Toxics
Most Probable Stressors Chloride Hydromodification Sediment Habitat Modification
Chlorides, hydromodification, habitat modification, and sediment have been identified as the
most probable stressors of the biological communities in the Accotink Creek watershed. Once the
stressor(s) have been identified, TMDLs can be developed for any pollutant identified as a stressor
of the biological community; however, not all stressors are pollutants amenable to TMDL
development. The CWA distinguishes the general class of pollution, defined as “the man-made or
man-induced alteration of physical, biological, chemical, and radiological integrity of water and
other media (CWA, Section 502, General Definitions),” from pollutants, which are restricted to
“[d]redged spoil, solid waste, incinerator residue, sewage, garbage, sewage sludge, munitions,
chemical wastes, biological materials, radioactive materials, heat, wrecked or discarded equipment,
rock, sand, cellar dust and industrial, municipal, and agricultural waste discharge into water (CWA,
Section 502, General Definitions).” TMDLs can only be developed for pollutants. If a stressor is not
Final: 08/30/2017 Introduction
Sediment TMDLs for Accotink Creek Watershed 1-9
a pollutant, EPA guidance (EPA, 2015) provides an alternative category in the Integrated List, 4C,
for waterbodies impaired by pollution not caused by a pollutant.
Of the four most probable stressors, only chloride and sediment are pollutants. As specified in
the CWA, TMDLs should be developed for sediment and chloride for each of the three impaired
segments in the Accotink Creek watershed. The chloride TMDLs are described in Volume III of this
report. This volume, Volume II, describes the development of sediment TMDLs for upper Accotink
Creek, lower Accotink Creek, and Long Branch, to help address the biological impairments in those
watersheds. The following section reviews the evidence that sediment is most probably a stressor
of the biological community in the Accotink Creek watershed.
1.3.1 Evidence for a Sediment Impairment in the Accotink Creek Watershed
Both suspended sediment and deposited sediment can adversely impact stream biota.
Suspended sediment contributes to increased turbidity, which limits the light available for
photosynthesis and reduces visibility for predators. Elevated sediment concentrations can
interfere with filter-feeding organisms by reducing the quality of available food or directly clogging
filtering organs. Increased suspended sediment concentrations during high flows enhance the
scour of periphyton and macroinvertebrates. Suspended sediment also enhances drift, making
colonization by macroinvertebrates less likely (Bilotta and Brazier, 2008). The abrasive action of
suspended sediment can also damage stalks and other plant structures, the bodily parts of
invertebrates, and the gills of fish. Deposited sediment can directly bury periphyton,
macroinvertebrates, and fish eggs or larvae. In addition, deposited sediment can cover larger
substrate that is favored as habitat by many sensitive macroinvertebrates, fill in spaces between
substrate that provide refuge for macroinvertebrates and small fishes, or reduce the supply of
gravel or clean substrate necessary for spawning by trout or other species.
There is ample evidence that in the mainstem of Accotink Creek and its tributaries, sediment is
being transported and deposited in sufficient quantities to adversely impact the aquatic
community. The primary sources of evidence are (1) DEQ habitat assessments and (2) the stream
physical assessment (SPA) performed by CH2MHill (2005) on behalf of Fairfax County Department
of Public Works and Environmental Services (FCDPWES).
DEQ routinely performs a habitat assessment of the biological monitoring site as part of its
biological assessment. The SI in Volume 1 analyzed a total of sixteen habitat assessments which
DEQ performed from 2006 through 2008 at the biological monitoring stations shown in Figure 1-1:
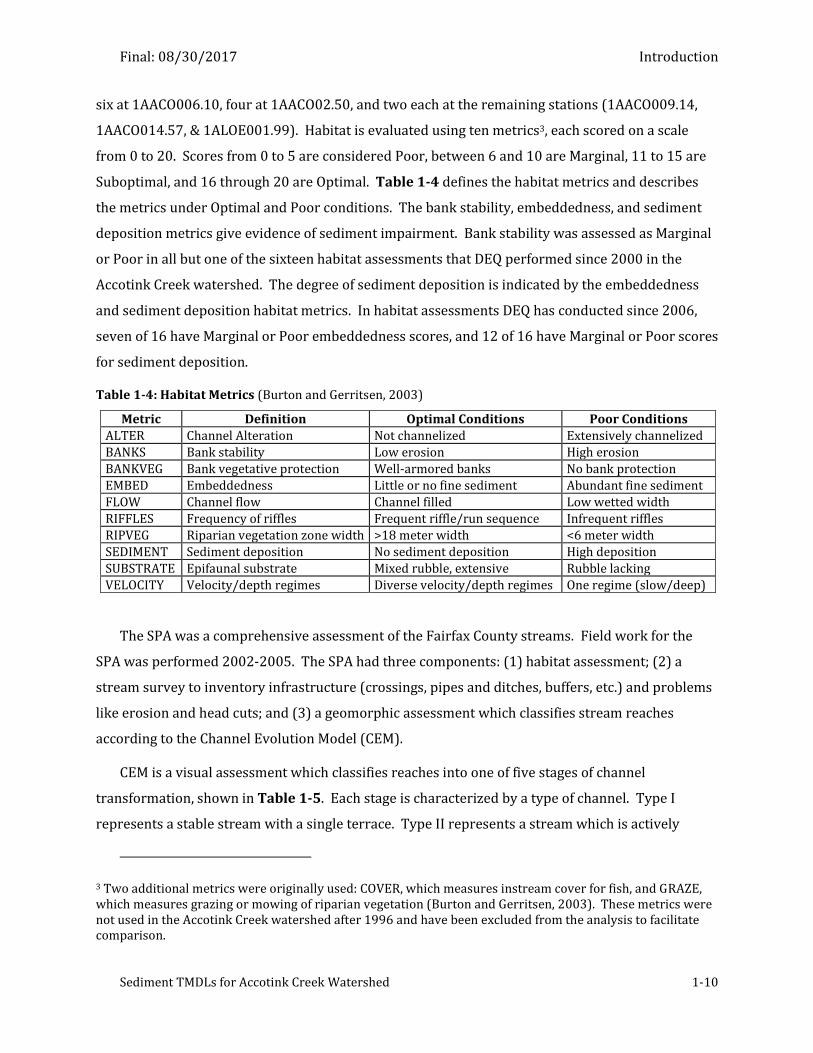
Final: 08/30/2017 Introduction
Sediment TMDLs for Accotink Creek Watershed 1-10
six at 1AACO006.10, four at 1AACO02.50, and two each at the remaining stations (1AACO009.14,
1AACO014.57, & 1ALOE001.99). Habitat is evaluated using ten metrics3, each scored on a scale
from 0 to 20. Scores from 0 to 5 are considered Poor, between 6 and 10 are Marginal, 11 to 15 are
Suboptimal, and 16 through 20 are Optimal. Table 1-4 defines the habitat metrics and describes
the metrics under Optimal and Poor conditions. The bank stability, embeddedness, and sediment
deposition metrics give evidence of sediment impairment. Bank stability was assessed as Marginal
or Poor in all but one of the sixteen habitat assessments that DEQ performed since 2000 in the
Accotink Creek watershed. The degree of sediment deposition is indicated by the embeddedness
and sediment deposition habitat metrics. In habitat assessments DEQ has conducted since 2006,
seven of 16 have Marginal or Poor embeddedness scores, and 12 of 16 have Marginal or Poor scores
for sediment deposition.
Table 1-4: Habitat Metrics (Burton and Gerritsen, 2003)
Metric Definition Optimal Conditions Poor Conditions
ALTER Channel Alteration Not channelized Extensively channelized
BANKS Bank stability Low erosion High erosion
BANKVEG Bank vegetative protection Well-armored banks No bank protection
EMBED Embeddedness Little or no fine sediment Abundant fine sediment
FLOW Channel flow Channel filled Low wetted width
RIFFLES Frequency of riffles Frequent riffle/run sequence Infrequent riffles
RIPVEG Riparian vegetation zone width >18 meter width <6 meter width
SEDIMENT Sediment deposition No sediment deposition High deposition
SUBSTRATE Epifaunal substrate Mixed rubble, extensive Rubble lacking
VELOCITY Velocity/depth regimes Diverse velocity/depth regimes One regime (slow/deep)
The SPA was a comprehensive assessment of the Fairfax County streams. Field work for the
SPA was performed 2002-2005. The SPA had three components: (1) habitat assessment; (2) a
stream survey to inventory infrastructure (crossings, pipes and ditches, buffers, etc.) and problems
like erosion and head cuts; and (3) a geomorphic assessment which classifies stream reaches
according to the Channel Evolution Model (CEM).
CEM is a visual assessment which classifies reaches into one of five stages of channel
transformation, shown in Table 1-5. Each stage is characterized by a type of channel. Type I
represents a stable stream with a single terrace. Type II represents a stream which is actively
3 Two additional metrics were originally used: COVER, which measures instream cover for fish, and GRAZE, which measures grazing or mowing of riparian vegetation (Burton and Gerritsen, 2003). These metrics were not used in the Accotink Creek watershed after 1996 and have been excluded from the analysis to facilitate comparison.
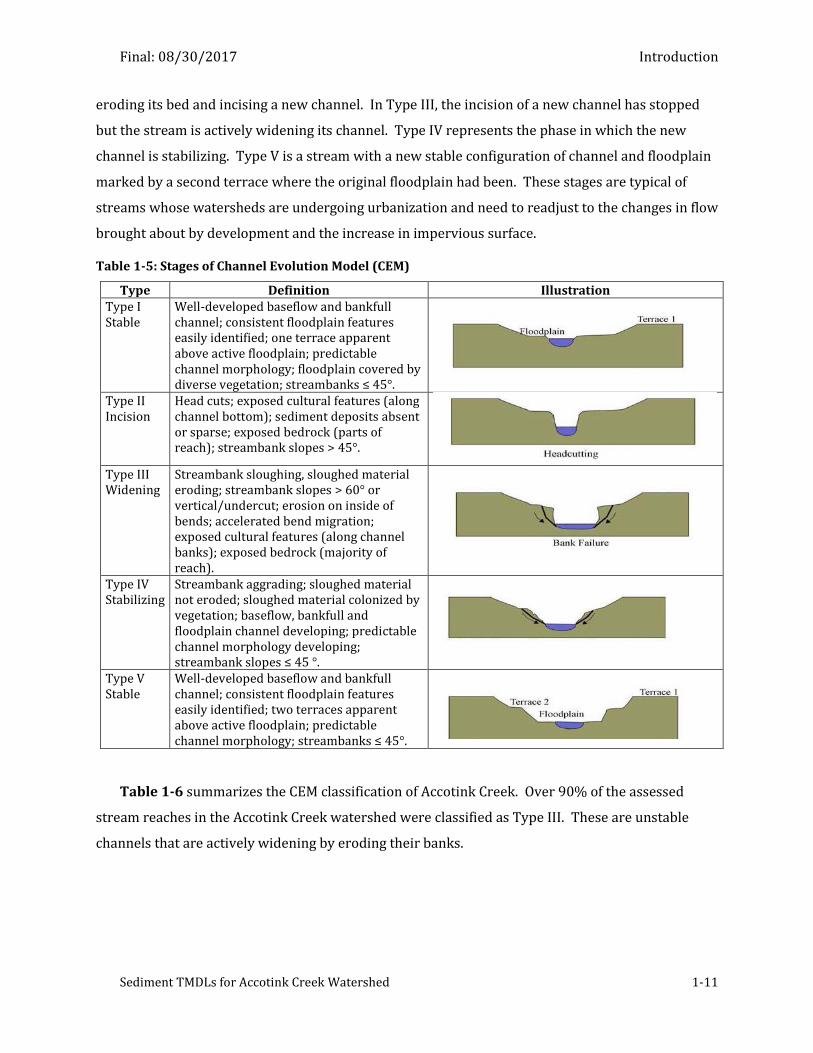
Final: 08/30/2017 Introduction
Sediment TMDLs for Accotink Creek Watershed 1-11
eroding its bed and incising a new channel. In Type III, the incision of a new channel has stopped
but the stream is actively widening its channel. Type IV represents the phase in which the new
channel is stabilizing. Type V is a stream with a new stable configuration of channel and floodplain
marked by a second terrace where the original floodplain had been. These stages are typical of
streams whose watersheds are undergoing urbanization and need to readjust to the changes in flow
brought about by development and the increase in impervious surface.
Table 1-5: Stages of Channel Evolution Model (CEM)
Type Definition Illustration Type I Stable
Well-developed baseflow and bankfull channel; consistent floodplain features easily identified; one terrace apparent above active floodplain; predictable channel morphology; floodplain covered by diverse vegetation; streambanks ≤ 45°.
Type II Incision
Head cuts; exposed cultural features (along channel bottom); sediment deposits absent or sparse; exposed bedrock (parts of reach); streambank slopes > 45°.
Type III Widening
Streambank sloughing, sloughed material eroding; streambank slopes > 60° or vertical/undercut; erosion on inside of bends; accelerated bend migration; exposed cultural features (along channel banks); exposed bedrock (majority of reach).
Type IV Stabilizing
Streambank aggrading; sloughed material not eroded; sloughed material colonized by vegetation; baseflow, bankfull and floodplain channel developing; predictable channel morphology developing; streambank slopes ≤ 45 °.
Type V Stable
Well-developed baseflow and bankfull channel; consistent floodplain features easily identified; two terraces apparent above active floodplain; predictable channel morphology; streambanks ≤ 45°.
Table 1-6 summarizes the CEM classification of Accotink Creek. Over 90% of the assessed
stream reaches in the Accotink Creek watershed were classified as Type III. These are unstable
channels that are actively widening by eroding their banks.
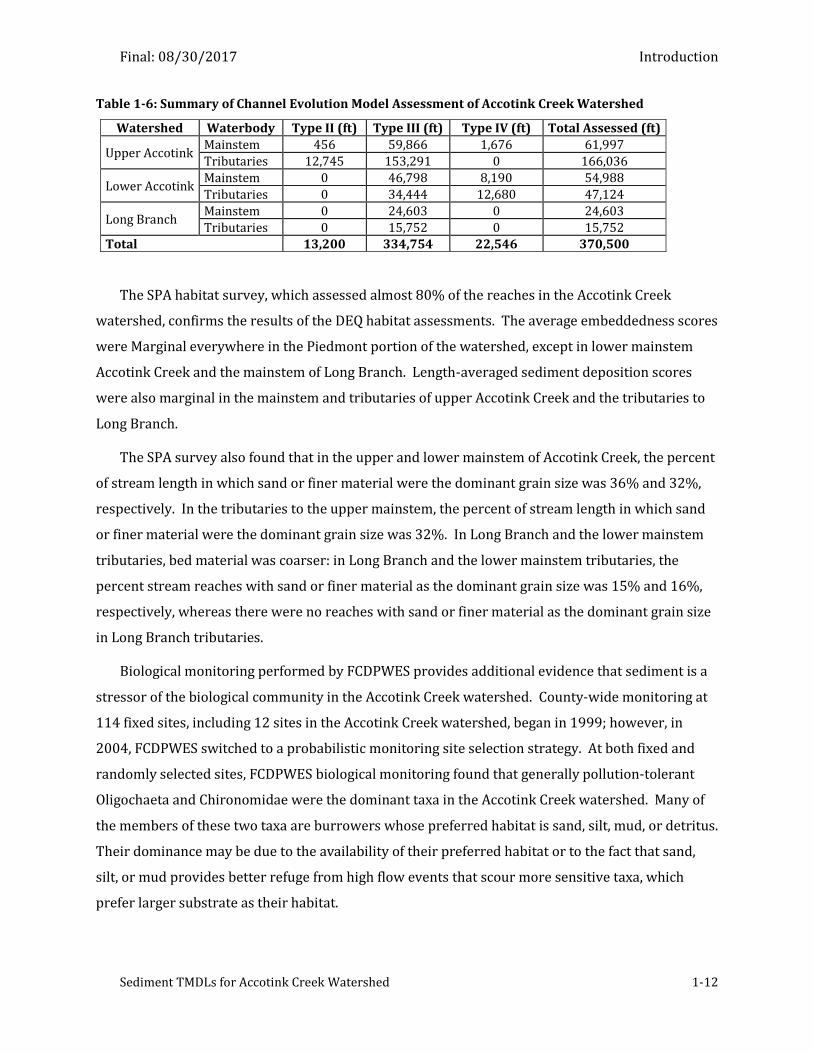
Final: 08/30/2017 Introduction
Sediment TMDLs for Accotink Creek Watershed 1-12
Table 1-6: Summary of Channel Evolution Model Assessment of Accotink Creek Watershed
Watershed Waterbody Type II (ft) Type III (ft) Type IV (ft) Total Assessed (ft)
Upper Accotink Mainstem 456 59,866 1,676 61,997
Tributaries 12,745 153,291 0 166,036
Lower Accotink Mainstem 0 46,798 8,190 54,988
Tributaries 0 34,444 12,680 47,124
Long Branch Mainstem 0 24,603 0 24,603
Tributaries 0 15,752 0 15,752 Total 13,200 334,754 22,546 370,500
The SPA habitat survey, which assessed almost 80% of the reaches in the Accotink Creek
watershed, confirms the results of the DEQ habitat assessments. The average embeddedness scores
were Marginal everywhere in the Piedmont portion of the watershed, except in lower mainstem
Accotink Creek and the mainstem of Long Branch. Length-averaged sediment deposition scores
were also marginal in the mainstem and tributaries of upper Accotink Creek and the tributaries to
Long Branch.
The SPA survey also found that in the upper and lower mainstem of Accotink Creek, the percent
of stream length in which sand or finer material were the dominant grain size was 36% and 32%,
respectively. In the tributaries to the upper mainstem, the percent of stream length in which sand
or finer material were the dominant grain size was 32%. In Long Branch and the lower mainstem
tributaries, bed material was coarser: in Long Branch and the lower mainstem tributaries, the
percent stream reaches with sand or finer material as the dominant grain size was 15% and 16%,
respectively, whereas there were no reaches with sand or finer material as the dominant grain size
in Long Branch tributaries.
Biological monitoring performed by FCDPWES provides additional evidence that sediment is a
stressor of the biological community in the Accotink Creek watershed. County-wide monitoring at
114 fixed sites, including 12 sites in the Accotink Creek watershed, began in 1999; however, in
2004, FCDPWES switched to a probabilistic monitoring site selection strategy. At both fixed and
randomly selected sites, FCDPWES biological monitoring found that generally pollution-tolerant
Oligochaeta and Chironomidae were the dominant taxa in the Accotink Creek watershed. Many of
the members of these two taxa are burrowers whose preferred habitat is sand, silt, mud, or detritus.
Their dominance may be due to the availability of their preferred habitat or to the fact that sand,
silt, or mud provides better refuge from high flow events that scour more sensitive taxa, which
prefer larger substrate as their habitat.
Final: 08/30/2017 Watershed Description
Sediment TMDLs for Accotink Creek Watershed 2-1
2 Watershed Description
This section describes the Accotink Creek watershed in greater detail. Section 2.1 discusses
topography, hydrogeomorphic regions, soils, land use, population, and housing. Section 2.2
describes permitted facilities, regulated stormwater, and waste disposal.
2.1 Watershed Description and Identification
Accotink Creek drains approximately 52 mi2 of Northern Virginia. Figure 2-1 shows the
location of Accotink Creek and its watershed. The mainstem of Accotink Creek begins in the City of
Fairfax and flows southeast through Fairfax County and Fort Belvoir4 before entering first Accotink
Bay and then Gunston Cove, an embayment on the tidal Potomac River. Seventy-seven percent of
the Accotink Creek watershed is in Fairfax County; the remainder is in the City of Fairfax (11%),
Fort Belvoir (8%), and the Town of Vienna (4%). The headwaters of Accotink Creek are along
Interstate 66. Most of the watershed is just outside the Capital Beltway. Accotink Creek crosses
Interstate 95 near Springfield, VA, before entering the main post of Fort Belvoir.
The Accotink Creek watershed is highly developed. Overall, according to the analysis of zoning
and planimetric data described in Section 2.1.4, 87% of the Accotink Creek watershed draining to
the impaired segments consists of commercial, industrial, transportation, or residential land, and
impervious surface covers 28% of the watershed draining to impaired segments.
4 Fort Belvoir is a U.S. Army installation that is the headquarters of the National Geospatial-Intelligence Agency and many other Defense Department agencies. It is divided into two sections: Fort Belvoir North Area (803 acres) and the main post (9,530 acres). Under the 2005 Base Realignment and Closure (BRAC) Act, many defense department agencies were relocated to Fort Belvoir. It is currently one of the largest employers in Fairfax County and is expected to generate extensive development in the surrounding area (Fairfax County, 2013).
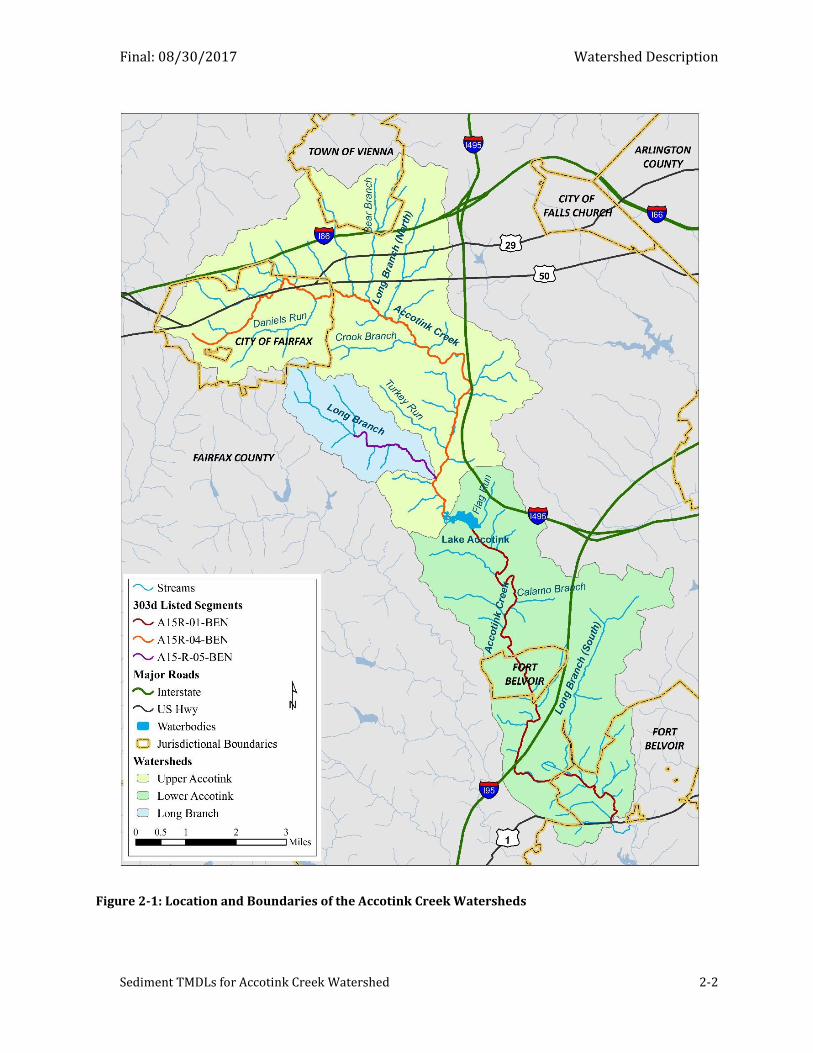
Final: 08/30/2017 Watershed Description
Sediment TMDLs for Accotink Creek Watershed 2-2
Figure 2-1: Location and Boundaries of the Accotink Creek Watersheds
Final: 08/30/2017 Watershed Description
Sediment TMDLs for Accotink Creek Watershed 2-3
Lake Accotink is a 55 acre impoundment on Accotink Creek in the middle of the watershed
(Fairfax County, 2014). It was originally built in the 1940’s as a drinking water reservoir for Fort
Belvoir. The army stopped using it as a source of drinking water in the 1960’s (Fairfax County
Public Schools, 1976), and it is currently operated by the Fairfax County Park Authority for
recreational use as part of the 493 acre Lake Accotink Park.
Figure 2-1 shows the impaired sections of Accotink Creek and Long Branch. Lake Accotink
separates the two impaired sections of the mainstem Accotink Creek, A15R-01-BEN and A15R-04-
BEN, which will be referred to as “lower Accotink Creek” and “upper Accotink Creek,” respectively.
Figure 2-1 also shows the drainage areas associated with the two impairments. The drainage area
for the upper Accotink Creek impairment terminates at the inlet to Lake Accotink. The drainage
area for the lower Accotink Creek impairment includes the upper Accotink Creek drainage, the
drainage of the tributaries to Lake Accotink, and direct drainage to the lake. The drainage areas
above and below the inlet to Lake Accotink will also be referred to as the upper Accotink Creek
watershed and the lower Accotink Creek watershed, respectively.
In addition, Figure 2-1 shows the impaired section of Long Branch and the Long Branch
watershed. There are two other tributaries to Accotink Creek named Long Branch: one has its
headwaters north of Interstate 66, and the other runs parallel to Interstate 95 until it joints with
Accotink Creek in Fort Belvoir (see Figure 2-1). These will be referred to as “Long Branch North”
and “Long Branch South,” respectively, while “Long Branch” will always refer to the impaired
segment and its watershed.
2.1.1 Topography
A National Elevation Dataset (NED) was used to characterize the topography in the watershed
(USGS, 1999). NED data obtained from the United States Geological Survey (USGS) show that
elevation in the upper Accotink watershed, excluding the Long Branch watershed, ranges from
approximately 184 to 492 ft above mean sea level, with an average elevation of 343 ft above mean
sea level, while the elevation in the lower Accotink Creek watershed below Lake Accotink ranges
from approximately eight to 384 ft above mean sea level, with an average elevation of 194 ft. The
elevation in the Long Branch watershed ranges from 186 to 462 ft above mean sea level, with an
average elevation of 337 ft.
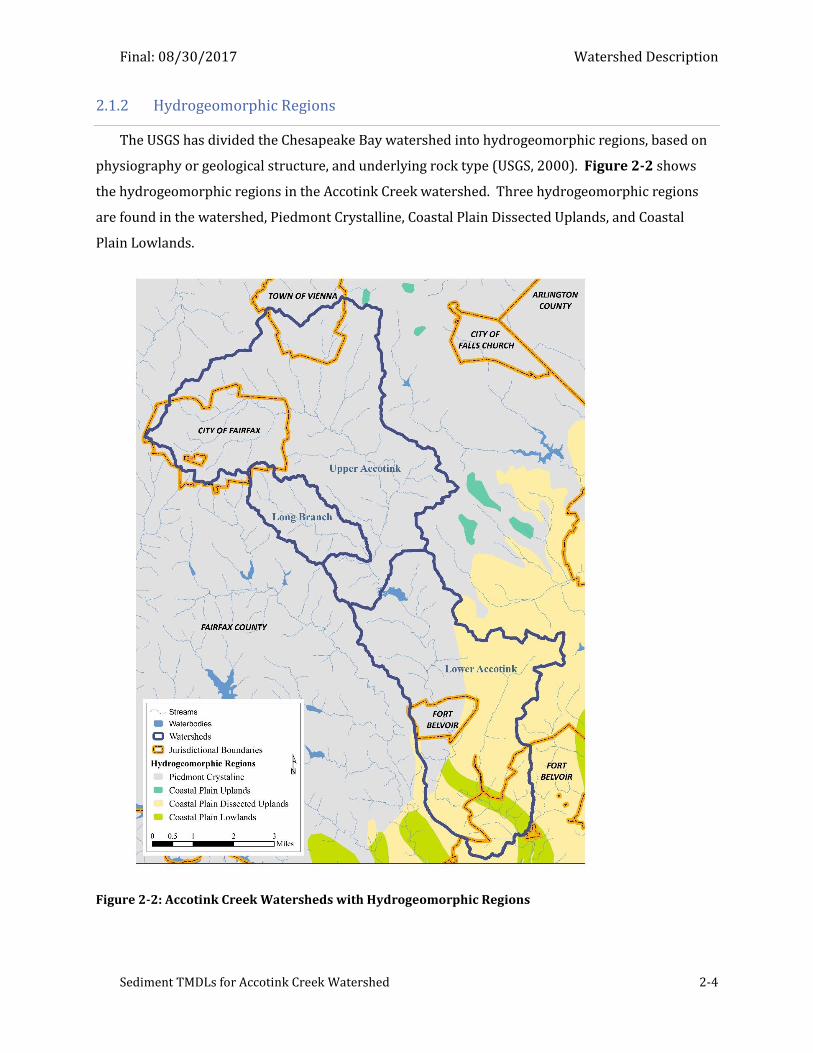
Final: 08/30/2017 Watershed Description
Sediment TMDLs for Accotink Creek Watershed 2-4
2.1.2 Hydrogeomorphic Regions
The USGS has divided the Chesapeake Bay watershed into hydrogeomorphic regions, based on
physiography or geological structure, and underlying rock type (USGS, 2000). Figure 2-2 shows
the hydrogeomorphic regions in the Accotink Creek watershed. Three hydrogeomorphic regions
are found in the watershed, Piedmont Crystalline, Coastal Plain Dissected Uplands, and Coastal
Plain Lowlands.
Figure 2-2: Accotink Creek Watersheds with Hydrogeomorphic Regions
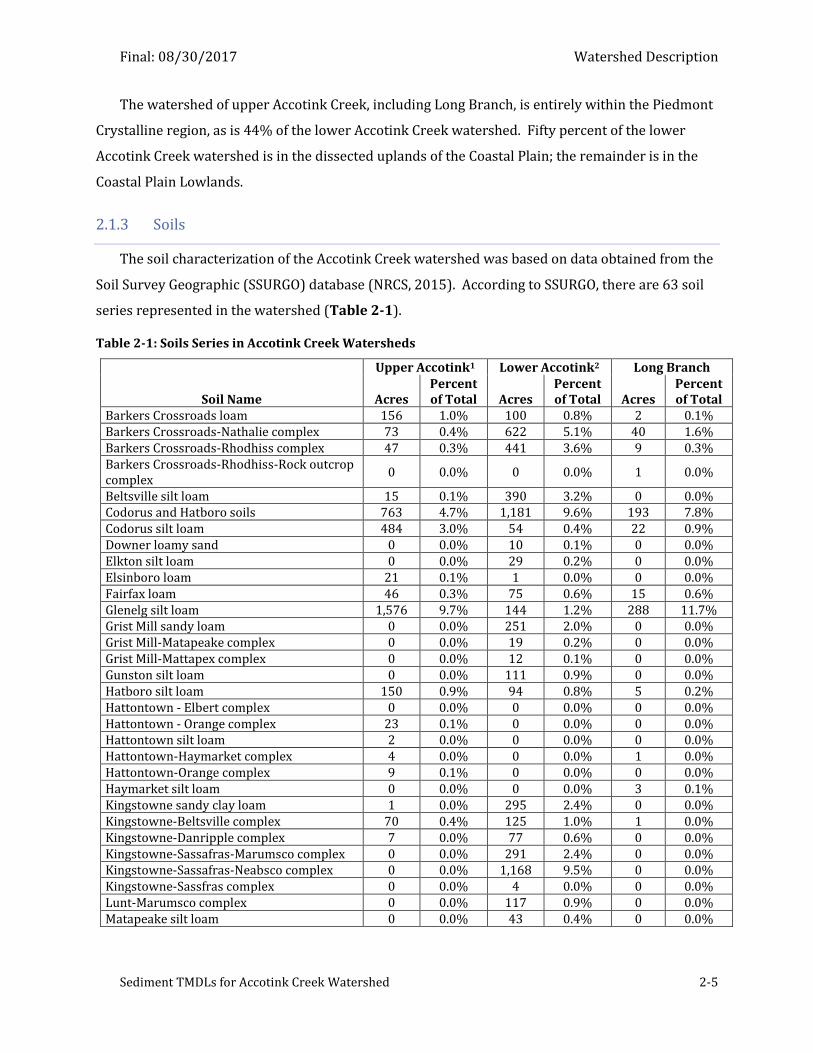
Final: 08/30/2017 Watershed Description
Sediment TMDLs for Accotink Creek Watershed 2-5
The watershed of upper Accotink Creek, including Long Branch, is entirely within the Piedmont
Crystalline region, as is 44% of the lower Accotink Creek watershed. Fifty percent of the lower
Accotink Creek watershed is in the dissected uplands of the Coastal Plain; the remainder is in the
Coastal Plain Lowlands.
2.1.3 Soils
The soil characterization of the Accotink Creek watershed was based on data obtained from the
Soil Survey Geographic (SSURGO) database (NRCS, 2015). According to SSURGO, there are 63 soil
series represented in the watershed (Table 2-1).
Table 2-1: Soils Series in Accotink Creek Watersheds
Soil Name
Upper Accotink1 Lower Accotink2 Long Branch
Acres Percent of Total Acres
Percent of Total Acres
Percent of Total
Barkers Crossroads loam 156 1.0% 100 0.8% 2 0.1% Barkers Crossroads-Nathalie complex 73 0.4% 622 5.1% 40 1.6% Barkers Crossroads-Rhodhiss complex 47 0.3% 441 3.6% 9 0.3% Barkers Crossroads-Rhodhiss-Rock outcrop complex
0 0.0% 0 0.0% 1 0.0%
Beltsville silt loam 15 0.1% 390 3.2% 0 0.0% Codorus and Hatboro soils 763 4.7% 1,181 9.6% 193 7.8% Codorus silt loam 484 3.0% 54 0.4% 22 0.9% Downer loamy sand 0 0.0% 10 0.1% 0 0.0% Elkton silt loam 0 0.0% 29 0.2% 0 0.0% Elsinboro loam 21 0.1% 1 0.0% 0 0.0% Fairfax loam 46 0.3% 75 0.6% 15 0.6% Glenelg silt loam 1,576 9.7% 144 1.2% 288 11.7% Grist Mill sandy loam 0 0.0% 251 2.0% 0 0.0% Grist Mill-Matapeake complex 0 0.0% 19 0.2% 0 0.0% Grist Mill-Mattapex complex 0 0.0% 12 0.1% 0 0.0% Gunston silt loam 0 0.0% 111 0.9% 0 0.0% Hatboro silt loam 150 0.9% 94 0.8% 5 0.2% Hattontown - Elbert complex 0 0.0% 0 0.0% 0 0.0% Hattontown - Orange complex 23 0.1% 0 0.0% 0 0.0% Hattontown silt loam 2 0.0% 0 0.0% 0 0.0% Hattontown-Haymarket complex 4 0.0% 0 0.0% 1 0.0% Hattontown-Orange complex 9 0.1% 0 0.0% 0 0.0% Haymarket silt loam 0 0.0% 0 0.0% 3 0.1% Kingstowne sandy clay loam 1 0.0% 295 2.4% 0 0.0% Kingstowne-Beltsville complex 70 0.4% 125 1.0% 1 0.0% Kingstowne-Danripple complex 7 0.0% 77 0.6% 0 0.0% Kingstowne-Sassafras-Marumsco complex 0 0.0% 291 2.4% 0 0.0% Kingstowne-Sassafras-Neabsco complex 0 0.0% 1,168 9.5% 0 0.0% Kingstowne-Sassfras complex 0 0.0% 4 0.0% 0 0.0% Lunt-Marumsco complex 0 0.0% 117 0.9% 0 0.0% Matapeake silt loam 0 0.0% 43 0.4% 0 0.0%
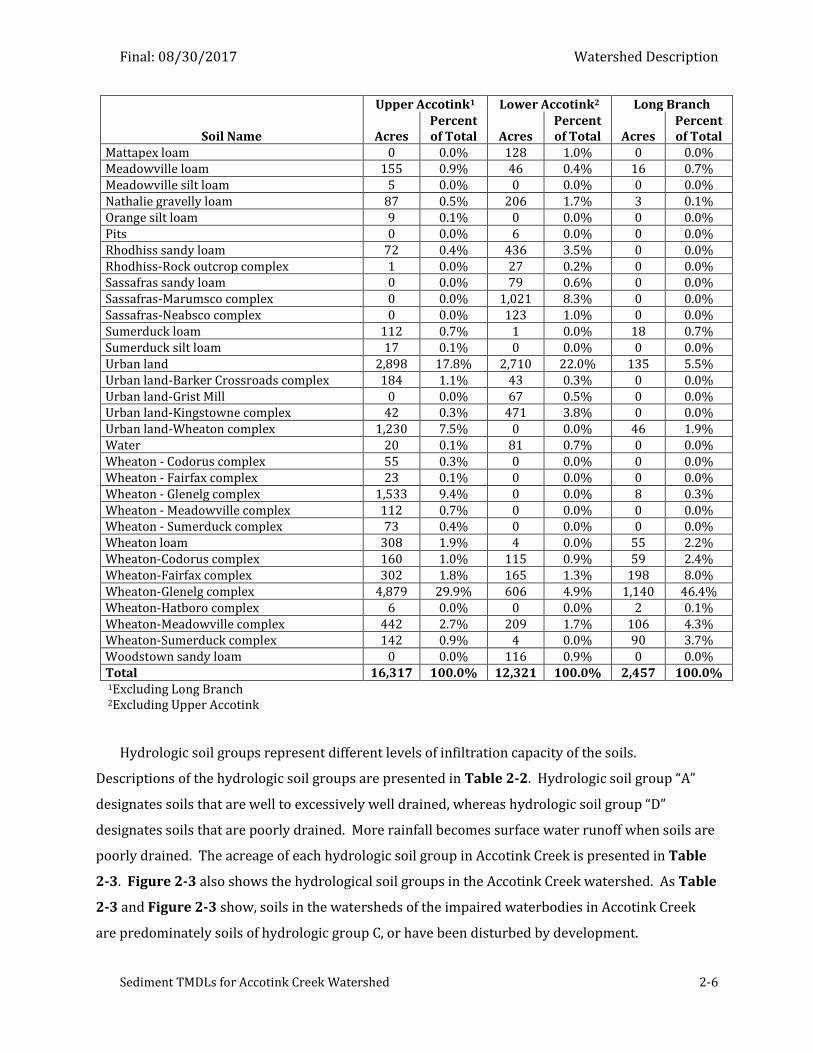
Final: 08/30/2017 Watershed Description
Sediment TMDLs for Accotink Creek Watershed 2-6
Soil Name
Upper Accotink1 Lower Accotink2 Long Branch
Acres Percent of Total Acres
Percent of Total Acres
Percent of Total
Mattapex loam 0 0.0% 128 1.0% 0 0.0% Meadowville loam 155 0.9% 46 0.4% 16 0.7% Meadowville silt loam 5 0.0% 0 0.0% 0 0.0% Nathalie gravelly loam 87 0.5% 206 1.7% 3 0.1% Orange silt loam 9 0.1% 0 0.0% 0 0.0% Pits 0 0.0% 6 0.0% 0 0.0% Rhodhiss sandy loam 72 0.4% 436 3.5% 0 0.0% Rhodhiss-Rock outcrop complex 1 0.0% 27 0.2% 0 0.0% Sassafras sandy loam 0 0.0% 79 0.6% 0 0.0% Sassafras-Marumsco complex 0 0.0% 1,021 8.3% 0 0.0% Sassafras-Neabsco complex 0 0.0% 123 1.0% 0 0.0% Sumerduck loam 112 0.7% 1 0.0% 18 0.7% Sumerduck silt loam 17 0.1% 0 0.0% 0 0.0% Urban land 2,898 17.8% 2,710 22.0% 135 5.5% Urban land-Barker Crossroads complex 184 1.1% 43 0.3% 0 0.0% Urban land-Grist Mill 0 0.0% 67 0.5% 0 0.0% Urban land-Kingstowne complex 42 0.3% 471 3.8% 0 0.0% Urban land-Wheaton complex 1,230 7.5% 0 0.0% 46 1.9% Water 20 0.1% 81 0.7% 0 0.0% Wheaton - Codorus complex 55 0.3% 0 0.0% 0 0.0% Wheaton - Fairfax complex 23 0.1% 0 0.0% 0 0.0% Wheaton - Glenelg complex 1,533 9.4% 0 0.0% 8 0.3% Wheaton - Meadowville complex 112 0.7% 0 0.0% 0 0.0% Wheaton - Sumerduck complex 73 0.4% 0 0.0% 0 0.0% Wheaton loam 308 1.9% 4 0.0% 55 2.2% Wheaton-Codorus complex 160 1.0% 115 0.9% 59 2.4% Wheaton-Fairfax complex 302 1.8% 165 1.3% 198 8.0% Wheaton-Glenelg complex 4,879 29.9% 606 4.9% 1,140 46.4% Wheaton-Hatboro complex 6 0.0% 0 0.0% 2 0.1% Wheaton-Meadowville complex 442 2.7% 209 1.7% 106 4.3% Wheaton-Sumerduck complex 142 0.9% 4 0.0% 90 3.7% Woodstown sandy loam 0 0.0% 116 0.9% 0 0.0% Total 16,317 100.0% 12,321 100.0% 2,457 100.0% 1Excluding Long Branch 2Excluding Upper Accotink
Hydrologic soil groups represent different levels of infiltration capacity of the soils.
Descriptions of the hydrologic soil groups are presented in Table 2-2. Hydrologic soil group “A”
designates soils that are well to excessively well drained, whereas hydrologic soil group “D”
designates soils that are poorly drained. More rainfall becomes surface water runoff when soils are
poorly drained. The acreage of each hydrologic soil group in Accotink Creek is presented in Table
2-3. Figure 2-3 also shows the hydrological soil groups in the Accotink Creek watershed. As Table
2-3 and Figure 2-3 show, soils in the watersheds of the impaired waterbodies in Accotink Creek
are predominately soils of hydrologic group C, or have been disturbed by development.
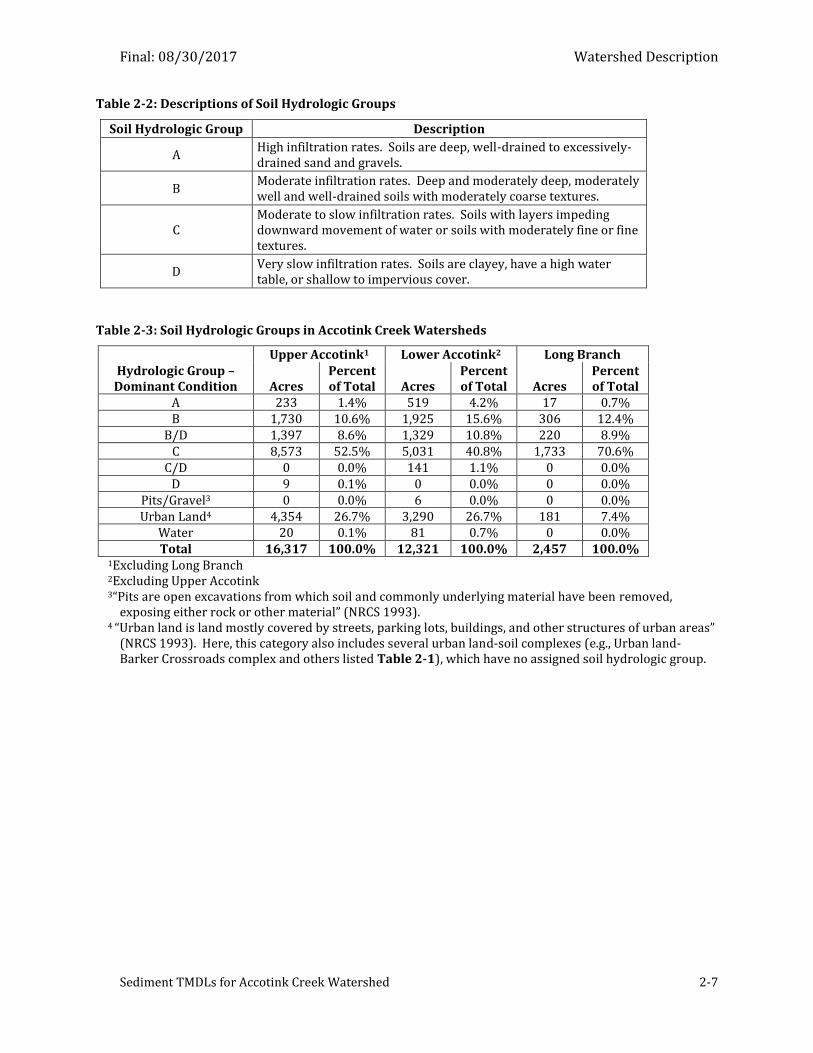
Final: 08/30/2017 Watershed Description
Sediment TMDLs for Accotink Creek Watershed 2-7
Table 2-2: Descriptions of Soil Hydrologic Groups
Soil Hydrologic Group Description
A High infiltration rates. Soils are deep, well-drained to excessively-drained sand and gravels.
B Moderate infiltration rates. Deep and moderately deep, moderately well and well-drained soils with moderately coarse textures.
C Moderate to slow infiltration rates. Soils with layers impeding downward movement of water or soils with moderately fine or fine textures.
D Very slow infiltration rates. Soils are clayey, have a high water table, or shallow to impervious cover.
Table 2-3: Soil Hydrologic Groups in Accotink Creek Watersheds
Hydrologic Group – Dominant Condition
Upper Accotink1 Lower Accotink2 Long Branch
Acres Percent of Total Acres
Percent of Total Acres
Percent of Total
A 233 1.4% 519 4.2% 17 0.7%
B 1,730 10.6% 1,925 15.6% 306 12.4%
B/D 1,397 8.6% 1,329 10.8% 220 8.9% C 8,573 52.5% 5,031 40.8% 1,733 70.6%
C/D 0 0.0% 141 1.1% 0 0.0%
D 9 0.1% 0 0.0% 0 0.0%
Pits/Gravel3 0 0.0% 6 0.0% 0 0.0%
Urban Land4 4,354 26.7% 3,290 26.7% 181 7.4%
Water 20 0.1% 81 0.7% 0 0.0%
Total 16,317 100.0% 12,321 100.0% 2,457 100.0% 1Excluding Long Branch 2Excluding Upper Accotink 3“Pits are open excavations from which soil and commonly underlying material have been removed,
exposing either rock or other material” (NRCS 1993). 4 “Urban land is land mostly covered by streets, parking lots, buildings, and other structures of urban areas”
(NRCS 1993). Here, this category also includes several urban land-soil complexes (e.g., Urban land-Barker Crossroads complex and others listed Table 2-1), which have no assigned soil hydrologic group.
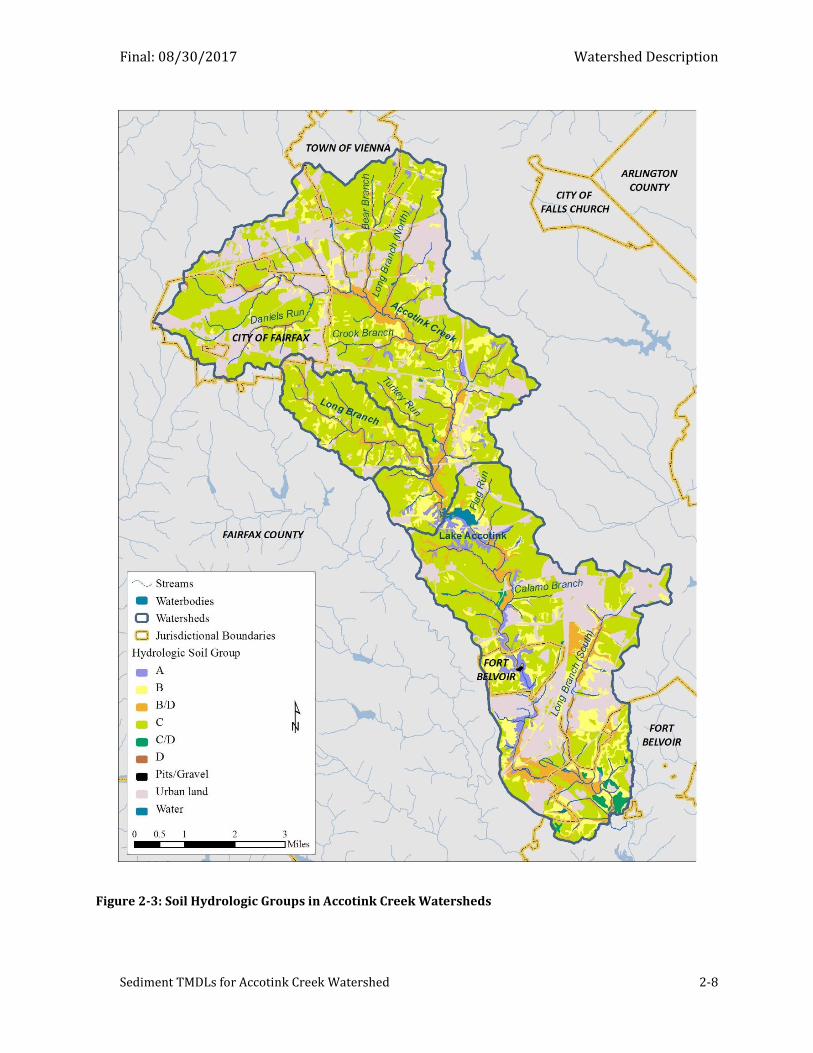
Final: 08/30/2017 Watershed Description
Sediment TMDLs for Accotink Creek Watershed 2-8
Figure 2-3: Soil Hydrologic Groups in Accotink Creek Watersheds
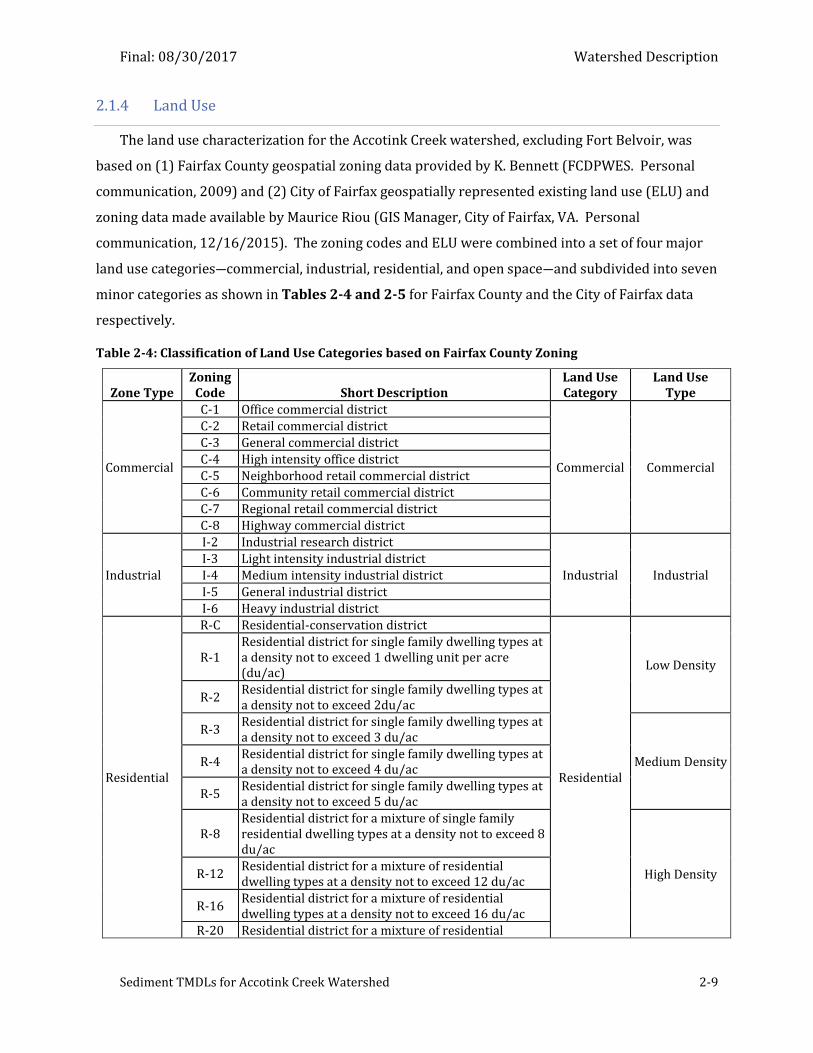
Final: 08/30/2017 Watershed Description
Sediment TMDLs for Accotink Creek Watershed 2-9
2.1.4 Land Use
The land use characterization for the Accotink Creek watershed, excluding Fort Belvoir, was
based on (1) Fairfax County geospatial zoning data provided by K. Bennett (FCDPWES. Personal
communication, 2009) and (2) City of Fairfax geospatially represented existing land use (ELU) and
zoning data made available by Maurice Riou (GIS Manager, City of Fairfax, VA. Personal
communication, 12/16/2015). The zoning codes and ELU were combined into a set of four major
land use categories―commercial, industrial, residential, and open space―and subdivided into seven
minor categories as shown in Tables 2-4 and 2-5 for Fairfax County and the City of Fairfax data
respectively.
Table 2-4: Classification of Land Use Categories based on Fairfax County Zoning
Zone Type Zoning
Code Short Description Land Use Category
Land Use Type
Commercial
C-1 Office commercial district
Commercial Commercial
C-2 Retail commercial district
C-3 General commercial district
C-4 High intensity office district
C-5 Neighborhood retail commercial district
C-6 Community retail commercial district C-7 Regional retail commercial district
C-8 Highway commercial district
Industrial
I-2 Industrial research district
Industrial Industrial
I-3 Light intensity industrial district
I-4 Medium intensity industrial district
I-5 General industrial district
I-6 Heavy industrial district
Residential
R-C Residential-conservation district
Residential
Low Density R-1
Residential district for single family dwelling types at a density not to exceed 1 dwelling unit per acre (du/ac)
R-2 Residential district for single family dwelling types at a density not to exceed 2du/ac
R-3 Residential district for single family dwelling types at a density not to exceed 3 du/ac
Medium Density R-4 Residential district for single family dwelling types at a density not to exceed 4 du/ac
R-5 Residential district for single family dwelling types at a density not to exceed 5 du/ac
R-8 Residential district for a mixture of single family residential dwelling types at a density not to exceed 8 du/ac
High Density R-12 Residential district for a mixture of residential dwelling types at a density not to exceed 12 du/ac
R-16 Residential district for a mixture of residential dwelling types at a density not to exceed 16 du/ac
R-20 Residential district for a mixture of residential
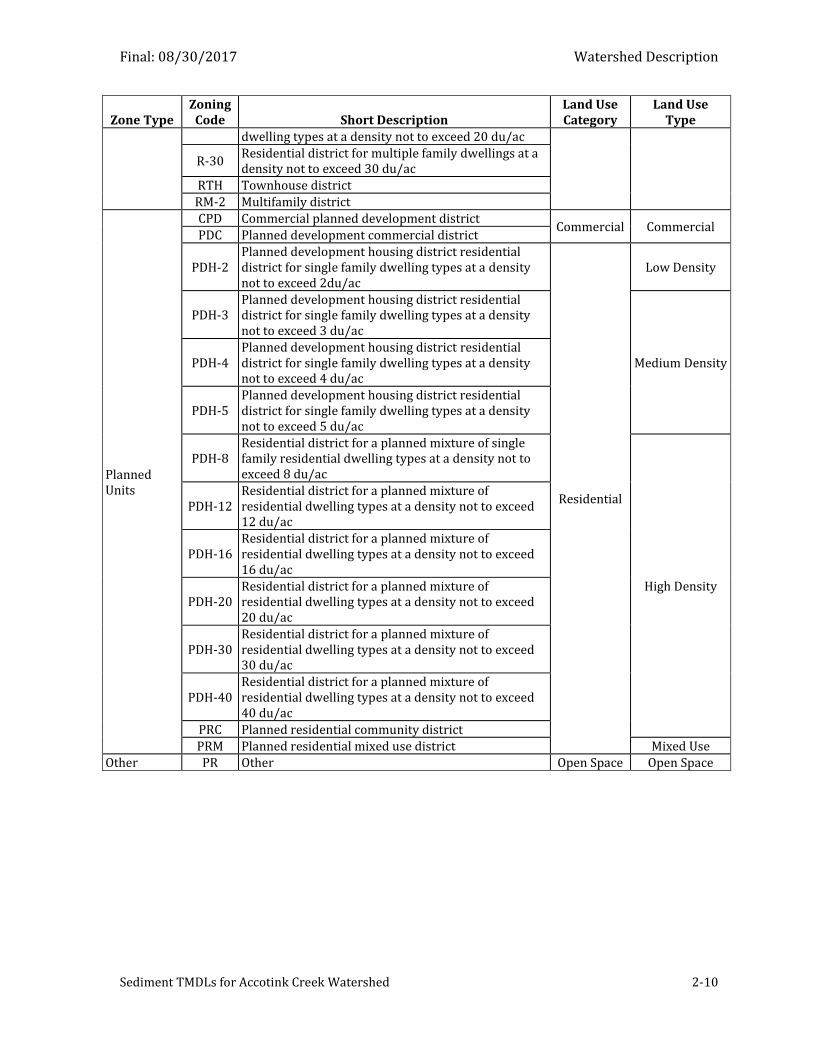
Final: 08/30/2017 Watershed Description
Sediment TMDLs for Accotink Creek Watershed 2-10
Zone Type Zoning
Code Short Description Land Use Category
Land Use Type
dwelling types at a density not to exceed 20 du/ac
R-30 Residential district for multiple family dwellings at a density not to exceed 30 du/ac
RTH Townhouse district
RM-2 Multifamily district
Planned Units
CPD Commercial planned development district Commercial Commercial
PDC Planned development commercial district
PDH-2 Planned development housing district residential district for single family dwelling types at a density not to exceed 2du/ac
Residential
Low Density
PDH-3 Planned development housing district residential district for single family dwelling types at a density not to exceed 3 du/ac
Medium Density PDH-4 Planned development housing district residential district for single family dwelling types at a density not to exceed 4 du/ac
PDH-5 Planned development housing district residential district for single family dwelling types at a density not to exceed 5 du/ac
PDH-8 Residential district for a planned mixture of single family residential dwelling types at a density not to exceed 8 du/ac
High Density
PDH-12 Residential district for a planned mixture of residential dwelling types at a density not to exceed 12 du/ac
PDH-16 Residential district for a planned mixture of residential dwelling types at a density not to exceed 16 du/ac
PDH-20 Residential district for a planned mixture of residential dwelling types at a density not to exceed 20 du/ac
PDH-30 Residential district for a planned mixture of residential dwelling types at a density not to exceed 30 du/ac
PDH-40 Residential district for a planned mixture of residential dwelling types at a density not to exceed 40 du/ac
PRC Planned residential community district
PRM Planned residential mixed use district Mixed Use Other PR Other Open Space Open Space
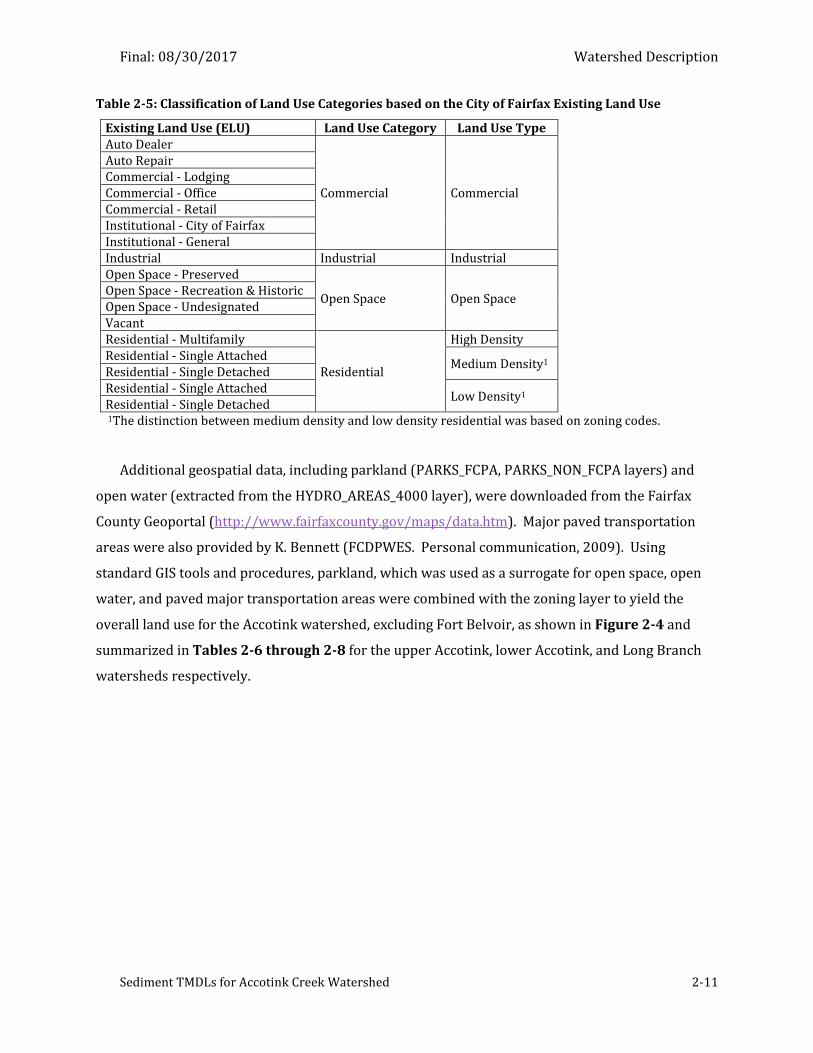
Final: 08/30/2017 Watershed Description
Sediment TMDLs for Accotink Creek Watershed 2-11
Table 2-5: Classification of Land Use Categories based on the City of Fairfax Existing Land Use
Existing Land Use (ELU) Land Use Category Land Use Type Auto Dealer
Commercial Commercial
Auto Repair Commercial - Lodging Commercial - Office Commercial - Retail Institutional - City of Fairfax Institutional - General Industrial Industrial Industrial Open Space - Preserved
Open Space Open Space Open Space - Recreation & Historic Open Space - Undesignated Vacant Residential - Multifamily
Residential
High Density Residential - Single Attached
Medium Density1
Residential - Single Detached Residential - Single Attached
Low Density1 Residential - Single Detached 1The distinction between medium density and low density residential was based on zoning codes.
Additional geospatial data, including parkland (PARKS_FCPA, PARKS_NON_FCPA layers) and
open water (extracted from the HYDRO_AREAS_4000 layer), were downloaded from the Fairfax
County Geoportal (http://www.fairfaxcounty.gov/maps/data.htm). Major paved transportation
areas were also provided by K. Bennett (FCDPWES. Personal communication, 2009). Using
standard GIS tools and procedures, parkland, which was used as a surrogate for open space, open
water, and paved major transportation areas were combined with the zoning layer to yield the
overall land use for the Accotink watershed, excluding Fort Belvoir, as shown in Figure 2-4 and
summarized in Tables 2-6 through 2-8 for the upper Accotink, lower Accotink, and Long Branch
watersheds respectively.
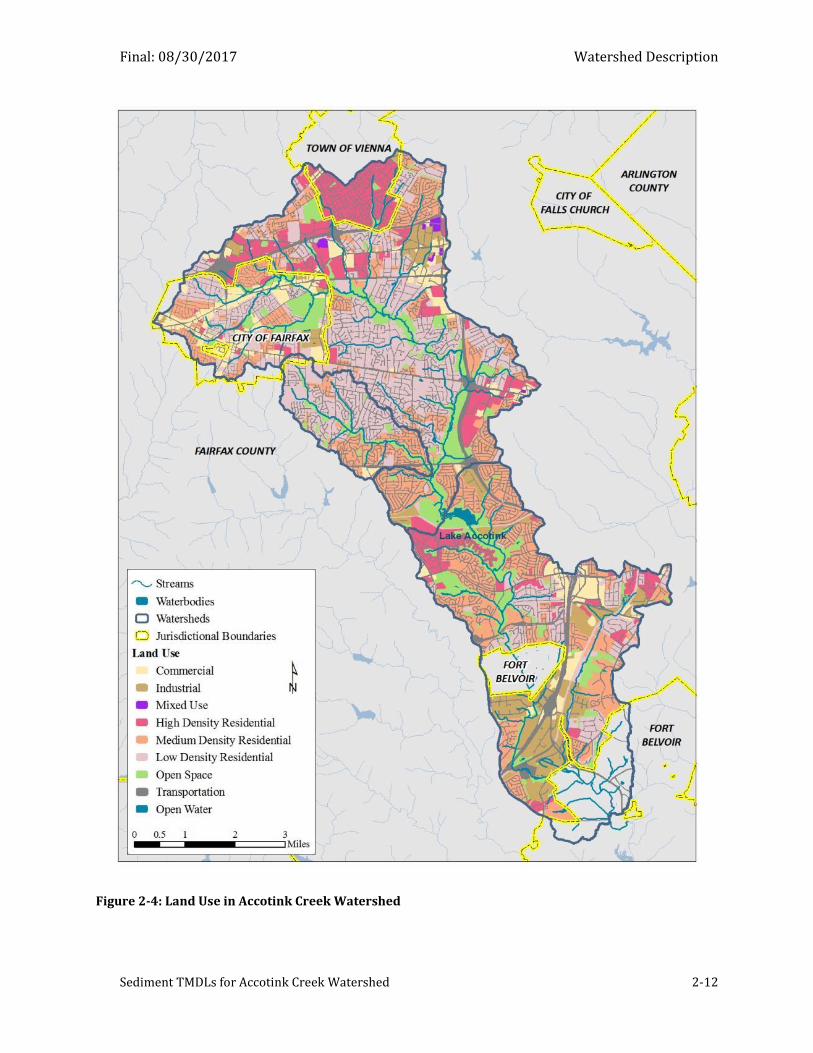
Final: 08/30/2017 Watershed Description
Sediment TMDLs for Accotink Creek Watershed 2-12
Figure 2-4: Land Use in Accotink Creek Watershed
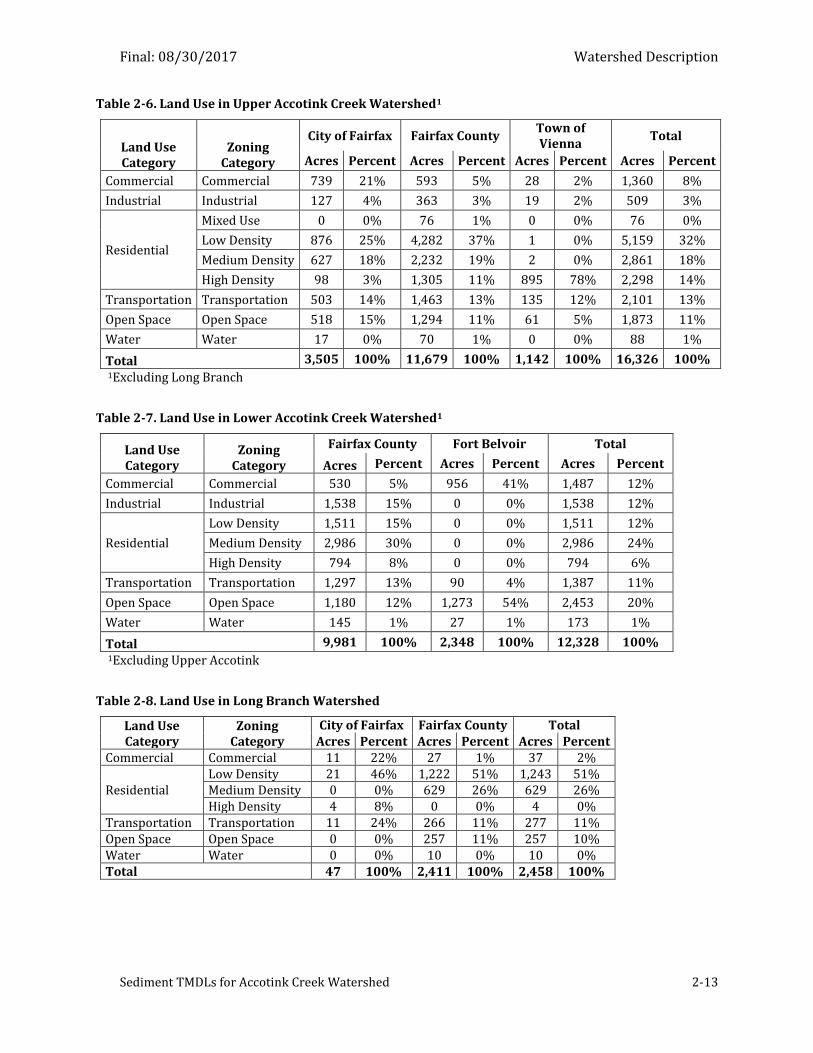
Final: 08/30/2017 Watershed Description
Sediment TMDLs for Accotink Creek Watershed 2-13
Table 2-6. Land Use in Upper Accotink Creek Watershed1
Land Use Category
Zoning Category
City of Fairfax Fairfax County Town of Vienna
Total
Acres Percent Acres Percent Acres Percent Acres Percent
Commercial Commercial 739 21% 593 5% 28 2% 1,360 8%
Industrial Industrial 127 4% 363 3% 19 2% 509 3%
Residential
Mixed Use 0 0% 76 1% 0 0% 76 0%
Low Density 876 25% 4,282 37% 1 0% 5,159 32%
Medium Density 627 18% 2,232 19% 2 0% 2,861 18%
High Density 98 3% 1,305 11% 895 78% 2,298 14%
Transportation Transportation 503 14% 1,463 13% 135 12% 2,101 13%
Open Space Open Space 518 15% 1,294 11% 61 5% 1,873 11%
Water Water 17 0% 70 1% 0 0% 88 1%
Total 3,505 100% 11,679 100% 1,142 100% 16,326 100% 1Excluding Long Branch
Table 2-7. Land Use in Lower Accotink Creek Watershed1
Land Use Category
Zoning Category
Fairfax County Fort Belvoir Total
Acres Percent Acres Percent Acres Percent
Commercial Commercial 530 5% 956 41% 1,487 12%
Industrial Industrial 1,538 15% 0 0% 1,538 12%
Residential
Low Density 1,511 15% 0 0% 1,511 12%
Medium Density 2,986 30% 0 0% 2,986 24%
High Density 794 8% 0 0% 794 6%
Transportation Transportation 1,297 13% 90 4% 1,387 11%
Open Space Open Space 1,180 12% 1,273 54% 2,453 20%
Water Water 145 1% 27 1% 173 1%
Total 9,981 100% 2,348 100% 12,328 100% 1Excluding Upper Accotink
Table 2-8. Land Use in Long Branch Watershed
Land Use Category
Zoning Category
City of Fairfax Fairfax County Total Acres Percent Acres Percent Acres Percent
Commercial Commercial 11 22% 27 1% 37 2%
Residential Low Density 21 46% 1,222 51% 1,243 51% Medium Density 0 0% 629 26% 629 26% High Density 4 8% 0 0% 4 0%
Transportation Transportation 11 24% 266 11% 277 11% Open Space Open Space 0 0% 257 11% 257 10% Water Water 0 0% 10 0% 10 0% Total 47 100% 2,411 100% 2,458 100%
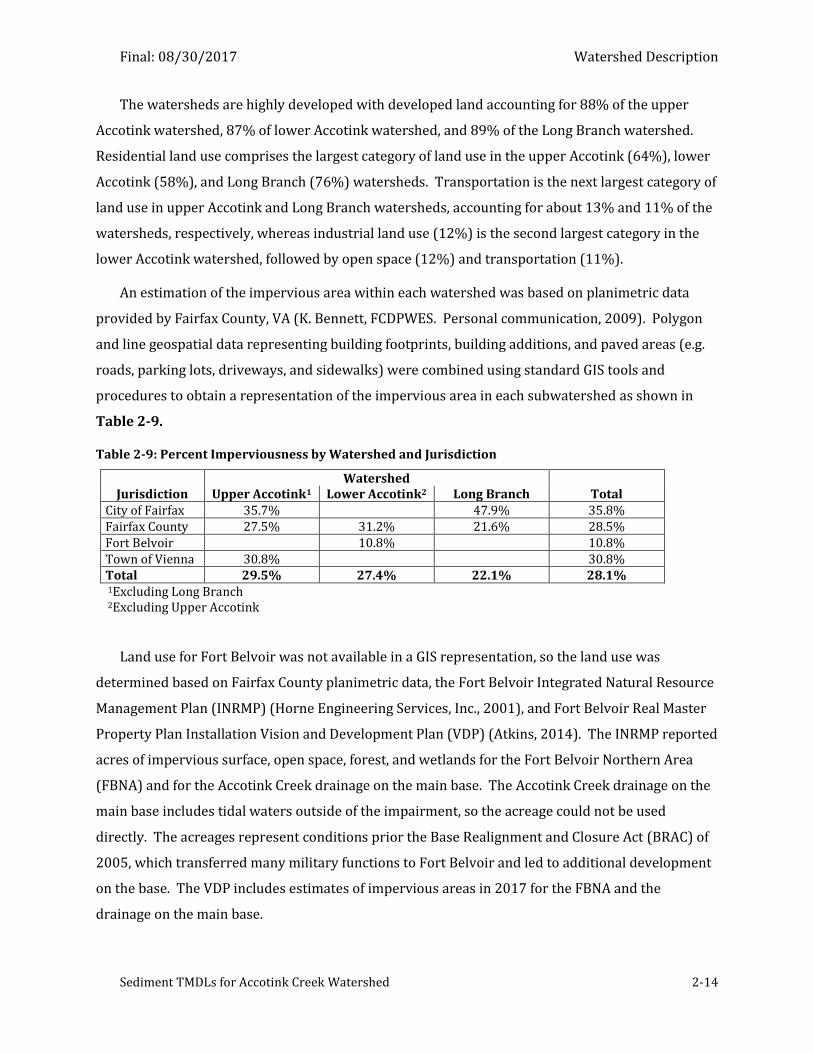
Final: 08/30/2017 Watershed Description
Sediment TMDLs for Accotink Creek Watershed 2-14
The watersheds are highly developed with developed land accounting for 88% of the upper
Accotink watershed, 87% of lower Accotink watershed, and 89% of the Long Branch watershed.
Residential land use comprises the largest category of land use in the upper Accotink (64%), lower
Accotink (58%), and Long Branch (76%) watersheds. Transportation is the next largest category of
land use in upper Accotink and Long Branch watersheds, accounting for about 13% and 11% of the
watersheds, respectively, whereas industrial land use (12%) is the second largest category in the
lower Accotink watershed, followed by open space (12%) and transportation (11%).
An estimation of the impervious area within each watershed was based on planimetric data
provided by Fairfax County, VA (K. Bennett, FCDPWES. Personal communication, 2009). Polygon
and line geospatial data representing building footprints, building additions, and paved areas (e.g.
roads, parking lots, driveways, and sidewalks) were combined using standard GIS tools and
procedures to obtain a representation of the impervious area in each subwatershed as shown in
Table 2-9.
Table 2-9: Percent Imperviousness by Watershed and Jurisdiction
Jurisdiction Watershed
Upper Accotink1 Lower Accotink2 Long Branch Total City of Fairfax 35.7% 47.9% 35.8% Fairfax County 27.5% 31.2% 21.6% 28.5% Fort Belvoir 10.8% 10.8% Town of Vienna 30.8% 30.8% Total 29.5% 27.4% 22.1% 28.1% 1Excluding Long Branch 2Excluding Upper Accotink
Land use for Fort Belvoir was not available in a GIS representation, so the land use was
determined based on Fairfax County planimetric data, the Fort Belvoir Integrated Natural Resource
Management Plan (INRMP) (Horne Engineering Services, Inc., 2001), and Fort Belvoir Real Master
Property Plan Installation Vision and Development Plan (VDP) (Atkins, 2014). The INRMP reported
acres of impervious surface, open space, forest, and wetlands for the Fort Belvoir Northern Area
(FBNA) and for the Accotink Creek drainage on the main base. The Accotink Creek drainage on the
main base includes tidal waters outside of the impairment, so the acreage could not be used
directly. The acreages represent conditions prior the Base Realignment and Closure Act (BRAC) of
2005, which transferred many military functions to Fort Belvoir and led to additional development
on the base. The VDP includes estimates of impervious areas in 2017 for the FBNA and the
drainage on the main base.
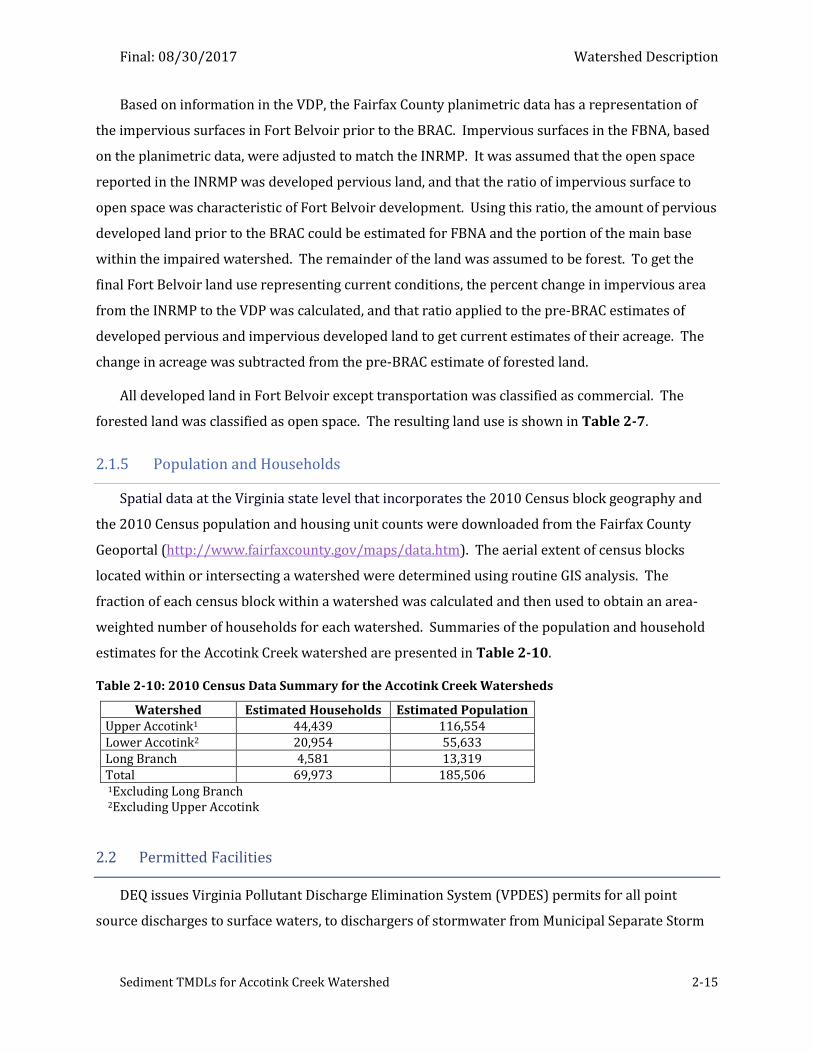
Final: 08/30/2017 Watershed Description
Sediment TMDLs for Accotink Creek Watershed 2-15
Based on information in the VDP, the Fairfax County planimetric data has a representation of
the impervious surfaces in Fort Belvoir prior to the BRAC. Impervious surfaces in the FBNA, based
on the planimetric data, were adjusted to match the INRMP. It was assumed that the open space
reported in the INRMP was developed pervious land, and that the ratio of impervious surface to
open space was characteristic of Fort Belvoir development. Using this ratio, the amount of pervious
developed land prior to the BRAC could be estimated for FBNA and the portion of the main base
within the impaired watershed. The remainder of the land was assumed to be forest. To get the
final Fort Belvoir land use representing current conditions, the percent change in impervious area
from the INRMP to the VDP was calculated, and that ratio applied to the pre-BRAC estimates of
developed pervious and impervious developed land to get current estimates of their acreage. The
change in acreage was subtracted from the pre-BRAC estimate of forested land.
All developed land in Fort Belvoir except transportation was classified as commercial. The
forested land was classified as open space. The resulting land use is shown in Table 2-7.
2.1.5 Population and Households
Spatial data at the Virginia state level that incorporates the 2010 Census block geography and
the 2010 Census population and housing unit counts were downloaded from the Fairfax County
Geoportal (http://www.fairfaxcounty.gov/maps/data.htm). The aerial extent of census blocks
located within or intersecting a watershed were determined using routine GIS analysis. The
fraction of each census block within a watershed was calculated and then used to obtain an area-
weighted number of households for each watershed. Summaries of the population and household
estimates for the Accotink Creek watershed are presented in Table 2-10.
Table 2-10: 2010 Census Data Summary for the Accotink Creek Watersheds
Watershed Estimated Households Estimated Population Upper Accotink1 44,439 116,554 Lower Accotink2 20,954 55,633 Long Branch 4,581 13,319 Total 69,973 185,506 1Excluding Long Branch 2Excluding Upper Accotink
2.2 Permitted Facilities
DEQ issues Virginia Pollutant Discharge Elimination System (VPDES) permits for all point
source discharges to surface waters, to dischargers of stormwater from Municipal Separate Storm
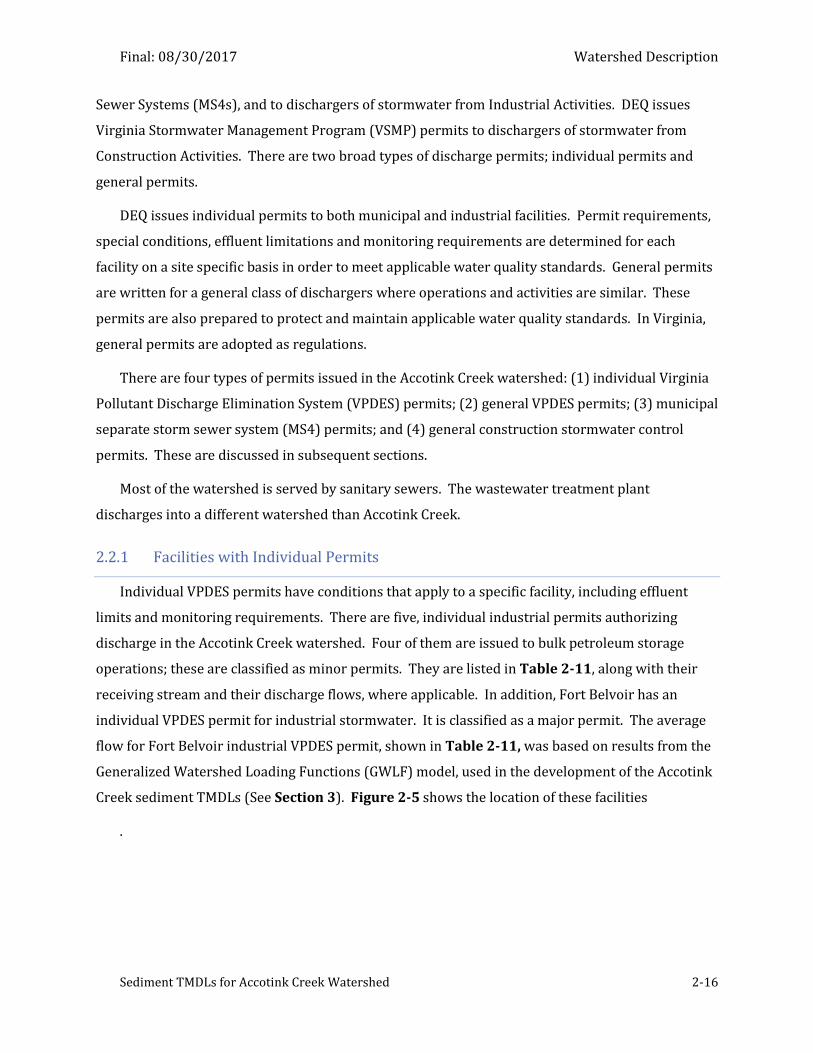
Final: 08/30/2017 Watershed Description
Sediment TMDLs for Accotink Creek Watershed 2-16
Sewer Systems (MS4s), and to dischargers of stormwater from Industrial Activities. DEQ issues
Virginia Stormwater Management Program (VSMP) permits to dischargers of stormwater from
Construction Activities. There are two broad types of discharge permits; individual permits and
general permits.
DEQ issues individual permits to both municipal and industrial facilities. Permit requirements,
special conditions, effluent limitations and monitoring requirements are determined for each
facility on a site specific basis in order to meet applicable water quality standards. General permits
are written for a general class of dischargers where operations and activities are similar. These
permits are also prepared to protect and maintain applicable water quality standards. In Virginia,
general permits are adopted as regulations.
There are four types of permits issued in the Accotink Creek watershed: (1) individual Virginia
Pollutant Discharge Elimination System (VPDES) permits; (2) general VPDES permits; (3) municipal
separate storm sewer system (MS4) permits; and (4) general construction stormwater control
permits. These are discussed in subsequent sections.
Most of the watershed is served by sanitary sewers. The wastewater treatment plant
discharges into a different watershed than Accotink Creek.
2.2.1 Facilities with Individual Permits
Individual VPDES permits have conditions that apply to a specific facility, including effluent
limits and monitoring requirements. There are five, individual industrial permits authorizing
discharge in the Accotink Creek watershed. Four of them are issued to bulk petroleum storage
operations; these are classified as minor permits. They are listed in Table 2-11, along with their
receiving stream and their discharge flows, where applicable. In addition, Fort Belvoir has an
individual VPDES permit for industrial stormwater. It is classified as a major permit. The average
flow for Fort Belvoir industrial VPDES permit, shown in Table 2-11, was based on results from the
Generalized Watershed Loading Functions (GWLF) model, used in the development of the Accotink
Creek sediment TMDLs (See Section 3). Figure 2-5 shows the location of these facilities
.
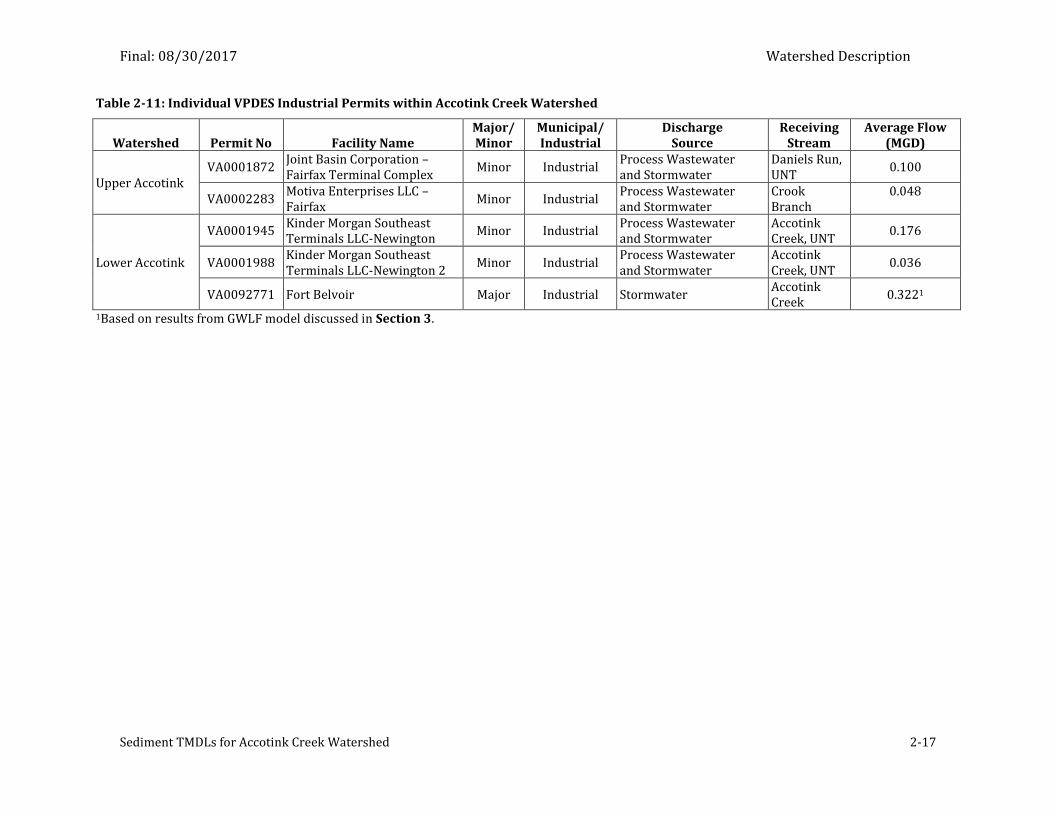
Final: 08/30/2017 Watershed Description
Sediment TMDLs for Accotink Creek Watershed 2-17
Table 2-11: Individual VPDES Industrial Permits within Accotink Creek Watershed
Watershed Permit No Facility Name Major/ Minor
Municipal/ Industrial
Discharge Source
Receiving Stream
Average Flow (MGD)
Upper Accotink VA0001872
Joint Basin Corporation – Fairfax Terminal Complex
Minor Industrial Process Wastewater and Stormwater
Daniels Run, UNT
0.100
VA0002283 Motiva Enterprises LLC – Fairfax
Minor Industrial Process Wastewater and Stormwater
Crook Branch
0.048
Lower Accotink
VA0001945 Kinder Morgan Southeast Terminals LLC-Newington
Minor Industrial Process Wastewater and Stormwater
Accotink Creek, UNT
0.176
VA0001988 Kinder Morgan Southeast Terminals LLC-Newington 2
Minor Industrial Process Wastewater and Stormwater
Accotink Creek, UNT
0.036
VA0092771 Fort Belvoir Major Industrial Stormwater Accotink Creek
0.3221
1Based on results from GWLF model discussed in Section 3.
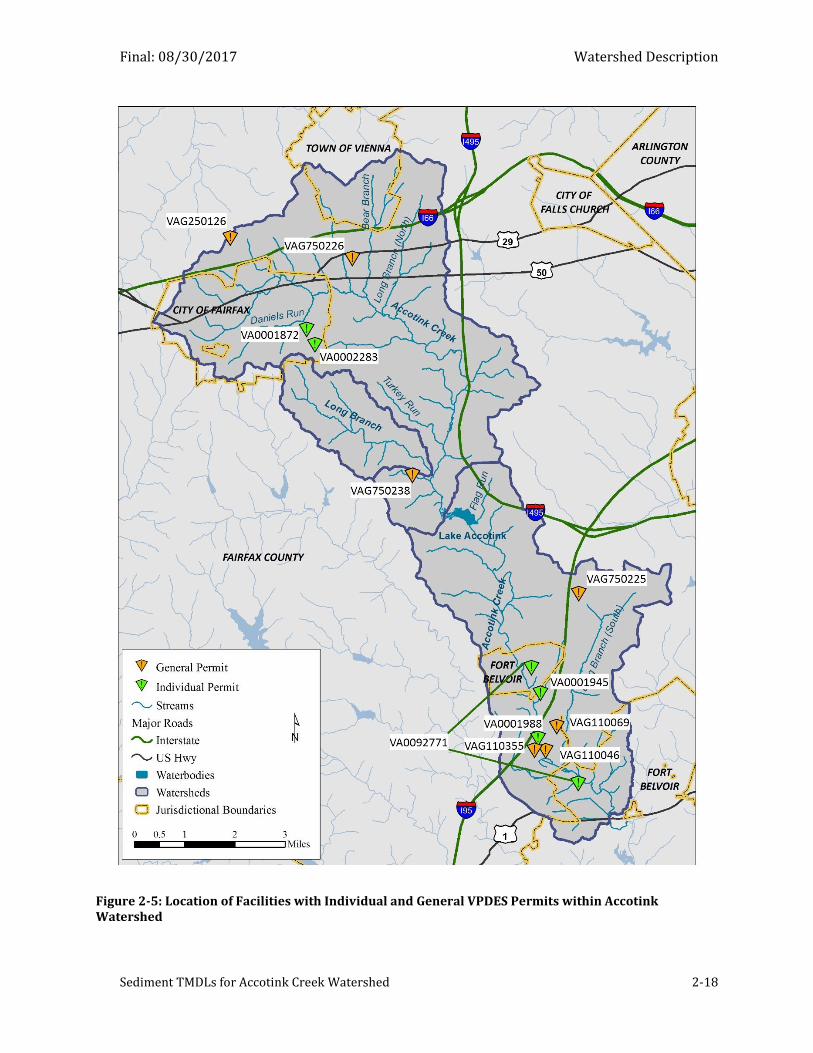
Final: 08/30/2017 Watershed Description
Sediment TMDLs for Accotink Creek Watershed 2-18
Figure 2-5: Location of Facilities with Individual and General VPDES Permits within Accotink Watershed
Final: 08/30/2017 Watershed Description
Sediment TMDLs for Accotink Creek Watershed 2-19
2.2.2 Facilities with General Permits
General permits apply to a class of dischargers. Facilities in Accotink Creek watershed are
registered under the following general permits, excluding the MS4 general permit:
three (3) Vehicle Wash and Laundry facilities;
one (1) Non-contact Cooling Water permittees;
three (3) Concrete Products Facilities;
two (2) permittees under the Domestic Sewage Discharge of Less Than or Equal to
1,000 Gallons per Day;
two (2) facilities authorized under the permit for Petroleum Contaminated Sites and
Hydrostatic Tests;
twelve (12) permits for Discharges of Stormwater Associated with Industrial Activity;
Table 2-12 shows the facilities in Accotink Creek registered under these general permits, not
including discharges of industrial stormwater, the two domestic sewage dischargers, or the two
permits for petroleum contaminated sites and hydrostatic tests. Figure 2-5 shows the location of
facilities with general permits that are identified in Table 2-12. The twelve facilities registered
under the general permit for industrial stormwater are identified in Table 2-13 with their locations
shown in Figure 2-6. One household under the general domestic sewage permit for discharges less
than 1,000 gallons per day is in the upper Accotink Creek watershed, and the other is in the Long
Branch watershed. Facilities authorized to discharge under the general permit for petroleum
contaminated sites, groundwater remediation and/or hydrostatic testing are not presented in the
referenced maps or tables. These permits may be short-lived, depending on the specific
activity. Additionally, a registration statement is not required for certain activities, such as short-
term projects and hydrostatic testing discharges. Because of the nature of permitting these sources
and because these are insignificant sources of sediment, they are not presented in the referenced
maps or tables. Nonetheless, the two permits that were active at the time of writing this report
were both located in the upper Accotink Creek watershed. Permits for discharge of stormwater
from construction activities are discussed in Section 2.2.4.
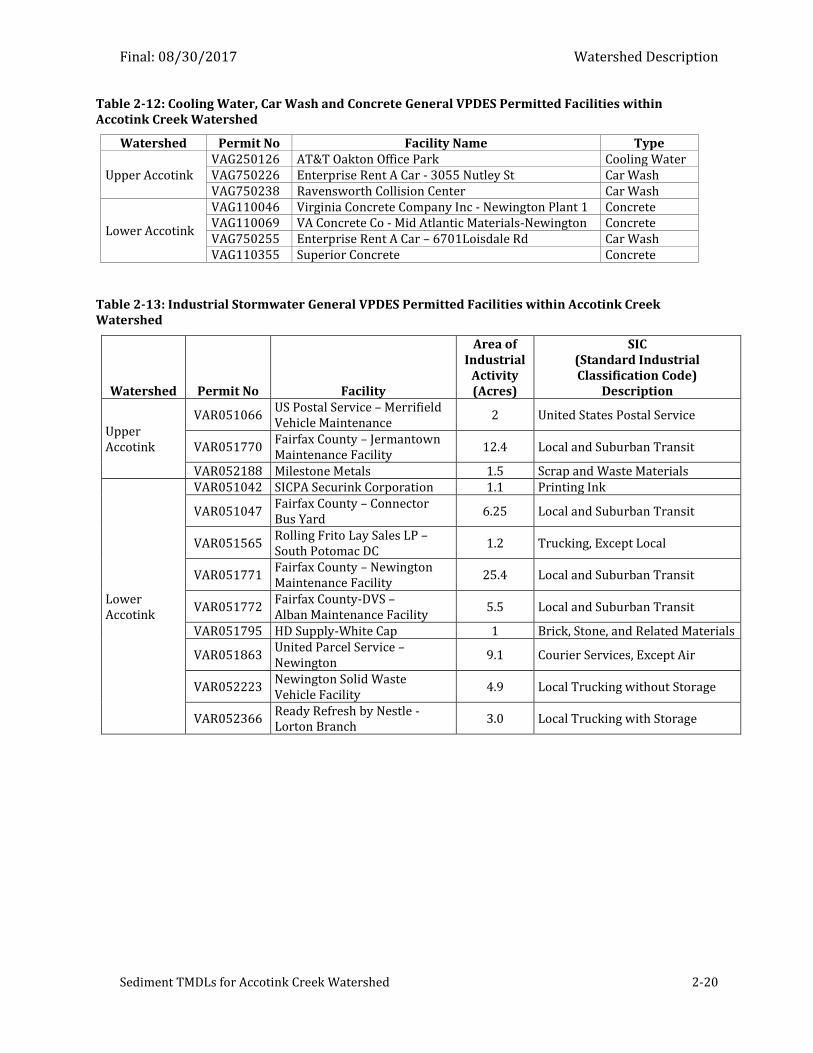
Final: 08/30/2017 Watershed Description
Sediment TMDLs for Accotink Creek Watershed 2-20
Table 2-12: Cooling Water, Car Wash and Concrete General VPDES Permitted Facilities within Accotink Creek Watershed
Watershed Permit No Facility Name Type
Upper Accotink VAG250126 AT&T Oakton Office Park Cooling Water VAG750226 Enterprise Rent A Car - 3055 Nutley St Car Wash VAG750238 Ravensworth Collision Center Car Wash
Lower Accotink
VAG110046 Virginia Concrete Company Inc - Newington Plant 1 Concrete VAG110069 VA Concrete Co - Mid Atlantic Materials-Newington Concrete VAG750255 Enterprise Rent A Car – 6701Loisdale Rd Car Wash VAG110355 Superior Concrete Concrete
Table 2-13: Industrial Stormwater General VPDES Permitted Facilities within Accotink Creek Watershed
Watershed Permit No Facility
Area of Industrial
Activity (Acres)
SIC (Standard Industrial Classification Code)
Description
Upper Accotink
VAR051066 US Postal Service – Merrifield Vehicle Maintenance
2 United States Postal Service
VAR051770 Fairfax County – Jermantown Maintenance Facility
12.4 Local and Suburban Transit
VAR052188 Milestone Metals 1.5 Scrap and Waste Materials
Lower Accotink
VAR051042 SICPA Securink Corporation 1.1 Printing Ink
VAR051047 Fairfax County – Connector Bus Yard
6.25 Local and Suburban Transit
VAR051565 Rolling Frito Lay Sales LP – South Potomac DC
1.2 Trucking, Except Local
VAR051771 Fairfax County – Newington Maintenance Facility
25.4 Local and Suburban Transit
VAR051772 Fairfax County-DVS – Alban Maintenance Facility
5.5 Local and Suburban Transit
VAR051795 HD Supply-White Cap 1 Brick, Stone, and Related Materials
VAR051863 United Parcel Service – Newington
9.1 Courier Services, Except Air
VAR052223 Newington Solid Waste Vehicle Facility
4.9 Local Trucking without Storage
VAR052366 Ready Refresh by Nestle - Lorton Branch
3.0 Local Trucking with Storage
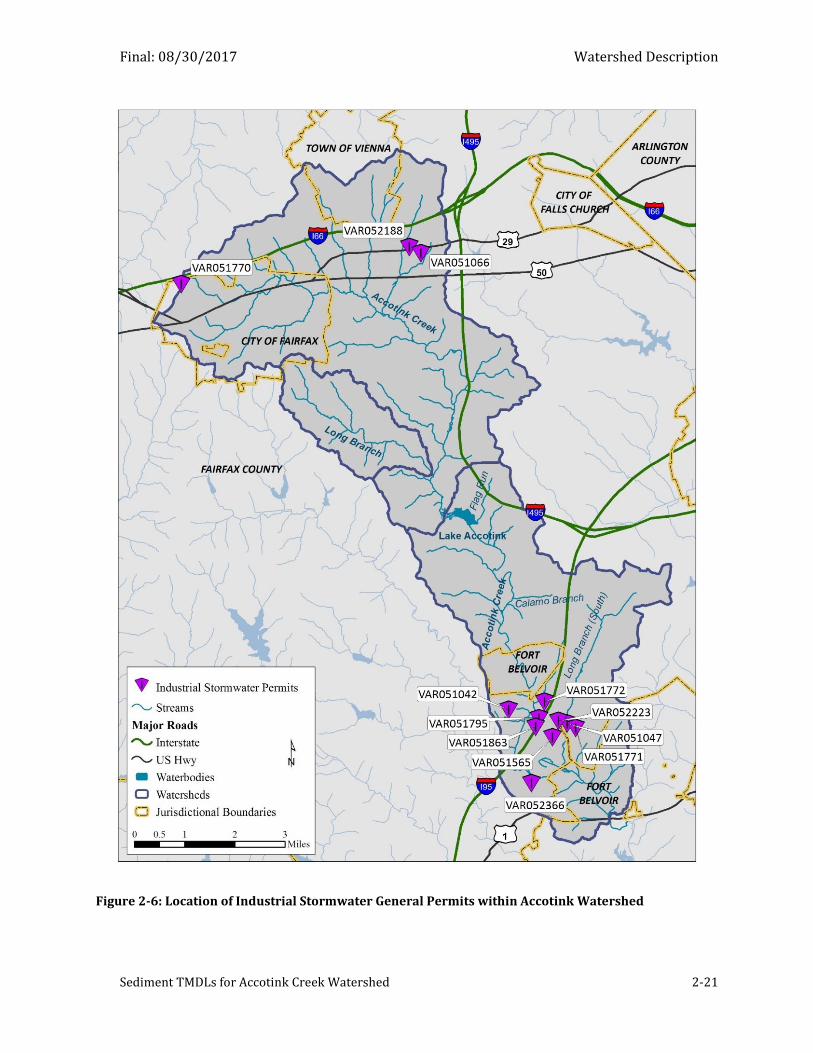
Final: 08/30/2017 Watershed Description
Sediment TMDLs for Accotink Creek Watershed 2-21
Figure 2-6: Location of Industrial Stormwater General Permits within Accotink Watershed
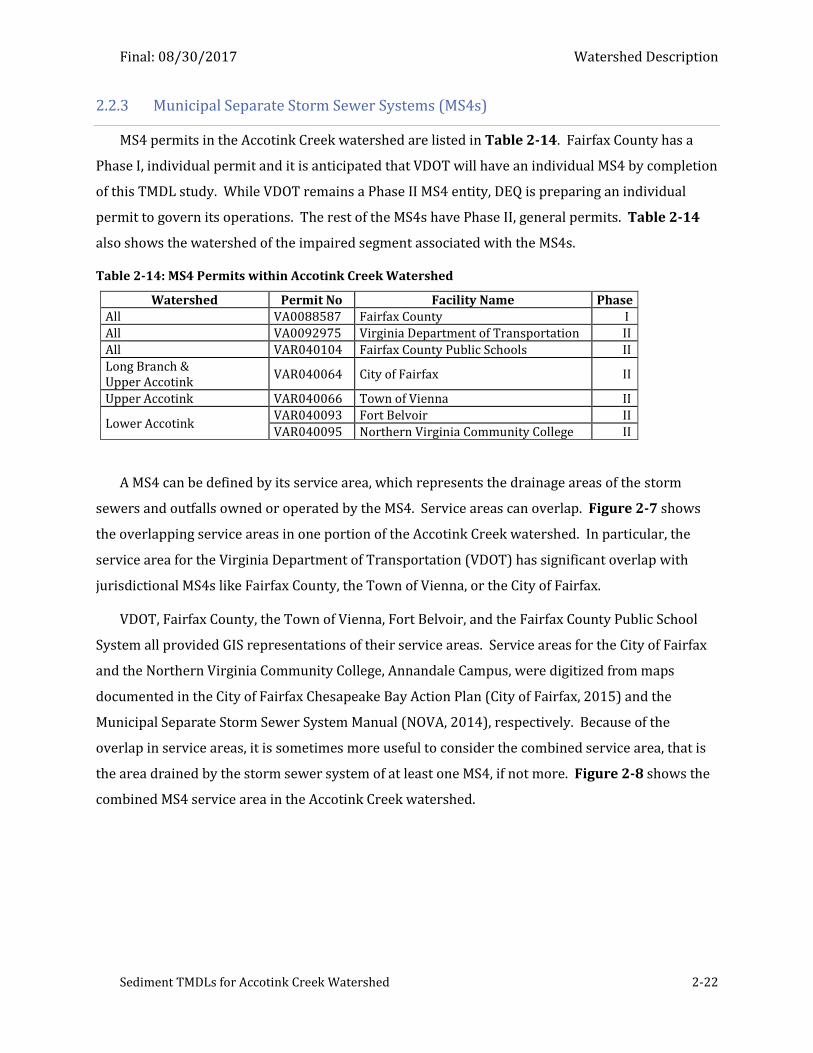
Final: 08/30/2017 Watershed Description
Sediment TMDLs for Accotink Creek Watershed 2-22
2.2.3 Municipal Separate Storm Sewer Systems (MS4s)
MS4 permits in the Accotink Creek watershed are listed in Table 2-14. Fairfax County has a
Phase I, individual permit and it is anticipated that VDOT will have an individual MS4 by completion
of this TMDL study. While VDOT remains a Phase II MS4 entity, DEQ is preparing an individual
permit to govern its operations. The rest of the MS4s have Phase II, general permits. Table 2-14
also shows the watershed of the impaired segment associated with the MS4s.
Table 2-14: MS4 Permits within Accotink Creek Watershed
Watershed Permit No Facility Name Phase All VA0088587 Fairfax County I
All VA0092975 Virginia Department of Transportation II
All VAR040104 Fairfax County Public Schools II
Long Branch & Upper Accotink
VAR040064 City of Fairfax II
Upper Accotink VAR040066 Town of Vienna II
Lower Accotink VAR040093 Fort Belvoir II
VAR040095 Northern Virginia Community College II
A MS4 can be defined by its service area, which represents the drainage areas of the storm
sewers and outfalls owned or operated by the MS4. Service areas can overlap. Figure 2-7 shows
the overlapping service areas in one portion of the Accotink Creek watershed. In particular, the
service area for the Virginia Department of Transportation (VDOT) has significant overlap with
jurisdictional MS4s like Fairfax County, the Town of Vienna, or the City of Fairfax.
VDOT, Fairfax County, the Town of Vienna, Fort Belvoir, and the Fairfax County Public School
System all provided GIS representations of their service areas. Service areas for the City of Fairfax
and the Northern Virginia Community College, Annandale Campus, were digitized from maps
documented in the City of Fairfax Chesapeake Bay Action Plan (City of Fairfax, 2015) and the
Municipal Separate Storm Sewer System Manual (NOVA, 2014), respectively. Because of the
overlap in service areas, it is sometimes more useful to consider the combined service area, that is
the area drained by the storm sewer system of at least one MS4, if not more. Figure 2-8 shows the
combined MS4 service area in the Accotink Creek watershed.
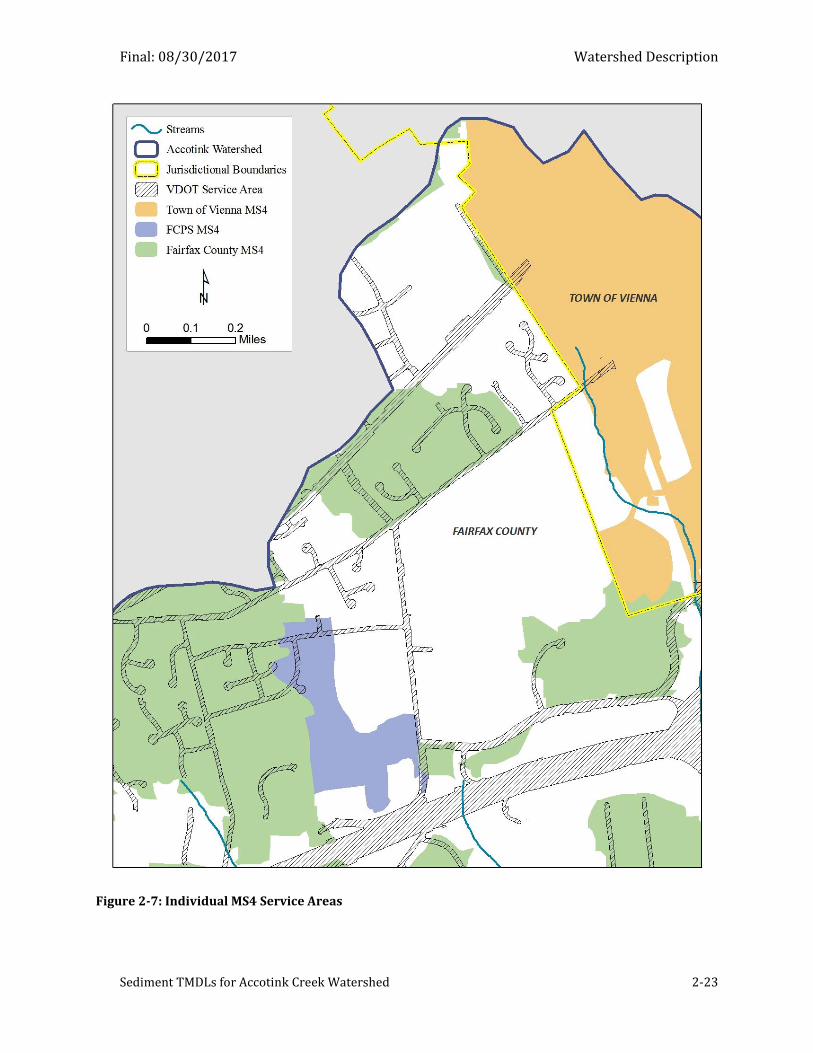
Final: 08/30/2017 Watershed Description
Sediment TMDLs for Accotink Creek Watershed 2-23
Figure 2-7: Individual MS4 Service Areas
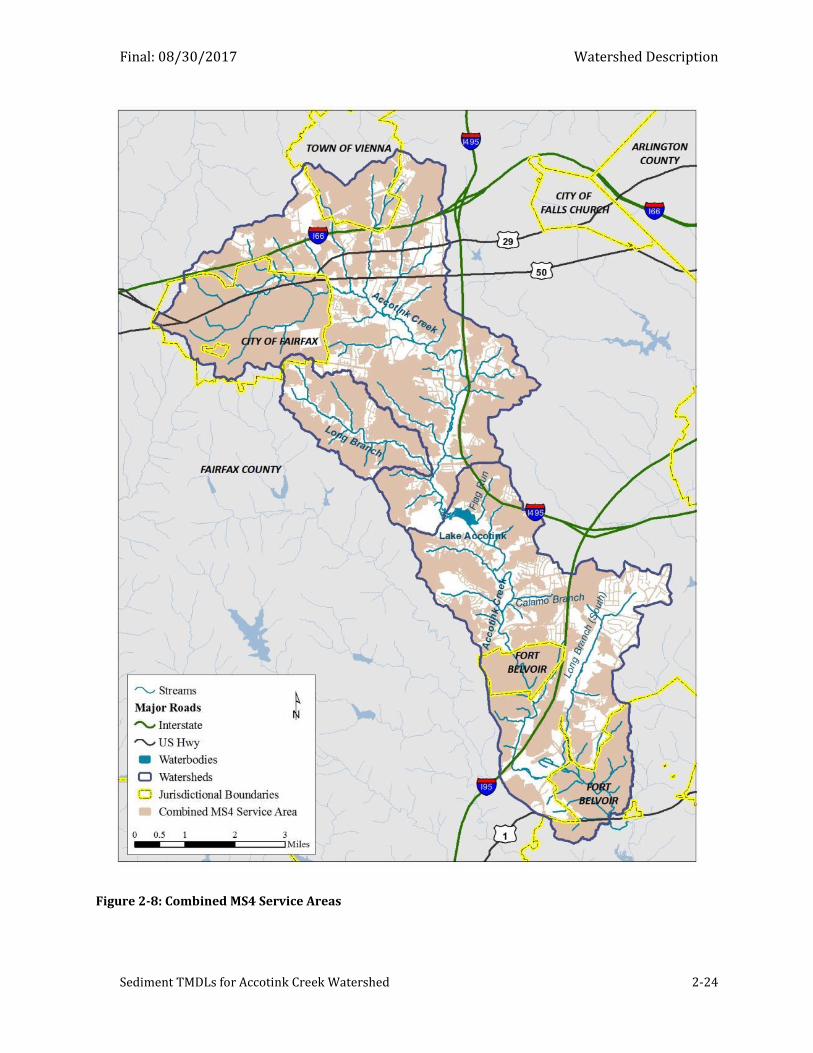
Final: 08/30/2017 Watershed Description
Sediment TMDLs for Accotink Creek Watershed 2-24
Figure 2-8: Combined MS4 Service Areas
Final: 08/30/2017 Watershed Description
Sediment TMDLs for Accotink Creek Watershed 2-25
2.2.4 Construction Permits
Under the VSMP, DEQ also issues general permits to control stormwater from construction
sites. Table 2-15 summarizes the number of active construction permits in the Accotink Creek
watershed, the total acreage under development, and the total disturbed area at the inception of
this project in December, 2014. Information on current construction permits can be obtained from
an on-line database on the VSMP website, which is currently available at the following:
http://www.deq.virginia.gov/Programs/Water/StormwaterManagement/VSMPPermits/Construct
ionGeneralPermit.aspx
Table 2-15: Construction Stormwater Permits within Accotink Creek Watershed (December, 2014)
Watershed Number of Permits Total Area of Sites
(acres) Total Disturbed Area
(acres)
Upper Accotink1 44 704 315
Lower Accotink2 33 648 265
Long Branch 1 11 5 1Excludes Long Branch 2Excludes upper Accotink Creek and Long Branch
2.2.5 Sewers
The population in Accotink Creek watershed is primarily served by sanitary sewers. Most of the
wastewater is treated at Fairfax County’s Norman J. Cole Jr. Pollution Control Plant, which
discharges into Pohick Creek, which is the watershed adjacent to Accotink Creek.
Final: 08/30/2017
Sediment TMDLs for Accotink Creek Watershed 3-1
3 TMDL Development
Virginia does not have numeric water quality criteria for sediment to protect aquatic life.
TMDLs developed for sediment in Virginia use the reference watershed approach, in which the
sediment loads from unimpaired watersheds, which are similar in other respects to the impaired
watershed, are used to set the TMDL for the impaired watershed. The current implementation of
the reference watershed approach is the AllForX approach (Benham et al., 2014; Yagow et al.;
2015a; Yagow et al., 2015b). An all-forest load multiplier (AllForX) is the ratio of current sediment
loads to the loads which would occur under all-forested conditions. In other words, the AllForX
multiplier is an indication of how much higher current sediment loads are above an undeveloped
condition. These multipliers are calculated for both impaired and unimpaired watersheds, and the
Virginia Stream Condition Index (VSCI) scores are then regressed against the AllForX values. Using
the regression line, a threshold multiplier is identified for a VSCI score of 60, which is the
assessment threshold that indicates a healthy benthic macroinvertebrate community. That AllForX
threshold, multiplied by the all-forested sediment load of an impaired watershed, becomes the
TMDL endpoint for the impaired watershed.
3.1 Overview of the Generalized Watershed Loading Functions (GWLF) Model
Loading rates for both the impaired and unimpaired watersheds are determined by computer
simulation models. In Virginia, the Generalized Watershed Loading Functions (GWLF) model
(Haith et al., 1992) or updated versions of GWLF developed at Penn State (Evans et al., 2001; Evans
and Corradini, 2014) or Virginia Tech (Yagow et al., 2015a) are often used to simulate sediment
loads. Both updated versions of GWLF have added the capacity to simulate streambank erosion.
GWLF is a continuous simulation model that can be used to represent streamflow, sediment
loads, and nitrogen and phosphorus loads from point and nonpoint sources on a watershed basis. It
has played a key role in the reference watershed approach to the development of sediment and
nutrient TMDLs to address benthic impairments in Virginia and other states, such as Pennsylvania.
GWLF’s strength is that it uses accepted engineering practices and techniques to calculate key
variables like runoff and erosion. It is best characterized as a planning level model that does not
require as much input data as many continuous simulation models, nor does it require the
calibration of model parameters. GWLF operates on a daily timestep, although flow and loads are
Final: 08/30/2017 TMDL Development
Sediment TMDLs for Accotink Creek Watershed 3-2
most often reported on a monthly or annual basis. Runoff, erosion, and the nutrients transported in
them are simulated by land use; groundwater flows and their loads are simulated on a watershed
scale.
GWLF was originally developed at Cornell University (Haith and Shoemaker, 1997; Haith et al.,
1992). AVGWLF, a version of GWLF developed by Pennsylvania State University (Evans et al.,
2003) for use in Pennsylvania’s nonpoint source TMDLs, added a channel erosion component to the
original GWLF model.
The key elements in GWLF’s simulation of watershed hydrology and sediment transport are
discussed below. For more details on the GWLF model, see Haith et al. (1992) and Evans et al.
(2003).
3.1.1 Simulation of Watershed Hydrology
GWLF represents all phases of the hydrological cycle: precipitation, runoff, infiltration,
percolation, evapotranspiration, and groundwater discharge. It requires daily times series of
average temperature and rainfall.
The cornerstone of the hydrology model is use of the Natural Resource Conservation Service
(NRCS--formerly Soil Conservation Service (SCS)) Curve Number method for computing runoff from
daily rainfall. Curve numbers for each land use represented are adjusted on a daily basis according
to precipitation over the previous five days. Snowfall, snowpack, and snowmelt are also simulated.
While runoff is computed on a distributed basis over the land uses represented in the
watershed, subsurface processes are lumped on a watershed scale. Precipitation that does not
runoff infiltrates into the shallow unsaturated zone. There it is subject to evapotranspiration.
Potential evapotranspiration is calculated daily according to Hamon’s method, on the basis of
average temperature and latitude. Monthly cover coefficients determine how much of potential
evapotranspiration can be satisfied by the vegetative cover.
When the unsaturated zone reaches its maximum water capacity, additional inflow enters
saturated storage. Saturated storage is modeled as a linear reservoir; the recession coefficient is
the ratio of the change in storage, discharged as baseflow, and the saturated storage. Total
streamflow is the sum of baseflow and runoff. There is no hydraulic routing in GWLF.
The key parameters that characterize a hydrology simulation are (1) curve numbers for each
land use represented, (2) maximum unsaturated storage, (3) cover coefficients, and (4) the
Final: 08/30/2017 TMDL Development
Sediment TMDLs for Accotink Creek Watershed 3-3
recession coefficient. More details on the hydrology component of GWLF can be found in Haith et
al. (1992).
3.1.2 Simulation of Erosion and Sediment Transport
Just as curve numbers are the cornerstone of the hydrology simulation, the universal soil loss
equation (USLE) forms the cornerstone of the representation of erosion and sediment transport.
Erosion from the Universal Soil Loss Equation is calculated as follows:
A = R*K*LS*C*P
where
R = Rainfall erosivity K = Soil erodibility LS = Topographic factor, based on slope and slope length C = Cover and management factor P = Support practice factor A = Soil loss per unit of time
USLE was originally intended to provide annual or seasonal estimates of erosion from land uses
such as forests, cropland, pasture, and pervious developed land. In GWLF, the USLE was modified
to calculate erosion on an event basis by calculating the erosivity factor (R) for daily precipitation.
Other factors in the USLE are input to the model for each land use.
Not all the sediment eroded in a watershed is transported out of the watershed. The sediment
delivery ratio, the proportion of the eroded sediment transported out of the watershed, is a
function of watershed size. The delivery of sediment is proportional to the relative size of the
monthly runoff that occurs over the remainder of the year from the time the erosion took place.
Again, for more details, see Haith et al. (1992).
Evans et al. (2003) introduced a channel erosion component into GWLF. Channel erosion is the
product of a total stream length in the watershed, bank height, the bulk density of the bank soil, and
a lateral erosion rate. The lateral erosion rate (LER), in cm/month, is a function of average monthly
streamflow (Q), in m3/s, and a factor “a”
LER = a*Q0.6
The “a” factor was determined by regression as a function of the following watershed
characteristics: (1) percent developed land, (2) animal equivalent unit density, (3) average curve
number, (4) average K-factor, and (5) mean slope.
Final: 08/30/2017 TMDL Development
Sediment TMDLs for Accotink Creek Watershed 3-4
Sediment loads from point sources can also be represented in GWLF. These are not subject to
the sediment delivery ratio.
3.1.3 Seasonal Variability and Critical Conditions
Any TMDL is required to take into account the seasonal factors that impact loading rates and
critical conditions that exacerbate the impact of the pollutant in question, in this case sediment.
The GWLF model can incorporate seasonal variability and critical conditions into its simulation of
watershed sediment loads.
First, several GWLF parameters, including rainfall erosivity and evaporation cover coefficients,
are modified on a monthly basis to take into account their seasonal variation. Second, using a daily
model over a twelve-year simulation period represents a wide variety of meteorological and
hydrological conditions and seasonal effects. Wet springs, dry hot summers, or even wet cool
summers are represented over a long simulation period.
With respect to sediment, critical conditions are (1) heavy rainfalls that erode sediment from
fields and (2) high flows that scour streambanks. Both types of events are represented in GWLF if
the simulation period includes a sufficient variety of meteorological and hydrological conditions.
Therefore, using GWLF to develop TMDL allocations satisfies the requirements that TMDLs take
into account the seasonality of loads and critical conditions.
3.1.4 Implementation of GWLF in the Accotink Creek Watershed
Although GWLF is supposed to require little or no calibration, hydrology parameters have been
calibrated against observed flow data in most Virginia TMDLs where GWLF has been used. For
Accotink Creek, hydrology parameters were calibrated using the parameter estimation software,
PEST (Doherty, 2001). PEST requires a version of the model that can run under the DOS operating
system. GWLF 2.0 is the most recent version of the model that can be run as a stand-alone model
under DOS. The hydrology calibration is described in Section 3.2.
Accotink Creek is a highly developed watershed. Eighty-four percent of the watershed is
occupied by developed land uses. As described in Section 2.1.4, most jurisdictions made their
zoning and land cover data available for use in developing the Accotink Creek TMDLs. The most
recent Penn State version of GWLF, Mapshed, which, as is described in Appendix A, was used to
model the comparison watersheds, is unable to accommodate the seven categories of developed
land used to characterize Accotink Creek. GWLF 2.0 is able to simulate seven developed land uses,
Final: 08/30/2017 TMDL Development
Sediment TMDLs for Accotink Creek Watershed 3-5
however, and therefore was used to simulate both hydrology and sediment in Accotink Creek. On
the other hand, GWLF 2.0 does not include the simulation of streambank erosion, which is often the
dominant source of sediment in highly developed watersheds. A spreadsheet version of Evans et
al.’s (2003) streambank erosion model was implemented using flow output from the GWLF 2.0
model.
The combination of the USLE and delivery factors does not capture the dynamics of sediment
transport in highly developed watersheds. Developed watersheds have a high percentage of
impervious surfaces, which are not subject to erosion, but still generate sediment loads from the
deposition of wind-blown particulates. Some of these same surfaces serve as transport paths for
sediment eroded from pervious surfaces, and which are often part of a larger network of storm
sewers that convey both flow and sediment. For these reasons sediment loads from developed land
are best characterized as the loads delivered at the storm sewer outfalls, or alternatively, as the
product of flow and an average or typical event mean concentration measured at the end-of-pipe
(EOP). The USLE parameters for all land uses in Accotink Creek except open space and
construction were set so that the simulated average annual sediment concentrations in runoff from
these land uses were equal to average event mean concentrations taken from the National
Stormwater Quality Database (NSQD). Calculation of calibration targets and estimates of total
watershed load, based on observed data, are also described in Section 3.3.
Four GWLF models simulating baseline conditions were developed: a model used primarily for
calibration of hydrology parameters, which represents the Accotink Creek watershed above the
USGS gauge on Accotink Creek near Annandale (01654000); and a model for each of the three
watersheds draining to the impaired sections of upper Accotink Creek, lower Accotink Creek, and
Long Branch. The model for calibration of hydrology was used to parameterize the three models
for the impaired watersheds. Section 3.4 will describe the development of the sediment
simulations in these models. As Section 3.4 will explain, the upper Accotink Creek model includes
Long Branch but the lower Accotink Creek model does not include the upper Accotink Creek
watershed. There are also three GWLF models representing upper Accotink Creek, lower Accotink
Creek, and Long Branch under all-forested conditions. The development of these models is also
described in Section 3.4.
Section 3.5 presents the resulting baseline and all-forested sediment loads for each of the three
impaired watersheds. It also calculates the AllForX ratio for each impairment and the TMDL
required to meet water quality standards, based on the AllforX method.
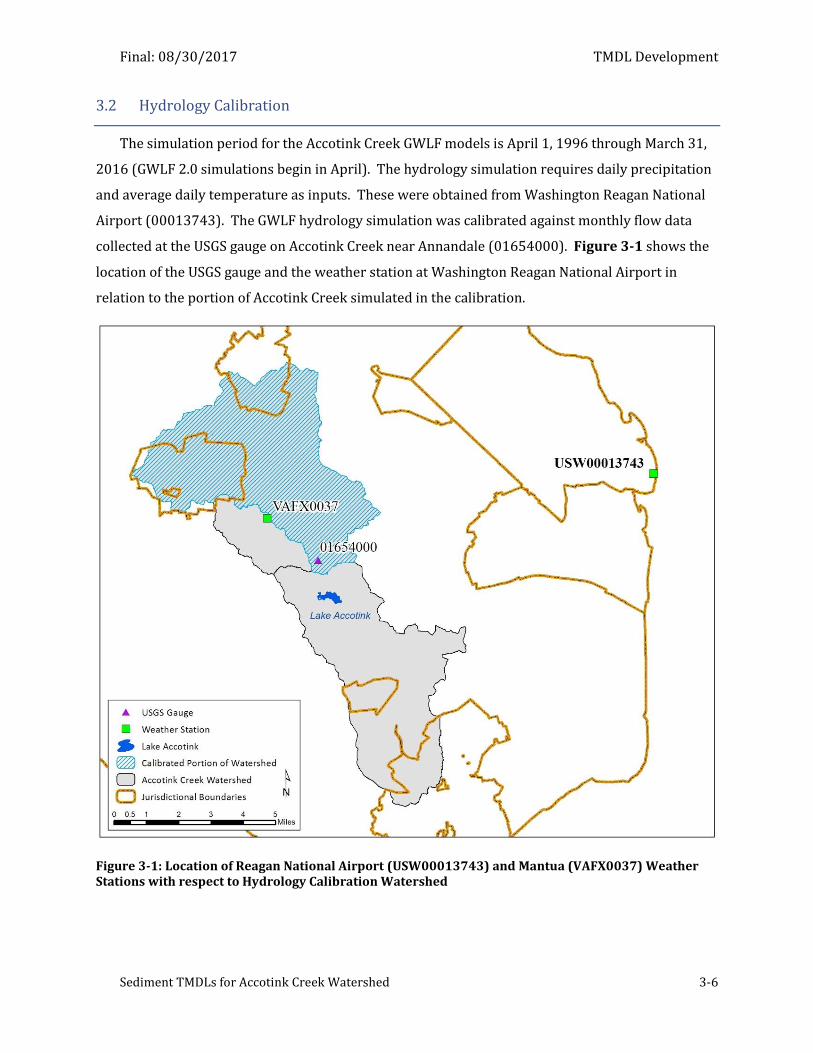
Final: 08/30/2017 TMDL Development
Sediment TMDLs for Accotink Creek Watershed 3-6
3.2 Hydrology Calibration
The simulation period for the Accotink Creek GWLF models is April 1, 1996 through March 31,
2016 (GWLF 2.0 simulations begin in April). The hydrology simulation requires daily precipitation
and average daily temperature as inputs. These were obtained from Washington Reagan National
Airport (00013743). The GWLF hydrology simulation was calibrated against monthly flow data
collected at the USGS gauge on Accotink Creek near Annandale (01654000). Figure 3-1 shows the
location of the USGS gauge and the weather station at Washington Reagan National Airport in
relation to the portion of Accotink Creek simulated in the calibration.
Figure 3-1: Location of Reagan National Airport (USW00013743) and Mantua (VAFX0037) Weather Stations with respect to Hydrology Calibration Watershed
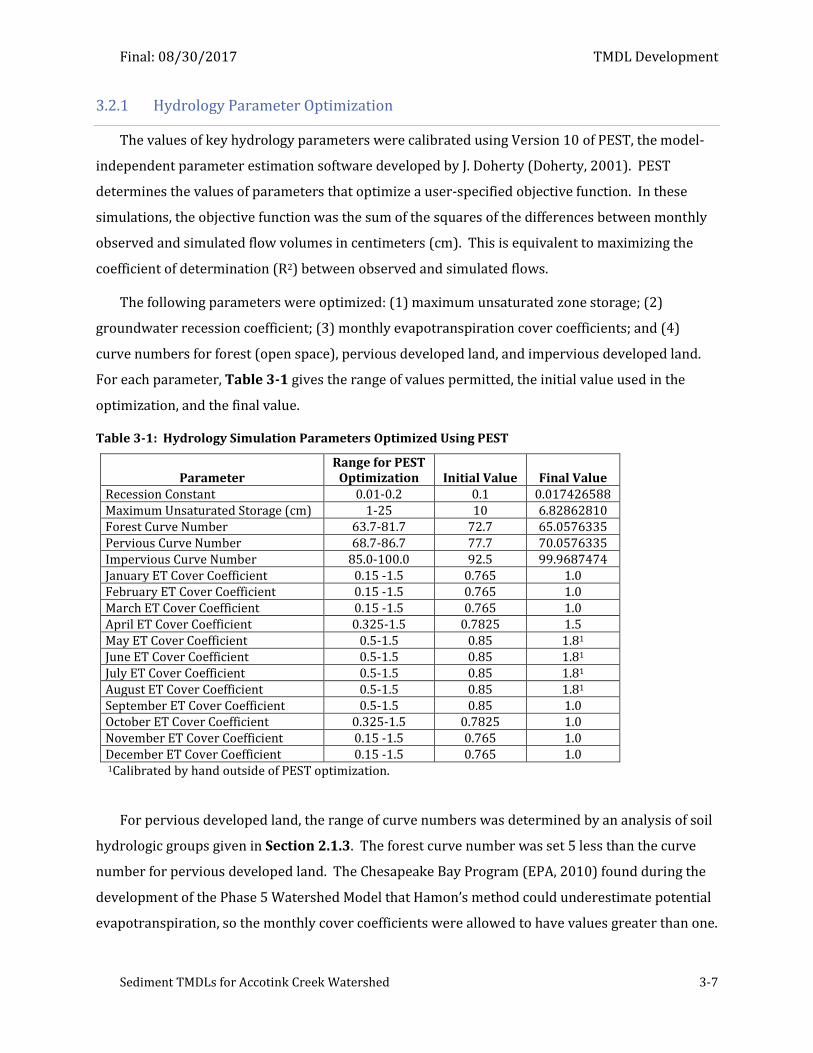
Final: 08/30/2017 TMDL Development
Sediment TMDLs for Accotink Creek Watershed 3-7
3.2.1 Hydrology Parameter Optimization
The values of key hydrology parameters were calibrated using Version 10 of PEST, the model-
independent parameter estimation software developed by J. Doherty (Doherty, 2001). PEST
determines the values of parameters that optimize a user-specified objective function. In these
simulations, the objective function was the sum of the squares of the differences between monthly
observed and simulated flow volumes in centimeters (cm). This is equivalent to maximizing the
coefficient of determination (R2) between observed and simulated flows.
The following parameters were optimized: (1) maximum unsaturated zone storage; (2)
groundwater recession coefficient; (3) monthly evapotranspiration cover coefficients; and (4)
curve numbers for forest (open space), pervious developed land, and impervious developed land.
For each parameter, Table 3-1 gives the range of values permitted, the initial value used in the
optimization, and the final value.
Table 3-1: Hydrology Simulation Parameters Optimized Using PEST
Parameter Range for PEST
Optimization Initial Value Final Value Recession Constant 0.01-0.2 0.1 0.017426588 Maximum Unsaturated Storage (cm) 1-25 10 6.82862810 Forest Curve Number 63.7-81.7 72.7 65.0576335 Pervious Curve Number 68.7-86.7 77.7 70.0576335 Impervious Curve Number 85.0-100.0 92.5 99.9687474 January ET Cover Coefficient 0.15 -1.5 0.765 1.0 February ET Cover Coefficient 0.15 -1.5 0.765 1.0 March ET Cover Coefficient 0.15 -1.5 0.765 1.0 April ET Cover Coefficient 0.325-1.5 0.7825 1.5 May ET Cover Coefficient 0.5-1.5 0.85 1.81 June ET Cover Coefficient 0.5-1.5 0.85 1.81 July ET Cover Coefficient 0.5-1.5 0.85 1.81 August ET Cover Coefficient 0.5-1.5 0.85 1.81 September ET Cover Coefficient 0.5-1.5 0.85 1.0 October ET Cover Coefficient 0.325-1.5 0.7825 1.0 November ET Cover Coefficient 0.15 -1.5 0.765 1.0 December ET Cover Coefficient 0.15 -1.5 0.765 1.0 1Calibrated by hand outside of PEST optimization.
For pervious developed land, the range of curve numbers was determined by an analysis of soil
hydrologic groups given in Section 2.1.3. The forest curve number was set 5 less than the curve
number for pervious developed land. The Chesapeake Bay Program (EPA, 2010) found during the
development of the Phase 5 Watershed Model that Hamon’s method could underestimate potential
evapotranspiration, so the monthly cover coefficients were allowed to have values greater than one.
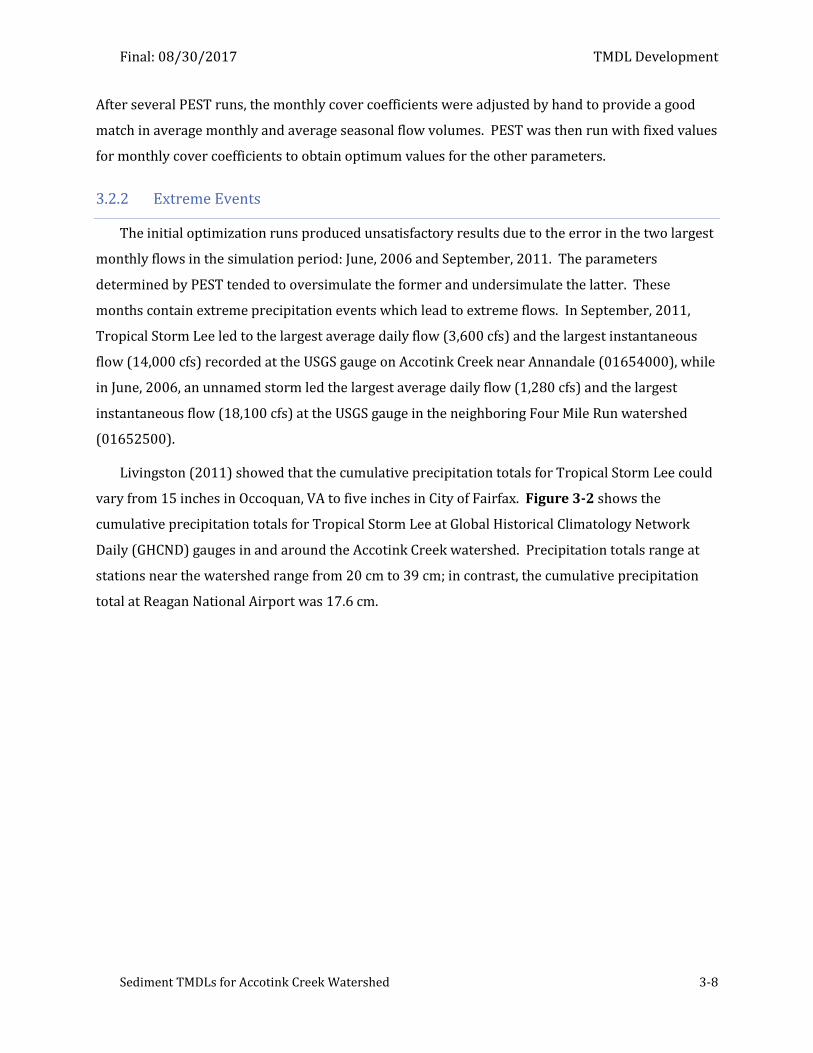
Final: 08/30/2017 TMDL Development
Sediment TMDLs for Accotink Creek Watershed 3-8
After several PEST runs, the monthly cover coefficients were adjusted by hand to provide a good
match in average monthly and average seasonal flow volumes. PEST was then run with fixed values
for monthly cover coefficients to obtain optimum values for the other parameters.
3.2.2 Extreme Events
The initial optimization runs produced unsatisfactory results due to the error in the two largest
monthly flows in the simulation period: June, 2006 and September, 2011. The parameters
determined by PEST tended to oversimulate the former and undersimulate the latter. These
months contain extreme precipitation events which lead to extreme flows. In September, 2011,
Tropical Storm Lee led to the largest average daily flow (3,600 cfs) and the largest instantaneous
flow (14,000 cfs) recorded at the USGS gauge on Accotink Creek near Annandale (01654000), while
in June, 2006, an unnamed storm led the largest average daily flow (1,280 cfs) and the largest
instantaneous flow (18,100 cfs) at the USGS gauge in the neighboring Four Mile Run watershed
(01652500).
Livingston (2011) showed that the cumulative precipitation totals for Tropical Storm Lee could
vary from 15 inches in Occoquan, VA to five inches in City of Fairfax. Figure 3-2 shows the
cumulative precipitation totals for Tropical Storm Lee at Global Historical Climatology Network
Daily (GHCND) gauges in and around the Accotink Creek watershed. Precipitation totals range at
stations near the watershed range from 20 cm to 39 cm; in contrast, the cumulative precipitation
total at Reagan National Airport was 17.6 cm.
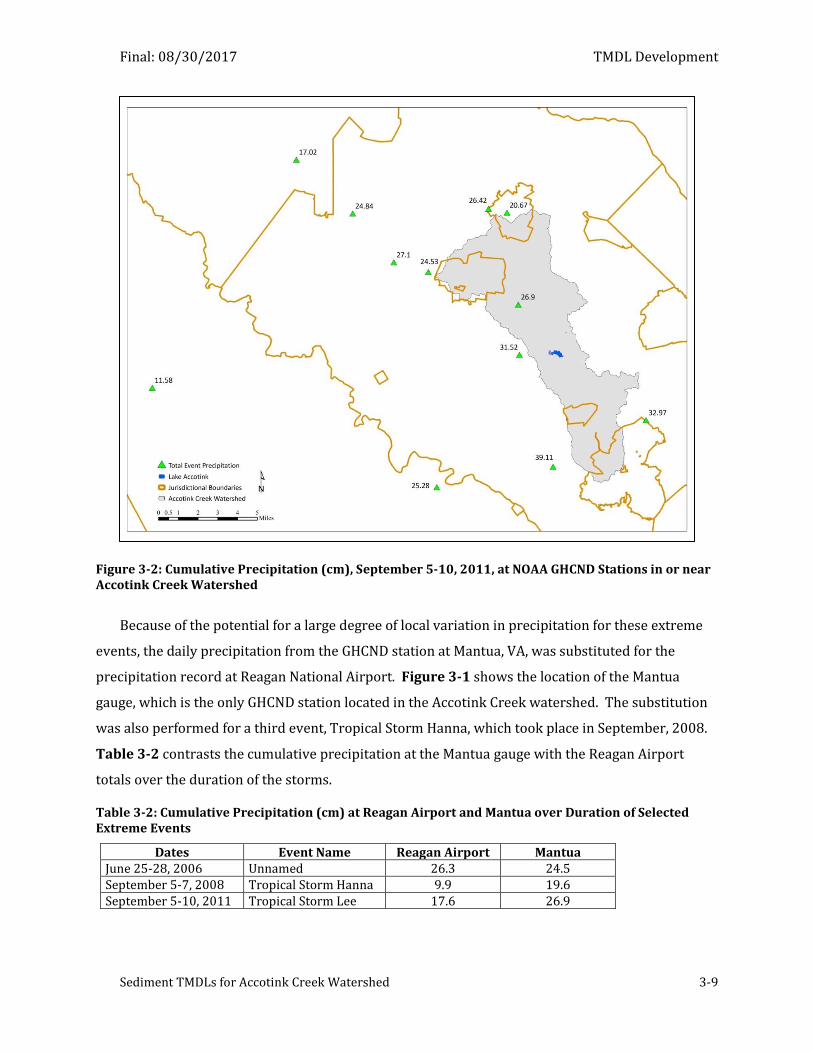
Final: 08/30/2017 TMDL Development
Sediment TMDLs for Accotink Creek Watershed 3-9
Figure 3-2: Cumulative Precipitation (cm), September 5-10, 2011, at NOAA GHCND Stations in or near Accotink Creek Watershed
Because of the potential for a large degree of local variation in precipitation for these extreme
events, the daily precipitation from the GHCND station at Mantua, VA, was substituted for the
precipitation record at Reagan National Airport. Figure 3-1 shows the location of the Mantua
gauge, which is the only GHCND station located in the Accotink Creek watershed. The substitution
was also performed for a third event, Tropical Storm Hanna, which took place in September, 2008.
Table 3-2 contrasts the cumulative precipitation at the Mantua gauge with the Reagan Airport
totals over the duration of the storms.
Table 3-2: Cumulative Precipitation (cm) at Reagan Airport and Mantua over Duration of Selected Extreme Events
Dates Event Name Reagan Airport Mantua June 25-28, 2006 Unnamed 26.3 24.5 September 5-7, 2008 Tropical Storm Hanna 9.9 19.6 September 5-10, 2011 Tropical Storm Lee 17.6 26.9
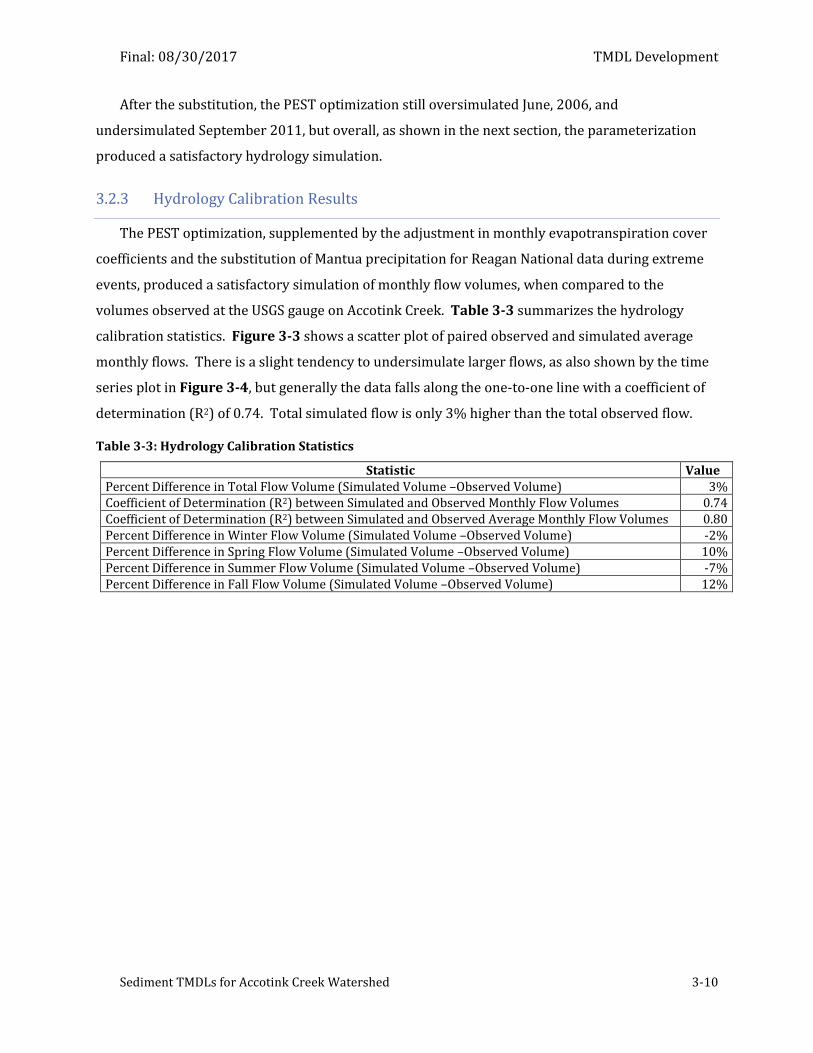
Final: 08/30/2017 TMDL Development
Sediment TMDLs for Accotink Creek Watershed 3-10
After the substitution, the PEST optimization still oversimulated June, 2006, and
undersimulated September 2011, but overall, as shown in the next section, the parameterization
produced a satisfactory hydrology simulation.
3.2.3 Hydrology Calibration Results
The PEST optimization, supplemented by the adjustment in monthly evapotranspiration cover
coefficients and the substitution of Mantua precipitation for Reagan National data during extreme
events, produced a satisfactory simulation of monthly flow volumes, when compared to the
volumes observed at the USGS gauge on Accotink Creek. Table 3-3 summarizes the hydrology
calibration statistics. Figure 3-3 shows a scatter plot of paired observed and simulated average
monthly flows. There is a slight tendency to undersimulate larger flows, as also shown by the time
series plot in Figure 3-4, but generally the data falls along the one-to-one line with a coefficient of
determination (R2) of 0.74. Total simulated flow is only 3% higher than the total observed flow.
Table 3-3: Hydrology Calibration Statistics
Statistic Value Percent Difference in Total Flow Volume (Simulated Volume –Observed Volume) 3% Coefficient of Determination (R2) between Simulated and Observed Monthly Flow Volumes 0.74 Coefficient of Determination (R2) between Simulated and Observed Average Monthly Flow Volumes 0.80 Percent Difference in Winter Flow Volume (Simulated Volume –Observed Volume) -2% Percent Difference in Spring Flow Volume (Simulated Volume –Observed Volume) 10% Percent Difference in Summer Flow Volume (Simulated Volume –Observed Volume) -7% Percent Difference in Fall Flow Volume (Simulated Volume –Observed Volume) 12%
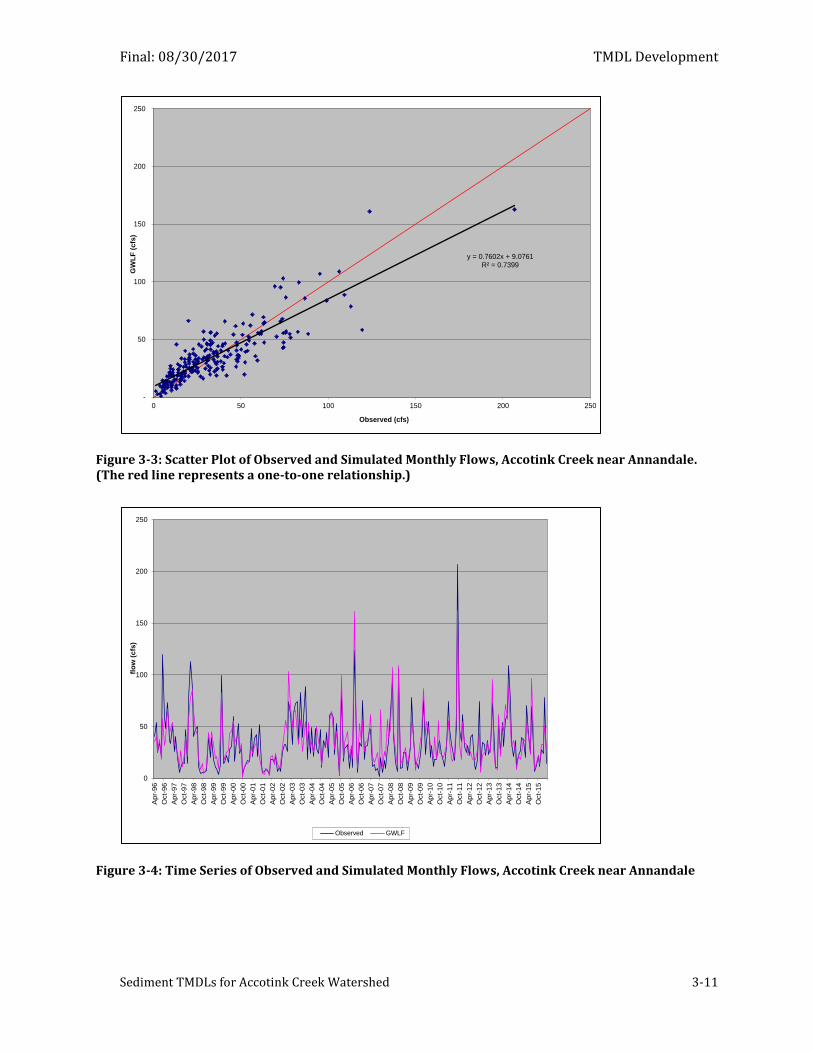
Final: 08/30/2017 TMDL Development
Sediment TMDLs for Accotink Creek Watershed 3-11
Figure 3-3: Scatter Plot of Observed and Simulated Monthly Flows, Accotink Creek near Annandale. (The red line represents a one-to-one relationship.)
Figure 3-4: Time Series of Observed and Simulated Monthly Flows, Accotink Creek near Annandale
y = 0.7602x + 9.0761R² = 0.7399
-
50
100
150
200
250
0 50 100 150 200 250
GW
LF
(c
fs)
Observed (cfs)
0
50
100
150
200
250
Ap
r-9
6
Oct-
96
Ap
r-9
7
Oct-
97
Ap
r-9
8
Oct-
98
Ap
r-9
9
Oct-
99
Ap
r-0
0
Oct-
00
Ap
r-0
1
Oct-
01
Ap
r-0
2
Oct-
02
Ap
r-0
3
Oct-
03
Ap
r-0
4
Oct-
04
Ap
r-0
5
Oct-
05
Ap
r-0
6
Oct-
06
Ap
r-0
7
Oct-
07
Ap
r-0
8
Oct-
08
Ap
r-0
9
Oct-
09
Apr-
10
Oct-
10
Ap
r-1
1
Oct-
11
Ap
r-1
2
Oct-
12
Ap
r-1
3
Oct-
13
Ap
r-1
4
Oct-
14
Apr-
15
Oct-
15
flo
w (
cfs
)
dateObserved GWLF
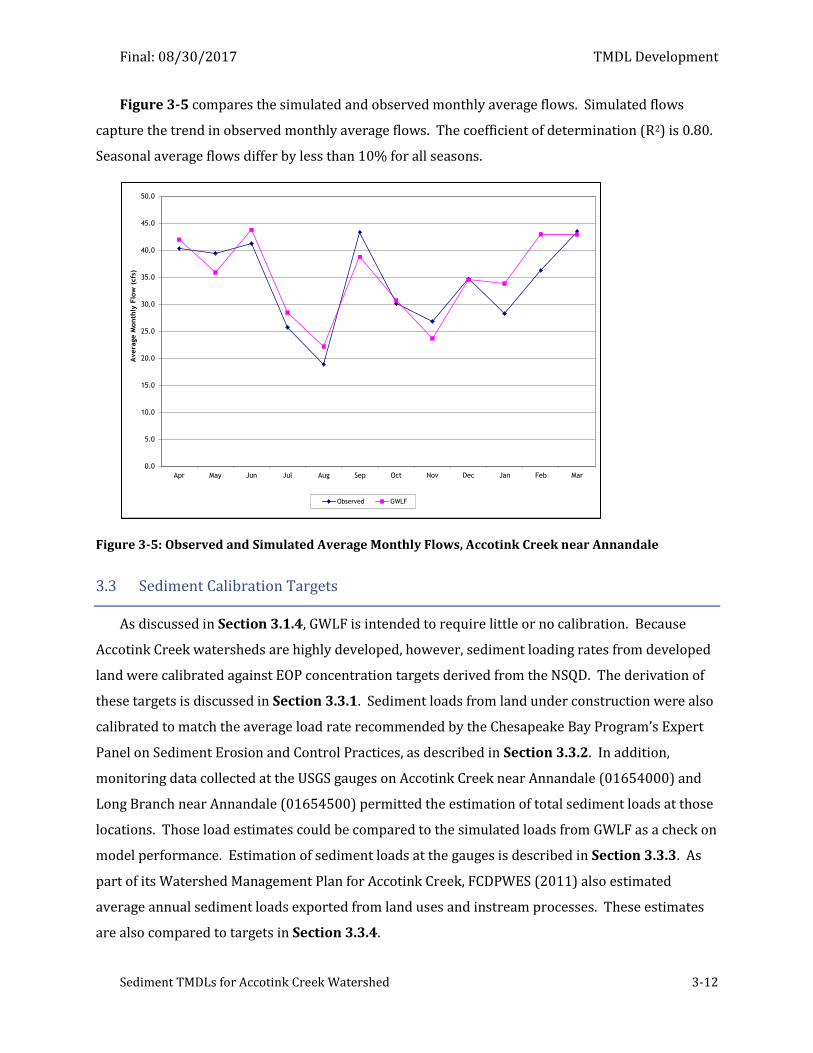
Final: 08/30/2017 TMDL Development
Sediment TMDLs for Accotink Creek Watershed 3-12
Figure 3-5 compares the simulated and observed monthly average flows. Simulated flows
capture the trend in observed monthly average flows. The coefficient of determination (R2) is 0.80.
Seasonal average flows differ by less than 10% for all seasons.
Figure 3-5: Observed and Simulated Average Monthly Flows, Accotink Creek near Annandale
3.3 Sediment Calibration Targets
As discussed in Section 3.1.4, GWLF is intended to require little or no calibration. Because
Accotink Creek watersheds are highly developed, however, sediment loading rates from developed
land were calibrated against EOP concentration targets derived from the NSQD. The derivation of
these targets is discussed in Section 3.3.1. Sediment loads from land under construction were also
calibrated to match the average load rate recommended by the Chesapeake Bay Program’s Expert
Panel on Sediment Erosion and Control Practices, as described in Section 3.3.2. In addition,
monitoring data collected at the USGS gauges on Accotink Creek near Annandale (01654000) and
Long Branch near Annandale (01654500) permitted the estimation of total sediment loads at those
locations. Those load estimates could be compared to the simulated loads from GWLF as a check on
model performance. Estimation of sediment loads at the gauges is described in Section 3.3.3. As
part of its Watershed Management Plan for Accotink Creek, FCDPWES (2011) also estimated
average annual sediment loads exported from land uses and instream processes. These estimates
are also compared to targets in Section 3.3.4.
0.0
5.0
10.0
15.0
20.0
25.0
30.0
35.0
40.0
45.0
50.0
Apr May Jun Jul Aug Sep Oct Nov Dec Jan Feb Mar
Avera
ge M
onth
ly F
low
(cfs
)
Observed GWLF
Final: 08/30/2017 TMDL Development
Sediment TMDLs for Accotink Creek Watershed 3-13
3.3.1 Developed Land Sediment Concentrations Targets
Calibration targets for developed land uses were calculated from monitoring data in the NSQD.
The NSQD is a database of monitoring data collected under the permit requirements of Municipal
Separate Storm Sewer Systems. The original database was developed in 2001-2004 by the
University of Alabama and the Center for Watershed Protection under sponsorship of the EPA. It
included monitoring data from 3,770 distinct storm events from 66 jurisdictions across the country
with Phase I MS4 permits (Pitt et al., 2004). The data in the NSQD is subject to extensive Quality
Assurance/Quality Control (QA/QC) procedures. It includes extensive auxiliary data about
monitoring locations, such as land use. The database has been updated since its original release
and is currently maintained in conjunction with the International Stormwater BMP Database, which
is sponsored by the EPA, the American Society of Civil Engineers (ASCE), and other partners.
Version 4.02 was used to develop sediment concentration targets for Accotink Creek.
NSQD contains data from across the county. Data from arid regions, like the southwest, is likely
to be less relevant to conditions in Virginia than neighboring states. Data was restricted to EPA
Rain Zone 2 (EPA, 1986), which includes the state of Virginia, Maryland, North Carolina, Kentucky,
Tennessee, and West Virginia, in order to provide a wide-range of monitoring data without
including data collected under conditions significantly different than those found in Accotink Creek
watershed. Only stations without reported BMPs were used in the analysis. In additions, a station
was required to have at least five samples to be included in the analysis.
Based on a literature review by Sievers (2014), the Chesapeake Bay Program decided against
simulating distinct land use loading rates for any developed land use class except transportation.
Since it will be necessary to manage sediment loads for Chesapeake Bay TMDL implementation, for
the sake of consistency only two target sediment concentrations were estimated for the Accotink
Creek TMDLs from the NSQD: one for transportation and one for the other developed land uses—
commercial, industrial, mixed, and residential. For transportation, the average concentration of
station averages of event mean concentrations was calculated for all sites where “Freeways” were
the principle land use type. In other words, first a station average was calculated over all the events
for a station classified as “Freeway,” and then the station averages were themselves averaged to
obtain an overall mean concentration for the transportation land use class. For the other developed
land use types, the station averages for all other land use types were calculated, and the average of
the station averages was obtained, representing the overall mean concentration for the aggregate
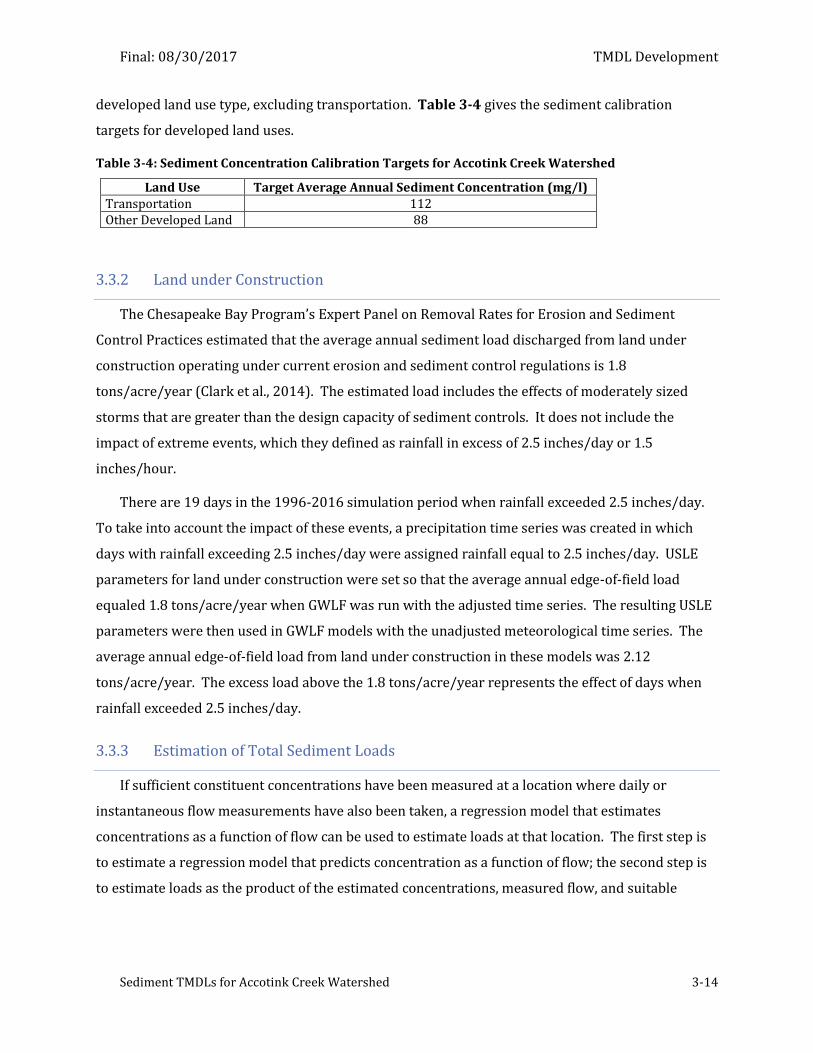
Final: 08/30/2017 TMDL Development
Sediment TMDLs for Accotink Creek Watershed 3-14
developed land use type, excluding transportation. Table 3-4 gives the sediment calibration
targets for developed land uses.
Table 3-4: Sediment Concentration Calibration Targets for Accotink Creek Watershed
Land Use Target Average Annual Sediment Concentration (mg/l) Transportation 112 Other Developed Land 88
3.3.2 Land under Construction
The Chesapeake Bay Program’s Expert Panel on Removal Rates for Erosion and Sediment
Control Practices estimated that the average annual sediment load discharged from land under
construction operating under current erosion and sediment control regulations is 1.8
tons/acre/year (Clark et al., 2014). The estimated load includes the effects of moderately sized
storms that are greater than the design capacity of sediment controls. It does not include the
impact of extreme events, which they defined as rainfall in excess of 2.5 inches/day or 1.5
inches/hour.
There are 19 days in the 1996-2016 simulation period when rainfall exceeded 2.5 inches/day.
To take into account the impact of these events, a precipitation time series was created in which
days with rainfall exceeding 2.5 inches/day were assigned rainfall equal to 2.5 inches/day. USLE
parameters for land under construction were set so that the average annual edge-of-field load
equaled 1.8 tons/acre/year when GWLF was run with the adjusted time series. The resulting USLE
parameters were then used in GWLF models with the unadjusted meteorological time series. The
average annual edge-of-field load from land under construction in these models was 2.12
tons/acre/year. The excess load above the 1.8 tons/acre/year represents the effect of days when
rainfall exceeded 2.5 inches/day.
3.3.3 Estimation of Total Sediment Loads
If sufficient constituent concentrations have been measured at a location where daily or
instantaneous flow measurements have also been taken, a regression model that estimates
concentrations as a function of flow can be used to estimate loads at that location. The first step is
to estimate a regression model that predicts concentration as a function of flow; the second step is
to estimate loads as the product of the estimated concentrations, measured flow, and suitable
Final: 08/30/2017 TMDL Development
Sediment TMDLs for Accotink Creek Watershed 3-15
conversion factors5. The load estimate is only as good as the regression model. A necessary
condition for a satisfactory regression model is the collection of constituent data at a wide variety
of flow regimes, and particularly during high flow events when concentrations may vary widely.
The USGS has analyzed samples for suspended sediment (SS) at the USGS gauges on Accotink
Creek near Annandale (01654000) and on Long Branch near Annandale (01654500). Samples have
been collected across a wide variety of flow conditions, and storm events have been targeted for
sampling. Thus, it is possible to estimate sediment loads at those locations.
This method can be taken a step further, if continuous monitoring of turbidity is also performed
at gauges. As shown in Section 3.5.8 of Volume I, the correlation between turbidity and
suspended sediment can be stronger than the correlation between flow and suspended sediment.
Thus, in theory, turbidity can be a better predictor of sediment than flow, or at least strengthen the
predictive relation between flow and sediment. Rasmussen et al. (2009) suggest procedures for
using continuous turbidity measurements to estimate sediment loads.
The USGS only began the continuous monitoring of turbidity at the gauge on Accotink Creek
near Annandale in 2015, so there is not enough turbidity data to include turbidity in the regression
model predicting sediment concentrations at that location. Section 3.3.3.1 describes a regression
model relating sediment concentrations to instantaneous flow, which was developed to help
estimate sediment loads at the gauge on Accotink Creek. On the other hand, the USGS has
performed continuous monitoring of turbidity on Long Branch since 2013, providing the data to
estimate a regression model relating suspended sediment to instantaneous flow and turbidity
measurements at that location. Section 3.3.3.2 describes the development of the regression model
and its use in estimating sediment loads in Long Branch.
3.3.3.1 Estimation of Sediment Loads in Accotink Creek near Annandale
A regression relation was estimated between the log of SS and the log of instantaneous flow (Q).
Figure 3-6 shows a scatter plot of the relation.
5 For example, the flux of sediment (lbs/s) is equal to the concentration (mg/l) times the flow rate (cfs) times
28.3168 l/ft3 times 2.2046E-6 mg/lb. To get the rate in lbs/d, multiply by 86,400 s/d.
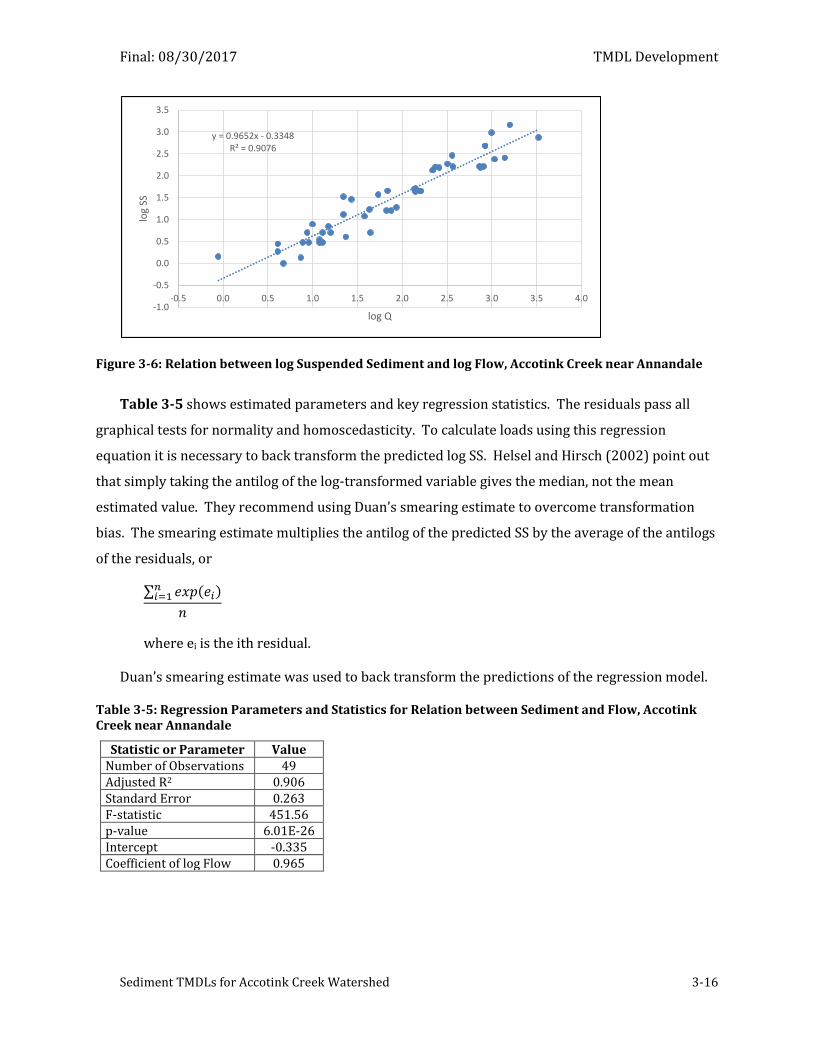
Final: 08/30/2017 TMDL Development
Sediment TMDLs for Accotink Creek Watershed 3-16
Figure 3-6: Relation between log Suspended Sediment and log Flow, Accotink Creek near Annandale
Table 3-5 shows estimated parameters and key regression statistics. The residuals pass all
graphical tests for normality and homoscedasticity. To calculate loads using this regression
equation it is necessary to back transform the predicted log SS. Helsel and Hirsch (2002) point out
that simply taking the antilog of the log-transformed variable gives the median, not the mean
estimated value. They recommend using Duan’s smearing estimate to overcome transformation
bias. The smearing estimate multiplies the antilog of the predicted SS by the average of the antilogs
of the residuals, or
∑ 𝑒𝑥𝑝(𝑒𝑖)𝑛𝑖=1
𝑛
where ei is the ith residual.
Duan’s smearing estimate was used to back transform the predictions of the regression model.
Table 3-5: Regression Parameters and Statistics for Relation between Sediment and Flow, Accotink Creek near Annandale
Statistic or Parameter Value Number of Observations 49 Adjusted R2 0.906 Standard Error 0.263 F-statistic 451.56 p-value 6.01E-26 Intercept -0.335 Coefficient of log Flow 0.965
y = 0.9652x - 0.3348R² = 0.9076
-1.0
-0.5
0.0
0.5
1.0
1.5
2.0
2.5
3.0
3.5
-0.5 0.0 0.5 1.0 1.5 2.0 2.5 3.0 3.5 4.0
log
SS
log Q
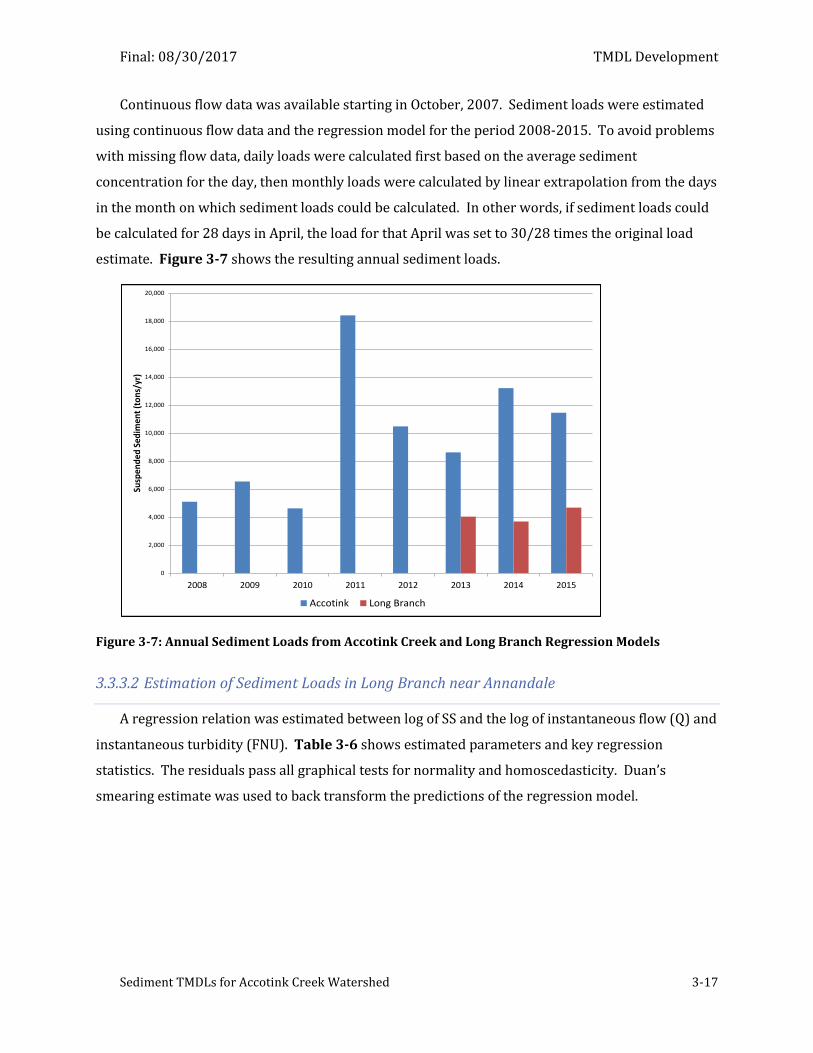
Final: 08/30/2017 TMDL Development
Sediment TMDLs for Accotink Creek Watershed 3-17
Continuous flow data was available starting in October, 2007. Sediment loads were estimated
using continuous flow data and the regression model for the period 2008-2015. To avoid problems
with missing flow data, daily loads were calculated first based on the average sediment
concentration for the day, then monthly loads were calculated by linear extrapolation from the days
in the month on which sediment loads could be calculated. In other words, if sediment loads could
be calculated for 28 days in April, the load for that April was set to 30/28 times the original load
estimate. Figure 3-7 shows the resulting annual sediment loads.
Figure 3-7: Annual Sediment Loads from Accotink Creek and Long Branch Regression Models
3.3.3.2 Estimation of Sediment Loads in Long Branch near Annandale
A regression relation was estimated between log of SS and the log of instantaneous flow (Q) and
instantaneous turbidity (FNU). Table 3-6 shows estimated parameters and key regression
statistics. The residuals pass all graphical tests for normality and homoscedasticity. Duan’s
smearing estimate was used to back transform the predictions of the regression model.
0
2,000
4,000
6,000
8,000
10,000
12,000
14,000
16,000
18,000
20,000
2008 2009 2010 2011 2012 2013 2014 2015
Susp
end
ed S
edim
ent
(to
ns/
yr)
Accotink Long Branch
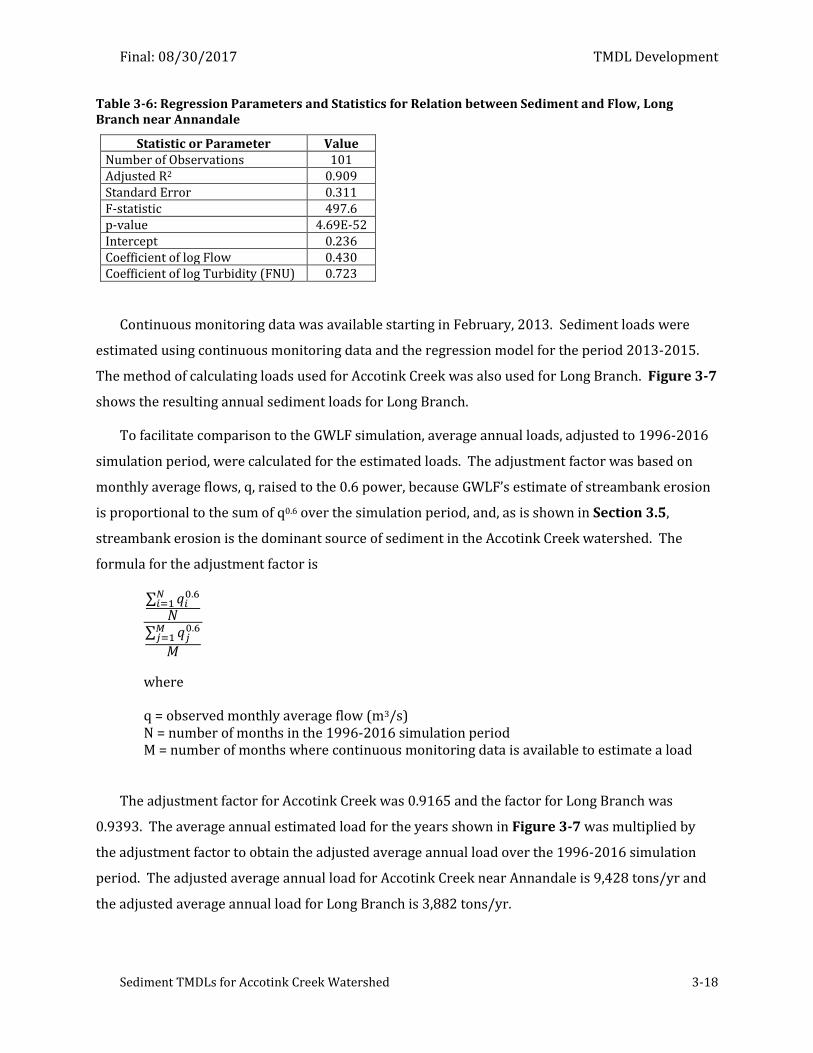
Final: 08/30/2017 TMDL Development
Sediment TMDLs for Accotink Creek Watershed 3-18
Table 3-6: Regression Parameters and Statistics for Relation between Sediment and Flow, Long Branch near Annandale
Statistic or Parameter Value Number of Observations 101 Adjusted R2 0.909 Standard Error 0.311 F-statistic 497.6 p-value 4.69E-52 Intercept 0.236 Coefficient of log Flow 0.430 Coefficient of log Turbidity (FNU) 0.723
Continuous monitoring data was available starting in February, 2013. Sediment loads were
estimated using continuous monitoring data and the regression model for the period 2013-2015.
The method of calculating loads used for Accotink Creek was also used for Long Branch. Figure 3-7
shows the resulting annual sediment loads for Long Branch.
To facilitate comparison to the GWLF simulation, average annual loads, adjusted to 1996-2016
simulation period, were calculated for the estimated loads. The adjustment factor was based on
monthly average flows, q, raised to the 0.6 power, because GWLF’s estimate of streambank erosion
is proportional to the sum of q0.6 over the simulation period, and, as is shown in Section 3.5,
streambank erosion is the dominant source of sediment in the Accotink Creek watershed. The
formula for the adjustment factor is
∑ 𝑞𝑖0.6𝑁
𝑖=1𝑁
∑ 𝑞𝑗0.6𝑀
𝑗=1
𝑀
where
q = observed monthly average flow (m3/s) N = number of months in the 1996-2016 simulation period M = number of months where continuous monitoring data is available to estimate a load
The adjustment factor for Accotink Creek was 0.9165 and the factor for Long Branch was
0.9393. The average annual estimated load for the years shown in Figure 3-7 was multiplied by
the adjustment factor to obtain the adjusted average annual load over the 1996-2016 simulation
period. The adjusted average annual load for Accotink Creek near Annandale is 9,428 tons/yr and
the adjusted average annual load for Long Branch is 3,882 tons/yr.
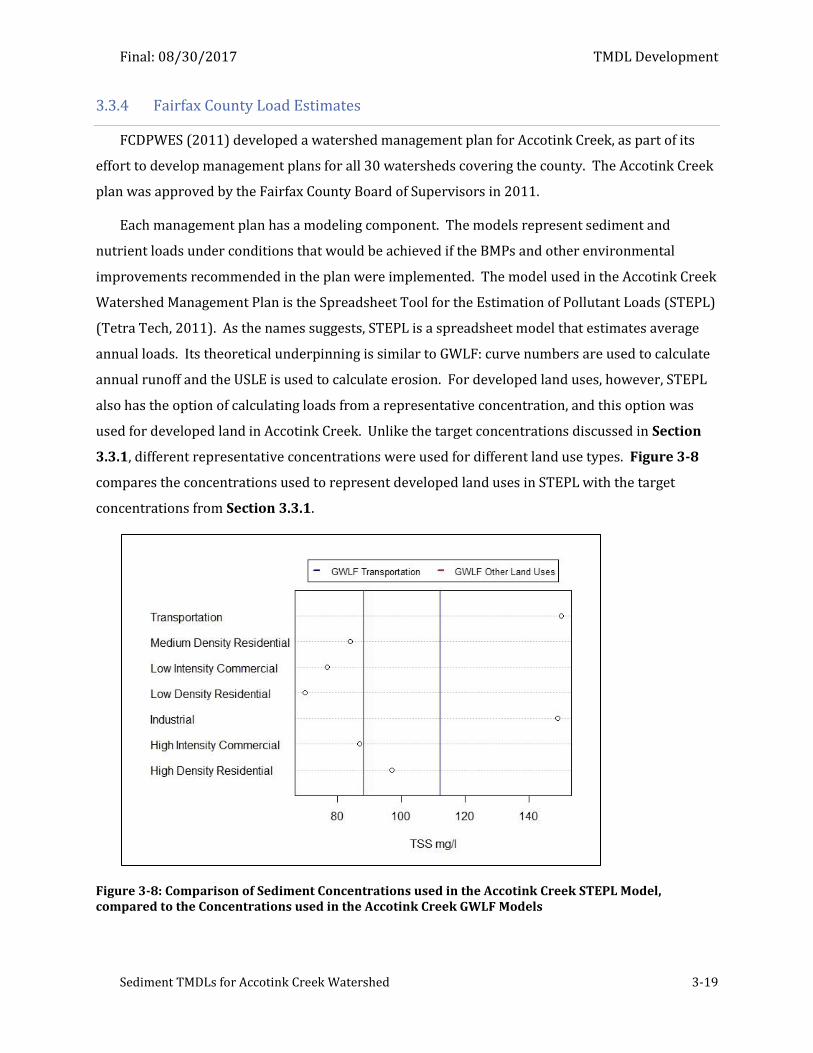
Final: 08/30/2017 TMDL Development
Sediment TMDLs for Accotink Creek Watershed 3-19
3.3.4 Fairfax County Load Estimates
FCDPWES (2011) developed a watershed management plan for Accotink Creek, as part of its
effort to develop management plans for all 30 watersheds covering the county. The Accotink Creek
plan was approved by the Fairfax County Board of Supervisors in 2011.
Each management plan has a modeling component. The models represent sediment and
nutrient loads under conditions that would be achieved if the BMPs and other environmental
improvements recommended in the plan were implemented. The model used in the Accotink Creek
Watershed Management Plan is the Spreadsheet Tool for the Estimation of Pollutant Loads (STEPL)
(Tetra Tech, 2011). As the names suggests, STEPL is a spreadsheet model that estimates average
annual loads. Its theoretical underpinning is similar to GWLF: curve numbers are used to calculate
annual runoff and the USLE is used to calculate erosion. For developed land uses, however, STEPL
also has the option of calculating loads from a representative concentration, and this option was
used for developed land in Accotink Creek. Unlike the target concentrations discussed in Section
3.3.1, different representative concentrations were used for different land use types. Figure 3-8
compares the concentrations used to represent developed land uses in STEPL with the target
concentrations from Section 3.3.1.
Figure 3-8: Comparison of Sediment Concentrations used in the Accotink Creek STEPL Model, compared to the Concentrations used in the Accotink Creek GWLF Models
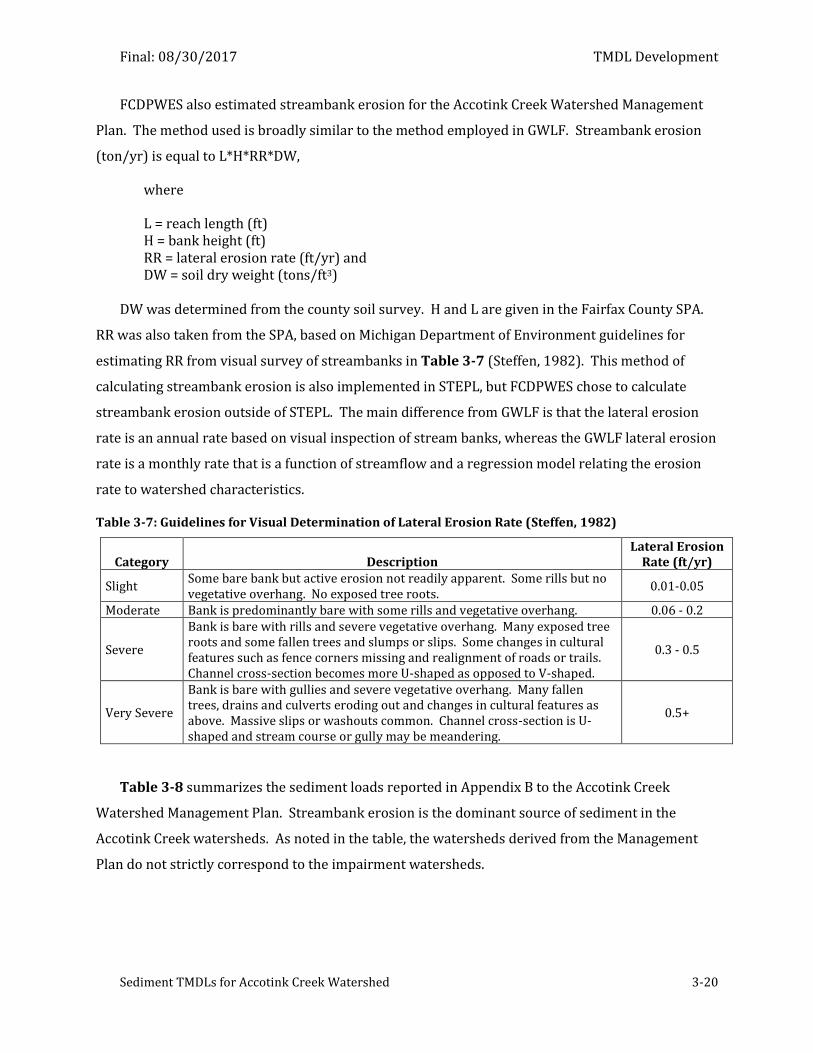
Final: 08/30/2017 TMDL Development
Sediment TMDLs for Accotink Creek Watershed 3-20
FCDPWES also estimated streambank erosion for the Accotink Creek Watershed Management
Plan. The method used is broadly similar to the method employed in GWLF. Streambank erosion
(ton/yr) is equal to L*H*RR*DW,
where
L = reach length (ft) H = bank height (ft) RR = lateral erosion rate (ft/yr) and DW = soil dry weight (tons/ft3)
DW was determined from the county soil survey. H and L are given in the Fairfax County SPA.
RR was also taken from the SPA, based on Michigan Department of Environment guidelines for
estimating RR from visual survey of streambanks in Table 3-7 (Steffen, 1982). This method of
calculating streambank erosion is also implemented in STEPL, but FCDPWES chose to calculate
streambank erosion outside of STEPL. The main difference from GWLF is that the lateral erosion
rate is an annual rate based on visual inspection of stream banks, whereas the GWLF lateral erosion
rate is a monthly rate that is a function of streamflow and a regression model relating the erosion
rate to watershed characteristics.
Table 3-7: Guidelines for Visual Determination of Lateral Erosion Rate (Steffen, 1982)
Category Description Lateral Erosion
Rate (ft/yr)
Slight Some bare bank but active erosion not readily apparent. Some rills but no vegetative overhang. No exposed tree roots.
0.01-0.05
Moderate Bank is predominantly bare with some rills and vegetative overhang. 0.06 - 0.2
Severe
Bank is bare with rills and severe vegetative overhang. Many exposed tree roots and some fallen trees and slumps or slips. Some changes in cultural features such as fence corners missing and realignment of roads or trails. Channel cross-section becomes more U-shaped as opposed to V-shaped.
0.3 - 0.5
Very Severe
Bank is bare with gullies and severe vegetative overhang. Many fallen trees, drains and culverts eroding out and changes in cultural features as above. Massive slips or washouts common. Channel cross-section is U-shaped and stream course or gully may be meandering.
0.5+
Table 3-8 summarizes the sediment loads reported in Appendix B to the Accotink Creek
Watershed Management Plan. Streambank erosion is the dominant source of sediment in the
Accotink Creek watersheds. As noted in the table, the watersheds derived from the Management
Plan do not strictly correspond to the impairment watersheds.
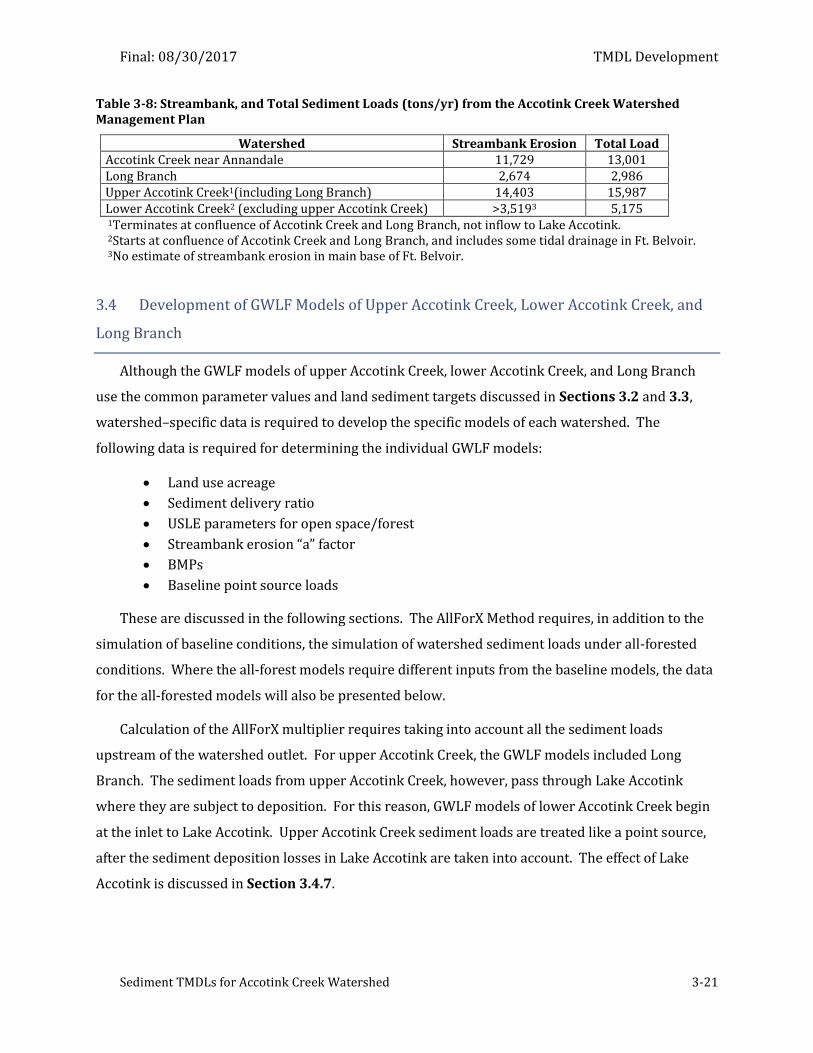
Final: 08/30/2017 TMDL Development
Sediment TMDLs for Accotink Creek Watershed 3-21
Table 3-8: Streambank, and Total Sediment Loads (tons/yr) from the Accotink Creek Watershed Management Plan
Watershed Streambank Erosion Total Load Accotink Creek near Annandale 11,729 13,001 Long Branch 2,674 2,986 Upper Accotink Creek1(including Long Branch) 14,403 15,987 Lower Accotink Creek2 (excluding upper Accotink Creek) >3,5193 5,175 1Terminates at confluence of Accotink Creek and Long Branch, not inflow to Lake Accotink. 2Starts at confluence of Accotink Creek and Long Branch, and includes some tidal drainage in Ft. Belvoir. 3No estimate of streambank erosion in main base of Ft. Belvoir.
3.4 Development of GWLF Models of Upper Accotink Creek, Lower Accotink Creek, and
Long Branch
Although the GWLF models of upper Accotink Creek, lower Accotink Creek, and Long Branch
use the common parameter values and land sediment targets discussed in Sections 3.2 and 3.3,
watershed–specific data is required to develop the specific models of each watershed. The
following data is required for determining the individual GWLF models:
Land use acreage
Sediment delivery ratio
USLE parameters for open space/forest
Streambank erosion “a” factor
BMPs
Baseline point source loads
These are discussed in the following sections. The AllForX Method requires, in addition to the
simulation of baseline conditions, the simulation of watershed sediment loads under all-forested
conditions. Where the all-forest models require different inputs from the baseline models, the data
for the all-forested models will also be presented below.
Calculation of the AllForX multiplier requires taking into account all the sediment loads
upstream of the watershed outlet. For upper Accotink Creek, the GWLF models included Long
Branch. The sediment loads from upper Accotink Creek, however, pass through Lake Accotink
where they are subject to deposition. For this reason, GWLF models of lower Accotink Creek begin
at the inlet to Lake Accotink. Upper Accotink Creek sediment loads are treated like a point source,
after the sediment deposition losses in Lake Accotink are taken into account. The effect of Lake
Accotink is discussed in Section 3.4.7.
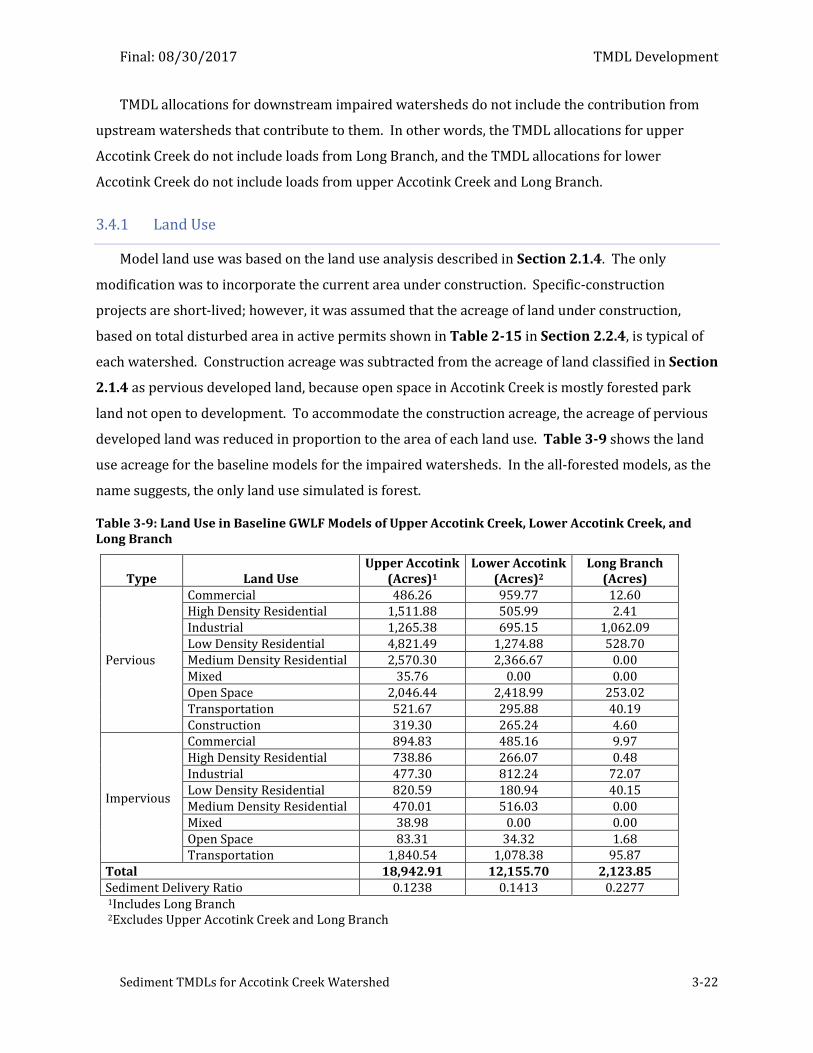
Final: 08/30/2017 TMDL Development
Sediment TMDLs for Accotink Creek Watershed 3-22
TMDL allocations for downstream impaired watersheds do not include the contribution from
upstream watersheds that contribute to them. In other words, the TMDL allocations for upper
Accotink Creek do not include loads from Long Branch, and the TMDL allocations for lower
Accotink Creek do not include loads from upper Accotink Creek and Long Branch.
3.4.1 Land Use
Model land use was based on the land use analysis described in Section 2.1.4. The only
modification was to incorporate the current area under construction. Specific-construction
projects are short-lived; however, it was assumed that the acreage of land under construction,
based on total disturbed area in active permits shown in Table 2-15 in Section 2.2.4, is typical of
each watershed. Construction acreage was subtracted from the acreage of land classified in Section
2.1.4 as pervious developed land, because open space in Accotink Creek is mostly forested park
land not open to development. To accommodate the construction acreage, the acreage of pervious
developed land was reduced in proportion to the area of each land use. Table 3-9 shows the land
use acreage for the baseline models for the impaired watersheds. In the all-forested models, as the
name suggests, the only land use simulated is forest.
Table 3-9: Land Use in Baseline GWLF Models of Upper Accotink Creek, Lower Accotink Creek, and Long Branch
Type Land Use Upper Accotink
(Acres)1 Lower Accotink
(Acres)2 Long Branch
(Acres)
Pervious
Commercial 486.26 959.77 12.60 High Density Residential 1,511.88 505.99 2.41 Industrial 1,265.38 695.15 1,062.09 Low Density Residential 4,821.49 1,274.88 528.70 Medium Density Residential 2,570.30 2,366.67 0.00 Mixed 35.76 0.00 0.00 Open Space 2,046.44 2,418.99 253.02 Transportation 521.67 295.88 40.19 Construction 319.30 265.24 4.60
Impervious
Commercial 894.83 485.16 9.97 High Density Residential 738.86 266.07 0.48 Industrial 477.30 812.24 72.07 Low Density Residential 820.59 180.94 40.15 Medium Density Residential 470.01 516.03 0.00 Mixed 38.98 0.00 0.00 Open Space 83.31 34.32 1.68 Transportation 1,840.54 1,078.38 95.87
Total 18,942.91 12,155.70 2,123.85 Sediment Delivery Ratio 0.1238 0.1413 0.2277 1Includes Long Branch 2Excludes Upper Accotink Creek and Long Branch
Final: 08/30/2017 TMDL Development
Sediment TMDLs for Accotink Creek Watershed 3-23
3.4.2 Sediment Delivery Ratio
The sediment delivery ratio (SDR) was calculated using a formula found in MapShed (Evans and
Corradini, 2014):
SDR = 0.451*A-0.298
where
A is the area of the watershed in square kilometers.
The formula is intended to replicate the graphic representation of Vanoni (1975) recommended
by the GWLF 2.0 documentation (Haith et al., 1992). Since SDR is a function of watershed area
alone, the same value is used for the baseline and all-forest models; however, since developed land
uses are simulated as end-of-pipe loads, the SDR is applied only to open space and land under
construction in the baseline models. The SDR for each watershed model is shown in Table 3-9.
3.4.3 USLE Parameters
USLE is used under baseline conditions to simulate sediment losses from open space land.
GWLF requires the product of the CKLSP factors as a model input. Open space was simulated as
forest and, following the GWLF manual (Haith et al., 1992), the C factor was set 0.001. The P factor
was set equal to 1. The K factor was calculated from the SSURGO soil data described in Section
2.1.3 by intersecting soil types with the zoning information. The LS factor was calculated using a
formula from Haith et al. (1992), originally from Wischmeier and Smith (1978):
LS = (0.045 * L)b(65.41 * sin2S + 4.56 * sin S + 0.065)
where
S = inverse tangent of slope L = slope length b = factor that varies with slope
The percent slope was calculated using the NED described in Section 2.1.1. The slope length
was calculated using the formula from Evans and Corradini (2014):
L = (0.5*A)/TSL
where
A = watershed area (km) TSL = total length of streams in the watershed (m)
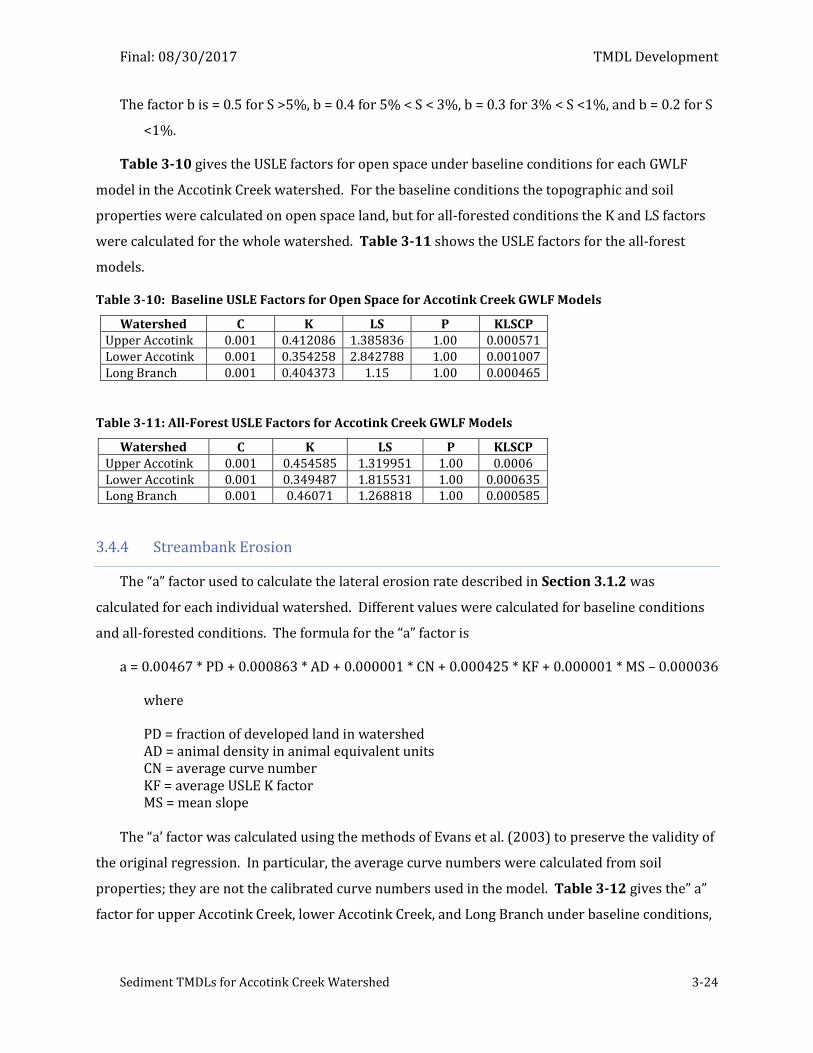
Final: 08/30/2017 TMDL Development
Sediment TMDLs for Accotink Creek Watershed 3-24
The factor b is = 0.5 for S >5%, b = 0.4 for 5% < S < 3%, b = 0.3 for 3% < S <1%, and b = 0.2 for S
<1%.
Table 3-10 gives the USLE factors for open space under baseline conditions for each GWLF
model in the Accotink Creek watershed. For the baseline conditions the topographic and soil
properties were calculated on open space land, but for all-forested conditions the K and LS factors
were calculated for the whole watershed. Table 3-11 shows the USLE factors for the all-forest
models.
Table 3-10: Baseline USLE Factors for Open Space for Accotink Creek GWLF Models
Watershed C K LS P KLSCP Upper Accotink 0.001 0.412086 1.385836 1.00 0.000571 Lower Accotink 0.001 0.354258 2.842788 1.00 0.001007 Long Branch 0.001 0.404373 1.15 1.00 0.000465
Table 3-11: All-Forest USLE Factors for Accotink Creek GWLF Models
Watershed C K LS P KLSCP Upper Accotink 0.001 0.454585 1.319951 1.00 0.0006 Lower Accotink 0.001 0.349487 1.815531 1.00 0.000635 Long Branch 0.001 0.46071 1.268818 1.00 0.000585
3.4.4 Streambank Erosion
The “a” factor used to calculate the lateral erosion rate described in Section 3.1.2 was
calculated for each individual watershed. Different values were calculated for baseline conditions
and all-forested conditions. The formula for the “a” factor is
a = 0.00467 * PD + 0.000863 * AD + 0.000001 * CN + 0.000425 * KF + 0.000001 * MS – 0.000036
where
PD = fraction of developed land in watershed AD = animal density in animal equivalent units CN = average curve number KF = average USLE K factor MS = mean slope
The “a’ factor was calculated using the methods of Evans et al. (2003) to preserve the validity of
the original regression. In particular, the average curve numbers were calculated from soil
properties; they are not the calibrated curve numbers used in the model. Table 3-12 gives the” a”
factor for upper Accotink Creek, lower Accotink Creek, and Long Branch under baseline conditions,
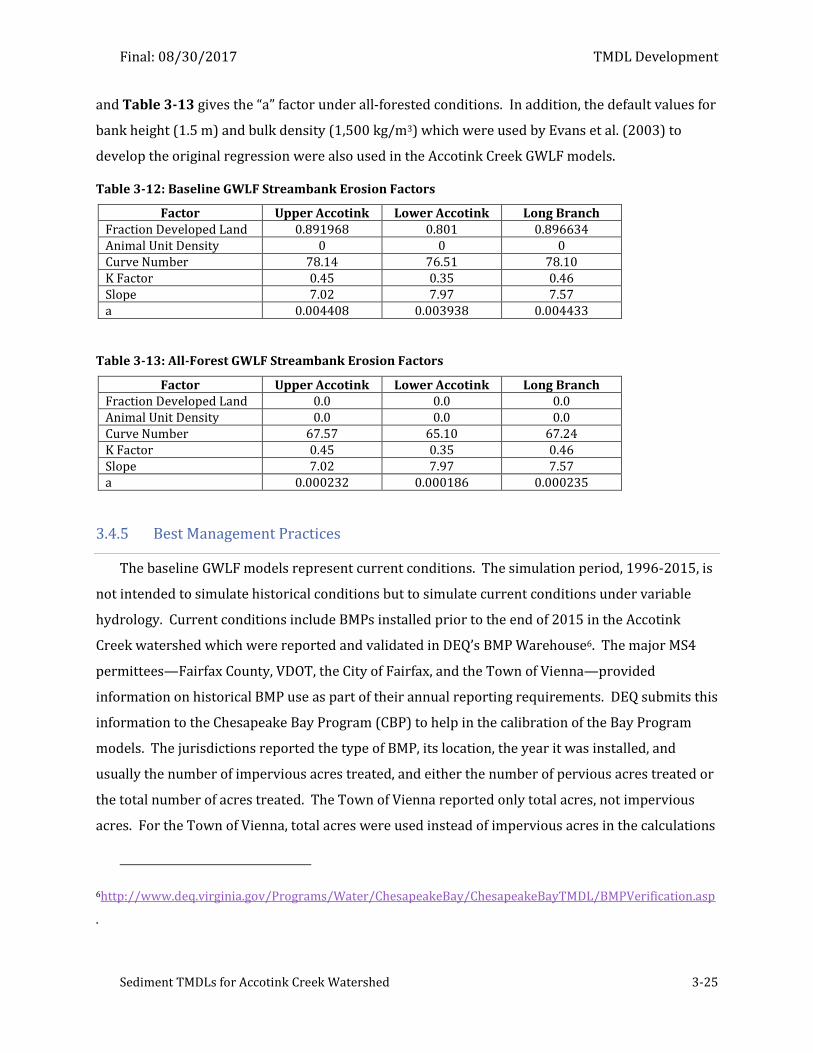
Final: 08/30/2017 TMDL Development
Sediment TMDLs for Accotink Creek Watershed 3-25
and Table 3-13 gives the “a” factor under all-forested conditions. In addition, the default values for
bank height (1.5 m) and bulk density (1,500 kg/m3) which were used by Evans et al. (2003) to
develop the original regression were also used in the Accotink Creek GWLF models.
Table 3-12: Baseline GWLF Streambank Erosion Factors
Factor Upper Accotink Lower Accotink Long Branch Fraction Developed Land 0.891968 0.801 0.896634 Animal Unit Density 0 0 0 Curve Number 78.14 76.51 78.10 K Factor 0.45 0.35 0.46 Slope 7.02 7.97 7.57 a 0.004408 0.003938 0.004433
Table 3-13: All-Forest GWLF Streambank Erosion Factors
Factor Upper Accotink Lower Accotink Long Branch Fraction Developed Land 0.0 0.0 0.0 Animal Unit Density 0.0 0.0 0.0 Curve Number 67.57 65.10 67.24 K Factor 0.45 0.35 0.46 Slope 7.02 7.97 7.57 a 0.000232 0.000186 0.000235
3.4.5 Best Management Practices
The baseline GWLF models represent current conditions. The simulation period, 1996-2015, is
not intended to simulate historical conditions but to simulate current conditions under variable
hydrology. Current conditions include BMPs installed prior to the end of 2015 in the Accotink
Creek watershed which were reported and validated in DEQ’s BMP Warehouse6. The major MS4
permittees—Fairfax County, VDOT, the City of Fairfax, and the Town of Vienna—provided
information on historical BMP use as part of their annual reporting requirements. DEQ submits this
information to the Chesapeake Bay Program (CBP) to help in the calibration of the Bay Program
models. The jurisdictions reported the type of BMP, its location, the year it was installed, and
usually the number of impervious acres treated, and either the number of pervious acres treated or
the total number of acres treated. The Town of Vienna reported only total acres, not impervious
acres. For the Town of Vienna, total acres were used instead of impervious acres in the calculations
6http://www.deq.virginia.gov/Programs/Water/ChesapeakeBay/ChesapeakeBayTMDL/BMPVerification.asp
.
Final: 08/30/2017 TMDL Development
Sediment TMDLs for Accotink Creek Watershed 3-26
described below. It was assumed that all BMPs installed in the watershed prior to 2015 are
currently in operation.
The impacts of the installed BMPs were incorporated into the baseline GWLF models as follows:
First the sediment reduction efficiency of each of type BMP reported was estimated from the
literature. Sources of efficiency information included:
Virginia TMDL Implementation Plan Guidance (DEQ, 2003)
Chesapeake Bay Program (CBP, 2006)
Chesapeake Bay Program Efficiencies (DEQ, 2015)
Virginia Assessment Scenario Tool (VAST)
International Stormwater BMP Database (ISBMP)
Minnesota Pollution Control Agency (MPCA, 2015)
Nashua Regional Planning Commission (NRPC)
Pennsylvania Stormwater BMP Manual (PADEP, 2006)
Table 3-14 shows the sediment reduction efficiency for each type of BMP and the source of the
estimate of the efficiency. The names of the types of BMPs in Table 3-14 may differ from the names
of the types of BMPs submitted by the jurisdictions, because names of the types of BMPs in the BMP
Warehouse must conform to the National Environmental Information Exchange Network (NEIEN)
nomenclature.
Second, the location of each BMP was determined. For each BMP, the impaired watershed, the
jurisdiction, and whether or not it was in the combined MS4 service area, shown in Figure 2-8, was
identified. Third, the total effective impervious area treated was calculated by impairment,
jurisdiction, and whether it was inside or outside the combined service area. The total effective
impervious area is based on the product of the impervious area and BMP reduction efficiency
summed for all BMPs in a defined area. It represents the equivalent amount of impervious area
whose load is removed by BMPs. For example, if 100 acres are treated by a BMP with a reduction
efficiency of 40%, that is equivalent to totally removing the sediment load from 40 acres of
impervious land. The percent reduction from impervious area is the ratio of total effective
impervious area to total impervious area. The percent reduction can be reported by impairment,
jurisdiction, or service area. Table 3-15 shows the percent reduction from impervious land loads
by impairment and jurisdiction combined service area, since wasteload allocations for MS4s are
Final: 08/30/2017 TMDL Development
Sediment TMDLs for Accotink Creek Watershed 3-27
aggregated by jurisdiction as described in Section 4.2 under the MS4 subsection. Table 3-15 also
shows the percent reduction from areas outside of a combined service area, which are given by
impairment only. To be conservative, BMP reductions were applied only to sediment loads from
impervious surfaces, because runoff from pervious surfaces, which represents only a small fraction
of total surface runoff, is more likely to occur under high flow storm events when BMPs are less
effective .
Streambank restoration projects in Accotink Creek were not among the BMPs submitted to DEQ
by the jurisdictions, so no BMP reductions were applied to streambank erosion in simulating
current conditions in the Accotink Creek watershed.
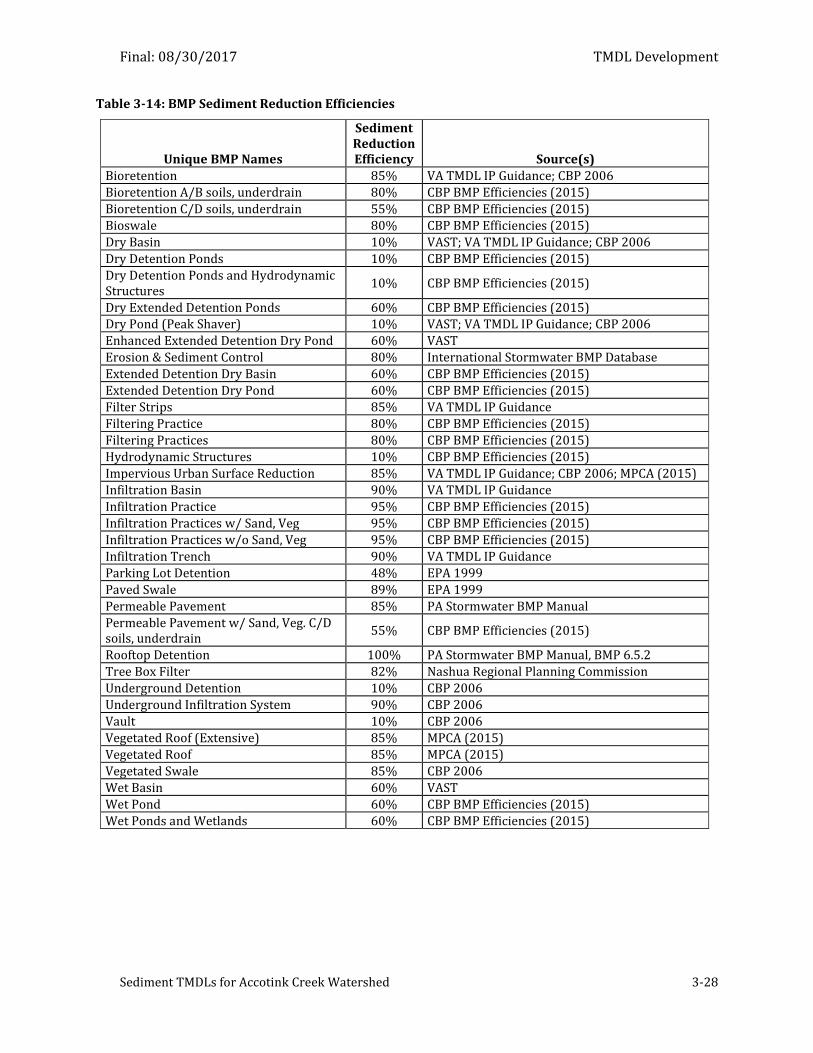
Final: 08/30/2017 TMDL Development
Sediment TMDLs for Accotink Creek Watershed 3-28
Table 3-14: BMP Sediment Reduction Efficiencies
Unique BMP Names
Sediment Reduction Efficiency Source(s)
Bioretention 85% VA TMDL IP Guidance; CBP 2006
Bioretention A/B soils, underdrain 80% CBP BMP Efficiencies (2015)
Bioretention C/D soils, underdrain 55% CBP BMP Efficiencies (2015)
Bioswale 80% CBP BMP Efficiencies (2015)
Dry Basin 10% VAST; VA TMDL IP Guidance; CBP 2006
Dry Detention Ponds 10% CBP BMP Efficiencies (2015)
Dry Detention Ponds and Hydrodynamic Structures
10% CBP BMP Efficiencies (2015)
Dry Extended Detention Ponds 60% CBP BMP Efficiencies (2015) Dry Pond (Peak Shaver) 10% VAST; VA TMDL IP Guidance; CBP 2006
Enhanced Extended Detention Dry Pond 60% VAST
Erosion & Sediment Control 80% International Stormwater BMP Database
Extended Detention Dry Basin 60% CBP BMP Efficiencies (2015)
Extended Detention Dry Pond 60% CBP BMP Efficiencies (2015)
Filter Strips 85% VA TMDL IP Guidance
Filtering Practice 80% CBP BMP Efficiencies (2015)
Filtering Practices 80% CBP BMP Efficiencies (2015)
Hydrodynamic Structures 10% CBP BMP Efficiencies (2015)
Impervious Urban Surface Reduction 85% VA TMDL IP Guidance; CBP 2006; MPCA (2015)
Infiltration Basin 90% VA TMDL IP Guidance
Infiltration Practice 95% CBP BMP Efficiencies (2015)
Infiltration Practices w/ Sand, Veg 95% CBP BMP Efficiencies (2015)
Infiltration Practices w/o Sand, Veg 95% CBP BMP Efficiencies (2015)
Infiltration Trench 90% VA TMDL IP Guidance
Parking Lot Detention 48% EPA 1999
Paved Swale 89% EPA 1999
Permeable Pavement 85% PA Stormwater BMP Manual
Permeable Pavement w/ Sand, Veg. C/D soils, underdrain
55% CBP BMP Efficiencies (2015)
Rooftop Detention 100% PA Stormwater BMP Manual, BMP 6.5.2
Tree Box Filter 82% Nashua Regional Planning Commission
Underground Detention 10% CBP 2006
Underground Infiltration System 90% CBP 2006
Vault 10% CBP 2006
Vegetated Roof (Extensive) 85% MPCA (2015)
Vegetated Roof 85% MPCA (2015)
Vegetated Swale 85% CBP 2006
Wet Basin 60% VAST
Wet Pond 60% CBP BMP Efficiencies (2015)
Wet Ponds and Wetlands 60% CBP BMP Efficiencies (2015)
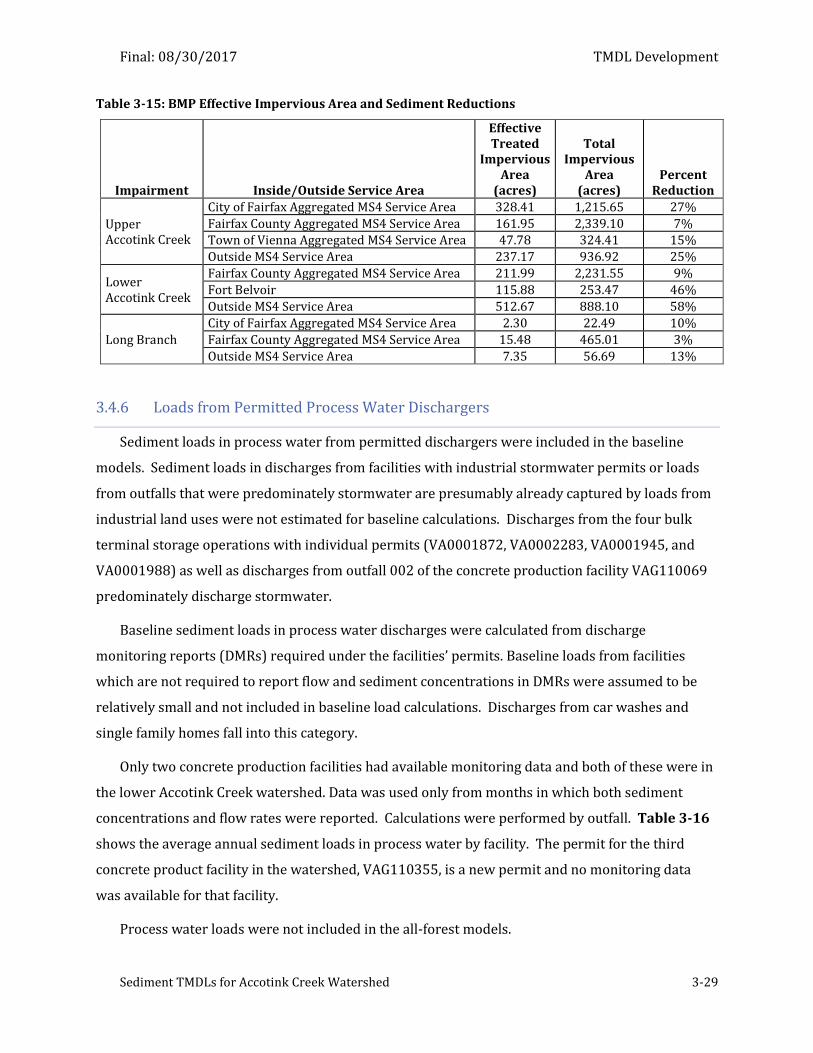
Final: 08/30/2017 TMDL Development
Sediment TMDLs for Accotink Creek Watershed 3-29
Table 3-15: BMP Effective Impervious Area and Sediment Reductions
Impairment Inside/Outside Service Area
Effective Treated
Impervious Area
(acres)
Total Impervious
Area (acres)
Percent Reduction
Upper Accotink Creek
City of Fairfax Aggregated MS4 Service Area 328.41 1,215.65 27%
Fairfax County Aggregated MS4 Service Area 161.95 2,339.10 7% Town of Vienna Aggregated MS4 Service Area 47.78 324.41 15%
Outside MS4 Service Area 237.17 936.92 25%
Lower Accotink Creek
Fairfax County Aggregated MS4 Service Area 211.99 2,231.55 9%
Fort Belvoir 115.88 253.47 46%
Outside MS4 Service Area 512.67 888.10 58%
Long Branch
City of Fairfax Aggregated MS4 Service Area 2.30 22.49 10%
Fairfax County Aggregated MS4 Service Area 15.48 465.01 3%
Outside MS4 Service Area 7.35 56.69 13%
3.4.6 Loads from Permitted Process Water Dischargers
Sediment loads in process water from permitted dischargers were included in the baseline
models. Sediment loads in discharges from facilities with industrial stormwater permits or loads
from outfalls that were predominately stormwater are presumably already captured by loads from
industrial land uses were not estimated for baseline calculations. Discharges from the four bulk
terminal storage operations with individual permits (VA0001872, VA0002283, VA0001945, and
VA0001988) as well as discharges from outfall 002 of the concrete production facility VAG110069
predominately discharge stormwater.
Baseline sediment loads in process water discharges were calculated from discharge
monitoring reports (DMRs) required under the facilities’ permits. Baseline loads from facilities
which are not required to report flow and sediment concentrations in DMRs were assumed to be
relatively small and not included in baseline load calculations. Discharges from car washes and
single family homes fall into this category.
Only two concrete production facilities had available monitoring data and both of these were in
the lower Accotink Creek watershed. Data was used only from months in which both sediment
concentrations and flow rates were reported. Calculations were performed by outfall. Table 3-16
shows the average annual sediment loads in process water by facility. The permit for the third
concrete product facility in the watershed, VAG110355, is a new permit and no monitoring data
was available for that facility.
Process water loads were not included in the all-forest models.
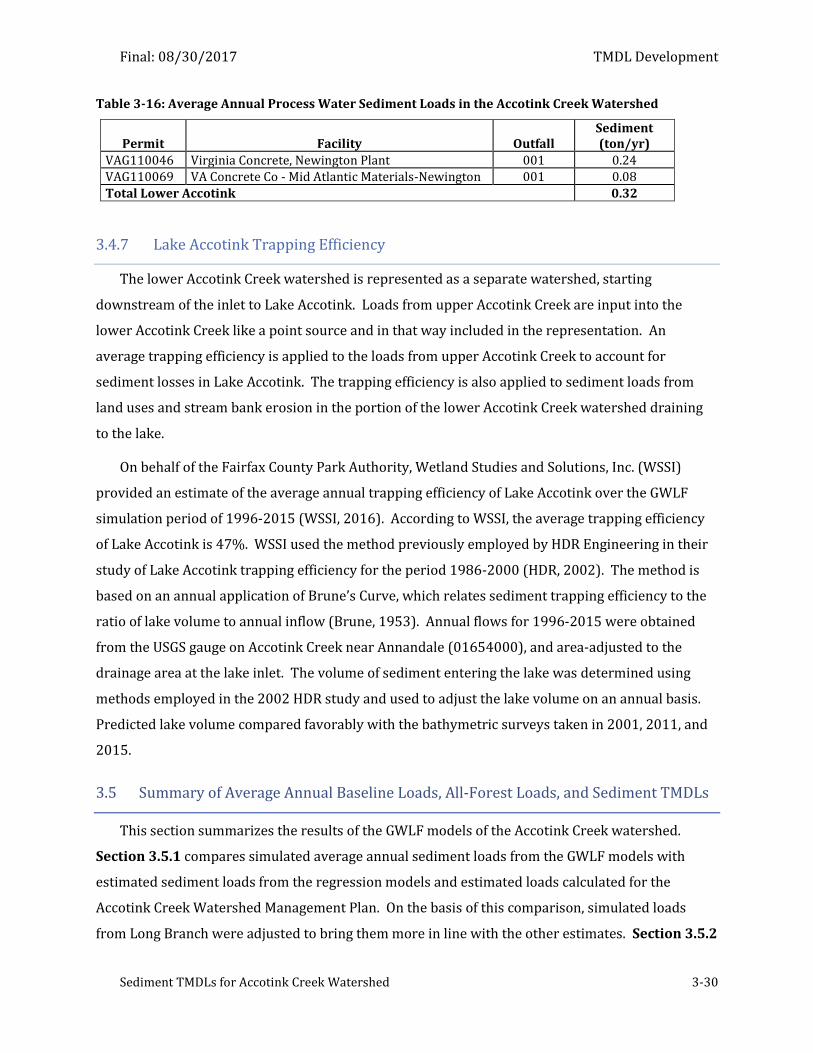
Final: 08/30/2017 TMDL Development
Sediment TMDLs for Accotink Creek Watershed 3-30
Table 3-16: Average Annual Process Water Sediment Loads in the Accotink Creek Watershed
Permit Facility Outfall Sediment (ton/yr)
VAG110046 Virginia Concrete, Newington Plant 001 0.24 VAG110069 VA Concrete Co - Mid Atlantic Materials-Newington 001 0.08
Total Lower Accotink 0.32
3.4.7 Lake Accotink Trapping Efficiency
The lower Accotink Creek watershed is represented as a separate watershed, starting
downstream of the inlet to Lake Accotink. Loads from upper Accotink Creek are input into the
lower Accotink Creek like a point source and in that way included in the representation. An
average trapping efficiency is applied to the loads from upper Accotink Creek to account for
sediment losses in Lake Accotink. The trapping efficiency is also applied to sediment loads from
land uses and stream bank erosion in the portion of the lower Accotink Creek watershed draining
to the lake.
On behalf of the Fairfax County Park Authority, Wetland Studies and Solutions, Inc. (WSSI)
provided an estimate of the average annual trapping efficiency of Lake Accotink over the GWLF
simulation period of 1996-2015 (WSSI, 2016). According to WSSI, the average trapping efficiency
of Lake Accotink is 47%. WSSI used the method previously employed by HDR Engineering in their
study of Lake Accotink trapping efficiency for the period 1986-2000 (HDR, 2002). The method is
based on an annual application of Brune’s Curve, which relates sediment trapping efficiency to the
ratio of lake volume to annual inflow (Brune, 1953). Annual flows for 1996-2015 were obtained
from the USGS gauge on Accotink Creek near Annandale (01654000), and area-adjusted to the
drainage area at the lake inlet. The volume of sediment entering the lake was determined using
methods employed in the 2002 HDR study and used to adjust the lake volume on an annual basis.
Predicted lake volume compared favorably with the bathymetric surveys taken in 2001, 2011, and
2015.
3.5 Summary of Average Annual Baseline Loads, All-Forest Loads, and Sediment TMDLs
This section summarizes the results of the GWLF models of the Accotink Creek watershed.
Section 3.5.1 compares simulated average annual sediment loads from the GWLF models with
estimated sediment loads from the regression models and estimated loads calculated for the
Accotink Creek Watershed Management Plan. On the basis of this comparison, simulated loads
from Long Branch were adjusted to bring them more in line with the other estimates. Section 3.5.2
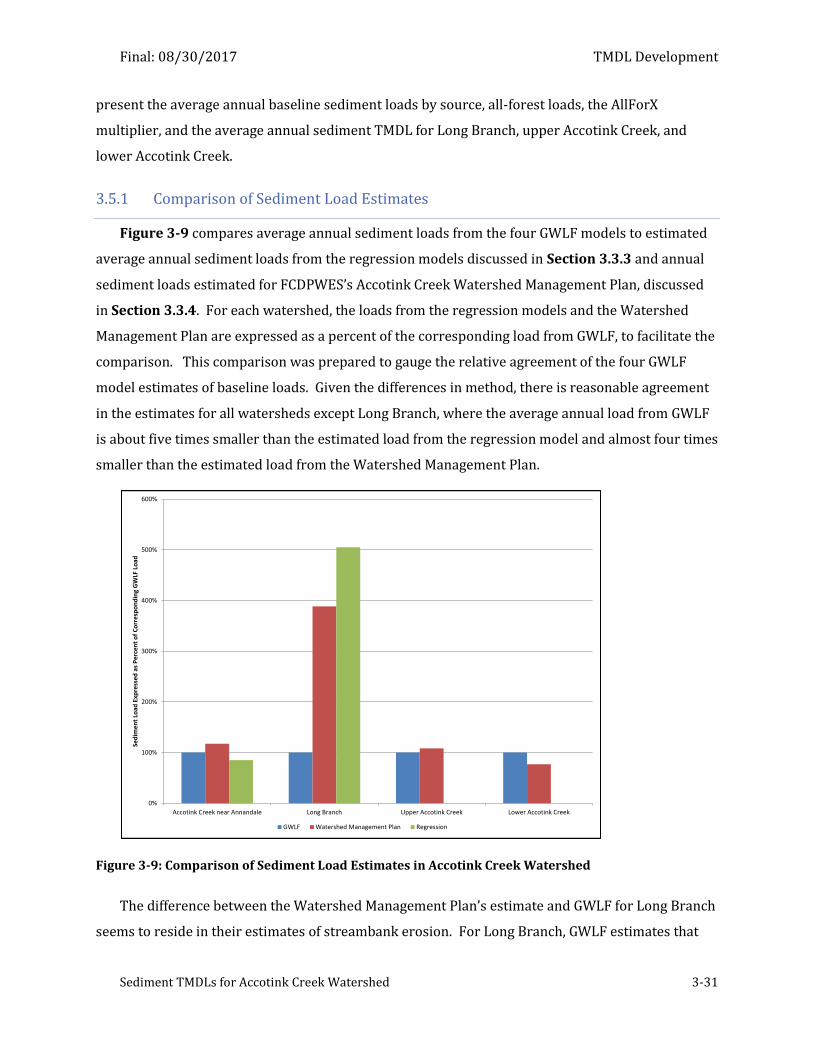
Final: 08/30/2017 TMDL Development
Sediment TMDLs for Accotink Creek Watershed 3-31
present the average annual baseline sediment loads by source, all-forest loads, the AllForX
multiplier, and the average annual sediment TMDL for Long Branch, upper Accotink Creek, and
lower Accotink Creek.
3.5.1 Comparison of Sediment Load Estimates
Figure 3-9 compares average annual sediment loads from the four GWLF models to estimated
average annual sediment loads from the regression models discussed in Section 3.3.3 and annual
sediment loads estimated for FCDPWES’s Accotink Creek Watershed Management Plan, discussed
in Section 3.3.4. For each watershed, the loads from the regression models and the Watershed
Management Plan are expressed as a percent of the corresponding load from GWLF, to facilitate the
comparison. This comparison was prepared to gauge the relative agreement of the four GWLF
model estimates of baseline loads. Given the differences in method, there is reasonable agreement
in the estimates for all watersheds except Long Branch, where the average annual load from GWLF
is about five times smaller than the estimated load from the regression model and almost four times
smaller than the estimated load from the Watershed Management Plan.
Figure 3-9: Comparison of Sediment Load Estimates in Accotink Creek Watershed
The difference between the Watershed Management Plan’s estimate and GWLF for Long Branch
seems to reside in their estimates of streambank erosion. For Long Branch, GWLF estimates that
0%
100%
200%
300%
400%
500%
600%
Accotink Creek near Annandale Long Branch Upper Accotink Creek Lower Accotink Creek
Sed
ime
nt
Load
Exp
ress
ed
as
Pe
rce
nt
of
Co
rre
spo
nd
ing
GW
LF L
oad
GWLF Watershed Management Plan Regression
Final: 08/30/2017 TMDL Development
Sediment TMDLs for Accotink Creek Watershed 3-32
the average annual sediment load from land-based sources is 282 tons/yr, which is comparable to
the estimate of land-based sources in the Watershed Management Plan of 312 tons/yr (assuming,
that is, that the land-based load in the Management Plan can be identified with the difference
between total load and streambank erosion). The GWLF streambank erosion rate, on the other
hand, is over five times smaller than the erosion rate calculated for the Management Plan.
To bring the GWLF loads for Long Branch into line with the other estimates, the streambank
erosion rate in Long Branch was adjusted so that the average annual load equals the adjusted
average annual load estimated by the regression model. This is tantamount to calibrating the Long
Branch “a” factor against the estimated loads. The streambank adjustment factor for Long Branch
was 7.45.
The streambank adjustment factor was also applied to streambank erosion loads under the all-
forested conditions. By applying the adjustment factor under all-forested conditions, Long Branch’s
share of the total streambank load in upper Accotink Creek remains about the same. When the
adjustment factor is applied, Long Branch’s share of total streambank erosion is about 30% under
both baseline conditions and all-forested conditions. If the adjustment factor were not applied
under all-forested conditions, Long Branch’s share of total streambank erosion would be about 4%,
making it difficult to account for the source of streambank erosion in upper Accotink Creek
watershed under all-forest conditions.
3.5.2 Average Annual Baseline Sediment Loads, All-Forest Loads, and TMDLs
Average annual baseline loads were simulated based on the sediment calibration targets
discussed in Section 3.3, the watershed-specific land use (Section 3.4.1), model parameters
(Sections 3.4.2-3.4.4), BMP reductions in loads from impervious land (Section 3.4.5), and
regulated process water loads (Section 3.4.6). All-Forest loads were simulated with a single land
use, forest, and the watershed-specific parameters in Sections 3.4.2 through 3.4.4. No point
sources or BMPs are simulated under all-forested conditions. All simulations used the calibrated
hydrology parameters from Section 3.2.
The ratio of average annual sediment loads under baseline conditions to sediment loads under
all-forested conditions is the AllForX multiplier. As shown in Appendix A, AllForX multipliers from
the Accotink Creek watershed were used to calculate a threshold AllForX multiplier. The threshold
AllForX multiplier is the multiplier that is projected to achieve a VSCI score of 60, and thus meet
Virginia’s water quality standards for supporting aquatic life. As shown in Appendix A, the AllForX
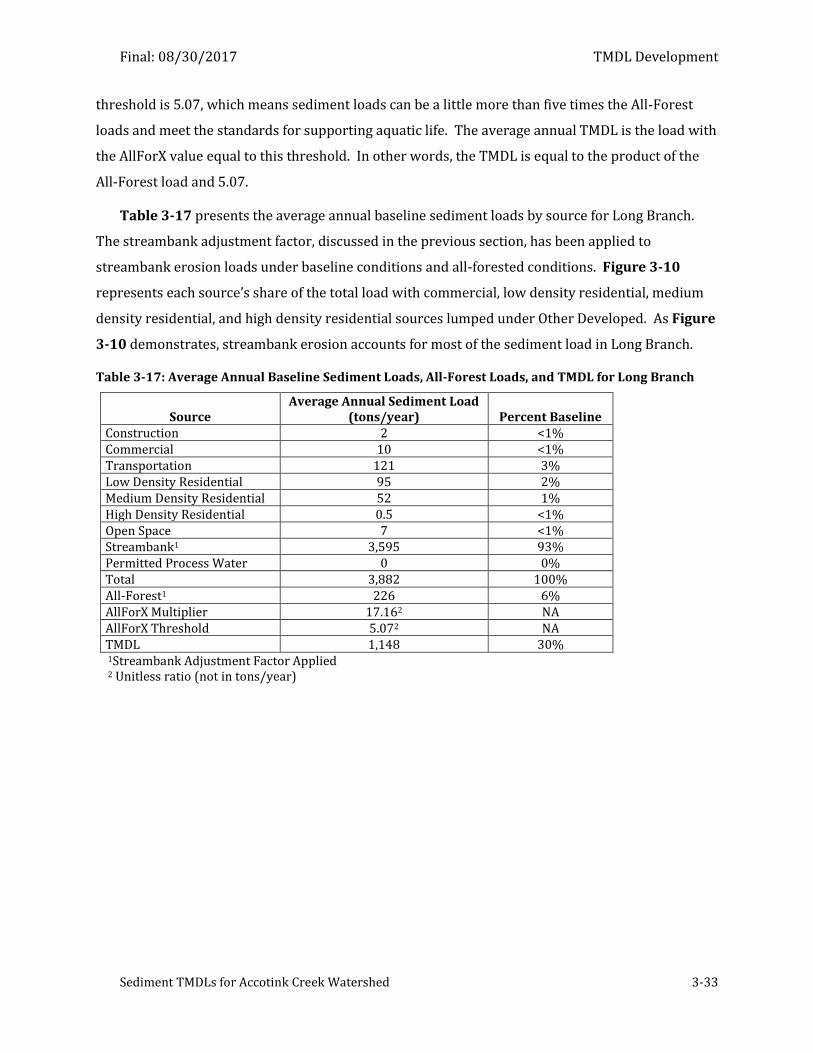
Final: 08/30/2017 TMDL Development
Sediment TMDLs for Accotink Creek Watershed 3-33
threshold is 5.07, which means sediment loads can be a little more than five times the All-Forest
loads and meet the standards for supporting aquatic life. The average annual TMDL is the load with
the AllForX value equal to this threshold. In other words, the TMDL is equal to the product of the
All-Forest load and 5.07.
Table 3-17 presents the average annual baseline sediment loads by source for Long Branch.
The streambank adjustment factor, discussed in the previous section, has been applied to
streambank erosion loads under baseline conditions and all-forested conditions. Figure 3-10
represents each source’s share of the total load with commercial, low density residential, medium
density residential, and high density residential sources lumped under Other Developed. As Figure
3-10 demonstrates, streambank erosion accounts for most of the sediment load in Long Branch.
Table 3-17: Average Annual Baseline Sediment Loads, All-Forest Loads, and TMDL for Long Branch
Source Average Annual Sediment Load
(tons/year) Percent Baseline Construction 2 <1% Commercial 10 <1% Transportation 121 3% Low Density Residential 95 2% Medium Density Residential 52 1% High Density Residential 0.5 <1% Open Space 7 <1% Streambank1 3,595 93% Permitted Process Water 0 0% Total 3,882 100% All-Forest1 226 6% AllForX Multiplier 17.162 NA AllForX Threshold 5.072 NA TMDL 1,148 30% 1Streambank Adjustment Factor Applied 2 Unitless ratio (not in tons/year)
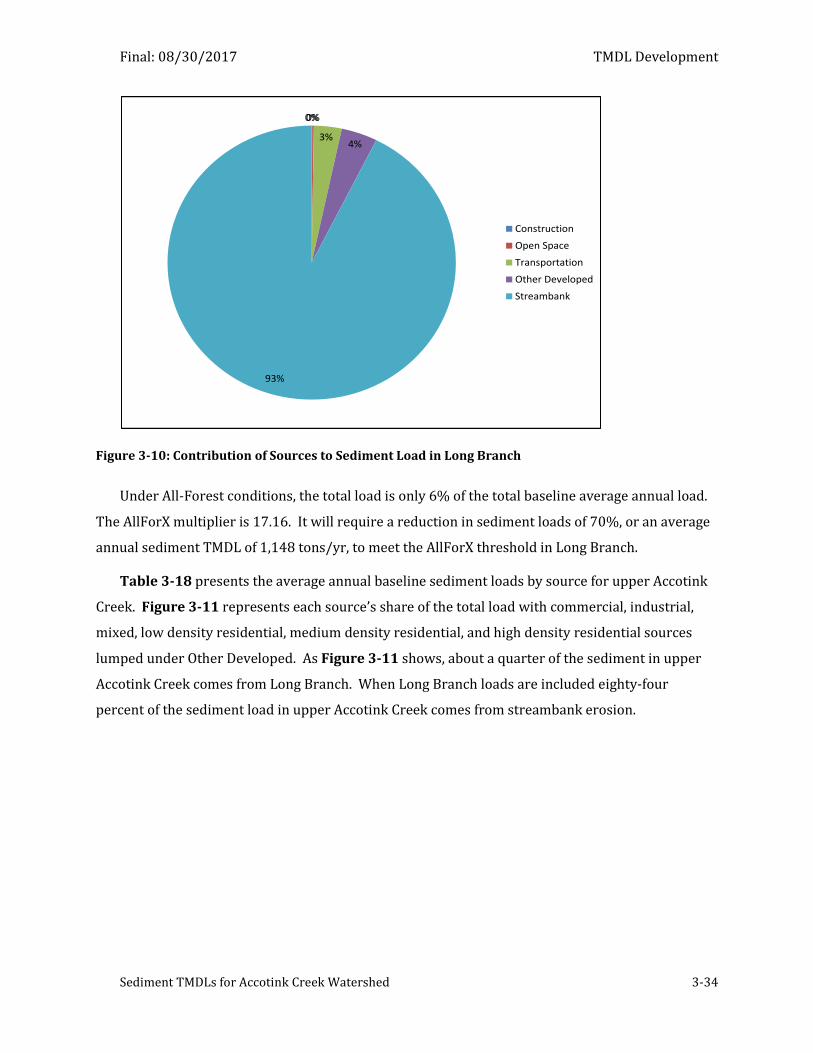
Final: 08/30/2017 TMDL Development
Sediment TMDLs for Accotink Creek Watershed 3-34
Figure 3-10: Contribution of Sources to Sediment Load in Long Branch
Under All-Forest conditions, the total load is only 6% of the total baseline average annual load.
The AllForX multiplier is 17.16. It will require a reduction in sediment loads of 70%, or an average
annual sediment TMDL of 1,148 tons/yr, to meet the AllForX threshold in Long Branch.
Table 3-18 presents the average annual baseline sediment loads by source for upper Accotink
Creek. Figure 3-11 represents each source’s share of the total load with commercial, industrial,
mixed, low density residential, medium density residential, and high density residential sources
lumped under Other Developed. As Figure 3-11 shows, about a quarter of the sediment in upper
Accotink Creek comes from Long Branch. When Long Branch loads are included eighty-four
percent of the sediment load in upper Accotink Creek comes from streambank erosion.
0%0%
3%4%
93%
Construction
Open Space
Transportation
Other Developed
Streambank
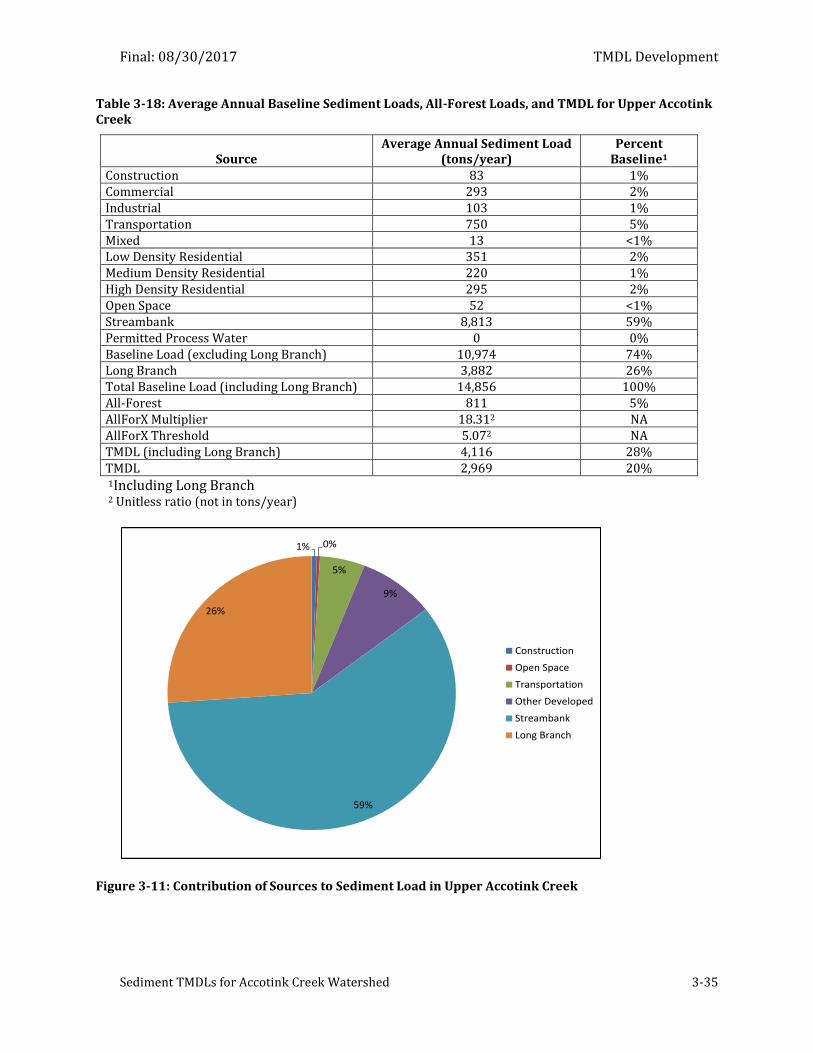
Final: 08/30/2017 TMDL Development
Sediment TMDLs for Accotink Creek Watershed 3-35
Table 3-18: Average Annual Baseline Sediment Loads, All-Forest Loads, and TMDL for Upper Accotink Creek
Source Average Annual Sediment Load
(tons/year) Percent
Baseline1
Construction 83 1% Commercial 293 2% Industrial 103 1% Transportation 750 5% Mixed 13 <1% Low Density Residential 351 2% Medium Density Residential 220 1% High Density Residential 295 2% Open Space 52 <1% Streambank 8,813 59% Permitted Process Water 0 0% Baseline Load (excluding Long Branch) 10,974 74% Long Branch 3,882 26% Total Baseline Load (including Long Branch) 14,856 100% All-Forest 811 5% AllForX Multiplier 18.312 NA AllForX Threshold 5.072 NA TMDL (including Long Branch) 4,116 28% TMDL 2,969 20% 1Including Long Branch 2 Unitless ratio (not in tons/year)
Figure 3-11: Contribution of Sources to Sediment Load in Upper Accotink Creek
1% 0%
5%
9%
59%
26%
Construction
Open Space
Transportation
Other Developed
Streambank
Long Branch
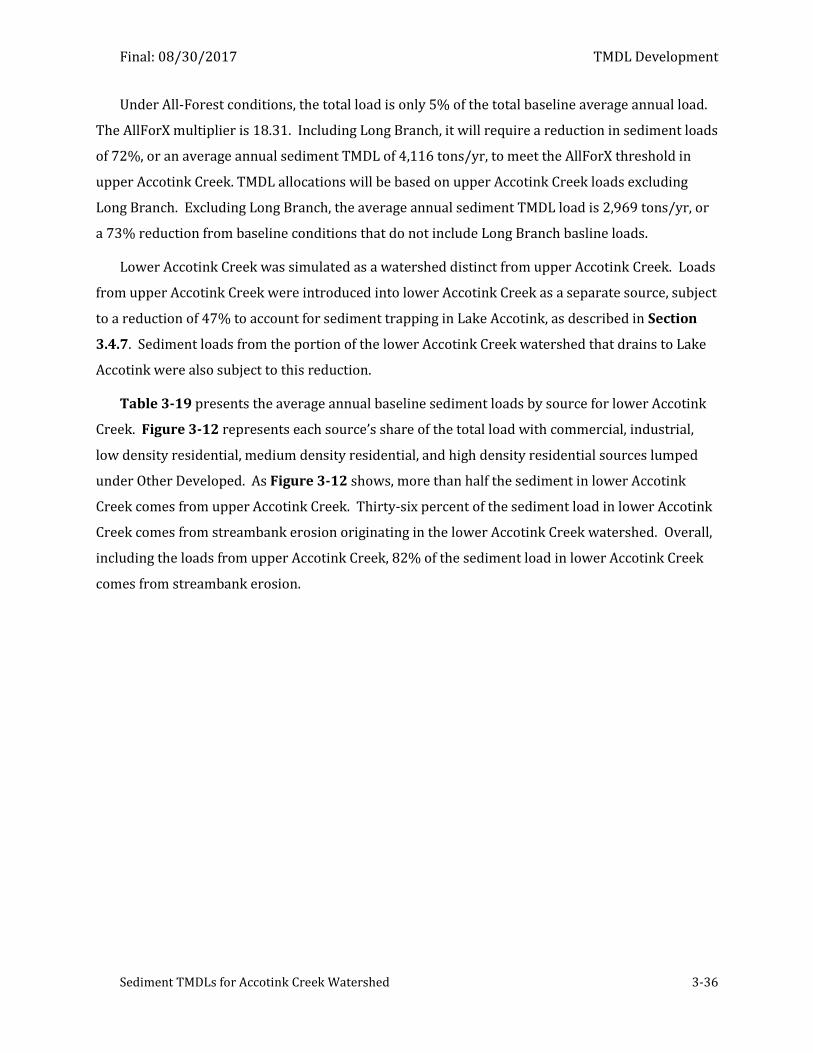
Final: 08/30/2017 TMDL Development
Sediment TMDLs for Accotink Creek Watershed 3-36
Under All-Forest conditions, the total load is only 5% of the total baseline average annual load.
The AllForX multiplier is 18.31. Including Long Branch, it will require a reduction in sediment loads
of 72%, or an average annual sediment TMDL of 4,116 tons/yr, to meet the AllForX threshold in
upper Accotink Creek. TMDL allocations will be based on upper Accotink Creek loads excluding
Long Branch. Excluding Long Branch, the average annual sediment TMDL load is 2,969 tons/yr, or
a 73% reduction from baseline conditions that do not include Long Branch basline loads.
Lower Accotink Creek was simulated as a watershed distinct from upper Accotink Creek. Loads
from upper Accotink Creek were introduced into lower Accotink Creek as a separate source, subject
to a reduction of 47% to account for sediment trapping in Lake Accotink, as described in Section
3.4.7. Sediment loads from the portion of the lower Accotink Creek watershed that drains to Lake
Accotink were also subject to this reduction.
Table 3-19 presents the average annual baseline sediment loads by source for lower Accotink
Creek. Figure 3-12 represents each source’s share of the total load with commercial, industrial,
low density residential, medium density residential, and high density residential sources lumped
under Other Developed. As Figure 3-12 shows, more than half the sediment in lower Accotink
Creek comes from upper Accotink Creek. Thirty-six percent of the sediment load in lower Accotink
Creek comes from streambank erosion originating in the lower Accotink Creek watershed. Overall,
including the loads from upper Accotink Creek, 82% of the sediment load in lower Accotink Creek
comes from streambank erosion.
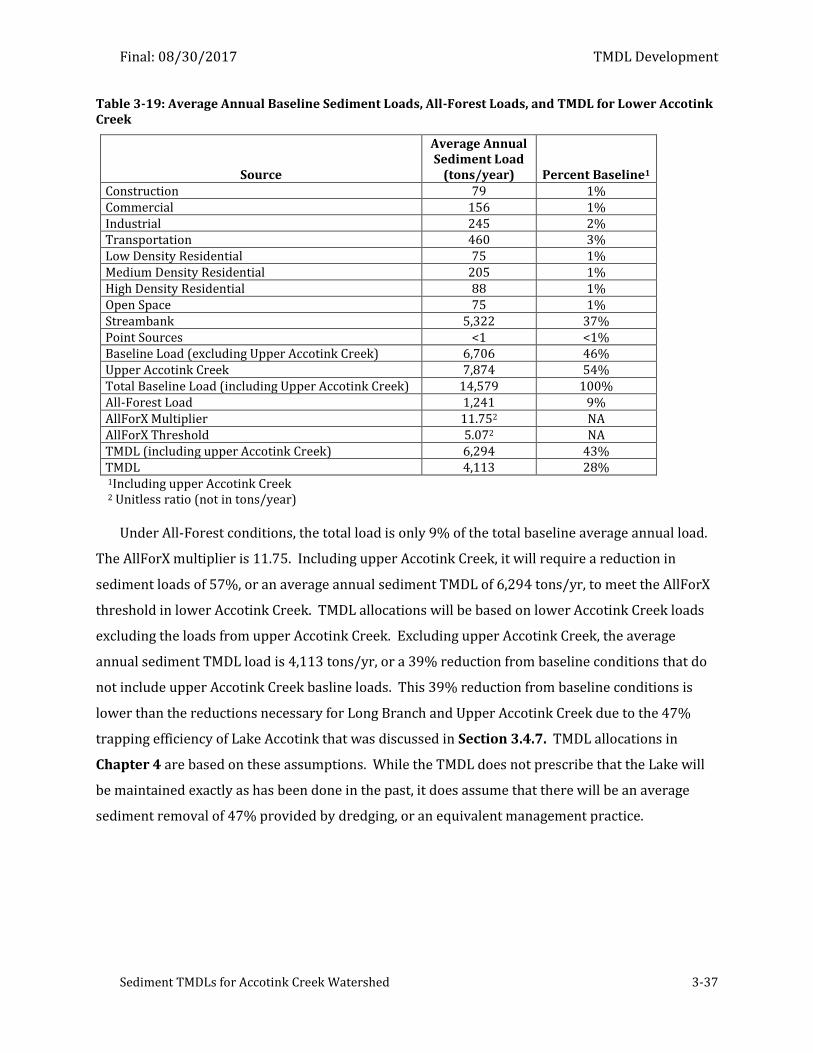
Final: 08/30/2017 TMDL Development
Sediment TMDLs for Accotink Creek Watershed 3-37
Table 3-19: Average Annual Baseline Sediment Loads, All-Forest Loads, and TMDL for Lower Accotink Creek
Source
Average Annual Sediment Load
(tons/year) Percent Baseline1
Construction 79 1% Commercial 156 1% Industrial 245 2% Transportation 460 3% Low Density Residential 75 1% Medium Density Residential 205 1% High Density Residential 88 1% Open Space 75 1% Streambank 5,322 37% Point Sources <1 <1% Baseline Load (excluding Upper Accotink Creek) 6,706 46% Upper Accotink Creek 7,874 54% Total Baseline Load (including Upper Accotink Creek) 14,579 100% All-Forest Load 1,241 9% AllForX Multiplier 11.752 NA AllForX Threshold 5.072 NA TMDL (including upper Accotink Creek) 6,294 43% TMDL 4,113 28% 1Including upper Accotink Creek 2 Unitless ratio (not in tons/year)
Under All-Forest conditions, the total load is only 9% of the total baseline average annual load.
The AllForX multiplier is 11.75. Including upper Accotink Creek, it will require a reduction in
sediment loads of 57%, or an average annual sediment TMDL of 6,294 tons/yr, to meet the AllForX
threshold in lower Accotink Creek. TMDL allocations will be based on lower Accotink Creek loads
excluding the loads from upper Accotink Creek. Excluding upper Accotink Creek, the average
annual sediment TMDL load is 4,113 tons/yr, or a 39% reduction from baseline conditions that do
not include upper Accotink Creek basline loads. This 39% reduction from baseline conditions is
lower than the reductions necessary for Long Branch and Upper Accotink Creek due to the 47%
trapping efficiency of Lake Accotink that was discussed in Section 3.4.7. TMDL allocations in
Chapter 4 are based on these assumptions. While the TMDL does not prescribe that the Lake will
be maintained exactly as has been done in the past, it does assume that there will be an average
sediment removal of 47% provided by dredging, or an equivalent management practice.
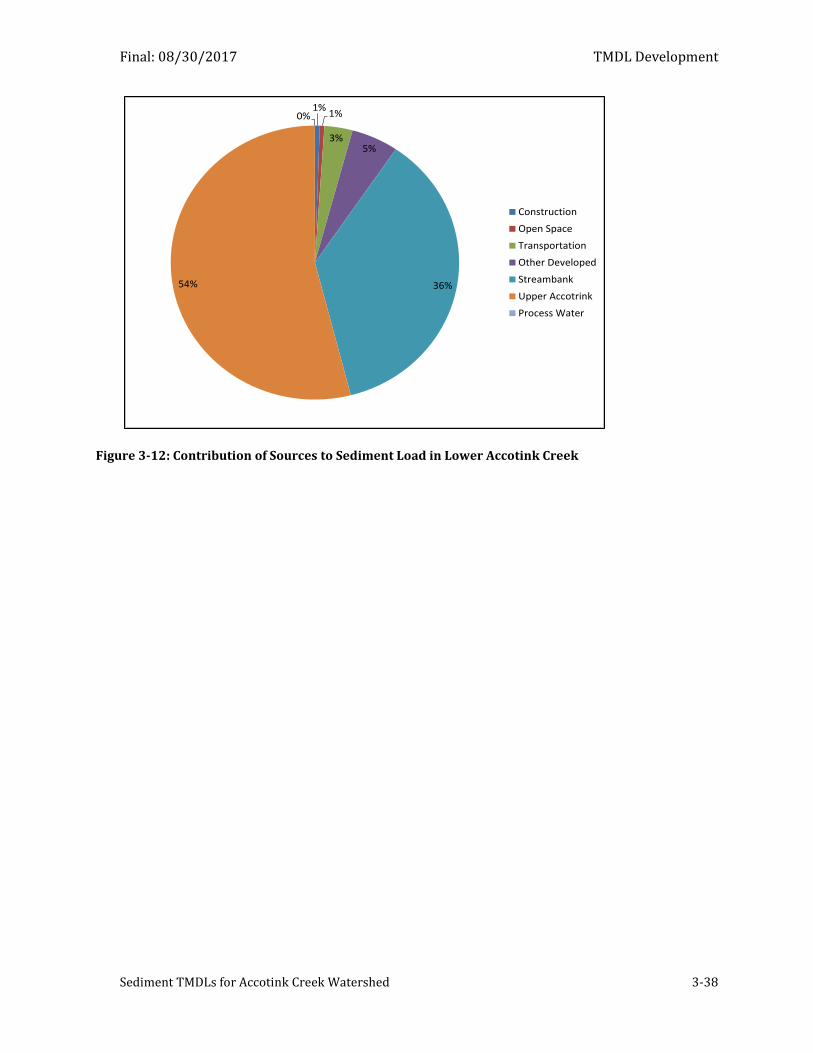
Final: 08/30/2017 TMDL Development
Sediment TMDLs for Accotink Creek Watershed 3-38
Figure 3-12: Contribution of Sources to Sediment Load in Lower Accotink Creek
1%1%
3%5%
36%54%
0%
Construction
Open Space
Transportation
Other Developed
Streambank
Upper Accotrink
Process Water
Final: 08/30/2017
Sediment TMDLs for Accotink Creek Watershed 4-1
4 TMDL Allocations
A TMDL is the amount of pollutant a waterbody can assimilate and still meet water quality
standards. According to EPA regulations (CFR 130.2, 130.7), the TMDL must be assigned or
allocated among regulated and non-regulated sources, according to the following equation:
TMDL = ΣWLA + ΣLA + MOS
where
WLA = Wasteload Allocation, which is the portion of the TMDL assigned to regulated or permitted sources;
LA = Load Allocation, which is the portion of the TMDL assigned to non-regulated sources
MOS = Margin of Safety Each of the components of the TMDL is discussed in more detail below.
4.1 Margin of Safety
A MOS is necessary to take into account the uncertainty in the relation between pollutant
loading rates and water quality. The MOS can be implicit or explicit. An implicit MOS is based on
the conservative assumptions used to determine the TMDL. An explicit MOS reserves a portion of
the TMDL to the MOS. A 10% explicit margin of safety was used in addressing the sediment
impairments in Accotink Creek.
4.2 Wasteload Allocation
Wasteload allocations are assigned to regulated, point source discharges. DEQ issues Virginia
Pollutant Discharge Elimination System (VPDES) permits for all point source discharges to surface
waters, to dischargers of stormwater from Municipal Separate Storm Sewer Systems (MS4s), and to
dischargers of stormwater from Industrial Activities. DEQ issues Virginia Stormwater Management
Program (VSMP) permits to dischargers of stormwater from Construction Activities. There are two
broad types of discharge permits; individual permits and general permits.
DEQ issues individual permits to both municipal and industrial facilities. Permit requirements,
special conditions, effluent limitations and monitoring requirements are determined for each
facility on a site specific basis in order to meet applicable water quality standards. General permits
are written for a general class of dischargers where operations and activities are similar. These
Final: 08/30/2017 TMDL Allocations
Sediment TMDLs for Accotink Creek Watershed 4-2
permits are also prepared to protect and maintain applicable water quality standards. In Virginia,
general permits are adopted as regulations.
Within the Accotink Creek watershed, there are seven individual permits authorizing
discharges to surface waters. Five of the individual permits are classified as industrial discharges.
Four of these permits govern the discharges from bulk petroleum storage facilities. One permit
governs the industrial stormwater discharges from Fort Belvoir. Lastly, there are two individual
permits issued to Municipal Separate Storm Sewer Systems (MS4) which govern the stormwater
discharges from municipal operations. Fairfax County currently has an individual permit; it is
anticipated that the Virginia Department of Transportation will have an individual permit by the
completion of this TMDL study.
There are discharges from eight general permit categories authorized in the Accotink Creek
watershed. These include:
three (3) Vehicle Wash and Laundry facilities;
one (1) Non-contact Cooling Water permittees;
three (3) Concrete Products Facilities;
two (2) permittees under the Domestic Sewage Discharge of Less Than or Equal to
1,000 Gallons per Day;
two (2) facilities authorized under the permit for Petroleum Contaminated Sites and
Hydrostatic Tests;
12 permits for Discharges of Stormwater Associated with Industrial Activity;
numerous transitory permits for stormwater discharges associated with land
disturbance or construction activities;
five (5) MS4 general permits issued to either small or non-traditional MS4 entities.
Not all of the authorized general permit discharges are considered to discharge the pollutant of
concern (e.g. sediment) in significant amounts which may cause or contribute to the impairments in
the Accotink Creek watershed. Accordingly, insignificant discharges are not assigned wasteload
allocations. Additionally, there is a distinction recognized throughout this document that
authorized discharges may result from stormwater (e.g. precipitation) and/or process water. An
example of a process water discharge is that resulting from the mixing and preparing of concrete
products, or the blow-down from a heating and air conditioning ventilation system. These
discharges are not related to a storm event.
Final: 08/30/2017 TMDL Allocations
Sediment TMDLs for Accotink Creek Watershed 4-3
The following sources will receive sediment wasteload allocations:
Municipal separate storm sewer systems (MS4s) discharges authorized under both
individual and general permits;
Individual VPDES permitted facilities;
Industrial stormwater discharges authorized under the general permit as contained in
9VAC25-151 (VAR05) - Discharges of Stormwater Associated with Industrial Activity;
Concrete product facilities authorized to discharge under the general permit 9VAC25-
193 (VAG11) - Concrete Products Facilities;
Carwash facilities authorized to discharge under the general permit 9VAC25-194
(VAG75) - Vehicle Wash and Laundry Facilities;
Domestic sewage discharges less than 1000 gallons per day authorized under 9VAC25-
110 (VAG40) - Domestic Sewage Discharges of Less Than or Equal To 1,000 Gallons Per
Day;
Stormwater discharges associated with land disturbance, or construction activities,
authorized under 9VAC25-880 - General VPDES Permit for Discharges of Stormwater
from Construction Activities.
Note that the regulatory citations for the general permits noted above are current as of the
preparation of this TMDL. The established WLA for each facility is applicable to the regulated
discharge(s) and shall remain valid should the regulatory citation for a given permit category be
updated or changed in the future.
Not all of the authorized general permit discharges are considered to discharge the pollutant of
concern (e.g. sediment) in significant amounts which may cause or contribute to the impairments in
the Accotink Creek watershed. Accordingly, insignificant discharges are not assigned wasteload
allocations. For this TMDL, sediment discharges from the general permit categories of non-contact
cooling water discharges as well as petroleum contaminated sites and hydrostatic discharges are
considered to be insignificant. These pollutants are not governed in either of these general permit
categories as they are not considered to have a reasonable potential to cause or contribute to
excursions of water quality standards. This TMDL study acknowledges and concurs with these
findings.
Individual Permits Governing Discharge from Petroleum Bulk Storage Operations. The
discharges associated with bulk terminal operations include both stormwater-derived discharges
Final: 08/30/2017 TMDL Allocations
Sediment TMDLs for Accotink Creek Watershed 4-4
as well as process water discharges. These discharges are generally controlled, or managed,
through containment areas and/or stormwater ponds. The allocations are based on (1) a maximum
total suspended solids (TSS) concentration of 60 mg/l and (2) average daily flow rates reported in
permit documentation, which including the permit application, fact sheet, permit and monthly
Discharge Monitoring Reports (DMRs).
Individual and General Industrial Stormwater Permits. Allocations for facilities discharging
stormwater exposed to industrial activity under an individual permit or the general industrial
stormwater permit were based on (1) a benchmark concentration of 100 mg/l, and (2) simulated
runoff in the drainage area of their outfalls. Simulated runoff was based on pervious and
impervious area in outfalls and average annual runoff per acre for developed pervious and
impervious land, taken from the GWLF hydrology simulation. Runoff was calculated in the same
way for the individual stormwater permit for Fort Belvoir, and a benchmark concentration of 100
mg/l was also used to calculate the allocation.
Car Wash General Permits. The sediment allocations for the three general car wash permit in
the watershed were calculated using a maximum permitted concentration of 60 mg/l and assumed
average discharges of 0.001 MGD, 0.00004 MDG, and 0.001 MGD for VAG750226, VAG750238, and
VAG750255, respectively.
Concrete Product General Permits. The allocations for concrete facilities were made by
outfall, depending on whether stormwater or process water (or both) were discharged through the
outfall. For VAG110046, the only outfall discharges process water. The allocation was calculated
from a permitted average concentration of 30 mg/l and an average daily flow of 0.00728 MGD. For
VAG110069, outfall 001 discharges process water and outfall 002 discharges stormwater. The
stormwater discharge was calculated using a concentration of 100 mg/l and simulated runoff from
GWLF. The allocation for the process water discharge was based on the permitted average
concentration of 30 mg/l and an average daily flow of 0.008 MGD. For VAG110355, there is a single
outfall (001) discharging process water comingled with stormwater. Since the majority of process
water is reused, the allocation was based on simulated runoff from GWLF and the process water
permitted average concentration of 30 mg/l.
Domestic Sewage Discharges General Permits. The sediment allocations for the two single
family homes discharging sewage under a general permit were calculated using a maximum
permitted concentration of 30 mg/l and a maximum permitted flow of 1000 gallons a day (0.001
MGD).
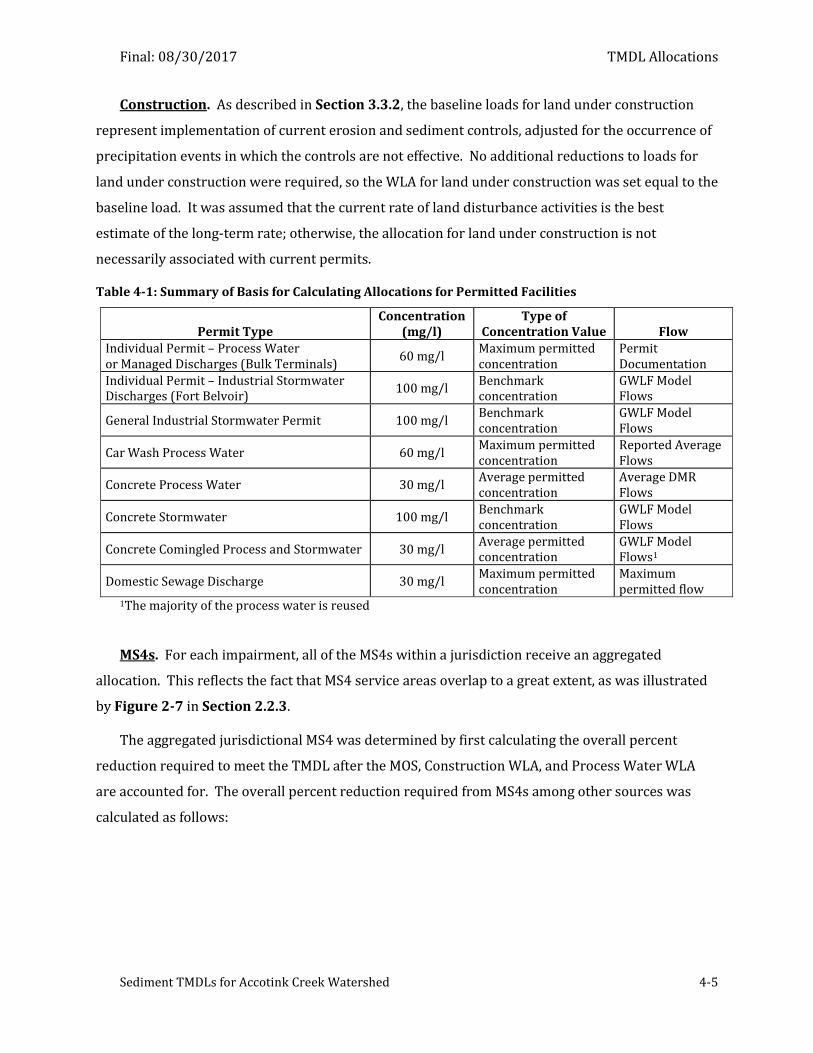
Final: 08/30/2017 TMDL Allocations
Sediment TMDLs for Accotink Creek Watershed 4-5
Construction. As described in Section 3.3.2, the baseline loads for land under construction
represent implementation of current erosion and sediment controls, adjusted for the occurrence of
precipitation events in which the controls are not effective. No additional reductions to loads for
land under construction were required, so the WLA for land under construction was set equal to the
baseline load. It was assumed that the current rate of land disturbance activities is the best
estimate of the long-term rate; otherwise, the allocation for land under construction is not
necessarily associated with current permits.
Table 4-1: Summary of Basis for Calculating Allocations for Permitted Facilities
Permit Type Concentration
(mg/l) Type of
Concentration Value Flow
Individual Permit – Process Water or Managed Discharges (Bulk Terminals)
60 mg/l Maximum permitted concentration
Permit Documentation
Individual Permit – Industrial Stormwater Discharges (Fort Belvoir)
100 mg/l Benchmark concentration
GWLF Model Flows
General Industrial Stormwater Permit 100 mg/l Benchmark concentration
GWLF Model Flows
Car Wash Process Water 60 mg/l Maximum permitted concentration
Reported Average Flows
Concrete Process Water 30 mg/l Average permitted concentration
Average DMR Flows
Concrete Stormwater 100 mg/l Benchmark concentration
GWLF Model Flows
Concrete Comingled Process and Stormwater 30 mg/l Average permitted concentration
GWLF Model Flows1
Domestic Sewage Discharge 30 mg/l Maximum permitted concentration
Maximum permitted flow
1The majority of the process water is reused
MS4s. For each impairment, all of the MS4s within a jurisdiction receive an aggregated
allocation. This reflects the fact that MS4 service areas overlap to a great extent, as was illustrated
by Figure 2-7 in Section 2.2.3.
The aggregated jurisdictional MS4 was determined by first calculating the overall percent
reduction required to meet the TMDL after the MOS, Construction WLA, and Process Water WLA
are accounted for. The overall percent reduction required from MS4s among other sources was
calculated as follows:
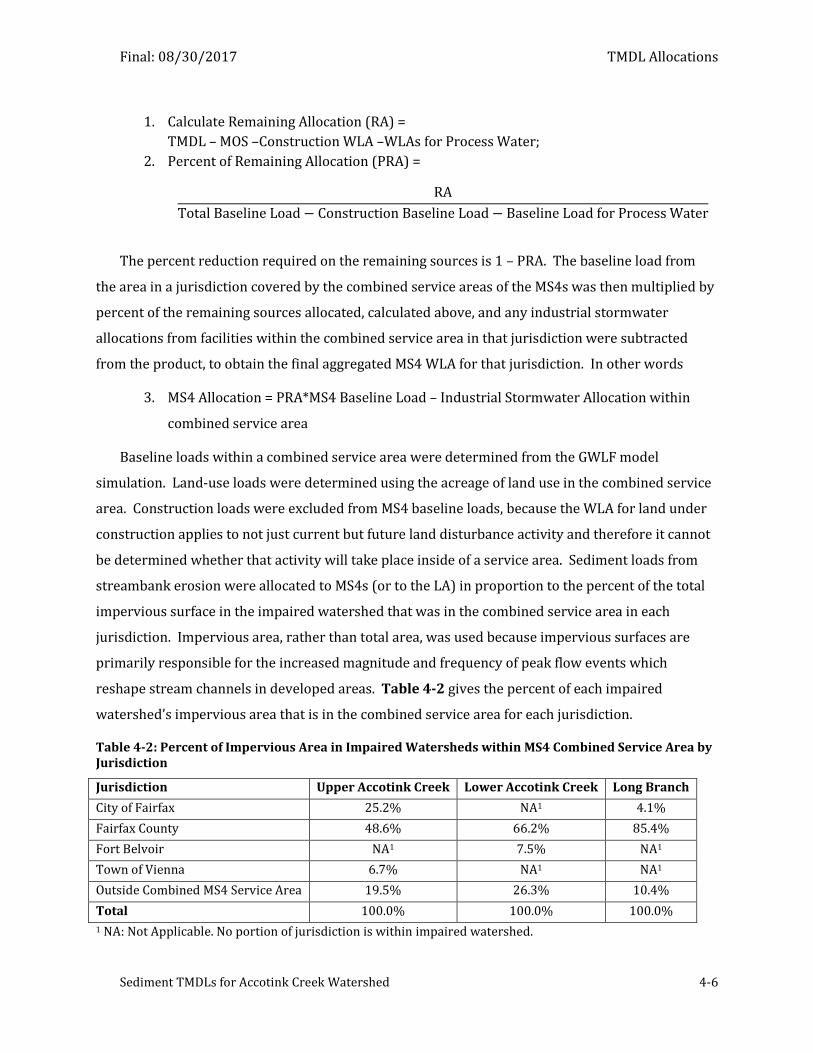
Final: 08/30/2017 TMDL Allocations
Sediment TMDLs for Accotink Creek Watershed 4-6
1. Calculate Remaining Allocation (RA) =
TMDL – MOS –Construction WLA –WLAs for Process Water;
2. Percent of Remaining Allocation (PRA) =
RA
Total Baseline Load − Construction Baseline Load − Baseline Load for Process Water
The percent reduction required on the remaining sources is 1 – PRA. The baseline load from
the area in a jurisdiction covered by the combined service areas of the MS4s was then multiplied by
percent of the remaining sources allocated, calculated above, and any industrial stormwater
allocations from facilities within the combined service area in that jurisdiction were subtracted
from the product, to obtain the final aggregated MS4 WLA for that jurisdiction. In other words
3. MS4 Allocation = PRA*MS4 Baseline Load – Industrial Stormwater Allocation within
combined service area
Baseline loads within a combined service area were determined from the GWLF model
simulation. Land-use loads were determined using the acreage of land use in the combined service
area. Construction loads were excluded from MS4 baseline loads, because the WLA for land under
construction applies to not just current but future land disturbance activity and therefore it cannot
be determined whether that activity will take place inside of a service area. Sediment loads from
streambank erosion were allocated to MS4s (or to the LA) in proportion to the percent of the total
impervious surface in the impaired watershed that was in the combined service area in each
jurisdiction. Impervious area, rather than total area, was used because impervious surfaces are
primarily responsible for the increased magnitude and frequency of peak flow events which
reshape stream channels in developed areas. Table 4-2 gives the percent of each impaired
watershed’s impervious area that is in the combined service area for each jurisdiction.
Table 4-2: Percent of Impervious Area in Impaired Watersheds within MS4 Combined Service Area by Jurisdiction
Jurisdiction Upper Accotink Creek Lower Accotink Creek Long Branch
City of Fairfax 25.2% NA1 4.1%
Fairfax County 48.6% 66.2% 85.4%
Fort Belvoir NA1 7.5% NA1
Town of Vienna 6.7% NA1 NA1
Outside Combined MS4 Service Area 19.5% 26.3% 10.4%
Total 100.0% 100.0% 100.0%
1 NA: Not Applicable. No portion of jurisdiction is within impaired watershed.
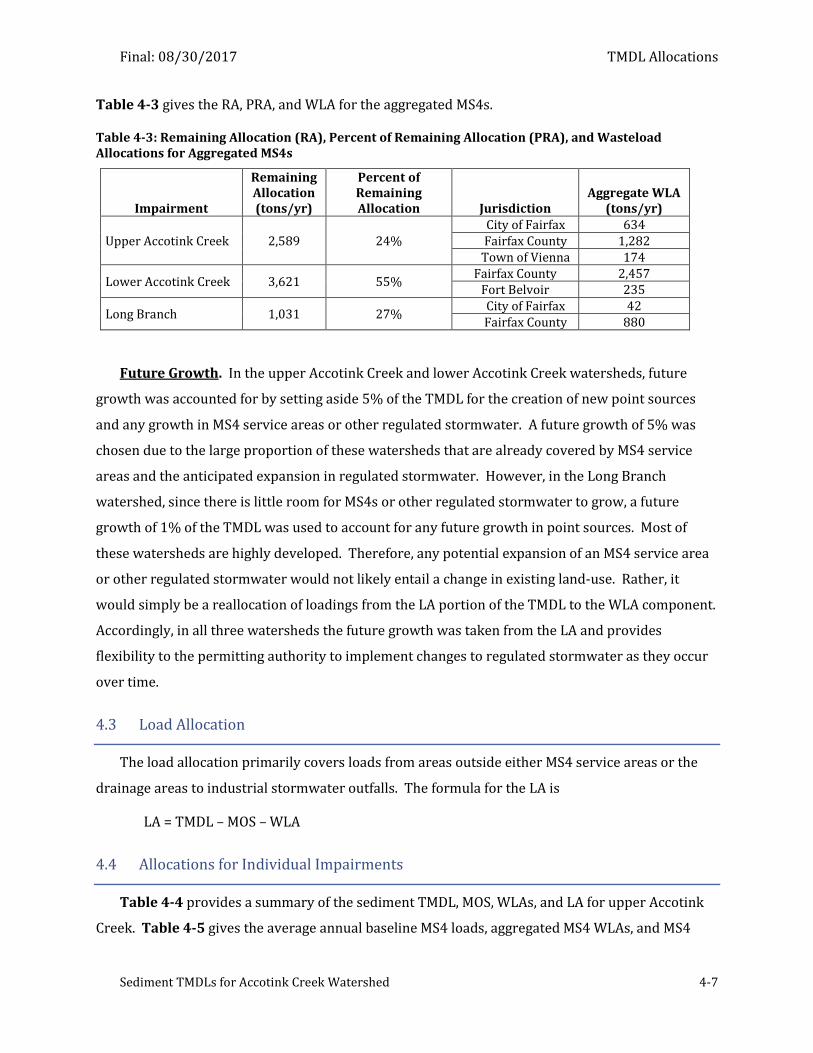
Final: 08/30/2017 TMDL Allocations
Sediment TMDLs for Accotink Creek Watershed 4-7
Table 4-3 gives the RA, PRA, and WLA for the aggregated MS4s.
Table 4-3: Remaining Allocation (RA), Percent of Remaining Allocation (PRA), and Wasteload Allocations for Aggregated MS4s
Impairment
Remaining Allocation (tons/yr)
Percent of Remaining Allocation Jurisdiction
Aggregate WLA (tons/yr)
Upper Accotink Creek 2,589 24% City of Fairfax 634 Fairfax County 1,282
Town of Vienna 174
Lower Accotink Creek 3,621 55% Fairfax County 2,457
Fort Belvoir 235
Long Branch 1,031 27% City of Fairfax 42 Fairfax County 880
Future Growth. In the upper Accotink Creek and lower Accotink Creek watersheds, future
growth was accounted for by setting aside 5% of the TMDL for the creation of new point sources
and any growth in MS4 service areas or other regulated stormwater. A future growth of 5% was
chosen due to the large proportion of these watersheds that are already covered by MS4 service
areas and the anticipated expansion in regulated stormwater. However, in the Long Branch
watershed, since there is little room for MS4s or other regulated stormwater to grow, a future
growth of 1% of the TMDL was used to account for any future growth in point sources. Most of
these watersheds are highly developed. Therefore, any potential expansion of an MS4 service area
or other regulated stormwater would not likely entail a change in existing land-use. Rather, it
would simply be a reallocation of loadings from the LA portion of the TMDL to the WLA component.
Accordingly, in all three watersheds the future growth was taken from the LA and provides
flexibility to the permitting authority to implement changes to regulated stormwater as they occur
over time.
4.3 Load Allocation
The load allocation primarily covers loads from areas outside either MS4 service areas or the
drainage areas to industrial stormwater outfalls. The formula for the LA is
LA = TMDL – MOS – WLA
4.4 Allocations for Individual Impairments
Table 4-4 provides a summary of the sediment TMDL, MOS, WLAs, and LA for upper Accotink
Creek. Table 4-5 gives the average annual baseline MS4 loads, aggregated MS4 WLAs, and MS4
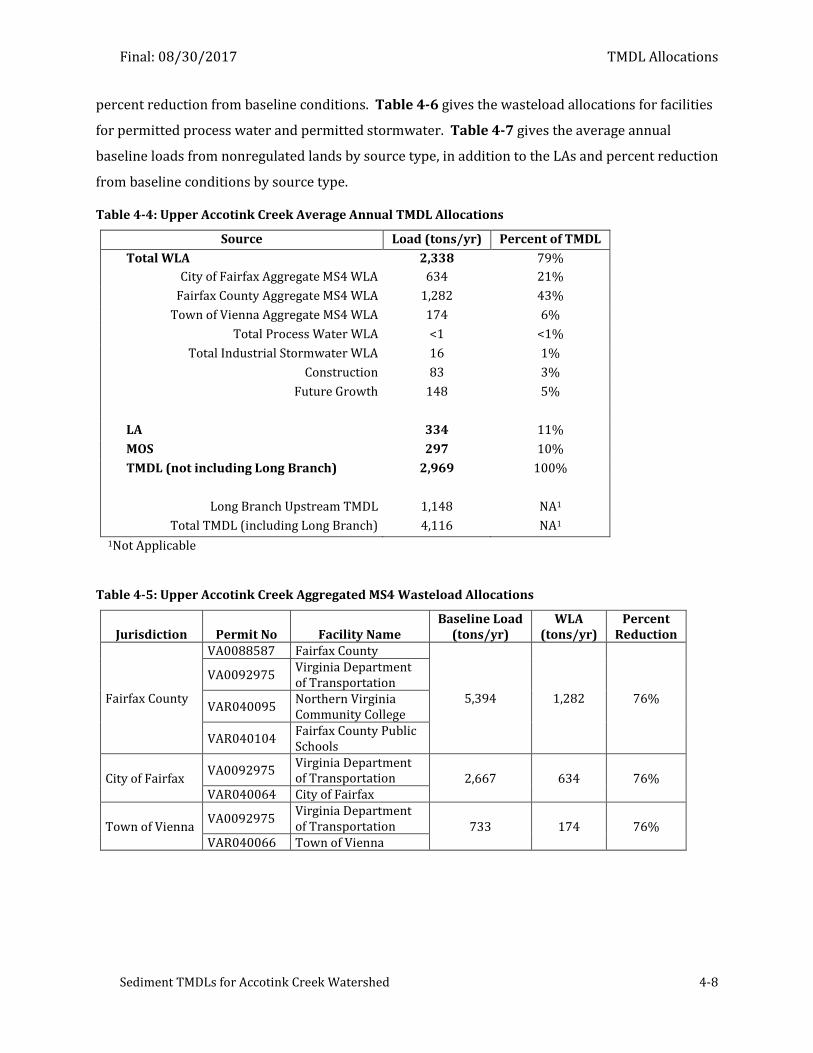
Final: 08/30/2017 TMDL Allocations
Sediment TMDLs for Accotink Creek Watershed 4-8
percent reduction from baseline conditions. Table 4-6 gives the wasteload allocations for facilities
for permitted process water and permitted stormwater. Table 4-7 gives the average annual
baseline loads from nonregulated lands by source type, in addition to the LAs and percent reduction
from baseline conditions by source type.
Table 4-4: Upper Accotink Creek Average Annual TMDL Allocations
Source Load (tons/yr) Percent of TMDL
Total WLA 2,338 79%
City of Fairfax Aggregate MS4 WLA 634 21%
Fairfax County Aggregate MS4 WLA 1,282 43%
Town of Vienna Aggregate MS4 WLA 174 6%
Total Process Water WLA <1 <1%
Total Industrial Stormwater WLA 16 1%
Construction 83 3%
Future Growth 148 5%
LA 334 11%
MOS 297 10%
TMDL (not including Long Branch) 2,969 100%
Long Branch Upstream TMDL 1,148 NA1
Total TMDL (including Long Branch) 4,116 NA1
1Not Applicable
Table 4-5: Upper Accotink Creek Aggregated MS4 Wasteload Allocations
Jurisdiction Permit No Facility Name Baseline Load
(tons/yr) WLA
(tons/yr) Percent
Reduction
Fairfax County
VA0088587 Fairfax County
5,394 1,282 76%
VA0092975 Virginia Department of Transportation
VAR040095 Northern Virginia Community College
VAR040104 Fairfax County Public Schools
City of Fairfax VA0092975
Virginia Department of Transportation 2,667 634 76%
VAR040064 City of Fairfax
Town of Vienna VA0092975
Virginia Department of Transportation 733 174 76%
VAR040066 Town of Vienna
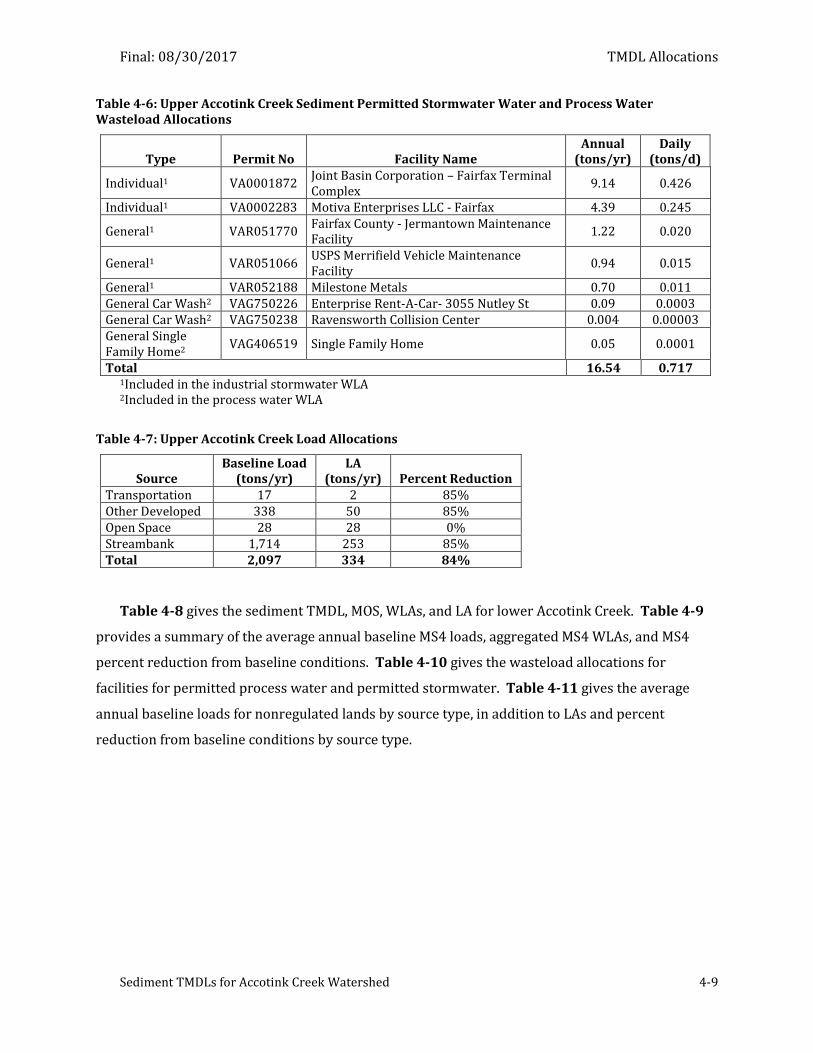
Final: 08/30/2017 TMDL Allocations
Sediment TMDLs for Accotink Creek Watershed 4-9
Table 4-6: Upper Accotink Creek Sediment Permitted Stormwater Water and Process Water Wasteload Allocations
Type Permit No Facility Name Annual
(tons/yr) Daily
(tons/d)
Individual1 VA0001872 Joint Basin Corporation – Fairfax Terminal Complex
9.14 0.426
Individual1 VA0002283 Motiva Enterprises LLC - Fairfax 4.39 0.245
General1 VAR051770 Fairfax County - Jermantown Maintenance Facility
1.22 0.020
General1 VAR051066 USPS Merrifield Vehicle Maintenance Facility
0.94 0.015
General1 VAR052188 Milestone Metals 0.70 0.011 General Car Wash2 VAG750226 Enterprise Rent-A-Car- 3055 Nutley St 0.09 0.0003 General Car Wash2 VAG750238 Ravensworth Collision Center 0.004 0.00003 General Single Family Home2
VAG406519 Single Family Home 0.05 0.0001
Total 16.54 0.717 1Included in the industrial stormwater WLA 2Included in the process water WLA
Table 4-7: Upper Accotink Creek Load Allocations
Source Baseline Load
(tons/yr) LA
(tons/yr) Percent Reduction Transportation 17 2 85% Other Developed 338 50 85% Open Space 28 28 0% Streambank 1,714 253 85% Total 2,097 334 84%
Table 4-8 gives the sediment TMDL, MOS, WLAs, and LA for lower Accotink Creek. Table 4-9
provides a summary of the average annual baseline MS4 loads, aggregated MS4 WLAs, and MS4
percent reduction from baseline conditions. Table 4-10 gives the wasteload allocations for
facilities for permitted process water and permitted stormwater. Table 4-11 gives the average
annual baseline loads for nonregulated lands by source type, in addition to LAs and percent
reduction from baseline conditions by source type.
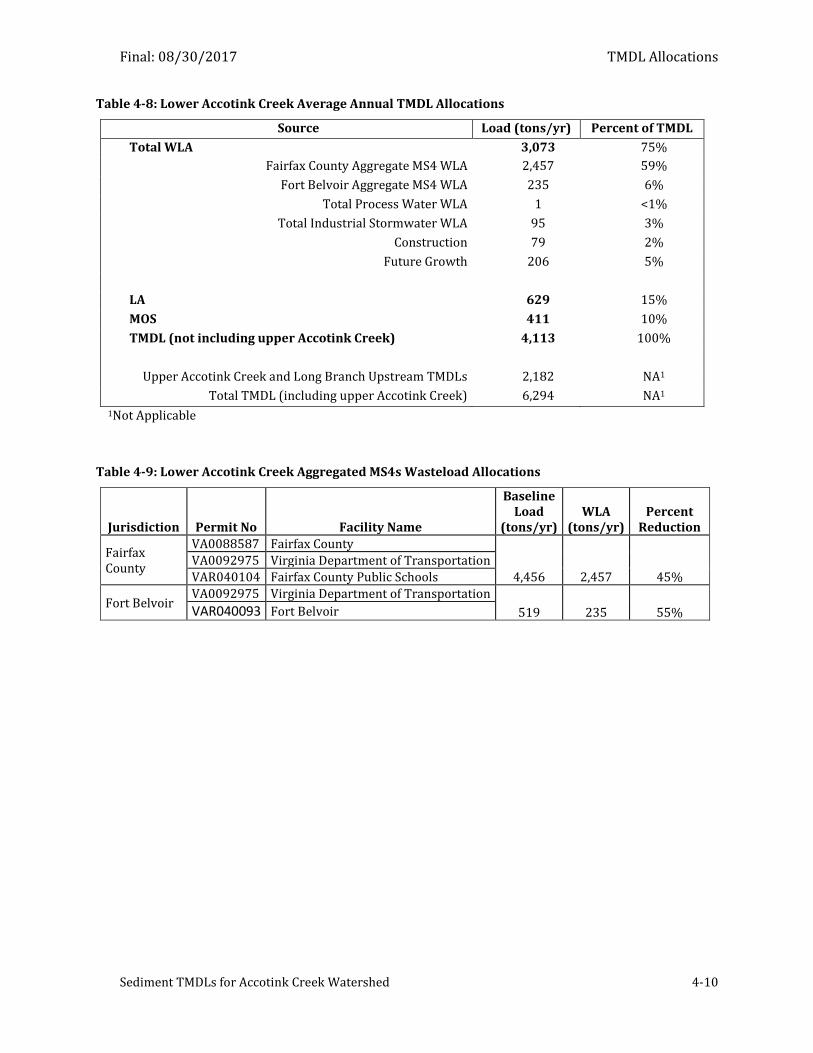
Final: 08/30/2017 TMDL Allocations
Sediment TMDLs for Accotink Creek Watershed 4-10
Table 4-8: Lower Accotink Creek Average Annual TMDL Allocations
Source Load (tons/yr)
( (tons/yr)
Percent of TMDL
Total WLA 3,073 75%
Fairfax County Aggregate MS4 WLA 2,457 59%
Fort Belvoir Aggregate MS4 WLA 235 6%
Total Process Water WLA 1 <1%
Total Industrial Stormwater WLA 95 3%
Construction 79 2%
Future Growth 206 5%
LA 629 15%
MOS 411 10%
TMDL (not including upper Accotink Creek) 4,113 100%
Upper Accotink Creek and Long Branch Upstream TMDLs 2,182 NA1
Total TMDL (including upper Accotink Creek) 6,294 NA1 1Not Applicable
Table 4-9: Lower Accotink Creek Aggregated MS4s Wasteload Allocations
Jurisdiction Permit No Facility Name
Baseline Load
(tons/yr) WLA
(tons/yr) Percent
Reduction
Fairfax County
VA0088587 Fairfax County
4,456 2,457 45%
VA0092975 Virginia Department of Transportation
VAR040104 Fairfax County Public Schools
Fort Belvoir VA0092975 Virginia Department of Transportation
519 235 55% VAR040093 Fort Belvoir
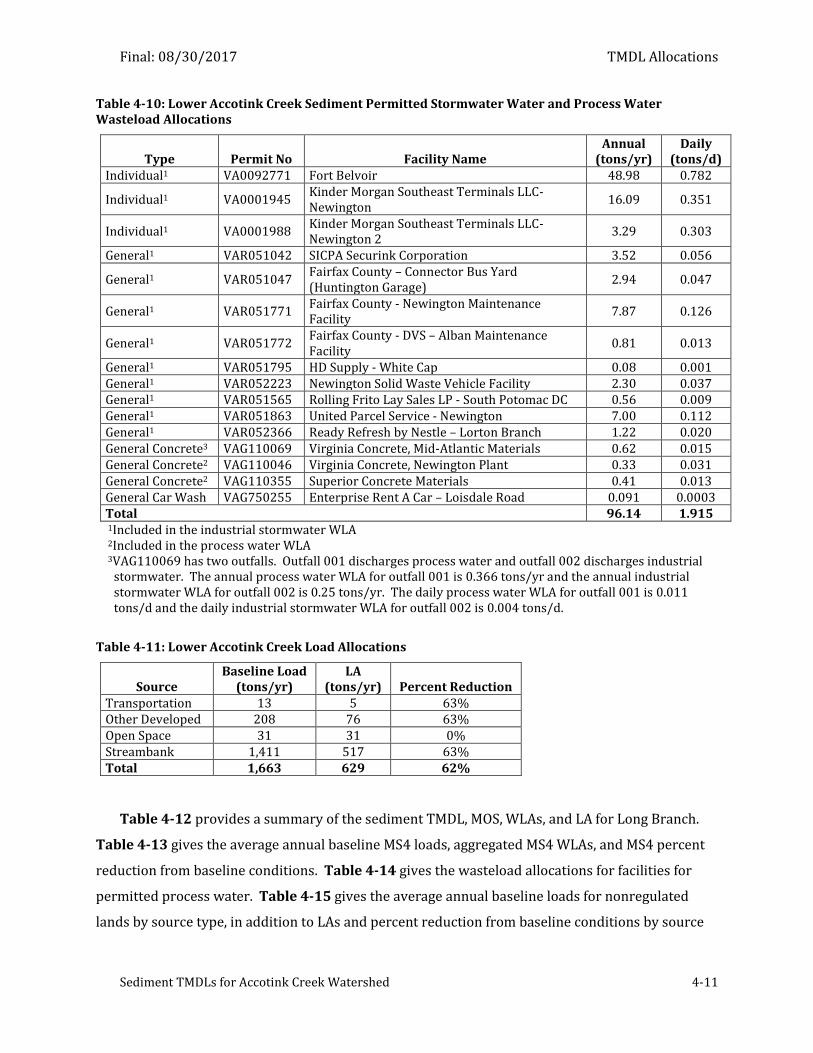
Final: 08/30/2017 TMDL Allocations
Sediment TMDLs for Accotink Creek Watershed 4-11
Table 4-10: Lower Accotink Creek Sediment Permitted Stormwater Water and Process Water Wasteload Allocations
Type Permit No Facility Name Annual
(tons/yr) Daily
(tons/d) Individual1 VA0092771 Fort Belvoir 48.98 0.782
Individual1 VA0001945 Kinder Morgan Southeast Terminals LLC-Newington
16.09 0.351
Individual1 VA0001988 Kinder Morgan Southeast Terminals LLC-Newington 2
3.29 0.303
General1 VAR051042 SICPA Securink Corporation 3.52 0.056
General1 VAR051047 Fairfax County – Connector Bus Yard (Huntington Garage)
2.94 0.047
General1 VAR051771 Fairfax County - Newington Maintenance Facility
7.87 0.126
General1 VAR051772 Fairfax County - DVS – Alban Maintenance Facility
0.81 0.013
General1 VAR051795 HD Supply - White Cap 0.08 0.001 General1 VAR052223 Newington Solid Waste Vehicle Facility 2.30 0.037 General1 VAR051565 Rolling Frito Lay Sales LP - South Potomac DC 0.56 0.009 General1 VAR051863 United Parcel Service - Newington 7.00 0.112 General1 VAR052366 Ready Refresh by Nestle – Lorton Branch 1.22 0.020 General Concrete3 VAG110069 Virginia Concrete, Mid-Atlantic Materials 0.62 0.015 General Concrete2 VAG110046 Virginia Concrete, Newington Plant 0.33 0.031 General Concrete2 VAG110355 Superior Concrete Materials 0.41 0.013 General Car Wash VAG750255 Enterprise Rent A Car – Loisdale Road 0.091 0.0003 Total 96.14 1.915 1Included in the industrial stormwater WLA 2Included in the process water WLA 3VAG110069 has two outfalls. Outfall 001 discharges process water and outfall 002 discharges industrial
stormwater. The annual process water WLA for outfall 001 is 0.366 tons/yr and the annual industrial stormwater WLA for outfall 002 is 0.25 tons/yr. The daily process water WLA for outfall 001 is 0.011 tons/d and the daily industrial stormwater WLA for outfall 002 is 0.004 tons/d.
Table 4-11: Lower Accotink Creek Load Allocations
Source Baseline Load
(tons/yr) LA
(tons/yr) Percent Reduction Transportation 13 5 63% Other Developed 208 76 63% Open Space 31 31 0% Streambank 1,411 517 63% Total 1,663 629 62%
Table 4-12 provides a summary of the sediment TMDL, MOS, WLAs, and LA for Long Branch.
Table 4-13 gives the average annual baseline MS4 loads, aggregated MS4 WLAs, and MS4 percent
reduction from baseline conditions. Table 4-14 gives the wasteload allocations for facilities for
permitted process water. Table 4-15 gives the average annual baseline loads for nonregulated
lands by source type, in addition to LAs and percent reduction from baseline conditions by source
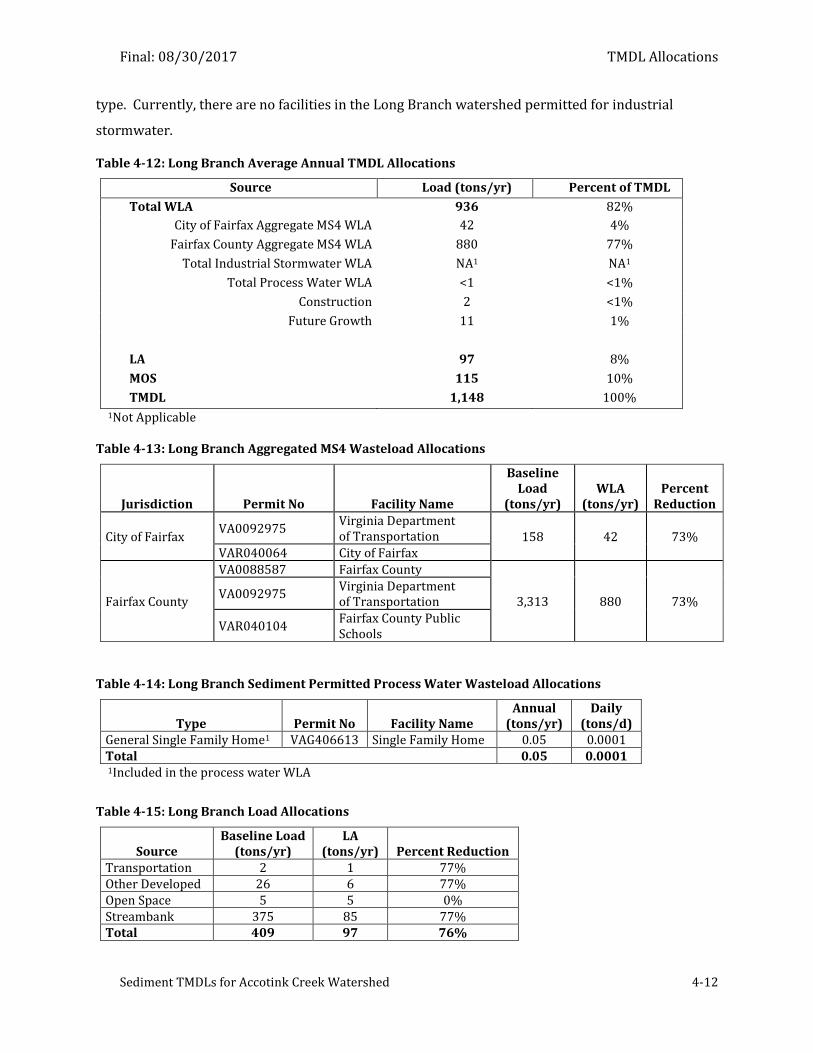
Final: 08/30/2017 TMDL Allocations
Sediment TMDLs for Accotink Creek Watershed 4-12
type. Currently, there are no facilities in the Long Branch watershed permitted for industrial
stormwater.
Table 4-12: Long Branch Average Annual TMDL Allocations
Source Load (tons/yr) Percent of TMDL
Total WLA 936 82%
City of Fairfax Aggregate MS4 WLA 42 4%
Fairfax County Aggregate MS4 WLA 880 77%
Total Industrial Stormwater WLA NA1 NA1
Total Process Water WLA <1 <1%
Construction 2 <1%
Future Growth 11 1%
LA 97 8%
MOS 115 10%
TMDL 1,148 100% 1Not Applicable
Table 4-13: Long Branch Aggregated MS4 Wasteload Allocations
Jurisdiction Permit No Facility Name
Baseline Load
(tons/yr) WLA
(tons/yr) Percent
Reduction
City of Fairfax VA0092975
Virginia Department of Transportation 158 42 73%
VAR040064 City of Fairfax
Fairfax County
VA0088587 Fairfax County
3,313 880 73% VA0092975
Virginia Department of Transportation
VAR040104 Fairfax County Public Schools
Table 4-14: Long Branch Sediment Permitted Process Water Wasteload Allocations
Type Permit No Facility Name Annual
(tons/yr) Daily
(tons/d) General Single Family Home1 VAG406613 Single Family Home 0.05 0.0001 Total 0.05 0.0001 1Included in the process water WLA
Table 4-15: Long Branch Load Allocations
Source Baseline Load
(tons/yr) LA
(tons/yr) Percent Reduction Transportation 2 1 77% Other Developed 26 6 77% Open Space 5 5 0% Streambank 375 85 77% Total 409 97 76%
Final: 08/30/2017 TMDL Allocations
Sediment TMDLs for Accotink Creek Watershed 4-13
4.5 Daily Load Expressions
The TMDLs and allocations were expressed on a daily basis. As described below, daily
expressions of the WLAs were given to permitted facilities based on permit type, according to the
following categories:
Individual Permit Process Water or Managed Discharges (Bulk Terminals)
Car Wash Process Water
Single Family Home Domestic Sewage
Concrete Product Process Water
Industrial Stormwater (under both Individual and General Permits); Concrete Stormwater; MS4s; and Land under Construction
Concrete Comingled Process Water and Stormwater
The LAs were also expressed on a daily basis using the method applied to MS4s and industrial
stormwater.
Individual Permit Process Water or Managed Discharges (Bulk Terminals). The process
water and managed discharges from bulk terminals with individual permits have a maximum
permitted concentration. The WLA for these facilities was expressed on a daily basis as the product
of the maximum permitted concentration and maximum flow reported in their DMRs during the
last five years.
Car Wash Process Water. Car wash facilities under a general permit have maximum
permitted concentrations. The daily WLA was calculated as the product of the maximum permitted
concentration and expected average flow. The expected average flow was set at 0.0001 MGD, 0.001
MGD, and 0.001 MGD for VAG750238, VAG750226, and VAG750255, respectively.
Domestic Sewage under a General Permit. The discharge from a Single Family Home under a
domestic sewage general permit has a maximum permitted concentration of 30 mg/l, and a
maximum permitted discharge of 1000 gallons (0.001 MGD). The daily WLA was calculated as the
product of the maximum permitted concentration and maximum permitted flow.
Concrete Product Process Water. Concrete facilities under a general permit have a maximum
permitted sediment concentration of 60 mg/l. The daily WLA for outfalls discharging process water
only was calculated as the product of the maximum permitted concentration and maximum flow
reported in their DMRs during the last five years.
Industrial Stormwater, Concrete Stormwater, MS4s, Land under Construction, and Load
Allocations. Hydrology is the primary source of the variation of daily loads in stormwater, runoff,
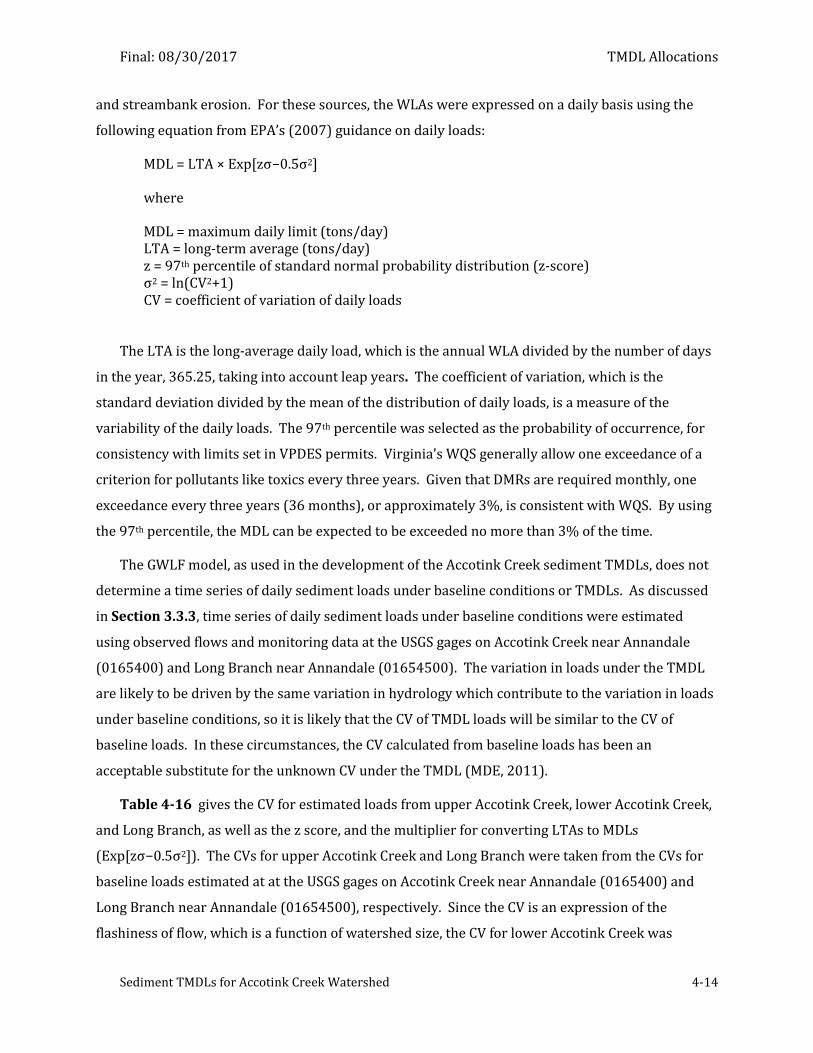
Final: 08/30/2017 TMDL Allocations
Sediment TMDLs for Accotink Creek Watershed 4-14
and streambank erosion. For these sources, the WLAs were expressed on a daily basis using the
following equation from EPA’s (2007) guidance on daily loads:
MDL = LTA × Exp[zσ−0.5σ2]
where
MDL = maximum daily limit (tons/day) LTA = long-term average (tons/day) z = 97th percentile of standard normal probability distribution (z-score) σ2 = ln(CV2+1) CV = coefficient of variation of daily loads
The LTA is the long-average daily load, which is the annual WLA divided by the number of days
in the year, 365.25, taking into account leap years. The coefficient of variation, which is the
standard deviation divided by the mean of the distribution of daily loads, is a measure of the
variability of the daily loads. The 97th percentile was selected as the probability of occurrence, for
consistency with limits set in VPDES permits. Virginia’s WQS generally allow one exceedance of a
criterion for pollutants like toxics every three years. Given that DMRs are required monthly, one
exceedance every three years (36 months), or approximately 3%, is consistent with WQS. By using
the 97th percentile, the MDL can be expected to be exceeded no more than 3% of the time.
The GWLF model, as used in the development of the Accotink Creek sediment TMDLs, does not
determine a time series of daily sediment loads under baseline conditions or TMDLs. As discussed
in Section 3.3.3, time series of daily sediment loads under baseline conditions were estimated
using observed flows and monitoring data at the USGS gages on Accotink Creek near Annandale
(0165400) and Long Branch near Annandale (01654500). The variation in loads under the TMDL
are likely to be driven by the same variation in hydrology which contribute to the variation in loads
under baseline conditions, so it is likely that the CV of TMDL loads will be similar to the CV of
baseline loads. In these circumstances, the CV calculated from baseline loads has been an
acceptable substitute for the unknown CV under the TMDL (MDE, 2011).
Table 4-16 gives the CV for estimated loads from upper Accotink Creek, lower Accotink Creek,
and Long Branch, as well as the z score, and the multiplier for converting LTAs to MDLs
(Exp[zσ−0.5σ2]). The CVs for upper Accotink Creek and Long Branch were taken from the CVs for
baseline loads estimated at at the USGS gages on Accotink Creek near Annandale (0165400) and
Long Branch near Annandale (01654500), respectively. Since the CV is an expression of the
flashiness of flow, which is a function of watershed size, the CV for lower Accotink Creek was
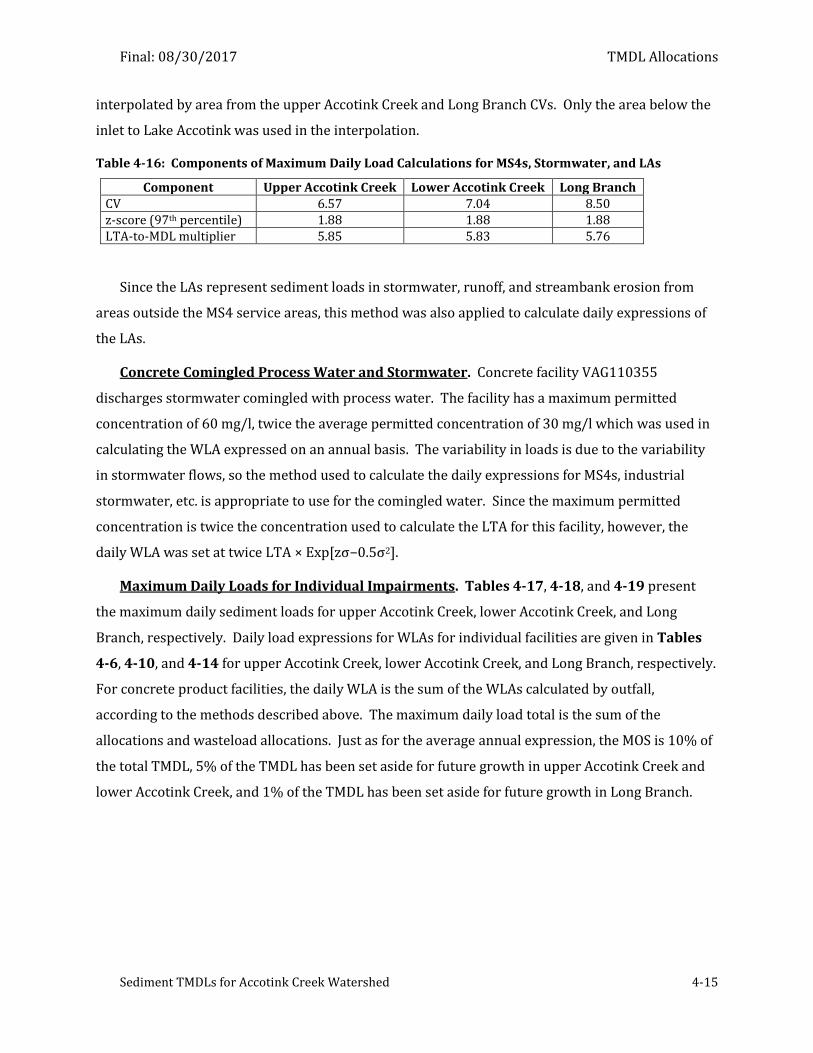
Final: 08/30/2017 TMDL Allocations
Sediment TMDLs for Accotink Creek Watershed 4-15
interpolated by area from the upper Accotink Creek and Long Branch CVs. Only the area below the
inlet to Lake Accotink was used in the interpolation.
Table 4-16: Components of Maximum Daily Load Calculations for MS4s, Stormwater, and LAs
Component Upper Accotink Creek Lower Accotink Creek Long Branch CV 6.57 7.04 8.50 z-score (97th percentile) 1.88 1.88 1.88 LTA-to-MDL multiplier 5.85 5.83 5.76
Since the LAs represent sediment loads in stormwater, runoff, and streambank erosion from
areas outside the MS4 service areas, this method was also applied to calculate daily expressions of
the LAs.
Concrete Comingled Process Water and Stormwater. Concrete facility VAG110355
discharges stormwater comingled with process water. The facility has a maximum permitted
concentration of 60 mg/l, twice the average permitted concentration of 30 mg/l which was used in
calculating the WLA expressed on an annual basis. The variability in loads is due to the variability
in stormwater flows, so the method used to calculate the daily expressions for MS4s, industrial
stormwater, etc. is appropriate to use for the comingled water. Since the maximum permitted
concentration is twice the concentration used to calculate the LTA for this facility, however, the
daily WLA was set at twice LTA × Exp[zσ−0.5σ2].
Maximum Daily Loads for Individual Impairments. Tables 4-17, 4-18, and 4-19 present
the maximum daily sediment loads for upper Accotink Creek, lower Accotink Creek, and Long
Branch, respectively. Daily load expressions for WLAs for individual facilities are given in Tables
4-6, 4-10, and 4-14 for upper Accotink Creek, lower Accotink Creek, and Long Branch, respectively.
For concrete product facilities, the daily WLA is the sum of the WLAs calculated by outfall,
according to the methods described above. The maximum daily load total is the sum of the
allocations and wasteload allocations. Just as for the average annual expression, the MOS is 10% of
the total TMDL, 5% of the TMDL has been set aside for future growth in upper Accotink Creek and
lower Accotink Creek, and 1% of the TMDL has been set aside for future growth in Long Branch.
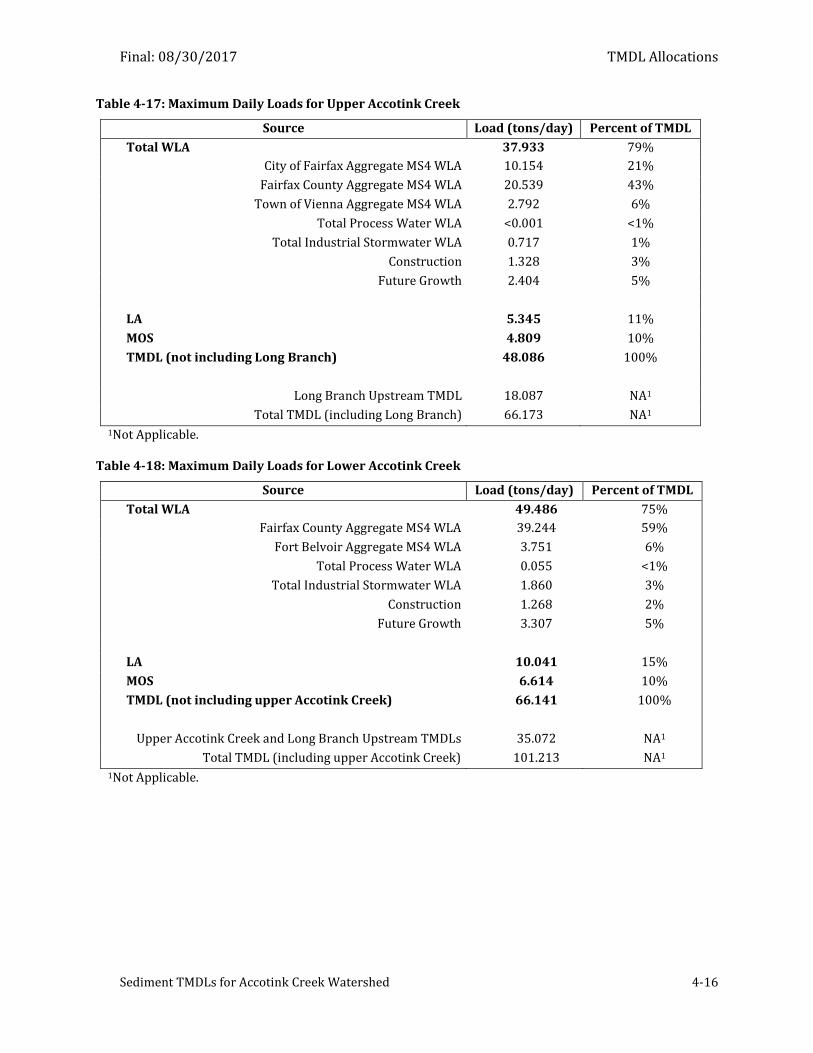
Final: 08/30/2017 TMDL Allocations
Sediment TMDLs for Accotink Creek Watershed 4-16
Table 4-17: Maximum Daily Loads for Upper Accotink Creek
Source Load (tons/day) Percent of TMDL
Total WLA 37.933 79%
City of Fairfax Aggregate MS4 WLA 10.154 21%
Fairfax County Aggregate MS4 WLA 20.539 43%
Town of Vienna Aggregate MS4 WLA 2.792 6%
Total Process Water WLA <0.001 <1%
Total Industrial Stormwater WLA 0.717 1%
Construction 1.328 3%
Future Growth 2.404 5%
LA 5.345 11%
MOS 4.809 10%
TMDL (not including Long Branch) 48.086 100%
Long Branch Upstream TMDL 18.087 NA1
Total TMDL (including Long Branch) 66.173 NA1 1Not Applicable.
Table 4-18: Maximum Daily Loads for Lower Accotink Creek
Source Load (tons/day)
( (tons/yr)
Percent of TMDL
Total WLA 49.486 75%
Fairfax County Aggregate MS4 WLA 39.244 59%
Fort Belvoir Aggregate MS4 WLA 3.751 6%
Total Process Water WLA 0.055 <1%
Total Industrial Stormwater WLA 1.860 3%
Construction 1.268 2%
Future Growth 3.307 5%
LA 10.041 15%
MOS 6.614 10%
TMDL (not including upper Accotink Creek) 66.141 100%
Upper Accotink Creek and Long Branch Upstream TMDLs 35.072 NA1
Total TMDL (including upper Accotink Creek) 101.213 NA1 1Not Applicable.
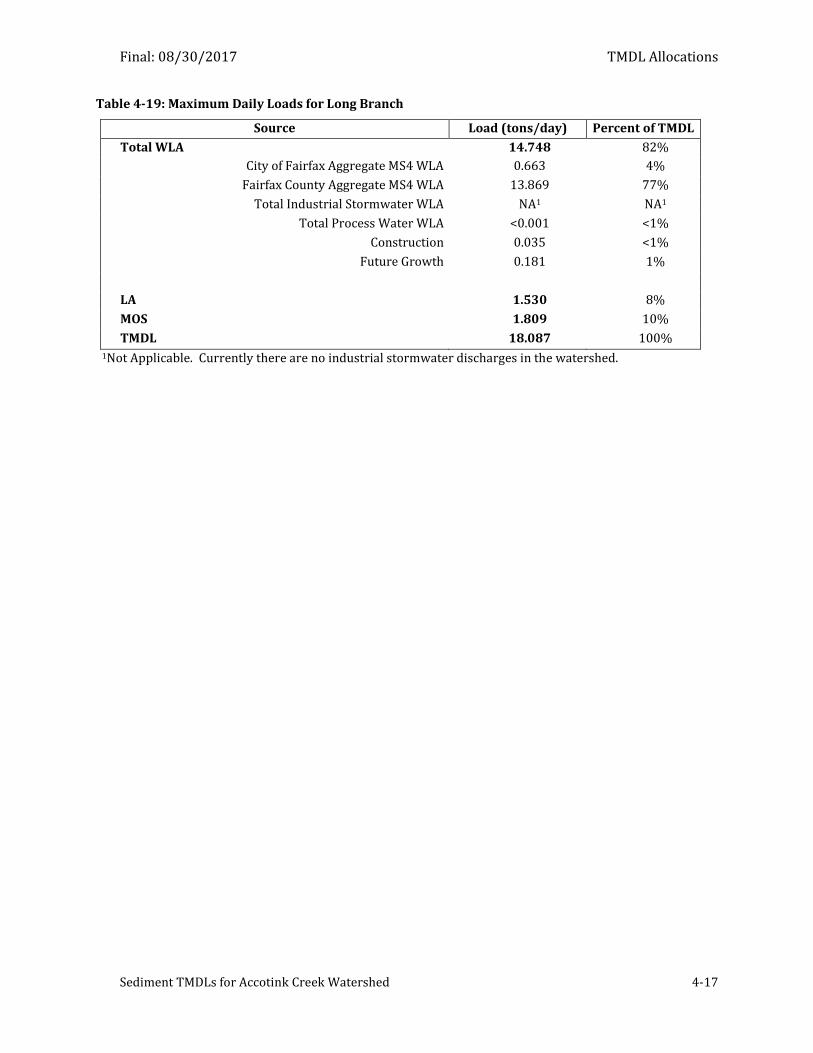
Final: 08/30/2017 TMDL Allocations
Sediment TMDLs for Accotink Creek Watershed 4-17
Table 4-19: Maximum Daily Loads for Long Branch
Source Load (tons/day) Percent of TMDL
Total WLA 14.748 82%
City of Fairfax Aggregate MS4 WLA 0.663 4%
Fairfax County Aggregate MS4 WLA 13.869 77%
Total Industrial Stormwater WLA NA1 NA1
Total Process Water WLA <0.001 <1%
Construction 0.035 <1%
Future Growth 0.181 1%
LA 1.530 8%
MOS 1.809 10%
TMDL 18.087 100% 1Not Applicable. Currently there are no industrial stormwater discharges in the watershed.
Final: 08/30/2017
Sediment TMDLs for Accotink Creek Watershed 5-1
5 TMDL Implementation
Once a TMDL has been approved by EPA, measures must be taken to reduce pollution levels
from both point and non-point sources. The following sections outline the framework used in
Virginia to provide reasonable assurance that the required pollutant reductions can be achieved.
5.1 Continuing Planning Process and Water Quality Management Planning
As part of the Continuing Planning Process, DEQ staff will present both EPA-approved TMDLs
and TMDL implementation plans to the State Water Control Board (SWCB) for inclusion in the
appropriate Water Quality Management Plan (WQMP), in accordance with the Clean Water Act’s
Section 303(e) and Virginia’s Public Participation Guidelines for Water Quality Management
Planning.
DEQ staff will also request that the SWCB adopt TMDL WLAs as part of the Water Quality
Management Planning Regulation (9 VAC 25-720). This regulatory action is in accordance with
§2.2-4006A.14 and §2.2-4006B of the Code of Virginia. SWCB actions relating to water quality
management planning are described in the public participation guidelines referenced above and
can be found on DEQ’s web site under
http://deq.state.va.us/Portals/0/DEQ/Water/TMDL/FeaturedTopics/WQMP_PPP_Final.pdf.
5.2 Staged Implementation
In general, Virginia intends for the required control actions, including Best Management
Practices (BMPs), to be implemented in an iterative process that first addresses those sources with
the largest impact on water quality. The iterative implementation of pollution control actions in the
watershed has several benefits:
1. Enables tracking of water quality improvements following implementation through
follow-up stream monitoring.
2. Provides a measure of quality control, given the uncertainties inherent in TMDL
development.
3. Provides a mechanism for developing public support through periodic updates on
implementation levels and water quality improvements.
4. Helps ensure that the most cost effective practices are implemented first.
Final: 08/30/2017 TMDL Implementation
Sediment TMDLs for Accotink Creek Watershed 5-2
5. Allows for the evaluation of the adequacy of the TMDL in achieving water quality
standards.
Many of the BMPs that address sediment also address the two non-pollutant stressors,
hydromodification and habitat modification. Proposed measures to reduce sediment that also
address the non-pollutant stressors should be considered priority BMPs for implementing this
TMDL. Furthermore, with streambank erosion being the predominant source of sediment in all of
the impaired watersheds, BMPs that work to stabilize the streambanks are also recommended
priority BMPs.
5.3 Implementation of Wasteload Allocations
Federal regulations require that all new or revised National Pollutant Discharge Elimination
System (NPDES) permits must be consistent with the assumptions and requirements of any
applicable TMDL WLA (40 CFR §122.44 (d)(1)(vii)(B)). All such permits should be submitted to
EPA for review.
For the implementation of the WLA component of the TMDL, DEQ utilizes the Virginia Pollutant
Discharge Elimination System (VPDES) program and the Virginia Stormwater Management
Program (VSMP). Requirements of the permit process should not be duplicated in the TMDL
process; depending on the type and nature of a point source discharge. The WLA implementation
process may be informed through the development of a TMDL implementation plan, or it may be
addressed solely through the discharge permit. However, it is recognized that implementation plan
development may help to coordinate the efforts of permitted stormwater sources through the
collaborative process involved in development of the plan.
5.3.1 Wastewater Treatment Plants and Process Water from Industrial Facilities
There are no municipal wastewater treatment plants in the Accotink Creek watershed. There
are two small single family home discharge governed under the general permit for small domestic
discharges less than or equal to 1,000 gallons per day. Process water dischargers in the watershed
that discharge the POC include concrete plants and carwashes. Process water discharged from
concrete plants, car washes, or other activities regulated by general permits are required to meet
the sediment concentration limits at the point of discharge as stipulated in the VPDES permit. The
discharge concentration limits serve as an effective surrogate to demonstrate that permittees are
meeting established sediment wasteload allocations. Direct measurement and evaluation of
Final: 08/30/2017 TMDL Implementation
Sediment TMDLs for Accotink Creek Watershed 5-3
concentration end-points, whether established as effluent limits are benchmark concentrations, is
the expected method for demonstrating permitted discharges are consistent with the assumptions
and requirements of this TMDL.
5.3.2 Stormwater
DEQ authorizes the discharges of stormwater associated with industrial activities, construction
sites, and MS4s through the issuance of VPDES permits. Authorization for the issuance of VPDES
permits to address stormwater discharges from construction sites and MS4s is included in the
VSMP Regulation. While the authorization to issue VPDES permits is housed in two different
regulations, permits allowing the discharge of industrial stormwater, construction stormwater, and
municipal stormwater all implement the requirements of the federal NPDES program. All new or
revised permits must be consistent with the assumptions and requirements of any applicable TMDL
WLA.
Municipal Separate Storm Sewer Systems – MS4s. For MS4 individual and general permits,
DEQ expects the permittee to address the TMDL wasteload allocations for stormwater through the
iterative implementation of BMPs to the maximum extent practicable. Permittee implementation of
an individual control strategy includes determining BMP effectiveness. If BMPs are determined to
not be effective, then the permit could require the MS4 to expand or better tailor its stormwater
management program to achieve the TMDL wasteload allocation.
There is not a precise regulatory definition of maximum extent practicable. MS4s have the
flexibility to optimize reductions in stormwater pollutants by implementing BMPs and other
requirements of the MS4 permit in an iterative process. Successive permits continually adapt to
current conditions, BMP effectiveness and technology, on a location-by-location basis, taking into
consideration such factors as condition of receiving waters, specific local concerns, a
comprehensive watershed plan, MS4 size, current ability to finance the program, beneficial uses of
receiving water, hydrology, geology, and capacity to perform operation and maintenance.
Permittees will be strongly encouraged to participate in the development of TMDL implementation
plans since recommendations from stakeholder input may provide a basis for modifications to the
stormwater management plan in order to meet the TMDL.
For MS4 individual and general permits, the DEQ plans to specifically address the TMDL WLAs
for stormwater through the iterative implementation of BMPs to the maximum extent practicable.
Final: 08/30/2017 TMDL Implementation
Sediment TMDLs for Accotink Creek Watershed 5-4
Industrial Stormwater. As noted, industrial stormwater discharges are regulated under the
VPDES program. These discharges are derived from precipitation, as opposed to process
wastewaters. In the Accotink Creek watershed there are both individual VPDES permits for
industrial stormwater discharges, such as Fort Belvoir, as well as general permits for industrial
stormwater discharges. The individual permits are regulated based on 9VAC25-31-120, whereas
the general permits are regulated under 9VAC25-151 et al. Discharge concentration limits and/or
benchmark endpoints serve as an effective surrogate to demonstrate that permittees are meeting
established sediment wasteload allocations. Direct measurement and evaluation of sediment
concentration end-points, whether established as effluent limits are benchmark concentrations, is
the expected method for demonstrating permitted discharges are consistent with the assumptions
and requirements of this TMDL.
5.3.3 Insignificant Dischargers
Wasteload allocations are assigned to permittees considered to be significant dischargers of the
pollutant of concern (POC). Significant discharges of the POC have reasonable potential to cause or
contribute to the instream impairment. Conversely, incidental or insignificant discharges of the
POC may occur but not at levels considered to cause or contribute to the impairment, therefore not
necessitating the establishment of wasteload allocations for these dischargers. For example, there
may be a small sediment load coming from the AT&T Oakton Office Park cooling water facility.
However, discharges of this sediment from these sources are considered to be negligible and are
therefore not included in the TMDL WLAs.
5.3.4 TMDL Modifications for New or Expanding Dischargers
Permits issued for facilities with WLAs developed as part of a TMDL must be consistent with the
assumptions and requirements of these WLAs, per EPA regulations. In cases where a new permit or
proposed permit modification occurs in a TMDL watershed and is therefore affected by a TMDL
WLA, permit and TMDL staff will coordinate to ensure that new or expanding discharges meet this
requirement. In 2014, DEQ issued Guidance Memorandum No. 14-2015 describing the available
options and the process that should be followed under those circumstances, including public
participation, EPA approval, State Water Control Board actions, and coordination between permit
and TMDL staff. The guidance memorandum is available on DEQ’s web site at
http://www.deq.virginia.gov/Programs/Water/Laws,Regulations,Guidance/Guidance/TMDLGuida
nce.aspx.
Final: 08/30/2017 TMDL Implementation
Sediment TMDLs for Accotink Creek Watershed 5-5
5.4 Implementation of Load Allocations
The TMDL program does not impart new implementation authorities. Therefore, DEQ intends
to use existing programs to the fullest extent in order to attain its water quality goals. The
measures for unregulated, nonpoint source reductions are implemented in an iterative process that
is described along with specific BMPs in a TMDL implementation plan. In the highly developed,
urbanized Accotink Creek watershed, the nature of the unregulated, nonpoint source discharges is
very similar to that of the regulated, point source discharges. Namely, it is stormwater generated
from highly developed land-uses with a high percentage of impervious surfaces. Pollutants
entering surface waters not conveyed through an MS4-owned system are generally non-regulated,
nonpoint source loadings. It is very similar in nature to that of the MS4 discharges. Accordingly,
the management measures and structural controls that may be used to control the regulated
stormwater would also apply to the non-regulated NPS discharges. It should be noted that the
design and operational requirements of the VSMP program, as applicable, to development and re-
development projects in the Accotink Creek watershed will also serve to mitigate sediment loadings
as well as stormwater energy over time. The VSMP requirements are implemented by the local
authority to all applicable projects, regardless of whether they are located in regulated or non-
regulated areas. Furthermore, many of the BMPs that address sediment also address the two non-
pollutant stressors hydromodification and habitat modification. Measures to reduce sediment that
also address the non-pollutant stressors should be considered priority BMPs for implementing this
TMDL.
5.4.1 Implementation Plan Development
A TMDL implementation plan must address, at a minimum, the requirements specified in the
Code of Virginia, Section 62.1-44.19.7. State law directs the State Water Control Board to “develop
and implement a plan to achieve fully supporting status for impaired waters.” The implementation
plan “shall include the date of expected achievement of water quality objectives, measurable goals,
corrective actions necessary and the associated costs, benefits and environmental impacts of
addressing the impairments.” EPA outlines the minimum elements of an approvable
implementation plan in its 1999 “Guidance for Water Quality-Based Decisions: The TMDL Process.”
The listed elements include implementation actions/management measures, timelines, legal or
regulatory controls, time required to attain water quality standards, monitoring plans, and
milestones for attaining water quality standards.
Final: 08/30/2017 TMDL Implementation
Sediment TMDLs for Accotink Creek Watershed 5-6
In order to qualify for other funding sources, such as EPA’s Section 319 grants, additional plan
requirements may need to be met. The detailed process for developing an implementation plan has
been described in the “TMDL Implementation Plan Guidance Manual,” that is available at
http://www.deq.virginia.gov/Portals/0/DEQ/Water/TMDL/ImplementationPlans/ipguide.pdf.
Watershed stakeholders will have opportunities to provide input and to participate in the
development of the TMDL implementation plan. Regional and local offices of DEQ, DCR, and other
cooperating agencies are technical resources that can assist in this endeavor.
With successful completion of implementation plans, local stakeholders will have a blueprint to
restore impaired waters and enhance the value of their land and water resources. Additionally,
development of an approved implementation plan may enhance opportunities for obtaining
financial and technical assistance during implementation.
5.4.2 Staged Implementation Scenarios
The purpose of the staged implementation scenarios is to identify one or more combinations of
implementation actions that will result in the reduction of controllable sources to the maximum
extent practicable using cost-effective, reasonable BMPs for nonpoint source control. The types of
BMPs that may be considered to address unregulated, nonpoint source loads are stream
restoration, stream bank stabilization, and other BMPs that work to capture stormwater and
promote infiltration of that stormwater.
DEQ expects that implementation of the sediment TMDLs will occur in stages, and that full
implementation of the TMDLs is a long-term goal. Specific goals for phased implementation will be
determined as part of implementation plan development.
Actions identified during TMDL implementation plan development that go beyond what can be
considered cost-effective and reasonable will only be included as implementation actions if there
are reasonable grounds for assuming that these actions will in fact be implemented.
5.4.3 Link to Ongoing Restoration Efforts
Implementation of this TMDL will contribute to on-going water quality improvement efforts
aimed at restoring water quality in the Accotink Creek watershed, the Potomac River, and the
Chesapeake Bay. Links to on-going restoration efforts are described in more detail below.
Final: 08/30/2017 TMDL Implementation
Sediment TMDLs for Accotink Creek Watershed 5-7
Chesapeake Bay Program Action Plans. Under their MS4 permits, Fairfax County, the City of
Fairfax, and the Town of Vienna are required to develop Action Plans to address attaining
reductions in Pollutants of Concern (POCs) under the Chesapeake Bay TMDLs. Sediment is among
the POCs in the Bay TMDLs.
Stormwater Management Ordinances. Fairfax County, the City of Fairfax, and the Town of
Vienna have adopted Stormwater Management Ordinances, becoming local Virginia Stormwater
Management Program (VSMP) authorities in 2014. These ordinances require Stormwater BMPs for
all new development or redevelopment.
Accotink Creek Watershed Plan. The Fairfax County Board of Supervisors approved a
Watershed Plan for Accotink Creek on February 8, 2011. The plan will help identify strategies to
control stormwater runoff and its associated pollutant loads. The plan identifies a list of structural
projects and non-structural actions that could be implemented in the next 10 to 25 years
(FCDPWES, 2011). Types of structural projects include
Stormwater management ponds or pond retrofits
Stream restoration
Drainage improvements
Culvert retrofits
Low-impact development (LID) or LID retrofits
Outfall improvements
Buffer restoration, rain barrels, disconnecting impervious areas, and street sweeping are among
the non-structural actions included in the plan. The Watershed Plan lists 120 high priority projects
included in a ten-year planning horizon and 109 lower priority projects included in a 25-year
planning horizon. Implementation of the plan is contingent on available funding.
Implementation of the plan will help not only meet the sediment load reductions set forth in
this TMDL but also help meet the overall biological goals of this TMDL and water quality standards.
Many of the structural projects and non-structural actions will help address adverse impacts of two
other most probable stressors of the aquatic community in Accotink Creek: habitat modification
and hydromodification.
Final: 08/30/2017 TMDL Implementation
Sediment TMDLs for Accotink Creek Watershed 5-8
5.4.4 Implementation Funding Sources
The implementation of pollutant reductions from non-regulated nonpoint sources relies heavily
on incentive-based programs, while the funding sources for regulated discharges can be varied
depending on the type of discharge. Therefore, the identification of funding sources for non-
regulated implementation activities is a key to success. Cooperating agencies, organizations, and
stakeholders must identify potential funding sources available for implementation during the
development of the implementation plan in accordance with the “Virginia Guidance Manual for
Total Maximum Daily Load Implementation Plans.” The TMDL Implementation Plan Guidance
Manual contains information on a variety of funding sources and government agencies that might
support implementation efforts, as well as suggestions for integrating TMDL implementation with
other watershed planning efforts.
Some of the major potential sources of funding for non-regulated implementation actions
include EPA Section 319 funds, Stormwater Local Assistance Fund (SLAF), Virginia State Revolving
Loan Program (also available for permitted activities), Virginia Water Quality Improvement Fund
(WQIF) (available for both point and nonpoint source pollution), tax credits and landowner
contributions. Information on WQIF projects and allocations can be found at
http://www.deq.virginia.gov/Programs/Water/CleanWaterFinancingAssistance/WaterQualityImp
rovementFund.aspx.
5.5 Follow-Up Monitoring
Following the development of the TMDL, DEQ will continue to monitor the impaired streams in
accordance with its ambient monitoring program. To demonstrate that the watershed is meeting
water quality standards in watersheds where corrective actions have taken place, DEQ must meet
the minimum data requirements from the original listing station or a station representative of the
originally listed segment. The minimum data requirement for biological monitoring is two
consecutive samples (one in the spring and one in the fall) in a one year period. Since there may be
a lag time of one-to-several years before any improvements in the benthic community will be
evident, follow-up biological monitoring may not have to occur in the year immediately following
the implementation of the control measures. The purpose, location, parameters, frequency, and
duration of the monitoring will be determined by DEQ staff, in cooperation with local stakeholders.
The details of the follow-up monitoring will be outlined in the Annual Water Monitoring Plan
prepared by each DEQ Regional Office. Other agency personnel, watershed stakeholders, etc. may
Final: 08/30/2017 TMDL Implementation
Sediment TMDLs for Accotink Creek Watershed 5-9
provide input on the Annual Water Monitoring Plan. These recommendations must be made to the
DEQ regional TMDL coordinator by September 30 of each year. Figure 5-1 shows the location of
the water quality monitoring stations in the upper Accotink Creek, lower Accotink Creek, and Long
Branch watersheds, and Table 5-1 provides a description of the station locations.
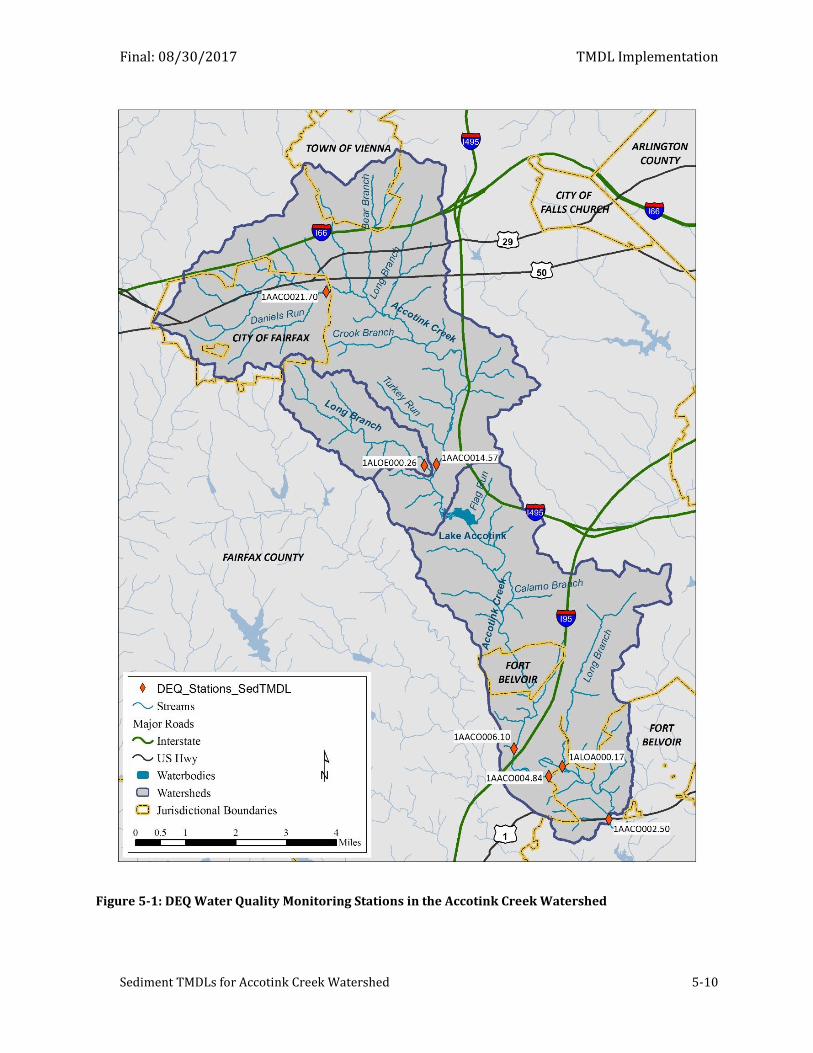
Final: 08/30/2017 TMDL Implementation
Sediment TMDLs for Accotink Creek Watershed 5-10
Figure 5-1: DEQ Water Quality Monitoring Stations in the Accotink Creek Watershed
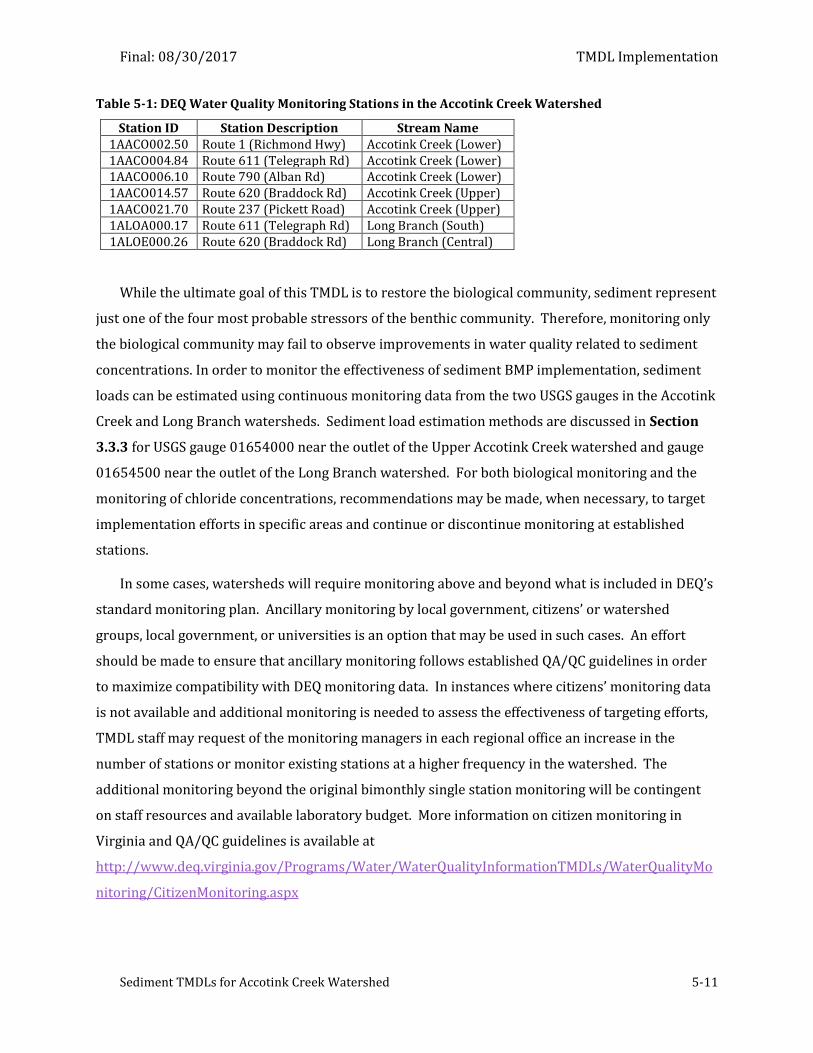
Final: 08/30/2017 TMDL Implementation
Sediment TMDLs for Accotink Creek Watershed 5-11
Table 5-1: DEQ Water Quality Monitoring Stations in the Accotink Creek Watershed
Station ID Station Description Stream Name 1AACO002.50 Route 1 (Richmond Hwy) Accotink Creek (Lower) 1AACO004.84 Route 611 (Telegraph Rd) Accotink Creek (Lower) 1AACO006.10 Route 790 (Alban Rd) Accotink Creek (Lower) 1AACO014.57 Route 620 (Braddock Rd) Accotink Creek (Upper) 1AACO021.70 Route 237 (Pickett Road) Accotink Creek (Upper) 1ALOA000.17 Route 611 (Telegraph Rd) Long Branch (South) 1ALOE000.26 Route 620 (Braddock Rd) Long Branch (Central)
While the ultimate goal of this TMDL is to restore the biological community, sediment represent
just one of the four most probable stressors of the benthic community. Therefore, monitoring only
the biological community may fail to observe improvements in water quality related to sediment
concentrations. In order to monitor the effectiveness of sediment BMP implementation, sediment
loads can be estimated using continuous monitoring data from the two USGS gauges in the Accotink
Creek and Long Branch watersheds. Sediment load estimation methods are discussed in Section
3.3.3 for USGS gauge 01654000 near the outlet of the Upper Accotink Creek watershed and gauge
01654500 near the outlet of the Long Branch watershed. For both biological monitoring and the
monitoring of chloride concentrations, recommendations may be made, when necessary, to target
implementation efforts in specific areas and continue or discontinue monitoring at established
stations.
In some cases, watersheds will require monitoring above and beyond what is included in DEQ’s
standard monitoring plan. Ancillary monitoring by local government, citizens’ or watershed
groups, local government, or universities is an option that may be used in such cases. An effort
should be made to ensure that ancillary monitoring follows established QA/QC guidelines in order
to maximize compatibility with DEQ monitoring data. In instances where citizens’ monitoring data
is not available and additional monitoring is needed to assess the effectiveness of targeting efforts,
TMDL staff may request of the monitoring managers in each regional office an increase in the
number of stations or monitor existing stations at a higher frequency in the watershed. The
additional monitoring beyond the original bimonthly single station monitoring will be contingent
on staff resources and available laboratory budget. More information on citizen monitoring in
Virginia and QA/QC guidelines is available at
http://www.deq.virginia.gov/Programs/Water/WaterQualityInformationTMDLs/WaterQualityMo
nitoring/CitizenMonitoring.aspx
Final: 08/30/2017 TMDL Implementation
Sediment TMDLs for Accotink Creek Watershed 5-12
5.6 Attainability of Designated Uses
The goal of a TMDL is to restore impaired waters so that water quality standards are attained.
Water quality standards consist of statements that describe water quality requirements and include
three components: (1) designated uses, (2) water quality criteria to protect designated uses, and
(3) an antidegredation policy. In the case of these sediment TMDLs, pollutant load reductions were
developed for one of the four most probable stressors impairing the aquatic life use. Implementing
cost-effective and reasonable best management practices to reduce sediment loads to the maximum
extent practicable are expected to ultimately attain the TMDLs for sediment. However, in some
streams for which TMDLs have been developed, factors may prevent the stream from attaining its
designated use. In order for a stream to be assigned a new designated use, a subcategory of a use,
or a tiered use, the current designated use must be removed. To remove a designated use, the state
must demonstrate that the use is not an existing use, and that downstream uses are protected. Such
uses will be attained by implementing effluent limits required under §301b and §306 of Clean
Water Act and by implementing cost-effective and reasonable best management practices for
nonpoint source control (9 VAC 25-260-10 paragraph I).
The state must also demonstrate that attaining the designated use is not feasible because of one
or more of the following reasons:
1. Naturally occurring pollutant concentration prevents the attainment of the use.
2. Natural, ephemeral, intermittent, or low flow conditions prevent the attainment of the
use unless these conditions may be compensated for by the discharge of sufficient
volume of pollutant discharges without violating state water conservation.
3. Human-caused conditions or sources of pollution prevent the attainment of the use and
cannot be remedied or would cause more environmental damage to correct than to
leave in place.
4. Dams, diversions, or other types of hydrologic modifications preclude the attainment of
the use, and it is not feasible to restore the waterbody to its original condition or to
operate the modification in such a way that would result in the attainment of the use.
5. Physical conditions related to natural features of the waterbody, such as the lack of
proper substrate, cover, flow, depth, pools, riffles, and the like, unrelated to water
quality, preclude attainment of aquatic life use protection.
6. Controls more stringent than those required by §301b and §306 of the Clean Water Act
would result in substantial and widespread economic and social impact.
Final: 08/30/2017 TMDL Implementation
Sediment TMDLs for Accotink Creek Watershed 5-13
This and other information is collected through a special study called a Use Attainability
Analysis (UAA). All site-specific criteria or designated use changes must be adopted by the SWCB as
amendments to the water quality standards regulations. During the regulatory process, watershed
stakeholders and other interested citizens, as well as the EPA, are able to provide comment.
The process to address potentially unattainable reductions based on the above is as follows:
As a first step, measures targeted at the controllable, anthropogenic sources of all pollutants
and non-pollutants causing or contributing to the biological impairment will be implemented. In
addition, measures should be taken to ensure that discharge permits are fully implementing
provisions required in the TMDL. The expectation would be for the reductions of all controllable
sources to be to the maximum extent practicable. DEQ will continue to monitor water quality in the
impaired streams during and subsequent to the implementation of these measures to determine if
water quality standards are being attained. This effort will also help to evaluate if the modeling
assumptions used in the TMDL were correct. In the best-case scenario, water quality goals will be
met and the stream’s uses fully restored using pollution controls and BMPs. If, however, water
quality standards are not being met, and no additional pollution controls and BMPs can be
identified, a UAA would then be initiated with the goal of re-designating the stream for a more
appropriate use, subcategory of a use, or tiered use.
A 2006 amendment to the Code of Virginia under 62.1-44.19:7E provides an opportunity for
aggrieved parties in the TMDL process to present to the State Water Control Board reasonable
grounds indicating that the attainment of the designated use for a water is not feasible. The Board
may then allow the aggrieved party to conduct a use attainability analysis according to the criteria
listed above and a schedule established by the Board. The amendment further states that “If
applicable, the schedule shall also address whether TMDL development or implementation for the
water shall be delayed.”
Final: 08/30/2017
Sediment TMDLs for Accotink Creek Watershed 6-1
6 Public Participation
Public participation was an essential element in the development of the sediment TMDLs for
upper Accotink Creek, lower Accotink Creek, and Long Branch. Three public meetings and six
Technical Advisory Committee (TAC) meetings were held over the course of the project. Topics
discussed at these meetings are summarized below.
The first TAC meeting was held on August 26, 2014, at the Richard Byrd Library, 7250
Commerce Street, Springfield, VA. The meeting covered an overview of the TMDL process and the
role of SI in TMDL development. The presentation for the meeting included a discussion of the data
required for the SI and for characterizing the Accotink watershed.
The first public meeting was held on September 10, 2014, at Kings Park Library, 9000 Burke
Lake Road, Burke, VA. The meeting also provided an overview of the TMDL development process,
with an emphasis on the role of biological monitoring in determining that upper Accotink Creek,
lower Accotink Creek, and Long Branch are not supporting their Aquatic Life Uses. The concept of
an SI was introduced.
The second TAC meeting was held on June 24, 2015 at the Kings Park Library in Burke. At that
meeting the results of the SI were presented in detail. Emphasis was placed on explaining the
evidence that sediment, chloride, hydromodification, and habitat modification are the most
probable stressors of the biological community in the Accotink Creek watershed.
The second public meeting was held on July 6, 2015 at the Kings Park Library in Burke. This
meeting also presented the results of the SI in detail.
The third TAC meeting was held on December 14, 2015 at the Kings Park Library in Burke. The
meeting presented in detail the steps in developing sediment and chloride TMDLs in the Accotink
Creek watershed. Two potential approaches to developing sediment TMDLs were discussed: (1)
the AllForX method, which has been used to develop most of the recent sediment TMDLs in VA, and
(2) a method based on Fairfax County’s Uniform Stormwater Design Standard, which was also
under development. DEQ’s plan for performing continuous monitoring of specific conductance and
collecting additional chloride data in the winter of 2016 was also discussed.
The fourth TAC meeting was held on July 28, 2016 at the Richard Byrd Library in Springfield. At
the meeting the use of the AllForX method to develop sediment TMDLs were explained in detail.
Final: 08/30/2017 Public Participation
Sediment TMDLs for Accotink Creek Watershed 6-2
The computer simulation model that was proposed to be used to develop the chloride TMDLs was
also presented. The meeting included a discussion of possible alternatives to using computer
simulation modeling to develop the chloride TMDLs.
The fifth TAC meeting was held on October 18, 2016 at the offices of the Northern Virginia
Regional Commission, 3040 Williams Drive, Fairfax, VA. The load duration approach to developing
the chloride TMDLs was presented to the TAC members. Progress on sediment TMDL development
was also reviewed, with a focus on changes in the approach to modeling the lower Accotink Creek
watershed and the impact of Lake Accotink. The meeting also included a detailed discussion of the
principles used in developing load and wasteload allocations for the sediment and chloride TMDLs.
Draft allocations based on these principles were presented to the TAC.
The sixth TAC meeting was held on June 7, 2017 at the Richard Byrd Library in Springfield. The
allocation methodology for both the chloride TMDLs and the sediment TMDLs was reviewed and
proposed allocations for both sets of TMDLs presented. The meeting also included a discussion of
establishing a regional Salt Management Strategy (SaMS) to implement the chloride TMDLs.
The third and final public meeting was held on June 28, 2017 at the Kings Park Library in Burke.
The meeting reviewed all of the steps in the development of chloride and sediment TMDLs in the
Accotink Creek watershed. The implementation of the chloride TMDLs through a regional SaMS was
also introduced.
The following agencies, businesses, and organizations attended TAC meetings and participated
in the development of the TMDLs for the Accotink Creek watershed:
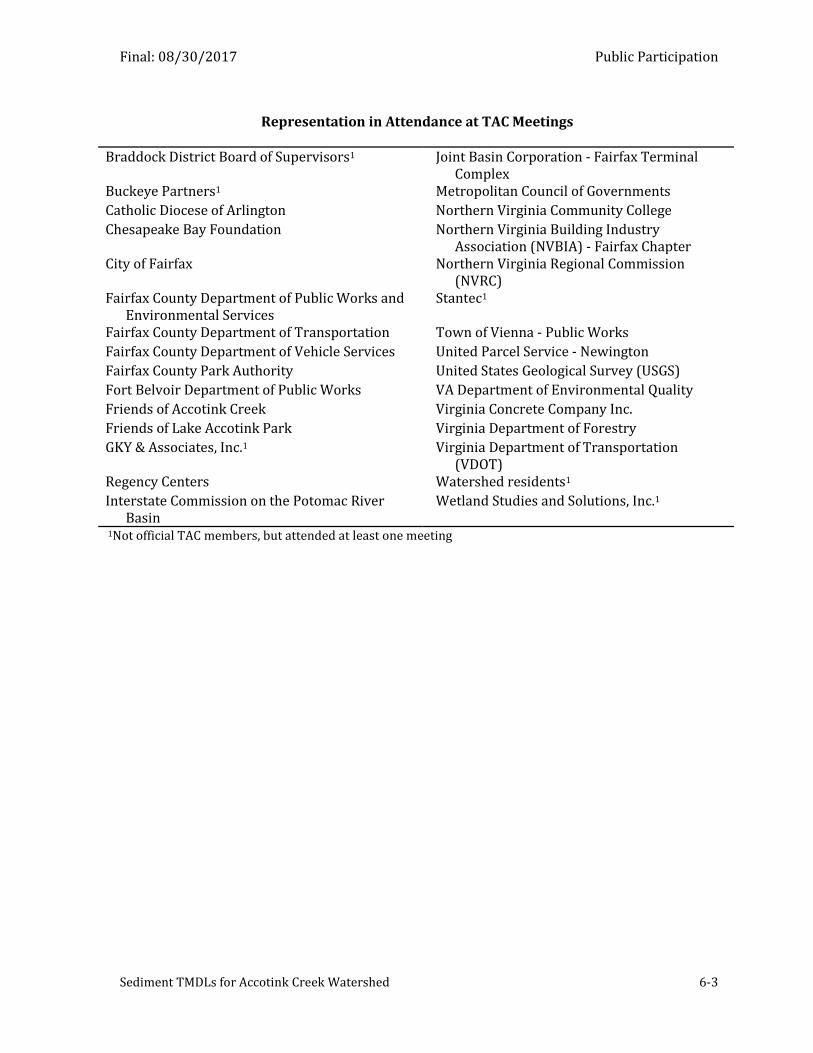
Final: 08/30/2017 Public Participation
Sediment TMDLs for Accotink Creek Watershed 6-3
Representation in Attendance at TAC Meetings
Braddock District Board of Supervisors1 Joint Basin Corporation - Fairfax Terminal Complex
Buckeye Partners1 Metropolitan Council of Governments
Catholic Diocese of Arlington Northern Virginia Community College
Chesapeake Bay Foundation Northern Virginia Building Industry Association (NVBIA) - Fairfax Chapter
City of Fairfax Northern Virginia Regional Commission (NVRC)
Fairfax County Department of Public Works and Environmental Services
Stantec1
Fairfax County Department of Transportation Town of Vienna - Public Works
Fairfax County Department of Vehicle Services United Parcel Service - Newington
Fairfax County Park Authority United States Geological Survey (USGS)
Fort Belvoir Department of Public Works VA Department of Environmental Quality
Friends of Accotink Creek Virginia Concrete Company Inc.
Friends of Lake Accotink Park Virginia Department of Forestry
GKY & Associates, Inc.1 Virginia Department of Transportation (VDOT)
Regency Centers Watershed residents1
Interstate Commission on the Potomac River Basin
Wetland Studies and Solutions, Inc.1
1Not official TAC members, but attended at least one meeting
Final: 08/30/2017
Sediment TMDLs for Accotink Creek Watershed A-1
Appendix A
ALLFORX Approach for the Accotink Creek Sediment TMDLs
Introduction
The Accotink Creek sediment TMDLs were developed using the AllForX approach (Benham et
al., 2014; Yagow et al., 2015a, Yagow et al., 2015b). The method, described in detail in this
appendix, is based on quantifying unimpaired conditions using comparison watersheds and using
that information to set sediment reductions needed to meet water quality standards. The
methodology included the following steps:
selecting comparison watersheds,
developing and running the GWLF model under current and all-forested conditions for
comparison and impaired watersheds,
calculating AllForX values for comparison and impaired watersheds,
regressing the Virginia Stream Condition Index (VSCI) scores against the AllForX values,
identifying a threshold multiplier for a VSCI score of 60, which indicates a healthy benthic macroinvertebrate community, and
multiplying the AllForX threshold by the all-forested sediment load for impaired
watersheds to establish the TMDL endpoint for the impaired watersheds.
The methodology and results are discussed in more detail in the sections below. Whenever
possible, the modeling process for the comparison watersheds was developed using the same
assumptions as those described for the Accotink models (Section 3). Where differences exist, they
are highlighted in this appendix.
Watershed Selection
The comparison watersheds were selected using an approach similar to those documented in
Yagow (2014), Yagow et al. (2013), and Yagow et al. (2015a). Specifically, the DEQ biological
monitoring database for the Northern Virginia Region was queried to identify monitoring locations
(1) in the Piedmont physiographic province, (2) with monitoring data after the year 2004, (3)
whose average VSCI score was greater than or equal to 60, and (4) with greater than or equal to
three sampling events. The monitoring locations meeting these criteria were then screened
spatially using GIS software to identify only monitoring locations (1) within 45 miles of the
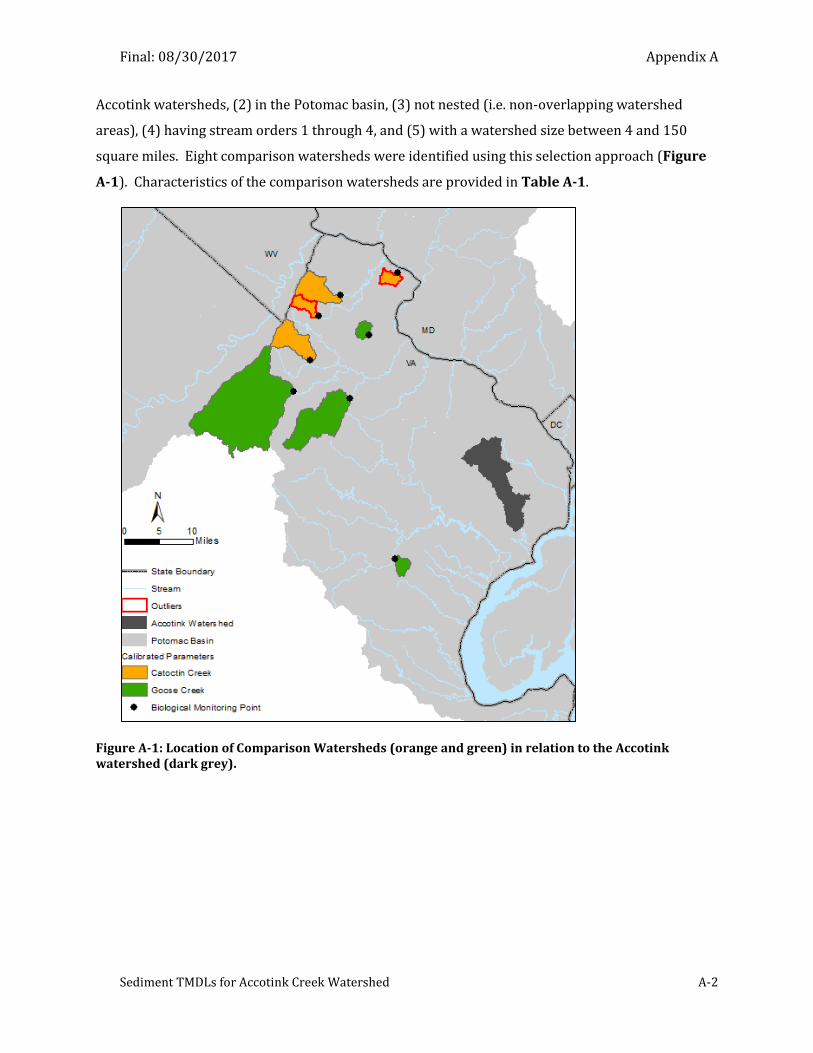
Final: 08/30/2017 Appendix A
Sediment TMDLs for Accotink Creek Watershed A-2
Accotink watersheds, (2) in the Potomac basin, (3) not nested (i.e. non-overlapping watershed
areas), (4) having stream orders 1 through 4, and (5) with a watershed size between 4 and 150
square miles. Eight comparison watersheds were identified using this selection approach (Figure
A-1). Characteristics of the comparison watersheds are provided in Table A-1.
Figure A-1: Location of Comparison Watersheds (orange and green) in relation to the Accotink watershed (dark grey).
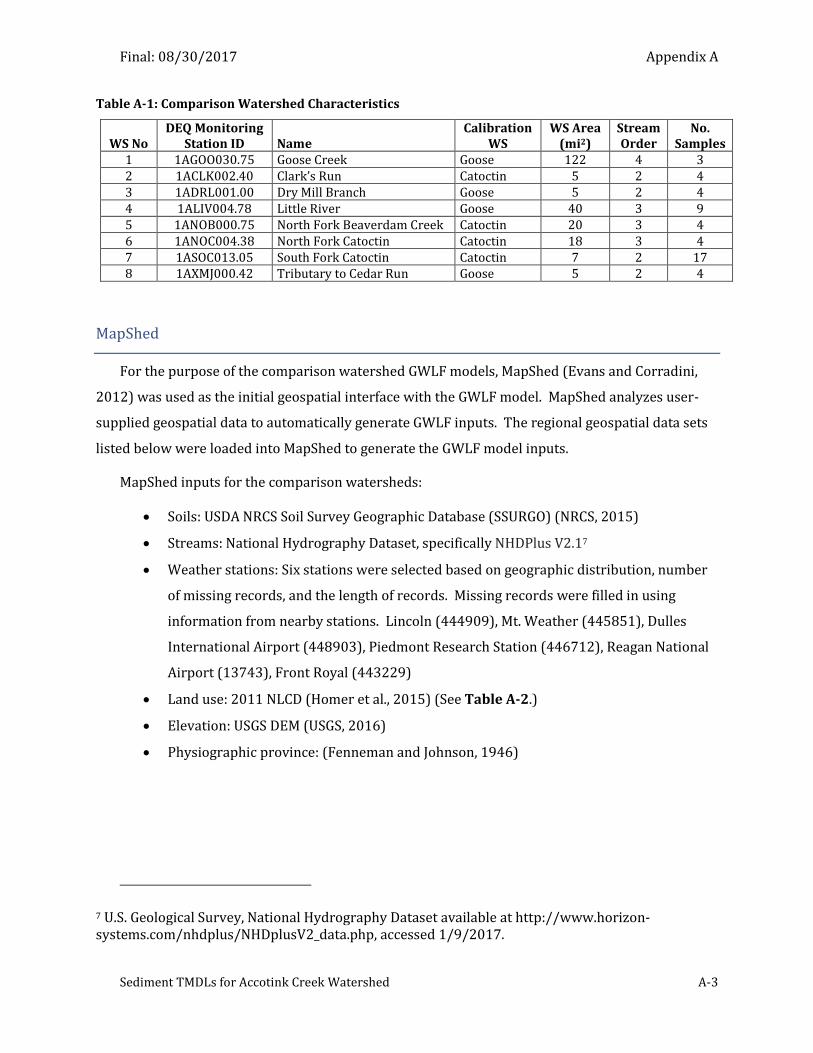
Final: 08/30/2017 Appendix A
Sediment TMDLs for Accotink Creek Watershed A-3
Table A-1: Comparison Watershed Characteristics
WS No DEQ Monitoring
Station ID Name Calibration
WS WS Area
(mi2) Stream Order
No. Samples
1 1AGOO030.75 Goose Creek Goose 122 4 3 2 1ACLK002.40 Clark’s Run Catoctin 5 2 4 3 1ADRL001.00 Dry Mill Branch Goose 5 2 4 4 1ALIV004.78 Little River Goose 40 3 9 5 1ANOB000.75 North Fork Beaverdam Creek Catoctin 20 3 4 6 1ANOC004.38 North Fork Catoctin Catoctin 18 3 4 7 1ASOC013.05 South Fork Catoctin Catoctin 7 2 17 8 1AXMJ000.42 Tributary to Cedar Run Goose 5 2 4
MapShed
For the purpose of the comparison watershed GWLF models, MapShed (Evans and Corradini,
2012) was used as the initial geospatial interface with the GWLF model. MapShed analyzes user-
supplied geospatial data to automatically generate GWLF inputs. The regional geospatial data sets
listed below were loaded into MapShed to generate the GWLF model inputs.
MapShed inputs for the comparison watersheds:
Soils: USDA NRCS Soil Survey Geographic Database (SSURGO) (NRCS, 2015)
Streams: National Hydrography Dataset, specifically NHDPlus V2.17
Weather stations: Six stations were selected based on geographic distribution, number
of missing records, and the length of records. Missing records were filled in using
information from nearby stations. Lincoln (444909), Mt. Weather (445851), Dulles
International Airport (448903), Piedmont Research Station (446712), Reagan National
Airport (13743), Front Royal (443229)
Land use: 2011 NLCD (Homer et al., 2015) (See Table A-2.)
Elevation: USGS DEM (USGS, 2016)
Physiographic province: (Fenneman and Johnson, 1946)
7 U.S. Geological Survey, National Hydrography Dataset available at http://www.horizon-systems.com/nhdplus/NHDplusV2_data.php, accessed 1/9/2017.
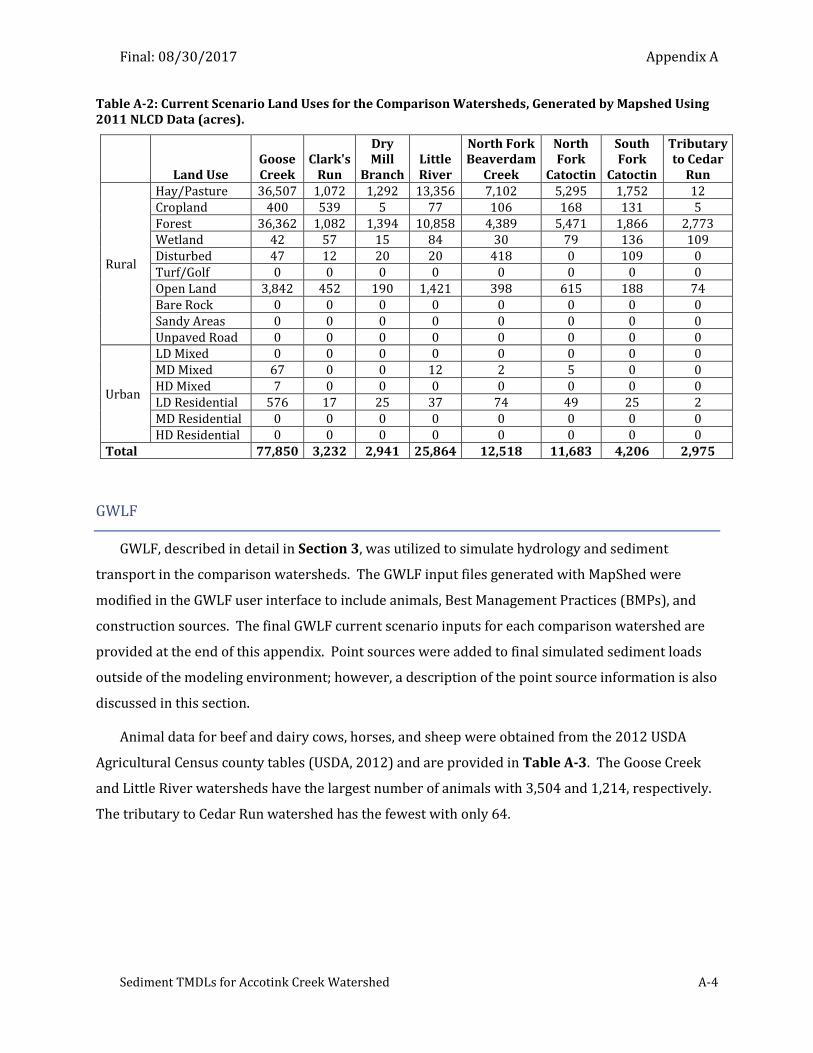
Final: 08/30/2017 Appendix A
Sediment TMDLs for Accotink Creek Watershed A-4
Table A-2: Current Scenario Land Uses for the Comparison Watersheds, Generated by Mapshed Using 2011 NLCD Data (acres).
Land Use
Goose Creek
Clark's Run
Dry Mill
Branch Little River
North Fork Beaverdam
Creek
North Fork
Catoctin
South Fork
Catoctin
Tributary to Cedar
Run
Rural
Hay/Pasture 36,507 1,072 1,292 13,356 7,102 5,295 1,752 12 Cropland 400 539 5 77 106 168 131 5 Forest 36,362 1,082 1,394 10,858 4,389 5,471 1,866 2,773 Wetland 42 57 15 84 30 79 136 109 Disturbed 47 12 20 20 418 0 109 0 Turf/Golf 0 0 0 0 0 0 0 0 Open Land 3,842 452 190 1,421 398 615 188 74 Bare Rock 0 0 0 0 0 0 0 0 Sandy Areas 0 0 0 0 0 0 0 0 Unpaved Road 0 0 0 0 0 0 0 0
Urban
LD Mixed 0 0 0 0 0 0 0 0 MD Mixed 67 0 0 12 2 5 0 0 HD Mixed 7 0 0 0 0 0 0 0 LD Residential 576 17 25 37 74 49 25 2 MD Residential 0 0 0 0 0 0 0 0 HD Residential 0 0 0 0 0 0 0 0
Total 77,850 3,232 2,941 25,864 12,518 11,683 4,206 2,975
GWLF
GWLF, described in detail in Section 3, was utilized to simulate hydrology and sediment
transport in the comparison watersheds. The GWLF input files generated with MapShed were
modified in the GWLF user interface to include animals, Best Management Practices (BMPs), and
construction sources. The final GWLF current scenario inputs for each comparison watershed are
provided at the end of this appendix. Point sources were added to final simulated sediment loads
outside of the modeling environment; however, a description of the point source information is also
discussed in this section.
Animal data for beef and dairy cows, horses, and sheep were obtained from the 2012 USDA
Agricultural Census county tables (USDA, 2012) and are provided in Table A-3. The Goose Creek
and Little River watersheds have the largest number of animals with 3,504 and 1,214, respectively.
The tributary to Cedar Run watershed has the fewest with only 64.
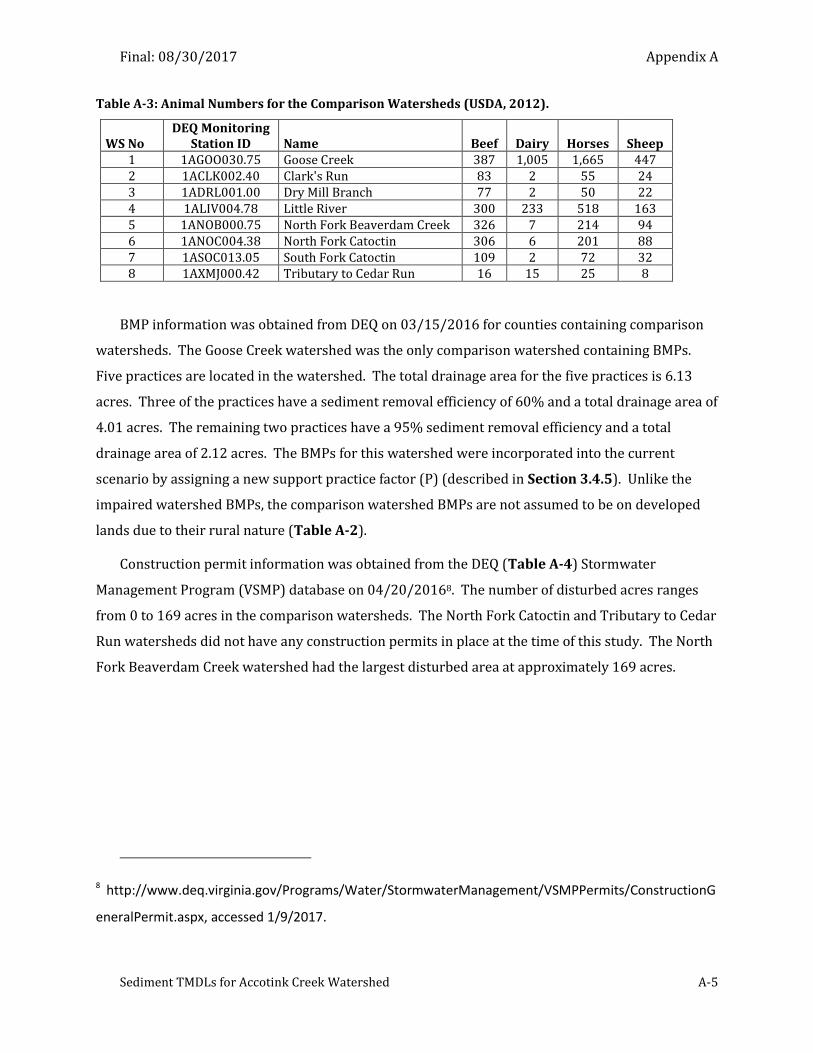
Final: 08/30/2017 Appendix A
Sediment TMDLs for Accotink Creek Watershed A-5
Table A-3: Animal Numbers for the Comparison Watersheds (USDA, 2012).
WS No DEQ Monitoring
Station ID Name Beef Dairy Horses Sheep 1 1AGOO030.75 Goose Creek 387 1,005 1,665 447 2 1ACLK002.40 Clark's Run 83 2 55 24 3 1ADRL001.00 Dry Mill Branch 77 2 50 22 4 1ALIV004.78 Little River 300 233 518 163 5 1ANOB000.75 North Fork Beaverdam Creek 326 7 214 94 6 1ANOC004.38 North Fork Catoctin 306 6 201 88 7 1ASOC013.05 South Fork Catoctin 109 2 72 32 8 1AXMJ000.42 Tributary to Cedar Run 16 15 25 8
BMP information was obtained from DEQ on 03/15/2016 for counties containing comparison
watersheds. The Goose Creek watershed was the only comparison watershed containing BMPs.
Five practices are located in the watershed. The total drainage area for the five practices is 6.13
acres. Three of the practices have a sediment removal efficiency of 60% and a total drainage area of
4.01 acres. The remaining two practices have a 95% sediment removal efficiency and a total
drainage area of 2.12 acres. The BMPs for this watershed were incorporated into the current
scenario by assigning a new support practice factor (P) (described in Section 3.4.5). Unlike the
impaired watershed BMPs, the comparison watershed BMPs are not assumed to be on developed
lands due to their rural nature (Table A-2).
Construction permit information was obtained from the DEQ (Table A-4) Stormwater
Management Program (VSMP) database on 04/20/20168. The number of disturbed acres ranges
from 0 to 169 acres in the comparison watersheds. The North Fork Catoctin and Tributary to Cedar
Run watersheds did not have any construction permits in place at the time of this study. The North
Fork Beaverdam Creek watershed had the largest disturbed area at approximately 169 acres.
8 http://www.deq.virginia.gov/Programs/Water/StormwaterManagement/VSMPPermits/ConstructionG
eneralPermit.aspx, accessed 1/9/2017.
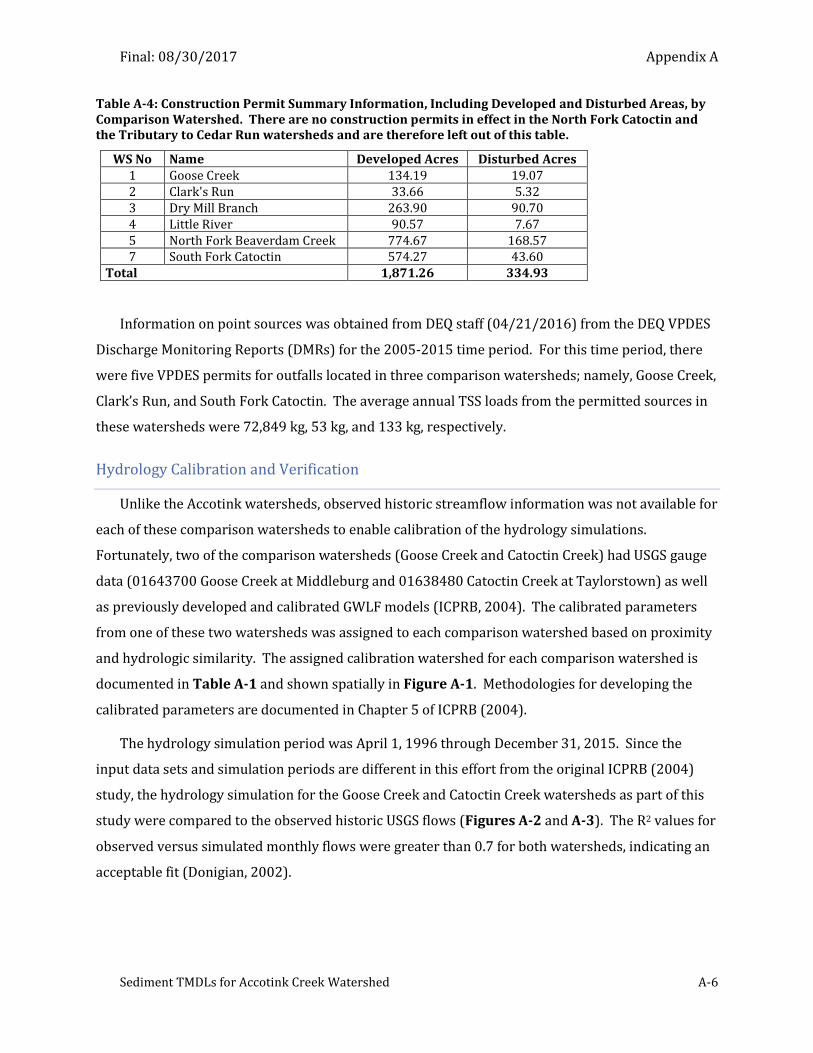
Final: 08/30/2017 Appendix A
Sediment TMDLs for Accotink Creek Watershed A-6
Table A-4: Construction Permit Summary Information, Including Developed and Disturbed Areas, by Comparison Watershed. There are no construction permits in effect in the North Fork Catoctin and the Tributary to Cedar Run watersheds and are therefore left out of this table.
WS No Name Developed Acres Disturbed Acres 1 Goose Creek 134.19 19.07 2 Clark's Run 33.66 5.32 3 Dry Mill Branch 263.90 90.70 4 Little River 90.57 7.67 5 North Fork Beaverdam Creek 774.67 168.57 7 South Fork Catoctin 574.27 43.60
Total 1,871.26 334.93
Information on point sources was obtained from DEQ staff (04/21/2016) from the DEQ VPDES
Discharge Monitoring Reports (DMRs) for the 2005-2015 time period. For this time period, there
were five VPDES permits for outfalls located in three comparison watersheds; namely, Goose Creek,
Clark’s Run, and South Fork Catoctin. The average annual TSS loads from the permitted sources in
these watersheds were 72,849 kg, 53 kg, and 133 kg, respectively.
Hydrology Calibration and Verification
Unlike the Accotink watersheds, observed historic streamflow information was not available for
each of these comparison watersheds to enable calibration of the hydrology simulations.
Fortunately, two of the comparison watersheds (Goose Creek and Catoctin Creek) had USGS gauge
data (01643700 Goose Creek at Middleburg and 01638480 Catoctin Creek at Taylorstown) as well
as previously developed and calibrated GWLF models (ICPRB, 2004). The calibrated parameters
from one of these two watersheds was assigned to each comparison watershed based on proximity
and hydrologic similarity. The assigned calibration watershed for each comparison watershed is
documented in Table A-1 and shown spatially in Figure A-1. Methodologies for developing the
calibrated parameters are documented in Chapter 5 of ICPRB (2004).
The hydrology simulation period was April 1, 1996 through December 31, 2015. Since the
input data sets and simulation periods are different in this effort from the original ICPRB (2004)
study, the hydrology simulation for the Goose Creek and Catoctin Creek watersheds as part of this
study were compared to the observed historic USGS flows (Figures A-2 and A-3). The R2 values for
observed versus simulated monthly flows were greater than 0.7 for both watersheds, indicating an
acceptable fit (Donigian, 2002).
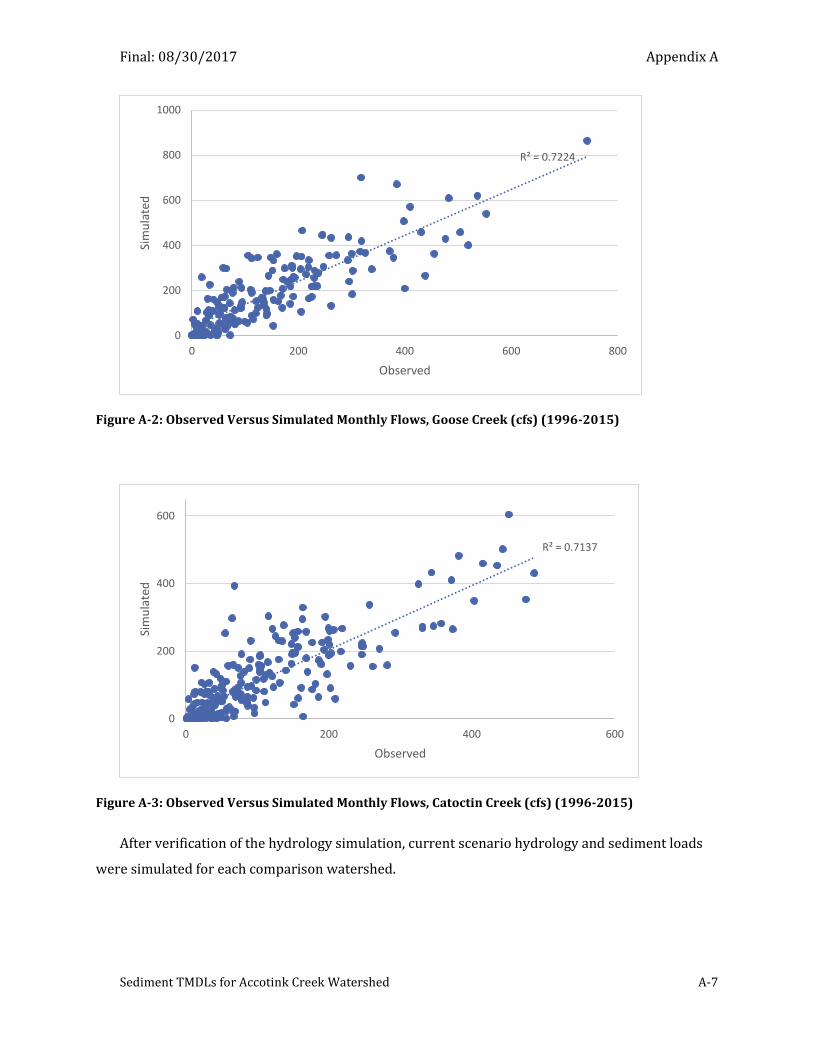
Final: 08/30/2017 Appendix A
Sediment TMDLs for Accotink Creek Watershed A-7
Figure A-2: Observed Versus Simulated Monthly Flows, Goose Creek (cfs) (1996-2015)
Figure A-3: Observed Versus Simulated Monthly Flows, Catoctin Creek (cfs) (1996-2015)
After verification of the hydrology simulation, current scenario hydrology and sediment loads
were simulated for each comparison watershed.
R² = 0.7224
0
200
400
600
800
1000
0 200 400 600 800
Sim
ula
ted
Observed
R² = 0.7137
0
200
400
600
0 200 400 600
Sim
ula
ted
Observed
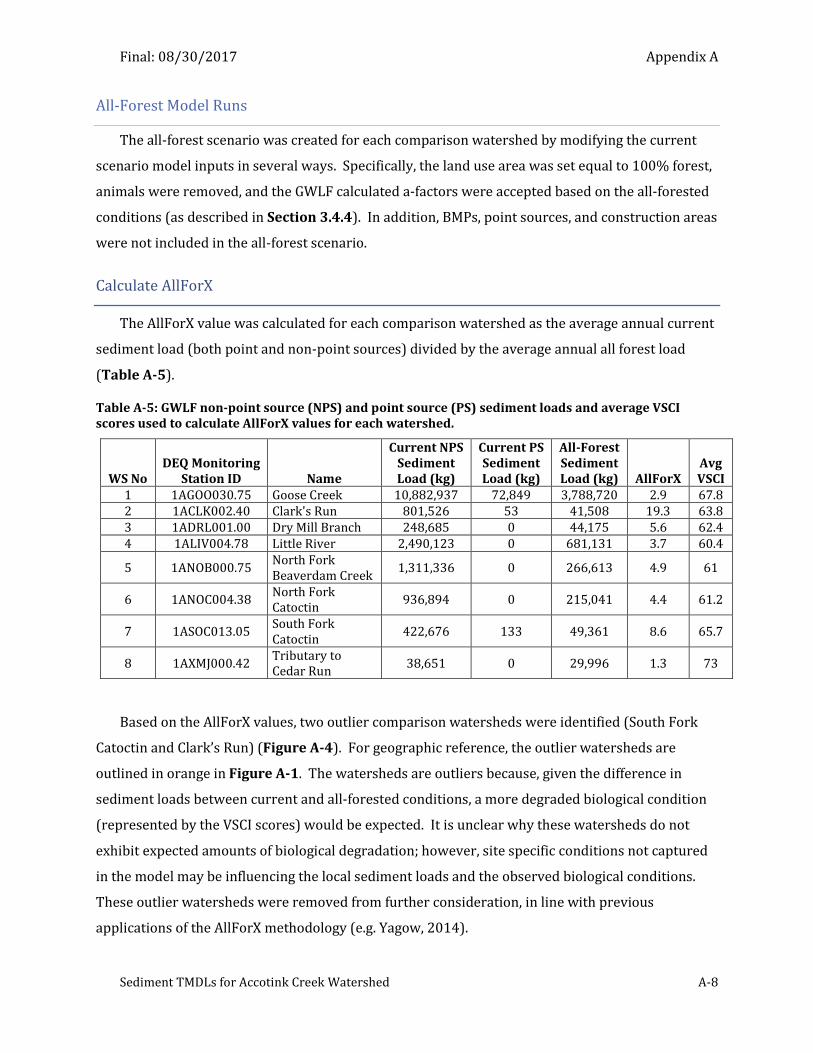
Final: 08/30/2017 Appendix A
Sediment TMDLs for Accotink Creek Watershed A-8
All-Forest Model Runs
The all-forest scenario was created for each comparison watershed by modifying the current
scenario model inputs in several ways. Specifically, the land use area was set equal to 100% forest,
animals were removed, and the GWLF calculated a-factors were accepted based on the all-forested
conditions (as described in Section 3.4.4). In addition, BMPs, point sources, and construction areas
were not included in the all-forest scenario.
Calculate AllForX
The AllForX value was calculated for each comparison watershed as the average annual current
sediment load (both point and non-point sources) divided by the average annual all forest load
(Table A-5).
Table A-5: GWLF non-point source (NPS) and point source (PS) sediment loads and average VSCI scores used to calculate AllForX values for each watershed.
WS No DEQ Monitoring
Station ID Name
Current NPS Sediment Load (kg)
Current PS Sediment Load (kg)
All-Forest Sediment Load (kg) AllForX
Avg VSCI
1 1AGOO030.75 Goose Creek 10,882,937 72,849 3,788,720 2.9 67.8 2 1ACLK002.40 Clark's Run 801,526 53 41,508 19.3 63.8 3 1ADRL001.00 Dry Mill Branch 248,685 0 44,175 5.6 62.4 4 1ALIV004.78 Little River 2,490,123 0 681,131 3.7 60.4
5 1ANOB000.75 North Fork Beaverdam Creek
1,311,336 0 266,613 4.9 61
6 1ANOC004.38 North Fork Catoctin
936,894 0 215,041 4.4 61.2
7 1ASOC013.05 South Fork Catoctin
422,676 133 49,361 8.6 65.7
8 1AXMJ000.42 Tributary to Cedar Run
38,651 0 29,996 1.3 73
Based on the AllForX values, two outlier comparison watersheds were identified (South Fork
Catoctin and Clark’s Run) (Figure A-4). For geographic reference, the outlier watersheds are
outlined in orange in Figure A-1. The watersheds are outliers because, given the difference in
sediment loads between current and all-forested conditions, a more degraded biological condition
(represented by the VSCI scores) would be expected. It is unclear why these watersheds do not
exhibit expected amounts of biological degradation; however, site specific conditions not captured
in the model may be influencing the local sediment loads and the observed biological conditions.
These outlier watersheds were removed from further consideration, in line with previous
applications of the AllForX methodology (e.g. Yagow, 2014).
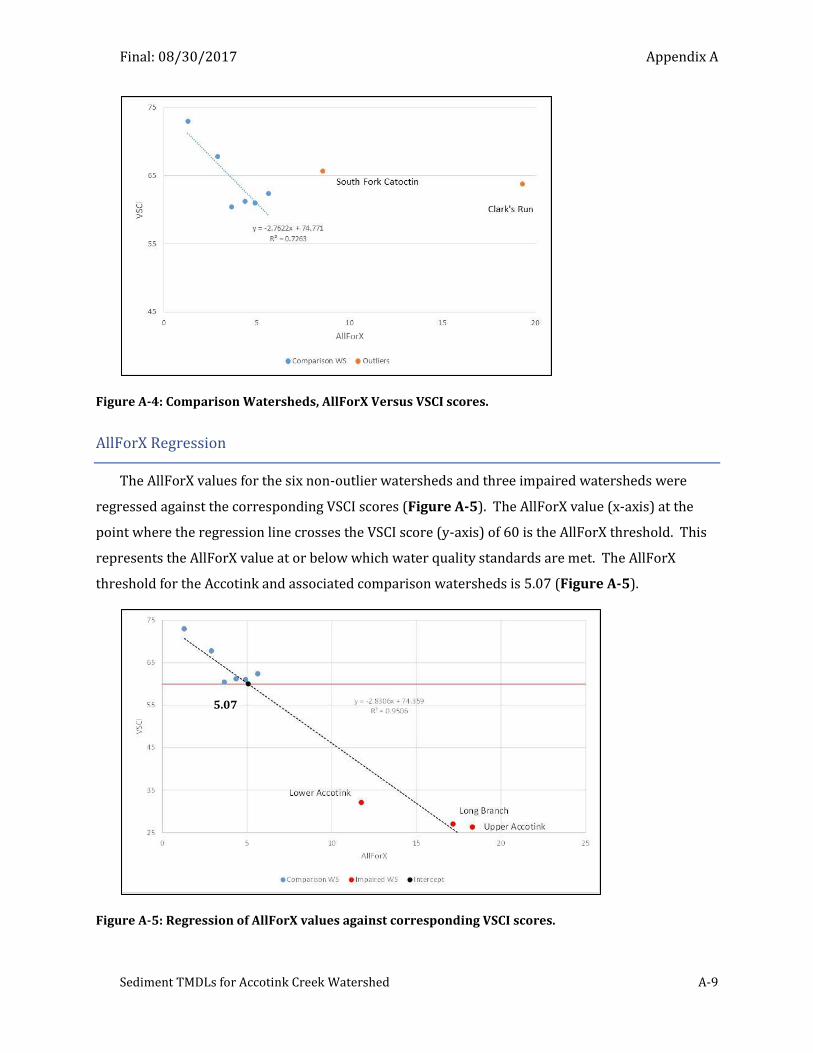
Final: 08/30/2017 Appendix A
Sediment TMDLs for Accotink Creek Watershed A-9
Figure A-4: Comparison Watersheds, AllForX Versus VSCI scores.
AllForX Regression
The AllForX values for the six non-outlier watersheds and three impaired watersheds were
regressed against the corresponding VSCI scores (Figure A-5). The AllForX value (x-axis) at the
point where the regression line crosses the VSCI score (y-axis) of 60 is the AllForX threshold. This
represents the AllForX value at or below which water quality standards are met. The AllForX
threshold for the Accotink and associated comparison watersheds is 5.07 (Figure A-5).
Figure A-5: Regression of AllForX values against corresponding VSCI scores.
5.07

Final: 08/30/2017 Appendix A
Sediment TMDLs for Accotink Creek Watershed A-10
The red horizontal line in Figure A-5 is located at the 60 VSCI score. The black dot is the
AllForX threshold. Data for comparison (unimpaired) watersheds are displayed with blue dots.
Red dots represent Accotink impaired watersheds.
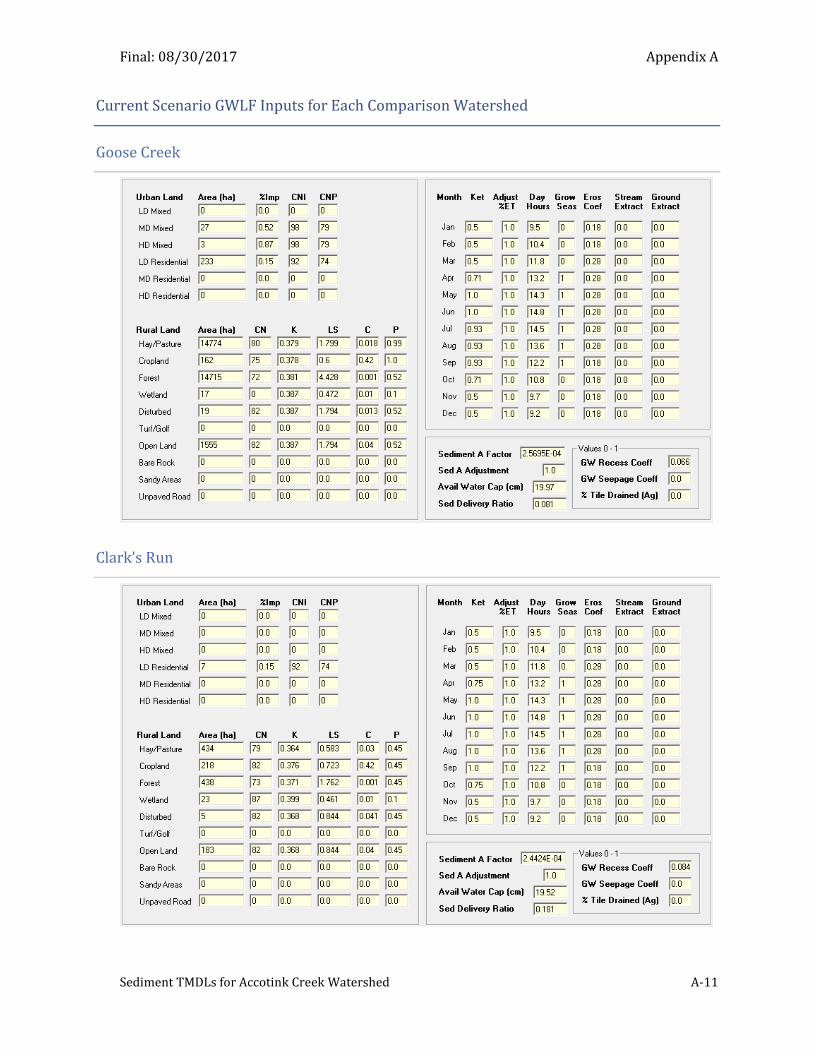
Final: 08/30/2017 Appendix A
Sediment TMDLs for Accotink Creek Watershed A-11
Current Scenario GWLF Inputs for Each Comparison Watershed
Goose Creek
Clark’s Run
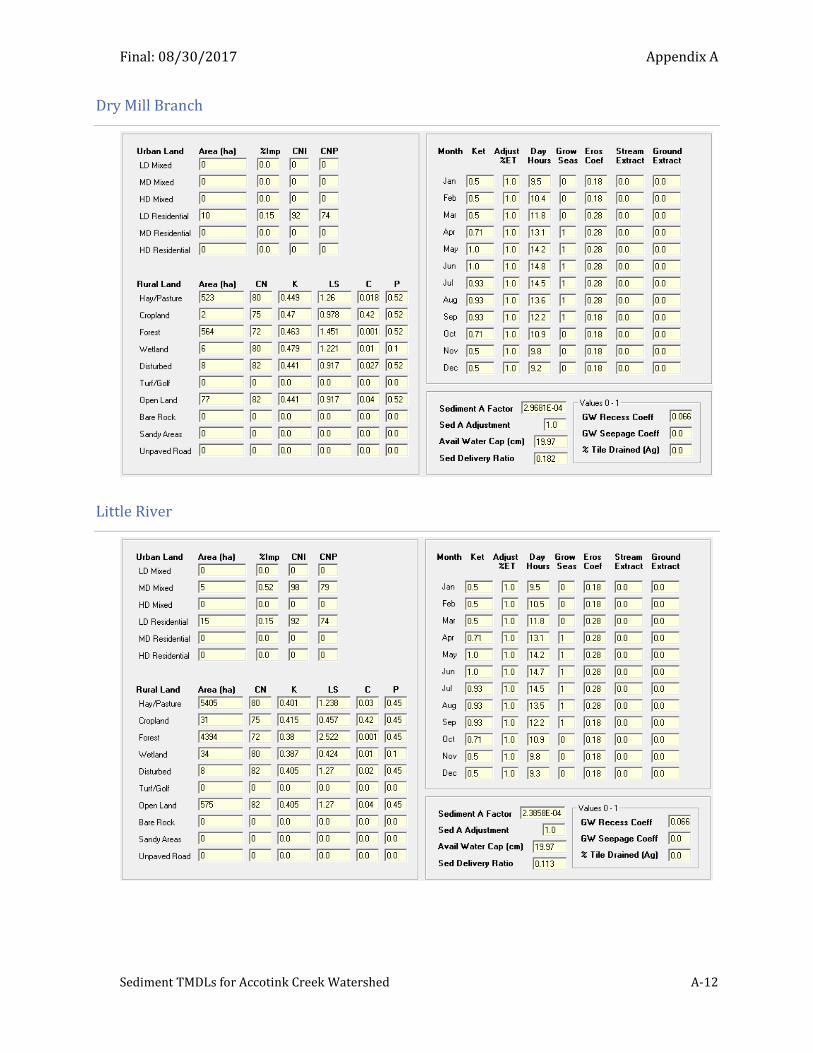
Final: 08/30/2017 Appendix A
Sediment TMDLs for Accotink Creek Watershed A-12
Dry Mill Branch
Little River
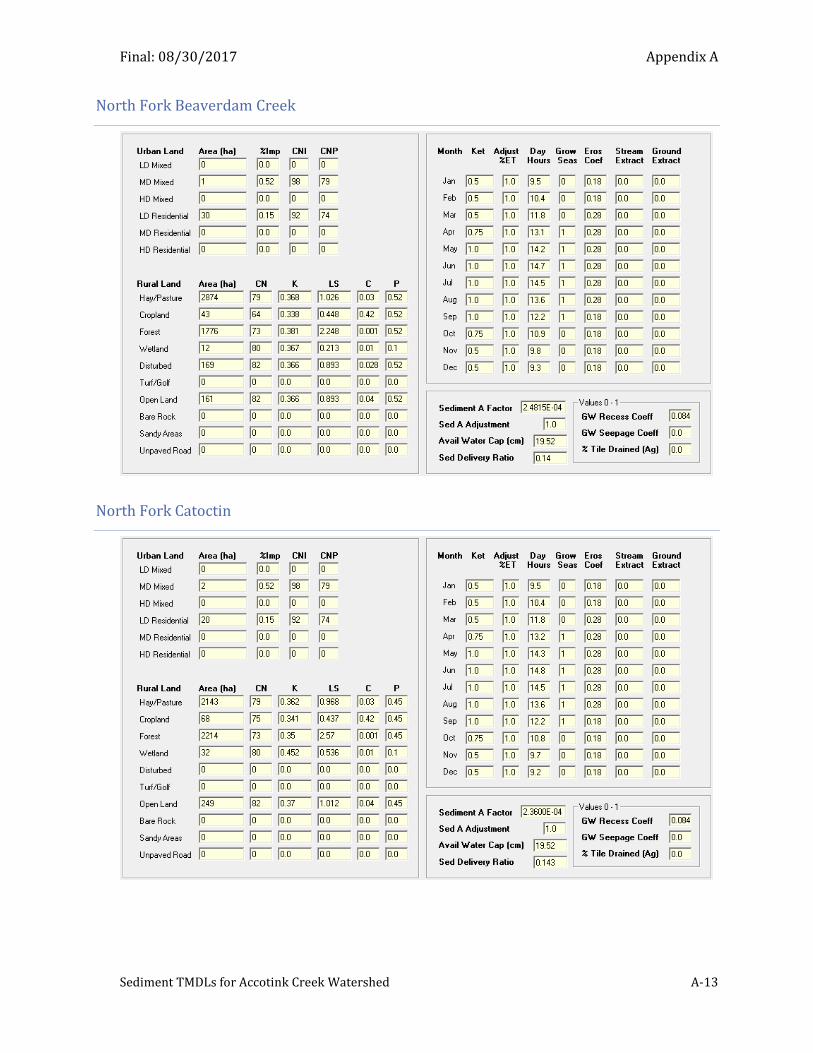
Final: 08/30/2017 Appendix A
Sediment TMDLs for Accotink Creek Watershed A-13
North Fork Beaverdam Creek
North Fork Catoctin
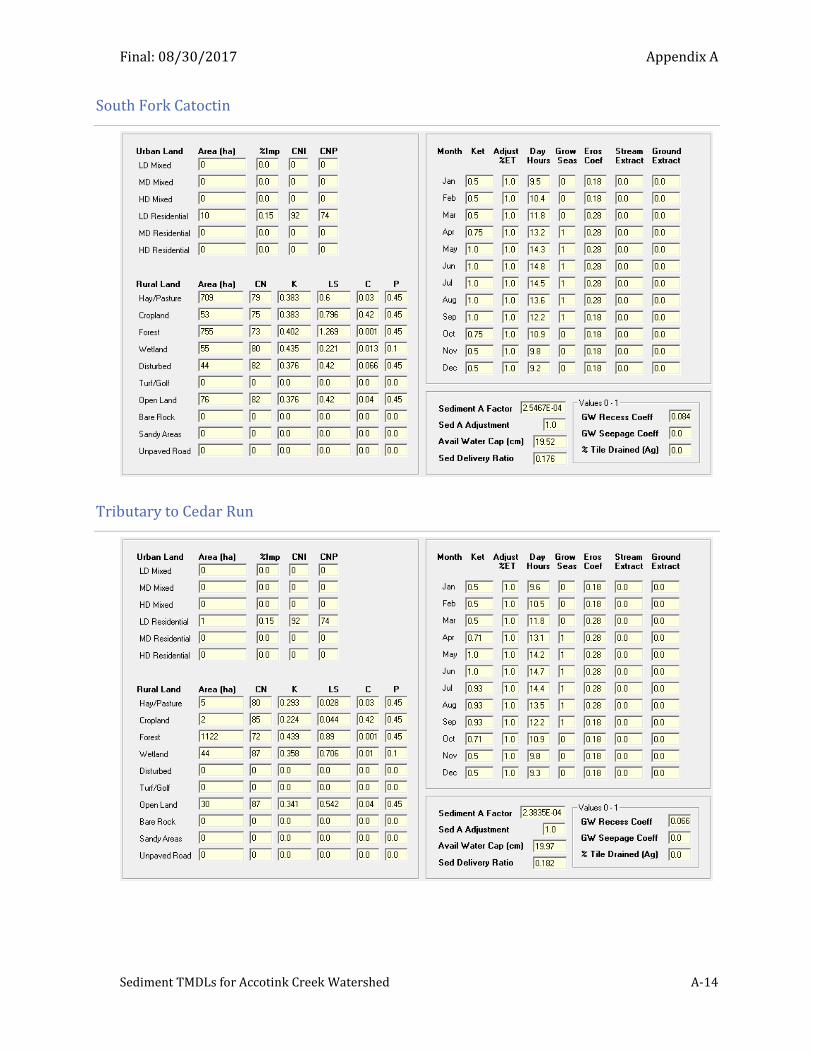
Final: 08/30/2017 Appendix A
Sediment TMDLs for Accotink Creek Watershed A-14
South Fork Catoctin
Tributary to Cedar Run
Final: 08/30/2017
Sediment TMDLs for Accotink Creek Watershed R-1
References
Atkins. 2014. Real Property Master Plan. Installation Vision and Development Plan. Fort Belvoir,
Virginia. Available at
http://www.belvoir.army.mil/docs/environdocs/Belvoir_VDP_DRAFT_MAR%202014.pdf
Benham, B., C. Mitchem, Jr., G. Yagow, W. Tse, and K. Kline, T. Sieber, S. Mueller, and N. McRae. 2014.
Bacteria TMDL Development for Crooked Run, Borden Marsh Run, Willow Brook, West Run,
Long Branch, Stephens Run, Manassas Run, and Happy Creek Watersheds, and Sediment TMDL
Development for Happy Creek Watershed Located in Clarke, Frederick, and Warren Counties,
Virginia. VT-BSE Document No. 2014-0004. Available at
http://www.deq.virginia.gov/Portals/0/DEQ/Water/TMDL/apptmdls/shenrvr/ShenTribs_Bac
teria_Benthic_Final.pdf
Bilotta, G. S., and R. E. Brazier. 2008. Understanding the Influence of Suspended Solids on Water
Quality and Aquatic Biota. Water Research 42: 2849-2861.
Brune, G.M. 1953. Trap Efficiency of Reservoirs. Transactions, American Geophysical Union.
Volume 34, Number 3, June, 1953.
Burton, J. and J. Gerritsen. 2003. A Stream Condition Index for Virginia Non-Coastal Streams. Tetra
Tech: Owings Mills, MD.
Chesapeake Bay Program (CBP). 2006. Best Management Practices for Sediment Control and
Water Clarity Enhancement. CBP/TRS-282-06. Available at
http://www.chesapeakebay.net/content/publications/cbp_13369.pdf.
CH2MHILL. 2005. Fairfax County Stream Physical Assessment. CH2MHILL: Herndon, VA.
City of Fairfax. 2015. Chesapeake Bay TMDL Action Plan. Available at
http://www.fairfaxva.gov/home/showdocument?id=5771. Accessed 12/12/2016.
Clark, S., M. Grose, R. Greer, A. Jarrett, S. Kunkel, D. Lake, N. Law, J. McCutcheon, R .McLaughlin, K.
Mumaw, and B. Young. 2014. Recommendations of the Expert Panel to Define Removal Rates
for Erosion and Sediment Control Practices. Chesapeake Bay Program. Annapolis, MD.
Available at http://www.chesapeakebay.net/channel_files/21146/attachment_d.2--
final_short_draft_esc_expert_panel_01072014.pdf
Final: 08/30/2017 References
Sediment TMDLs for Accotink Creek Watershed R-2
Doherty, J. 2001. PEST: Model independent parameter estimation - User’s Manual. Watermark
Numerical Computing.
Donigian, A.S. 2002. Watershed Model Calibration and Validation – The HSPF Experience. National
TMDL Science and Policy 2002. Specialty Conference Proceedings: Water Environment
Foundation, Phoenix, AZ. 30p.
Evans, B.M., S.A. Sheeder, K.J. Corradini, and W.S. Brown. 2001. AVGWLF version 3.2. Users Guide.
Environmental Resources Research Institute, Pennsylvania State University and Pennsylvania
Department of Environmental Protection, Bureau of Watershed Conservation.
Evans, B.M., S.A. Sheeder, D.W. Lehning. 2003. A Spatial Technique for Estimating Streambank
Erosion Based on Watershed Characteristics. J. Spatial Hydrology 3(2). Available at
http://www.spatialhydrology.net/index.php/JOSH/article/view/14/13.
Evans, B.M. and K.J. Corradini. 2012. MapShed Users Guide. Penn State Institutes of Energy and the
Environment. Updated July 2015. 142p.
Evans, B.M., and K.J. Corradini. 2014. MapShed Version 1.1. Users Guide. Environmental
Resources Research Institute, Pennsylvania State University
Fairfax County Department of Public Works and Environmental Services (FCDPWES). 2011.
Accotink Creek Watershed Management Plan. Fairfax County Stormwater Planning Division.
Available at
http://www.fairfaxcounty.gov/dpwes/watersheds/publications/ac/01_ac_wmp_full_ada.pdf
Fairfax County Public Schools. 1976. Focus on Fairfax County: A Guide to the Local Environment
for Earth Science Teachers.
Fairfax County. 2014. Fairfax County Park Authority. Available at
http://www.fairfaxcounty.gov/parks/lake-accotink.
Fenneman, N.M. and D.W. Johnson. 1946. Physiographic Divisions of the Conterminous U.S. USGS,
Reston, VA. Available at https://water.usgs.gov/GIS/dsdl/physio_shp.zip.
Haith, D.A. and L.L. Shoemaker. 1987. Generalized Watershed Loading Functions for Stream Flow
Nutrients. Water Resources Bulletin, 23(3), pp. 471-478.
Final: 08/30/2017 References
Sediment TMDLs for Accotink Creek Watershed R-3
Haith, D.R., R. Mandel, and R.S. Wu. 1992. GWLF: Generalized Watershed Loading Functions User’s
Manual, Version. 2.0. Cornell University, Ithaca, NY. Available at
http://www.mapshed.psu.edu/Downloads/GWLFManual.pdf.
HDR Engineering. 2002. Final, Lake Accotink Dredge Study (with Appendices). Alexandria, VA.
Helsel, D.R. and R.M. Hirsch. 2002. Statistical Methods in Water Resources. Techniques of Water
Resource Investigations of the United States Geological Survey, Book 4, Chapter A3. U.S.
Geological Survey. Available at https://pubs.usgs.gov/twri/twri4a3/
Homer, C.G., J.A. Dewitz, L. Yang, S. Jin, P. Danielson, G. Xian, J. Coulston, N.D. Herold, J.D. Wickham,
and K. Megown. 2015. Completion of the 2011 National Land Cover Database for the
Conterminous United States-Representing a Decade of Land Cover Change Information.
Photogrammetric Engineering and Remote Sensing, 8(5):345-354.
Horne Engineering Services, Inc. 2001. Integrated Natural Resources Management Plan 2001-
2005. Prepared for U.S. Army Garrision Fort Belvoir, Virginia, Directorate of Installation
Support, Environmental and Natural Resources Division, Fort Belvoir, VA. Available at
http://www.belvoir.army.mil/docs/environdocs/inrmp_4_web.pdf
International Stormwater Best Management Practices Database (ISBMP). Available at
http://www.bmpdatabase.org/.
Interstate Commission on the Potomac River Basin (ICPRB). 2004. Benthic TMDLs for the Goose
Creek watershed. Prepared for VA DEQ. Available at http://www.potomacriver.org/wp-
content/uploads/2015/11/ICP04-5_ICPRB.pdf
Livingston, I. 2011. Washington Post. September 9, 2011.
Maryland Department of the Environment (MDE). 2011. Total Maximum Daily Load of Sediment in
the Patapsco River Lower North Branch Watershed, Baltimore City and Baltimore, Howard,
Carroll and Anne Arundel Counties, Maryland.
http://www.mde.state.md.us/programs/Water/TMDL/ApprovedFinalTMDLs/Documents/ww
w.mde.state.md.us/assets/document/PatapLNB_Sed_TMDL_093011_Final.pdf
Minnesota Pollution Control Agency (MPCA). 2015. Minnesota Stormwater Manual. Available at
http://stormwater.pca.state.mn.us/index.php/Calculating_credits_for_green_roof.
Final: 08/30/2017 References
Sediment TMDLs for Accotink Creek Watershed R-4
Nashua Regional Planning Commission (NRPC). Low Impact Development Guidebook. Merrimack,
NH 03054. Available at
http://www.nashuarpc.org/files/2613/9300/1349/LID_guidebook.pdf.
Natural Resources Conservation Service (NRCS), Soil Survey Staff, United States Department of
Agriculture. Web Soil Survey. Available at http://websoilsurvey.nrcs.usda.gov. Accessed
12/3/2015.
Northern Virginia Community College (NOVA). 2014. Municipal Separate Storm Sewer System
(MS4) Manual. Available at
https://www.nvcc.edu/stormwater/_docs/MS4StormwaterMasterplan.pdf. Accessed
12/12/2016.
Pennsylvania Department of Environmental Protection (PADEP). 2006. Pennsylvania Stormwater
Best Management Practices Manual. Chapter 6 Structural BMPs.363-0300-002. Available at
http://www.stormwaterpa.org/bmp-manual-chapter-6.html
Pitt, R., A. Maestre, and R. Morquecho. 2004. The National Stormwater Quality Database (NSQD),
Version 1.1. A Compilation and Analysis of NPDES Stormwater Monitoring Information.
Available at
http://rpitt.eng.ua.edu/Publications/Stormwater%20Characteristics/NSQD%20EPA.pdf
Rasmussen, PP., J.R. Gray, G.D. Glysson, and A.C. Ziegler. 2009. Guidelines and Procedures for
Computing Time-series Suspended-sediment Concentrations and Loads from In-stream
Turbidity-sensor and Streamflow Data: U.S. Geological Survey Techniques and Methods, Book 3,
Chapter C4. Available at https://pubs.usgs.gov/tm/tm3c4/pdf/TM3C4.pdf
Sievers, M. 2014. Land Use Loading Literature Review Task Summary and Results. Memo to Gary
Shenk, EPA and Peter Claggett, USGS. Tetra Tech. Fairfax, VA. Available at
http://www.chesapeakebay.net/channel_files/21151/attachment_f--
tetra_tech_urban_loads_literature_review_memo_20140331.pdf
State Water Control Board. 2011. 9 VAC 25-260 Virginia Water Quality Standards. Richmond, VA.
Steffen, L.J. 1982. Channel Erosion. Personal communication. In Michigan Department of the
Environment. Revised June 1999. Pollution Controlled Calculation and Documentation for
Section 319 Watersheds Training Manual. Lansing, MI. Available at
https://www.michigan.gov/documents/deq/deq-wb-nps-POLCNTRL_250921_7.pdf
Final: 08/30/2017 References
Sediment TMDLs for Accotink Creek Watershed R-5
Tetra Tech. 2011. Users Guide: Spreadsheet Tool for the Estimation of Pollutant Load (STEPL).
Version 4.1. Fairfax, VA. Available at http://it.tetratech-
ffx.com/steplweb/STEPLmain_files/STEPLGuide401.pdf
United States Department of Agriculture (USDA). 2012. Agricultural Census - Virginia County
Tables. Available at
http://www.agcensus.usda.gov/Publications/2012/Full_Report/Volume_1,_Chapter_2_County_
Level/Virginia
U. S. Environmental Protection Agency (EPA).1986. Methodology for the Analysis of Detention
Basins for Control of Urban Runoff Quality. Office of Water. Nonpoint Source Branch.
Washington, DC. EPA 440/5-87-001.
EPA. 1991. Technical Support Document for Water Quality based Toxics Control. EPA/505/2-90-
001. U.S. Environmental Protection Agency. Office of Water. Washington, DC. Available at
https://www3.epa.gov/npdes/pubs/owm0264.pdf
EPA. 2005. Guidance for the 2006 Assessment, Listing, and Reporting Requirements Pursuant to
Sections 303(d), 305(b), and 314 of the Clean Water Act. U. S. Environmental Protection
Agency: Washington, DC. Available at
http://water.epa.gov/lawsregs/lawsguidance/cwa/tmdl/upload/2006irg-report.pdf
EPA. 2007. Draft Options for Expressing Daily Loads in TMDLs. U.S. Environmental Protection
Agency. Office of Wetlands, Oceans and Watersheds. Washington, DC. Available at
https://www.epa.gov/tmdl/options-expressing-daily-loads-tmdls
EPA. 2010. Chesapeake Bay Phase 5.3 Community Watershed Model. EPA 903S10002 - CBP/TRS-
303-10. Chesapeake Bay Program Office. Annapolis, MD. Available at
http://www.chesapeakebay.net/about/programs/modeling/53/
EPA. 2015. Information Concerning 2016 Clean Water Act Sections 303(d), 305(b), and 314
Integrated Reporting and Listing Decisions. Office of Wetlands, Oceans and Watersheds.
Washington, DC. Available at https://www.epa.gov/sites/production/files/2015-
10/documents/2016-ir-memo-and-cover-memo-8_13_2015.pdf
U.S. Geological Survey (USGS). 1999. National Elevation Dataset. U.S. Geological Survey EROS Data
Center. Sioux Falls, SD. Available at http://nationalmap.gov/elevation.html. Accessed
10/8/2014.
Final: 08/30/2017 References
Sediment TMDLs for Accotink Creek Watershed R-6
USGS. 2000. Brakebill, J.W. and S.K. Kelley (eds). Hydrogeomorphic Regions in the Chesapeake Bay
Watershed. U.S. Geological Survey: Baltimore, MD. Available at
http://water.usgs.gov/lookup/getspatial?hgmr
USGS. 2016. 3DEP Products and Services: The National Map, 3D Elevation Program Web Page.
http://nationalmap.gov/3DEP/3dep_prodserv.html, accessed 1/9/2017.
Vanoni, V. A. (Ed.). 1975. Sedimentation Engineering. American Society of Civil Engineers, New
York NY.
Virginia Assessment Scenario Tool (VAST). Available at
http://www.vasttool.org/Documentation.aspx.
Virginia Department of Environmental Quality (DEQ). 2003. Guidance Manual for Total Maximum
Daily Load Implementation Plans. The Commonwealth of Virginia: Department of Conservation
and Recreation and Department of Environmental Quality. Available at
http://www.deq.virginia.gov/Portals/0/DEQ/Water/TMDL/ImplementationPlans/ipguide.pdf.
DEQ. 2016. 2014 305(b)/303(d) Water Quality Assessment Integrated Report. Virginia
Department of Environmental Quality: Richmond, VA. Available at
http://www.deq.virginia.gov/Portals/0/DEQ/Water/WaterQualityAssessments/IntegratedRep
ort/2014/ir14_Integrated_Report_Final.pdf
DEQ. 2015. Chesapeake Bay TMDL Action Plan Guidance Revision Change Summary 5/18/2015.
Available at http://www.deq.virginia.gov/Portals/0/DEQ/Water/Guidance/152005.pdf.
DEQ. 2017. Draft. Stressor Analysis Report for the Benthic Macroinvertebrate Impairments in the
Accotink Creek Watershed, Fairfax County, Virginia. Virginia Department of Environmental
Quality: Richmond, VA.
Wetland Studies and Solutions, Inc (WSSI). 2016. Appendix: Lake Accotink Management Options—
Water Quality Assessment. Trapping Efficiency Estimation.
Wischmeier, W.H. and D.D. Smith. 1978. Predicting Rainfall Erosion Losses - A Guide to
Conservation Planning. Agricultural Handbook 537, U.S. Department of Agriculture,
Washington DC. Available at https://naldc.nal.usda.gov/download/CAT79706928/PDF
Final: 08/30/2017 References
Sediment TMDLs for Accotink Creek Watershed R-7
Yagow, G., B. Benham, K. Kline, and C.J. Mitchem. 2013. Developing Sediment Load Thresholds
Protective of Aquatic Life. 2013 ASABE Annual International Meeting. Kansas City, MO. July
21-24.
Yagow, G. 2014. Creating Data Layer for Analysis of AllforX Comparison Watersheds. Memo-to-file
dated June 19, 2014.
Yagow, G., K. Kline, and B. Benham. 2015a. TMDLs for Benthic Impairments in Little Otter River
(Sediment and Total Phosphorus), Johns Creek, Wells Creek, and Buffalo Creek (Sediment).
Town of Bedford, Bedford and Campbell Counties, Virginia. VT-BSE Document No. 2013-0001.
Final: January 9, 2015. EPA approval: February 3, 2015.
Yagow, G., K. Kline, C. Wallace, R. Zeckoski, and B. Benham. 2015b. Sediment TMDLs for Moores
Creek, Lodge Creek, Meadow Creek, and Schenks Branch Albemarle County and the City of
Charlottesville, Virginia. VT-BSE Document No. 2014-0003. Draft: April 21, 2015.