volaris: the leading ultra-low-cost airline serving...
TRANSCRIPT
Volaris: the leading ultra-low-cost airline
serving Mexico, USA and Central America
January 2018
The information ("Confidential Information") contained in this presentation is confidential and is provided by
Controladora Vuela Compañía de Aviación, S.A.B. de C.V., (d/b/a Volaris, the "Company") confidentially to you solely
for your reference and may not be retransmitted or distributed to any other persons for any purpose whatsoever.
The Confidential Information is subject to change without notice, its accuracy is not guaranteed, it has not been
independently verified and it may not contain all material information concerning the Company. Neither the Company,
nor any of their respective directors makes any representation or warranty (express or implied) regarding, or
assumes any responsibility or liability for, the accuracy or completeness of, or any errors or omissions in, any
information or opinions contained herein. None of the Company nor any of their respective directors, officers,
employees, stockholders or affiliates nor any other person accepts any liability (in negligence, or otherwise)
whatsoever for any loss howsoever arising from any use of this presentation or its contents or otherwise arising in
connection therewith. No reliance may be placed for any purposes whatsoever on the information set forth in this
presentation or on its completeness.
This presentation does not constitute or form part of any offer or invitation for sale or subscription of or solicitation or
invitation of any offer to buy or subscribe for any securities, nor shall it or any part of it form the basis of or be relied
on in connection with any contract or commitment whatsoever. Recipients of this presentation are not to construe the
contents of this presentation as legal, tax or investment advice and should consult their own advisers in this regard.
This presentation contains statements that constitute forward-looking statements which involve risks and
uncertainties. These statements include descriptions regarding the intent, belief or current expectations of the
Company or its officers with respect to the consolidated results of operations and financial condition, and future
events and plans of the Company. These statements can be recognized by the use of words such as "expects,"
"plans," "will," "estimates," "projects," or words of similar meaning. Such forward-looking statements are not
guarantees of future performance and actual results may differ significantly from those in the forward-looking
statements as a result of various factors and assumptions. You are cautioned not to place undue reliance on these
forward looking statements, which are based on the current view of the management of the Company on future
events. The Company does not undertake to revise forward-looking statements to reflect future events orcircumstances.
Disclaimer
2
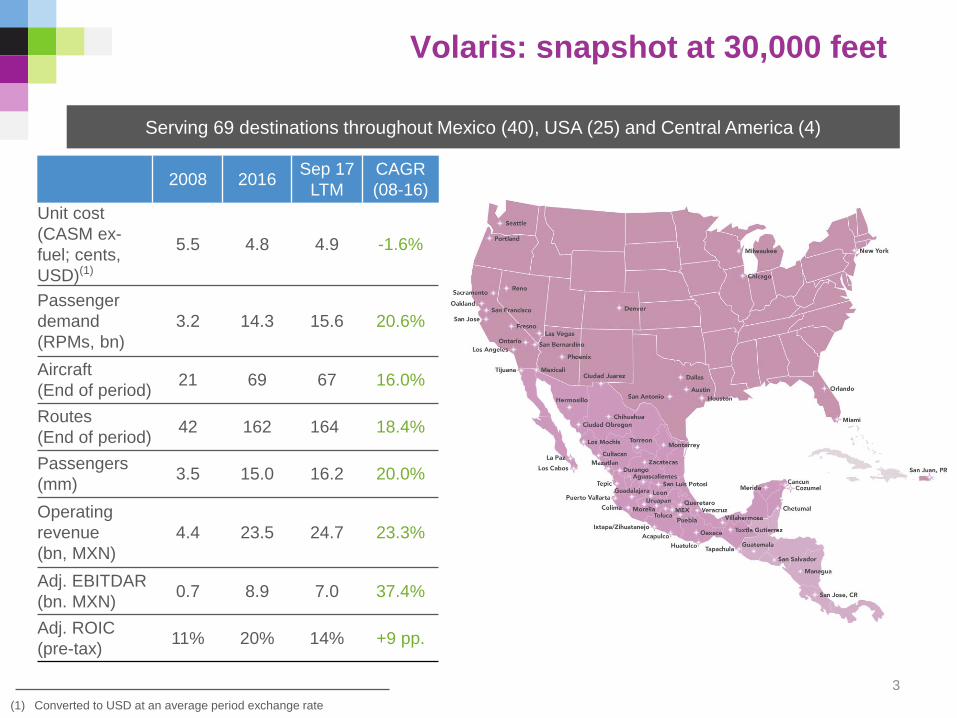
Serving 69 destinations throughout Mexico (40), USA (25) and Central America (4)
(1) Converted to USD at an average period exchange rate
Volaris: snapshot at 30,000 feet
2008 2016Sep 17
LTM
CAGR
(08-16)
Unit cost
(CASM ex-
fuel; cents,
USD)(1)
5.5 4.8 4.9 -1.6%
Passenger
demand
(RPMs, bn)
3.2 14.3 15.6 20.6%
Aircraft
(End of period) 21 69 67 16.0%
Routes
(End of period) 42 162 164 18.4%
Passengers
(mm)3.5 15.0 16.2 20.0%
Operating
revenue
(bn, MXN)
4.4 23.5 24.7 23.3%
Adj. EBITDAR
(bn. MXN)0.7 8.9 7.0 37.4%
Adj. ROIC
(pre-tax)11% 20% 14% +9 pp.
3
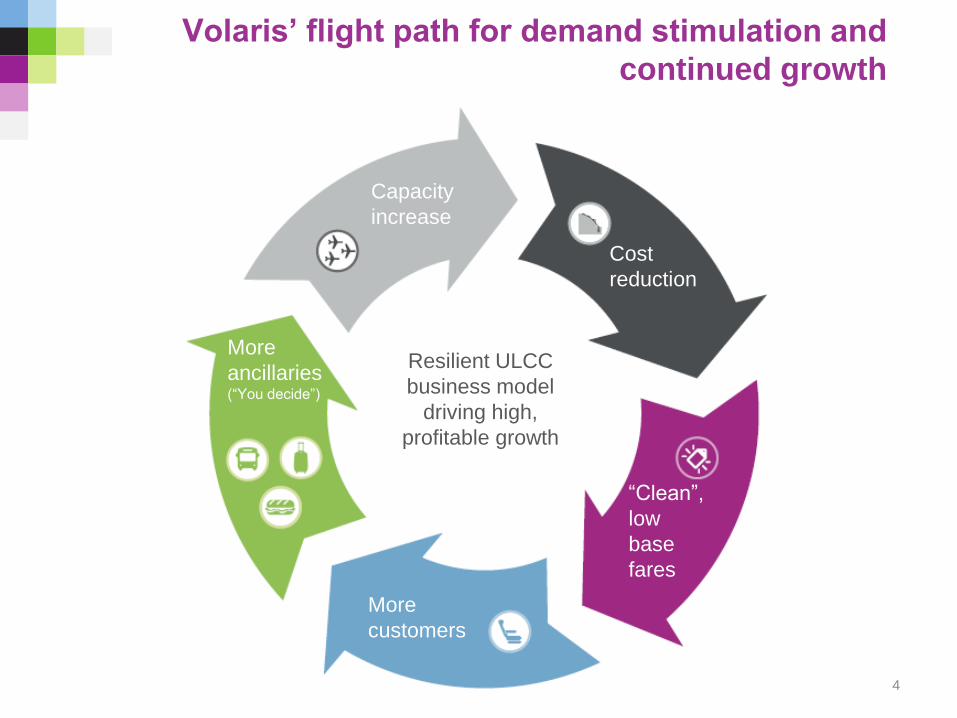
Volaris’ flight path for demand stimulation and
continued growth
Capacity
increase
Cost
reduction
“Clean”,
low
base
fares
More
customers
More
ancillaries(“You decide”)
Resilient ULCC
business model
driving high,
profitable growth
4
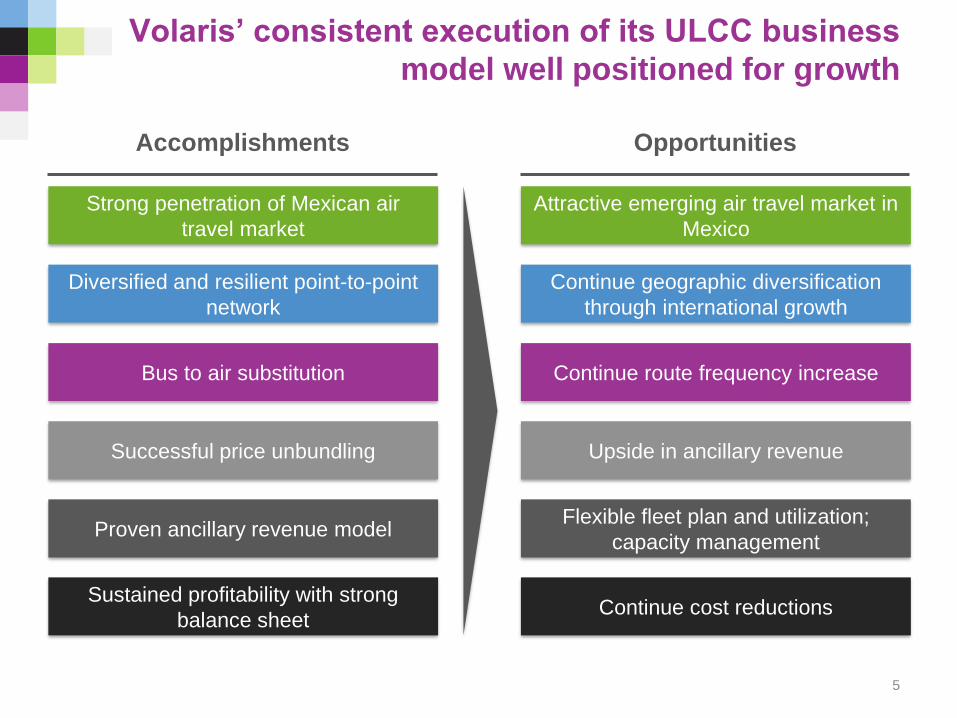
Volaris’ consistent execution of its ULCC business
model well positioned for growth
Diversified and resilient point-to-point
network
Successful price unbundling
Strong penetration of Mexican air
travel market
Proven ancillary revenue model
Bus to air substitution
Upside in ancillary revenue
Continue geographic diversification
through international growth
Attractive emerging air travel market in
Mexico
Flexible fleet plan and utilization;
capacity management
Sustained profitability with strong
balance sheet Continue cost reductions
Continue route frequency increase
OpportunitiesAccomplishments
5

Accomplishments
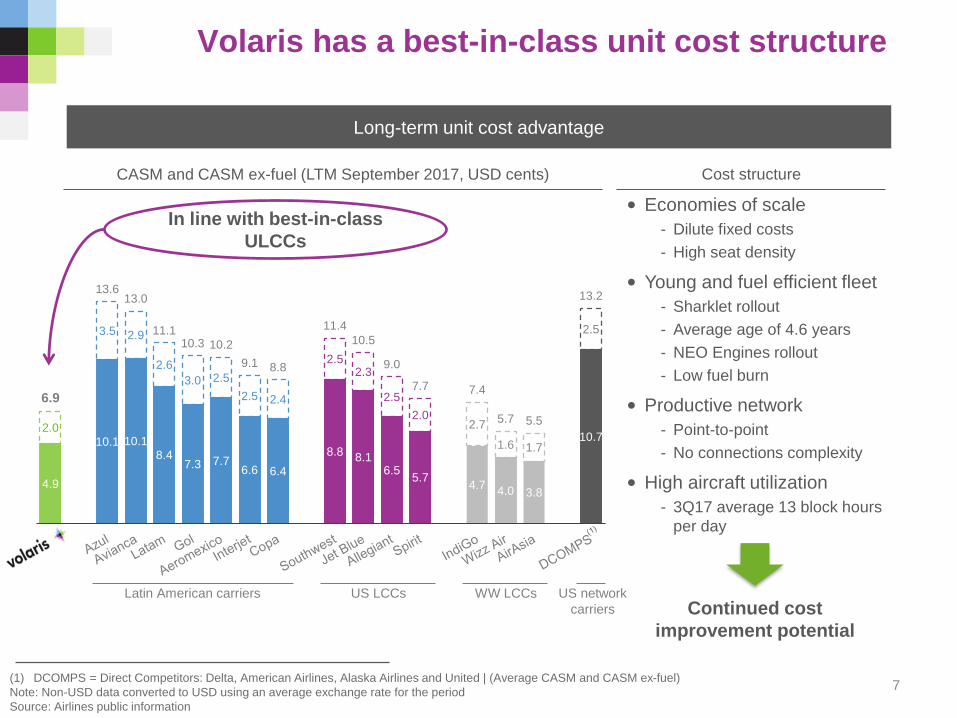
Volaris has a best-in-class unit cost structure
Long-term unit cost advantage
(1) DCOMPS = Direct Competitors: Delta, American Airlines, Alaska Airlines and United | (Average CASM and CASM ex-fuel)
Note: Non-USD data converted to USD using an average exchange rate for the period
Source: Airlines public information
CASM and CASM ex-fuel (LTM September 2017, USD cents) Cost structure
• Economies of scale
- Dilute fixed costs
- High seat density
• Young and fuel efficient fleet
- Sharklet rollout
- Average age of 4.6 years
- NEO Engines rollout
- Low fuel burn
• Productive network
- Point-to-point
- No connections complexity
• High aircraft utilization
- 3Q17 average 13 block hours
per day
Continued cost
improvement potential
7
4.9
10.1 10.18.4
7.3 7.76.6 6.4
8.8 8.16.5
5.74.7
4.0 3.8
10.72.0
3.5 2.9
2.6
3.0 2.5
2.5 2.4
2.52.3
2.5
2.02.7
1.6 1.7
2.5
6.9
13.613.0
11.110.3 10.2
9.1 8.8
11.4
10.5
9.0
7.7 7.4
5.7 5.5
13.2
In line with best-in-class
ULCCs
Latin American carriers US LCCs US network
carriers
WW LCCs
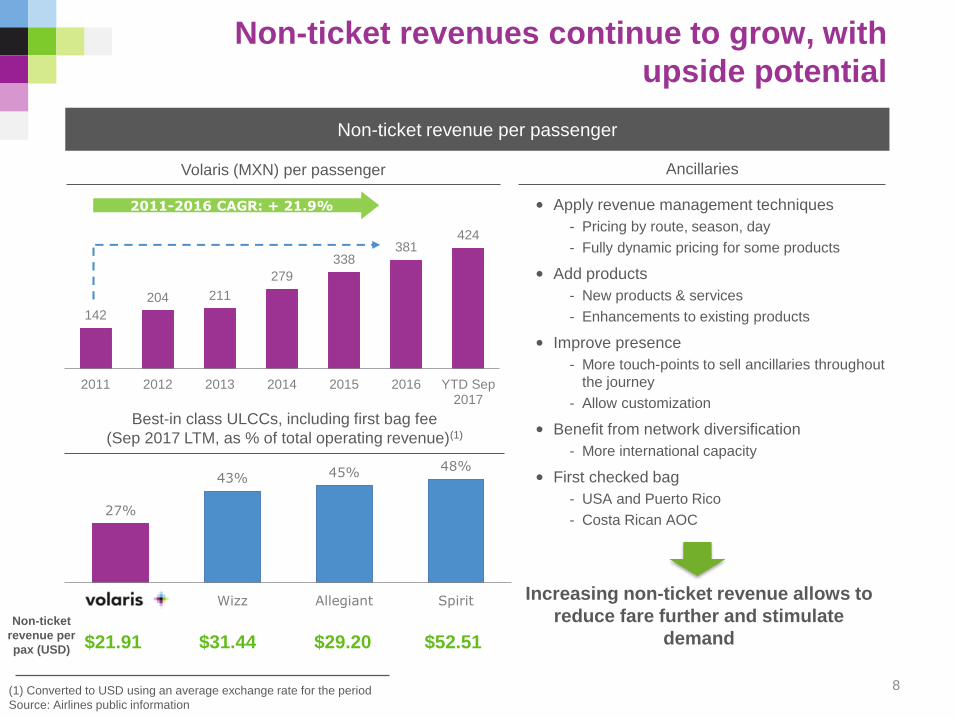
142
204 211
279
338381
424
2011 2012 2013 2014 2015 2016 YTD Sep2017
2011-2016 CAGR: + 21.9%
Non-ticket revenues continue to grow, with
upside potential
8(1) Converted to USD using an average exchange rate for the period
Source: Airlines public information
Non-ticket revenue per passenger
Volaris (MXN) per passenger
Best-in class ULCCs, including first bag fee
(Sep 2017 LTM, as % of total operating revenue)(1)
Ancillaries
• Apply revenue management techniques
- Pricing by route, season, day
- Fully dynamic pricing for some products
• Add products
- New products & services
- Enhancements to existing products
• Improve presence
- More touch-points to sell ancillaries throughout
the journey
- Allow customization
• Benefit from network diversification
- More international capacity
• First checked bag
- USA and Puerto Rico
- Costa Rican AOC
Increasing non-ticket revenue allows to
reduce fare further and stimulate
demandNon-ticket
revenue per
pax (USD) $21.91 $31.44 $29.20 $52.51
27%
43% 45% 48%
Volaris Wizz Allegiant Spirit
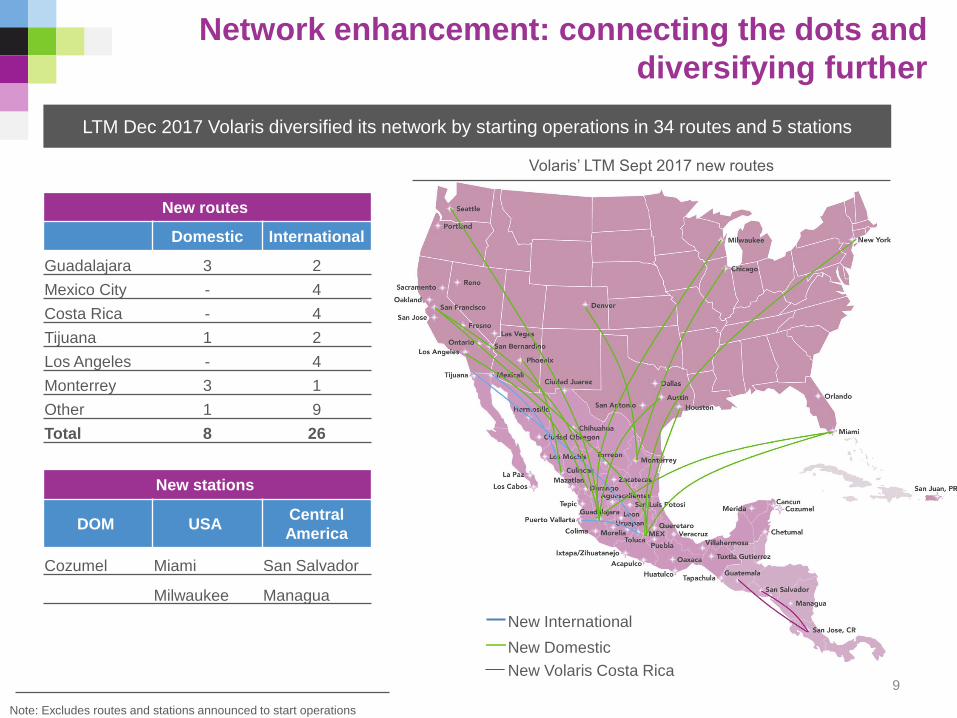
Network enhancement: connecting the dots and
diversifying further
Note: Excludes routes and stations announced to start operations
New routes
Domestic International
Guadalajara 3 2
Mexico City - 4
Costa Rica - 4
Tijuana 1 2
Los Angeles - 4
Monterrey 3 1
Other 1 9
Total 8 26
New stations
DOM USACentral
America
Cozumel Miami San Salvador
Milwaukee Managua
LTM Dec 2017 Volaris diversified its network by starting operations in 34 routes and 5 stations
Volaris’ LTM Sept 2017 new routes
9
New International
New Domestic
New Volaris Costa Rica
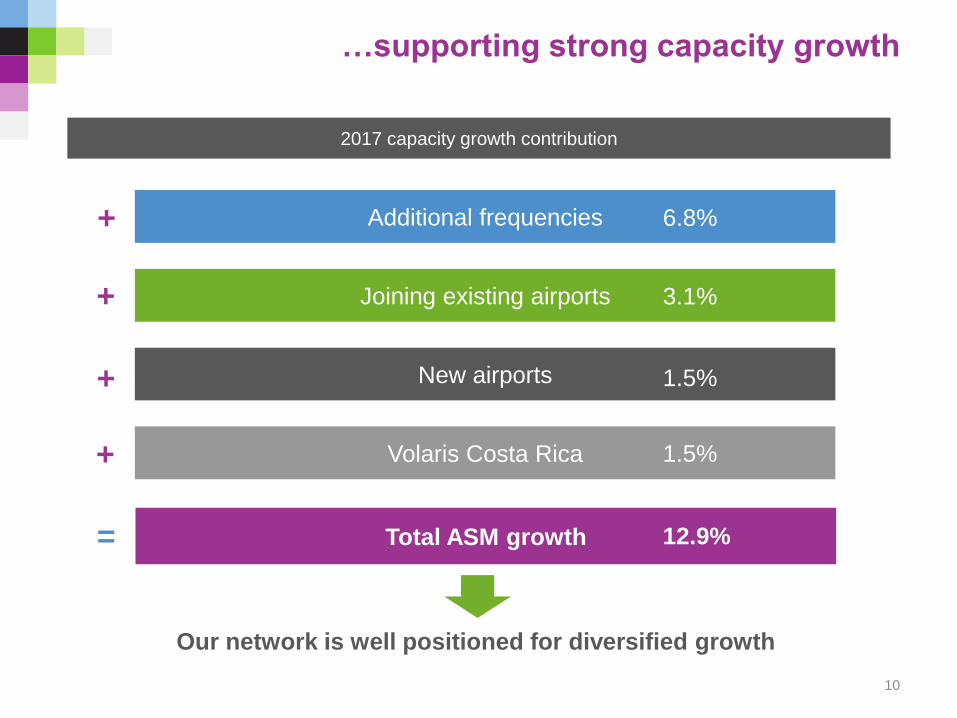
…supporting strong capacity growth
Joining existing airports
Additional frequencies
New airports
6.8%
3.1%
1.5%
Total ASM growth
2017 capacity growth contribution
12.9%
Our network is well positioned for diversified growth
=
+
+
+
Volaris Costa Rica 1.5%+
10

Growth opportunities
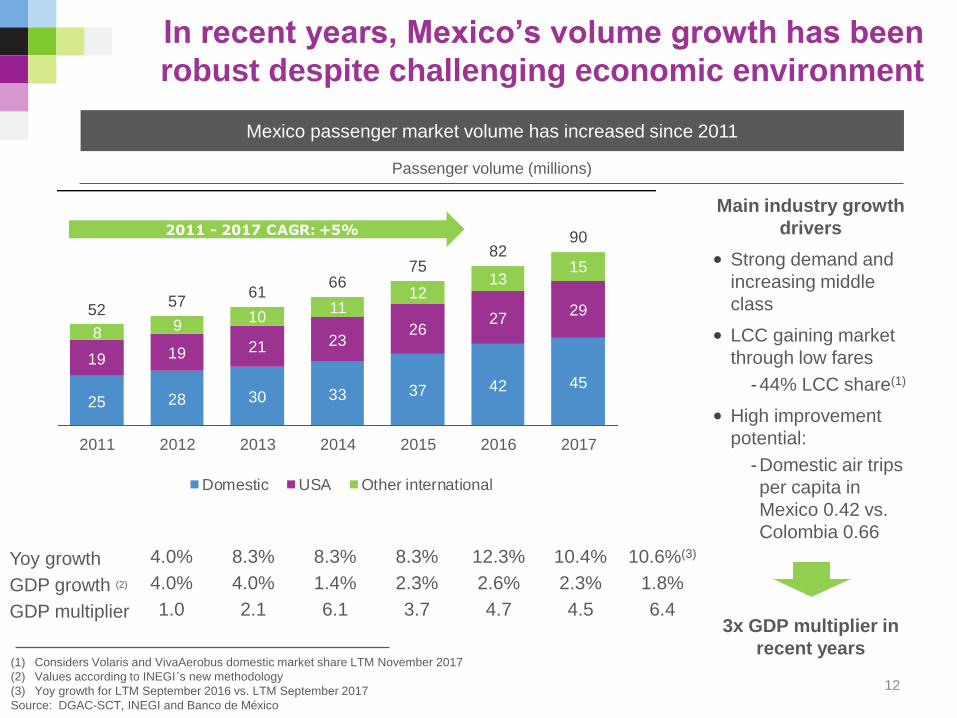
Yoy growth 4.0% 8.3% 8.3% 8.3% 12.3% 10.4% 10.6%(3)
GDP growth (2) 4.0% 4.0% 1.4% 2.3% 2.6% 2.3% 1.8%
GDP multiplier 1.0 2.1 6.1 3.7 4.7 4.5 6.4
In recent years, Mexico’s volume growth has been
robust despite challenging economic environment
(1) Considers Volaris and VivaAerobus domestic market share LTM November 2017
(2) Values according to INEGI´s new methodology
(3) Yoy growth for LTM September 2016 vs. LTM September 2017
Source: DGAC-SCT, INEGI and Banco de México
Mexico passenger market volume has increased since 2011
Passenger volume (millions)
12
Main industry growth
drivers
• Strong demand and
increasing middle
class
• LCC gaining market
through low fares
-44% LCC share(1)
• High improvement
potential:
-Domestic air trips
per capita in
Mexico 0.42 vs.
Colombia 0.66
3x GDP multiplier in
recent years
25 28 30 33 37 42 45
19 19 21 2326
2729
89
1011
1213
15
5257
6166
7582
90
2011 2012 2013 2014 2015 2016 2017
Domestic USA Other international
2011 - 2017 CAGR: +5%
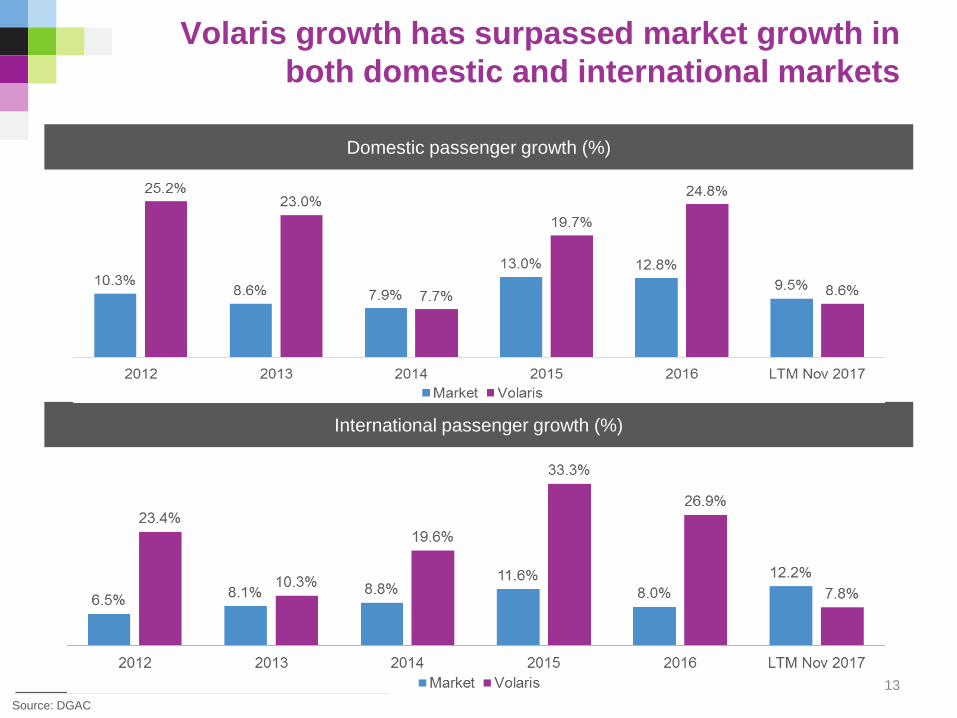
Domestic passenger growth (%)
Source: DGAC
Volaris growth has surpassed market growth in
both domestic and international markets
13
International passenger growth (%)
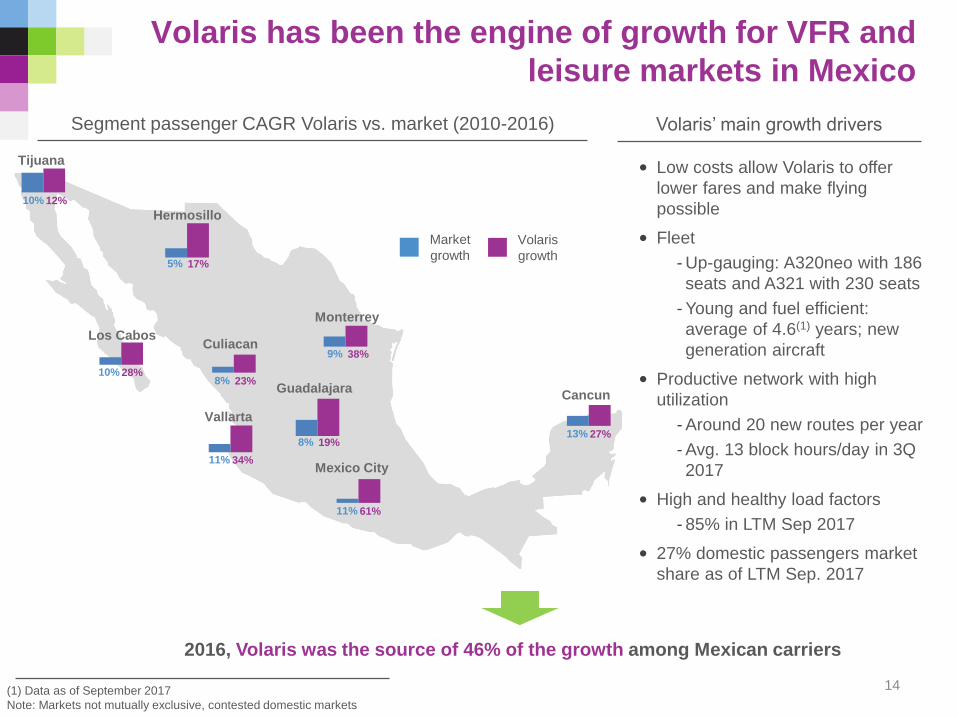
• Low costs allow Volaris to offer
lower fares and make flying
possible
• Fleet
- Up-gauging: A320neo with 186
seats and A321 with 230 seats
- Young and fuel efficient:
average of 4.6(1) years; new
generation aircraft
• Productive network with high
utilization
- Around 20 new routes per year
- Avg. 13 block hours/day in 3Q
2017
• High and healthy load factors
- 85% in LTM Sep 2017
• 27% domestic passengers market
share as of LTM Sep. 2017
Volaris has been the engine of growth for VFR and
leisure markets in Mexico
Market
growth
Volaris
growth
2016, Volaris was the source of 46% of the growth among Mexican carriers
(1) Data as of September 2017
Note: Markets not mutually exclusive, contested domestic markets
Volaris’ main growth driversSegment passenger CAGR Volaris vs. market (2010-2016)
14
Tijuana
Hermosillo
Los CabosCuliacan
Vallarta
Guadalajara
Mexico City
Cancun
Monterrey
10% 12%
5% 17%
10% 28%8% 23%
11% 34%
9% 38%
8% 19%
11% 61%
13% 27%
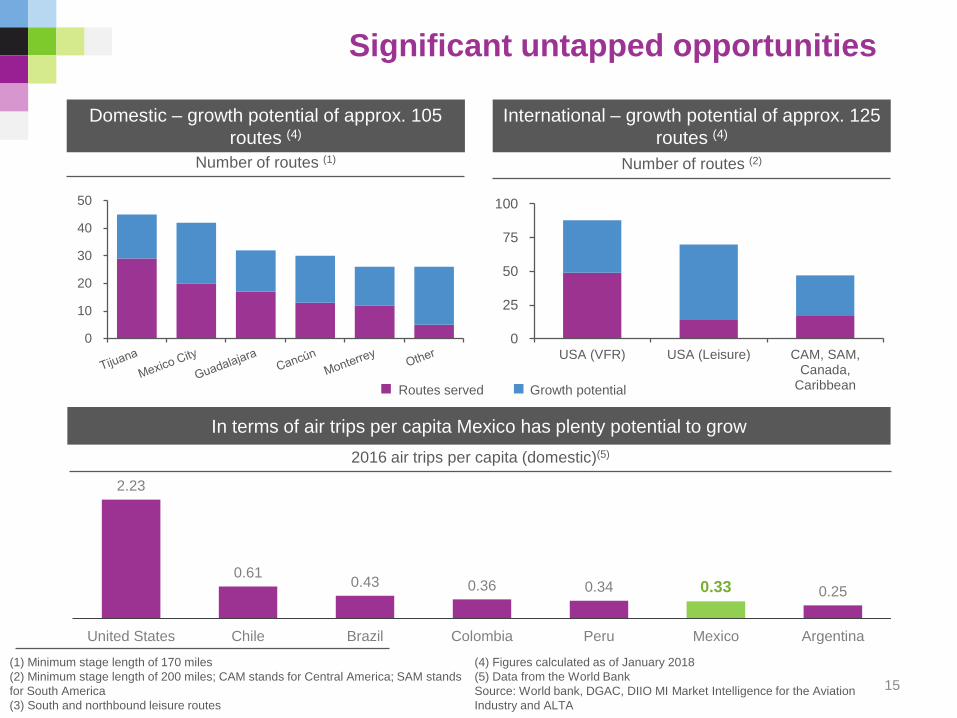
2.23
0.610.43 0.36 0.34 0.33 0.25
United States Chile Brazil Colombia Peru Mexico Argentina
Significant untapped opportunities
15
0
25
50
75
100
USA (VFR) USA (Leisure) CAM, SAM,Canada,
Caribbean
(1) Minimum stage length of 170 miles
(2) Minimum stage length of 200 miles; CAM stands for Central America; SAM stands
for South America
(3) South and northbound leisure routes
Domestic – growth potential of approx. 105
routes (4)
International – growth potential of approx. 125
routes (4)
Number of routes (1) Number of routes (2)
Routes served Growth potential
In terms of air trips per capita Mexico has plenty potential to grow
2016 air trips per capita (domestic)(5)
0
10
20
30
40
50
(4) Figures calculated as of January 2018
(5) Data from the World Bank
Source: World bank, DGAC, DIIO MI Market Intelligence for the Aviation
Industry and ALTA
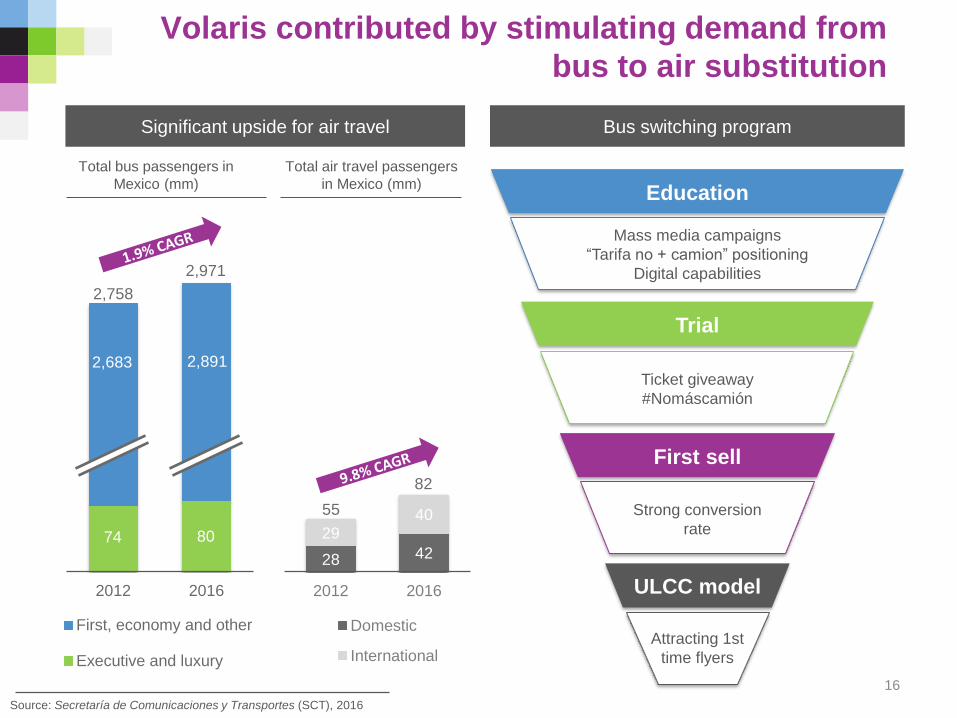
28 42
2940
2012 2016
Domestic
International
2012 2016
First, economy and other
Executive and luxury
Volaris contributed by stimulating demand from
bus to air substitution
Source: Secretaría de Comunicaciones y Transportes (SCT), 2016
Bus switching programSignificant upside for air travel
Total air travel passengers
in Mexico (mm)
Total bus passengers in
Mexico (mm)
2,758
33
16
Trial
Ticket giveaway
#Nomáscamión
First sell
Strong conversion
rate
ULCC model
Attracting 1st
time flyers
Mass media campaigns
“Tarifa no + camion” positioning
Digital capabilities
Education
2,971
2,683 2,891
74 80
55
82
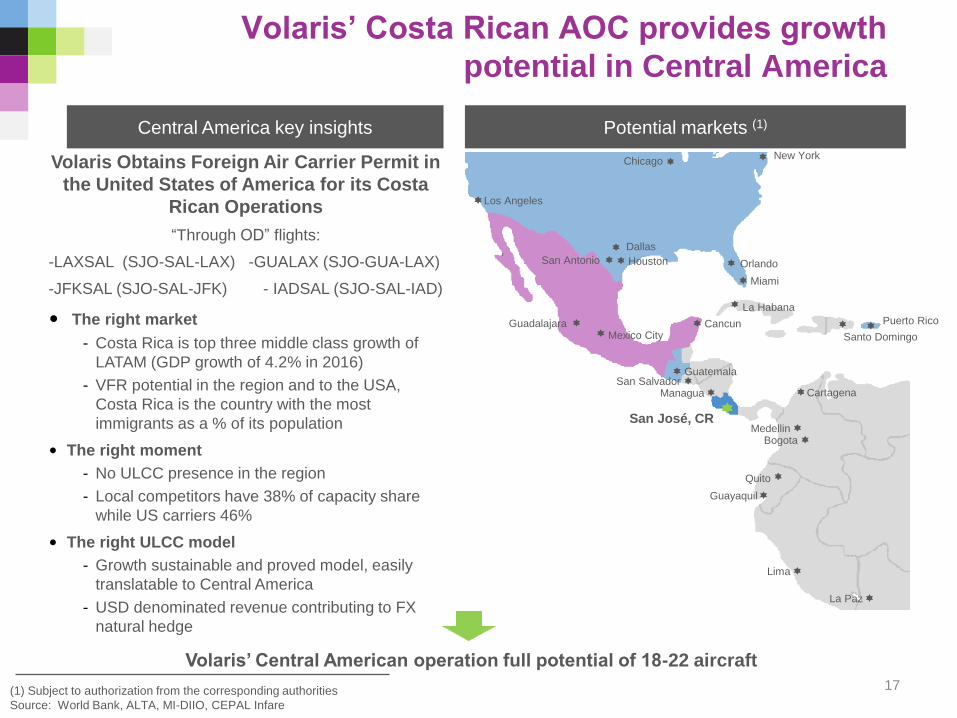
Volaris Obtains Foreign Air Carrier Permit in
the United States of America for its Costa
Rican Operations
“Through OD” flights:
-LAXSAL (SJO-SAL-LAX) -GUALAX (SJO-GUA-LAX)
-JFKSAL (SJO-SAL-JFK) - IADSAL (SJO-SAL-IAD)
• The right market
- Costa Rica is top three middle class growth of
LATAM (GDP growth of 4.2% in 2016)
- VFR potential in the region and to the USA,
Costa Rica is the country with the most
immigrants as a % of its population
• The right moment
- No ULCC presence in the region
- Local competitors have 38% of capacity share
while US carriers 46%
• The right ULCC model
- Growth sustainable and proved model, easily
translatable to Central America
- USD denominated revenue contributing to FX
natural hedge
Volaris’ Costa Rican AOC provides growth
potential in Central America
(1) Subject to authorization from the corresponding authorities
Source: World Bank, ALTA, MI-DIIO, CEPAL Infare
Potential markets (1)Central America key insights
17
Volaris’ Central American operation full potential of 18-22 aircraft
ChicagoNew York
Los Angeles
Dallas
HoustonSan Antonio Orlando
Miami
GuadalajaraMexico City
Cancun
Guatemala
San José, CR
Managua
MedellinBogota
Cartagena
Quito
Guayaquil
Lima
La Paz
San Salvador
La Habana
Santo Domingo
Puerto Rico
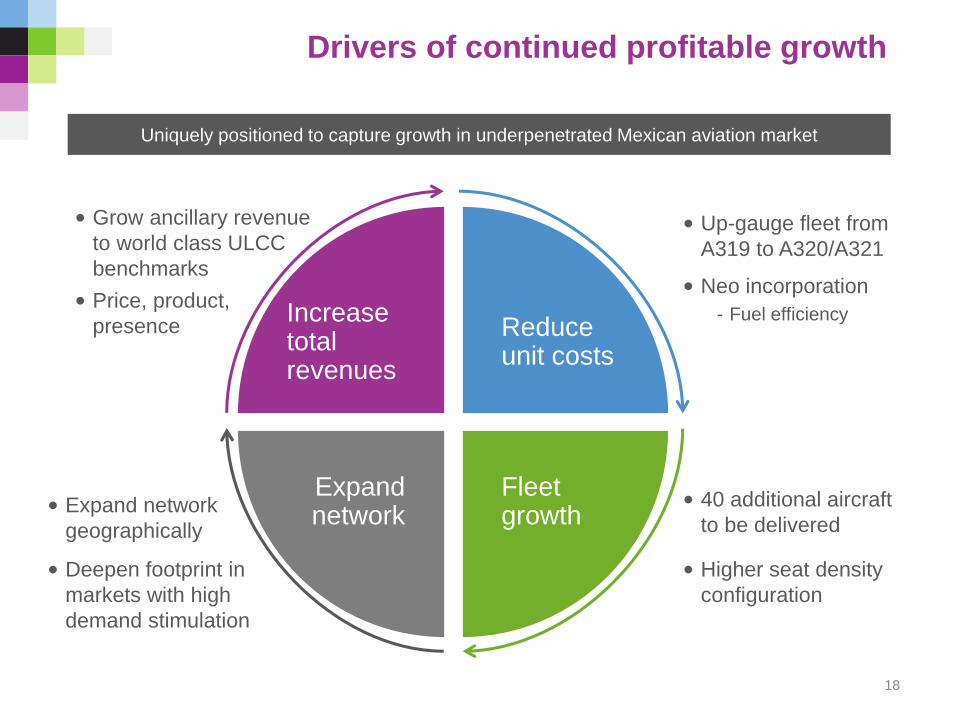
Drivers of continued profitable growth
Uniquely positioned to capture growth in underpenetrated Mexican aviation market
Reduce unit costs
Fleet growth
Expand network
Increase total revenues
• Deepen footprint in
markets with high
demand stimulation
• Grow ancillary revenue
to world class ULCC
benchmarks
• 40 additional aircraft
to be delivered
• Up-gauge fleet from
A319 to A320/A321
• Higher seat density
configuration
• Expand network
geographically
• Neo incorporation
- Fuel efficiency
18
• Price, product,
presence
Fleet and financials
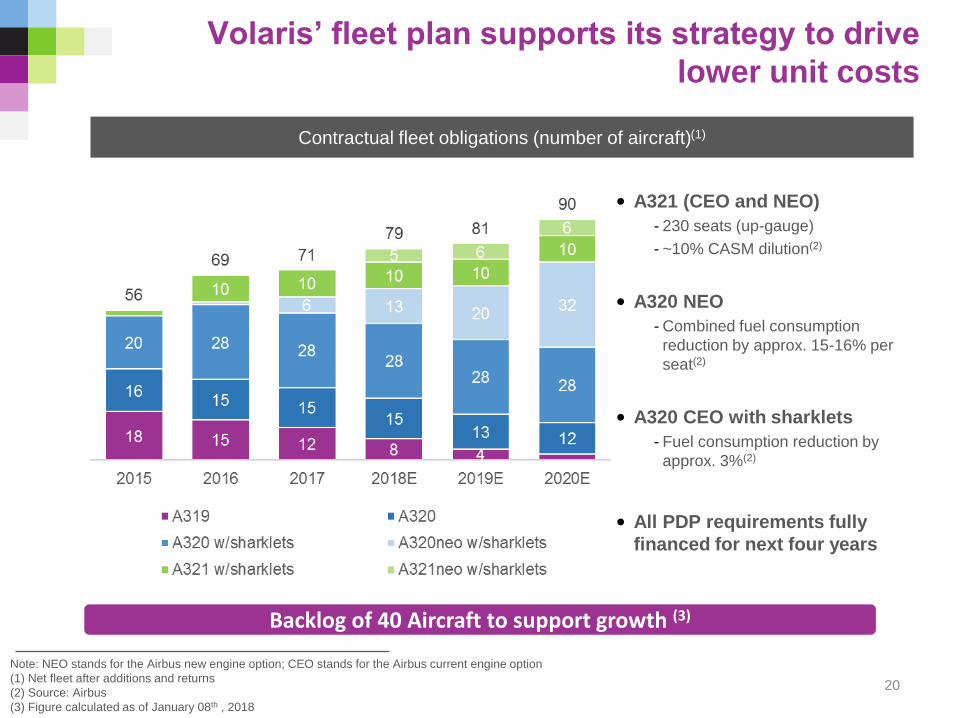
Volaris’ fleet plan supports its strategy to drive
lower unit costs
20
Note: NEO stands for the Airbus new engine option; CEO stands for the Airbus current engine option
(1) Net fleet after additions and returns
(2) Source: Airbus
(3) Figure calculated as of January 08th , 2018
• A321 (CEO and NEO)
- 230 seats (up-gauge)
- ~10% CASM dilution(2)
• A320 NEO
- Combined fuel consumption
reduction by approx. 15-16% per
seat(2)
• A320 CEO with sharklets
- Fuel consumption reduction by
approx. 3%(2)
• All PDP requirements fully
financed for next four years
Contractual fleet obligations (number of aircraft)(1)
Backlog of 40 Aircraft to support growth (3)
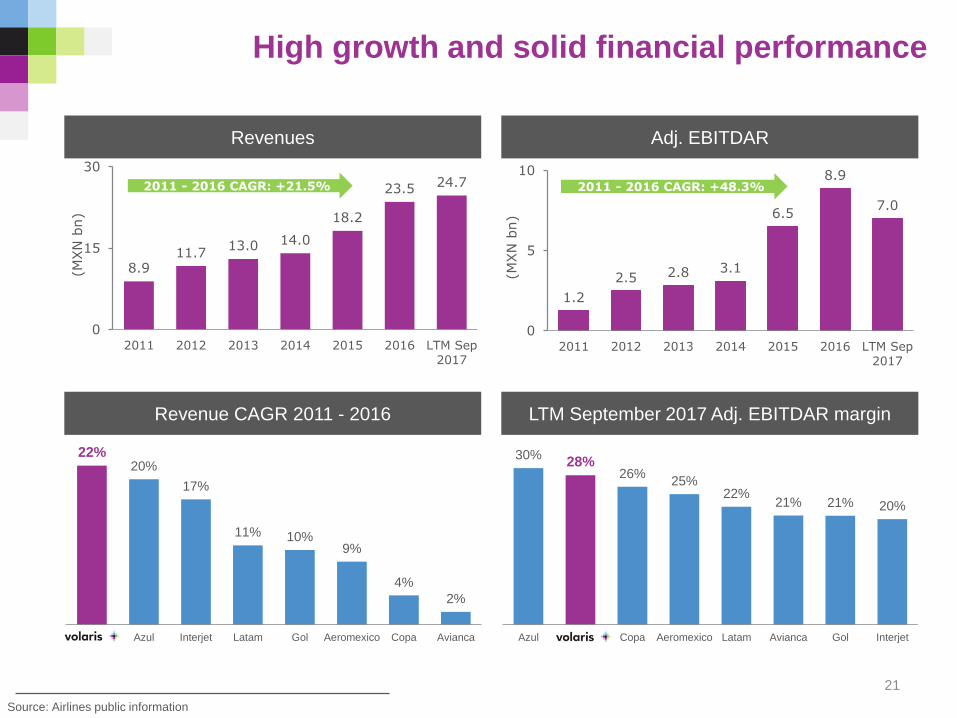
High growth and solid financial performance
21
Source: Airlines public information
Revenue CAGR 2011 - 2016
Revenues Adj. EBITDAR
LTM September 2017 Adj. EBITDAR margin
22%20%
17%
11% 10%9%
4%
2%
Volaris Azul Interjet Latam Gol Aeromexico Copa Avianca
8.911.7
13.0 14.0
18.2
23.5 24.7
0
15
30
2011 2012 2013 2014 2015 2016 LTM Sep
2017
(MXN
bn)
2011 - 2016 CAGR: +21.5%
1.2
2.5 2.8 3.1
6.5
8.9
7.0
0
5
10
2011 2012 2013 2014 2015 2016 LTM Sep
2017
(MXN
bn)
2011 - 2016 CAGR: +48.3%
30%28%
26%25%
22%21% 21% 20%
Azul Volaris Copa Aeromexico Latam Avianca Gol Interjet
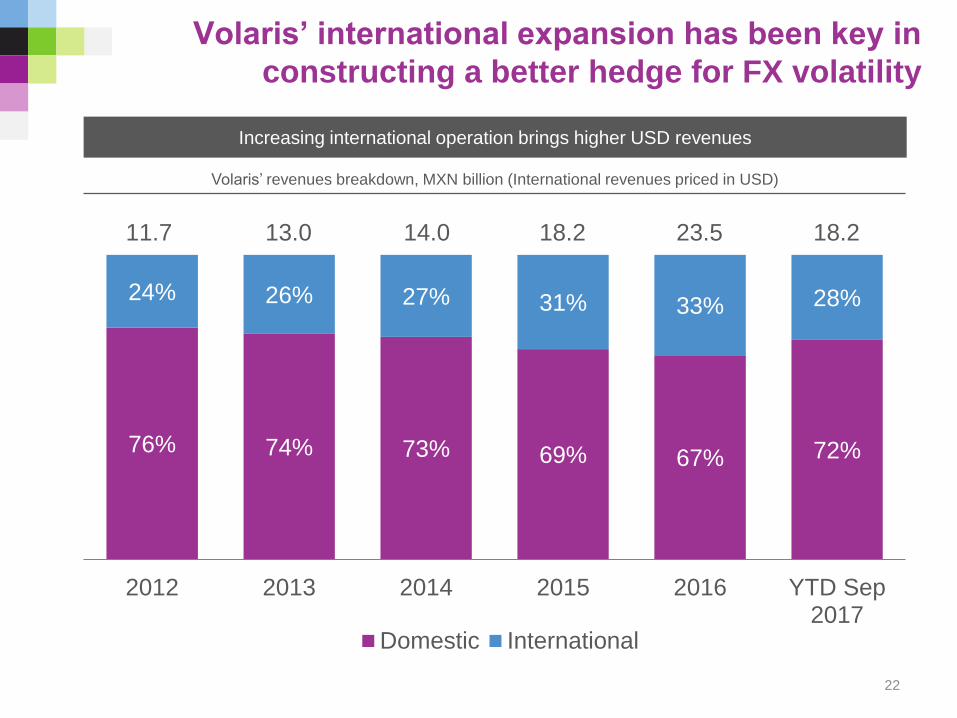
76% 74% 73% 69% 67% 72%
24% 26% 27% 31% 33% 28%
2012 2013 2014 2015 2016 YTD Sep2017
Domestic International
11.7 13.0 14.0 18.2 23.5 18.2
Increasing international operation brings higher USD revenues
Volaris’ international expansion has been key in
constructing a better hedge for FX volatility
22
Volaris’ revenues breakdown, MXN billion (International revenues priced in USD)
2.7x
4.8x5.1x 5.2x 5.3x
5.6x 5.6x
7.1x
Copa Azul Latam Aeromexico Gol Avianca Volaris Interjet
22%
12%
10% 9% 9%
7% 7% 6%
Volaris Avianca Copa Latam Aeromexico Interjet Azul Gol
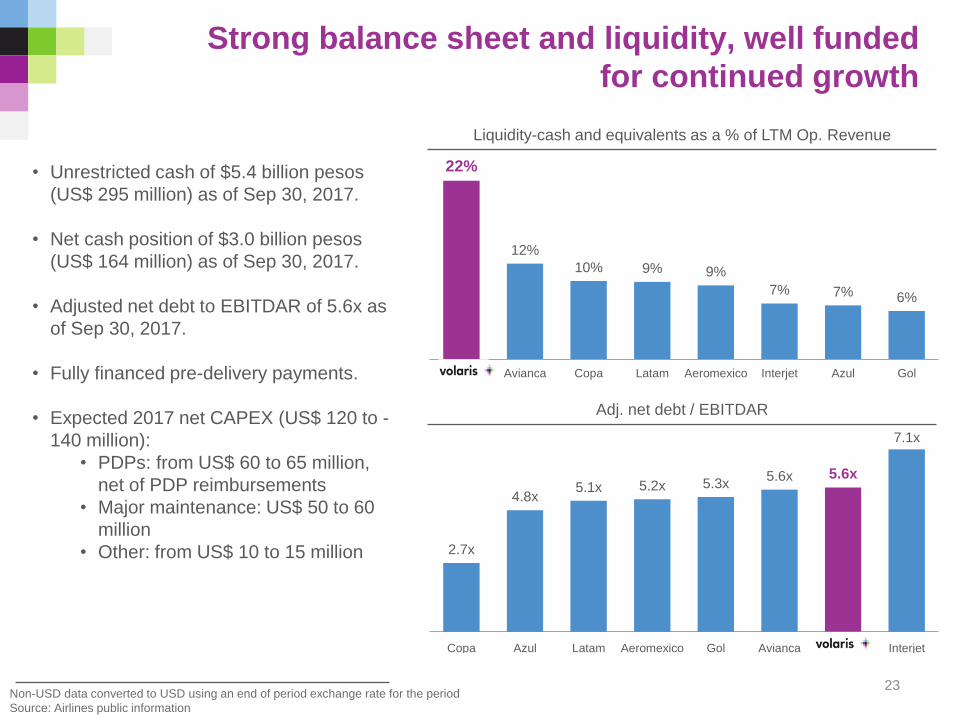
Strong balance sheet and liquidity, well funded
for continued growth
23
Adj. net debt / EBITDAR
Liquidity-cash and equivalents as a % of LTM Op. Revenue
• Unrestricted cash of $5.4 billion pesos
(US$ 295 million) as of Sep 30, 2017.
• Net cash position of $3.0 billion pesos
(US$ 164 million) as of Sep 30, 2017.
• Adjusted net debt to EBITDAR of 5.6x as
of Sep 30, 2017.
• Fully financed pre-delivery payments.
• Expected 2017 net CAPEX (US$ 120 to -
140 million):
• PDPs: from US$ 60 to 65 million,
net of PDP reimbursements
• Major maintenance: US$ 50 to 60
million
• Other: from US$ 10 to 15 million
Non-USD data converted to USD using an end of period exchange rate for the period
Source: Airlines public information
Appendix
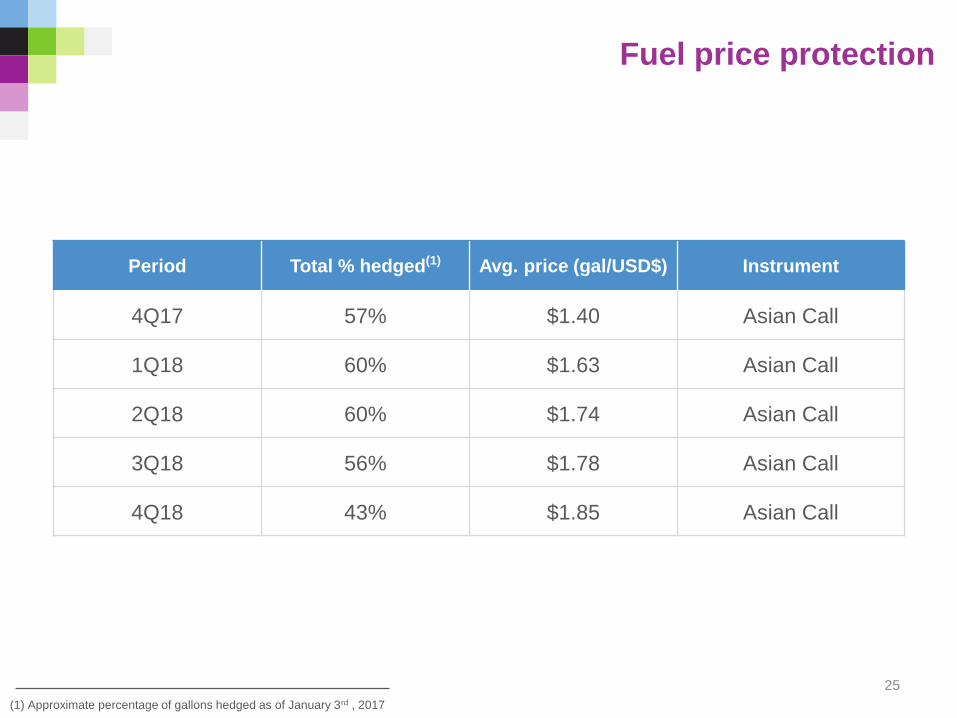
Fuel price protection
25
(1) Approximate percentage of gallons hedged as of January 3rd , 2017
Period Total % hedged(1) Avg. price (gal/USD$) Instrument
4Q17 57% $1.40 Asian Call
1Q18 60% $1.63 Asian Call
2Q18 60% $1.74 Asian Call
3Q18 56% $1.78 Asian Call
4Q18 43% $1.85 Asian Call
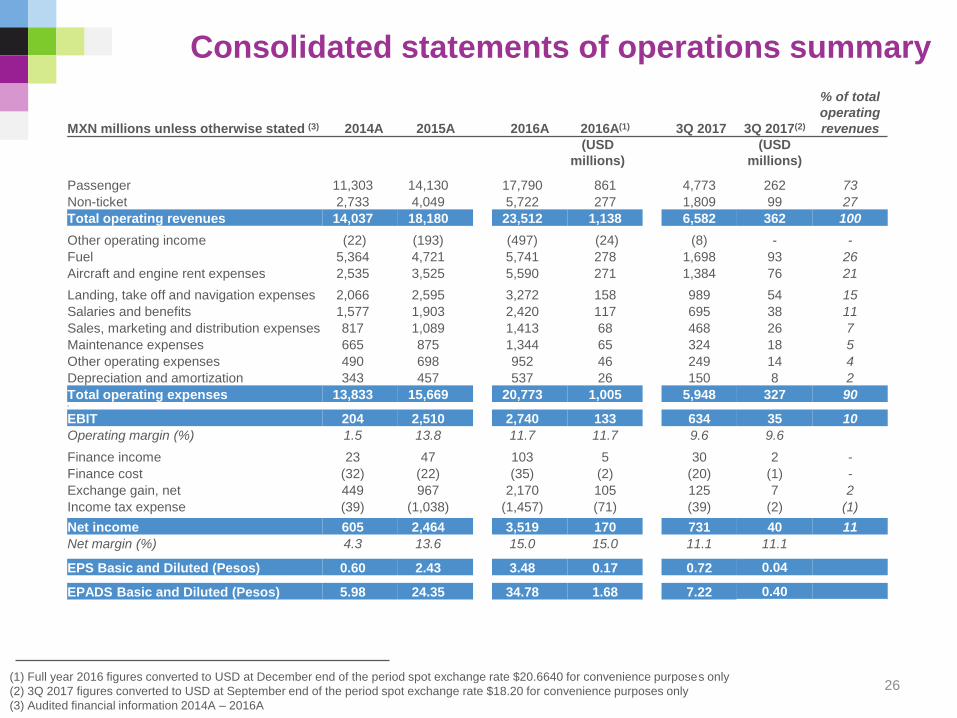
(1) Full year 2016 figures converted to USD at December end of the period spot exchange rate $20.6640 for convenience purposes only
(2) 3Q 2017 figures converted to USD at September end of the period spot exchange rate $18.20 for convenience purposes only
(3) Audited financial information 2014A – 2016A
Consolidated statements of operations summary
MXN millions unless otherwise stated (3) 2014A 2015A 2016A 2016A(1) 3Q 2017 3Q 2017(2)
% of total
operating
revenues
(USD
millions)
(USD
millions)
Passenger 11,303 14,130 17,790 861 4,773 262 73
Non-ticket 2,733 4,049 5,722 277 1,809 99 27
Total operating revenues 14,037 18,180 23,512 1,138 6,582 362 100
Other operating income (22) (193) (497) (24) (8) - -
Fuel 5,364 4,721 5,741 278 1,698 93 26
Aircraft and engine rent expenses 2,535 3,525 5,590 271 1,384 76 21
Landing, take off and navigation expenses 2,066 2,595 3,272 158 989 54 15
Salaries and benefits 1,577 1,903 2,420 117 695 38 11
Sales, marketing and distribution expenses 817 1,089 1,413 68 468 26 7
Maintenance expenses 665 875 1,344 65 324 18 5
Other operating expenses 490 698 952 46 249 14 4
Depreciation and amortization 343 457 537 26 150 8 2
Total operating expenses 13,833 15,669 20,773 1,005 5,948 327 906
EBIT 204 2,510 2,740 133 634 35 10
Operating margin (%) 1.5 13.8 11.7 11.7 9.6 9.6
Finance income 23 47 103 5 30 2 -
Finance cost (32) (22) (35) (2) (20) (1) -
Exchange gain, net 449 967 2,170 105 125 7 2
Income tax expense (39) (1,038) (1,457) (71) (39) (2) (1)
Net income 605 2,464 3,519 170 731 40 11
Net margin (%) 4.3 13.6 15.0 15.0 11.1 11.1
EPS Basic and Diluted (Pesos) 0.60 2.43 3.48 0.17 0.72 0.04
EPADS Basic and Diluted (Pesos) 5.98 24.35 34.78 1.68 7.22 0.40
26
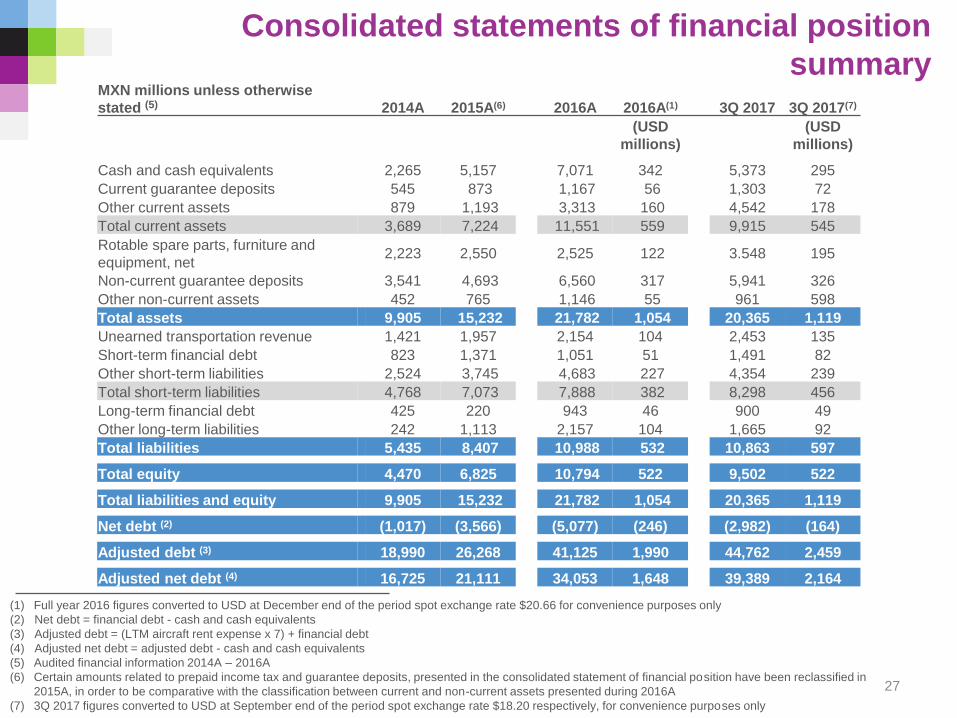
Consolidated statements of financial position
summary
(1) Full year 2016 figures converted to USD at December end of the period spot exchange rate $20.66 for convenience purposes only
(2) Net debt = financial debt - cash and cash equivalents
(3) Adjusted debt = (LTM aircraft rent expense x 7) + financial debt
(4) Adjusted net debt = adjusted debt - cash and cash equivalents
(5) Audited financial information 2014A – 2016A
(6) Certain amounts related to prepaid income tax and guarantee deposits, presented in the consolidated statement of financial position have been reclassified in
2015A, in order to be comparative with the classification between current and non-current assets presented during 2016A
(7) 3Q 2017 figures converted to USD at September end of the period spot exchange rate $18.20 respectively, for convenience purposes only
MXN millions unless otherwise
stated (5) 2014A 2015A(6) 2016A 2016A(1) 3Q 2017 3Q 2017(7)
(USD
millions)
(USD
millions)
Cash and cash equivalents 2,265 5,157 7,071 342 5,373 295
Current guarantee deposits 545 873 1,167 56 1,303 72
Other current assets 879 1,193 3,313 160 4,542 178
Total current assets 3,689 7,224 11,551 559 9,915 545
Rotable spare parts, furniture and
equipment, net2,223 2,550 2,525 122 3.548 195
Non-current guarantee deposits 3,541 4,693 6,560 317 5,941 326
Other non-current assets 452 765 1,146 55 961 598
Total assets 9,905 15,232 21,782 1,054 20,365 1,119
Unearned transportation revenue 1,421 1,957 2,154 104 2,453 135
Short-term financial debt 823 1,371 1,051 51 1,491 82
Other short-term liabilities 2,524 3,745 4,683 227 4,354 239
Total short-term liabilities 4,768 7,073 7,888 382 8,298 456
Long-term financial debt 425 220 943 46 900 49
Other long-term liabilities 242 1,113 2,157 104 1,665 92
Total liabilities 5,435 8,407 10,988 532 10,863 597
Total equity 4,470 6,825 10,794 522 9,502 522
Total liabilities and equity 9,905 15,232 21,782 1,054 20,365 1,119
Net debt (2) (1,017) (3,566) (5,077) (246) (2,982) (164)
Adjusted debt (3) 18,990 26,268 41,125 1,990 44,762 2,459
Adjusted net debt (4) 16,725 21,111 34,053 1,648 39,389 2,164
27
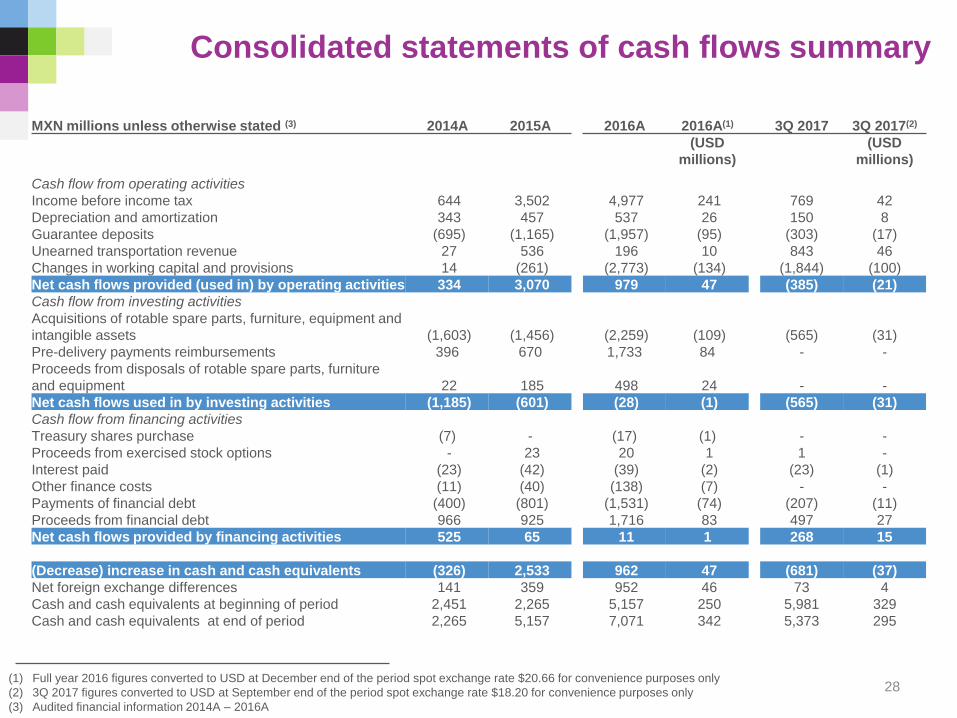
Consolidated statements of cash flows summary
(1) Full year 2016 figures converted to USD at December end of the period spot exchange rate $20.66 for convenience purposes only
(2) 3Q 2017 figures converted to USD at September end of the period spot exchange rate $18.20 for convenience purposes only
(3) Audited financial information 2014A – 2016A
MXN millions unless otherwise stated (3) 2014A 2015A 2016A 2016A(1) 3Q 2017 3Q 2017(2)
(USD
millions)
(USD
millions)
Cash flow from operating activities
Income before income tax 644 3,502 4,977 241 769 42
Depreciation and amortization 343 457 537 26 150 8
Guarantee deposits (695) (1,165) (1,957) (95) (303) (17)
Unearned transportation revenue 27 536 196 10 843 46
Changes in working capital and provisions 14 (261) (2,773) (134) (1,844) (100)
Net cash flows provided (used in) by operating activities 334 3,070 979 47 (385) (21)
Cash flow from investing activities
Acquisitions of rotable spare parts, furniture, equipment and
intangible assets (1,603) (1,456) (2,259) (109) (565) (31)
Pre-delivery payments reimbursements 396 670 1,733 84 - -
Proceeds from disposals of rotable spare parts, furniture
and equipment 22 185 498 24 - -
Net cash flows used in by investing activities (1,185) (601) (28) (1) (565) (31)
Cash flow from financing activities
Treasury shares purchase (7) - (17) (1) - -
Proceeds from exercised stock options - 23 20 1 1 -
Interest paid (23) (42) (39) (2) (23) (1)
Other finance costs (11) (40) (138) (7) - -
Payments of financial debt (400) (801) (1,531) (74) (207) (11)
Proceeds from financial debt 966 925 1,716 83 497 27
Net cash flows provided by financing activities 525 65 11 1 268 15
(Decrease) increase in cash and cash equivalents (326) 2,533 962 47 (681) (37)
Net foreign exchange differences 141 359 952 46 73 4
Cash and cash equivalents at beginning of period 2,451 2,265 5,157 250 5,981 329
Cash and cash equivalents at end of period 2,265 5,157 7,071 342 5,373 295
28