vivekananda international foundation - vifindia.org · ©vivekananda international foundation...
TRANSCRIPT

VIF Paper December 2017
Amb Prabhat Prakash Shukla
Vivekananda International Foundation

Page 2 of 32
http://www.vifindia.org ©Vivekananda International Foundation
About the Author
Prabhat Prakash Shukla is an alumnus of Delhi
School of Economics. Following his Masters, he
joined the Indian Foreign Service in 1974. During a
career spanning 37 years, he served in Moscow,
Brussels, London and Kathmandu, among other
places. He served in Delhi twice, including as the
Diplomatic Adviser to the Prime Minister from 1996 to 2000. He retired in
2011 as Ambassador of India to Moscow and is currently a Distinguished
Fellow in the Vivekananda International Foundation, New Delhi.

Page 3 of 32
http://www.vifindia.org ©Vivekananda International Foundation
Where Economics and Strategy Intersect: A Political Economy Approach to Global Power
Introduction
This essay attempts to understand the role of economic power in shaping
the world since the Second World War. It focuses on the main strand of
economic developments over this period, and it is important to clarify what
it does not do. It does not look at subsidiary (or, at best, parallel) processes,
important though they also were, processes such as the Cold War or the
limited détente that began in the early 1970s. It also ignores the quiet
struggle between the UK and the US over economic influence until about
the mid-1960s.
This point may require a little elucidation. It is not that the Cold War or
détente were less important. But their importance lay in the military and
strategic arenas – the détente of the 1970s in particular was of historic
significance, but that was because of the cross-recognition of the two
Germanys (thus ending the uncertainty of the early 1960s when Kennedy,
Khrushchev, and Erhard led the United States, Soviet Union and West
Germany respectively) and of the Oder-Neisse frontier; and, of course, the
limitation of nuclear arms. But from the economic point of view, these
processes were put in the shade by the much bigger magnitudes of capital
flows in the West and among the oil producers.
Equally, it ignores the emerging challenges to the US domination of the
World Economy in recent years. It does not, thus, look at the Chinese Belt
and Road Initiative (that has been done separately), or the emergence of
crypto currencies, nor does it look at the Russian (and possibly Chinese)
drive for a gold-backed alternative to the US dollar. All these are
unquestionably important, but at the moment, their success is far from
assured. There is time before these need to be the subjects of detailed
study.
The First Phase: European Recovery and US External Imbalances
The study begins with the European Recovery Programme, or the Marshall
Plan, as it is more commonly known, which ran from 1948 to end of 1951.

Page 4 of 32
http://www.vifindia.org ©Vivekananda International Foundation
By way of backdrop, the Bretton Woods institutions – the International
Monetary Fund (IMF) and the World Bank – had been established and had
placed the US Dollar at the centre of the international financial system. It
was the only currency that was convertible into gold at a fixed price ($35
per ounce) and all other currencies were fixed in relation to the dollar.
Devaluations beyond a narrow range could only be done with IMF
permission where the US had veto voting power and were only permitted
in cases of “fundamental disequilibrium” which was not defined.
Marshall Aid turned out to be necessary because the European recovery
after the war was slow in coming. By 1946-47, there were signs of serious
unrest and the fear of Communist advances if the economies of the
countries were not to show some quick and substantial improvement. Two
features of Marshall Aid are worth highlighting. First, it was large. The total
value over the period 1948 to 1952 was approximately $12.5 billion (in
current dollars, a bit over $450 billion, using gold prices as the convertor).
The US Gross Domestic Product (GDP) in 1952 was a little under $60
billion. What this did was to leave little American assistance for other
countries – a point frequently made by US officials in discussions with
other countries, including India.
The second feature was that it marked the line of cleavage in the Cold War.
The countries that accepted the aid were: Austria, Belgium, Denmark,
France, Greece, Iceland, Italy, Luxembourg, the Netherlands, Norway,
Portugal, Sweden, Switzerland, Turkey, and the United Kingdom as well as
the bizone of Germany, later to become the Federal Republic of Germany
(FRG). Those that rejected US assistance were the USSR, Albania, Bulgaria,
Czechoslovakia, Hungary, Poland, Romania and of course, the Soviet part of
Germany, later to become the German Democratic Republic (GDR). These
countries formed the Warsaw Pact and the Soviet-led economic
cooperation arrangement under the Council for Mutual Economic
Assistance (COMECON). Finland, though a capitalist country also refused
Marshall Aid. It became a byword through the Cold War for sensitivity to
Soviet concerns, and gave the term ‘Finlandisation’ to the discourse during
those years. Yugoslavia, part of the Communist International (Comintern)
in 1948, rejected Marshall Aid, but in 1949 asked to be included. It did
receive US assistance, but outside of Marshall Aid.

Page 5 of 32
http://www.vifindia.org ©Vivekananda International Foundation
These European countries also committed to accept the “friendly advice” of
the US to develop economic integration among themselves, including West
Germany. This served the dual purpose of tying the FRG with the West
economically, which was a major goal, because the country had not yet
been taken into North Atlantic Treaty Organization (NATO) – that was to
happen in 1955, after the failure of the European Defence Community. The
second major objective was to find a large enough economic area to absorb
the investment already made in the oil industry in West Asia including the
pipelines that were to transport Saudi and other oil into Europe. The
important thing in this connection is to note is how the money was used.
Over 10 per cent was spent on oil imports, almost entirely from the Middle
East, and a slightly smaller amount was spent on transport – also oil fired,
or undergoing conversion from coal to oil.i This marked the beginning of a
three-way economic commitment involving the US, those parts of Europe
that accepted Marshall Aid, and West Asia, with Saudi Arabia at its centre. A
little bit of background to this development may add clarity as regards the
drivers of these changes.
As far back as December 1943, while the Second World War was still on –
but after the German surrender at Stalingrad had determined the outcome,
and the Teheran Conference between Roosevelt, Stalin and Churchill had
just ended – the oil company California Arabian Standard Oil Co (later
ARAMCO) requested the US Administration for permission and backing to
supply oil from Saudi Arabia to West European markets. In short order, this
request was approved and finance amounting to a maximum of $160
million was also provided to be repaid over 25 years. Certain conditions
were attached, including building up a reserve, and that ARAMCO (its new
name from January 1944 on) would not sell oil to any party deemed
inimical to the US interests by the State Department.ii
By April 1944, the policy was elaborated in greater detail. The Inter-
Divisional Petroleum Committee of the State Department announced its
aims with regard to Middle East oil in the following terms:
“Facilitation, by international agreement and otherwise, of substantial
and orderly expansion of production in Eastern Hemisphere sources of
supply, principally in the Middle East, to meet increasing requirements
of post-war markets removal, by international agreement and
Page 6 of 32
http://www.vifindia.org ©Vivekananda International Foundation
otherwise, of impediments to the exploitation of Middle Eastern
concessions held by United States nationals.”iii
The phrase “by international agreement and otherwise” catches the eye –
diplomat-speak for the use of coercion if persuasion were not to work. And
it was used on a regular basis – in Syria in 1949, in Iran in 1953, in the Suez
in 1956, to name a few. But the more important purpose of discussing the
role of oil is to bring out its importance for the US, an aspect that will
feature in a bigger way in the discussion of developments in the
international economy in the late 1960s and early 1970s.
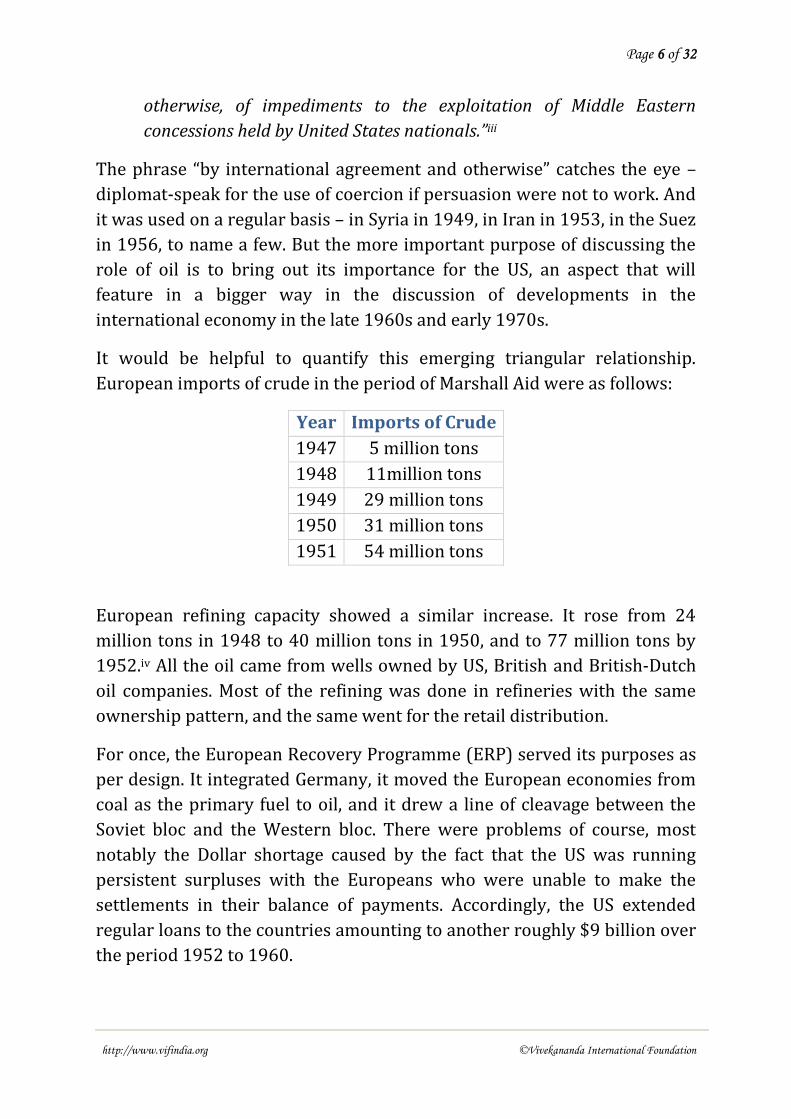
It would be helpful to quantify this emerging triangular relationship.
European imports of crude in the period of Marshall Aid were as follows:
Year Imports of Crude
1947 5 million tons
1948 11million tons
1949 29 million tons
1950 31 million tons
1951 54 million tons
European refining capacity showed a similar increase. It rose from 24
million tons in 1948 to 40 million tons in 1950, and to 77 million tons by
1952.iv All the oil came from wells owned by US, British and British-Dutch
oil companies. Most of the refining was done in refineries with the same
ownership pattern, and the same went for the retail distribution.
For once, the European Recovery Programme (ERP) served its purposes as
per design. It integrated Germany, it moved the European economies from
coal as the primary fuel to oil, and it drew a line of cleavage between the
Soviet bloc and the Western bloc. There were problems of course, most
notably the Dollar shortage caused by the fact that the US was running
persistent surpluses with the Europeans who were unable to make the
settlements in their balance of payments. Accordingly, the US extended
regular loans to the countries amounting to another roughly $9 billion over
the period 1952 to 1960.
Page 7 of 32
http://www.vifindia.org ©Vivekananda International Foundation
By this latter date the success of the ERP was well established and the
member-states were running surpluses with the rest of the world, so that
they could make their currencies convertible on current account. In 1957,
six of the leading countries of the ERP – France, West Germany, Italy,
Belgium, Netherlands and Luxembourg - set up the European Economic
Community (EEC), and thus began a period of changing trade patterns
between the US and Europe and, by extension, in the global economy.
The reason was that, as the European surpluses grew, and with it, the fear
that the US dollar would face devaluation pressures, countries such as
France asked to redeem their dollar holdings into gold. This was the period
of fixed exchange rates, and dollar convertibility into gold at the fixed
parity of $35 per ounce. This faced the US with a double dilemma – how to
preserve the Bretton Woods system, with fixed exchange rates and
convertibility into gold, and yet fix the persistent and growing trade
deficits. At the same time, they also wanted to provide for the growing
liquidity needed to finance the rapidly growing global trade – growing
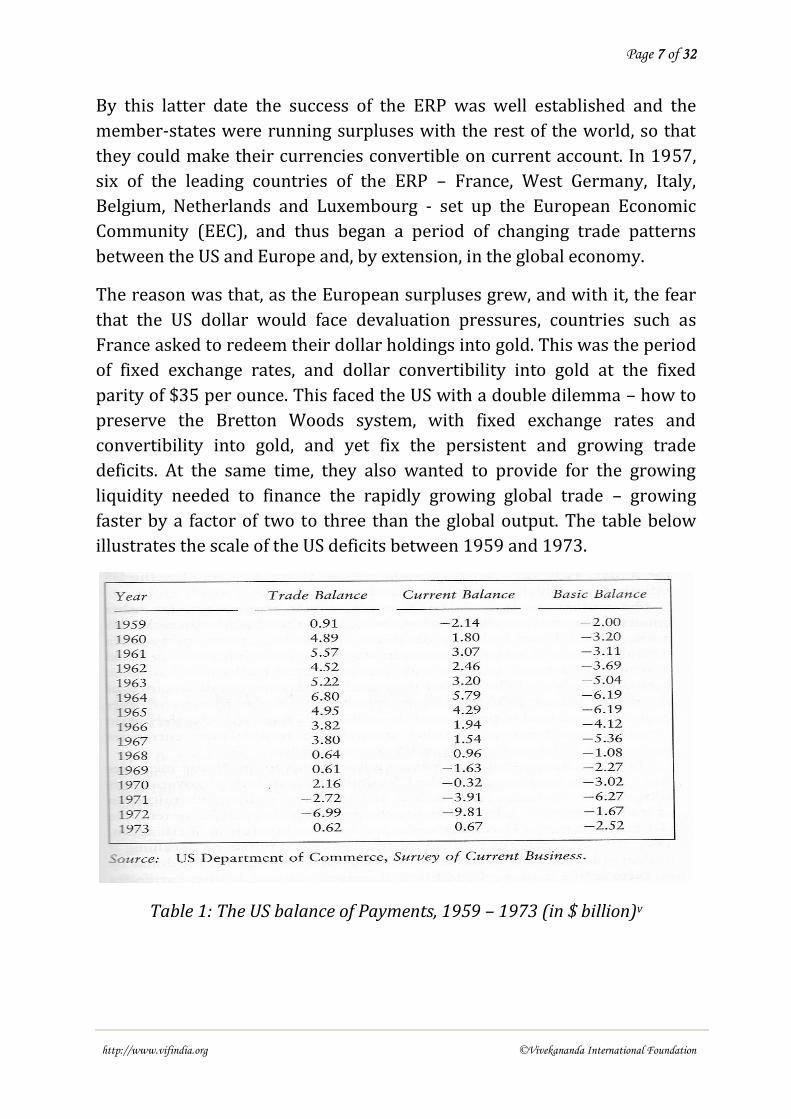
faster by a factor of two to three than the global output. The table below
illustrates the scale of the US deficits between 1959 and 1973.
Table 1: The US balance of Payments, 1959 – 1973 (in $ billion)v

Page 8 of 32
http://www.vifindia.org ©Vivekananda International Foundation
The Second Phase: The Oil-Finance Cycle and Financialization
In actual fact, as the US archives show, the problem between Europe (and,
increasingly, Japan) on the one hand and the US on the other was more
acute than these figures suggest, for the deficits of the US with those
countries were larger. Several ideas were at this stage floating in the Nixon
Administration by 1969, but the dominant theme was that a devaluation of
the dollar was the way to fix the persistent trade deficit. After an initial
minor adjustment, which did not yield the desired result, Nixon took the
step in August 1971 of taking the dollar off gold, and imposed domestic
price controls as well as import tariffs of 10 per cent across the board.
The availability of monetary gold was the obvious constraint on the
issuance of dollars in the period when the dollar was linked to gold, for that
was the second problem in using the dollar as the international currency
for financing trade. It is revealing therefore that the South Africans were
running their mines at full capacity, and, in 1970, produced the highest
output in their history, as the chart below shows. This amount, 1000 tons in
1970, represented two-thirds of the world output. But even this amount
was not sufficient to meet the requirement and it tapered off once the gold
window closed.
Figure 1: South African Gold Production 1940 - 2012vi

Page 9 of 32
http://www.vifindia.org ©Vivekananda International Foundation
In the event, this did not help the external balance except for a short while,
and the downward pressure on the dollar continued. Nor was the US the
only major economy facing difficulties. The UK, which had already once
devalued the Pound in 1967, continued to face balance of payments
difficulties, and decided to let its currency float in 1972. The Japanese and
the Swiss followed a few months later, and by 1973 most of the major
currencies were floating, including the US Dollar, though the Europeans
maintained a band within which their currencies could float against one
another.
In parallel with this process, a few others were also in train, and would
collectively transform the global economy, and the US role in its
management. Three processes are discussed next. None of them would
have been possible but for the freedom given to the dollar by the
abandonment of the gold standard, and the floating of exchange rates. The
three processes were:
(i) Increase in oil prices driven by Organisation of Petroleum
Exporting Countries (OPEC);
(ii) Loosening of US monetary policy, with the Dollar freed from the
constraints of maintaining any parity with either gold or other
currencies; and
(iii) Rise in the role of the banks to deal with the flow of petrodollars
into the European money markets, overwhelmingly into London.
The rise in oil prices began in the late 1960s, when Libya began its hard
bargaining with Occidental Petroleum Corporation. As an independent
company, it enjoyed little official support, and was heavily dependent on
Libyan oil as its only major source of crude. Its leverage was further
increased by the difficulties created by Nasser over the Suez Canal in 1967,
leaving Libya and Algeria as the only countries that could supply oil to
Europe without needing to transit the Suez Canal.
Colonel Gaddafi, who had taken over in a coup in September 1969, finally
succeeded in raising the tax payments charged to Occidental on its oil. One
after another, the other oil companies agreed to the higher taxes, which
then fed back into arrangements in the Persian Gulf producers. This started
a chain of increasing demands, which culminated in the Tehran Agreement

Page 10 of 32
http://www.vifindia.org ©Vivekananda International Foundation
of 1971 that saw an increase of some 50 per cent (from 80 cents a barrel to
$1.25 per barrel) in the amount of tax paid by the oil companies to the
producer countries. This was accompanied by a programme of annual
increases all the way to 1975.
This is what led the US State Department oil expert, James Akins, to remark:
“With the possible exception of Croesus, the world will never have seen
anything quite like the wealth which is flowing and will continue to
flow into the Persian Gulf.”vii
The Akins article is remarkably prescient on a subject notoriously hard to
predict, and is recommended to the inquisitive reader – not only for the
information it provides on oil politics, but equally for the way it leads to the
other two aspects mentioned above. For he goes on to examine how the
massive surpluses that OPEC was going to earn could be utilised.
And that brings in the US financial and monetary response to these
developments. It would be useful to pause, though, and stress that all this
was happening before the October 1973 Yom Kippur War upset even these
arrangements, and led to a partial embargo and hence still higher prices for
oil. This, in turn, provided even higher surpluses for the OPEC, especially
Arab, countries.
Why this becomes important to note is that, after the US abandoned the
gold standard in August 1971, Paul Volcker – then the Under Secretary for
International Affairs at the Treasury – remarked at one of the meetings of a
working group that the developing countries would have to bear the
burden of adjustment, given the policies the West was following. The exact
quote is in the third person in a report from a staffer from the office of the
Presidential Assistant for International Economic Affairs:
“Paul noted that both the OECD and the US ideas of equilibrium call for
the LDC's to bear a significant part of the adjustment burden!”viii
And so indeed it turned out; the table below, shows the nature and
magnitude of the current account deficits the least developed countries had
to face throughout the 1970s and beyond.

Page 11 of 32
http://www.vifindia.org ©Vivekananda International Foundation
Table 2: Global current account balances 1973 to 1980ix
The loose monetary policy that marked the 1970s has been well
documented. Nixon was facing re-election in 1972 and needed positive
economic results after the upheavals described above. He, therefore,
appointed a new Federal Reserve Chairman, Arthur Burns, who loosened
M1 from $228 billion to $249 billion between December 1971 and
December 1972. The previous 12-month period under the long-serving
Chairman, William McChesney Martin saw a move from $198 billion to
$203 billion.
The essence of the loose monetary policy became clear towards the end of
the decade, as inflation rose to 14 per cent by 1979, but allowed two large
oil price hikes to be absorbed by the global economy – with the developing
countries being the exception, which indeed had to bear the burden of the
changing economic strategies. How they coped with the burden is the third
part of the changes that followed the abandonment of the Bretton Woods
arrangements in the early 1970s.
This was the role of the private commercial banks in the handling of the
unprecedented funds that accrued to the oil exporters. Since the end of the
war, the job of transferring capital was left to governments, as Marshall Aid
itself showed, or to the World Bank and the IMF. At this stage, an informal
consensus emerged among the financial managers of the world – the IMF,
Organization for Economic Cooperation and Development (OECD), and the
main central banks – that the handling of these large funds would be left to
the private banks, as they, the governments or the international financial
institutions, could not do the same job adequately. The traditional lenders,
particularly the IMF, were constrained by quota limits and conditionalities.
In point of fact, even the banks were uncertain about their ability to handle

Page 12 of 32
http://www.vifindia.org ©Vivekananda International Foundation
and recycle such large amounts of capital. The geographic location of the
recycling centre was to be the City of London, because both continental
Europe and the US had fairly tight banking regulations, which would not
permit the free-wheeling practices that made such recycling possible. Thus,
the Eurodollar market was unleashed – though it had existed on a small
scale since at least the late 1950s.
A recent book by Carlo Edoardo Altamura titled ‘European Banks and the
Rise of International Finance’ provides useful insights into the process. The
main driver was the British financial establishment, led by the Bank of
England, which recognised that the City was singularly well-placed to
provide the banking services needed to undertake the task of recycling. The
interesting insight the book provides is that even the banks were not quite
sure they could cope with the challenge of recycling. The following quote
from one of the British members of the Trilateral Commission, Sir Philip de
Zulueta to the Governor of the Bank of England is illustrative:
“At the Brussels meeting we had among other things a discussion about
the re-cycling of Arab oil money. The bankers present, of whom the
most important were David Rockefeller himself and Alan Hockin
(Executive Vice President of the Toronto Dominion Bank) but included
some Europeans, expressed considerable worry about the capacity of
the private banking system to re-cycle the extra Arab oil money into
medium term credits …”x
Among other issues, the bankers were concerned about the maturity
mismatch, since the deposits were short-term, the loans medium- to long-
term, and the straight fact that many of the countries to which loans were
advanced were poor credit risks. But in a pattern that was to repeat itself in
the early 2000s, there was no better option, as the surpluses kept pouring
in. The only safeguard adopted was syndication – loans to developing
countries were divided up among a number of banks and these syndicated
loans parcelled out the credit risks among the participant banks.
To sum up, the situation that the US and the developed world faced in the
early 1970s involved some tough choices. The dollar was in an
unsustainable position, being both a national currency and an international
one. The demands of the latter meant that the US had to run persistent

Page 13 of 32
http://www.vifindia.org ©Vivekananda International Foundation
deficits on its balance of payments; in addition, because trade was rising
several times faster than global GDP, the issuance of dollars had to be faster
than the national growth would warrant. Inflation, and hence, depreciation,
was built into this system. Moreover, the US was running consistent deficits
on its balance of payments, and so there was always a downward pressure
on the currency.
The only way to control the situation was to go the way Nixon chose, or to
curtail the money supply and induce a recession, which is how the issue
was faced down by Federal Reserve Chairman Volcker in the late 1970s,
which is discussed below.
For the nonce, the decision was to accommodate the rise of the petrodollar,
and its recycling through the Eurocurrency markets. This, in turn, meant
the financialization of the US economy, and the empowerment of the
commercial banks in a way that has not been seen since the Great
Depression.
It also meant empowering Europe in a way not seen since the war. Those
with long memories will recall the public and sharp airing of differences in
the 1970s between the Europeans, particularly the French, on the one side
and the Americans on the other. Authors like Mary Kaldor wrote ‘The
Disintegrating West’, as a harbinger of things to come, with Europe
emerging as an independent force, co-equal of the US, in international
affairs. And a young economist, Fred Hirsch, spoke of the need for a
“controlled disintegration” of the global economy as a legitimate aim for the
1980s.
The Third Phase: Controlled Integration of the Global Economy
The riposte was not long coming, and it was Volcker again who set the
stage. Fittingly or not, he delivered the first Fred Hirsch memorial lecture in
1978, Hirsch having died in January the same year aged 47. Instead of
controlled disintegration, Volcker spoke of the need for a “managed
integration” of the global economy. He was then the President of the New
York Federal Reserve Bank, and shortly to be appointed Chairman of the
Federal Reserve Board. In arguing for managed integration, he conceded
that the US was no longer the dominant economic presence, but argued
that a coordinated approach with Japan and Europe would best serve the

Page 14 of 32
http://www.vifindia.org ©Vivekananda International Foundation
interests of the three, also making the point that such an approach would
avoid currency volatility and at the same time prevent unhealthy
competition between the three for advantageous positions in the
developing countries. Also noteworthy is the following passage:
“For one thing we have learned that even large exchange rate changes
have not been nearly as effective as hoped in achieving adjustment of
long-standing imbalances in current account positions. Where clear
improvements have been made, they can be traced to changes in
relative demand pressures, or to structural changes such as North Sea
oil.”xi
This relative demand management was the tool he was to employ to good
effect upon taking over at the Fed, for that was the result of his shift
towards money supply targeting, causing interest rates to rise to 20 per
cent by the end of 1980. The stated aim was to end the high inflation (14
per cent at its peak in the late 1970s). It also had the effect of breaking the
oil-finance recycling as many of the developing countries in Latin America
and East European countries (to whom smaller amounts were extended)
were unable to service the loans. The graph below, which shows what the
result of this monetary tightening was, is taken from an IMF study.
Figure 2: Bank flows to emerging markets 1970 – 1985 (in US$ billions)xii

Page 15 of 32
http://www.vifindia.org ©Vivekananda International Foundation
The implications of this for Europe were spelt out by an ex-President of
France well-versed in the ways of high finance, Giscard d’Estaing, in an
article in Foreign Affairs, written in 1983, at a time when the US recovery
was well under way:
“Traditionally a US recovery has fuelled exports of developing
countries, increasing their orders of equipment goods from countries
such as Japan, Germany and France, and the interdependence between
European countries has led to diffusion in Europe of these expansionary
forces, thereby sustaining the world recovery. This time, and due to the
international debt crisis, developing countries will not be in a position
to benefit fully from the US recovery.”xiii
This passage also provides some insight into the active diplomacy then
under way on the North-South Dialogue. Evidently, the European
economies were at risk of an economic “decoupling” because of the policies
adopted in the US. Of course, these policies also affected the US itself in a
long-term way, and it would be well to spell out some of features of the new
economy that was slowly taking shape. The most important feature was the
decline of the traditional manufacturing industries and rise of international
finance as the new driver of the economies of many of the developed
countries. Here is how Altamura, already quoted above, puts it:
“After the end of the gilded age of Fordist capitalism, a new compact
for growth had to be found. The compact that started to take place in
the Western world (Europe for the purpose of our work) in the early
1970s, after the crumbling of Bretton Woods and, particularly, after
the first oil shock, was a compact based on less and less regulation on
financial movements and institutions. It was based on the centrality of
the banking and financial sector as opposed to the public hand and
industrial sector as the engines of growth, and, finally, was based on
the collusion between controllers and controlled, which increased the
moral hazard.”xiv
The result of this empowerment of the banks was that the commercial
banking sector in the US grew by orders of magnitude over the period 1978
to 2007. The commercial banking sector held assets of $1.2 trillion in 1978,
equivalent to 53 per cent of GDP. They rose to $11.8 trillion in 2007or 84

Page 16 of 32
http://www.vifindia.org ©Vivekananda International Foundation
per cent of GDP. Over the same period, investment banks grew even faster,
going from $33 billion, or 1.4 per cent of GDP to $3.1 trillion, or 22 per cent
of GDP. Profitability in the sector grew significantly more rapidly than in
other corporate sectors combined, as the chart below shows.
Figure 3: Real Corporate Profits, Financial vs Non-Financial Sectorsxv
Two additional features stand out, and are worth spelling out, for they
were to be repeated in aggravated form by 2008. The first was the
emergence of large-scale global surpluses, which could not be productively
employed in the country, or countries, originating them. These were the
OPEC member-states at this time. Having no place to deposit these
surpluses, such as the IMF or even the Bank for International Settlements
(BIS), all the countries concerned agreed that it was best for the private
banks to take in these funds and employ them where possible. In the 1970s,
the focus of these deposits was the offshore commercial banks. But by the
2000s, the US financial services industry had been liberalised to an extent
where they could handle the funds onshore.
The second feature was the recycling of these funds to countries, some of
which were questionable credit risks. As the amount of surpluses grew, the
banks were perforce looking at riskier investments. The same was to
happen in the 2000s, of course, and that is what gave rise to the subprime

Page 17 of 32
http://www.vifindia.org ©Vivekananda International Foundation
loans. The difference was that in 1979, Volcker could apply the brakes on
the oil-finance cycle by curtailing money supply, and the US economy could
take the shock because its own exposure was limited to offshore
commercial banks, and the debtors were also foreign countries. Three
decades later, it was a different story.
But all that was still to come. In the 1980s, the Mexican default in the
summer of 1982 forced the hand of the US financial establishment to ease
up on money supply, and that began a financial bull run that has continued
– with occasional hiccups – to this day. For comparison, the Dow Jones
Industrial Average (DJIA) ranged between 600 and 1000 from 1965 to
1982. It was a little above 700 in August 1982, when the Fed announced
that it was abandoning monetary targetting. Twenty years later, it was
above 10,000. In graphic form:
Figure 4: Dow Jones Industrial Average 1900 - 2014
This twenty-year period also saw a few significant changes in the global
economy. The most important, without question, was the relative decline of
Europe, and the rise of Asia, as it also became the most important trade
partner of the US. And within that process, the world saw the rise of Japan
in the 1980s, and its stagnation from the mid-1990s.
A second feature was the liberalisation of the US financial sector. The
improbable reality of the US economy up to the 1970s was that it was
heavily controlled and regulated – a result of the post-1929 experience and

Page 18 of 32
http://www.vifindia.org ©Vivekananda International Foundation
the New Deal regulation. Banks were divided into commercial and
investment functions under the Glass-Steagall Act of 1933. Regulation Q set
limits on the interest they could pay on deposits, and they could not cross
state borders. Others such as the Bank Holding Act and the Interest
Equalisation Tax were further constraints. The process of removing these
began in the 1980s, which gradually eroded, and finally repealed Glass-
Steagall and also, along the way, permitted the growth of moral hazard. The
Savings & Loans bailout in the late 1980s cost the taxpayer some $125
billion. Later, in 1998, saving Long-Term Capital Management (LTCM) was
similarly helped out by the New York Federal Reserve Bank, though no
public funds were used. Nonetheless, several analysts noted that the New
York Fed had brokered a better deal for the LTCM shareholders than would
have been possible without such intervention. And there was, of course, the
bailout of Bear Stearns by the New York Federal Reserve Bank, whose role
was described by Volcker as “actions that extend to the very edge of its
lawful and implied powers”.
The Fourth Phase: Growth Shifts to Asia
Meanwhile, the real economy was also undergoing shifts of an
unprecedented magnitude. With Europe struggling after the Latin
American debt crisis – several commentators described the situation as
“Eurosclerosis” while Asia was gaining economic heft. In the 1980s, Japan
was the fast-rising economy, and the usual spate of writing ensued
describing Japan as the coming economic leader of the world.
As is well-known, that did not happen. And the reasons for that not
happening are well-documented, and deserve treatment in some detail. The
first point to note is that the Japanese economy did not stagnate from the
late 1980s. Though it is frequently believed that the crash of the stock
market at the end of December 1989, when the Nikkei was close to 40,000,
marked the downturn. In actual fact, Japan’s GDP continued to grow until
1995. It was $3.0 trillion in 1989, and reached $5.3 trillion in 1995.
The cause of the stalling may be found in the rise of China, and this came
about in three stages - the devaluation of the Yuan and the simultaneous
rise in the Yen; the Asian Financial Crisis; and the entry of China in the
World Trade Organization at the end of 2001.

Page 19 of 32
http://www.vifindia.org ©Vivekananda International Foundation
The devaluation of the Yuan by nearly 50 per cent (from Y5.8 to the $ to
Y8.7 to the $) on 1 January 1994 had the effect of making asset prices and
labour costs significantly cheaper for foreign investors. The table below,
taken from ADB Key Indicators of Developing Asian and Pacific Countries for
various years, provides an indication of how Foreign Direct Investment
(FDI) behaved over the period just before, and just after the devaluation,
and how the Asian Financial Crisis affected the region in terms of FDI flows.
It suggests a clear movement of FDI into China in ever growing amounts,
and either stagnant, or diminishing investment into other South-East Asian
countries. The partial exceptions are Singapore and to a lesser extent
Thailand.
Countries 1990 1995 1997 1998 2007
East Asia
China, People's Rep. of 2657.0 33849.0 41673.7 41118.1 121418.3
Hong Kong, China ... ... ... -2220.0 6712.0
Korea, Rep. of -263.1 -1776.2 -1605.2 672.8 -13696.7
South Asia
India 96.0 2143.0 3562.0 2480.0 15545.0
Sri Lanka 41.6 53.1 429.8 193.0 548.0
Southeast Asia
Indonesia 1093.0 3742.0 4677.0 -241.0 1164.2
Malaysia 2332.0 6642.0 6787.7 2708.0 -2561.7
Philippines 528.0 1361.0 1113.0 1592.0 -514.0
Singapore 3541.0 4748.0 2849.1 5148.9 11837.0
Thailand 2402.0 1183.0 3298.0 7360.0 7819.4
Viet Nam 120.0 1780.0 2220.0 1671.0 6550.0
Developed Member
Countries
Australia 4272.4 2792.5 3819.2 1889.0 1624.7
Japan -
48968.9
-
22591.0
-
22767.8
-
20960.2
-50999.5
New Zealand … 4984.3 2120.1 -131.7 821.3
Table 3: Total Net Foreign Direct Investment (in US$ million)
The next table, Table 2, shows the effects of this large-scale FDI into China.
It shows the growing importance of FDI in China’s export performance.

Page 20 of 32
http://www.vifindia.org ©Vivekananda International Foundation
Enterprises with foreign funding contributed 31 per cent to China’s exports
in 1995, just as the boom was starting. By 2005, when the boom was in its
peak years, their contribution was 58 per cent.
Year FDI (in $ bn) Total Exports
(in $ bn)
Exports by
FFEs (in $ bn)
Share of FFE
Exports (in %)
1995 37.52 148.78 46.88 31.51
1996 41.73 151.05 61.51 40.72
1997 45.26 182.79 74.90 40.98
1998 45.46 183.71 80.96 44.07
1999 40.32 194.93 88.63 45.47
2000 40.72 249.20 119.44 47.93
2001 46.88 266.10 133.24 50.07
2002 52.74 325.60 169.99 52.21
2003 53.51 438.23 240.31 54.84
2004 60.63 593.33 338.59 57.07
2005 60.33 761.95 444.18 58.30
Table 4: China’s Inward FDI and Exports by Foreign Funded Enterprises
(Nominal), 1995-2005xvi
But an even more striking pattern when the direction of trade flows is also
taken into account. Table 3, taken again from ADB (op. cit.), reveals the shift
between 1990 and 2007. On the export side, it shows a major shift in
Chinese exports towards the US and Europe, with both doubling (or better)
in percentage terms – which would also obviously in absolute terms, given
the huge increase in China’s export quantities. For almost all the other
countries, the opposite process is under way. Exports to both the above
destinations decline, while exports within Asia go up significantly, which
for most countries, means to China. Only India and Indonesia provide
partial exceptions, and then too, not very significant in quantitative terms.
In plain language, China became the funnel through which raw materials
and intermediate goods were finished and exported to the US and Europe.
Table 4 showing the changing pattern of imports is equally revealing. The
imports of all countries, except China, go up from Asia, and down from the
US and Europe. China’s imports from all three regions decline, which
indicates that it was importing ever larger amounts from other sources –
mostly oil and other raw materials not covered in the three jurisdictions

Page 21 of 32
http://www.vifindia.org ©Vivekananda International Foundation
included in these tables. Here, then, we have the new pattern that emerged
over the period from the mid-1990s to the mid-2000s, and this brings out
the nature and source of China’s huge current account surpluses. To go
further, the bulk of the surpluses arose from exports to two destinations,
the US and EU. The US alone accounted for over 25 per cent of total exports
in 2005, and for 18 per cent as late as 2016.
Country of Origin
To Asia To Europe To North and
Central
America
1990 2007 1990 2007 1990 2007
China, People's
Rep.
67.7 40.8 14.7 23.5 10.0 22.9
Korea, Rep. of 34.0 51.4 15.5 16.1 33.4 17.5
India 21.0 32.6 47.2 23.4 16.3 17.6
Indonesia 64.3 60.8 12.8 13.3 13.9 12.5
Malaysia 58.0 57.1 16.6 13.5 18.1 17.3
Singapore 47.1 64.7 17.2 11.3 23.0 11.6
Thailand 37.8 54.1 25.3 15.5 25.3 14.5
Viet Nam 39.1 36.8 48.1 23.1 0.6 25.0
Australia 50.4 60.5 17.1 12.5 12.9 7.6
Japan 26.1 42.8 23.0 16.8 36.3 24.9
New Zealand 30.4 32.4 21.7 15.3 16.9 15.7
Table 5: Direction of Trade: Merchandise Exports (per cent of total
merchandise exports)
Country of Origin
To Asia To Europe To North and
Central
America
1990 2007 1990 2007 1990 2007
China, People's Rep. of 48.4 40.4 24.1 14.5 15.8 9.4
Korea, Rep. of 33.5 46.7 13.1 12.6 25.3 12.0
India 17.3 29.9 41.3 21.6 12.9 9.2
Indonesia 43.4 70.7 22.5 8.4 13.7 5.1
Malaysia 50.6 60.3 17.9 13.2 18.1 11.6
Singapore 48.2 54.4 15.9 14.1 16.9 13.5
Thailand 53.3 56.4 19.7 11.0 12.1 7.6

Page 22 of 32
http://www.vifindia.org ©Vivekananda International Foundation
Viet Nam 34.1 69.1 21.3 10.4 0.4 3.9
Australia 32.4 49.0 27.5 23.8 26.4 14.8
Japan 25.1 40.8 19.8 13.4 27.2 14.0
New Zealand 24.0 42.0 25.0 17.7 20.0 11.5
Table 6: Direction of Trade: Merchandise Imports (per cent of total
merchandise imports)
The Fifth Phase: Unsustainable Surpluses Again
Thus, in the real economy, China was running up surpluses of a magnitude
that even the Japanese – in their halcyon days – did not enjoy, leading to
unprecedented surplus accumulation by China. At the same time, the OPEC
countries were also enjoying a sustained rise in oil prices, which were to
peak at over $140 per barrel (Brent) in 2008. Croesus was left far behind. A
revealing datum is the figure for money supply in the US. M3 is the
broadest measure commonly used, and it captures the newer forms of
money market funds, as well as external sources. In the US Fed data, they
also used to show the figures for non-M2 M3, and this figure, which
captured these new sources rose from 1 per cent in 1959 to 35 per cent in
2006.
Once again, the global economy was faced with excessive surpluses and
nowhere to use them. This time, the bulk of the monies were deposited in
the US banks, particularly in the Wall Street banks, now freed from all
constraints. They had also developed new and unregulated instruments
with which to recycle these colossal amounts. Inevitably, this required
dropping diligence standards for evaluating loan recipients. And this time,
instead of syndicating loans, the safeguard employed was securitisation, in
the form of Mortgage-Backed Securities, and other derivatives. Despite
some efforts at regulating these activities, nothing was done to control
them. It was in essence a repeat, with some change of technique and major
actors, of the oil-finance recycling of the 1970s.
At least one person in a position of authority seemed to sense the dangers
in the situation. When Fed Chair Greenspan began raising interest rates in
2004, he testified before the Senate, where he said, inter alia, ''We cannot be
certain that this benign environment will persist and that there are not more

Page 23 of 32
http://www.vifindia.org ©Vivekananda International Foundation
deep-seated forces emerging as a consequence of prolonged monetary
accommodation,'' (emphasis added).xvii
Given the elliptical way central bankers use language, it is hard to be
certain as to the meaning of this sentence. His book, ‘The Age of Turbulence’,
also does not clear up the meaning. But it would be a reasonable
assumption that this was on his mind, in the same way that the excess
liquidity in the global system was in the late 1970s. In fact, in later years,
Greenspan has squarely blamed the global savings glut for the financial
crisis.
And Greenspan did not confine himself to statements. In the subsequent
meetings of the Fed Open Market Committee, interest rates were raised 17
times on the trot, in a sequence that seems unimaginable today. What is
even more striking in comparison, when the cycle of upward moves began
in 2004, unemployment was at 5.6 per cent, and core inflation between 1.5
and 2 per cent - that is significantly worse in terms of unemployment, and
not much different in terms of inflation as compared to the present
situation. And yet, he raised rates, whereas today, there is a marked
concern to hasten slowly, and then too with every mark of extreme
reluctance.
Of course, there was in between the searing experience of the financial
crisis, or the Great Recession, as it is coming to be called. Enough has been
written about it, and this essay does not intend to go over the ground here.
Some of the major post-crisis features of the global economy are worth
highlighting. Arguably the most important change has been the effect on
global trade. This has led global growth since the late 1940s, and has
registered a growth rate of 6.8 per cent annually between 1985 and 2007.
Post-crisis, it has slowed down and has barely kept pace with global GDP
growth, even falling below in some years, and going negative in years such
as 2015 – in both value and volume terms.
In turn, this behaviour of global trade has meant that export-dependent
economies have been adversely affected. As the world’s leading exporter,
China has faced serious challenges in maintaining its growth rate. And that
brings in the major feature, the rapid growth in Chinese debt. The open
indebtedness in China is now 250 per cent of GDP, and there is more from

Page 24 of 32
http://www.vifindia.org ©Vivekananda International Foundation
the shadow system. The Chinese are themselves more open about their
economic problems than much of the western conventional media. Thus,
for instance, the Chair of the People’s Bank of China described the latent
risks in the financial system as “hidden, complex, sudden, contagious and
hazardous”xviii. This came after warnings from the IMF and the BIS, as well
as downgrades by some rating agencies regarding the very same issue –
Chinese debt levels. This level of debt accumulation in so short a period of
time is without precedent in post-War history. In graphic form:
Figure 5: China’s total internal debt 2004 - 2016
All of the above demonstrates not just the downside risks facing the
Chinese economy in the post-crisis period; it also indicates the dependence
of China on benign US policies, especially with regard to interest rates and
trade. On the first count, higher interest rates will cause China also to
tighten its debt issuance or risk a depreciation of the Yuan – and there are
several well-known China bears who are shorting the currency. But it will
also affect China’s external debt, which is of the order of $1.5 trillion. This is
why Fed Chair Janet Yellen finally broke her silence on the relevance of
China in decision-making on interest rates in September 2015, when she
decided against raising them and invoked China 16 times in her press
conference. This was in stark contrast for the Fed, which barely talked
about global worries before.xix

Page 25 of 32
http://www.vifindia.org ©Vivekananda International Foundation
On the second count, China is even more dependent on the US for
continued growth. In 2016, for instance, China’s export surplus with the US
was of the order of $350 billion. Its overall surplus was $510 billion, so the
US contributed just under 70 per cent of China’s trade surplus. This is in
conformity with the long-term pattern of US-China trade.
There is the counter-argument that “China owns US debt”, or that the “US is
addicted to Chinese debt” – suggesting that there is mutual dependence so
that China also has leverage over the US. In fact, China owns a little less
than 6 per cent of US Government debt, which is about the same as Japan.
Adding corporate debt to the numbers puts Japan well ahead of China. Plus
which, the various Quantitative Easings have shown that, in the final
analysis, the US does not need any outsider to buy its bonds. At its peak, the
Fed was buying (and “twisting”, that is, swapping maturities) a trillion
dollars annually on its own. To prove the point, it may be recalled that
China sold $188 billion of US Treasurys in 2016 – with little effect on yields.
To offer some final thoughts: the narrative above has been aimed at
showing that the US has ensured its economic domination of the global
economy essentially through financial control, after the industrial
domination was irretrievably lost in the late 1960s. The financial flows, and
the management of currencies enabled the US to direct its support through
the process of “managed integration” described above. In turn, this brought
the blessings of US effective demand to the EEC, then Japan, and finally,
China. This last is being played out now, and there are vested interests in
keeping it going, just as there are – especially in the new Trump
Administration – forces that seek an altogether new system and pattern of
international engagement.
It is early yet to discern the contours of this new pattern. But some
tentative conclusions are possible. Firstly, the heavy reliance on trade-led
global growth is under strain. It was breaking down anyway, even before
2017, but is now part of the strategy of the new Administration. This would
have far-reaching implications for both the global value chains that
emerged over the last two decades or so, and for the financialization of the
US (and Western more generally) economy that took shape under the oil-
finance cycle.

Page 26 of 32
http://www.vifindia.org ©Vivekananda International Foundation
The role of Brexit is also worth noting. The Eurocurrency markets
depended on the City in order to function, and that was among the main
drivers of the British entry into the EEC, as it was then called. Now, the pull-
out of the UK from the EU could very well be the harbinger of a new
financial system to displace the current one.
These are huge changes, and are calling forth huge opposition. The
outcome of this struggle will determine the kind of world that emerges.
Conclusion
Some winding up remarks would be in order now.
Perhaps a good starting point would be to state what should be obvious
from the foregoing- the US is not in decline. Since the late 1960s, the US
GDP share in the global output has been fluctuating between 22 and 24 per
cent. In 2016, it was 25 per cent. One could argue about the nature and
quality of the growth, but the basic fact cannot be controverted. The notion
of decline has been linked to the undoubted rise of China. But China has
filled the space vacated by the USSR, Europe, and Japanese stagnation.
China’s growth, as has been argued in this essay, is itself dependent on the
US policies of loose money, and open trade, especially its imports. This is
changing, if the Trump Administration follows through on its new
economic approach. And so far, it gives every indication of being serious
about this.
Equally, the Dollar is not under threat. Its role in international reserves
remains unchanged, even enhanced. It accounted for 62 per cent of
international reserve holdings in 1996, and that has gone up slightly to 63
per cent currently, as of end-2016. The Euro has increased slightly over the
same period. The combined of the D-mark, the French Franc, and the ECU
was a little shy of 18 per cent in 1996; it is 20 per cent now. There is also
the Greek debt issue, which has not yet been finally resolved. The IMF has
not joined in yet, pending a review of the repayment programme of the
government for sustainability. After satisfying itself on that score, it will
join the assistance package in 2018.
The Chinese Yuan is in the 1 per cent handle at present, but it entered the
SDR basket only last year, so its future will need to be tracked. So far,

Page 27 of 32
http://www.vifindia.org ©Vivekananda International Foundation
though, China has maintained strict – and tightening – capital controls, so it
is unlikely that its share will rise significantly until capital controls are
eased. Gold-backed movements are also worth monitoring, especially since
China is now the largest gold producer in the world, and Russia and
Uzbekistan are also among the top ten.
The foregoing analysis has also attempted to show the nature of the
functioning of the global economy since the late 1940s. It has been an
economy led and controlled by US power, which has been sustained by
increasing financialization and dollar dominance, especially since the end
of the Bretton Woods arrangements in the early 1970s. It has also been a
system where trade has acquired a leading role in fostering economic
growth. And once again, as the export destination of first resort, the US has
had the power to direct the speed of that economic growth. It has also used
its pulling power to shift growth from one jurisdiction to another – Europe
initially, Japan and finally China.
All this has not been without external challenges, and internal doubt. As
early as 1952, the incoming Eisenhower team posed the problem inherent
in international trade, that of persistent surpluses and deficits. The point
was made in the following words:
“How is it expected that a world system of trade and payments, free of
quantitative restrictions and exchange controls and with convertible
currencies, would be kept in balance? In other words, what
equilibrating forces are expected to operate so as to prevent persistent
surpluses and deficits (not accounted for by normal capital flow)?
Under the gold standard the notion was that an inflow of payments
produced by an export surplus would tend automatically to increase
prices in the surplus country and reduce prices in the deficit country,
thus stimulating imports into the surplus country and deterring
imports into the deficit country. Whatever may have been the validity
of this notion in the past it is clear that under present and foreseeable
circumstances there is no direct or automatic connection between the
inflow and outflow of payments and internal price levels.”xx
This was written at a time when the US was running surpluses with the rest
of the world, and so is all the more prescient. But once the tide turned and

Page 28 of 32
http://www.vifindia.org ©Vivekananda International Foundation
the US was facing the prospect of persistent deficits, the same problem was
seen differently. Kissinger noted in a memo to President Nixon that “the
present monetary system puts very little real pressure on surplus countries
to act short of intense political pressure from the rest of the world”.xxi
This indeed gets to the heart of the problem of international trade and
finance. Surpluses are deemed good but deficits bad – and yet, you cannot
have one without the other. And when the surpluses become as large as
they did in the 1970s and in the early 2000s, the global economy faces the
problem of how to utilise them. Both times, financial institutions found a
way to put these surpluses to some use, and inevitably, they were
economically unsustainable.
It appears possible that the new US Administration has understood that
these are structural problems in the global economy and its management
since the 1940s. The structure of the US economy itself has had perforce to
change to accommodate these patterns of capital and trade flows, but this
has come at a cost – frequent financial crises, poor job growth, and
persistent deficits in the external balance, with corresponding volatility of
the dollar. Not only have the new economic team openly rejected the long-
standing commitment to free trade, they have also supported external
policies – like the full-throated of candidate Trump for Brexit, when the
incumbent President voiced open discouragement for it. It would be wise to
prepare for a radical shake-up of the global economy.
One of the consequences that appears to be happening already, and even
before the current Administration took office, is a slowdown in
international trade. The period after 2012 saw stagnation, and even
negative growth, especially in 2015, both in value and by volume. The
situation has improved a little in recent years, but even now, the growth in
trade is no faster than overall global growth. This is slow by historical
standards, when trade has outstripped global growth by a factor of two or
three.
This implies that domestic demand will grow in importance as a driver of
growth. The Chinese leaders recognise this, and have been talking since the
last ten years about the need to boost domestic demand. The results so far
have fallen short. But India is in the happy situation of having one of the
most buoyant domestic consumption economies in the world. The changes
Page 29 of 32
http://www.vifindia.org ©Vivekananda International Foundation
described in this essay suggest that India needs to nurture this and the best
way is to reduce the burden of direct taxes – on income, on corporate
profits, and on property-related transactions – and to reduce the burdens
of regulations and inspection. Not only will this play to our strengths, it will
also provide a true free-market approach to managing the economy,
something that has long been promised, but not really delivered so far. The
experience of several countries is that reducing taxes does indeed raise
revenues after an initial dip, through better compliance, and through higher
economic growth. The times are propitious for such an approach.
There is another insight that the history of the last seven decades has to
offer- depreciating one’s currency is no help in fixing an external
imbalance. The US example also bears this out. In terms of gold prices, the
dollar has fallen from $35 per ounce, to close to $1300 per ounce today –
and the US continues to run persistent deficits. And the dollar has not
weakened just in terms of gold. It has been all over the place against the
currencies of its main trading partners, including periods of extended
weakness to no avail.
India itself offers a compelling example. A dollar bought Rs 3.21 in 1947,
whereas today it is in the range of Rs 65. That is a 20-fold decline, and there
has been a similar decline vis-à-vis other currencies as well. Yet, we have
run deficits in our balance of trade every year, except two in the 1970s.
Indian policy-makers would be well-advised not to work to weaken the
Rupee since it will not help our external balance. The current US
Administration has, to boot, placed India on the watch list for policies that
deliberately weaken the Rupee. We have been buying over a billion dollars
per month for the past few years, whether intending to weaken the
currency or not. But that has been the effect. And it has not helped our
trade balance.
Finally, the inquisitive mind will be struck by the close linkages between
the economic and political. If Marshall Aid divided Europe along the line of
cleavage of east and West, the Yom Kippur War served to raise oil prices
and the launch of the oil-finance cycle. Similarly, there is fertile ground for
inquiry into the gold production and its link to the dollar, to the US Interest
Equalisation Tax, and perhaps even to apartheid. Similarly, the breaking of
the oil-finance cycle in the early 1980s led to major pro-democracy

Page 30 of 32
http://www.vifindia.org ©Vivekananda International Foundation
movements in South America. The distinction almost universally drawn
between the economic and the strategic is probably a misleading one – and
that is what this essay has tried to demonstrate.
References: i David S. Painter, ‘Oil and the Marshall Plan’, The Business History Review, 58 (3) Autumn, 1984, pp. 359-383.
ii Foreign Relations of the United States: Diplomatic Papers 1944, ‘The Near East, South Asia, and Africa’, The Far East Volume V, Doc 890F.6363/91, 27 December 1943; and Doc 800.6363/1515a, 3 March 1944.
iii Foreign Petroleum Policy of the United States: Memorandum by the Inter-Divisional Petroleum Committee of the Department of State, 1944811.6363/4-1144, April 11, 1944.
iv All figures are taken from Jon Kimche, ‘Seven Fallen Pillars’, Secker & Warburg, London 1953, p. 21.
v Keith Pilbeam, ‘International Finance’, Macmillan 1998.
vi South Africa Gold Production, https://commons.wikimedia.org/w/index.php?curid=30203661.
vii James Akins, ‘The Oil Crisis: This Time the Wolf is Here’, Foreign Affairs, April 1973.
viii Foreign Relations of the United States: Foreign Economic Policy: 1969-76, Volume III, ‘International Monetary Policy, 1969-72’, Document 173 of 1 September 1971.
ix Pilbeam, No. 5, p. 291.
x Carlo Edoardo Altamura, ‘European Banks and the Rise of International Finance: The post-Bretton Woods era’ (Kindle Locations 3258-3262), Routledge Explorations in Economic History, Taylor and Francis, Kindle Edition.
xi Paul Volcker, ‘The Political Economy of the Foreign Affairs’, November 1978, p. 9, https://www.newyorkfed.org/medialibrary/media/research/quarterly_review/1978v3/v3n4article1.pdf
xii Johannes Wiegand, ‘Bank Recycling of Petro Dollars to Emerging Market Economies during the Current Oil Price Boom’, IMF Working Papers, 08/180, https://www.imf.org/external/pubs/ft/wp/2008/wp08180.pdf
xiii Valery Giscard d’Estaing, ‘New Opportunities and New Challenges’, Foreign Affairs, Fall 1983.
xiv Altamura, No. 10.
xv Johnson & Kwak, 13 Bankers, Vintage Books, New York 2011, pp. 59 – 61.
xvi China Statistical Yearbook (1996-2006): National Bureau of Statistics of China; quoted in Weishi Gu, Titus O Awokuse, Yan Yuan, ‘The Contribution of Foreign Direct Investment to China’s Export Performance’, paper prepared for presentation at the American Agricultural Economics Association Annual Meeting, Orlando, FL, July, 2008, p. 28.
xvii New York Times, 21 July 2004.
xviii China’s Central Bank Chief Warns of ‘Sudden, Contagious and Hazardous’ Financial Risks, Bloomberg News, November 4, 2017, https://www.bloomberg.com/news/articles/2017-11-04/china-s-zhou-warns-on-mounting-financial-risk-in-rare-commentary

Page 31 of 32
http://www.vifindia.org ©Vivekananda International Foundation
xix Patrick Gillespie and Heather Long, @CNN Money, ‘Janet Yellen invokes China 16 times in 1 hour’, September 18, 2015,http://money.cnn.com/2015/09/18/news/economy/china-yellen-global-economy-worry/index.html
xx Foreign Relations of the United States: 1952-54, Volume I, Part 1, Economic and Political Matters, Document 16, dated 11 December 1952.
xxi Foreign Relations of the United States: 1969-76, Volume III Foreign Economic Policy; International Monetary Policy, 1969-72, Document 124, dated 7 May 1969.
Front Page Image Source: https://www.businessinsider.in

About the VIVEKANANDA INTERNATIONAL FOUNDATION The Vivekananda International Foundation is an independent non-partisan institution that conducts research and analysis on domestic and international issues, and offers a platform for dialogue and conflict resolution. Some of India’s leading practitioners from the fields of security, military, diplomacy, government, academia and media have come together to generate ideas and stimulate action on national security issues. The defining feature of VIF lies in its provision of core institutional support which enables the organisation to be flexible in its approach and proactive in changing circumstances, with a long-term focus on India’s strategic, developmental and civilisational interests. The VIF aims to channelise fresh insights and decades of experience harnessed from its faculty into fostering actionable ideas for the nation’s stakeholders. Since its inception, VIF has pursued quality research and scholarship and made efforts to highlight issues in governance, and strengthen national security. This is being actualised through numerous activities like seminars, round tables, interactive dialogues, Vimarsh (public discourse), conferences and briefings. The publications of VIF form lasting deliverables of VIF’s aspiration to impact on the prevailing discourse on issues concerning India’s national interest.
VIVEKANANDA INTERNATIONAL FOUNDATION
3, San Martin Marg, Chanakyapuri, New Delhi – 110021 Phone: +91-11-24121764, 24106698
Email: [email protected] Website: http://www.vifindia.org
Follow us on twitter@vifindia