visualized conference and jquery conference
TRANSCRIPT

Trends in Data Visualization
and Client Side Technologies
Keiichiro Ono Visualized Conference and jQuery Conference Report

Background- We are (mainly) working on client-side
applications: Cytoscape
- And we still live in old world…
- Java desktop application
- Need to learn new technologies for long-term goals
- SOA / Cytoscape CI

Client-Side Technology- Java is dying in this field...
- If you want to survive in this field, you need to learn emerging technologies
- JavaScript, HTML5, CSS3, WebGL
- Also, client-side programmers now need some design skills
- Flat Design, UX Design Principles

Conferences Attended
- Visualized in New York
- jQuery Conference in San Diego


- Conference about:
- Data Visualization
- Design
- Technology
- Some politics
Visualized


- Web is the data visualization platform
- Mature enough for real-world problems
- Fat backend (cloud/cluster) and fat client (browser)
- Design do matter
- Usability / UX
Summary

Selected Talks

Jan Willem Tulp


The Flavor Network

Giorgia Lupi accurat.it


Aesthetics
- Not changing so rapidly
- Learn from familiar aesthetics

Peter Olson VP, Web and Application Development at Marvel

Marvel API

Marvel API

{ "id": 1009610, "name": "Spider-Man", "description": "Bitten by a radioactive spider, high school student Peter Parker gained the speed, strength and powers of a spider. Adopting the name Spider-Man, Peter hoped to start a career using his new abilities. Taught that with great power comes great responsibility, Spidey has vowed to use his powers to help people.", "modified": "2013-10-24T13:52:13-0400", "thumbnail": { "path": "http://i.annihil.us/u/prod/marvel/i/mg/3/50/526548a343e4b", "extension": "jpg" }, "resourceURI": "http://gateway.marvel.com/v1/public/characters/1009610", "comics": { "available": 2576, "collectionURI": "http://gateway.marvel.com/v1/public/characters/1009610/comics", "items": [

Visualizing Marvel Universe

Graph Visualization Outside of Biology
- Gephi is the winner
- Some possible reasons:
- Built-in clustering and its visualization
- Nice presets

Mike Pell Sr. Experience Designer at Microsoft

His Points
- “Make things talk”
- Summarize themselves
- Easy round-trip from overview to details
- Never create hairball

Importance of Affordance
- Easy discoverability of possible actions (in HCI)
- Example: door knob
- turn, pull, push
- Don’t make users think

Know Users
- Skeuomorphism to flat
- Users are mature enough to understand what to do with the flat buttons

Moritz Stefaner

Just as the microscope made it possible for the naked human eye to see cells, microbes, and viruses, thereby advancing biology and medicine, and just as the telescope opened the human mind to the immensity of the cosmos and the conquest of space—the macroscope promises to help make sense of yet another dimension—the infinitely complex.
Plug-and-Play Macroscopes By Katy Börner Communications of the ACM, Vol. 54 No. 3, Pages 60-69

Data Visualization != Fancy Information Graphics
- UX or interactive design is important when we design tools

Jonathan Corum New York Times Science Graphics Editor


MARS CURIOSITY ROVER TRACKER

Tools
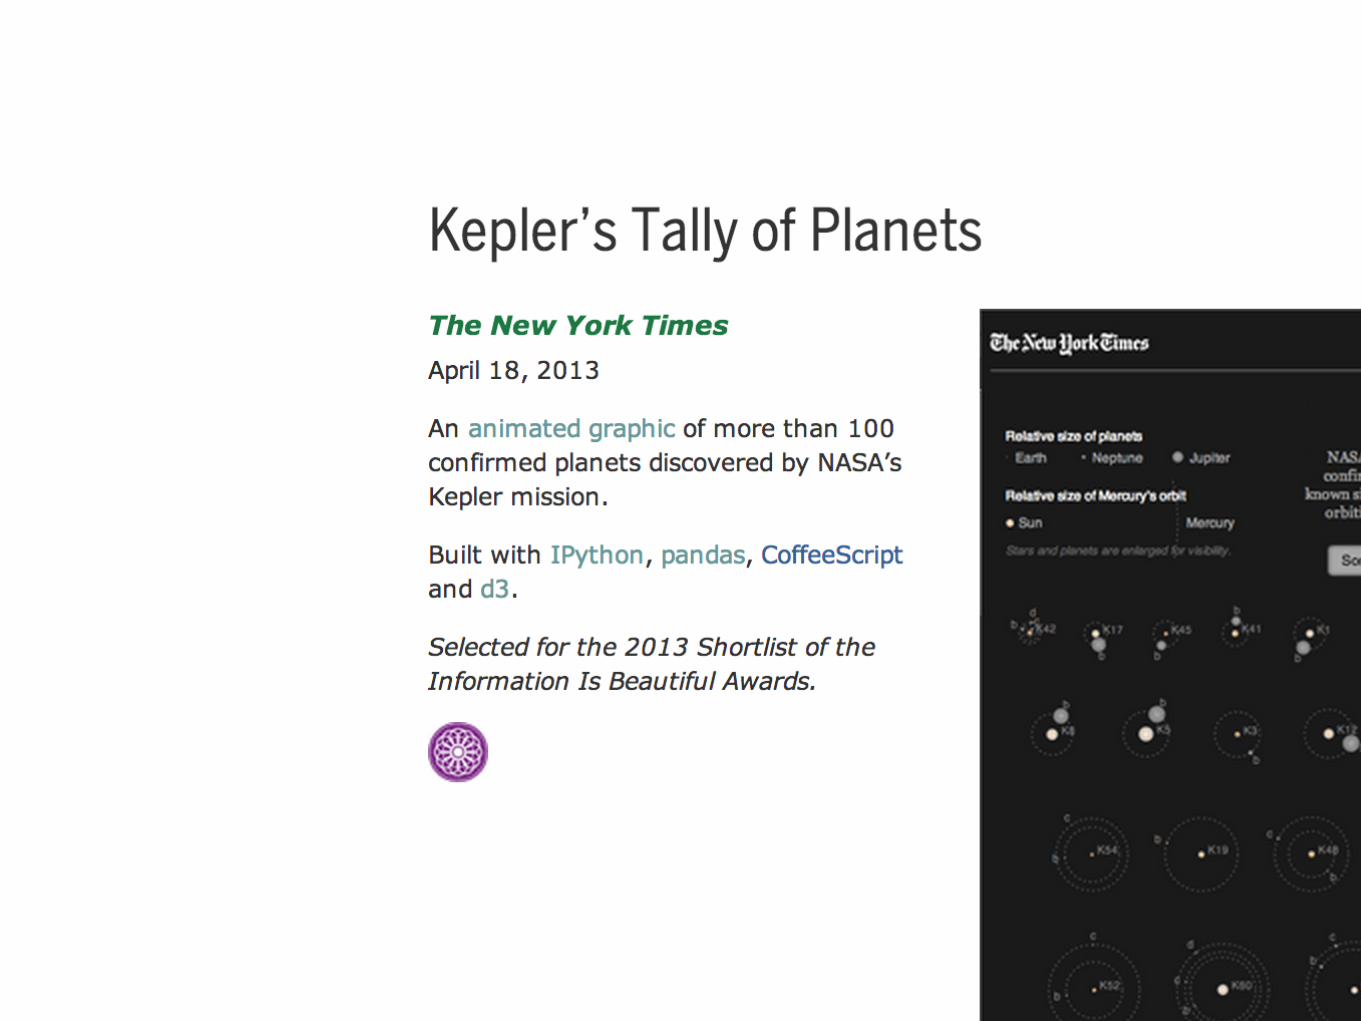

Tools for Rapid Production
- Python for data gathering/cleansing
- R/Pandas for analysis
- Visualized by D3.js (JavaScript)
- Publish workflow with IPython Notebook

Alexander Chen


Overall Comments
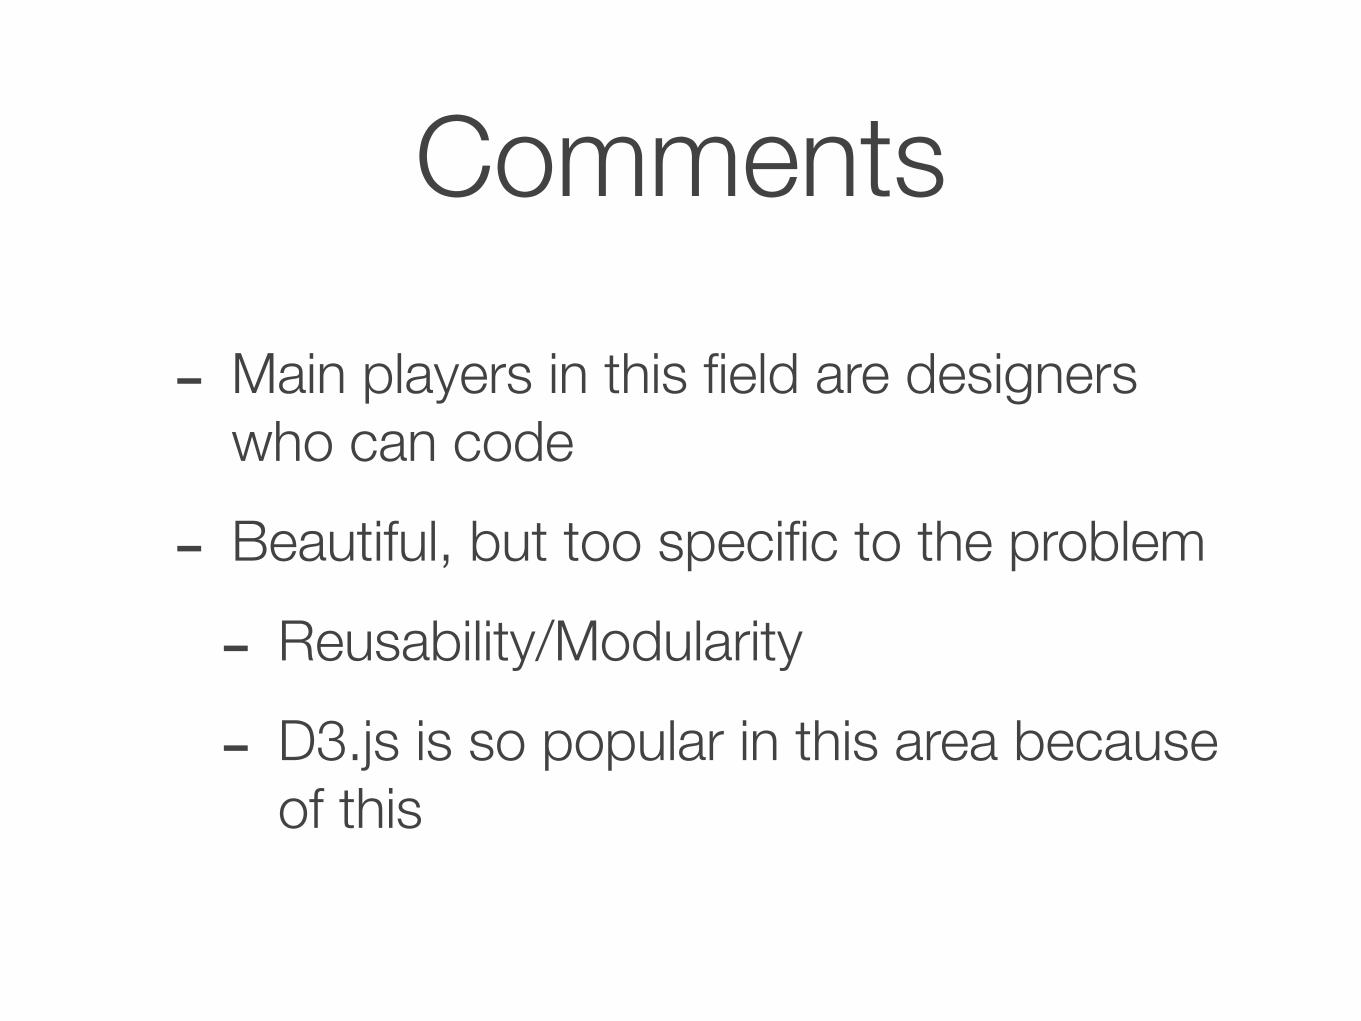
Comments
- Main players in this field are designers who can code
- Beautiful, but too specific to the problem
- Reusability/Modularity
- D3.js is so popular in this area because of this

What can we do?
- Modular and reusable libraries and toolkits are still missing
- As software developers, we can work on this problem
- Bio.JS (EBI)


jQuery Conference- Not only for jQuery
- JS and related technologies
- Server-side JavaScript
- Data Visualization
- More technical details, rather than meta-discussion

Data Visualization Technologies
- C++ and Java are still important languages for high-end scientific data visualization applications
- Computational Fluid Dynamics
- Meteorology
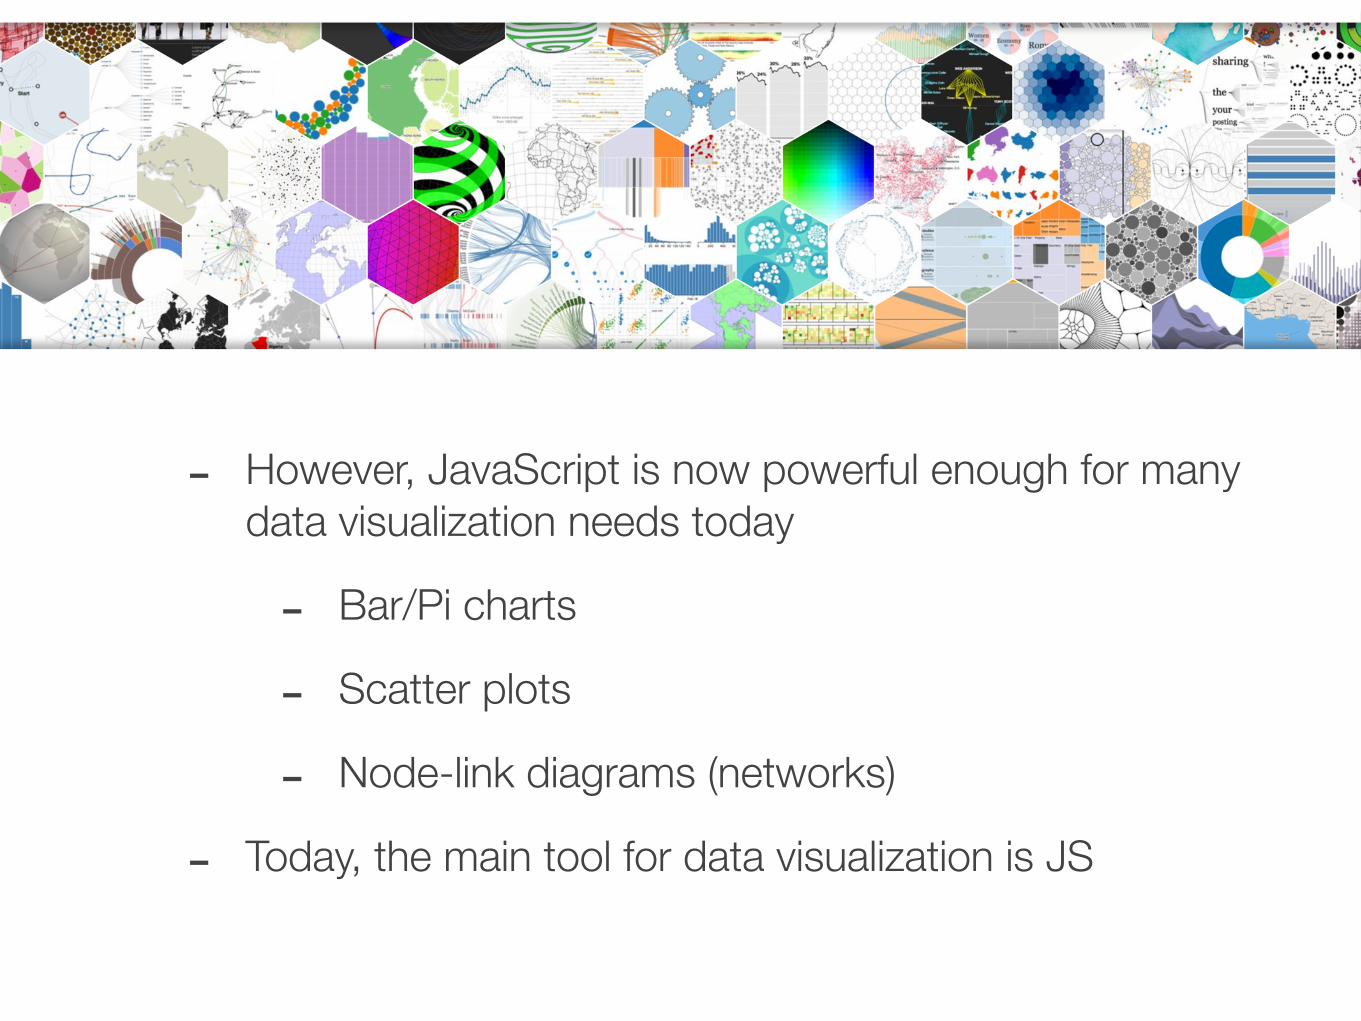
- However, JavaScript is now powerful enough for many data visualization needs today
- Bar/Pi charts
- Scatter plots
- Node-link diagrams (networks)
- Today, the main tool for data visualization is JS

Use Right Technology: Past
- Simple
- JavaScript
- Medium Complexity
- Flash/Java Web Start/Applet
- High-end
- Desktop Applications witten in C++

Use Right Technology: Today
- Simple/Medium Complexity
- JavaScript with Canvas/SVG/WebGL
- High-end
- C++ with OpenGL

What are JS folks doing now?
- In some sense, they are repeating what we have done in Java world
- Unit test frameworks (Karma/Mocha/Jasmin)
- Build System (Grunt = Maven)
- Static code analysis
- Continuous integration
- Languages compiled to JS
- CoffeeScript/TypeScript/Haxe/etc.
Sample Talks


JS for Large Scale Application
- JavaScript was not designed for large-scale application development
- JS developers are making tools to handle this problem
- Is JS ready for it?
- Yes