visualization of air conditioning and ventilation ...€¦ · carrier’s psychrometric chart...
TRANSCRIPT

1038 2nd PALENC Conference and 28th AIVC Conference on Building Low Energy Cooling and Advanced Ventilation Technologies in the 21st Century, September 2007, Crete island, Greece
Visualization of air conditioning and ventilation processes: the apperiance of hu-mid air diagram within a short period at three distant places on a globe
B. TodorovicUniversity of Belgrade, Serbia
the temperature (t) and enthalpy (h), so when these two diagrams are compared, one is to be viewed in a mirror image or if on a slide, it should be viewed from the back and rotated.The Ramzin’s diagram was constructed similarly to the Mollier’s, but was originally adapted to processes ori-ented toward the drying processes.The three diagrams were published within the period of 7-12 years. The Carrier’s was the first to be officially published in 1911, the Ramzin’s in 1918, and the Mollier’s in 1923.In order to understand that the time difference between the appearance of the three diagrams was not great for the communication conditions at that time, we should remember that it happened less than of hundred years ago, when people communicated only in writing, using the postal services, mail first carried on horses or by ships, rare railroad traffic – anyway, all much slower than nowadays. It was the time when telephone connections and radio were started, so that communication between the similarly-oriented and curious scientists was neither fast nor often. If there were direct contacts, they were in the form of long-lasting journeys. It is probable that Mol-lier and Carrier were informed of each other; however, it is hard to believe that Ramzin’s was the similar case, because he lived and worked during the period before the Russian October Revolution, and afterwards during the bolshevism period.How can it be, then, that at three distant spots of our world, in Germany, Russia and the USA, within a short time three, we may say absolutely same ideas, three needs, three realizations in regard to humid air appear? The only acceptable answer is that it happened within three nations of exceptional intellectual potential, who obtained new technologies and were at the doorstep of industrialization. So that the human spirit, knowledge and needs in the states of similar potential and techno-logical abilities had similar level of development. Simi-lar problems were researched, and their solutions, if they were discoveries of natural laws and finding their pos-sible applications, had to be basically the same, as there is always only one solution – the true one. With the note that scientific meetings were organized then in Germany and America, and the researchers of similar topics had a chance to meet, not often, but enough to find out directly
SUMMARY
Psychometric diagram, or diagram of humid air, was es-tablished by three authors in a period of 10 years, very possible independent from one another. It is interesting how three men got the same idea in three very different locations of the globe, at a time when there were no ra-dios, good phones or electronic connections. It was dif-ficult time for close dialogs and exchange of informa-tion but still it happened that three men, nearly in same time have done the same contribution to science and art of HVAC&R. Namely, Carrier in USA, Ramzin in Rus-sia and Mollier in Germany, does nor matter who was first and who last, all have helped all thermodynamic engineers in their realization of AC systems presenting them diagram easy to calculate and analyze air con-ditioning process. The diagram Europeans named Mol-lier’s diagram, English speaking nations Carrier’s psy-chrometric chart, and Russia and former Soviet Union as well as in Easter countries, called it Ramzin’s one.
1. INTRODUCTION
Air conditioning calculations are based on a diagram where a complete process of the change of air treating or air handling may be virtually presented, with all the conditions through which the air passes, from its out-side state to its relocation into the air-conditioned space. There, thermo-dynamic changes with final state may be precisely defined and marked: both during the pre-heating, humidifying, drying, finally heating and cool-ing, and during the process happening in the controlled room, when the air usually makes up the heat losses or neutralizes heat gains.The diagram or the chart in Central Europe is called “The Humid Air Mollier Diagram” and in Russia “The Ramzin’s Diagram”. In the USA the diagram is called “The Psychrometric Chart” by W. Carrier.The Mollier diagram is practically different from the Carrier chart in the coordinate system display: the Mol-lier diagram is on the right side, with temperatures (en-thalpy) on one and humidity content on another axis The Carrier diagram is left-oriented and represents a system of air humidity content (x) dependence upon
PALENC 2007 - Vol 2.indd 1038 7/9/2007 1:25:49 µµ
10392nd PALENC Conference and 28th AIVC Conference on Building Low Energy Cooling and Advanced Ventilation Technologies in the 21st Century, September 2007, Crete island, Greece
what research was being done and has been achieved.
2. WILLIS HAVILLAND CARRIER (1876-1950)
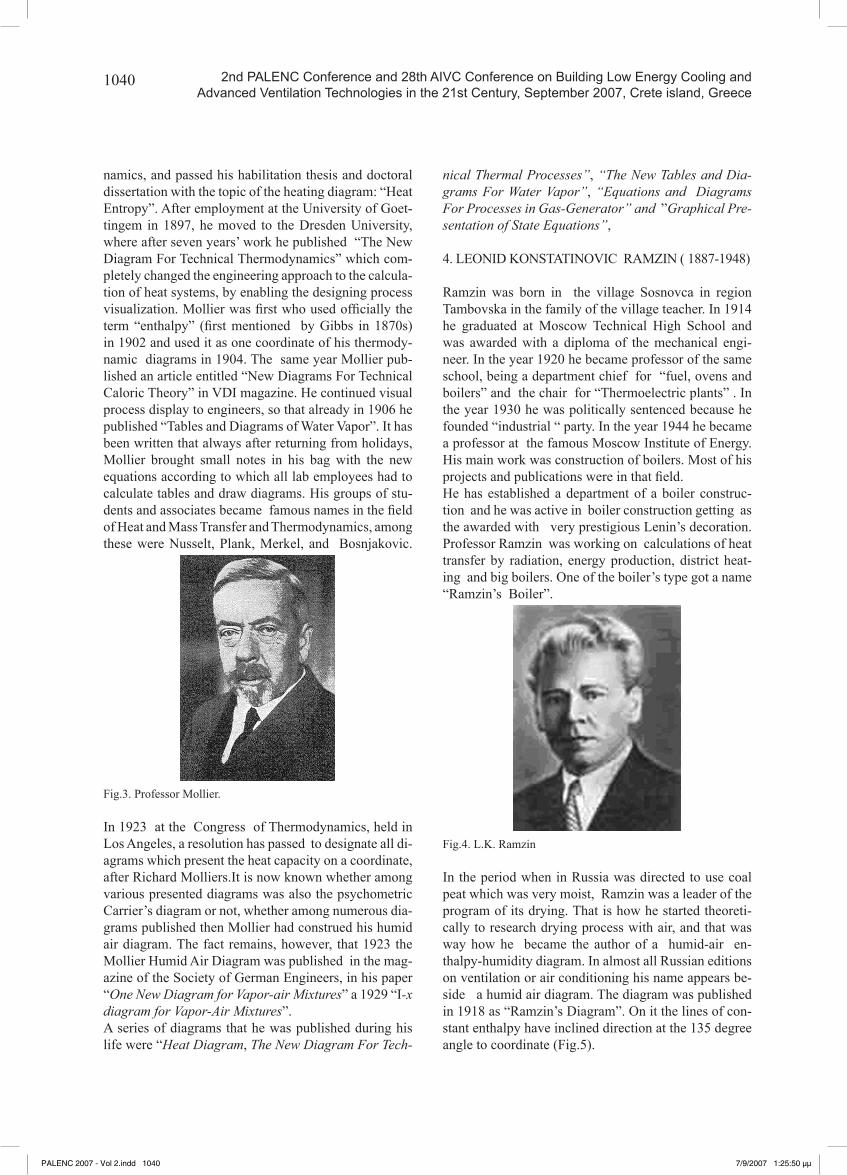
Willis Carrier (fig 1) was considered an exceptionally creative engineer, who in 1901 started working in the Buffalo Forge Company, in Buffalo, New York, USA. He got the task of managing the researching and devel-opment of the company activities, and very quickly met with the problem of maintaining the condition of re-duced humidity in a printing shop in Brooklyn, because at times of high outdoor temperatures and increased hu-midity there were big financial losses, especially when printing colored editions. Color spreading in humid and hot environment during such periods of the summer high outdoor temperatures created great difficulties for the printing company.When Carrier got acquainted with the problem, he wrote that “it would be much easier if the relative in-door humidity was higher that the outdoor one”. So he started reducing the humidity in the printing shop using calcium chloride brine as a hygroscope agent. He rigged a burlap cloth on two rollers and a fan pulled through the cloth, which was wetted continuously with a satu-rated solution of calcium chloride brine. The air became drier, but minute salty drops showed in it, which was undesirable within the printing process. Therefore, he decided to dry the air using cold water. There, he no-ticed that while spraying water in the air mass, if its temperature was below the dew pint, its humidity was reduced. Eight years earlier a German Herman Rietshel, the creator of the scientific approach to heating and air conditioning in Middle Europe wrote about it, saying that the air washing chamber may be used to reduce air humidity by spraying water, but further researches were necessary in order to achieve the desired effect.
Fig.1. W.Carrier
Then Carrier decided to achieve drying by using the heat
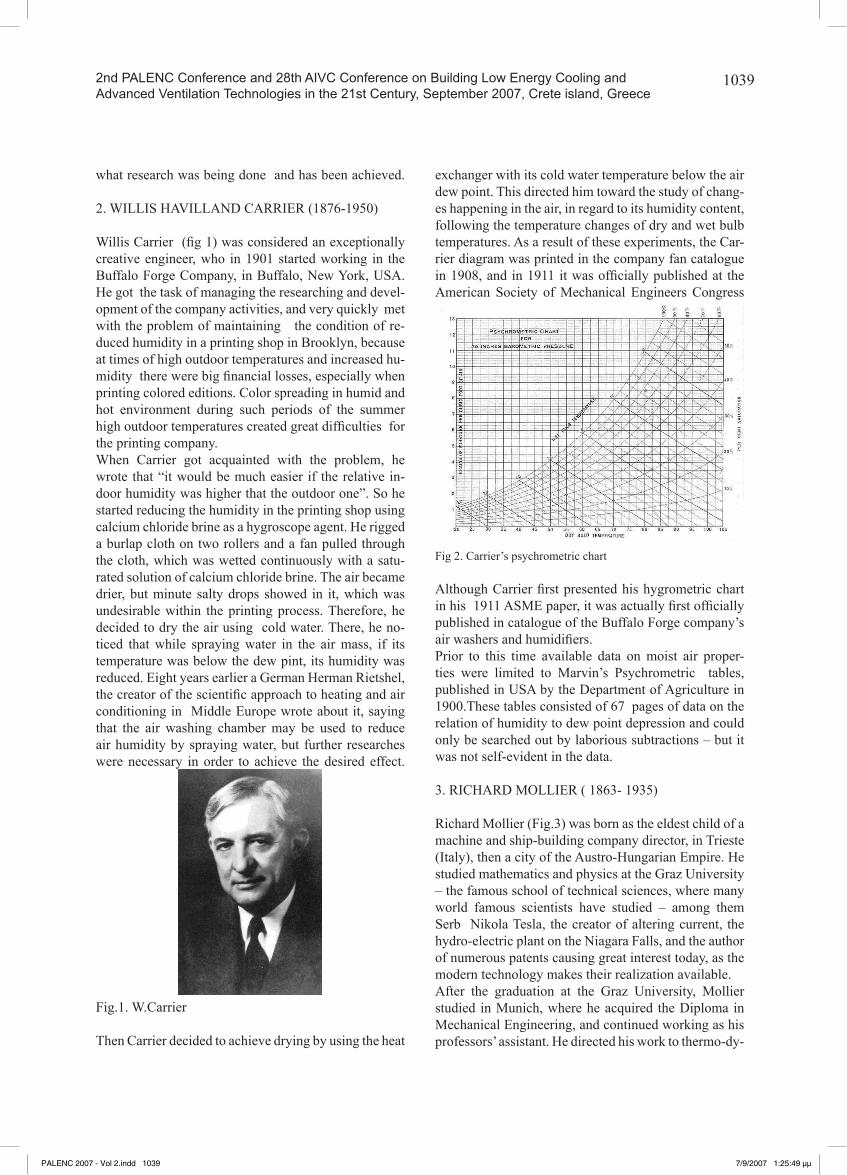
exchanger with its cold water temperature below the air dew point. This directed him toward the study of chang-es happening in the air, in regard to its humidity content, following the temperature changes of dry and wet bulb temperatures. As a result of these experiments, the Car-rier diagram was printed in the company fan catalogue in 1908, and in 1911 it was officially published at the American Society of Mechanical Engineers Congress
Fig 2. Carrier’s psychrometric chart
Although Carrier first presented his hygrometric chart in his 1911 ASME paper, it was actually first officially published in catalogue of the Buffalo Forge company’s air washers and humidifiers.Prior to this time available data on moist air proper-ties were limited to Marvin’s Psychrometric tables, published in USA by the Department of Agriculture in 1900.These tables consisted of 67 pages of data on the relation of humidity to dew point depression and could only be searched out by laborious subtractions – but it was not self-evident in the data.
3. RICHARD MOLLIER ( 1863- 1935)
Richard Mollier (Fig.3) was born as the eldest child of a machine and ship-building company director, in Trieste (Italy), then a city of the Austro-Hungarian Empire. He studied mathematics and physics at the Graz University – the famous school of technical sciences, where many world famous scientists have studied – among them Serb Nikola Tesla, the creator of altering current, the hydro-electric plant on the Niagara Falls, and the author of numerous patents causing great interest today, as the modern technology makes their realization available.After the graduation at the Graz University, Mollier studied in Munich, where he acquired the Diploma in Mechanical Engineering, and continued working as his professors’ assistant. He directed his work to thermo-dy-
PALENC 2007 - Vol 2.indd 1039 7/9/2007 1:25:49 µµ
1040 2nd PALENC Conference and 28th AIVC Conference on Building Low Energy Cooling and Advanced Ventilation Technologies in the 21st Century, September 2007, Crete island, Greece
namics, and passed his habilitation thesis and doctoral dissertation with the topic of the heating diagram: “Heat Entropy”. After employment at the University of Goet-tingem in 1897, he moved to the Dresden University, where after seven years’ work he published “The New Diagram For Technical Thermodynamics” which com-pletely changed the engineering approach to the calcula-tion of heat systems, by enabling the designing process visualization. Mollier was first who used officially the term “enthalpy” (first mentioned by Gibbs in 1870s) in 1902 and used it as one coordinate of his thermody-namic diagrams in 1904. The same year Mollier pub-lished an article entitled “New Diagrams For Technical Caloric Theory” in VDI magazine. He continued visual process display to engineers, so that already in 1906 he published “Tables and Diagrams of Water Vapor”. It has been written that always after returning from holidays, Mollier brought small notes in his bag with the new equations according to which all lab employees had to calculate tables and draw diagrams. His groups of stu-dents and associates became famous names in the field of Heat and Mass Transfer and Thermodynamics, among these were Nusselt, Plank, Merkel, and Bosnjakovic.
Fig.3. Professor Mollier.
In 1923 at the Congress of Thermodynamics, held in Los Angeles, a resolution has passed to designate all di-agrams which present the heat capacity on a coordinate, after Richard Molliers.It is now known whether among various presented diagrams was also the psychometric Carrier’s diagram or not, whether among numerous dia-grams published then Mollier had construed his humid air diagram. The fact remains, however, that 1923 the Mollier Humid Air Diagram was published in the mag-azine of the Society of German Engineers, in his paper “One New Diagram for Vapor-air Mixtures” a 1929 “I-x diagram for Vapor-Air Mixtures”.A series of diagrams that he was published during his life were “Heat Diagram, The New Diagram For Tech-
nical Thermal Processes”, “The New Tables and Dia-grams For Water Vapor”, “Equations and Diagrams For Processes in Gas-Generator” and ”Graphical Pre-sentation of State Equations”,
4. LEONID KONSTATINOVIC RAMZIN ( 1887-1948)
Ramzin was born in the village Sosnovca in region Tambovska in the family of the village teacher. In 1914 he graduated at Moscow Technical High School and was awarded with a diploma of the mechanical engi-neer. In the year 1920 he became professor of the same school, being a department chief for “fuel, ovens and boilers” and the chair for “Thermoelectric plants” . In the year 1930 he was politically sentenced because he founded “industrial “ party. In the year 1944 he became a professor at the famous Moscow Institute of Energy. His main work was construction of boilers. Most of his projects and publications were in that field. He has established a department of a boiler construc-tion and he was active in boiler construction getting as the awarded with very prestigious Lenin’s decoration. Professor Ramzin was working on calculations of heat transfer by radiation, energy production, district heat-ing and big boilers. One of the boiler’s type got a name “Ramzin’s Boiler”.
Fig.4. L.K. Ramzin
In the period when in Russia was directed to use coal peat which was very moist, Ramzin was a leader of the program of its drying. That is how he started theoreti-cally to research drying process with air, and that was way how he became the author of a humid-air en-thalpy-humidity diagram. In almost all Russian editions on ventilation or air conditioning his name appears be-side a humid air diagram. The diagram was published in 1918 as “Ramzin’s Diagram”. On it the lines of con-stant enthalpy have inclined direction at the 135 degree angle to coordinate (Fig.5).
PALENC 2007 - Vol 2.indd 1040 7/9/2007 1:25:50 µµ

10412nd PALENC Conference and 28th AIVC Conference on Building Low Energy Cooling and Advanced Ventilation Technologies in the 21st Century, September 2007, Crete island, Greece
Fig.5 Ramzin’s humid air diagram
5. CONCLUSION
We shall never know the whole truth. Judging by publi-cation years, and by their construction, the Carrier Dia-gram was surely his original work, and the first Humid Air Chart. It is hard to believe that Ramzin could know about the Carrier’s work, so we must suppose that Ramzin created his dia-gram independently. The Mollier Diagram is displayed as the Ramzin’s one, and published 5 years later. Was the Mollier Diagram created after the Carrier’s idea, as he could have met him in Los Angeles in 1923, or not? He published his own diagram the same year, but it is hard to know whether before or after his trip to Ameri-ca. Could he somehow know about the Ramzin’s work? He could. Their diagrams are done under the same angle of enthalpy inclination. If it happened, it had to be before 1923, because of the Russian Revolution and Soviet Union border closing in the first period of social-ism. Why would, in that case, Mollier wait for 5 years? Having all facts in mind, but also knowing that Mollier had been working all his life on various diagrams, as no scientist in the field of thermo-dynamics before or after him, the only conclusion is that the three thermal ex-perts have done their own diagrams absolutely indepen-dently at three points of the world, far away from each other, during the period when contacts and exchange of publications were difficult.
LITERATURE
[1] Russian Encyclopedia, Moscow, 1976.[2] F. Bosnjakovic, Thermodynamics, Zagreb, 1948[3] Donaldson, Nagengast, Heat and Cold, ASHRAE,1994[4] Wissenshafliche Zeitsfrift, Technishe Universitaet Dresden, 1964[5] B.M. Hrustalev, A.P. Nesecuk, V.N. Romanjuk, Thehnical Thermodynamic, part 1, Minsk, UP Tehnoprint, 2004.
PALENC 2007 - Vol 2.indd 1041 7/9/2007 1:25:50 µµ