visualisation & data storytelling
TRANSCRIPT


About me●●●●
●●

What is Data Visualisation

One compelling reason to visualise data●
●

Visualisation in the context of AnalyticsIdentify Obtain Understand Prepare Analyse Present
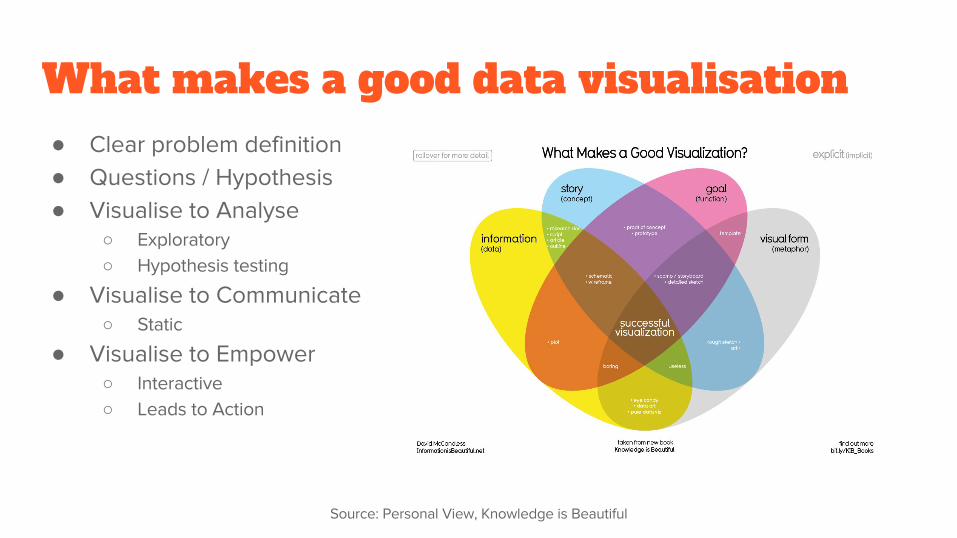
What makes a good data visualisation●●●
○○
●○
●○○

Choosing the components of your story

Gauging your choices

Considerations during ‘Present’ phase
●●●
●
Identify Obtain Understand Prepare Analyse Present

Storytelling guidelines●●●●●●●●●●
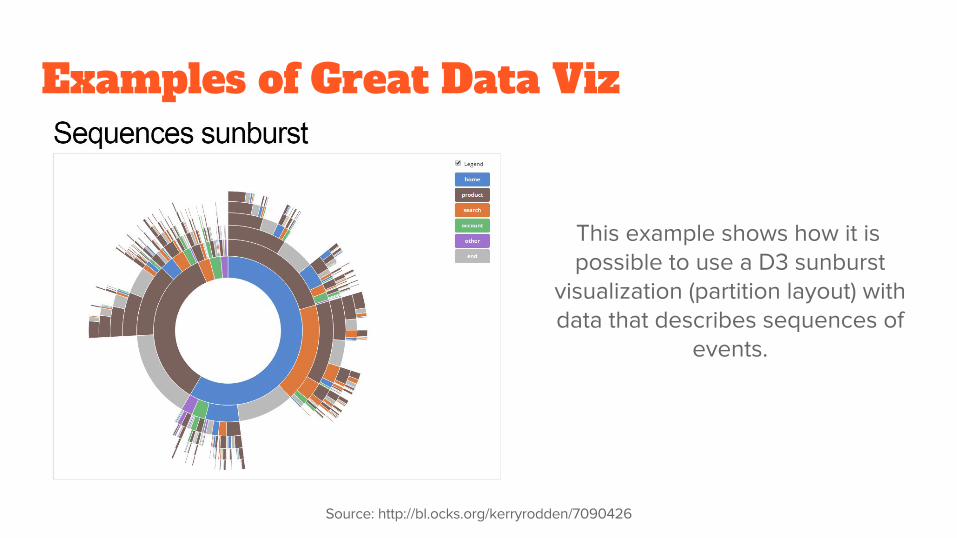
Examples of Great Data Viz

Examples of Great Data Viz
Source: http://exposedata.com/parallel/

Examples of Great Data Viz
Source: http://www.nytimes.com/interactive/2009/07/31/business/20080801-metrics-graphic.html?_r=1&

Examples of Great Data Viz
Source: https://www.tableau.com/about/blog/2015/11/how-storytelling-data-changes-way-we-see-world-45435

Examples of Great Data Viz
Source: http://bost.ocks.org/mike/sankey/

Examples of Great Data Viz
Source: http://euclid.psych.yorku.ca/SCS/Gallery/excellence.html

Examples of Great Data Viz
Source: Information is Beautiful

Examples of Great Data Viz
Source: http://flowingdata.com/2015/12/15/a-day-in-the-life-of-americans/
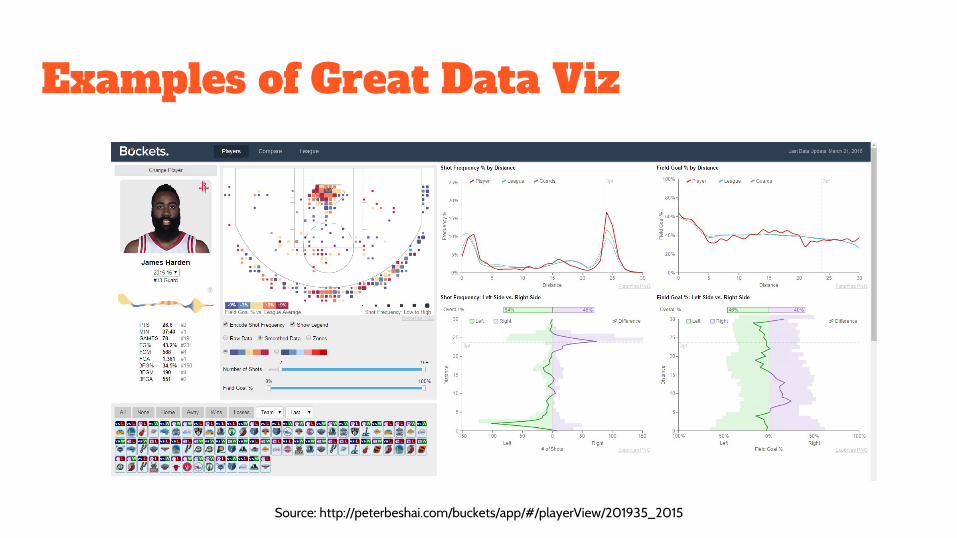
Examples of Great Data Viz
Source: http://peterbeshai.com/buckets/app/#/playerView/201935_2015

Context is Essential in Graphical Data
Source: The Visual Display of Quantitative Information by Edward Tufte

Context is Essential in Graphical Data
Source: Personal Experience

Context is Essential in Graphical Data
Source: Personal Experience

Graphical Choice is Important
Source: Visualize This, Nathan Yau

Look Out for and Highlight Anomalies

Be Extra Careful With Averages

Correlation does not imply Causation
http://www.nejm.org/doi/full/10.1056/NEJMon1211064
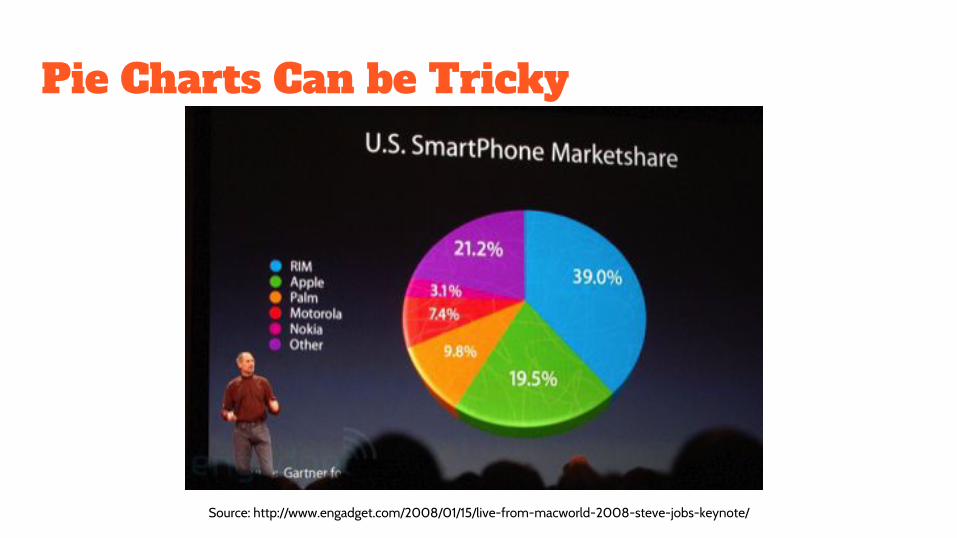
Pie Charts Can be Tricky
Source: http://www.engadget.com/2008/01/15/live-from-macworld-2008-steve-jobs-keynote/
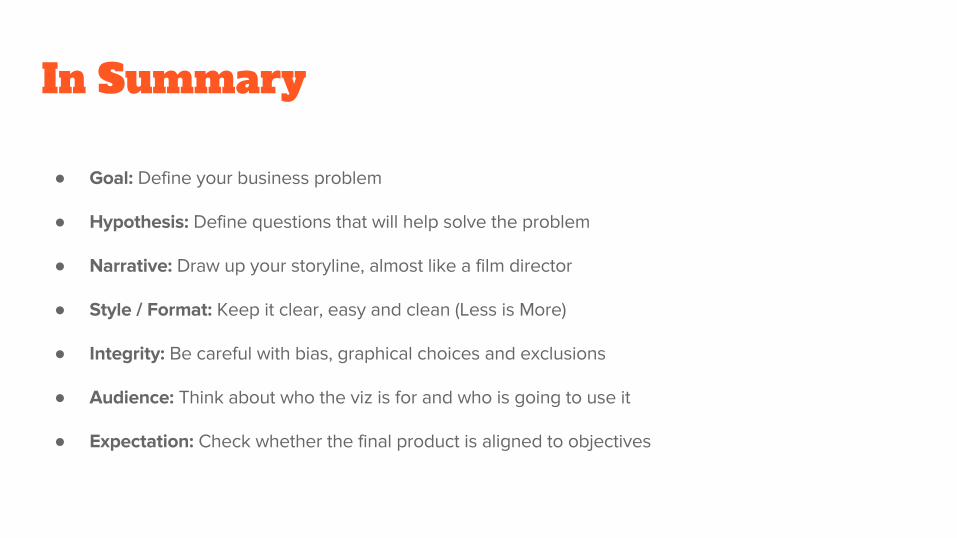
In Summary
●
●
●
●
●
●
●
