visual assessment of the luminosity of daylight fluorescent pigments and its relationship with...
TRANSCRIPT
JOURNAL OF THE OPTICAL SOCIETY OF AMERICA
Visual Assessment of the Luminosity of Daylight Fluorescent Pigmentsand Its Relationship with Colorimetric Quantities
R. THIELERT AND G. SCHLIEMANN
Unilever Forschungsgesellschaft mbH, Hamburg 50, Germany(Received 15 May 1971)
A visual assessment of the luminosity of 22 different samples of daylight fluorescent pigments has beencarried out by the method of paired comparisons. From these investigations, it can be concluded that alinear relationship exists between the sensation of luminosity and the calorimetric quantity A= Ynr/lY+aY+bpe, which has previously been suggested for characterizing the luminosity of daylight fluorescent pig-ments. Y is the luminous reflectance of the color, p. is its excitation purity, Yfj is the luminous reflectanceof the fluorescent light of the sample, and a and b are constants.INDEx HEADINGS: Color; Fluorescence; Colorimetry; Spectrophotometry; Reflectance.
It has been shown that the visual perception of lumi-nosity of daylight fluorescent pigments is correlatedwith certain calorimetric quantities.' The luminosity,however, was assessed visually with a method bywhich only the rank order of the samples with respectto their luminosity could be evaluated. Therefore, noquantitative relationship could be found between theresults of the visual assessment of luminosity andcolorimetric quantities suggested for the characteriza-tion of luminosity. The visual assessment of luminositywas therefore repeated with a method by which themagnitude of visually perceived luminosity differencesbetween the samples could be determined.
The samples used in this investigation consisted ofrectangular sheets of paper printed with a daylightfluorescent ink or a nonfluorescent ink or with differentmixtures of both. Three sets of samples have beeninvestigated, one with 11 red (set No. 1), one with 11yellow (set No. 2), and one with four red and fouryellow inks (set No. 3).
VISUAL ASSESSMENT
The samples were presented to each of 40 observers,on a table covered with matte gray cardborad. Tri-stimulus values of the cardboard were X=22.29,Y=23.50, and Z=23.44. These values are with refer-ence to illumination with illuminant D60 and to aspectral reflectance pA = 1 for freshly smoked MgO.The samples were illuminated by a CL 20 luminaire2
hanging 50 cm above the table. This luminaire consists3
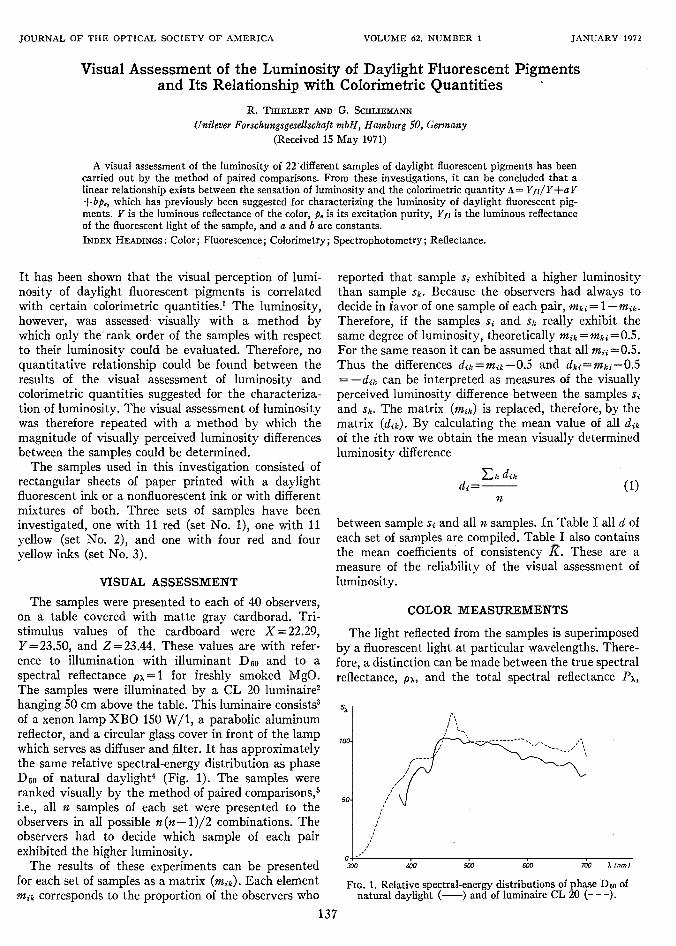
of a xenon lamp XBO 150 W/1, a parabolic aluminumreflector, and a circular glass cover in front of the lampwhich serves as diffuser and filter. It has approximatelythe same relative spectral-energy distribution as phaseD6o of natural daylight4 (Fig. 1). The samples wereranked visually by the method of paired comparisons,6
i.e., all n samples of each set were presented to theobservers in all possible n(n-1)/2 combinations. Theobservers had to decide which sample of each pairexhibited the higher luminosity.
The results of these experiments can be presentedfor each set of samples as a matrix (mik). Each elementinik corresponds to the proportion of the observers who
reported that sample si exhibited a higher luminositythan sample Sk. Because the observers had always todecide in favor of one sample of each pair, Mki= I -rnk.Therefore, if the samples si and sk really exhibit thesame degree of luminosity, theoretically mik=mki=0.5.For the same reason it can be assumed that all mij = 0.5.Thus the differences dik=mik-0.5 and dki=mii-0.5= -dik can be interpreted as measures of the visuallyperceived luminosity difference between the samples siand Sk. The matrix (mik) is replaced, therefore, by thematrix (dik). By calculating the mean value of all dikof the ith row we obtain the mean visually determinedluminosity difference
ETk didi==
n(1)
between sample si and all n samples. In Table I all d ofeach set of samples are compiled. Table I also containsthe mean coefficients of consistency K. These are ameasure of the reliability of the visual assessment ofluminosity.
COLOR MEASUREMENTS
The light reflected from the samples is superimposedby a fluorescent light at particular wavelengths. There-fore, a distinction can be made between the true spectralreflectance, pp., and the total spectral reflectance Px,
100-
so-
0o V300 400 500 600 700 A m)
FIG. 1. Relative spectral-energy distributions of phase D60 ofnatural daylight (-) and of luminaire CL 20 (---).
137
VOLUME 62, NUMBER I JANUARY 1972
11I/I I"II -,
------ -1
II

R. THIELERT AND G. SCHLIEMANN
- .
1.0 d
FIG. 2. Relations between visual perception of luminosityof 11 red samples (set No. 1) and the colorimetric quantitiesA (-+-+-+) and A' (-X-X-).
which contains the emitted fluorescent light. Formally,this fact can be expressed by the formula
PxA=p+fx, (2)
where fx is the spectral distribution of the fluorescentlight. The quantities P), and pie have been measured byuse of a spectrophotometer in the wavelength intervalbetween 380 and 770 nm. These are relative to thespectral reflectance pw - 1 of an opaque layer of freshlysmoked MgO.
In order to determine Px, the light from a xenon lampwas directed towards the inner wall of an integratingsphere. Thus, a diffuse illumination of the samples was
TABLE I. Visually determined luminosity of the samples.
Set No. 1 Set No. 2 Set No. 3
d d dArbitrary Arbitrary Arbitrary
Sample units Sample units Sample units
R 1 0.836 G 1 0.823 R 1 0.706R 2 0.718 G 2 0.636 R 2 0.622R 3 0.577 G 3 0.566 R 4 0.359R 4 0.427 G 4 0.448 R 8 0.841R 5 0.277 G 5 0.355 G 1 0.531R 6 0.150 G 6 0.275 G 2 0.306R 7 0.048 G 7 0.105 G 4 0.128R 8 0.936 G 8 0.939 G 8 0.556R 10 0,602 G 10 0.586R 11 0.586 G 11 0.461R 12 0.341 G 12 0.316
K=0.97 K=0.89 R=0.87
AA'
1.0-
0.5-
0-
0
0
- 0-
- -o
0.5
- Q
1.0 dFIG. 3. Relations between visual perception of luminosity of
11 yellow samples (set No. 2) and the colorimetric quantitiesA (-o-o-) andA' (-*-*-).
1.
TABLE II. Colorimetric data.
XdSample X Y Z (nm) pe Yf I
R 1 68.77 42.35 17.75 615 0.595 18.14 40.60R 2 61.14 36.49 11.27 610 0.696 14.20 37.27R 3 54.90 32.40 8.68 609 0.732 10.48 36.11R 4 49.78 29.25 7.42 609 0.743 7.27 35.41R 5 46.58 26.89 6.09 609 0.773 6.03 33.87R 6 44.31 25.53 5.67 609 0.778 4.75 33.63R 7 35.87 20.59 4.75 610 0.767 ... 33.43R 8 64.26 36.02 8.58 612 0.770 18.43 31.89R 10 52.36 29.22 4.92 609 0.835 11.52 30.82R 11 50.28 28.15 4.84 609 0.833 10.06 31.15R 12 44.22 24.89 4.54 609 0.820 6.53 31.58
G 1 78.93 101.49 25.60 566 0.643 20.77 95.84G 2 75.80 95.56 20.45 568 0.692 14.62 96.54G 3 74.14 92.22 18.50 568 0.711 11.43 97.00G 4 72.23 88.75 16.95 569 0.725 8.11 97.43G 5 71.24 86.89 15.88 569 0.733 6.26 97.44G 6 70.12 84.84 14.91 570 0.746 4.26 96.86G 7 66.95 79.11 11.47 571 0.795 94.71G 8 77.28 100.31 16.15 567 0.754 23.64 94.81G 10 73.67 91.07 11.85 569 0.803 10.65 96.27G 11 72.66 89.15 11.42 570 0.812 8.85 96.54G 12 71.33 85.82 10.74 570 0.818 5.60 95.66
obtained from an illuminant that corresponds approxi-mately6 to illuminant D6U. The light reflected andemitted from the sample at 0° was dispersed in a mono-chromator and measured by a photomultiplier.
In order to determine pa, a second monochromatorwas placed between the xenon lamp and the integratingsphere. Thus the samples were illuminated diffusely
A.A'
+44.-+ ---
0 0.5
138 Vol. 62
.
- to
January1972 LUMINOSITY OF DAYLIGHT
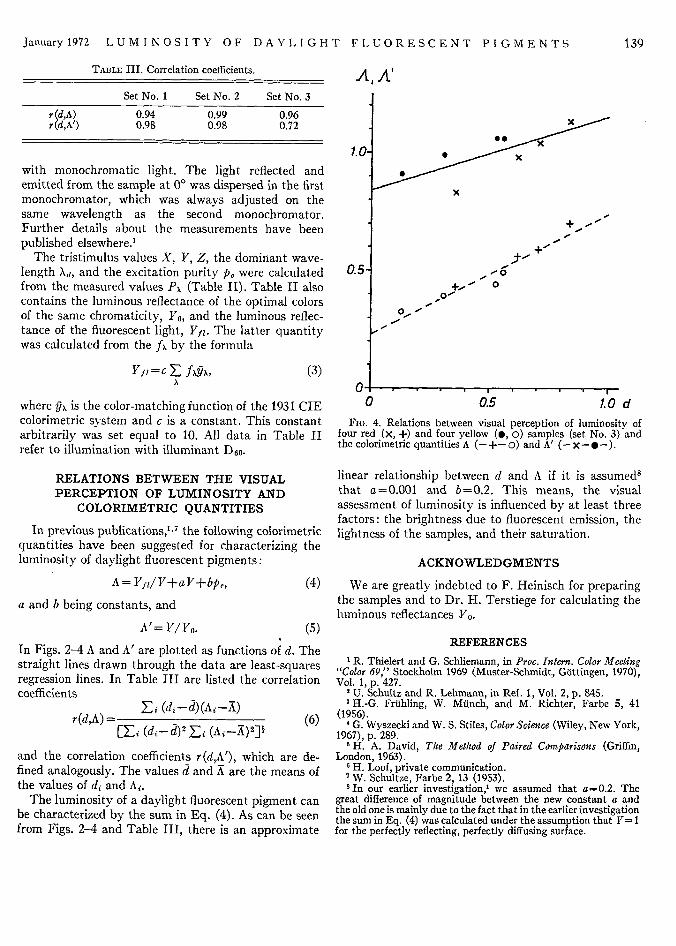
TABLE III. Correlation coefficients.
Set No. 1 Set No. 2 Set No. 3
r(dA) 0.94 0.99 0.96r (d,A') 0.98 0.98 0.72
with monochromatic light. The light reflected andemitted from the sample at 0° was dispersed in the firstmonochromator, which was always adjusted on thesame wavelength as the second monochromator.Further details about the measurements have beenpublished elsewhere.'
The tristimulus values X, Y, Z, the dominant wave-length Xd, and the excitation purity p. were calculatedfrom the measured values P, (Table II). Table II alsocontains the luminous reflectance of the optimal colorsof the same chromaticity, Yo, and the luminous reflec-tance of the fluorescent light, Yfl. The latter quantitywas calculated from the f?. by the formula
Yf I = C E fxAA
FLUORESCENT PIGMENTS 139
A, A'
1.1
(3)
where y,, is the color-matching function of the 1931 CIEcolorimetric system and c is a constant. This constantarbitrarily was set equal to 10. All data in Table IIrefer to illumination with illuminant D60.
RELATIONS BETWEEN THE VISUALPERCEPTION OF LUMINOSITY AND
COLORIMETRIC QUANTITIES
In previous publications,' 7 the following calorimetricquantities have been suggested for characterizing theluminosity of daylight fluorescent pigments:
A = Yf/Y+aY+bpe, (4)
a and b being constants, and
A F= Y/YF. (5)
In Figs. 2-4 A and A' are plotted as functions of d. Thestraight lines drawn through the data are least-squaresregression lines. In Table III are listed the correlationcoefficients
r(d,A) =El-i (di-d)2 57i (Ai-X)22+
and the correlation coefficients r(d,A'), which are de-fined analogously. The values d and A are the means ofthe values of di and Ai.
The luminosity of a daylight fluorescent pigment canbe characterized by the sum in Eq. (4). As can be seenfrom Figs. 2-4 and Table III, there is an approximate
xa
.,0.
0~'
0ox
0 0.5 1.0d
FIG. 4. Relations between visual perception of luminosity offour red (x, +) and four yellow (-, o) samples (set No. 3) andthe calorimetric quantities A (-+-o) and A' (-X-*-).
linear relationship between d and A if it is assumed'that a=0.001 and b=0.2. This means, the visualassessment of luminosity is influenced by at least threefactors: the brightness due to fluorescent emission, thelightness of the samples, and their saturation.
ACKNOWLEDGMENTS
We are greatly indebted to F. Heinisch for preparingthe samples and to Dr. H. Terstiege for calculating theluminous reflectances Yo.
REFERENCES1 R. Thielert and G. Schliemann, in Proc. Intern. Color Meeting
"Color 69," Stockholm 1969 (Muster-Schmidt, Gettingen, 1970),Vol. 1, p. 427.
2 U. Schultz and R. Lehmann, in Ref. 1, Vol. 2, p. 845.aH.-G. Frfthling, W. Munch, and M. Richter, Farbe 5, 41
(1956).4 G. Wyszecki and W. S. Stiles, Color Science (Wiley, New York,
1967), p. 289.H H. A. David, The Method of Paired Comparisons (Griffin,
London, 1963).H. Loof, private communication.W. Schultze, Farbe 2, 13 (1953).
'In our earlier investigation,' we assumed that a=0.2. Thegreat difference of magnitude between the new constant a andthe old one is mainly due to the fact that in the earlier investigationthe sum in Eq. (4) was calculated under the assumption that Y= Ifor the perfectly reflecting, perfectly diffusing surface.