visit python interface manual -...
TRANSCRIPT
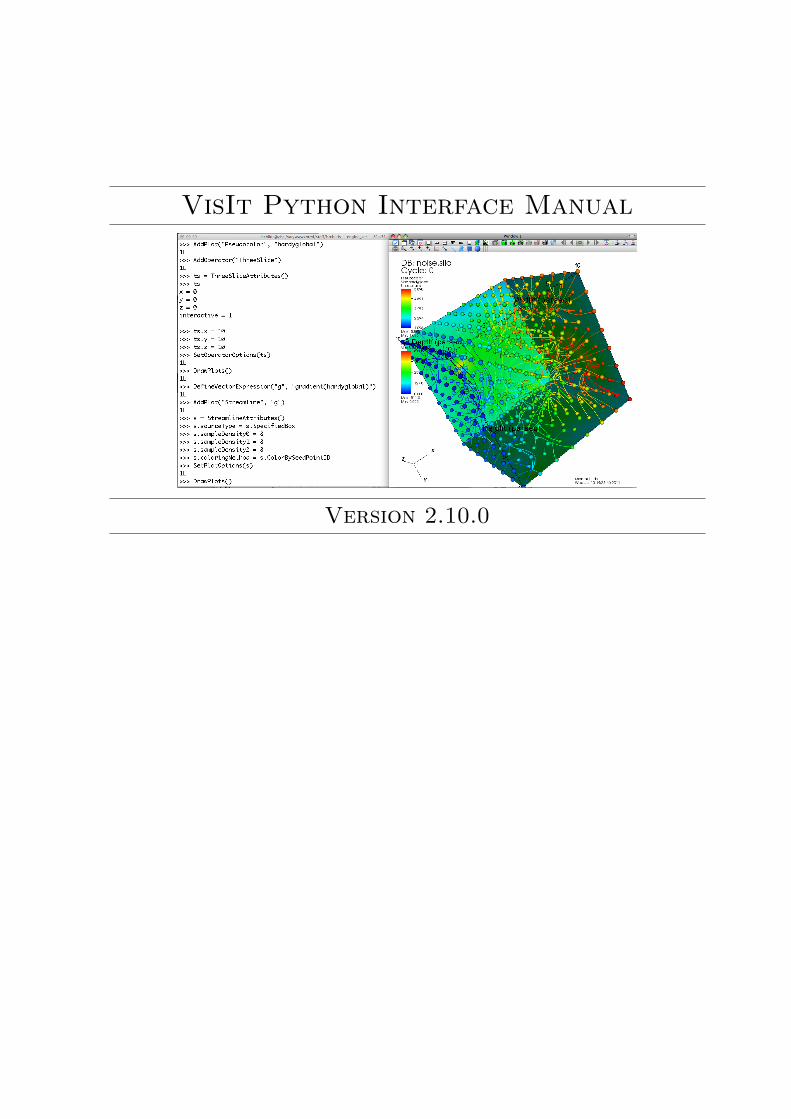
VisIt Python Interface Manual
Version 2.10.0
Contents
1 Introduction to VisIt 11.1 Overview . . . . . . . . . . . . . . . . . . . . . . . . . . . . . . . . . . . . . . . . . . . . 11.2 Manual chapters . . . . . . . . . . . . . . . . . . . . . . . . . . . . . . . . . . . . . . . . 11.3 Understanding how VisIt works . . . . . . . . . . . . . . . . . . . . . . . . . . . . . . . . 11.4 Starting VisIt . . . . . . . . . . . . . . . . . . . . . . . . . . . . . . . . . . . . . . . . . . 31.5 Getting started . . . . . . . . . . . . . . . . . . . . . . . . . . . . . . . . . . . . . . . . . 3
2 Python 52.1 Overview . . . . . . . . . . . . . . . . . . . . . . . . . . . . . . . . . . . . . . . . . . . . 52.2 Indentation . . . . . . . . . . . . . . . . . . . . . . . . . . . . . . . . . . . . . . . . . . . 52.3 Comments . . . . . . . . . . . . . . . . . . . . . . . . . . . . . . . . . . . . . . . . . . . . 52.4 Identifiers . . . . . . . . . . . . . . . . . . . . . . . . . . . . . . . . . . . . . . . . . . . . 62.5 Data types . . . . . . . . . . . . . . . . . . . . . . . . . . . . . . . . . . . . . . . . . . . 6
2.5.1 Strings . . . . . . . . . . . . . . . . . . . . . . . . . . . . . . . . . . . . . . . . . . 62.5.2 Tuples . . . . . . . . . . . . . . . . . . . . . . . . . . . . . . . . . . . . . . . . . . 62.5.3 Lists . . . . . . . . . . . . . . . . . . . . . . . . . . . . . . . . . . . . . . . . . . . 72.5.4 Dictionaries . . . . . . . . . . . . . . . . . . . . . . . . . . . . . . . . . . . . . . . 7
2.6 Control flow . . . . . . . . . . . . . . . . . . . . . . . . . . . . . . . . . . . . . . . . . . . 72.6.1 if/elif/else . . . . . . . . . . . . . . . . . . . . . . . . . . . . . . . . . . . . . . . . 72.6.2 For loop . . . . . . . . . . . . . . . . . . . . . . . . . . . . . . . . . . . . . . . . . 82.6.3 While loop . . . . . . . . . . . . . . . . . . . . . . . . . . . . . . . . . . . . . . . 8
2.7 Functions . . . . . . . . . . . . . . . . . . . . . . . . . . . . . . . . . . . . . . . . . . . . 8
3 Quick Recipes 103.1 Overview . . . . . . . . . . . . . . . . . . . . . . . . . . . . . . . . . . . . . . . . . . . . 103.2 How to start . . . . . . . . . . . . . . . . . . . . . . . . . . . . . . . . . . . . . . . . . . 10
3.2.1 Using session files . . . . . . . . . . . . . . . . . . . . . . . . . . . . . . . . . . . 103.2.2 Getting something on the screen . . . . . . . . . . . . . . . . . . . . . . . . . . . 11
3.3 Saving images . . . . . . . . . . . . . . . . . . . . . . . . . . . . . . . . . . . . . . . . . . 113.3.1 Setting the output image characteristics . . . . . . . . . . . . . . . . . . . . . . . 113.3.2 Saving an image . . . . . . . . . . . . . . . . . . . . . . . . . . . . . . . . . . . . 12
3.4 Working with databases . . . . . . . . . . . . . . . . . . . . . . . . . . . . . . . . . . . . 123.4.1 Opening a database . . . . . . . . . . . . . . . . . . . . . . . . . . . . . . . . . . 123.4.2 Opening a database at late time . . . . . . . . . . . . . . . . . . . . . . . . . . . 123.4.3 Opening a virtual database . . . . . . . . . . . . . . . . . . . . . . . . . . . . . . 133.4.4 Opening a remote database . . . . . . . . . . . . . . . . . . . . . . . . . . . . . . 133.4.5 Opening a compute engine . . . . . . . . . . . . . . . . . . . . . . . . . . . . . . 13
3.5 Working with plots . . . . . . . . . . . . . . . . . . . . . . . . . . . . . . . . . . . . . . . 133.5.1 Creating a plot . . . . . . . . . . . . . . . . . . . . . . . . . . . . . . . . . . . . . 143.5.2 Plotting materials . . . . . . . . . . . . . . . . . . . . . . . . . . . . . . . . . . . 14
i
CONTENTS CONTENTS
3.5.3 Setting plot attributes . . . . . . . . . . . . . . . . . . . . . . . . . . . . . . . . . 143.5.4 Working with multiple plots . . . . . . . . . . . . . . . . . . . . . . . . . . . . . . 153.5.5 Plots in the error state . . . . . . . . . . . . . . . . . . . . . . . . . . . . . . . . . 15
3.6 Operators . . . . . . . . . . . . . . . . . . . . . . . . . . . . . . . . . . . . . . . . . . . . 163.6.1 Adding operators . . . . . . . . . . . . . . . . . . . . . . . . . . . . . . . . . . . . 163.6.2 Setting operator attributes . . . . . . . . . . . . . . . . . . . . . . . . . . . . . . 16
3.7 Quantitative operations . . . . . . . . . . . . . . . . . . . . . . . . . . . . . . . . . . . . 173.7.1 Defining expressions . . . . . . . . . . . . . . . . . . . . . . . . . . . . . . . . . . 173.7.2 Pick . . . . . . . . . . . . . . . . . . . . . . . . . . . . . . . . . . . . . . . . . . . 173.7.3 Lineout . . . . . . . . . . . . . . . . . . . . . . . . . . . . . . . . . . . . . . . . . 183.7.4 Query . . . . . . . . . . . . . . . . . . . . . . . . . . . . . . . . . . . . . . . . . . 183.7.5 Finding the min and the max . . . . . . . . . . . . . . . . . . . . . . . . . . . . . 18
3.8 Subsetting . . . . . . . . . . . . . . . . . . . . . . . . . . . . . . . . . . . . . . . . . . . . 193.8.1 Turning off domains . . . . . . . . . . . . . . . . . . . . . . . . . . . . . . . . . . 193.8.2 Turning off materials . . . . . . . . . . . . . . . . . . . . . . . . . . . . . . . . . . 19
3.9 View . . . . . . . . . . . . . . . . . . . . . . . . . . . . . . . . . . . . . . . . . . . . . . . 203.9.1 Setting the 2D view . . . . . . . . . . . . . . . . . . . . . . . . . . . . . . . . . . 203.9.2 Setting the 3D view . . . . . . . . . . . . . . . . . . . . . . . . . . . . . . . . . . 203.9.3 Flying around plots . . . . . . . . . . . . . . . . . . . . . . . . . . . . . . . . . . 21
3.10 Working with annotations . . . . . . . . . . . . . . . . . . . . . . . . . . . . . . . . . . . 223.10.1 Using gradient background colors . . . . . . . . . . . . . . . . . . . . . . . . . . . 233.10.2 Adding a banner . . . . . . . . . . . . . . . . . . . . . . . . . . . . . . . . . . . . 233.10.3 Adding a time slider . . . . . . . . . . . . . . . . . . . . . . . . . . . . . . . . . . 243.10.4 Adding a logo . . . . . . . . . . . . . . . . . . . . . . . . . . . . . . . . . . . . . . 24
4 Functions 26ActivateDatabase . . . . . . . . . . . . . . . . . . . . . . . . . . . . . . . . . . . . . . . . 26AddArgument . . . . . . . . . . . . . . . . . . . . . . . . . . . . . . . . . . . . . . . . . . 27AddMachineProfile . . . . . . . . . . . . . . . . . . . . . . . . . . . . . . . . . . . . . . . 28AddOperator . . . . . . . . . . . . . . . . . . . . . . . . . . . . . . . . . . . . . . . . . . 29AddPlot . . . . . . . . . . . . . . . . . . . . . . . . . . . . . . . . . . . . . . . . . . . . . 30AddWindow . . . . . . . . . . . . . . . . . . . . . . . . . . . . . . . . . . . . . . . . . . . 31AlterDatabaseCorrelation . . . . . . . . . . . . . . . . . . . . . . . . . . . . . . . . . . . 32ApplyNamedSelection . . . . . . . . . . . . . . . . . . . . . . . . . . . . . . . . . . . . . 33ChangeActivePlotsVar . . . . . . . . . . . . . . . . . . . . . . . . . . . . . . . . . . . . . 34CheckForNewStates . . . . . . . . . . . . . . . . . . . . . . . . . . . . . . . . . . . . . . 35ChooseCenterOfRotation . . . . . . . . . . . . . . . . . . . . . . . . . . . . . . . . . . . 36ClearAllWindows . . . . . . . . . . . . . . . . . . . . . . . . . . . . . . . . . . . . . . . . 37ClearCache . . . . . . . . . . . . . . . . . . . . . . . . . . . . . . . . . . . . . . . . . . . 38ClearCacheForAllEngines . . . . . . . . . . . . . . . . . . . . . . . . . . . . . . . . . . . 39ClearMacros . . . . . . . . . . . . . . . . . . . . . . . . . . . . . . . . . . . . . . . . . . . 40ClearPickPoints . . . . . . . . . . . . . . . . . . . . . . . . . . . . . . . . . . . . . . . . . 41ClearReferenceLines . . . . . . . . . . . . . . . . . . . . . . . . . . . . . . . . . . . . . . 42ClearViewKeyframes . . . . . . . . . . . . . . . . . . . . . . . . . . . . . . . . . . . . . . 43ClearWindow . . . . . . . . . . . . . . . . . . . . . . . . . . . . . . . . . . . . . . . . . . 44CloneWindow . . . . . . . . . . . . . . . . . . . . . . . . . . . . . . . . . . . . . . . . . . 45Close . . . . . . . . . . . . . . . . . . . . . . . . . . . . . . . . . . . . . . . . . . . . . . . 46CloseComputeEngine . . . . . . . . . . . . . . . . . . . . . . . . . . . . . . . . . . . . . . 47CloseDatabase . . . . . . . . . . . . . . . . . . . . . . . . . . . . . . . . . . . . . . . . . 48ColorTableNames . . . . . . . . . . . . . . . . . . . . . . . . . . . . . . . . . . . . . . . . 49ConstructDataBinning . . . . . . . . . . . . . . . . . . . . . . . . . . . . . . . . . . . . . 50CopyAnnotationsToWindow . . . . . . . . . . . . . . . . . . . . . . . . . . . . . . . . . . 51
ii
CONTENTS CONTENTS
CopyLightingToWindow . . . . . . . . . . . . . . . . . . . . . . . . . . . . . . . . . . . . 52CopyPlotsToWindow . . . . . . . . . . . . . . . . . . . . . . . . . . . . . . . . . . . . . . 53CopyViewToWindow . . . . . . . . . . . . . . . . . . . . . . . . . . . . . . . . . . . . . . 54CreateAnnotationObject . . . . . . . . . . . . . . . . . . . . . . . . . . . . . . . . . . . . 55CreateDatabaseCorrelation . . . . . . . . . . . . . . . . . . . . . . . . . . . . . . . . . . 56CreateNamedSelection . . . . . . . . . . . . . . . . . . . . . . . . . . . . . . . . . . . . . 58DeIconifyAllWindows . . . . . . . . . . . . . . . . . . . . . . . . . . . . . . . . . . . . . 59DefineArrayExpression . . . . . . . . . . . . . . . . . . . . . . . . . . . . . . . . . . . . . 60DefineCurveExpression . . . . . . . . . . . . . . . . . . . . . . . . . . . . . . . . . . . . . 61DefineMaterialExpression . . . . . . . . . . . . . . . . . . . . . . . . . . . . . . . . . . . 62DefineMeshExpression . . . . . . . . . . . . . . . . . . . . . . . . . . . . . . . . . . . . . 63DefinePythonExpression . . . . . . . . . . . . . . . . . . . . . . . . . . . . . . . . . . . . 64DefineScalarExpression . . . . . . . . . . . . . . . . . . . . . . . . . . . . . . . . . . . . . 65DefineSpeciesExpression . . . . . . . . . . . . . . . . . . . . . . . . . . . . . . . . . . . . 66DefineTensorExpression . . . . . . . . . . . . . . . . . . . . . . . . . . . . . . . . . . . . 67DefineVectorExpression . . . . . . . . . . . . . . . . . . . . . . . . . . . . . . . . . . . . 68DeleteActivePlots . . . . . . . . . . . . . . . . . . . . . . . . . . . . . . . . . . . . . . . . 69DeleteAllPlots . . . . . . . . . . . . . . . . . . . . . . . . . . . . . . . . . . . . . . . . . 70DeleteDatabaseCorrelation . . . . . . . . . . . . . . . . . . . . . . . . . . . . . . . . . . 71DeleteExpression . . . . . . . . . . . . . . . . . . . . . . . . . . . . . . . . . . . . . . . . 72DeleteNamedSelection . . . . . . . . . . . . . . . . . . . . . . . . . . . . . . . . . . . . . 73DeletePlotDatabaseKeyframe . . . . . . . . . . . . . . . . . . . . . . . . . . . . . . . . . 74DeletePlotKeyframe . . . . . . . . . . . . . . . . . . . . . . . . . . . . . . . . . . . . . . 75DeleteViewKeyframe . . . . . . . . . . . . . . . . . . . . . . . . . . . . . . . . . . . . . . 76DeleteWindow . . . . . . . . . . . . . . . . . . . . . . . . . . . . . . . . . . . . . . . . . 77DemoteOperator . . . . . . . . . . . . . . . . . . . . . . . . . . . . . . . . . . . . . . . . 78DisableRedraw . . . . . . . . . . . . . . . . . . . . . . . . . . . . . . . . . . . . . . . . . 79DrawPlots . . . . . . . . . . . . . . . . . . . . . . . . . . . . . . . . . . . . . . . . . . . . 80EnableTool . . . . . . . . . . . . . . . . . . . . . . . . . . . . . . . . . . . . . . . . . . . 81ExecuteMacro . . . . . . . . . . . . . . . . . . . . . . . . . . . . . . . . . . . . . . . . . . 82ExportDatabase . . . . . . . . . . . . . . . . . . . . . . . . . . . . . . . . . . . . . . . . 83Expressions . . . . . . . . . . . . . . . . . . . . . . . . . . . . . . . . . . . . . . . . . . . 84GetActiveContinuousColorTable . . . . . . . . . . . . . . . . . . . . . . . . . . . . . . . 85GetActiveDiscreteColorTable . . . . . . . . . . . . . . . . . . . . . . . . . . . . . . . . . 86GetActiveTimeSlider . . . . . . . . . . . . . . . . . . . . . . . . . . . . . . . . . . . . . . 87GetAnimationAttributes . . . . . . . . . . . . . . . . . . . . . . . . . . . . . . . . . . . . 88GetAnimationTimeout . . . . . . . . . . . . . . . . . . . . . . . . . . . . . . . . . . . . . 89GetAnnotationAttributes . . . . . . . . . . . . . . . . . . . . . . . . . . . . . . . . . . . 90GetAnnotationObject . . . . . . . . . . . . . . . . . . . . . . . . . . . . . . . . . . . . . 91GetAnnotationObjectNames . . . . . . . . . . . . . . . . . . . . . . . . . . . . . . . . . . 92GetCallbackArgumentCount . . . . . . . . . . . . . . . . . . . . . . . . . . . . . . . . . . 93GetCallbackNames . . . . . . . . . . . . . . . . . . . . . . . . . . . . . . . . . . . . . . . 94GetDatabaseNStates . . . . . . . . . . . . . . . . . . . . . . . . . . . . . . . . . . . . . . 95GetDebugLevel . . . . . . . . . . . . . . . . . . . . . . . . . . . . . . . . . . . . . . . . . 96GetDefaultFileOpenOptions . . . . . . . . . . . . . . . . . . . . . . . . . . . . . . . . . . 97GetDomains . . . . . . . . . . . . . . . . . . . . . . . . . . . . . . . . . . . . . . . . . . . 98GetEngineList . . . . . . . . . . . . . . . . . . . . . . . . . . . . . . . . . . . . . . . . . 99GetEngineProperties . . . . . . . . . . . . . . . . . . . . . . . . . . . . . . . . . . . . . . 100GetGlobalAttributes . . . . . . . . . . . . . . . . . . . . . . . . . . . . . . . . . . . . . . 101GetGlobalLineoutAttributes . . . . . . . . . . . . . . . . . . . . . . . . . . . . . . . . . . 102GetInteractorAttributes . . . . . . . . . . . . . . . . . . . . . . . . . . . . . . . . . . . . 103GetKeyframeAttributes . . . . . . . . . . . . . . . . . . . . . . . . . . . . . . . . . . . . 104
iii

CONTENTS CONTENTS
GetLastError . . . . . . . . . . . . . . . . . . . . . . . . . . . . . . . . . . . . . . . . . . 105GetLight . . . . . . . . . . . . . . . . . . . . . . . . . . . . . . . . . . . . . . . . . . . . . 106GetLocalHostName . . . . . . . . . . . . . . . . . . . . . . . . . . . . . . . . . . . . . . . 107GetLocalUserName . . . . . . . . . . . . . . . . . . . . . . . . . . . . . . . . . . . . . . . 108GetMachineProfile . . . . . . . . . . . . . . . . . . . . . . . . . . . . . . . . . . . . . . . 109GetMachineProfileNames . . . . . . . . . . . . . . . . . . . . . . . . . . . . . . . . . . . 110GetMaterialAttributes . . . . . . . . . . . . . . . . . . . . . . . . . . . . . . . . . . . . . 111GetMaterials . . . . . . . . . . . . . . . . . . . . . . . . . . . . . . . . . . . . . . . . . . 112GetMeshManagementAttributes . . . . . . . . . . . . . . . . . . . . . . . . . . . . . . . . 113GetMetaData . . . . . . . . . . . . . . . . . . . . . . . . . . . . . . . . . . . . . . . . . . 114GetNumPlots . . . . . . . . . . . . . . . . . . . . . . . . . . . . . . . . . . . . . . . . . . 115GetOperatorOptions . . . . . . . . . . . . . . . . . . . . . . . . . . . . . . . . . . . . . . 116GetPickAttributes . . . . . . . . . . . . . . . . . . . . . . . . . . . . . . . . . . . . . . . 117GetPickOutput . . . . . . . . . . . . . . . . . . . . . . . . . . . . . . . . . . . . . . . . . 118GetPickOutputObject . . . . . . . . . . . . . . . . . . . . . . . . . . . . . . . . . . . . . 119GetPipelineCachingMode . . . . . . . . . . . . . . . . . . . . . . . . . . . . . . . . . . . 120GetPlotInformation . . . . . . . . . . . . . . . . . . . . . . . . . . . . . . . . . . . . . . . 121GetPlotList . . . . . . . . . . . . . . . . . . . . . . . . . . . . . . . . . . . . . . . . . . . 122GetPlotOptions . . . . . . . . . . . . . . . . . . . . . . . . . . . . . . . . . . . . . . . . . 123GetPreferredFileFormats . . . . . . . . . . . . . . . . . . . . . . . . . . . . . . . . . . . . 124GetQueryOutputObject . . . . . . . . . . . . . . . . . . . . . . . . . . . . . . . . . . . . 125GetQueryOutputString . . . . . . . . . . . . . . . . . . . . . . . . . . . . . . . . . . . . 126GetQueryOutputValue . . . . . . . . . . . . . . . . . . . . . . . . . . . . . . . . . . . . . 127GetQueryOutputXML . . . . . . . . . . . . . . . . . . . . . . . . . . . . . . . . . . . . . 128GetQueryOverTimeAttributes . . . . . . . . . . . . . . . . . . . . . . . . . . . . . . . . . 129GetQueryParameters . . . . . . . . . . . . . . . . . . . . . . . . . . . . . . . . . . . . . . 130GetRenderingAttributes . . . . . . . . . . . . . . . . . . . . . . . . . . . . . . . . . . . . 131GetSaveWindowAttributes . . . . . . . . . . . . . . . . . . . . . . . . . . . . . . . . . . . 132GetSelection . . . . . . . . . . . . . . . . . . . . . . . . . . . . . . . . . . . . . . . . . . . 133GetSelectionList . . . . . . . . . . . . . . . . . . . . . . . . . . . . . . . . . . . . . . . . 134GetSelectionSummary . . . . . . . . . . . . . . . . . . . . . . . . . . . . . . . . . . . . . 135GetTimeSliders . . . . . . . . . . . . . . . . . . . . . . . . . . . . . . . . . . . . . . . . . 136GetUltraScript . . . . . . . . . . . . . . . . . . . . . . . . . . . . . . . . . . . . . . . . . 137GetView2D . . . . . . . . . . . . . . . . . . . . . . . . . . . . . . . . . . . . . . . . . . . 138GetView3D . . . . . . . . . . . . . . . . . . . . . . . . . . . . . . . . . . . . . . . . . . . 139GetViewAxisArray . . . . . . . . . . . . . . . . . . . . . . . . . . . . . . . . . . . . . . . 140GetViewCurve . . . . . . . . . . . . . . . . . . . . . . . . . . . . . . . . . . . . . . . . . 141GetWindowInformation . . . . . . . . . . . . . . . . . . . . . . . . . . . . . . . . . . . . 142HideActivePlots . . . . . . . . . . . . . . . . . . . . . . . . . . . . . . . . . . . . . . . . . 143HideToolbars . . . . . . . . . . . . . . . . . . . . . . . . . . . . . . . . . . . . . . . . . . 144IconifyAllWindows . . . . . . . . . . . . . . . . . . . . . . . . . . . . . . . . . . . . . . . 145InitializeNamedSelectionVariables . . . . . . . . . . . . . . . . . . . . . . . . . . . . . . . 146InvertBackgroundColor . . . . . . . . . . . . . . . . . . . . . . . . . . . . . . . . . . . . 147Launch . . . . . . . . . . . . . . . . . . . . . . . . . . . . . . . . . . . . . . . . . . . . . 148LaunchNowin . . . . . . . . . . . . . . . . . . . . . . . . . . . . . . . . . . . . . . . . . . 149Lineout . . . . . . . . . . . . . . . . . . . . . . . . . . . . . . . . . . . . . . . . . . . . . 150ListDomains . . . . . . . . . . . . . . . . . . . . . . . . . . . . . . . . . . . . . . . . . . . 151ListMaterials . . . . . . . . . . . . . . . . . . . . . . . . . . . . . . . . . . . . . . . . . . 152ListPlots . . . . . . . . . . . . . . . . . . . . . . . . . . . . . . . . . . . . . . . . . . . . . 153LoadAttribute . . . . . . . . . . . . . . . . . . . . . . . . . . . . . . . . . . . . . . . . . . 154LoadNamedSelection . . . . . . . . . . . . . . . . . . . . . . . . . . . . . . . . . . . . . . 155LoadUltra . . . . . . . . . . . . . . . . . . . . . . . . . . . . . . . . . . . . . . . . . . . . 156
iv
CONTENTS CONTENTS
LocalNameSpace . . . . . . . . . . . . . . . . . . . . . . . . . . . . . . . . . . . . . . . . 157LongFileName . . . . . . . . . . . . . . . . . . . . . . . . . . . . . . . . . . . . . . . . . 158MoveAndResizeWindow . . . . . . . . . . . . . . . . . . . . . . . . . . . . . . . . . . . . 159MovePlotDatabaseKeyframe . . . . . . . . . . . . . . . . . . . . . . . . . . . . . . . . . . 160MovePlotKeyframe . . . . . . . . . . . . . . . . . . . . . . . . . . . . . . . . . . . . . . . 161MovePlotOrderTowardFirst . . . . . . . . . . . . . . . . . . . . . . . . . . . . . . . . . . 162MovePlotOrderTowardLast . . . . . . . . . . . . . . . . . . . . . . . . . . . . . . . . . . 163MoveViewKeyframe . . . . . . . . . . . . . . . . . . . . . . . . . . . . . . . . . . . . . . 164MoveWindow . . . . . . . . . . . . . . . . . . . . . . . . . . . . . . . . . . . . . . . . . . 165NodePick . . . . . . . . . . . . . . . . . . . . . . . . . . . . . . . . . . . . . . . . . . . . 166NumColorTableNames . . . . . . . . . . . . . . . . . . . . . . . . . . . . . . . . . . . . . 167NumOperatorPlugins . . . . . . . . . . . . . . . . . . . . . . . . . . . . . . . . . . . . . . 168NumPlotPlugins . . . . . . . . . . . . . . . . . . . . . . . . . . . . . . . . . . . . . . . . 169OpenComputeEngine . . . . . . . . . . . . . . . . . . . . . . . . . . . . . . . . . . . . . . 170OpenDatabase . . . . . . . . . . . . . . . . . . . . . . . . . . . . . . . . . . . . . . . . . 171OpenMDServer . . . . . . . . . . . . . . . . . . . . . . . . . . . . . . . . . . . . . . . . . 172OperatorPlugins . . . . . . . . . . . . . . . . . . . . . . . . . . . . . . . . . . . . . . . . 173OverlayDatabase . . . . . . . . . . . . . . . . . . . . . . . . . . . . . . . . . . . . . . . . 174Pick . . . . . . . . . . . . . . . . . . . . . . . . . . . . . . . . . . . . . . . . . . . . . . . 175PickByGlobalNode . . . . . . . . . . . . . . . . . . . . . . . . . . . . . . . . . . . . . . . 176PickByGlobalZone . . . . . . . . . . . . . . . . . . . . . . . . . . . . . . . . . . . . . . . 177PickByNode . . . . . . . . . . . . . . . . . . . . . . . . . . . . . . . . . . . . . . . . . . . 178PickByZone . . . . . . . . . . . . . . . . . . . . . . . . . . . . . . . . . . . . . . . . . . . 179PlotPlugins . . . . . . . . . . . . . . . . . . . . . . . . . . . . . . . . . . . . . . . . . . . 180PointPick . . . . . . . . . . . . . . . . . . . . . . . . . . . . . . . . . . . . . . . . . . . . 181PrintWindow . . . . . . . . . . . . . . . . . . . . . . . . . . . . . . . . . . . . . . . . . . 182PromoteOperator . . . . . . . . . . . . . . . . . . . . . . . . . . . . . . . . . . . . . . . . 183PythonQuery . . . . . . . . . . . . . . . . . . . . . . . . . . . . . . . . . . . . . . . . . . 184Queries . . . . . . . . . . . . . . . . . . . . . . . . . . . . . . . . . . . . . . . . . . . . . 185QueriesOverTime . . . . . . . . . . . . . . . . . . . . . . . . . . . . . . . . . . . . . . . . 186Query . . . . . . . . . . . . . . . . . . . . . . . . . . . . . . . . . . . . . . . . . . . . . . 187QueryOverTime . . . . . . . . . . . . . . . . . . . . . . . . . . . . . . . . . . . . . . . . 188ReOpenDatabase . . . . . . . . . . . . . . . . . . . . . . . . . . . . . . . . . . . . . . . . 189ReadHostProfilesFromDirectory . . . . . . . . . . . . . . . . . . . . . . . . . . . . . . . . 190RecenterView . . . . . . . . . . . . . . . . . . . . . . . . . . . . . . . . . . . . . . . . . . 191RedoView . . . . . . . . . . . . . . . . . . . . . . . . . . . . . . . . . . . . . . . . . . . . 192RedrawWindow . . . . . . . . . . . . . . . . . . . . . . . . . . . . . . . . . . . . . . . . . 193RegisterCallback . . . . . . . . . . . . . . . . . . . . . . . . . . . . . . . . . . . . . . . . 194RegisterMacro . . . . . . . . . . . . . . . . . . . . . . . . . . . . . . . . . . . . . . . . . 195RemoveAllOperators . . . . . . . . . . . . . . . . . . . . . . . . . . . . . . . . . . . . . . 196RemoveLastOperator . . . . . . . . . . . . . . . . . . . . . . . . . . . . . . . . . . . . . . 197RemoveMachineProfile . . . . . . . . . . . . . . . . . . . . . . . . . . . . . . . . . . . . . 198RemoveOperator . . . . . . . . . . . . . . . . . . . . . . . . . . . . . . . . . . . . . . . . 199RenamePickLabel . . . . . . . . . . . . . . . . . . . . . . . . . . . . . . . . . . . . . . . . 200ReplaceDatabase . . . . . . . . . . . . . . . . . . . . . . . . . . . . . . . . . . . . . . . . 201ResetLineoutColor . . . . . . . . . . . . . . . . . . . . . . . . . . . . . . . . . . . . . . . 202ResetOperatorOptions . . . . . . . . . . . . . . . . . . . . . . . . . . . . . . . . . . . . . 203ResetPickLetter . . . . . . . . . . . . . . . . . . . . . . . . . . . . . . . . . . . . . . . . . 204ResetPlotOptions . . . . . . . . . . . . . . . . . . . . . . . . . . . . . . . . . . . . . . . . 205ResetView . . . . . . . . . . . . . . . . . . . . . . . . . . . . . . . . . . . . . . . . . . . . 206ResizeWindow . . . . . . . . . . . . . . . . . . . . . . . . . . . . . . . . . . . . . . . . . 207RestoreSession . . . . . . . . . . . . . . . . . . . . . . . . . . . . . . . . . . . . . . . . . 208
v
CONTENTS CONTENTS
RestoreSessionWithDifferentSources . . . . . . . . . . . . . . . . . . . . . . . . . . . . . 209SaveAttribute . . . . . . . . . . . . . . . . . . . . . . . . . . . . . . . . . . . . . . . . . . 210SaveNamedSelection . . . . . . . . . . . . . . . . . . . . . . . . . . . . . . . . . . . . . . 211SaveSession . . . . . . . . . . . . . . . . . . . . . . . . . . . . . . . . . . . . . . . . . . . 212SaveWindow . . . . . . . . . . . . . . . . . . . . . . . . . . . . . . . . . . . . . . . . . . 213SendSimulationCommand . . . . . . . . . . . . . . . . . . . . . . . . . . . . . . . . . . . 214SetActiveContinuousColorTable . . . . . . . . . . . . . . . . . . . . . . . . . . . . . . . . 215SetActiveDiscreteColorTable . . . . . . . . . . . . . . . . . . . . . . . . . . . . . . . . . 216SetActivePlots . . . . . . . . . . . . . . . . . . . . . . . . . . . . . . . . . . . . . . . . . 217SetActiveTimeSlider . . . . . . . . . . . . . . . . . . . . . . . . . . . . . . . . . . . . . . 218SetActiveWindow . . . . . . . . . . . . . . . . . . . . . . . . . . . . . . . . . . . . . . . . 219SetAnimationTimeout . . . . . . . . . . . . . . . . . . . . . . . . . . . . . . . . . . . . . 220SetAnnotationAttributes . . . . . . . . . . . . . . . . . . . . . . . . . . . . . . . . . . . . 221SetCenterOfRotation . . . . . . . . . . . . . . . . . . . . . . . . . . . . . . . . . . . . . . 222SetColorTexturingEnabled . . . . . . . . . . . . . . . . . . . . . . . . . . . . . . . . . . . 223SetCreateMeshQualityExpressions . . . . . . . . . . . . . . . . . . . . . . . . . . . . . . 224SetCreateTimeDerivativeExpressions . . . . . . . . . . . . . . . . . . . . . . . . . . . . . 225SetCreateVectorMagnitudeExpressions . . . . . . . . . . . . . . . . . . . . . . . . . . . . 226SetDatabaseCorrelationOptions . . . . . . . . . . . . . . . . . . . . . . . . . . . . . . . . 227SetDebugLevel . . . . . . . . . . . . . . . . . . . . . . . . . . . . . . . . . . . . . . . . . 228SetDefaultAnnotationAttributes . . . . . . . . . . . . . . . . . . . . . . . . . . . . . . . 229SetDefaultFileOpenOptions . . . . . . . . . . . . . . . . . . . . . . . . . . . . . . . . . . 230SetDefaultInteractorAttributes . . . . . . . . . . . . . . . . . . . . . . . . . . . . . . . . 231SetDefaultMaterialAttributes . . . . . . . . . . . . . . . . . . . . . . . . . . . . . . . . . 232SetDefaultMeshManagementAttributes . . . . . . . . . . . . . . . . . . . . . . . . . . . . 233SetDefaultOperatorOptions . . . . . . . . . . . . . . . . . . . . . . . . . . . . . . . . . . 234SetDefaultPickAttributes . . . . . . . . . . . . . . . . . . . . . . . . . . . . . . . . . . . 235SetDefaultPlotOptions . . . . . . . . . . . . . . . . . . . . . . . . . . . . . . . . . . . . . 236SetGlobalLineoutAttributes . . . . . . . . . . . . . . . . . . . . . . . . . . . . . . . . . . 237SetInteractorAttributes . . . . . . . . . . . . . . . . . . . . . . . . . . . . . . . . . . . . 238SetKeyframeAttributes . . . . . . . . . . . . . . . . . . . . . . . . . . . . . . . . . . . . . 239SetLight . . . . . . . . . . . . . . . . . . . . . . . . . . . . . . . . . . . . . . . . . . . . . 240SetMachineProfile . . . . . . . . . . . . . . . . . . . . . . . . . . . . . . . . . . . . . . . 241SetMaterialAttributes . . . . . . . . . . . . . . . . . . . . . . . . . . . . . . . . . . . . . 242SetMeshManagementAttributes . . . . . . . . . . . . . . . . . . . . . . . . . . . . . . . . 243SetNamedSelectionAutoApply . . . . . . . . . . . . . . . . . . . . . . . . . . . . . . . . . 244SetOperatorOptions . . . . . . . . . . . . . . . . . . . . . . . . . . . . . . . . . . . . . . 245SetPickAttributes . . . . . . . . . . . . . . . . . . . . . . . . . . . . . . . . . . . . . . . . 246SetPipelineCachingMode . . . . . . . . . . . . . . . . . . . . . . . . . . . . . . . . . . . . 247SetPlotDatabaseState . . . . . . . . . . . . . . . . . . . . . . . . . . . . . . . . . . . . . 248SetPlotDescription . . . . . . . . . . . . . . . . . . . . . . . . . . . . . . . . . . . . . . . 249SetPlotFollowsTime . . . . . . . . . . . . . . . . . . . . . . . . . . . . . . . . . . . . . . 250SetPlotFrameRange . . . . . . . . . . . . . . . . . . . . . . . . . . . . . . . . . . . . . . 251SetPlotOptions . . . . . . . . . . . . . . . . . . . . . . . . . . . . . . . . . . . . . . . . . 252SetPlotOrderToFirst . . . . . . . . . . . . . . . . . . . . . . . . . . . . . . . . . . . . . . 253SetPlotOrderToLast . . . . . . . . . . . . . . . . . . . . . . . . . . . . . . . . . . . . . . 254SetPlotSILRestriction . . . . . . . . . . . . . . . . . . . . . . . . . . . . . . . . . . . . . 255SetPrecisionType . . . . . . . . . . . . . . . . . . . . . . . . . . . . . . . . . . . . . . . . 256SetPreferredFileFormats . . . . . . . . . . . . . . . . . . . . . . . . . . . . . . . . . . . . 257SetPrinterAttributes . . . . . . . . . . . . . . . . . . . . . . . . . . . . . . . . . . . . . . 258SetQueryFloatFormat . . . . . . . . . . . . . . . . . . . . . . . . . . . . . . . . . . . . . 259SetQueryOutputToObject . . . . . . . . . . . . . . . . . . . . . . . . . . . . . . . . . . . 260
vi
CONTENTS CONTENTS
SetQueryOutputToString . . . . . . . . . . . . . . . . . . . . . . . . . . . . . . . . . . . 261SetQueryOutputToValue . . . . . . . . . . . . . . . . . . . . . . . . . . . . . . . . . . . . 262SetQueryOverTimeAttributes . . . . . . . . . . . . . . . . . . . . . . . . . . . . . . . . . 263SetRemoveDuplicateNodes . . . . . . . . . . . . . . . . . . . . . . . . . . . . . . . . . . . 264SetRenderingAttributes . . . . . . . . . . . . . . . . . . . . . . . . . . . . . . . . . . . . 265SetSaveWindowAttributes . . . . . . . . . . . . . . . . . . . . . . . . . . . . . . . . . . . 266SetTimeSliderState . . . . . . . . . . . . . . . . . . . . . . . . . . . . . . . . . . . . . . . 267SetTreatAllDBsAsTimeVarying . . . . . . . . . . . . . . . . . . . . . . . . . . . . . . . . 268SetTryHarderCyclesTimes . . . . . . . . . . . . . . . . . . . . . . . . . . . . . . . . . . . 269SetUltraScript . . . . . . . . . . . . . . . . . . . . . . . . . . . . . . . . . . . . . . . . . 270SetView2D . . . . . . . . . . . . . . . . . . . . . . . . . . . . . . . . . . . . . . . . . . . 271SetView3D . . . . . . . . . . . . . . . . . . . . . . . . . . . . . . . . . . . . . . . . . . . 272SetViewAxisArray . . . . . . . . . . . . . . . . . . . . . . . . . . . . . . . . . . . . . . . 273SetViewCurve . . . . . . . . . . . . . . . . . . . . . . . . . . . . . . . . . . . . . . . . . . 274SetViewExtentsType . . . . . . . . . . . . . . . . . . . . . . . . . . . . . . . . . . . . . . 275SetViewKeyframe . . . . . . . . . . . . . . . . . . . . . . . . . . . . . . . . . . . . . . . . 276SetWindowArea . . . . . . . . . . . . . . . . . . . . . . . . . . . . . . . . . . . . . . . . . 277SetWindowLayout . . . . . . . . . . . . . . . . . . . . . . . . . . . . . . . . . . . . . . . 278SetWindowMode . . . . . . . . . . . . . . . . . . . . . . . . . . . . . . . . . . . . . . . . 279ShowAllWindows . . . . . . . . . . . . . . . . . . . . . . . . . . . . . . . . . . . . . . . . 280ShowToolbars . . . . . . . . . . . . . . . . . . . . . . . . . . . . . . . . . . . . . . . . . . 281Source . . . . . . . . . . . . . . . . . . . . . . . . . . . . . . . . . . . . . . . . . . . . . . 282SuppressMessages . . . . . . . . . . . . . . . . . . . . . . . . . . . . . . . . . . . . . . . . 283SuppressQueryOutputOff . . . . . . . . . . . . . . . . . . . . . . . . . . . . . . . . . . . 284SuppressQueryOutputOn . . . . . . . . . . . . . . . . . . . . . . . . . . . . . . . . . . . 285TimeSliderGetNStates . . . . . . . . . . . . . . . . . . . . . . . . . . . . . . . . . . . . . 286TimeSliderNextState . . . . . . . . . . . . . . . . . . . . . . . . . . . . . . . . . . . . . . 287TimeSliderPreviousState . . . . . . . . . . . . . . . . . . . . . . . . . . . . . . . . . . . . 288TimeSliderSetState . . . . . . . . . . . . . . . . . . . . . . . . . . . . . . . . . . . . . . . 289ToggleBoundingBoxMode . . . . . . . . . . . . . . . . . . . . . . . . . . . . . . . . . . . 290ToggleCameraViewMode . . . . . . . . . . . . . . . . . . . . . . . . . . . . . . . . . . . . 291ToggleFullFrameMode . . . . . . . . . . . . . . . . . . . . . . . . . . . . . . . . . . . . . 292ToggleLockTime . . . . . . . . . . . . . . . . . . . . . . . . . . . . . . . . . . . . . . . . 293ToggleLockTools . . . . . . . . . . . . . . . . . . . . . . . . . . . . . . . . . . . . . . . . 294ToggleLockViewMode . . . . . . . . . . . . . . . . . . . . . . . . . . . . . . . . . . . . . 295ToggleMaintainViewMode . . . . . . . . . . . . . . . . . . . . . . . . . . . . . . . . . . . 296ToggleSpinMode . . . . . . . . . . . . . . . . . . . . . . . . . . . . . . . . . . . . . . . . 297TurnDomainsOff . . . . . . . . . . . . . . . . . . . . . . . . . . . . . . . . . . . . . . . . 298TurnDomainsOn . . . . . . . . . . . . . . . . . . . . . . . . . . . . . . . . . . . . . . . . 299TurnMaterialsOff . . . . . . . . . . . . . . . . . . . . . . . . . . . . . . . . . . . . . . . . 300TurnMaterialsOn . . . . . . . . . . . . . . . . . . . . . . . . . . . . . . . . . . . . . . . . 301UndoView . . . . . . . . . . . . . . . . . . . . . . . . . . . . . . . . . . . . . . . . . . . . 302UpdateNamedSelection . . . . . . . . . . . . . . . . . . . . . . . . . . . . . . . . . . . . . 303Version . . . . . . . . . . . . . . . . . . . . . . . . . . . . . . . . . . . . . . . . . . . . . 304WriteConfigFile . . . . . . . . . . . . . . . . . . . . . . . . . . . . . . . . . . . . . . . . . 305ZonePick . . . . . . . . . . . . . . . . . . . . . . . . . . . . . . . . . . . . . . . . . . . . 307
5 Attribute References 308AMRStitchCell . . . . . . . . . . . . . . . . . . . . . . . . . . . . . . . . . . . . . . . . . 309Animation . . . . . . . . . . . . . . . . . . . . . . . . . . . . . . . . . . . . . . . . . . . . 310Annotation . . . . . . . . . . . . . . . . . . . . . . . . . . . . . . . . . . . . . . . . . . . 311Axis . . . . . . . . . . . . . . . . . . . . . . . . . . . . . . . . . . . . . . . . . . . . . . . 317
vii
CONTENTS CONTENTS
Boundary . . . . . . . . . . . . . . . . . . . . . . . . . . . . . . . . . . . . . . . . . . . . 318BoundaryOp . . . . . . . . . . . . . . . . . . . . . . . . . . . . . . . . . . . . . . . . . . 319Box . . . . . . . . . . . . . . . . . . . . . . . . . . . . . . . . . . . . . . . . . . . . . . . 320CartographicProjection . . . . . . . . . . . . . . . . . . . . . . . . . . . . . . . . . . . . 321Clip . . . . . . . . . . . . . . . . . . . . . . . . . . . . . . . . . . . . . . . . . . . . . . . 322Cone . . . . . . . . . . . . . . . . . . . . . . . . . . . . . . . . . . . . . . . . . . . . . . . 323ConnectedComponents . . . . . . . . . . . . . . . . . . . . . . . . . . . . . . . . . . . . . 324ConstructDataBinning . . . . . . . . . . . . . . . . . . . . . . . . . . . . . . . . . . . . . 325Contour . . . . . . . . . . . . . . . . . . . . . . . . . . . . . . . . . . . . . . . . . . . . . 326CoordSwap . . . . . . . . . . . . . . . . . . . . . . . . . . . . . . . . . . . . . . . . . . . 329CreateBonds . . . . . . . . . . . . . . . . . . . . . . . . . . . . . . . . . . . . . . . . . . 330Curve . . . . . . . . . . . . . . . . . . . . . . . . . . . . . . . . . . . . . . . . . . . . . . 331Cylinder . . . . . . . . . . . . . . . . . . . . . . . . . . . . . . . . . . . . . . . . . . . . . 333DataBinning . . . . . . . . . . . . . . . . . . . . . . . . . . . . . . . . . . . . . . . . . . 334DeferExpression . . . . . . . . . . . . . . . . . . . . . . . . . . . . . . . . . . . . . . . . . 336Displace . . . . . . . . . . . . . . . . . . . . . . . . . . . . . . . . . . . . . . . . . . . . . 337DualMesh . . . . . . . . . . . . . . . . . . . . . . . . . . . . . . . . . . . . . . . . . . . . 338Edge . . . . . . . . . . . . . . . . . . . . . . . . . . . . . . . . . . . . . . . . . . . . . . . 339Elevate . . . . . . . . . . . . . . . . . . . . . . . . . . . . . . . . . . . . . . . . . . . . . 340EllipsoidSlice . . . . . . . . . . . . . . . . . . . . . . . . . . . . . . . . . . . . . . . . . . 341ExportDB . . . . . . . . . . . . . . . . . . . . . . . . . . . . . . . . . . . . . . . . . . . . 342ExternalSurface . . . . . . . . . . . . . . . . . . . . . . . . . . . . . . . . . . . . . . . . . 343Extrude . . . . . . . . . . . . . . . . . . . . . . . . . . . . . . . . . . . . . . . . . . . . . 344FFT . . . . . . . . . . . . . . . . . . . . . . . . . . . . . . . . . . . . . . . . . . . . . . . 345FilledBoundary . . . . . . . . . . . . . . . . . . . . . . . . . . . . . . . . . . . . . . . . . 346Flux . . . . . . . . . . . . . . . . . . . . . . . . . . . . . . . . . . . . . . . . . . . . . . . 347Font . . . . . . . . . . . . . . . . . . . . . . . . . . . . . . . . . . . . . . . . . . . . . . . 348Global . . . . . . . . . . . . . . . . . . . . . . . . . . . . . . . . . . . . . . . . . . . . . . 349Histogram . . . . . . . . . . . . . . . . . . . . . . . . . . . . . . . . . . . . . . . . . . . . 350IndexSelect . . . . . . . . . . . . . . . . . . . . . . . . . . . . . . . . . . . . . . . . . . . 351IntegralCurve . . . . . . . . . . . . . . . . . . . . . . . . . . . . . . . . . . . . . . . . . . 352InverseGhostZone . . . . . . . . . . . . . . . . . . . . . . . . . . . . . . . . . . . . . . . . 355Isosurface . . . . . . . . . . . . . . . . . . . . . . . . . . . . . . . . . . . . . . . . . . . . 356Isovolume . . . . . . . . . . . . . . . . . . . . . . . . . . . . . . . . . . . . . . . . . . . . 357Keyframe . . . . . . . . . . . . . . . . . . . . . . . . . . . . . . . . . . . . . . . . . . . . 358LCS . . . . . . . . . . . . . . . . . . . . . . . . . . . . . . . . . . . . . . . . . . . . . . . 359Label . . . . . . . . . . . . . . . . . . . . . . . . . . . . . . . . . . . . . . . . . . . . . . 362Lagrangian . . . . . . . . . . . . . . . . . . . . . . . . . . . . . . . . . . . . . . . . . . . 363Light . . . . . . . . . . . . . . . . . . . . . . . . . . . . . . . . . . . . . . . . . . . . . . . 364LimitCycle . . . . . . . . . . . . . . . . . . . . . . . . . . . . . . . . . . . . . . . . . . . 365Lineout . . . . . . . . . . . . . . . . . . . . . . . . . . . . . . . . . . . . . . . . . . . . . 368Material . . . . . . . . . . . . . . . . . . . . . . . . . . . . . . . . . . . . . . . . . . . . . 369Mesh . . . . . . . . . . . . . . . . . . . . . . . . . . . . . . . . . . . . . . . . . . . . . . . 370MeshManagement . . . . . . . . . . . . . . . . . . . . . . . . . . . . . . . . . . . . . . . 371Molecule . . . . . . . . . . . . . . . . . . . . . . . . . . . . . . . . . . . . . . . . . . . . . 372MultiCurve . . . . . . . . . . . . . . . . . . . . . . . . . . . . . . . . . . . . . . . . . . . 373MultiresControl . . . . . . . . . . . . . . . . . . . . . . . . . . . . . . . . . . . . . . . . . 376OnionPeel . . . . . . . . . . . . . . . . . . . . . . . . . . . . . . . . . . . . . . . . . . . . 377ParallelCoordinates . . . . . . . . . . . . . . . . . . . . . . . . . . . . . . . . . . . . . . . 378PersistentParticles . . . . . . . . . . . . . . . . . . . . . . . . . . . . . . . . . . . . . . . 379Poincare . . . . . . . . . . . . . . . . . . . . . . . . . . . . . . . . . . . . . . . . . . . . . 380Printer . . . . . . . . . . . . . . . . . . . . . . . . . . . . . . . . . . . . . . . . . . . . . . 383
viii
CONTENTS CONTENTS
Process . . . . . . . . . . . . . . . . . . . . . . . . . . . . . . . . . . . . . . . . . . . . . 384Project . . . . . . . . . . . . . . . . . . . . . . . . . . . . . . . . . . . . . . . . . . . . . 385Pseudocolor . . . . . . . . . . . . . . . . . . . . . . . . . . . . . . . . . . . . . . . . . . . 386RadialResample . . . . . . . . . . . . . . . . . . . . . . . . . . . . . . . . . . . . . . . . . 388Reflect . . . . . . . . . . . . . . . . . . . . . . . . . . . . . . . . . . . . . . . . . . . . . . 389Rendering . . . . . . . . . . . . . . . . . . . . . . . . . . . . . . . . . . . . . . . . . . . . 390Replicate . . . . . . . . . . . . . . . . . . . . . . . . . . . . . . . . . . . . . . . . . . . . 391Resample . . . . . . . . . . . . . . . . . . . . . . . . . . . . . . . . . . . . . . . . . . . . 392Revolve . . . . . . . . . . . . . . . . . . . . . . . . . . . . . . . . . . . . . . . . . . . . . 393SPHResample . . . . . . . . . . . . . . . . . . . . . . . . . . . . . . . . . . . . . . . . . . 394SaveWindow . . . . . . . . . . . . . . . . . . . . . . . . . . . . . . . . . . . . . . . . . . 395Scatter . . . . . . . . . . . . . . . . . . . . . . . . . . . . . . . . . . . . . . . . . . . . . . 396Slice . . . . . . . . . . . . . . . . . . . . . . . . . . . . . . . . . . . . . . . . . . . . . . . 398SmoothOperator . . . . . . . . . . . . . . . . . . . . . . . . . . . . . . . . . . . . . . . . 399SphereSlice . . . . . . . . . . . . . . . . . . . . . . . . . . . . . . . . . . . . . . . . . . . 400Spreadsheet . . . . . . . . . . . . . . . . . . . . . . . . . . . . . . . . . . . . . . . . . . . 401Stagger . . . . . . . . . . . . . . . . . . . . . . . . . . . . . . . . . . . . . . . . . . . . . 402StatisticalTrends . . . . . . . . . . . . . . . . . . . . . . . . . . . . . . . . . . . . . . . . 403Streamline . . . . . . . . . . . . . . . . . . . . . . . . . . . . . . . . . . . . . . . . . . . . 404Subset . . . . . . . . . . . . . . . . . . . . . . . . . . . . . . . . . . . . . . . . . . . . . . 408SurfaceNormal . . . . . . . . . . . . . . . . . . . . . . . . . . . . . . . . . . . . . . . . . 409Tensor . . . . . . . . . . . . . . . . . . . . . . . . . . . . . . . . . . . . . . . . . . . . . . 410ThreeSlice . . . . . . . . . . . . . . . . . . . . . . . . . . . . . . . . . . . . . . . . . . . . 411Threshold . . . . . . . . . . . . . . . . . . . . . . . . . . . . . . . . . . . . . . . . . . . . 412Transform . . . . . . . . . . . . . . . . . . . . . . . . . . . . . . . . . . . . . . . . . . . . 413TriangulateRegularPoints . . . . . . . . . . . . . . . . . . . . . . . . . . . . . . . . . . . 415Truecolor . . . . . . . . . . . . . . . . . . . . . . . . . . . . . . . . . . . . . . . . . . . . 416Tube . . . . . . . . . . . . . . . . . . . . . . . . . . . . . . . . . . . . . . . . . . . . . . . 417Vector . . . . . . . . . . . . . . . . . . . . . . . . . . . . . . . . . . . . . . . . . . . . . . 418View . . . . . . . . . . . . . . . . . . . . . . . . . . . . . . . . . . . . . . . . . . . . . . . 419View2D . . . . . . . . . . . . . . . . . . . . . . . . . . . . . . . . . . . . . . . . . . . . . 420View3D . . . . . . . . . . . . . . . . . . . . . . . . . . . . . . . . . . . . . . . . . . . . . 421ViewAxisArray . . . . . . . . . . . . . . . . . . . . . . . . . . . . . . . . . . . . . . . . . 422ViewCurve . . . . . . . . . . . . . . . . . . . . . . . . . . . . . . . . . . . . . . . . . . . 423Volume . . . . . . . . . . . . . . . . . . . . . . . . . . . . . . . . . . . . . . . . . . . . . 424
6 VisIt CLI Events 427
7 Acknowledgments 434
ix
Chapter 1
Introduction to VisIt
1.1 Overview
VisIt is a distributed, parallel, visualization tool for visualizing data defined on two and three-dimensionalstructured and unstructured meshes. VisIt’s distributed architecture allows it to leverage both the com-pute power of a large parallel computer and the graphics acceleration hardware of a local workstation.Another benefit of the distributed architecture is that VisIt can visualize the data where it is generated,eliminating the need to move data. VisIt can be controlled by a Graphical User Interface (GUI) orthrough the Python scripting language. More information about VisIt’s Graphical User Interface canbe found in the VisIt User’s Manual.
1.2 Manual chapters
This manual is broken down into the following chapters:
Chapter title Chapter descriptionIntroduction to VisIt This chapter.
Python Describes the basic features of thePython programming language.
Quick Recipes Describes common patterns for scriptingusing the VisIt Python Interface.
Functions Describes functions in the VisIt PythonInterface.
Attributes References Describes attributes for setting commonoperations, as well as for VisIt’s plugins
CLI Events Describes possible events for callbacks.
1.3 Understanding how VisIt works
VisIt visualizes data by creating one or more plots in a visualization window, also known as a vis window.Examples of plots include Mesh plots, Contour plots and Pseudocolor plots. Plots take as input one ormore mesh, material, scalar, or tensor variables. It is possible to modify the variables by applying one or
1
1.3. UNDERSTANDING HOW VISIT WORKS CHAPTER 1. INTRODUCTION TO VISIT
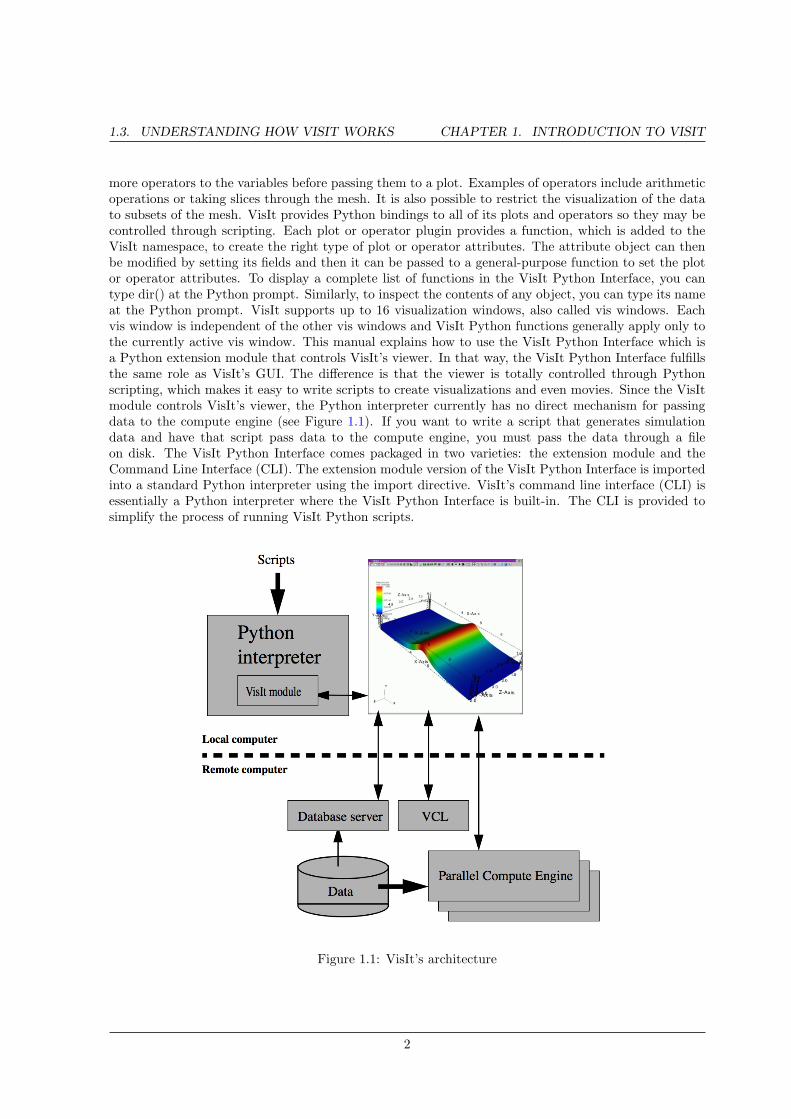
more operators to the variables before passing them to a plot. Examples of operators include arithmeticoperations or taking slices through the mesh. It is also possible to restrict the visualization of the datato subsets of the mesh. VisIt provides Python bindings to all of its plots and operators so they may becontrolled through scripting. Each plot or operator plugin provides a function, which is added to theVisIt namespace, to create the right type of plot or operator attributes. The attribute object can thenbe modified by setting its fields and then it can be passed to a general-purpose function to set the plotor operator attributes. To display a complete list of functions in the VisIt Python Interface, you cantype dir() at the Python prompt. Similarly, to inspect the contents of any object, you can type its nameat the Python prompt. VisIt supports up to 16 visualization windows, also called vis windows. Eachvis window is independent of the other vis windows and VisIt Python functions generally apply only tothe currently active vis window. This manual explains how to use the VisIt Python Interface which isa Python extension module that controls VisIt’s viewer. In that way, the VisIt Python Interface fulfillsthe same role as VisIt’s GUI. The difference is that the viewer is totally controlled through Pythonscripting, which makes it easy to write scripts to create visualizations and even movies. Since the VisItmodule controls VisIt’s viewer, the Python interpreter currently has no direct mechanism for passingdata to the compute engine (see Figure 1.1). If you want to write a script that generates simulationdata and have that script pass data to the compute engine, you must pass the data through a fileon disk. The VisIt Python Interface comes packaged in two varieties: the extension module and theCommand Line Interface (CLI). The extension module version of the VisIt Python Interface is importedinto a standard Python interpreter using the import directive. VisIt’s command line interface (CLI) isessentially a Python interpreter where the VisIt Python Interface is built-in. The CLI is provided tosimplify the process of running VisIt Python scripts.
Figure 1.1: VisIt’s architecture
2
1.4. STARTING VISIT CHAPTER 1. INTRODUCTION TO VISIT
1.4 Starting VisIt
You can invoke VisIt’s command line interface from the command line by typing:
visit -cli
VisIt provides a separate Python module if you instead wish to include VisIt functions in an existingPython script. In that case, you must first import the VisIt module into Python and then call theLaunch() function to make VisIt launch and dynamically load the rest of the VisIt functions intothe Python namespace. VisIt adopts this somewhat unusual approach to module loading since thelightweight “visit” front-end module can be installed as one of your Python’s site packages yet stilldynamically load the real control functions from different versions of VisIt selected by the user.
If you do not install the visit.so module as a Python site package, you can tell the Python interpreterwhere it is located by appending a new path to the sys.path variable. Be sure to substitute the correctpath to visit.so on your system.
import syssys.path.append("/path/to/visit/<version>/<architecture>/lib/site-packages")
Here is how to import all functions into the global Python namespace:
from visit import *Launch()
Here is how to import all functions into a “visit” module namespace:
import visitvisit.Launch()
1.5 Getting started
VisIt is a tool for visualizing 2D and 3D scientific databases. The first thing to do when runningVisIt is select databases to visualize. To select a database, you must first open the database using theOpenDatabase function. After a window has an open database, any number of plots and operators canbe added. To create a plot, use the AddPlot function. After adding a plot, call the DrawPlots functionto make sure that all of the new plots are drawn.
Example:
OpenDatabase("/usr/local/visit/data/multi_curv3d.silo")AddPlot("Pseudocolor", "u")DrawPlots()
To see a list of the available plots and operators when you use the VisIt Python Interface, use theOperator Plugins and Plot Plugins functions. Each of those functions returns a tuple of strings thatcontain the names of the currently loaded plot or operator plugins. Each plot and operator pluginprovides a function for creating an attributes object to set the plot or operator attributes. The nameof the function is the name of the plugin in the tuple returned by the OperatorPlugins or PlotPluginsfunctions plus the word “Attributes”. For example, the “Pseudocolor” plot provides a function calledPseudocolorAttributes. To set the plot attributes or the operator attributes, first use the attributescreation function to create an attributes object. Assign the newly created object to a variable nameand set the fields in the object. Each object has its own set of fields. To see the available fields inan object, print the name of the variable at the Python prompt and press the Enter key. This willprint the contents of the object so you can see the fields contained by the object. After setting the
3
1.5. GETTING STARTED CHAPTER 1. INTRODUCTION TO VISIT
appropriate fields, pass the object to either the SetPlotOptions function or the SetOperatorAttributesfunction.
Example:
OpenDatabase("/usr/local/visit/data/globe.silo")AddPlot("Pseudocolor", "u")AddOperator("Slice")p = PseudocolorAttributes()p.colorTableName = "rainbow"p.opacity = 0.5SetPlotOptions(p)a = SliceAttributes()a.originType = a.Pointa.normal, a.upAxis = (1,1,1), (-1,1,-1)SetOperatorOptions(a)DrawPlots()
That’s all there is to creating a plot using VisIt’s Python Interface. For more information on creatingplots and performing specific actions in VisIt, refer to the documentation for each function later in thismanual.
4
Chapter 2
Python
2.1 Overview
Python is a general purpose, interpreted, extensible, object-oriented scripting language that was chosenfor VisIt’s scripting language due to its ease of use and flexibility. VisIt’s Python interface was im-plemented as Python module and it allows you to enhance your Python scripts with coding to controlVisIt. This chapter explains some of Python’s syntax so it will be more familiar when you examinethe examples found in this document. For more information on programming in Python, there are anumber of good references, including on the Internet at http://www.python.org.
2.2 Indentation
One of the most obvious features of Python is its use of indentation for new scopes. You must takespecial care to indent all program logic consistently or else the Python interpreter may halt with anerror, or worse, not do what you intended. You must increase indentation levels when you define afunction, use an if/elif/else statement, or use any loop construct.
Note the different levels of indentation:
def example_function(n):v = 0if n > 2:print "n greater than 2."
else:v = n * n
return v
2.3 Comments
Like all good programming languages, Python supports the addition of comments in the code. Commentsbegin with a pound character (#) and continue to the end of the line.
# This is a commenta = 5 * 5
5
2.4. IDENTIFIERS CHAPTER 2. PYTHON
2.4 Identifiers
The Python interpreter accepts any identifier that contains letters ’A’-’Z’, ’a’-’z’ and numbers ’0’-’9’ aslong as the identifier does not begin with a number. The Python interpreter is case-sensitive so theidentifier “case” would not be the same identifier as “CASE”. Be sure to case consistently throughoutyour Python code since the Python interpreter will instantiate any identifier that it has not seen beforeand mixing case would cause the interpreter to use multiple identifiers and cause problems that youmight not expect. Identifiers can be used to refer to any type of object since Python is flexible in itstreatment of types.
2.5 Data types
Python supports a wide variety of data types and allows you to define your own data types readily.Most types are created from a handful of building-block types such as integers, floats, strings, tuples,lists, and dictionaries.
2.5.1 Strings
Python has built-in support for strings and you can create them using single quotes or double quotes.You can even use both types of quotes so you can create strings that include quotes in case quotes aredesired in the output. Strings are sequence objects and support operations that can break them downinto characters.
s = ’using single quotes’s2 = "using double quotes"s3 = ’nesting the "spiffy" double quotes’
2.5.2 Tuples
Python supports tuples, which can be thought of as a read-only set of objects. The members of a tuplecan be of different types. Tuples are commonly used to group multiple related items into a single objectthat can be passed around more easily. Tuples support a number of operations. You can subscript atuple like an array to access its individual members. You can easily determine whether an object is amember of a tuple. You can iterate over a tuple. There are many more uses for tuples. You can createtuples by enclosing a comma-separated list of objects in parenthesis.
# Create a tuplea = (1,2,3,4,5)print "The first value in a is:", a[0]# See if 3 is in a using the "in" operator.print "3 is in a:", 3 in a# Create another tuple and add it to the first one to create c.b = (6,7,8,9)c = a + b# Iterate over the items in the tuplefor value in c:print "value is: ", value
6
2.6. CONTROL FLOW CHAPTER 2. PYTHON
2.5.3 Lists
Lists are just like tuples except they are not read-only and they use square brackets [] to enclose theitems in the list instead of using parenthesis.
# Start with an empty list.L = []for i in range(10):# Add i to the list LL = L + [i]
print L# Assign a value into element 6L[5] = 1000print L
2.5.4 Dictionaries
Dictionaries are Python containers that allow you to store a value that is associated with a key. Dictio-naries are convenient for mapping 1 set to another set since they allow you to perform easy lookups ofvalues. Dictionaries are declared using curly braces and each item in the dictionary consists of a key:value pair with the key and values being separated by a colon. To perform a lookup using a dictionary,provide the key whose value you want to look up to the subscript [] operator.
colors = {"red" : "rouge", "orange" : "orange", \"yellow" : "jaune", "green" : "vert", "blue" : "bleu"}# Perform lookups using the keys.for c in colors.keys():
print "%s in French is: %s" % (c, colors[c])
2.6 Control flow
Python, like other general-purpose programming languages provides keywords that implement controlflow. Control flow is an important feature to have in a programming language because it allows complexbehavior to be created using a minimum amount of scripting.
2.6.1 if/elif/else
Python provides if/elif/else for conditional branching. The if statement takes any expression thatevaluates to an integer and it takes the if branch if the integer value is 1 other wise it takes the elsebranch if it is present.
# Example 1if condition:
do_something()
# Example 2if condition:
do_something()else:
do_something_else()
7

2.7. FUNCTIONS CHAPTER 2. PYTHON
# Example 3if condition:
do_domething()elif conditionn:
do_something_n()...else:
do_something_else()
2.6.2 For loop
Python provides a for loop that allows you to iterate over all items stored in a sequence object (tuples,lists, strings). The body of the for loop executes once for each item in the sequence object and allowsyou to specify the name of an identifier to use in order to reference the current item.
# Iterating through the characters of a stringfor c in "characters":
print c
# Iterating through a tuplefor value in ("VisIt", "is", "coolness", "times", 100):
print value
# Iterating through a listfor value in ["VisIt", "is", "coolness", "times", 100]:
print value
# Iterating through a range of numbers [0,N) created with range(N).N = 100for i in range(N):
print i, i*i
2.6.3 While loop
Python provides a while loop that allows you to execute a loop body indefinitely based on some condi-tion. The while loop can be used for iteration but can also be used to execute more complex types ofloops.
token = get_next_token()while token != "":do_something(token)token = get_next_token()
2.7 Functions
Python comes with many built-in functions and modules that implement additional functions. Functionscan be used to execute bodies of code that are meant to be re-used. Functions can optionally takearguments and can optionally return values. Python provides the def keyword, which allows you to
8
2.7. FUNCTIONS CHAPTER 2. PYTHON
define a function. The def keyword is followed by the name of the function and its arguments, whichshould appear as a tuple next to the name of the function.
# Define a function with no arguments and no return value.def my_function():
print "my function prints this..."
# Define a function with arguments and a return value.def n_to_the_d_power(n, d):value = 1if d > 0:for i in range(d):value = value * n
elif d < 0:value = 1. / float(n_to_the_d_power(n, -d))
return value
9
Chapter 3
Quick Recipes
3.1 Overview
This manual contains documentation for over two hundred functions and several dozen extension objecttypes. Learning to combine the right functions in order to accomplish a visualization task without guid-ance would involve hours of trial and error. To maximize productivity and start creating visualizationsusing Visit’s Python Interface as fast as possible, this chapter provides some common patterns, or ”quickrecipes” that you can combine to quickly create complex scripts.
3.2 How to start
The most important question when developing a script is: ”Where do I start?”. You can either usesession files that you used to save the state of your visualization to initialize the plots before you startscripting or you can script every aspect of plot initialization.
3.2.1 Using session files
VisIt’s session files contain all of the information required to recreate plots that have been set up inprevious interactive VisIt sessions. Since session files contain all of the information about plots, etc.,they are natural candidates to make scripting easier since they can be used to do the hard part of settingup the complex visualization, leaving the bulk of the script to animate through time or alter the plotsin some way. To use session files within a script, use the RestoreSession function.
# Import a session file from the current working directory.RestoreSesssion("my_visualization.session", 0)# Now that VisIt has restored the session, animate through time.for states in range(TimeSliderGetNStates()):SetTimeSliderState(state)SaveWindow()
10
3.3. SAVING IMAGES CHAPTER 3. QUICK RECIPES
3.2.2 Getting something on the screen
If you don’t want to use a session file to begin the setup for your visualization then you will have todive into opening databases, creating plots, and animating through time. This is where all of hand-crafted scripts begin. The first step in creating a visualization is opening a database. VisIt provides theOpenDatabase function to open a database. Once a database has been opened, you can create plotsfrom its variables using the AddPlot function. The AddPlot function takes a plot plugin name and thename of a variable from the open database. Once you’ve added a plot, it is in the new state, whichmeans that it has not yet been submitted to the compute engine for processing. To make sure that theplot gets drawn, call the DrawPlots function.
# Step 1: Open a databaseOpenDatabase("/usr/local/visit/data/wave.visit")
# Step 2: Add plotsAddPlot("Pseudocolor", "pressure")AddPlot("Mesh", "quadmesh")
# Step 3: Draw the plotsDrawPlots()
# Step 4: Animate through time and save imagesfor states in range(TimeSliderGetNStates()):SetTimeSliderState(state)SaveWindow()
3.3 Saving images
Much of the time, the entire purpose of using VisIt’s Python Interface is to create a script that can saveout images of a time-varying database for the purpose of making movies. Saving images using VisIt’sPython Interface is a straight-forward process, involving just a few functions.
3.3.1 Setting the output image characteristics
VisIt provides a number of options for saving files, including: fileformat, filename, and image size, toname a few. These attributes are grouped into the SaveWindowAttributes object. To set the optionsthat VisIt uses to save files, you must create a SaveWindowAttributes object, change the necessaryattributes, and call the SetSaveWindowAttributes function. Note that if you want to create imagesusing a specific image resolution, the best way is to use the -geometry command line argument withVisIt’s Command Line Interface and tell VisIt to use screen capture. If you instead require your scriptto be capable of saving everal different image sizes then you can turn off screen capture and set theimage resolution in the SaveWindowAttributes object.
# Save a BMP file at 1024x768 resolutions = SaveWindowAttributes()s.format = s.BMPs.fileName = "mybmpfile"s.width, s.height = 1024,768s.screenCapture = 0SetSaveWindowAttributes(s)
11
3.4. WORKING WITH DATABASES CHAPTER 3. QUICK RECIPES
3.3.2 Saving an image
Once you have set the SaveWindowAttributes to your liking, you can call the SaveWindow function tosave an image. The SaveWindow function returns the name of the image that is saved so you can usethat for other purposes in your script.
# Save images of all timesteps and add each image filename to a list.names = []for state in range(TimeSliderGetNStates()):SetTimeSliderState(state)# Save the imagen = SaveWindow()names = names + [n]
print names
3.4 Working with databases
VisIt allows you to open a wide array of databases both in terms of supported file formats and in termshow databases treat time. Databases can have a single time state or can have multiple time states.Databases can natively support multiple time states or sets of single time states files can be groupedinto time-varying databases using .visit files or using virtual databases. Working with databases getseven trickier if you are using VisIt to visualize a database that is still being generated by a simulation.This section describes how to interact with databases.
3.4.1 Opening a database
Opening a database is a relatively simple operation - most complexities arise in how the database treatstime. If you only want to visualize a single time state or if your database format natively supportsmultiple timestates per file then opening a database requires just a single call to the OpenDatabasefunction.
# Open a database at time state 0OpenDatabase("/usr/local/visit/data/allinone00.pdb")
3.4.2 Opening a database at late time
Opening a database at a later timestate is done just the same as opening a database at time statezero except that you must specify the time state at which you want to open the database. There area number of reasons for opening a database at a later time state. The most common reason for doingso, as opposed to just changing time states later, is that VisIt uses the metadata from the first openedtime state to describe the contents of the database for all timestates (except for certain file formats thatdon’t do this, i.e. SAMRAI). This means that the list of variables found for the first time state thatyou open is used for all timestates. If your database contains a variable at a later timestate that doesnot exist at earlier time states, you must open the database at a later time state to gain access to thetransient variable.
# Open a database at a later time state to pick up transient variablesOpenDatabase("/usr/local/visit/data/wave.visit", 17)
12

3.5. WORKING WITH PLOTS CHAPTER 3. QUICK RECIPES
3.4.3 Opening a virtual database
VisIt provides two ways for accessing a set of single time-state files as a single time- varying database.The first method is a .visit file, which is a simple text file that contains the names of each file to be usedas a time state in the time-varying database. The second method uses ”virtual databases”, which allowVisIt to exploit the file naming conventions that are often employed by simulation codes when theycreate their dumps. In many cases, VisIt can scan a specified directory and determine which filenameslook related. Filenames with close matches are grouped as individual time states into a virtual databasewhose name is based on the more abstract pattern used to create the filenames.
# Opening first file in series wave0000.silo, wave0010.silo, ...OpenDatabase("/usr/local/visit/data/wave0000.silo")
# Opening a virtual database representing all wave*.silo files.OpenDatabase("/usr/local/visit/data/wave*.silo database.)
3.4.4 Opening a remote database
VisIt supports running the client on a local computer while also allowing you to process data in parallelon a remote computer. If you want to access databases on a remote computer using VisIt’s PythonInterface, the only difference to accessing a database on a local computer is that you must specify a hostname as part of the database name.
# Opening a file on a remote computer by giving a host name# Also, open the database to a later time slice (17)OpenDatabase("thunder:/usr/local/visit/data/wave.visit", 17)
3.4.5 Opening a compute engine
Sometimes it is advantageous to open a compute engine before opening a database. When you tellVisIt to open a database using the OpenDatabase function, VisIt also launches a compute engine andtells the compute engine to open the specified database. When the VisIt Python Interface is run with avisible window, the Engine Chooser Window will present itself so you can select a host profile. If youwant to design a script that must specify parallel options, etc in batch mode where there is no EngineChooserWindow then you have few options other than to open a compute engine before opening adatabase. To open a compute engine, use the OpenComputeEngine function. You can pass the nameof the host on which to run the compute engine and any arguments that must be used to launch theengine such as the number of processors.
# Open a remote, parallel compute engine before opening a databaseOpenComputeEngine("mcr", ("-np", "4", "-nn", "2"))OpenDatabase("mcr:/usr/local/visit/data/multi_ucd3d.silo")
3.5 Working with plots
Plots are viewable objects, created from a database, that can be displayed in a visualization window.VisIt provides several types of plots and each plot allows you to view data using different visualizationtechniques. For example, the Pseudocolor plot allows you to see the general shape of a simulated objectwhile painting colors on it according to the values stored in a variable’s scalar field. The most importantfunctions for interacting with plots are covered in this section.
13
3.5. WORKING WITH PLOTS CHAPTER 3. QUICK RECIPES
3.5.1 Creating a plot
The function for adding a plot in VisIt is: AddPlot. The AddPlot function takes the name of a plottype and the name of a variable that is to be plotted and creates a new plot and adds it to the plot list.The name of the plot to be created corresponds to the name of one of VisIt’s plot plugins, which canbe queried using the PlotPlugins function. The variable that you pass to the AddPlot function mustbe a valid variable for the opend atabase. New plots are not realized, meaning that they have not beensubmitted to the compute engine for processing. If you want to force VisIt to process the new plot youmust call the DrawPlots function.
# Names of all available plot pluginsprint PlotPlugins()# Create plotsAddPlot("Pseudocolor", "pressure")AddPlot("Mesh", "quadmesh")# Draw the plotsDrawPlots()
3.5.2 Plotting materials
Plotting materials is a common operation in VisIt. The Boundary and FilledBoundary plots enable youto plot material boundaries and materials, respectively.
# Plot material boundariesAddPlot("Boundary", "mat1")# Plot materialsAddPlot("FilledBoundary", "mat1")
3.5.3 Setting plot attributes
Each plot type has an attributes object that controls how the plot generates its data or how it looksin the visualization window. The attributes object for each plot contains different fields. You can viewthe individual object fields by printing the object to the console. Each plot type provides a functionthat creates a new instance of one of its attribute objects. The function name is always of the form:plotname + ”Attributes”. For example, the attributes object creation function for the Pseudocolor plotwould be: PseudocolorAttributes. To change the attributes for a plot, you create an attributes objectusing the appropriate function, set the properties in the returned object, and tell VisIt to use the newplot attributes by passing the object to the SetPlotOptions function. Note that you should set a plot’sattributes before calling the DrawPlots method to realize the plot since setting a plot’s attributes cancause the compute engine to recalculate the plot.
# Creating a Pseudocolor plot and setting min/max values.AddPlot("Pseudocolor", "pressure")p = PseudocolorAttributes()# Look in the objectprint p# Set the min/max valuesp.min, p.minFlag = 1, 0.0p.max, p.maxFlag = 1, 10.0SetPlotOptions(p)
14
3.5. WORKING WITH PLOTS CHAPTER 3. QUICK RECIPES
3.5.4 Working with multiple plots
When you work with more than one plot, it is sometimes necessary to set the active plots because someof VisIt’s functions apply to all of the active plots. The active plot is usually the last plot that wascreated unless you’ve changed the list of active plots. Changing which plots are active is useful whenyou want to delete or hide certain plots or set their plot attributes independently. When you want toset which plots are active, use the SetActivePlots function. If you want to list the plots that you’vecreated, call the ListPlots function.
# Create more than 1 plot of the same typeAddPlot("Pseudocolor", "pressure")AddPlot("Pseudocolor", "density")
# List the plots. The second plot should be active.ListPlots()
# Draw the plotsDrawPlots()
# Hide the first plotSetActivePlots(0)HideActivePlots()
# Set both plots’ color table to "hot"p = PseudocolorAttributes()p.colorTableName = "hot"SetActivePlots((0,1))SetPlotOptions(p)
# Show the first plot again.SetActivePlots(0)HideActivePlots()
# Delete the second plotSetActivePlots(1)DeleteActivePlots()ListPlots()
3.5.5 Plots in the error state
When VisIt’s compute engine cannot process a plot, the plot is put into the error state. Once a plot isin the error state, it no longer is displayed in the visualization window. If you are generating a movie,plots entering the error state can be a serious problem because you most often want all of the plotsthat you have created to animate through time and not disappear in the middle of the animation. Youcan add extra code to your script to prevent plots from disappearing (most of the time) due to errorconditions by adding a call to the DrawPlots function.
# Save an image and take care of plots that entered the error state.drawThePlots = 0for state in range(TimeSliderGetNStates()):if SetTimeSliderState(state) == 0:drawThePlots = 1
15
3.6. OPERATORS CHAPTER 3. QUICK RECIPES
if drawThePlots == 1:if DrawPlots() == 0:print "VisIt could not draw plots for state: %d" % state
else:drawThePlots = 0
SaveWindow()
3.6 Operators
Operators are filters that are applied to database variables before the compute engine uses them tocreate plots. Operators can be linked one after the other to form chains of operators that can drasticallytransform the data before plotting it.
3.6.1 Adding operators
Adding an operator is similar to adding a plot in that you call a function with the name of the operator tobe added. The list of available operators is returned by the OperatorPlugins function. Any of the namesreturned in that plugin can be used to add an operator using the AddOperator function. Operators areadded to the active plots by default but you can also force VisIt to add them to all plots in the plotlist.
# Print available operatorsprint OperatorPlugins()# Create a plotAddPlot("Pseudocolor")# Add an Isovolume operator and a Slice operatorAddOperator("Isovolume")AddOperator("Slice")DrawPlots()
3.6.2 Setting operator attributes
Each plot gets its own instance of an operator which means that you can set each plot’s operatorattributes independently. Like plots, operators use objects to set their attributes. These objects arereturned by functions whose names are of the form: operatorname + ”Attributes”. Once you havecreated an operator attributes object, you can pass it to the SetOperatorOptions to set the optionsfor an operator. Note that setting the attributes for an operator nearly always causes the computeengine to recalculate the operator. You can use the power of VisIt’s Python Interface to create complexoperator behavior such as in the following code example, which moves slice planes through a Pseudocolorplot.
OpenDatabase("/usr/local/visit/data/noise.silo")AddPlot("Pseudocolor", "hardyglobal")AddOperator("Slice")s = SliceAttributes()s.originType = s.Percents.project2d = 0SetOperatorOptions(s)DrawPlots()
16
3.7. QUANTITATIVE OPERATIONS CHAPTER 3. QUICK RECIPES
nSteps = 20for axis in (0,1,2):s.axisType = axisfor step in range(nSteps):t = float(step) / float(nSteps - 1)s.originPercent = t * 100.SetOperatorOptions(s)SaveWindow()
3.7 Quantitative operations
This section focuses on some of the operations that allow you to examine your data more quantita-tively.
3.7.1 Defining expressions
VisIt allows you to create derived variables using its powerful expressions language. You can plot or queryvariables created using expressions just as you would if they were read from a database. VisIt’s PythonInterface allows you to create new scalar, vector, tensor variables using the DefineScalarExpression,DefineVectorExpression, and DefineTensorExpression functions.
# Creating a new expressionOpenDatabase("/usr/local/visit/data/noise.silo")AddPlot("Pseudocolor", "hardyglobal")DrawPlots()DefineScalarExpression("newvar", "sin(hardyglobal) + cos(shepardglobal")ChangeActivePlotsVar("newvar")
3.7.2 Pick
VisIt allows you to pick on cells, nodes, and points within a database and reutrn information for theitem of interest. To that end, VisIt provides several pick functions. Once a pick function has beencalled, you can call the GetPickOutput function to get a string that contains the pick information.The information in the string could be used for a multitude of uses such as building a test suite for asimulation code.
OpenDatabase("/usr/local/visit/data/noise.silo")AddPlot("Pseudocolor", "hgslice")DrawPlots()s = []# Pick by a node idPickbyNode(300)s = s + [GetPickOutput()]# Pick by a cell idPickByZone(250)s = s + [GetPickOutput()]# Pick on a cell using a 3d pointPick((-2., 2., 0.))s = s + [GetPickOutput()]# Pick on the node closest to (-2,2,0)
17

3.7. QUANTITATIVE OPERATIONS CHAPTER 3. QUICK RECIPES
NodePick((-2,2,0))s = s + [GetPickOutput()]# Print all pick resultsprint s
3.7.3 Lineout
VisIt allows you to extract data along a line, called a lineout, and plot the data using a Curve plot.
OpenDatabase("/usr/local/visit/data/noise.silo")AddPlot("Pseudocolor", "hgslice")DrawPlots()Lineout((-5,-3), (5,8))# Specify a number of sample pointsLineout((-5,-4), (5,7))
3.7.4 Query
VisIt can perform a number of different queries based on values calculated about plots or their originatingdatabase.
OpenDatabase("/usr/local/visit/data/noise.silo")AddPlot("Pseudocolor", "hardyglobal")DrawPlots()Query("NumNodes")print "The float value is: %g" % GetQueryOutputValue()Query("NumNodes")
3.7.5 Finding the min and the max
A common operation in debugging a simulation code is examining the min and max values. Here is apattern that allows you to print out the min and the max values and their locations in the databaseand also see them visually.
# Define a helper function to get the id’s of the MinMax query.def GetMinMaxIds():Query("MinMax")import strings = string.split(GetQueryOutputString(), " ")retval = []nextGood = 0idType = 0for token in s:if token == "(zone" or token == "(cell":idType = 1nextGood = 1continue
elif token == "(node":idType = 0nextGood = 1continue
18
3.8. SUBSETTING CHAPTER 3. QUICK RECIPES
if nextGood == 1:nextGood = 0retval = retval + [(idType, int(token))]
return retval
# Set up a plotOpenDatabase("/usr/local/visit/data/noise.silo")AddPlot("Pseudocolor", "hgslice")DrawPlots()
# Do picks on the ids that were returned by MinMax.for ids in GetMinMaxIds():idType = ids[0]id = ids[1]if idType == 0:PickByNode(id)
else:PickByZone(id)
3.8 Subsetting
VisIt allows the user to turn off subsets of the visualization using a number of different methods.Databases can be divided up any number of ways: domains, materials, etc. This section provides somedetails on how to remove materials and domains from your visualization.
3.8.1 Turning off domains
VisIt’s Python Interface provides the TurnDomainsOn and TurnDomainsOff functions to make it easyto turn domains on and off.
OpenDatabase("/usr/local/visit/data/multi_rect2d.silo")AddPlot("Pseudocolor", "d")DrawPlots()# Turning off all but the last domaind = GetDomains()for dom in d[:-1]:TurnDomainsOff(dom)# Turn all domains offTurnDomainsOff()# Turn on domains 3,5,7TurnDomainsOn((d[3], d[5], d[7]))
3.8.2 Turning off materials
VisIt’s Python Interface provides the TurnMaterialsOn and TurnMaterialsOff functions to make it easyto turn materials on and off.
OpenDatabase("/usr/local/visit/data/multi_rect2d.silo")AddPlot("FilledBoundary", "mat1")DrawPlots()
19
3.9. VIEW CHAPTER 3. QUICK RECIPES
# Print the materials are:GetMaterials()# Turn off material 2TurnMaterialsOff("2")
3.9 View
Setting up the view in your Python script is one of the most important things you can do to ensurethe quality of your visualization because the view concentrates attention on an object or inferest. VisItprovides different methods for setting the view, depending on the dimensionality of the plots in thevisualization window but despite differences in how the view is set, the general procedure is basicallythe same.
3.9.1 Setting the 2D view
The 2D view consists of a rectangular window in 2D space and a 2D viewport in the visualizationwindow. The window in 2D space determines what parts of the visualization you will look at while theviewport determines where the images will appear in the visualization window. It is not necessary tochange the viewport most of the time.
OpenDatabase("/usr/local/visit/data/noise.silo")AddPlot("Pseudocolor", "hgslice")AddPlot("Mesh", "Mesh2D")AddPlot("Label", "hgslice")DrawPlots()print "The current view is:", GetView2D()# Get an initialized 2D view object.v = GetView2D()v.windowCoords = (-7.67964, -3.21856, 2.66766, 7.87724)SetView2D(v)
3.9.2 Setting the 3D view
The 3D view is much more complex than the 2D view. For information on the actual meaning of thefields in the View3DAttributes object, refer to page 214 or the VisIt User’s Manual. VisIt automaticallycomputes a suitable view for 3D objects and it is best to initialize new View3DAttributes objects usingthe GetView3D function so most of the fields will already be initialized. The best way to get new viewsto use in a script is to interactively create the plot and repeatedly call GetView3D() after you finishrotating the plots with the mouse. You can paste the printed view information into your script andmodify it slightly to create sophisticated view transitions.
OpenDatabase("/usr/local/visit/data/noise.silo")AddPlot("Pseudocolor", "hardyglobal")AddPlot("Mesh", "Mesh")DrawPlots()v = GetView3D()print "The view is: ", vv.viewNormal = (-0.571619, 0.405393, 0.713378)v.viewUp = (0.308049, 0.911853, -0.271346)SetView3D(v)
20
3.9. VIEW CHAPTER 3. QUICK RECIPES
3.9.3 Flying around plots
Flying around plots is a commonly requested feature when making movies. Fortunately, this is easy toscript. The basic method used for flying around plots is interpolating the view. VisIt provides a numberof functions that can interpolate View2DAttributes and View3DAttributes objects. The most useful ofthese functions is the EvalCubicSpline function. The EvalCubicSpline function uses piece-wise cubicpolynomials to smoothly interpolate between a tuple of N like items. Scripting smooth view changesusing EvalCubicSpline is rather like keyframing in that you have a set of views that are mapped to somedistance along the parameterized space [0., 1.]. When the parameterized space is sampled with somenumber of samples, VisIt calculates the view for the specified parameter value and returns a smoothlyinterpolated view. One benefit over keyframing, in this case, is that you can use cubic interpolationwhereas VisIt’s keyframing mode currently uses linear interpolation.
# Do a pseudocolor plot of u.OpenDatabase("/usr/local/visit/data/globe.silo")AddPlot("Pseudocolor", "u")DrawPlots()
# Create the control points for the views.c0 = View3DAttributes()c0.viewNormal = (0, 0, 1)c0.focus = (0, 0, 0)c0.viewUp = (0, 1, 0)c0.viewAngle = 30c0.parallelScale = 17.3205c0.nearPlane = 17.3205c0.farPlane = 81.9615c0.perspective = 1
c1 = View3DAttributes()c1.viewNormal = (-0.499159, 0.475135, 0.724629)c1.focus = (0, 0, 0)c1.viewUp = (0.196284, 0.876524, -0.439521)c1.viewAngle = 30c1.parallelScale = 14.0932c1.nearPlane = 15.276c1.farPlane = 69.917c1.perspective = 1
c2 = View3DAttributes()c2.viewNormal = (-0.522881, 0.831168, -0.189092)c2.focus = (0, 0, 0)c2.viewUp = (0.783763, 0.556011, 0.27671)c2.viewAngle = 30c2.parallelScale = 11.3107c2.nearPlane = 14.8914c2.farPlane = 59.5324c2.perspective = 1
c3 = View3DAttributes()c3.viewNormal = (-0.438771, 0.523661, -0.730246)c3.focus = (0, 0, 0)c3.viewUp = (-0.0199911, 0.80676, 0.590541)
21
3.10. WORKING WITH ANNOTATIONS CHAPTER 3. QUICK RECIPES
c3.viewAngle = 30c3.parallelScale = 8.28257c3.nearPlane = 3.5905c3.farPlane = 48.2315c3.perspective = 1
c4 = View3DAttributes()c4.viewNormal = (0.286142, -0.342802, -0.894768)c4.focus = (0, 0, 0)c4.viewUp = (-0.0382056, 0.928989, -0.36813)c4.viewAngle = 30c4.parallelScale = 10.4152c4.nearPlane = 1.5495c4.farPlane = 56.1905c4.perspective = 1
c5 = View3DAttributes()c5.viewNormal = (0.974296, -0.223599, -0.0274086)c5.focus = (0, 0, 0)c5.viewUp = (0.222245, 0.97394, -0.0452541)c5.viewAngle = 30c5.parallelScale = 1.1052c5.nearPlane = 24.1248c5.farPlane = 58.7658c5.perspective = 1
c6 = c0
# Create a tuple of camera values and x values. The x values# determine where in [0,1] the control points occur.cpts = (c0, c1, c2, c3, c4, c5, c6)x=[]for i in range(7):x = x + [float(i) / float(6.)]
# Animate the view using EvalCubicSpline.nsteps = 100for i in range(nsteps):t = float(i) / float(nsteps - 1)c = EvalCubicSpline(t, x, cpts)c.nearPlane = -34.461c.farPlane = 34.461SetView3D(c)
3.10 Working with annotations
Adding annotations to your visualization improve the quality of the final visualization in that you canrefine the colors that you use, add logos, or highlight features of interest in your plots. This sectionprovides some recipes for creating annotations using scripting.
22
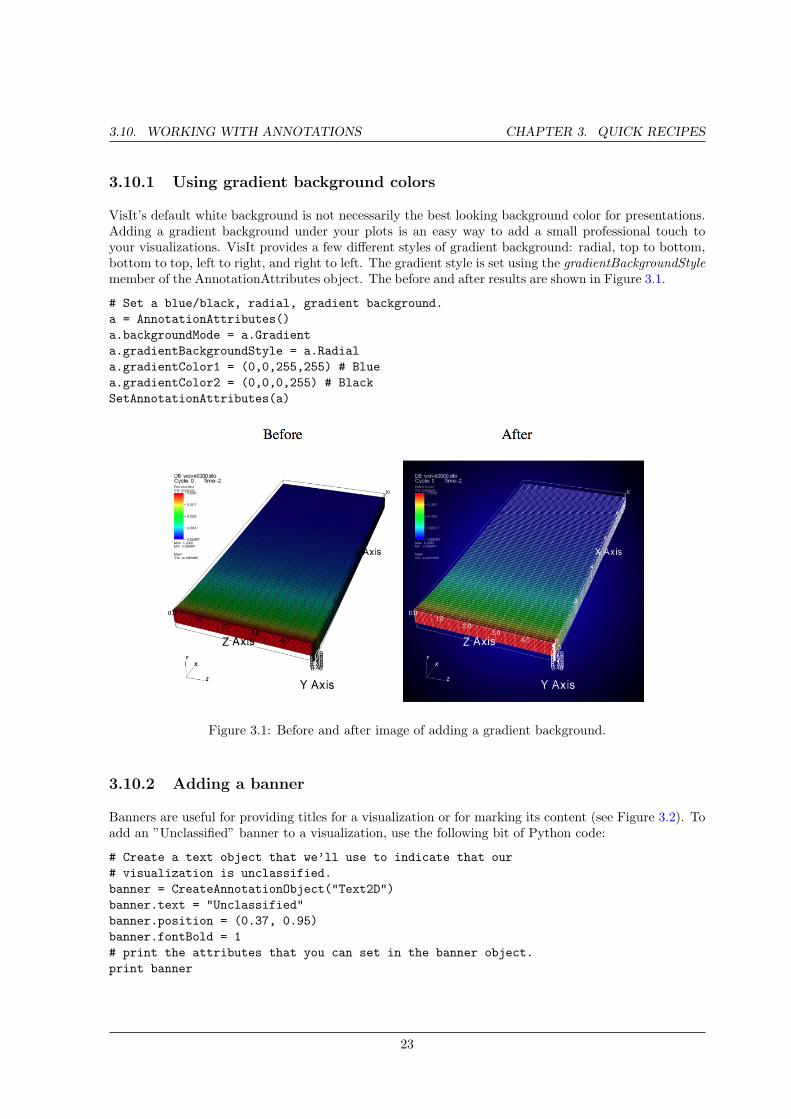
3.10. WORKING WITH ANNOTATIONS CHAPTER 3. QUICK RECIPES
3.10.1 Using gradient background colors
VisIt’s default white background is not necessarily the best looking background color for presentations.Adding a gradient background under your plots is an easy way to add a small professional touch toyour visualizations. VisIt provides a few different styles of gradient background: radial, top to bottom,bottom to top, left to right, and right to left. The gradient style is set using the gradientBackgroundStylemember of the AnnotationAttributes object. The before and after results are shown in Figure 3.1.
# Set a blue/black, radial, gradient background.a = AnnotationAttributes()a.backgroundMode = a.Gradienta.gradientBackgroundStyle = a.Radiala.gradientColor1 = (0,0,255,255) # Bluea.gradientColor2 = (0,0,0,255) # BlackSetAnnotationAttributes(a)
Figure 3.1: Before and after image of adding a gradient background.
3.10.2 Adding a banner
Banners are useful for providing titles for a visualization or for marking its content (see Figure 3.2). Toadd an ”Unclassified” banner to a visualization, use the following bit of Python code:
# Create a text object that we’ll use to indicate that our# visualization is unclassified.banner = CreateAnnotationObject("Text2D")banner.text = "Unclassified"banner.position = (0.37, 0.95)banner.fontBold = 1# print the attributes that you can set in the banner object.print banner
23
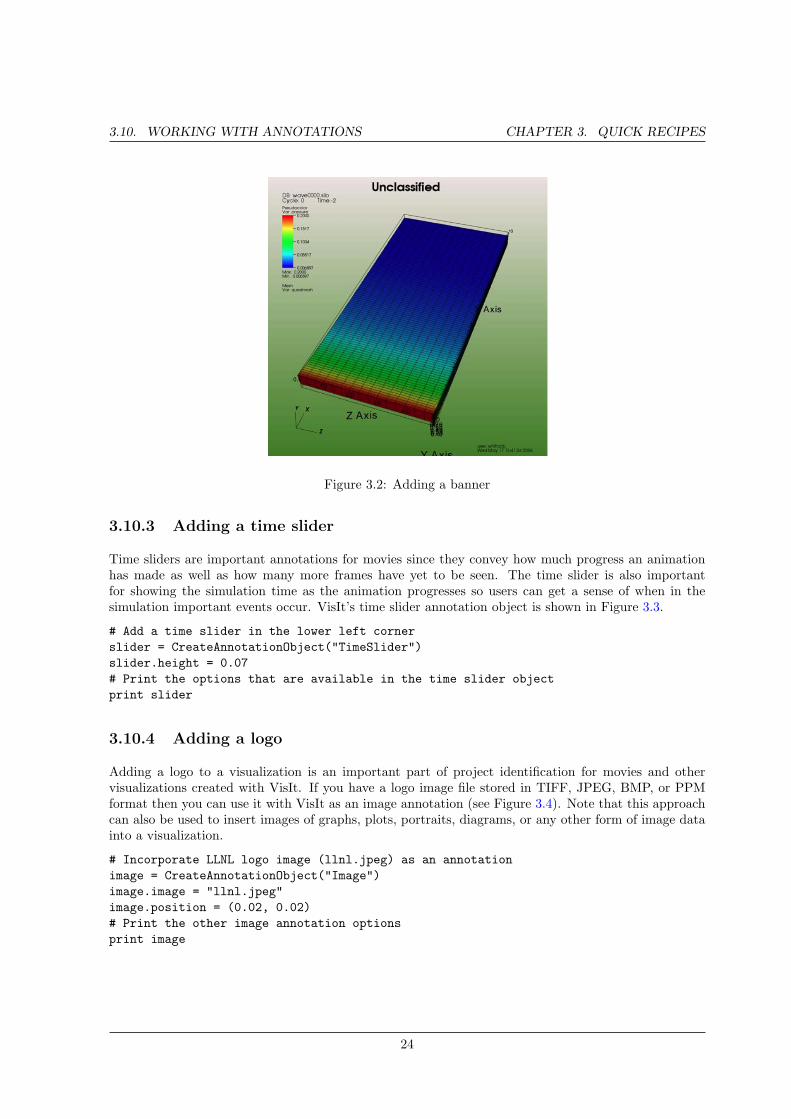
3.10. WORKING WITH ANNOTATIONS CHAPTER 3. QUICK RECIPES
Figure 3.2: Adding a banner
3.10.3 Adding a time slider
Time sliders are important annotations for movies since they convey how much progress an animationhas made as well as how many more frames have yet to be seen. The time slider is also importantfor showing the simulation time as the animation progresses so users can get a sense of when in thesimulation important events occur. VisIt’s time slider annotation object is shown in Figure 3.3.
# Add a time slider in the lower left cornerslider = CreateAnnotationObject("TimeSlider")slider.height = 0.07# Print the options that are available in the time slider objectprint slider
3.10.4 Adding a logo
Adding a logo to a visualization is an important part of project identification for movies and othervisualizations created with VisIt. If you have a logo image file stored in TIFF, JPEG, BMP, or PPMformat then you can use it with VisIt as an image annotation (see Figure 3.4). Note that this approachcan also be used to insert images of graphs, plots, portraits, diagrams, or any other form of image datainto a visualization.
# Incorporate LLNL logo image (llnl.jpeg) as an annotationimage = CreateAnnotationObject("Image")image.image = "llnl.jpeg"image.position = (0.02, 0.02)# Print the other image annotation optionsprint image
24
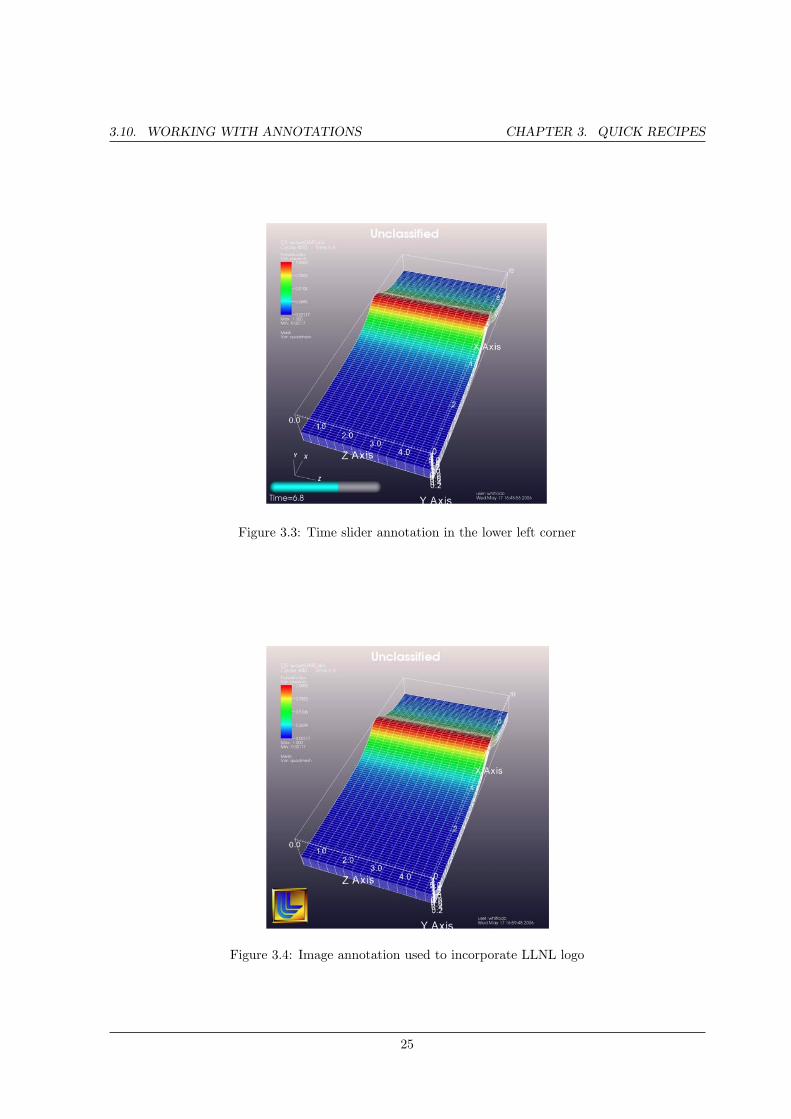
3.10. WORKING WITH ANNOTATIONS CHAPTER 3. QUICK RECIPES
Figure 3.3: Time slider annotation in the lower left corner
Figure 3.4: Image annotation used to incorporate LLNL logo
25
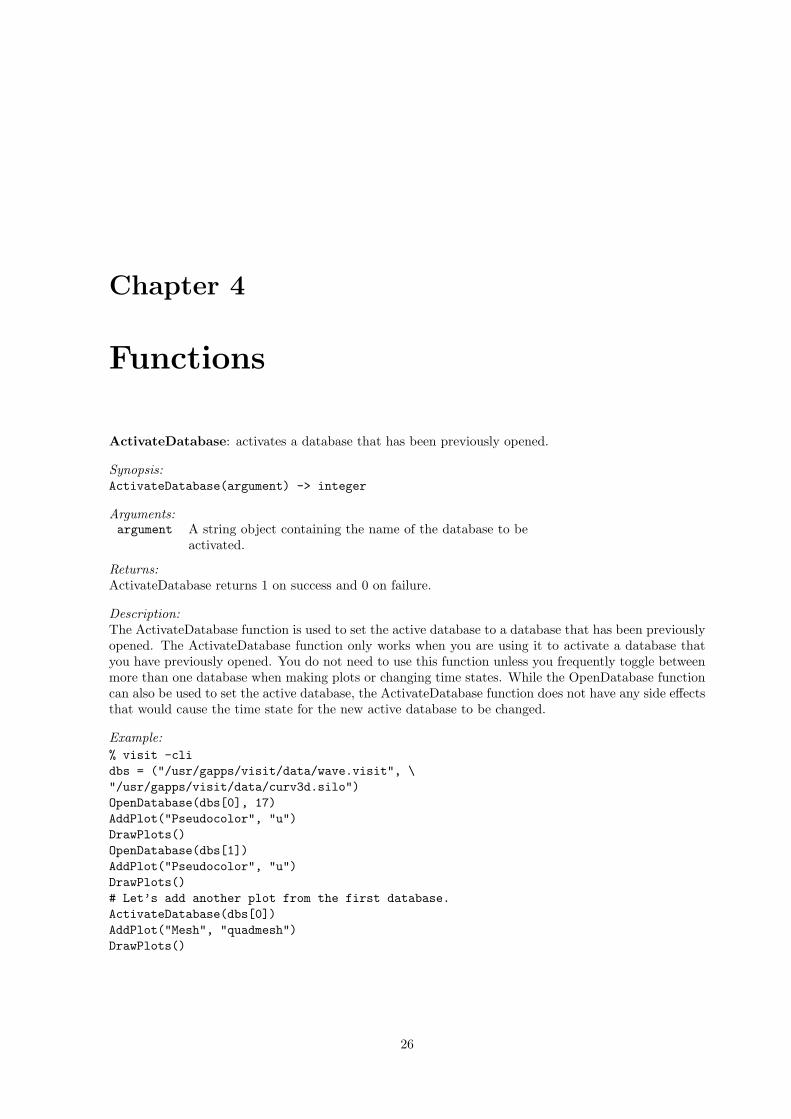
Chapter 4
Functions
ActivateDatabase: activates a database that has been previously opened.
Synopsis:ActivateDatabase(argument) -> integer
Arguments:argument A string object containing the name of the database to be
activated.
Returns:ActivateDatabase returns 1 on success and 0 on failure.
Description:The ActivateDatabase function is used to set the active database to a database that has been previouslyopened. The ActivateDatabase function only works when you are using it to activate a database thatyou have previously opened. You do not need to use this function unless you frequently toggle betweenmore than one database when making plots or changing time states. While the OpenDatabase functioncan also be used to set the active database, the ActivateDatabase function does not have any side effectsthat would cause the time state for the new active database to be changed.
Example:% visit -clidbs = ("/usr/gapps/visit/data/wave.visit", \"/usr/gapps/visit/data/curv3d.silo")OpenDatabase(dbs[0], 17)AddPlot("Pseudocolor", "u")DrawPlots()OpenDatabase(dbs[1])AddPlot("Pseudocolor", "u")DrawPlots()# Let’s add another plot from the first database.ActivateDatabase(dbs[0])AddPlot("Mesh", "quadmesh")DrawPlots()
26
CHAPTER 4. FUNCTIONS
AddArgument: add an argument to the viewer’s command line argument list.
Synopsis:AddArgument(argument)
Arguments:argument A string object that is added to the viewer’s command line
argument list.
Returns:AddArgument does not return a value.
Description:The AddArgument function is used to add extra command line arguments to VisIt’s viewer. This isonly useful when VisIt’s Python interface is imported into a stand−alone Python interpreter becausethe AddArgument function must be called before the viewer is launched. The AddArgument functionhas no effect when used in VisIt’s cli program because the viewer is automatically launched before anycommands are processed.
Example:import visitvisit.AddArgument("-nowin") # Add the -nowin argument to the viewer.
27
CHAPTER 4. FUNCTIONS
AddMachineProfile: ¡description¿
Synopsis:AddMachineProfile(MachineProfile) -> integer
Arguments:MachineProfile
Description:Sets the input machine profile in the HostProfileList, replaces if one already exists Otherwise adds tothe list
28
CHAPTER 4. FUNCTIONS
AddOperator: adds the named operator to the active plots.
Synopsis:AddOperator(operator) -> integerAddOperator(operator, all) -> integer
Arguments:operator This is a string containing the name of the operator to be
applied.all This is an optional integer argument that applies the oper-
ator to all plots if the value of the argument is not zero.
Returns:The AddOperator function returns an integer value of 1 for success and 0 for failure.
Description:The AddOperator function adds a VisIt operator to the active plots. The operator argument is a stringcontaining the name of the operator to be added to the active plots. The operatore name must be avalid operator plugin name that is a member of the tuple returned by the OperatorPlugins function.The all argument is an integer that determines whether or not the operator is applied to all plots. If theall argument is not provided, the operator is only added to active plots. Once the AddOperator functionis called, the desired operator is added to all active plots unless the all argument is a non−zero value.When the all argument is a non−zero value, the operator is applied to all plots regardless of whetheror not they are selected. Operator attributes are set through the SetOperatorOptions function.
Example:% visit -cliOpenDatabase("/usr/gapps/visit/data/globe.silo")AddPlot("Pseudocolor", "u")AddPlot("Mesh", "mesh1")AddOperator("Slice", 1) # Slice both plotsDrawPlots()
29
CHAPTER 4. FUNCTIONS
AddPlot: creates a new plot.
Synopsis:AddPlot(plotType, variableName) -> integerAddPlot(plotType, variableName, inheritSIL) -> integerAddPlot(plotType, variableName, inheritSIL,\
applyOperators) -> integer
Arguments:plotType This is a string containing the name of a valid plot plugin
type.variableName This is a string containing a valid variable name for the
open database.inheritSIL This is an integer flag indicating whether the plot should
inherit the active plot’s SIL restriction.applyOperators This is an integer flag indicating whether the operators from
the active plot should be applied to the new plot.
Returns:The AddPlot function returns an integer value of 1 for success and 0 for failure.
Description:The AddPlot function creates a new plot of the specified type using a variable from the open database.The plotType argument is a string that contains the name of a valid plot plugin type which must be amember of the string tuple that is returned by the PlotPlugins function. The variableName argumentis a string that contains the name of a variable in the open database. After the AddPlot function iscalled, a new plot is created and it is made the sole active plot.
Example:% visit -cliOpenDatabase("/usr/gapps/visit/data/globe.silo")AddPlot("Subset", "mat1") # Create a subset plotDrawPlots()
30
CHAPTER 4. FUNCTIONS
AddWindow: creates a new visualization window.
Synopsis:AddWindow()
Returns:The AddWindow function does not a return value.
Description:The AddWindow function creates a new visualization window and makes it the active window. Thisfunction can be used to create up to 16 visualization windows. After that, the AddWindow functionhas no effect.
Example:import visitvisit.Launch()visit.AddWindow() # Create window #2visit.AddWindow() # Create window #3
31
CHAPTER 4. FUNCTIONS
AlterDatabaseCorrelation: alters a specific database correlation.
Synopsis:AlterDatabaseCorrelation(name, databases, method) -> integer
Arguments:name The name argument must be a string object containing the
name of the database correlation to be altered.databases The databases argument must be a tuple or list of strings
containing the fully qualified database names to be used inthe database correlation.
method The method argument must be an integer in the range [0,3].
Returns:The AlterDatabaseCorrelation function returns 1 on success and 0 on failure.
Description:The AlterDatabaseCorrelation method alters an existing database correlation. A database correlation isa VisIt construct that relates the time states for two or more databases in some way. You would use theAlterDatabaseCorrelation function if you wanted to change the list of databases used in a database cor-relation or if you wanted to change how the databases are related − the correlation method. The nameargument is a string that is the name of the database correlation to be altered. If the name that youpass is not a valid database correlation then the AlterDatabaseCorrelation function fails. The databasesargument is a list or tuple of string objects containing the fully−qualified (host:/path/filename) namesof the databases to be involved in the database query. The method argument allows you to specify adatabase correlation method.
Correlation method ValueIndexForIndexCorrelation 0StretchedIndexCorrelation 1TimeCorrelation 2CycleCorrelation 3
Example:dbs = ("/usr/gapps/visit/data/wave.visit", \"/usr/gapps/visit/data/wave*.silo database")OpenDatabase(dbs[0])AddPlot("Pseudocolor", "pressure")OpenDatabase(dbs[1])AddPlot("Pseudocolor", "d")# VisIt created an index for index database correlation but we# want a cycle correlation.AlterDatabaseCorrelation("Correlation01", dbs, 3)
32
CHAPTER 4. FUNCTIONS
ApplyNamedSelection: applies a named selection to the active plot.
Synopsis:ApplyNamedSelection(name) -> integer
Arguments:name The name of a named selection. (This should have been
previously created with a CreateNamedSelection call.)
Returns:The ApplyNamedSelection function returns 1 for success and 0 for failure.
Description:Named Selections allow you to select a group of elements (or particles). One typically creates a namedselection from a group of elements and then later applies the named selection to another plot (thusreducing the set of elements displayed to the ones from when the named selection was created).
Example:% visit -clidb = "/usr/gapps/visit/data/wave*.silo database"OpenDatabase(db)AddPlot("Pseudocolor", "pressure")AddOperator("Clip")c = ClipAttributes()c.plane1Origin = (0,0.6,0)c.plane1Normal = (0,-1,0)SetOperatorOption(c)DrawPlots()CreateNamedSelection("els_above_at_time_0")SetTimeSliderState(40)RemoveLastOperator()ApplyNamedSelection("els_above_at_time_0")
33
CHAPTER 4. FUNCTIONS
ChangeActivePlotsVar: changes the variable for the active plots
Synopsis:ChangeActivePlotsVar(variableName) -> integer
Arguments:variableName The name of the new plot variable.
Returns:The ChangeActivePlotsVar function returns an integer value of 1 for success and 0 for failure.
Description:The ChangeActivePlotsVar function changes the plotted variable for the active plots. This is a usefulway to change what is being visualized without having to delete and recreate the current plots. ThevariableName argument is a string that contains the name of a variable in the open database.
Example:% visit -cliOpenDatabase("/usr/gapps/visit/data/globe.silo")AddPlot("Pseudocolor", "u")DrawPlots()SaveWindow()ChangeActivePlotsVar("v")
34
CHAPTER 4. FUNCTIONS
CheckForNewStates: checks the specified database for new time states.
Synopsis:CheckForNewStates(name) -> integer
Arguments:name The name argument must be a string that contains the
name of a database that has been opened previously.
Returns:The CheckForNewStates function returns 1 for success and 0 for failure.
Description:Calculations are often run at the same time as some of the preliminary visualization work is beingperformed. That said, you might be visualizing the leading time states of a database that is still beingcreated. If you want to force VisIt to add any new time states that were added since you opened thedatabase, you can use the CheckForNewStates function. The name argument must contain the name ofa database that has been opened before.
Example:% visit -clidb = "/usr/gapps/visit/data/wave*.silo database"OpenDatabase(db)AddPlot("Pseudocolor", "pressure")DrawPlots()SetTimeSliderState(TimeSliderGetNStates() - 1)# More files appear on diskCheckForNewStates(db)SetTimeSliderState(TimeSliderGetNStates() - 1)
35
CHAPTER 4. FUNCTIONS
ChooseCenterOfRotation: allows you to interactively pick a new center of rotation.
Synopsis:ChooseCenterOfRotation() -> integerChooseCenterOfRotation(screenX, screenY) -> integer
Arguments:screenX The X coordinate of the pick point in normalized [0,1]
screen space.screenY The Y cooridinate of the pick point in normalized [0,1]
screen space.
Returns:The ChooseCenterOfRotation function returns 1 if successful and 0 if it fails.
Description:The ChooseCenterOfRotation function allows you to pick a new center of rotation, which is the pointabout which plots are rotated when you interactively rotate plots. The function can either take zeroarguments, in which case you must interactively pick on plots, or it can take two arguments that cor-respond to the X and Y coordinates of the desired pick point in normalized screen space. When usingthe two argument version of the ChooseCenterOfRotation function, the X and Y values are floatingpoint values in the range [0,1]. If the ChooseCenterOfRotation function is able to actually pick on plots,yes there must be plots in the vis window, then the center of rotation is updated and the new value isprinted to the console.
Example:% visit -cliOpenDatabase("/usr/gapps/visit/data/globe.silo")AddPlots("Pseudocolor", "u")DrawPlots()# Interactively choose the center of rotationChooseCenterOfRotation()# Choose a center of rotation using normalized screen# coordinates and print the value.ResetView()ChooseCenterOfRotation(0.5, 0.3)print "The new center of rotation is:", GetView3D().centerOfRotation
36
CHAPTER 4. FUNCTIONS
ClearAllWindows: clears visualization windows of plots.
Synopsis:ClearAllWindows() -> integerClearWindow() -> integer
Returns:1 on success, 0 on failure.
Description:The ClearWindow function is used to clear out the plots from the active visualization window. Theplots are removed from the visualization window but are left in the plot list so that subsequent calls tothe DrawPlots function regenerate the plots in the plot list. The ClearAllWindows function preformsthe same work as the ClearWindow function except that all windows are cleared of their plots.
Example:% visit -cliOpenDatabase("/usr/gapps/visit/data/globe.silo")AddPlot("Pseudocolor", "u")DrawPlots()AddWindow()SetActiveWindow(2) # Make window 2 activeOpenDatabase("/usr/gapps/visit/data/globe.silo")AddPlot("Subset", "mat1")DrawPlots()ClearWindow() # Clear the plots in window 2.DrawPlots() # Redraw the plots in window 2.ClearAllWindows() # Clear the plots from all windows.
37
CHAPTER 4. FUNCTIONS
ClearCache: clears the compute engine’s network cache.
Synopsis:ClearCache(host) -> integerClearCache(host, simulation) -> integerClearCacheForAllEngines() -> integer
Arguments:host The name of the computer where the compute engine is
running.simulation The name of the simulation being processed by the compute
engine.
Returns:The ClearCache and ClearCacheForAllEngines functions return 1 on success and 0 on failure.
Description:Sometimes during extended VisIt runs, you might want to periodically clear the compute engine’s net-work cache to reduce the amount of memory being used by the compute engine. Clearing the networkcache is also useful when you want to change what the compute engine is working on. For example,you might process a large database and then decide to process another large database. Clearing thenetwork cache beforehand will free up more resources for the compute engine so it can more efficientlyprocess the new database. The host argument is a string object containing the name of the computeron which the compute engine is running. The simulation argument is optional and only applies to whenyou want to instruct a simulation that is acting as a VisIt compute engine to clear its network cache.If you want to tell more than one compute engine to clear its cache without having to call ClearCachemultiple times, you can use the ClearCacheForAllEngines function.
Example:%visit -cliOpenDatabase("localhost:very_large_database")# Do a lot of workClearCache("localhost")OpenDatabase(localhost:another_large_database")# Do more workOpenDatabase("remotehost:yet_another_database")# Do more workClearCacheForAllEngines()
38
CHAPTER 4. FUNCTIONS
ClearCacheForAllEngines: clears the compute engine’s network cache.
Synopsis:ClearCache(host) -> integerClearCache(host, simulation) -> integerClearCacheForAllEngines() -> integer
Arguments:host The name of the computer where the compute engine is
running.simulation The name of the simulation being processed by the compute
engine.
Returns:The ClearCache and ClearCacheForAllEngines functions return 1 on success and 0 on failure.
Description:Sometimes during extended VisIt runs, you might want to periodically clear the compute engine’s net-work cache to reduce the amount of memory being used by the compute engine. Clearing the networkcache is also useful when you want to change what the compute engine is working on. For example,you might process a large database and then decide to process another large database. Clearing thenetwork cache beforehand will free up more resources for the compute engine so it can more efficientlyprocess the new database. The host argument is a string object containing the name of the computeron which the compute engine is running. The simulation argument is optional and only applies to whenyou want to instruct a simulation that is acting as a VisIt compute engine to clear its network cache.If you want to tell more than one compute engine to clear its cache without having to call ClearCachemultiple times, you can use the ClearCacheForAllEngines function.
Example:%visit -cliOpenDatabase("localhost:very_large_database")# Do a lot of workClearCache("localhost")OpenDatabase(localhost:another_large_database")# Do more workOpenDatabase("remotehost:yet_another_database")# Do more workClearCacheForAllEngines()
39
CHAPTER 4. FUNCTIONS
ClearMacros: clear the macros that have been registered using RegisterMacros.
Synopsis:ClearMacros()
Arguments:none
Returns:The ClearMacros function does not return a value.
Description:The ClearMacros function clears out the list of registered macros and sends a message to the gui toclear the buttons from the Macros window.
Example:ClearMacros()
40
CHAPTER 4. FUNCTIONS
ClearPickPoints: clears pick points from the visualization window
Synopsis:ClearPickPoints()
Returns:The ClearPickPoints function does not return a value.
Description:The ClearPickPoints function removes pick points from the active visualization window. Pick points arethe letters that are added to the visualization window where the mouse is clicked when the visualizationwindow is in pick mode.
Example:% visit -cli# Put the visualization window into pick mode using the popup# menu and add some pick points.# Clear the pick points.ClearPickPoints()
41

CHAPTER 4. FUNCTIONS
ClearReferenceLines: clears reference lines from the visualization window.
Synopsis:ClearReferenceLines()
Returns:The ClearReferenceLines function does not return a value.
Description:The ClearReferenceLines function removes reference lines from the active visualization window. Refer-ence lines are the lines that are drawn on a plot to show where you have performed lineouts.
Example:% visit -cliOpenDatabase("/usr/gapps/visit/data/curv2d.silo")AddPlot("Pseudocolor", "d")Lineout((-3.0, 2.0), (2.0, 4.0), ("default", "u", "v"))ClearReferenceLines()
42
CHAPTER 4. FUNCTIONS
ClearViewKeyframes: clears any view keyframes that have been set.
Synopsis:ClearViewKeyframes() -> integer
Returns:The ClearViewKeyframes function returns 1 on success and 0 on failure.
Description:The ClearViewKeyframes function clears any view keyframes that may have been set. View keyframesare used to create complex view behavior such as fly−throughs when VisIt is in keyframing mode.
Example:% visit -cliOpenDatabase("/usr/gapps/visit/data/globe.silo")AddPlot("Pseudocolor", "u")k = KeyframeAttributes()k.enabled, k.nFrames, k.nFramesWasUserSet = 1,10,1SetKeyframeAttributes(k)DrawPlots()SetViewKeyframe()v1 = GetView3D()v1.viewNormal = (-0.66609, 0.337227, 0.665283)v1.viewUp = (0.157431, 0.935425, -0.316537)SetView3D(v1)SetTimeSliderState(9)SetViewKeyframe()ToggleCameraViewMode()for i in range(10):SetTimeSliderState(i)ClearViewKeyframes()
43

CHAPTER 4. FUNCTIONS
ClearWindow: clears visualization windows of plots.
Synopsis:ClearAllWindows() -> integerClearWindow() -> integer
Returns:1 on success, 0 on failure.
Description:The ClearWindow function is used to clear out the plots from the active visualization window. Theplots are removed from the visualization window but are left in the plot list so that subsequent calls tothe DrawPlots function regenerate the plots in the plot list. The ClearAllWindows function preformsthe same work as the ClearWindow function except that all windows are cleared of their plots.
Example:% visit -cliOpenDatabase("/usr/gapps/visit/data/globe.silo")AddPlot("Pseudocolor", "u")DrawPlots()AddWindow()SetActiveWindow(2) # Make window 2 activeOpenDatabase("/usr/gapps/visit/data/globe.silo")AddPlot("Subset", "mat1")DrawPlots()ClearWindow() # Clear the plots in window 2.DrawPlots() # Redraw the plots in window 2.ClearAllWindows() # Clear the plots from all windows.
44
CHAPTER 4. FUNCTIONS
CloneWindow: creates a new window that has the same plots, annotations, lights, and
Synopsis:CloneWindow() -> integer
Returns:The CloneWindow function returns an integer value of 1 for success and 0 for failure.
Description:The CloneWindow function tells the viewer to create a new window, based on the active window, thatcontains the same plots, annotations, lights, and view as the active window. This function is useful forwhen you have a window set up like you want and then want to do the same thing in another windowusing a different database. You can first clone the window and then replace the database.
Example:% visit -cliOpenDatabase("/usr/gapps/visit/data/globe.silo")AddPlot("Pseudocolor", "u")DrawPlots()v = ViewAttributes()v.camera = (-0.505893, 0.32034, 0.800909)v.viewUp = (0.1314, 0.946269, -0.295482)v.parallelScale = 14.5472v.nearPlane = -34.641v.farPlane = 34.641v.perspective = 1SetView3D() # Set the viewa = AnnotationAttributes()a.backgroundColor = (0, 0, 255, 255)SetAnnotationAttributes(a) # Set the annotation propertiesCloneWindow() # Create a clone of the active windowDrawPlots() # Make the new window draw its plots
45
CHAPTER 4. FUNCTIONS
Close: closes the viewer.
Synopsis:Close()
Arguments:none
Returns:The Close function does not return a value.
Description:The Close function terminates VisIt’s viewer. This is useful for Python scripts that only need access toVisIt’s capabilties for a short time before closing VisIt.
Example:import visitvisit.Launch()visit.Close() # Close the viewer
46
CHAPTER 4. FUNCTIONS
CloseComputeEngine: closes the compute engine running on a specified host.
Synopsis:CloseComputeEngine() -> integerCloseComputeEngine(hostName) -> integerCloseComputeEngine(hostName, simulation) -> integer
Arguments:hostName Optional name of the computer on which the compute en-
gine is running.simulation Optional name of a simulation.
Returns:The CloseComputeEngine function returns an integer value of 1 for success and 0 for failure.
Description:The CloseComputeEngine function tells the viewer to close the compute engine running a specified host.The hostName argument is a string that contains the name of the computer where the compute engineis running. The hostName argument can also be the name ”localhost” if you want to close the computeengine on the local machine without having to specify its name. It is not necessary to provide thehostName argument. If the argument is omitted, the first compute engine in the engine list will beclosed. The simulation argument can be provided if you want to close a connection to a simulation thatis acting as a VisIt compute engine. A compute engine can be launched again by creating a plot or bycalling the OpenComputeEngine function.
Example:% visit -cliOpenDatabase("/usr/gapps/visit/data/globe.silo") # Launches an engineAddPlot("Pseudocolor", "u")DrawPlots()CloseComputeEngine() # Close the compute engine
47
CHAPTER 4. FUNCTIONS
CloseDatabase: closes the specified database and frees up resources associated with it.
Synopsis:CloseDatabase(name) -> integer
Arguments:name A string object containing the name of the database to
close.
Returns:The CloseDatabase function returns 1 on success and 0 on failure.
Description:The CloseDatabase function is used to close a specified database and free all resources that were devotedto keeping the database open. This function has an effect similar to ClearCache but it does more inthat in addition to clearing the compute engine’s cache, which it only does for the specified database, italso removes all references to the specified database from tables of cached metadata, etc. Note that theCloseDatabase function will fail and the database will not be closed if any plots reference the specifieddatabase.
Example:% visit -clidb = "/usr/gapps/visit/data/globe.silo"OpenDatabase(db)AddPlot("Pseudocolor", "u")DrawPlots()print "This won’t work: retval = %d" % CloseDatabase(db)DeleteAllPlots()print "Now it works: retval = %d" % CloseDatabase(db)
48
CHAPTER 4. FUNCTIONS
ColorTableNames: returns a tuple of color table names.
Synopsis:ColorTableNames() -> tuple
Returns:The ColorTableNames function returns a tuple of strings containing the names of the color tables thathave been defined.
Description:The ColorTableNames function returns a tuple of strings containing the names of the color tables thathave been defined. This method can be used in case you want to iterate over several color tables.
Example:% visit -cliOpenDatabase("/usr/gapps/visit/data/curv2d.silo")AddPlot("Pseudocolor", "u")DrawPlots()for ct in ColorTableNames():p = PseudocolorAttributes()p.colorTableName = ctSetPlotOptions(p)
49
CHAPTER 4. FUNCTIONS
ConstructDataBinning: constructs a data binning
Synopsis:ConstructDataBinning(i) -> integer
Arguments:i An object of type ConstructDataBinningAttributes. This
object specifies the options for constructing a data binning.
Returns:Returns 1 on success, 0 on failure.
Description:The ConstructDataBinning function creates a data binning function for the active plot. Data Binningsplace data from a data set into bins and reduce that data. They are used to either be incorporated withexpressions to make new derived quantities or to be directly visualized.
Example:% visit -cliOpenDatabase("/usr/gapps/visit/data/curv3d.silo")AddPlot("Pseudocolor", "d")DrawPlots()# Set the construct data binning attributes.i = ConstructDataBinningAttributes()i.name = "db1"i.binningScheme = i.Uniformi.varnames = ("u", "w")i.binBoundaries = (-1, 1, -1, 1) # minu, maxu, minw, maxwi.numSamples = (25, 25)i.reductionOperator = i.Averagei.varForReductionOperator = "v"ConstructDataBinning(i)# Example of binning using spatial coordinatesi.varnames = ("X", "u") # X is added as a placeholder to maintain indexingi.binType = (1, 0) # 1 = X, 2 = Y, 3 = Z, 0 = variable
50
CHAPTER 4. FUNCTIONS
CopyAnnotationsToWindow: copies attributes from one visualization window to another visualiza-tion
Synopsis:CopyAnnotationsToWindow(source, dest) -> integerCopyLightingToWindow(source, dest) -> integerCopyViewTowindow(source, dest) -> integerCopyPlotsToWindow(source, dest) -> integer
Arguments:source The index (an integer from 1 to 16) of the source window.dest The index (an integer from 1 to 16) of the destination win-
dow.
Returns:The Copy functions return an integer value of 1 for success and 0 for failure.
Description:The Copy functions copy attributes from one visualization window to another visualization window.The CopyAnnotationsToWindow function copies the annotations from a source visualization window toa destination visualization window while the CopyLightingAttributes function copies lighting and theCopyViewToWindow function copies the view. The CopyPlotsToWindow function copies the plots fromone visualization window to another visualization window but does not also force plots to generate soafter copying plots with the CopyPlotsToWindow function, you should also call the DrawPlots function.
Example:% visit -cliOpenDatabase("/usr/gapps/visit/data/globe.silo")AddPlot("Pseudocolor", "u")DrawPlots()AddWindow()SetActiveWindow(2)OpenDatabase("/usr/gapps/visit/data/globe.silo")AddPlot("Mesh", "mesh1")# Copy window 1’s Pseudocolor plot to window 2.CopyPlotsToWindow(1, 2)DrawPlots() # Window 2 will have 2 plots# Spin the plots around in window 2 using the mouse.CopyViewToWindow(2, 1) # Copy window 2’s view to window 1.
51
CHAPTER 4. FUNCTIONS
CopyLightingToWindow: copies attributes from one visualization window to another visualization
Synopsis:CopyAnnotationsToWindow(source, dest) -> integerCopyLightingToWindow(source, dest) -> integerCopyViewTowindow(source, dest) -> integerCopyPlotsToWindow(source, dest) -> integer
Arguments:source The index (an integer from 1 to 16) of the source window.dest The index (an integer from 1 to 16) of the destination win-
dow.
Returns:The Copy functions return an integer value of 1 for success and 0 for failure.
Description:The Copy functions copy attributes from one visualization window to another visualization window.The CopyAnnotationsToWindow function copies the annotations from a source visualization window toa destination visualization window while the CopyLightingAttributes function copies lighting and theCopyViewToWindow function copies the view. The CopyPlotsToWindow function copies the plots fromone visualization window to another visualization window but does not also force plots to generate soafter copying plots with the CopyPlotsToWindow function, you should also call the DrawPlots function.
Example:% visit -cliOpenDatabase("/usr/gapps/visit/data/globe.silo")AddPlot("Pseudocolor", "u")DrawPlots()AddWindow()SetActiveWindow(2)OpenDatabase("/usr/gapps/visit/data/globe.silo")AddPlot("Mesh", "mesh1")# Copy window 1’s Pseudocolor plot to window 2.CopyPlotsToWindow(1, 2)DrawPlots() # Window 2 will have 2 plots# Spin the plots around in window 2 using the mouse.CopyViewToWindow(2, 1) # Copy window 2’s view to window 1.
52
CHAPTER 4. FUNCTIONS
CopyPlotsToWindow: copies attributes from one visualization window to another visualization
Synopsis:CopyAnnotationsToWindow(source, dest) -> integerCopyLightingToWindow(source, dest) -> integerCopyViewTowindow(source, dest) -> integerCopyPlotsToWindow(source, dest) -> integer
Arguments:source The index (an integer from 1 to 16) of the source window.dest The index (an integer from 1 to 16) of the destination win-
dow.
Returns:The Copy functions return an integer value of 1 for success and 0 for failure.
Description:The Copy functions copy attributes from one visualization window to another visualization window.The CopyAnnotationsToWindow function copies the annotations from a source visualization window toa destination visualization window while the CopyLightingAttributes function copies lighting and theCopyViewToWindow function copies the view. The CopyPlotsToWindow function copies the plots fromone visualization window to another visualization window but does not also force plots to generate soafter copying plots with the CopyPlotsToWindow function, you should also call the DrawPlots function.
Example:% visit -cliOpenDatabase("/usr/gapps/visit/data/globe.silo")AddPlot("Pseudocolor", "u")DrawPlots()AddWindow()SetActiveWindow(2)OpenDatabase("/usr/gapps/visit/data/globe.silo")AddPlot("Mesh", "mesh1")# Copy window 1’s Pseudocolor plot to window 2.CopyPlotsToWindow(1, 2)DrawPlots() # Window 2 will have 2 plots# Spin the plots around in window 2 using the mouse.CopyViewToWindow(2, 1) # Copy window 2’s view to window 1.
53

CHAPTER 4. FUNCTIONS
CopyViewToWindow: copies attributes from one visualization window to another visualization
Synopsis:CopyAnnotationsToWindow(source, dest) -> integerCopyLightingToWindow(source, dest) -> integerCopyViewTowindow(source, dest) -> integerCopyPlotsToWindow(source, dest) -> integer
Arguments:source The index (an integer from 1 to 16) of the source window.dest The index (an integer from 1 to 16) of the destination win-
dow.
Returns:The Copy functions return an integer value of 1 for success and 0 for failure.
Description:The Copy functions copy attributes from one visualization window to another visualization window.The CopyAnnotationsToWindow function copies the annotations from a source visualization window toa destination visualization window while the CopyLightingAttributes function copies lighting and theCopyViewToWindow function copies the view. The CopyPlotsToWindow function copies the plots fromone visualization window to another visualization window but does not also force plots to generate soafter copying plots with the CopyPlotsToWindow function, you should also call the DrawPlots function.
Example:% visit -cliOpenDatabase("/usr/gapps/visit/data/globe.silo")AddPlot("Pseudocolor", "u")DrawPlots()AddWindow()SetActiveWindow(2)OpenDatabase("/usr/gapps/visit/data/globe.silo")AddPlot("Mesh", "mesh1")# Copy window 1’s Pseudocolor plot to window 2.CopyPlotsToWindow(1, 2)DrawPlots() # Window 2 will have 2 plots# Spin the plots around in window 2 using the mouse.CopyViewToWindow(2, 1) # Copy window 2’s view to window 1.
54
CHAPTER 4. FUNCTIONS
CreateAnnotationObject: creates an annotation object that can directly manipulate annotations in
Synopsis:CreateAnnotationObject(annotType) -> annotation object
Arguments:annotType A string containing the name of the type of annotation
object to create.
Returns:CreateAnnotationObject is a factory function that creates annotation objects of different types. Thereturn value, if a valid annotation type is provided, is an annotation object. If the function fails, VisI-tException is raised.
Description:CreateAnnotationObject is a factory function that creates different kinds of annotation objects. TheannotType argument is a string containing the name of the type of annotation object to create. Eachtype of annotation object has different properties that can be set. Setting the different properties ofan Annotation objects directly modifes annotations in the vis window. Currently there are 5 types ofannotation objects:
Annotation type String2D text annotation ”Text2D”3D text annotation ”Text3D”Time slider annotation ”TimeSlider”Image annotation ”Image”Line/arrow annotation ”Line2D”
Example:% visit -cliOpenDatabase("/usr/gapps/visit/data/wave.visit", 17)AddPlot("Pseudocolor", "pressure")DrawPlots()slider = CreateAnnotationObject("TimeSlider")print sliderslider.startColor = (255,0,0,255)slider.endColor = (255,255,0,255)
55
CHAPTER 4. FUNCTIONS
CreateDatabaseCorrelation: creates a database correlation.
Synopsis:CreateDatabaseCorrelation(name, databases, method) -> integer
Arguments:name String object containing the name of the database correla-
tion to be created.databases Tuple or list of string objects containing the names of the
databases to involve in the database correlation.method An integer in the range [0,3] that determines the correlation
method.
Returns:The CreateDatabaseCorrelation function returns 1 on success and 0 on failure.
Description:The CreateDatabaseCorrelation function creates a database correlation, which is a VisIt construct thatrelates the time states for two or more databases in some way. You would use the CreateDatabaseC-orrelation function if you wanted to put plots from more than one time−varying database in the samevis window and then move them both through time in some synchronized way. The name argumentis a string that is the name of the database correlation to be created. You will use the name of thedatabase correlation to set the active time slider later so that you can change time states. The databasesargument is a list or tuple of string objects containing the fully−qualified (host:/path/filename) namesof the databases to be involved in the database query. The method argument allows you to specify adatabase correlation method.
Correlation method ValueIndexForIndexCorrelation 0StretchedIndexCorrelation 1TimeCorrelation 2CycleCorrelation 3
Each database correlation has its own time slider that can be used to set the time state of databases thatare part of a database correlation. Individual time−varying databases have their own trivial databasecorrelation, consisting of only 1 database. When you call the CreateDatabaseCorrelation function, VisItcreates a new time slider with the same name as the database correlation and makes it be the activetime slider.
Example:% visit -clidbs = ("/usr/gapps/visit/data/dbA00.pdb","/usr/gapps/visit/data/dbB00.pdb")OpenDatabase(dbs[0])AddPlot("FilledBoundary", "material(mesh)")OpenDatabase(dbs[1])AddPlot("FilledBoundary", "material(mesh)")DrawPlots()CreateDatabaseCorrelation("common", dbs, 1)# Creating a new database correlation also creates a new time# slider and makes it be active.w = GetWindowInformation()print "Active time slider: %s" % w.timeSliders[w.activeTimeSlider]
56
CHAPTER 4. FUNCTIONS
# Animate through time using the "common" database correlation’s# time slider.for i in range(TimeSliderGetNStates()):SetTimeSliderState(i)
57
CHAPTER 4. FUNCTIONS
CreateNamedSelection: creates a named selection.
Synopsis:CreateNamedSelection(name) -> integerCreateNamedSelection(name, properties) -> integer
Arguments:name The name of a named selection.properties This optional argument lets you pass a SelectionProper-
ties object containing the properties that will be used tocreate the named selection. When this argument is omit-ted, the named selection will always be associated with theactive plot. You can use this argument to set up more com-plex named selections that may be associated with plots ordatabases.
Returns:The CreateNamedSelection function returns 1 for success and 0 for failure.
Description:Named Selections allow you to select a group of elements (or particles). One typically creates a namedselection from a group of elements and then later applies the named selection to another plot (thusreducing the set of elements displayed to the ones from when the named selection was created).
Example:% visit -clidb = "/usr/gapps/visit/data/wave*.silo database"OpenDatabase(db)AddPlot("Pseudocolor", "pressure")AddOperator("Clip")c = ClipAttributes()c.plane1Origin = (0,0.6,0)c.plane1Normal = (0,-1,0)SetOperatorOption(c)DrawPlots()CreateNamedSelection("els_above_at_time_0")SetTimeSliderState(40)RemoveLastOperator()ApplyNamedSelection("els_above_at_time_0")
58

CHAPTER 4. FUNCTIONS
DeIconifyAllWindows: unhides all of the hidden visualization windows.
Synopsis:DeIconifyAllWindows()
Returns:The DeIconifyAllWindows function does not return a value.
Description:The DeIconifyAllWindows function unhides all of the hidden visualization windows. This function isusually called after IconifyAllWindows as a way of making all of the hidden visualization windows visible.
Example:% visit -cliSetWindowLayout(4) # Have 4 windowsIconifyAllWindows()DeIconifyAllWindows()
59

CHAPTER 4. FUNCTIONS
DefineArrayExpression: creates a expression variable.
Synopsis:DefineMaterialExpression(variableName, expression) -> integerDefineMeshExpression(variableName, expression) -> integerDefineScalarExpression(variableName, expression) -> integerDefineSpeciesExpression(variableName, expression) -> integerDefineTensorExpression(variableName, expression) -> integerDefineVectorExpression(variableName, expression) -> integerDefineArrayExpression(variableName, expression) -> integerDefineCurveExpression(variableName, expression) -> integer
Arguments:variableName The name of the variable to be created.expression The expression definition.
Returns:The DefineExpression functions return 1 on success and 0 on failure.
Description:The DefineScalarExpression function creates a new scalar variable based on other variables from theopen database. Likewise, the DefineMaterialExpression function creates new material variables, De-fineMeshExpression creates new mesh variables, DefineSpeciesExpression creates new species variables,DefineVectorExpression creates new vector variables, DefineTensorExpression creates new tensor vari-ables, and DefineArrayExpression creates new array variables. Expression variables can be plottedlike any other variable. The variableName argument is a string that contains the name of the newvariable. You can pass the name of an existing expression if you want to provide a new expressiondefinition. The expression argument is a string that contains the definition of the new variable in termsof math operators and pre−existing variable names Reference the VisIt User’s Manual if you want moreinformation on creating expressions, such as expression syntax, or a list of built−in expression functions.
Example:% visit -cliOpenDatabase("/usr/gapps/visit/data/globe.silo")DefineScalarExpression("myvar", "sin(u) + cos(w)")# Plot the scalar expression variable.AddPlot("Pseudocolor", "myvar")DrawPlots()# Plot a vector expression variable.DefineVectorExpression("myvec", "{u,v,w}")AddPlot("Vector", "myvec")DrawPlots()
60

CHAPTER 4. FUNCTIONS
DefineCurveExpression: creates a expression variable.
Synopsis:DefineMaterialExpression(variableName, expression) -> integerDefineMeshExpression(variableName, expression) -> integerDefineScalarExpression(variableName, expression) -> integerDefineSpeciesExpression(variableName, expression) -> integerDefineTensorExpression(variableName, expression) -> integerDefineVectorExpression(variableName, expression) -> integerDefineArrayExpression(variableName, expression) -> integerDefineCurveExpression(variableName, expression) -> integer
Arguments:variableName The name of the variable to be created.expression The expression definition.
Returns:The DefineExpression functions return 1 on success and 0 on failure.
Description:The DefineScalarExpression function creates a new scalar variable based on other variables from theopen database. Likewise, the DefineMaterialExpression function creates new material variables, De-fineMeshExpression creates new mesh variables, DefineSpeciesExpression creates new species variables,DefineVectorExpression creates new vector variables, DefineTensorExpression creates new tensor vari-ables, and DefineArrayExpression creates new array variables. Expression variables can be plottedlike any other variable. The variableName argument is a string that contains the name of the newvariable. You can pass the name of an existing expression if you want to provide a new expressiondefinition. The expression argument is a string that contains the definition of the new variable in termsof math operators and pre−existing variable names Reference the VisIt User’s Manual if you want moreinformation on creating expressions, such as expression syntax, or a list of built−in expression functions.
Example:% visit -cliOpenDatabase("/usr/gapps/visit/data/globe.silo")DefineScalarExpression("myvar", "sin(u) + cos(w)")# Plot the scalar expression variable.AddPlot("Pseudocolor", "myvar")DrawPlots()# Plot a vector expression variable.DefineVectorExpression("myvec", "{u,v,w}")AddPlot("Vector", "myvec")DrawPlots()
61

CHAPTER 4. FUNCTIONS
DefineMaterialExpression: creates a expression variable.
Synopsis:DefineMaterialExpression(variableName, expression) -> integerDefineMeshExpression(variableName, expression) -> integerDefineScalarExpression(variableName, expression) -> integerDefineSpeciesExpression(variableName, expression) -> integerDefineTensorExpression(variableName, expression) -> integerDefineVectorExpression(variableName, expression) -> integerDefineArrayExpression(variableName, expression) -> integerDefineCurveExpression(variableName, expression) -> integer
Arguments:variableName The name of the variable to be created.expression The expression definition.
Returns:The DefineExpression functions return 1 on success and 0 on failure.
Description:The DefineScalarExpression function creates a new scalar variable based on other variables from theopen database. Likewise, the DefineMaterialExpression function creates new material variables, De-fineMeshExpression creates new mesh variables, DefineSpeciesExpression creates new species variables,DefineVectorExpression creates new vector variables, DefineTensorExpression creates new tensor vari-ables, and DefineArrayExpression creates new array variables. Expression variables can be plottedlike any other variable. The variableName argument is a string that contains the name of the newvariable. You can pass the name of an existing expression if you want to provide a new expressiondefinition. The expression argument is a string that contains the definition of the new variable in termsof math operators and pre−existing variable names Reference the VisIt User’s Manual if you want moreinformation on creating expressions, such as expression syntax, or a list of built−in expression functions.
Example:% visit -cliOpenDatabase("/usr/gapps/visit/data/globe.silo")DefineScalarExpression("myvar", "sin(u) + cos(w)")# Plot the scalar expression variable.AddPlot("Pseudocolor", "myvar")DrawPlots()# Plot a vector expression variable.DefineVectorExpression("myvec", "{u,v,w}")AddPlot("Vector", "myvec")DrawPlots()
62
CHAPTER 4. FUNCTIONS
DefineMeshExpression: creates a expression variable.
Synopsis:DefineMaterialExpression(variableName, expression) -> integerDefineMeshExpression(variableName, expression) -> integerDefineScalarExpression(variableName, expression) -> integerDefineSpeciesExpression(variableName, expression) -> integerDefineTensorExpression(variableName, expression) -> integerDefineVectorExpression(variableName, expression) -> integerDefineArrayExpression(variableName, expression) -> integerDefineCurveExpression(variableName, expression) -> integer
Arguments:variableName The name of the variable to be created.expression The expression definition.
Returns:The DefineExpression functions return 1 on success and 0 on failure.
Description:The DefineScalarExpression function creates a new scalar variable based on other variables from theopen database. Likewise, the DefineMaterialExpression function creates new material variables, De-fineMeshExpression creates new mesh variables, DefineSpeciesExpression creates new species variables,DefineVectorExpression creates new vector variables, DefineTensorExpression creates new tensor vari-ables, and DefineArrayExpression creates new array variables. Expression variables can be plottedlike any other variable. The variableName argument is a string that contains the name of the newvariable. You can pass the name of an existing expression if you want to provide a new expressiondefinition. The expression argument is a string that contains the definition of the new variable in termsof math operators and pre−existing variable names Reference the VisIt User’s Manual if you want moreinformation on creating expressions, such as expression syntax, or a list of built−in expression functions.
Example:% visit -cliOpenDatabase("/usr/gapps/visit/data/globe.silo")DefineScalarExpression("myvar", "sin(u) + cos(w)")# Plot the scalar expression variable.AddPlot("Pseudocolor", "myvar")DrawPlots()# Plot a vector expression variable.DefineVectorExpression("myvec", "{u,v,w}")AddPlot("Vector", "myvec")DrawPlots()
63
CHAPTER 4. FUNCTIONS
DefinePythonExpression: defines a new Python Filter Expression.
Synopsis:DefinePythonExpression("myvar",[args],\
source=’python filter source ...’)DefinePythonExpression("myvar",[args],\
source=’python filter source ...’,type=’scalar’)DefinePythonExpression("myvar",[args],\
file=’path/to/python_filter_script.py’)
Arguments:name The name of the variable to be created.args A tuple (or list) of strings providing the variable names of
the arguments to the Python Expression.source A string containing the source code for a Python Expression
Filter .file A string containing the path to a Python Expression Filter
script file.type An optional string defining the output type of the
expression. Default type: ’scalar’ Avalaible types:’scalar’,’vector’,’tensor’,’array’,’curve’ Note: Use only oneof the ’source’ or ’file’ arguments. If both are used the’source’ argument overrides ’file’.
Returns:The DefineExpression functions do not return a value.
Description:Used to define a Python Filter Expression.
64

CHAPTER 4. FUNCTIONS
DefineScalarExpression: creates a expression variable.
Synopsis:DefineMaterialExpression(variableName, expression) -> integerDefineMeshExpression(variableName, expression) -> integerDefineScalarExpression(variableName, expression) -> integerDefineSpeciesExpression(variableName, expression) -> integerDefineTensorExpression(variableName, expression) -> integerDefineVectorExpression(variableName, expression) -> integerDefineArrayExpression(variableName, expression) -> integerDefineCurveExpression(variableName, expression) -> integer
Arguments:variableName The name of the variable to be created.expression The expression definition.
Returns:The DefineExpression functions return 1 on success and 0 on failure.
Description:The DefineScalarExpression function creates a new scalar variable based on other variables from theopen database. Likewise, the DefineMaterialExpression function creates new material variables, De-fineMeshExpression creates new mesh variables, DefineSpeciesExpression creates new species variables,DefineVectorExpression creates new vector variables, DefineTensorExpression creates new tensor vari-ables, and DefineArrayExpression creates new array variables. Expression variables can be plottedlike any other variable. The variableName argument is a string that contains the name of the newvariable. You can pass the name of an existing expression if you want to provide a new expressiondefinition. The expression argument is a string that contains the definition of the new variable in termsof math operators and pre−existing variable names Reference the VisIt User’s Manual if you want moreinformation on creating expressions, such as expression syntax, or a list of built−in expression functions.
Example:% visit -cliOpenDatabase("/usr/gapps/visit/data/globe.silo")DefineScalarExpression("myvar", "sin(u) + cos(w)")# Plot the scalar expression variable.AddPlot("Pseudocolor", "myvar")DrawPlots()# Plot a vector expression variable.DefineVectorExpression("myvec", "{u,v,w}")AddPlot("Vector", "myvec")DrawPlots()
65

CHAPTER 4. FUNCTIONS
DefineSpeciesExpression: creates a expression variable.
Synopsis:DefineMaterialExpression(variableName, expression) -> integerDefineMeshExpression(variableName, expression) -> integerDefineScalarExpression(variableName, expression) -> integerDefineSpeciesExpression(variableName, expression) -> integerDefineTensorExpression(variableName, expression) -> integerDefineVectorExpression(variableName, expression) -> integerDefineArrayExpression(variableName, expression) -> integerDefineCurveExpression(variableName, expression) -> integer
Arguments:variableName The name of the variable to be created.expression The expression definition.
Returns:The DefineExpression functions return 1 on success and 0 on failure.
Description:The DefineScalarExpression function creates a new scalar variable based on other variables from theopen database. Likewise, the DefineMaterialExpression function creates new material variables, De-fineMeshExpression creates new mesh variables, DefineSpeciesExpression creates new species variables,DefineVectorExpression creates new vector variables, DefineTensorExpression creates new tensor vari-ables, and DefineArrayExpression creates new array variables. Expression variables can be plottedlike any other variable. The variableName argument is a string that contains the name of the newvariable. You can pass the name of an existing expression if you want to provide a new expressiondefinition. The expression argument is a string that contains the definition of the new variable in termsof math operators and pre−existing variable names Reference the VisIt User’s Manual if you want moreinformation on creating expressions, such as expression syntax, or a list of built−in expression functions.
Example:% visit -cliOpenDatabase("/usr/gapps/visit/data/globe.silo")DefineScalarExpression("myvar", "sin(u) + cos(w)")# Plot the scalar expression variable.AddPlot("Pseudocolor", "myvar")DrawPlots()# Plot a vector expression variable.DefineVectorExpression("myvec", "{u,v,w}")AddPlot("Vector", "myvec")DrawPlots()
66
CHAPTER 4. FUNCTIONS
DefineTensorExpression: creates a expression variable.
Synopsis:DefineMaterialExpression(variableName, expression) -> integerDefineMeshExpression(variableName, expression) -> integerDefineScalarExpression(variableName, expression) -> integerDefineSpeciesExpression(variableName, expression) -> integerDefineTensorExpression(variableName, expression) -> integerDefineVectorExpression(variableName, expression) -> integerDefineArrayExpression(variableName, expression) -> integerDefineCurveExpression(variableName, expression) -> integer
Arguments:variableName The name of the variable to be created.expression The expression definition.
Returns:The DefineExpression functions return 1 on success and 0 on failure.
Description:The DefineScalarExpression function creates a new scalar variable based on other variables from theopen database. Likewise, the DefineMaterialExpression function creates new material variables, De-fineMeshExpression creates new mesh variables, DefineSpeciesExpression creates new species variables,DefineVectorExpression creates new vector variables, DefineTensorExpression creates new tensor vari-ables, and DefineArrayExpression creates new array variables. Expression variables can be plottedlike any other variable. The variableName argument is a string that contains the name of the newvariable. You can pass the name of an existing expression if you want to provide a new expressiondefinition. The expression argument is a string that contains the definition of the new variable in termsof math operators and pre−existing variable names Reference the VisIt User’s Manual if you want moreinformation on creating expressions, such as expression syntax, or a list of built−in expression functions.
Example:% visit -cliOpenDatabase("/usr/gapps/visit/data/globe.silo")DefineScalarExpression("myvar", "sin(u) + cos(w)")# Plot the scalar expression variable.AddPlot("Pseudocolor", "myvar")DrawPlots()# Plot a vector expression variable.DefineVectorExpression("myvec", "{u,v,w}")AddPlot("Vector", "myvec")DrawPlots()
67

CHAPTER 4. FUNCTIONS
DefineVectorExpression: creates a expression variable.
Synopsis:DefineMaterialExpression(variableName, expression) -> integerDefineMeshExpression(variableName, expression) -> integerDefineScalarExpression(variableName, expression) -> integerDefineSpeciesExpression(variableName, expression) -> integerDefineTensorExpression(variableName, expression) -> integerDefineVectorExpression(variableName, expression) -> integerDefineArrayExpression(variableName, expression) -> integerDefineCurveExpression(variableName, expression) -> integer
Arguments:variableName The name of the variable to be created.expression The expression definition.
Returns:The DefineExpression functions return 1 on success and 0 on failure.
Description:The DefineScalarExpression function creates a new scalar variable based on other variables from theopen database. Likewise, the DefineMaterialExpression function creates new material variables, De-fineMeshExpression creates new mesh variables, DefineSpeciesExpression creates new species variables,DefineVectorExpression creates new vector variables, DefineTensorExpression creates new tensor vari-ables, and DefineArrayExpression creates new array variables. Expression variables can be plottedlike any other variable. The variableName argument is a string that contains the name of the newvariable. You can pass the name of an existing expression if you want to provide a new expressiondefinition. The expression argument is a string that contains the definition of the new variable in termsof math operators and pre−existing variable names Reference the VisIt User’s Manual if you want moreinformation on creating expressions, such as expression syntax, or a list of built−in expression functions.
Example:% visit -cliOpenDatabase("/usr/gapps/visit/data/globe.silo")DefineScalarExpression("myvar", "sin(u) + cos(w)")# Plot the scalar expression variable.AddPlot("Pseudocolor", "myvar")DrawPlots()# Plot a vector expression variable.DefineVectorExpression("myvec", "{u,v,w}")AddPlot("Vector", "myvec")DrawPlots()
68
CHAPTER 4. FUNCTIONS
DeleteActivePlots: deletes plots from the active window’s plot list.
Synopsis:DeleteActivePlots() -> integerDeleteAllPlots() -> integer
Returns:The Delete functions return an integer value of 1 for success and 0 for failure.
Description:The Delete functions delete plots from the active window’s plot list. The DeleteActivePlots functiondeletes all of the active plots from the plot list. There is no way to retrieve a plot once it has beendeleted from the plot list. The active plots are set using the SetActivePlots function. The DeleteAllPlotsfunction deletes all plots from the active window’s plot list regardless of whether or not they are active.
Example:% visit -cliOpenDatabase("/usr/gapps/visit/data/curv2d.silo")AddPlot("Pseudocolor", "d")AddPlot("Contour", "u")AddPlot("Mesh", "curvmesh2d")DrawPlots()DeleteActivePlots() # Delete the mesh plotDeleteAllPlots() # Delete the pseudocolor and contour plots.
69

CHAPTER 4. FUNCTIONS
DeleteAllPlots: deletes plots from the active window’s plot list.
Synopsis:DeleteActivePlots() -> integerDeleteAllPlots() -> integer
Returns:The Delete functions return an integer value of 1 for success and 0 for failure.
Description:The Delete functions delete plots from the active window’s plot list. The DeleteActivePlots functiondeletes all of the active plots from the plot list. There is no way to retrieve a plot once it has beendeleted from the plot list. The active plots are set using the SetActivePlots function. The DeleteAllPlotsfunction deletes all plots from the active window’s plot list regardless of whether or not they are active.
Example:% visit -cliOpenDatabase("/usr/gapps/visit/data/curv2d.silo")AddPlot("Pseudocolor", "d")AddPlot("Contour", "u")AddPlot("Mesh", "curvmesh2d")DrawPlots()DeleteActivePlots() # Delete the mesh plotDeleteAllPlots() # Delete the pseudocolor and contour plots.
70
CHAPTER 4. FUNCTIONS
DeleteDatabaseCorrelation: deletes a database correlation.
Synopsis:DeleteDatabaseCorrelation(name) -> integer
Arguments:name A string object containing the name of the database corre-
lation to delete.
Returns:The DeleteDatabaseCorrelation function returns 1 on success and 0 on failure.
Description:The DeleteDatabaseCorrelation function deletes a specific database correlation and its associated timeslider. If you delete a database correlation whose time slider is being used for the current time slider,the time slider will be reset to the time slider of the next best suited database correlation. You can usethe DeleteDatabaseCorrelation function to remove database correlations that you no longer need suchas when you choose to examine databases that have nothing to do with your current databases.
Example:% visit -clidbs = ("dbA00.pdb", "dbB00.pdb")OpenDatabase(dbs[0])AddPlot("FilledBoundary", "material(mesh)")OpenDatabase(dbs[1])AddPlot("FilledBoundary", "material(mesh)")DrawPlots()CreateDatabaseCorrelation("common", dbs, 1)SetTimeSliderState(10)DeleteAllPlots()DeleteDatabaseCorrelation("common")CloseDatabase(dbs[0])CloseDatabase(dbs[1])
71
CHAPTER 4. FUNCTIONS
DeleteExpression: deletes an expression variable from the expression list.
Synopsis:DeleteExpression(variableName) -> integer
Arguments:variableName The name of the expression variable to be deleted.
Returns:The DeleteExpression function returns 1 on success and 0 on failure.
Description:The DeleteExpression function deletes the definition of an expression. The variableName argument isa string containing the name of the variable expression to be deleted. Any plot that uses an expressionthat has been deleted will fail to regenerate if its attributes are changed.
Example:% visit -cliOpenDatabase("/usr/gapps/visit/data/globe.silo")DefineScalarExpression("myvar", "sin(u) + cos(w)")AddPlot("Pseudocolor", "myvar") # Plot the expression variable.DrawPlots()DeleteExpression("myvar") # Delete the expression variable myvar.
72

CHAPTER 4. FUNCTIONS
DeleteNamedSelection: deletes knowledge of a named selection.
Synopsis:DeleteNamedSelection(name) -> integer
Arguments:name The name of a named selection.
Returns:The DeleteNamedSelection function returns 1 for success and 0 for failure.
Description:Named Selections allow you to select a group of elements (or particles). One typically creates a namedselection from a group of elements and then later applies the named selection to another plot (thusreducing the set of elements displayed to the ones from when the named selection was created). Ifyou have created a named selection that you are no longer interested in, you can delete it with theDeleteNamedSelection function.
Example:% visit -clidb = "/usr/gapps/visit/data/wave*.silo database"OpenDatabase(db)AddPlot("Pseudocolor", "pressure")AddOperator("Clip")c = ClipAttributes()c.plane1Origin = (0,0.6,0)c.plane1Normal = (0,-1,0)SetOperatorOption(c)DrawPlots()CreateNamedSelection("els_above_y")SetTimeSliderState(40)DeleteNamedSelection("els_above_y")CreateNamedSelection("els_above_y")
73
CHAPTER 4. FUNCTIONS
DeletePlotDatabaseKeyframe: deletes a database keyframe for a plot.
Synopsis:DeletePlotDatabaseKeyframe(plotIndex, frame)
Arguments:plotIndex A zero−based integer value corresponding to a plot’s index
in the plot list.frame A zero−based integer value corresponding to a database
keyframe at a particular animation frame.
Returns:DeletePlotDatabaseKeyframe does not return a value.
Description:The DeletePlotDatabaseKeyframe function removes a database keyframe from a specific plot. A databasekeyframe represents the database time state that will be used at a given animation frame when VisIt’skeyframing mode is enabled. The plotIndex argument is a zero−based integer that is used to identify aplot in the plot list. The frame argument is a zero−based integer that is used to identify the frame atwhich a database keyframe is to be removed for the specified plot.
Example:% visit -cliOpenDatabase("/usr/gapps/visit/data/wave.visit")k = GetKeyframeAttributes()k.enabled,k.nFrames,k.nFramesWasUserSet = 1,20,1SetKeyframeAttributes(k)AddPlot("Pseudocolor", "pressure")SetPlotDatabaseState(0, 0, 60)# Repeat time state 60 for the first few animation frames by adding akeyframe at frame 3.SetPlotDatabaseState(0, 3, 60)SetPlotDatabaseState(0, 19, 0)DrawPlots()ListPlots()# Delete the database keyframe at frame 3.DeletePlotDatabaseKeyframe(0, 3)ListPlots()
74

CHAPTER 4. FUNCTIONS
DeletePlotKeyframe: deletes a plot keyframe at a specified frame.
Synopsis:DeletePlotKeyframe(plotIndex, frame)
Arguments:plotIndex A zero−based integer value corresponding to a plot’s index
in the plot list.frame A zero−based integer value corresponding to a plot
keyframe at a particular animation frame.
Returns:DeletePlotKeyframe does not return a value.
Description:The DeletePlotKeyframe function removes a plot keyframe from a specific plot. A plot keyframe is theset of plot attributes at a specified frame. Plot keyframes are used to determine what plot attributeswill be used at a given animation frame when VisIt’s keyframing mode is enabled. The plotIndex argu-ment is a zero−based integer that is used to identify a plot in the plot list. The frame argument is azero−based integer that is used to identify the frame at which a keyframe is to be removed.
Example:% visit -cliOpenDatabase("/usr/gapps/visit/data/wave.visit")k = GetKeyframeAttributes()k.enabled,k.nFrames,k.nFramesWasUserSet = 1,20,1SetKeyframeAttributes(k)AddPlot("Pseudocolor", "pressure")# Set up plot keyframes so the Pseudocolor plot’s min will change# over time.p0 = PseudocolorAttributes()p0.minFlag,p0.min = 1,0.0p1 = PseudocolorAttributes()p1.minFlag,p1.min = 1, 0.5SetPlotOptions(p0)SetTimeSliderState(19)SetPlotOptions(p1)SetTimeSliderState(0)DrawPlots()ListPlots()# Iterate over all animation frames and wrap around to the first one.for i in list(range(TimeSliderGetNStates())) + [0]:SetTimeSliderState(i)# Delete the plot keyframe at frame 19 so the min won’t# change anymore.DeletePlotKeyframe(19)ListPlots()SetTimeSliderState(10)
75
CHAPTER 4. FUNCTIONS
DeleteViewKeyframe: deletes a view keyframe at a specified frame.
Synopsis:DeleteViewKeyframe(frame)
Arguments:frame A zero−based integer value corresponding to a view
keyframe at a particular animation frame.
Returns:DeleteViewKeyframe returns 1 on success and 0 on failure.
Description:The DeleteViewKeyframe function removes a view keyframe at a specified frame. View keyframes areused to determine what view will be used at a given animation frame when VisIt’s keyframing modeis enabled. The frame argument is a zero−based integer that is used to identify the frame at which akeyframe is to be removed.
Example:% visit -cliOpenDatabase("/usr/gapps/visit/data/globe.silo")k = KeyframeAttributes()k.enabled, k.nFrames, k.nFramesWasUserSet = 1,10,1SetKeyframeAttributes(k)AddPlot("Pseudocolor", "u")DrawPlots()# Set some view keyframesSetViewKeyframe()v1 = GetView3D()v1.viewNormal = (-0.66609, 0.337227, 0.665283)v1.viewUp = (0.157431, 0.935425, -0.316537)SetView3D(v1)SetTimeSliderState(9)SetViewKeyframe()ToggleCameraViewMode()# Iterate over the animation frames to watch the view change.for i in list(range(10)) + [0]:SetTimeSliderState(i)# Delete the last view keyframe, which is on frame 9.DeleteViewKeyframe(9)# Iterate over the animation frames again. The view should stay# the same.for i in range(10):SetTimeSliderState(i)
76
CHAPTER 4. FUNCTIONS
DeleteWindow: deletes the active visualization window.
Synopsis:DeleteWindow() -> integer
Returns:The DeleteWindow function returns an integer value of 1 for success and 0 for failure.
Description:The DeleteWindow function deletes the active visualization window and makes the visualization windowwith the smallest window index the new active window. This function has no effect when there is onlyone remaining visualization window.
Example:% visit -cliDeleteWindow() # Does nothing since there is only one windowAddWindow()DeleteWindow() # Deletes the new window.
77

CHAPTER 4. FUNCTIONS
DemoteOperator: moves an operator closer to the database in the visualization pipeline.
Synopsis:DemoteOperator(opIndex) -> integerDemoteOperator(opIndex, applyToAllPlots) -> integer
Arguments:opIndex A zero−based integer corresponding to the operator that
should be demoted.applyAll An integer flag that causes all plots in the plot list to be
affected when it is non−zero.
Returns:DemoteOperator returns 1 on success and 0 on failure.
Description:The DemoteOperator function moves an operator closer to the database in the visualization pipeline.This allows you to change the order of operators that have been applied to a plot without having toremove them from the plot. For example, consider moving a Slice to before a Reflect operator when ithad been the other way around. Changing the order of operators can result in vastly different resultsfor a plot. The opposite function is PromoteOperator.
Example:% visit -cliOpenDatabase("/usr/gapps/visit/data/noise.silo")AddPlot("Pseudocolor", "hardyglobal")AddOperator("Slice")s = SliceAttributes()s.project2d = 0s.originPoint = (0,5,0)s.originType=s.Points.normal = (0,1,0)s.upAxis = (-1,0,0)SetOperatorOptions(s)AddOperator("Reflect")DrawPlots()# Now reflect before slicing. We’ll only get 1 slice plane# instead of 2.DemoteOperator(1)DrawPlots()
78
CHAPTER 4. FUNCTIONS
DisableRedraw: prevents the active visualization window from redrawing itself.
Synopsis:DisableRedraw()
Returns:The DisableRedraw function does not return a value.
Description:The DisableRedraw function prevents the active visualization window from ever redrawing itself. Thisis a useful function to call when performing many operations that would cause unnecessary redraws inthe visualization window. The effects of this function are undone by calling the RedrawWindow function.
Example:% visit -cliOpenDatabase("/usr/gapps/visit/data/globe.silo")AddPlot("Contour", "u")AddPlot("Pseudocolor", "w")DrawPlots()DisableRedraw()AddOperator("Slice")# Set the slice operator attributes# Redraw now that th operator attributes are set. This will# prevent 1 redraw.RedrawWindow()
79
CHAPTER 4. FUNCTIONS
DrawPlots: draws any new plots
Synopsis:DrawPlots() -> integer
Returns:The DrawPlots function returns an integer value of 1 for success and 0 for failure.
Description:The DrawPlots function forces all new plots in the plot list to be drawn. Plots are added and then theirattributes are modified. Finally, the DrawPlots function is called to make sure all of the new plots drawthemselves in the visualization window. This function has no effect if all of the plots in the plot list arealready drawn.
Example:% visit -cliOpenDatabase("/usr/gapps/visit/data/globe.silo")AddPlot("Pseudocolor", "u")DrawPlots() # Draw the new pseudocolor plot.
80
CHAPTER 4. FUNCTIONS
EnableTool: sets the enabled state of an interactive tool in the active visualization
Synopsis:EnabledTool(toolIndex, activeFlag)
Arguments:toolIndex This is an integer that corresponds to an interactive tool.
(Plane tool = 0, Line tool = 1, Plane tool = 2, Box tool =3, Sphere tool = 4, Axis Restriction tool = 5)
activeFlag A value of 1 enables the tool while a value of 0 disables thetool.
Returns:The EnableTool function returns 1 on success and 0 on failure.
Description:The EnableTool function is used to set the enabled state of an interactive tool in the active visualizationwindow. The toolIndex argument is an integer index that corresponds to a certain tool. The activeFlagargument is an integer value (0 or 1) that indicates whether to turn the tool on or off.
Example:% visit -cliOpenDatabase("/usr/gapps/visit/data/globe.silo")AddPlot("Pseudocolor", "u")DrawPlots()EnableTool(0, 1) # Turn on the line tool.EnableTool(1,1) # Turn on the plane tool.EnableTool(2,1) # Turn on the sphere tool.EnableTool(2,0) # Turn off the sphere tool.
81
CHAPTER 4. FUNCTIONS
ExecuteMacro: execute a macro that has been registered using RegisterMacro.
Synopsis:ExecuteMacro(name) -> value
Arguments:name The name of the macro to execute.
Returns:The ExecuteMacro function returns the value returned from the user’s macro function.
Description:The ExecuteMacro function lets you call a macro function that was previously registered using theRegisterMacro method. Once macros are registered with a name, this function can be called wheneverthe macro function associated with that name needs to be called. The VisIt gui uses this function totell the Python interface when macros need to be executed in response to user button clicks.
Example:def SetupMyPlots():
OpenDatabase(’noise.silo’)AddPlot(’Pseudocolor’, ’hardyglobal’)DrawPlots()
RegisterMacro(’Setup My Plots’, SetupMyPlots)ExecuteMacro(’Setup My Plots’)
82
CHAPTER 4. FUNCTIONS
ExportDatabase: export a database
Synopsis:ExportDatabase(e) -> integerExportDatabase(e, o) -> integer
Arguments:e An object of type ExportDBAttributes. This object speci-
fies the options for exporting the database.o (optional) A dictionary containing a key/value mapping to set options
needed by the database exporter. The default values canbe obtained in the appropriate format using GetExportOp-tions(’plugin’).
Returns:Returns 1 on success, 0 on failure.
Description:The ExportDatabase function exports the active plot for the current window to a file. The format ofthe file, name, and variables to be saved are specified using the ExportDBAttributes argument. Notethat this functionality is distinct from the geometric formats of SaveWindow, such as STL. SaveWindowcan only save surfaces (triangle meshes), while ExportDatabase can export an entire three dimensionaldata set.
Example:% visit -cliOpenDatabase("/usr/gapps/visit/data/curv3d.silo")AddPlot("Pseudocolor", "d")DrawPlots()# Set the export database attributes.e = ExportDBAttributes()e.db_type = "Silo"e.variables = ("u", "v")e.filename = "test_ex_db"ExportDatabase(e)
83
CHAPTER 4. FUNCTIONS
Expressions: returns a tuple of expression names and definitions.
Synopsis:Expressions() -> tuple of expression tuples
Returns:The Expressions function returns a tuple of tuples that contain two strings that give the expressionname and definition.
Description:The Expressions function returns a tuple of tuples that contain two strings that give the expressionname and definition. This function is useful for listing the available expressions or for iterating througha list of expressions in order to create plots.
Example:% visit -cliSetWindowLayout(4)DefineScalarExpression("sin_u", "sin(u)")DefineScalarExpression("cos_u", "cos(u)")DefineScalarExpression("neg_u", "-u")DefineScalarExpression("bob", "sin_u + cos_u")for i in range(1,5):SetActiveWindow(i)OpenDatabase("/usr/gapps/visit/data/globe.silo")exprName = Expressions()[i-1][0]AddPlot("Pseudocolor", exprName)DrawPlots()
84

CHAPTER 4. FUNCTIONS
GetActiveContinuousColorTable: returns the name of the active color table.
Synopsis:GetActiveContinuousColorTable() -> stringGetActiveDiscreteColorTable() -> string
Returns:Both functions return a string object containing the name of a color table.
Description:A color table is a set of color values that are used as the colors for plots. VisIt supports two flavors ofcolor table: continuous and discrete. A continuous color table is defined by a small set of color controlpoints and the colors specified by the color control points are interpolated smoothly to fill in any gaps.Continuous color tables are used for plots that need to be colored smoothly by a variable (e.g. Pseudo-color plot). A discrete color table is a set of color control points that are used to color distinct regionsof a plot (e.g. Subset plot). VisIt supports the notion of default continuous and default discrete colortables so plots can just use the ”default” color table. This lets you change the color table used by manyplots by just changing the ”default” color table. The GetActiveContinuousColorTable function returnsthe name of the default continuous color table. The GetActiveDiscreteColorTable function returns thename of the default discrete color table.
Example:% visit -cliprint "Default continuous color table: %s" % \GetActiveContinuousColorTable()print "Default discrete color table: %s" % \GetActiveDiscreteColorTable()
85
CHAPTER 4. FUNCTIONS
GetActiveDiscreteColorTable: returns the name of the active color table.
Synopsis:GetActiveContinuousColorTable() -> stringGetActiveDiscreteColorTable() -> string
Returns:Both functions return a string object containing the name of a color table.
Description:A color table is a set of color values that are used as the colors for plots. VisIt supports two flavors ofcolor table: continuous and discrete. A continuous color table is defined by a small set of color controlpoints and the colors specified by the color control points are interpolated smoothly to fill in any gaps.Continuous color tables are used for plots that need to be colored smoothly by a variable (e.g. Pseudo-color plot). A discrete color table is a set of color control points that are used to color distinct regionsof a plot (e.g. Subset plot). VisIt supports the notion of default continuous and default discrete colortables so plots can just use the ”default” color table. This lets you change the color table used by manyplots by just changing the ”default” color table. The GetActiveContinuousColorTable function returnsthe name of the default continuous color table. The GetActiveDiscreteColorTable function returns thename of the default discrete color table.
Example:% visit -cliprint "Default continuous color table: %s" % \GetActiveContinuousColorTable()print "Default discrete color table: %s" % \GetActiveDiscreteColorTable()
86
CHAPTER 4. FUNCTIONS
GetActiveTimeSlider: returns the name of the active time slider.
Synopsis:GetActiveTimeSlider() -> string
Returns:The GetActiveTimeSlider function returns a string containing the name of the active time slider.
Description:VisIt can support having multiple time sliders when you have opened more than one time−varyingdatabase. You can then use each time slider to independently change time states for each databaseor you can use a database correlation to change time states for all databases simultaneously. Everytime−varying database has a database correlation and every database correlation has its own timeslider. If you want to query to determine which time slider is currently the active time slider, you canuse the GetActiveTimeSlider function.
Example:% visit -cliOpenDatabase("dbA00.pdb")AddPlot("FilledBoundary", "material(mesh)")OpenDatabase("dbB00.pdb")AddPlot("FilledBoundary", "materials(mesh)")print "Active time slider: %s" % GetActiveTimeSlider()CreateDatabaseCorrelation("common", ("dbA00.pdb", "dbB00.pdb"), 2)print "Active time slider: %s" % GetActiveTimeSlider()
87

CHAPTER 4. FUNCTIONS
GetAnimationAttributes: return a copy of the current animation attributes.
Synopsis:GetAnimationAttributes() -> AnimationAttributes object
Arguments:none
Returns:The GetAnimationAttributes function returns an AnimationAttributes object.
Description:This function returns the current animation attributes, which contain the animation mode, increment,and playback speed.
Example:a = GetAnimationAttributes()print a
88
CHAPTER 4. FUNCTIONS
GetAnimationTimeout: returns the animation timeout in milliseconds.
Synopsis:GetAnimationTimeout() -> integer
Returns:The GetAnimationTimeout function returns an integer that contains the time interval, measured inmilliseconds, between the rendering of animation frames.
Description:The GetAnimationTimeout returns an integer that contains the time interval, measured in milliseconds,between the rendering of animation frames.
Example:% visit -cliprint "Animation timeout = %d" % GetAnimationTimeout()
89
CHAPTER 4. FUNCTIONS
GetAnnotationAttributes: returns an object containing the active visualization window’s annotation
Synopsis:GetAnnotationAttributes() -> AnnotationAttributes object
Returns:The GetAnnotationAttributes function returns an AnnotationAttributes object that contains the anno-tation settings for the active visualization window.
Description:The GetAnnotationAttributes function returns an AnnotationAttributes object that contains the anno-tation settings for the active visualization window. It is often useful to retrieve the annotation settingsand modify them to suit the visualization.
Example:% visit -cliOpenDatabase("/usr/gapps/visit/data/globe.silo")AddPlot("Pseudocolor", "u")DrawPlots()a = GetAnnotationAttributes()print aa.backgroundMode = a.BACKGROUNDMODE_GRADIENTa.gradientColor1 = (0, 0, 255)SetAnnotationAttributes(a)
90
CHAPTER 4. FUNCTIONS
GetAnnotationObject: returns a reference to the annotation object at the specified index in
Synopsis:GetAnnotationObject(string) -> Annotation object
Arguments:string The name of the annotation object as returned by GetAn-
notationObjectNames.
Returns:GetAnnotationObject returns a reference to an annotation object that was created using the CreateAn-notationObject function.
Description:GetAnnotationObject returns a reference to an annotation object that was created using the CreateAn-notationObject function. The string argument specifies the name of the desired annotation object. Itmust be one of the names returned by GetAnnotationObjectNames. This function is not currentlynecessary unless the annotation object that you used to create an annotation has gone out of scope andyou need to create another reference to the object to set its properties. Also note that although thisfunction will apparently also accept an integer index, that mode of access is not reliably and should beavoided.
Example:% visit -cliOpenDatabase("/usr/gapps/visit/data/wave.visit")AddPlot("Pseudocolor", "pressure")DrawPlots()a = CreateAnnotationObject("TimeSlider")GetAnnotationObjectNames()["plot0000", "TimeSlider1"]ref = GetAnnotationObject("TimeSlider1")print ref
91
CHAPTER 4. FUNCTIONS
GetAnnotationObjectNames: returns a tuple of names of all currently defined annotation objects
Synopsis:GetAnnotationObjectNames() -> tuple of strings
Returns:GetAnnotationObjectNames returns a tuple of strings of the names of all annotation objects defined forthe currently active window.
Example:names = GetAnnotationObjectNames()names["plot0000", "Line2D1", "TimeSlider1"]
92
CHAPTER 4. FUNCTIONS
GetCallbackArgumentCount: ¡description¿
Synopsis:GetCallbackArgumentCount(callbackName) -> integer
Arguments:callbackName The name of a callback function. This name is a member
of the tuple returned by GetCallbackNames().
Returns:The GetCallbackArgumentCount function returns the number of arguments associated with a particularcallback function.
Description:None
Example:cbName = ’OpenDatabaseRPC’count = GetCallbackArgumentCount(cbName)print ’The number of arguments for %s is: %d’ % (cbName, count)
93
CHAPTER 4. FUNCTIONS
GetCallbackNames: returns a list of allowable callback names for use with RegisterCallback().
Synopsis:GetCallbackNames() -> tuple of string objects
Returns:GetCallbackNames returns a tuple containing the names of valid callback function identifiers for use inRegisterCallback().
Description:The GetCallbackNames function returns a tuple containing the names of valid callback function identi-fiers for use in RegisterCallback().
Example:import visitprint visit.GetCallbackNames()
94
CHAPTER 4. FUNCTIONS
GetDatabaseNStates: returns the number of time states in the active database.
Synopsis:GetDatabaseNStates() -> integer
Returns:Returns the number of time states in the active database or 0 if there is no active database.
Description:GetDatabaseNStates returns the number of time states in the active database, which is not the same asthe number of states in the active time slider. Time sliders can have different lengths due to databasecorrelations and keyframing. Use this function when you need the actual number of time states in theactive database.
Example:% visit -cliOpenDatabase("/usr/gapps/visit/data/wave*.silo database")print "Number of time states: %d" % GetDatabaseNStates()
95
CHAPTER 4. FUNCTIONS
GetDebugLevel: set or Get the VisIt module’s debug level.
Synopsis:GetDebugLevel() -> integerSetDebugLevel(level)
Arguments:level A string ’1’, ’2’, ’3’, ’4’, ’5’ with an optional ’b’ suffix to
indicate whether the output should be buffered. A value of’1’ is a low debug level , which should be used to producelittle output while a value of 5 should produce a lot of debugoutput.
Returns:The GetDebugLevel function returns the debug level of the VisIt module.
Description:The GetDebugLevel and SetDebugLevel functions are used when debugging VisIt Python scripts. TheSetDebugLevel function sets the debug level for VisIt’s viewer thus it must be called before a Launchmethod. The debug level determines how much detail is written to VisIt’s execution logs when it exe-cutes. The GetDebugLevel function can be used in Python scripts to alter the behavior of the script.For instance, the debug level can be used to selectively print values to the console.
Example:% visit -cli -debug 2print "VisIt’s debug level is: %d" % GetDebugLevel()
96
CHAPTER 4. FUNCTIONS
GetDefaultFileOpenOptions: returns the current default options used when opening files for a
Synopsis:GetDefaultFileOpenOptions(pluginName) -> Dictionary
Arguments:pluginName The name of a plugin.
Returns:Returns a dictionary containing the options.
Description:GetDefaultFileOpenOptions returns the current options used to open new files when a specific plugin istriggered.
Example:% visit -cliOpenMDServer()opts = GetDefaultFileOpenOptions("VASP")opts["Allow multiple timesteps"] = 1SetDefaultFileOpenOptions("VASP", opts)OpenDatabase("CHGCAR")
97
CHAPTER 4. FUNCTIONS
GetDomains: returns a tuple containing the names of all of the domain subsets for the
Synopsis:GetDomains() -> tuple of strings
Returns:GetDomains returns a tuple of strings.
Description:GetDomains returns a tuple containing the names of all of the domain subsets for a plot that was createdusing a database with multiple domains. This function can be used in specialized logic that iteratesover domains to turn them on or off in some programmed way.
Example:% visit -cliOpenDatabase("/usr/gapps/visit/data/multi_ucd3d.silo")AddPlot("Pseudocolor", "u")DrawPlots()doms = GetDomains()print doms# Turn off all but the last domain, one after the other.for d in doms[:-1]:TurnDomainsOff(d)
98
CHAPTER 4. FUNCTIONS
GetEngineList: returns a tuple containing the names of the compute engines.
Synopsis:GetEngineList() -> tuple of stringsGetEngineList(flag) -> tuple of tuples of strings
Arguments:flag (optional) If flag is a non−zero integer then the function returns a
tuple of tuples with information about simulations.
Returns:GetEngineList returns a tuple of strings that contain the names of the computers on which computeengines are running. If flag is a non−zero integer argument then the function returns a tuple of tupleswhere each tuple is of length 2. Element 0 contains the names of the computers where the engines arerunning. Element 1 contains the names of the simulations being run.
Description:The GetEngineList function returns a tuple of strings containing the names of the computers on whichcompute engines are running. This function can be useful if engines are going to be closed and openedexplicitly in the Python script. The contents of the tuple can be used to help determine which computeengines should be closed or they can be used to determine if a compute engine was successfully launched.
Example:% visit -cliOpenDatabase("/usr/gapps/visit/data/globe.silo")AddPlot("Pseudocolor", "u")OpenDatabase("mcr:/usr/gapps/visit/data/globe.silo")AddPlot("Mesh", "mesh1")DrawPlots()for name in GetEngineList():print "VisIt has a compute engine running on %s" % nameCloseComputeEngine(GetEngineList()[1])
99
CHAPTER 4. FUNCTIONS
GetEngineProperties: returns an engine properties object.
Synopsis:GetEngineProperties() -> EnginePropertiesGetEngineProperties(engine) -> EnginePropertiesGetEngineProperties(engine, sim) -> EngineProperties
Arguments:engine (optional) When engine is passed and it matches one of the com-
puter names returned from GetEngineList() then the En-gineProperties object for that engine is returned.
sim (optional) When both engine and sim arguments are passed, then theEngineProperties object for the simulation is returned.
Returns:The EngineProperties object for the specified compute engine/sim.
Description:GetEngineProperties returns an EngineProperties object containing the properties for the specified com-pute engine/sim. The EngineProperties let you discover information such as number of processors, etcfor a compute engine/sim.
Example:% visit -clidb = "/usr/gapps/visit/data/globe.silo"OpenDatabase(db)props = GetEngineProperties(GetEngineList()[0])
100

CHAPTER 4. FUNCTIONS
GetGlobalAttributes: returns a GlobalAttributes object.
Synopsis:GetGlobalAttributes() -> GlobalAttributes object
Returns:Returns a GlobalAttributes object that has been initialized.
Description:The GetGlobalAttributes function returns a GlobalAttributes object that has been initialized withthe current state of the viewer proxy’s GlobalAttributes object. The GlobalAttributes object containsread−only information about the list of sources, the list of windows, and various flags that can be queried.
Example:% visit -cliOpenDatabase("/usr/gapps/visit/data/globe.silo")AddPlot("Pseudocolor", "u")DrawPlots()g = GetGlobalAttributes()print g
101
CHAPTER 4. FUNCTIONS
GetGlobalLineoutAttributes: returns a GlobalLineoutAttributes object.
Synopsis:GetGlobalLineoutAttributes() -> GlobalLineoutAttributes object
Returns:Returns an initialized GlobalLineoutAttributes object.
Description:The GetGlobalLineoutAttributes function returns an initialized GlobalLineoutAttributes object. TheGlobalLineoutAttributes, as suggested by its name, contains global properties that apply to all lineouts.You can use the GlobalLineoutAttributes object to turn on lineout sampling, specify the destinationwindow, etc. for curve plots created as a result of performing lineouts. Once you make changes tothe object by setting its properties, use the SetGlobalLineoutAttributes function to make VisIt use themodified global lineout attributes.
Example:% visit -cliSetWindowLayout(4)OpenDatabase("/usr/gapps/visit/data/curv2d.silo")AddPlot("Pseudocolor", "d")DrawPlots()g = GetGlobalLineoutAttributes()print gg.samplingOn = 1g.windowId = 4g.createWindow = 0g.numSamples = 100SetGlobalLineoutAttributes(g)Lineout((-3,2),(3,3),("default"))
102
CHAPTER 4. FUNCTIONS
GetInteractorAttributes: returns an InteractorAttributes object.
Synopsis:GetInteractorAttributes() -> InteractorAttributes object
Returns:Returns an initialized InteractorAttributes object.
Description:The GetInteractorAttributes function returns an initialized InteractorAttributes object. The Interac-torAttributes object can be used to set certain interactor properties. Interactors, can be thought of ashow mouse clicks and movements are translated into actions in the vis window. To set the interactorattributes, first get the interactor attributes using the GetInteractorAttributes function. Once you’veset the object’s properties, call the SetInteractorAttributes function to make VisIt use the new interactorattributes.
Example:% visit -cliia = GetInteractorAttributes()print iaia.showGuidelines = 0SetInteractorAttributes(ia)
103
CHAPTER 4. FUNCTIONS
GetKeyframeAttributes: returns an initialized KeyframeAttributes object.
Synopsis:GetKeyframeAttributes() -> KeyframeAttributes object
Returns:GetKeyframeAttributes returns an initialized KeyframeAttributes object.
Description:Use the GetKeyframeAttributes function when you want to examine a KeyframeAttributes object soyou can determine VisIt’s state when it is in keyframing mode. The KeyframeAttributes object allowsyou to see whether VisIt is in keyframing mode and, if so, how many animation frames are in the currentkeyframe animation.
Example:% visit -clik = GetKeyframeAttributes()print kk.enabled,k.nFrames,k.nFramesWasUserSet = 1, 100, 1SetKeyframeAttributes(k)
104
CHAPTER 4. FUNCTIONS
GetLastError: returns a string containing the last error message that VisIt issued.
Synopsis:GetLastError() -> string
Returns:GetLastError returns a string containing the last error message that VisIt issued.
Description:The GetLastError function returns a string containing the last error message that VisIt issued.
Example:% visit -cliOpenDatabase("/this/database/does/not/exist")print "VisIt Error: %s" % GetLastError()
105
CHAPTER 4. FUNCTIONS
GetLight: returns a light object containing the attributes for a specified light.
Synopsis:GetLight(index) -> LightAttributes object
Arguments:index A zero−based integer index into the light list. Index can
be in the range [0,7].
Returns:GetLight returns a LightAttributes object.
Description:The GetLight function returns a LightAttributes object containing the attributes for a specific light.You can use the LightAttributes object that GetLight returns to set light properties and then you canpass the object to SetLight to make VisIt use the light properties that you’ve set.
Example:% visit -cliOpenDatabase("/usr/gapps/visit/data/globe.silo")AddPlot("Pseudocolor", "w")p = PseudocolorAttributes()p.colorTableName = "xray"SetPlotOptions(p)DrawPlots()InvertBackgroundColor()light = GetLight(0)print lightlight.enabledFlag = 1light.direction = (0,-1,0)light.color = (255,0,0,255)SetLight(0, light)light.color,light.direction = (0,255,0,255), (-1,0,0)SetLight(1, light)
106
CHAPTER 4. FUNCTIONS
GetLocalHostName: gets the local user or host name.
Synopsis:GetLocalHostName() -> stringGetLocalUserName() -> string
Returns:Both functions return a string.
Description:These functions are useful for determining the name of the local computer or the account name of theuser running VisIt. The GetLocalHostName function returns a string that contains the name of the localcomputer. The GetLocalUserName function returns a string containing the name of the user runningVisIt.
Example:% visit -cliprint "Local machine name is: %s" % GetLocalHostName()print "My username: %s" % GetLocalUserName()
107
CHAPTER 4. FUNCTIONS
GetLocalUserName: gets the local user or host name.
Synopsis:GetLocalHostName() -> stringGetLocalUserName() -> string
Returns:Both functions return a string.
Description:These functions are useful for determining the name of the local computer or the account name of theuser running VisIt. The GetLocalHostName function returns a string that contains the name of the localcomputer. The GetLocalUserName function returns a string containing the name of the user runningVisIt.
Example:% visit -cliprint "Local machine name is: %s" % GetLocalHostName()print "My username: %s" % GetLocalUserName()
108
CHAPTER 4. FUNCTIONS
GetMachineProfile: ¡description¿
Synopsis:GetMachineProfile(hostname) -> MachineProfile
Arguments:hostname
Returns:MachineProfile for hostname
Description:Gets the MachineProfile for a given hostname
109
CHAPTER 4. FUNCTIONS
GetMachineProfileNames: ¡description¿
Synopsis:GetMachineProfileNames() -> [hostname1, hostname2, ...]
Returns:List of MachineProfile hostnames
Description:Returns a list of hostnames that can be used to get a specific MachineProfile
110
CHAPTER 4. FUNCTIONS
GetMaterialAttributes: returns a MaterialAttributes object containing VisIt’s current material
Synopsis:GetMaterialAttributes() -> MaterialAttributes object
Returns:Returns a MaterialAttributes object.
Description:The GetMaterialAttributes function returns a MaterialAttributes object that contains VisIt’s currentmaterial interface reconstruction settings. You can set properties on the MaterialAttributes object andthen pass it to SetMaterialAttributes to make VisIt use the new material attributes that you’ve specified:
Example:% visit -cliOpenDatabase("/usr/gapps/visit/data/allinone00.pdb")AddPlot("Pseudocolor", "mesh/mixvar")p = PseudocolorAttributes()p.min,p.minFlag = 4.0, 1p.max,p.maxFlag = 13.0, 1SetPlotOptions(p)DrawPlots()# Tell VisIt to always do material interface reconstruction.m = GetMaterialAttributes()m.forceMIR = 1SetMaterialAttributes(m)ClearWindow()# Redraw the plot forcing VisIt to use the mixed variable information.DrawPlots()
111
CHAPTER 4. FUNCTIONS
GetMaterials: returns a string tuple of material names for the current plot’s database.
Synopsis:GetMaterials() -> tuple of strings
Returns:The GetMaterials function returns a tuple of strings.
Description:The GetMaterials function returns a tuple of strings containing the names of the available materials forthe current plot’s database. Note that the active plot’s database must have materials for this function toreturn a tuple that has any string objects in it. Also, you must have at least one plot. You can use thematerials returned by the GetMaterials function for a variety of purposes including turning materialson or off.
Example:% visit -cliOpenDatabase("/usr/gapps/visit/data/allinone00.pdb")AddPlot("Pseudocolor", "mesh/mixvar")DrawPlots()mats = GetMaterials()for m in mats[:-1]:TurnMaterialOff(m)
112
CHAPTER 4. FUNCTIONS
GetMeshManagementAttributes: returns a MeshManagementAttributes object containing VisIt’scurrent mesh
Synopsis:GetMeshmanagementAttributes() -> MeshmanagementAttributes object
Returns:Returns a MeshmanagementAttributes object.
Description:The GetMeshmanagementAttributes function returns a MeshmanagementAttributes object that con-tains VisIt’s current mesh discretization settings. You can set properties on the MeshManagementAt-tributes object and then pass it to SetMeshManagementAttributes to make VisIt use the new materialattributes that you’ve specified:
Example:% visit -cliOpenDatabase("/usr/gapps/visit/data/csg.silo")AddPlot("Mesh", "csgmesh")DrawPlots()# Tell VisIt to always do material interface reconstruction.mma = GetMeshManagementAttributes()mma.discretizationTolernace = (0.01, 0.025)SetMeshManagementAttributes(mma)ClearWindow()# Redraw the plot forcing VisIt to use the mixed variable information.DrawPlots()
113
CHAPTER 4. FUNCTIONS
GetMetaData: return a metadata object for the specified database without making it be the activedatabase.
Synopsis:GetMetaData(db) -> avtDatabaseMetaData objectGetMetaData(db, ts) -> avtDatabaseMetaData object
Arguments:db The name of the database for which to return metadata.ts An optional integer indicating the time state at which to
open the database.
Returns:The GetMetaData function returns an avtDatabaseMetaData object.
Description:VisIt relies on metadata to populate its variable menus and make important decisions. Metadata canbe used to create complex scripts whose behavior adapts based on the contents of the database.
Example:md = GetMetaData(’noise.silo’)for i in xrange(md.GetNumScalars()):
AddPlot(’Pseudocolor’, md.GetScalars(i).name)DrawPlots()
114

CHAPTER 4. FUNCTIONS
GetNumPlots: returns the number of plots in the active window.
Synopsis:GetNumPlots() -> integer
Returns:Returns the number of plots in the active window.
Description:The GetNumPlots function returns the number of plots in the active window.
Example:% visit -cliprint "Number of plots", GetNumPlots()OpenDatabase("/usr/gapps/visit/data/curv2d.silo")AddPlot("Pseudocolor", "d")print "Number of plots", GetNumPlots()AddPlot("Mesh", "curvmesh2d")DrawPlots()print "Number of plots", GetNumPlots()
115
CHAPTER 4. FUNCTIONS
GetOperatorOptions: return a copy of the operator attributes for the i’th operator in the first
Synopsis:GetOperatorOptions(index) -> operator attributes object
Arguments:index The index of the operator within the plot’s list of operators.
Returns:The GetOperatorOptions function returns an operator attributes object.
Description:This function is provided to make it easy to probe the current attributes for a specific operator on theactive plot.
Example:AddPlot(’Pseudocolor’, ’temperature’)AddOperator(’Transform’)AddOperator(’Transform’)t = GetOperatorOptions(1)print ’Attributes for the 2nd Transform operator:’, t
116
CHAPTER 4. FUNCTIONS
GetPickAttributes: returns the current pick attributes.
Synopsis:GetPickAttributes() -> PickAttributes object
Returns:GetPickAttributes returns a PickAttributes object.
Description:The GetPickAttributes object returns the pick settings that VisIt is currently using when it performspicks. These settings mainly determine which pick information is displayed when pick results are printedout but they can also be used to select auxiliary variables and generate time curves. You can examingthe settings and you can set properties on the returned object. Once you’ve changed pick settings bysetting properties on the object, you can pass the altered object to the SetPickAttributes function toforce VisIt to use the new pick settings.
Example:% visit -cliOpenDatabase("/usr/gapps/visit/data/allinone00.pdb")AddPlot("Pseudocolor", "mesh/ireg")DrawPlots()p = GetPickAttributes()print pp.variables = ("default", "mesh/a", "mesh/mixvar")SetPickAttributes(p)# Now do some interactive picks and you’ll see pick information# for more than 1 variable.p.doTimeCurve = 1SetPickAttributes(p)# Now do some interactive picks and you’ll get time-curves in# a new window.
117
CHAPTER 4. FUNCTIONS
GetPickOutput: returns a string containing the output from the last pick.
Synopsis:GetPickOutput() -> stringGetPickOutputObject() -> dictonary
Returns:GetPickOutput returns a string containing the output from the last pick. GetPickOutputObject returnsa dictionary produced by the last pick.
Description:The GetPickOutput returns a string object that contains the output from the last pick. GetPickOut-putObject returns a dictionary object containing output from the last pick
Example:% visit -cliOpenDatabase("/usr/gapps/visit/data/rect2d.silo")AddPlot("Pseudocolor", "d")DrawPlots()ZonePick(coord=(0.4, 0.6, 0), vars=("default", "u", "v"))s = GetPickOutput()print so = GetPickOutputObject()print o
118
CHAPTER 4. FUNCTIONS
GetPickOutputObject: returns a string containing the output from the last pick.
Synopsis:GetPickOutput() -> stringGetPickOutputObject() -> dictonary
Returns:GetPickOutput returns a string containing the output from the last pick. GetPickOutputObject returnsa dictionary produced by the last pick.
Description:The GetPickOutput returns a string object that contains the output from the last pick. GetPickOut-putObject returns a dictionary object containing output from the last pick
Example:% visit -cliOpenDatabase("/usr/gapps/visit/data/rect2d.silo")AddPlot("Pseudocolor", "d")DrawPlots()ZonePick(coord=(0.4, 0.6, 0), vars=("default", "u", "v"))s = GetPickOutput()print so = GetPickOutputObject()print o
119
CHAPTER 4. FUNCTIONS
GetPipelineCachingMode: returns if pipelines are cached in the viewer.
Synopsis:GetPipelineCachingMode() -> integer
Returns:The GetPipelineCachingMode function returns 1 if pipelines are being cached and 0 otherwise.
Description:The GetPipelineCachingMode function returns whether or not pipelines are being cached in the viewer.For animations of long time sequences, it is often useful to turn off pipeline caching so the viewer doesnot run out of memory.
Example:%visit -clioffon = ("off", "on")print "Pipeline caching is %s" % offon[GetPipelineCachingMode()]
120
CHAPTER 4. FUNCTIONS
GetPlotInformation: returns a dictionary of plot information for the active plot.
Synopsis:GetPlotInformation() -> dictionary
Returns:GetPlotInformation returns a dictionary.
Description:The GetPlotInformation function returns information about the active plot. For example, a Curve plotwill return the xy pairs that comprise the curve. The tuple is arranged <x1, y1, x2, y2, ..., xn, yn>.
Example:% visit -cliOpenDatabase("/usr/gapps/visit/data/rect2d.silo")AddPlot("Pseudocolor", "d")DrawPlots()Lineout((0, 0), (1, 1))SetActiveWindow(2)info = GetPlotInformation()lineout = info["Curve"]print "The first lineout point is: [%g, %g] " % lineout[0], lineout[1]
121
CHAPTER 4. FUNCTIONS
GetPlotList: return a copy of the plot list object.
Synopsis:GetPlotList() -> PlotList object
Arguments:none
Returns:The GetPlotList function returns a PlotList object.
Description:The GetPlotList function returns a copy of the plot list that gets exchanged between VisIt’s viewer andits clients. The plot list object contains the list of plots, along with the databases, and any operatorsthat are applied to each plot. Changing this object has NO EFFECT but it can be useful when writingcomplex functions that need to know about the plots and operators that exist within a visualizationwindow
Example:# Copy plots (without operators to window 2)pL = GetPlotList()AddWindow()for i in xrange(pL.GetNumPlots()):
AddPlot(PlotPlugins()[pL.GetPlots(i).plotType], pL.GetPlots(i).plotVar)DrawPlots()
122
CHAPTER 4. FUNCTIONS
GetPlotOptions: return a copy of the plot options for the first active plot of the first plot
Synopsis:GetPlotOptions() -> plot attributes object
Arguments:none
Returns:The GetPlotOptions function returns a plot attributes object whose type varies depending the selectedplots.
Description:This function is provided to make it easy to probe the current attributes for the selected plot.
Example:pc = GetPlotOptions()pc.legend = 0SetPlotOptions(pc)
123
CHAPTER 4. FUNCTIONS
GetPreferredFileFormats: gets the list of preferred file format IDs.
Synopsis:GetPreferredFileFormats() -> tuple of stringsArguments: none
Returns:The GetPreferredFileFormats returns the current list of preferred plugins.
Description:The GetPreferredFileFormats method is a way to get the list of file format reader plugins which aretried before any others. These IDs are full IDs, not just names, and are tried in order.
Example:GetPreferredFileFormats()# returns (’Silo_1.0’,)
124

CHAPTER 4. FUNCTIONS
GetQueryOutputObject: returns information about the last query.
Synopsis:GetQueryOutputString() -> stringGetQueryOutputValue() -> double, tuple of doublesGetQueryOutputXML() -> stringGetQueryOutputObject() -> dictonary or value
Returns:GetQueryOutputString returns a string. GetQueryOutputValue returns a single double precision num-ber or a tuple of double precision numbers. GetQueryOutputXML returns an xml string produced bythe last query. GetQueryOutputObject returns an xml string produced by the last query.
Description:Both the GetQueryOutputString and GetQueryOutputValue functions return information about thelast query to be executed but the type of information returns differs. GetQueryOutputString returnsa string containing the output of the last query. GetQueryOutputValue returns a single number ortuple of numbers, depending on the nature of the last query to be executed. GetQueryOutputXML andGetQueryOutputObject expose more complex query output.
Example:% visit -cliOpenDatabase("/usr/gapps/visit/data/rect2d.silo")AddPlot("Pseudocolor", "d")DrawPlots()Query("MinMax")print GetQueryOutputString()print "The min is: %g and the max is: %g" % GetQueryOutputValue()
125
CHAPTER 4. FUNCTIONS
GetQueryOutputString: returns information about the last query.
Synopsis:GetQueryOutputString() -> stringGetQueryOutputValue() -> double, tuple of doublesGetQueryOutputXML() -> stringGetQueryOutputObject() -> dictonary or value
Returns:GetQueryOutputString returns a string. GetQueryOutputValue returns a single double precision num-ber or a tuple of double precision numbers. GetQueryOutputXML returns an xml string produced bythe last query. GetQueryOutputObject returns an xml string produced by the last query.
Description:Both the GetQueryOutputString and GetQueryOutputValue functions return information about thelast query to be executed but the type of information returns differs. GetQueryOutputString returnsa string containing the output of the last query. GetQueryOutputValue returns a single number ortuple of numbers, depending on the nature of the last query to be executed. GetQueryOutputXML andGetQueryOutputObject expose more complex query output.
Example:% visit -cliOpenDatabase("/usr/gapps/visit/data/rect2d.silo")AddPlot("Pseudocolor", "d")DrawPlots()Query("MinMax")print GetQueryOutputString()print "The min is: %g and the max is: %g" % GetQueryOutputValue()
126

CHAPTER 4. FUNCTIONS
GetQueryOutputValue: returns information about the last query.
Synopsis:GetQueryOutputString() -> stringGetQueryOutputValue() -> double, tuple of doublesGetQueryOutputXML() -> stringGetQueryOutputObject() -> dictonary or value
Returns:GetQueryOutputString returns a string. GetQueryOutputValue returns a single double precision num-ber or a tuple of double precision numbers. GetQueryOutputXML returns an xml string produced bythe last query. GetQueryOutputObject returns an xml string produced by the last query.
Description:Both the GetQueryOutputString and GetQueryOutputValue functions return information about thelast query to be executed but the type of information returns differs. GetQueryOutputString returnsa string containing the output of the last query. GetQueryOutputValue returns a single number ortuple of numbers, depending on the nature of the last query to be executed. GetQueryOutputXML andGetQueryOutputObject expose more complex query output.
Example:% visit -cliOpenDatabase("/usr/gapps/visit/data/rect2d.silo")AddPlot("Pseudocolor", "d")DrawPlots()Query("MinMax")print GetQueryOutputString()print "The min is: %g and the max is: %g" % GetQueryOutputValue()
127
CHAPTER 4. FUNCTIONS
GetQueryOutputXML: returns information about the last query.
Synopsis:GetQueryOutputString() -> stringGetQueryOutputValue() -> double, tuple of doublesGetQueryOutputXML() -> stringGetQueryOutputObject() -> dictonary or value
Returns:GetQueryOutputString returns a string. GetQueryOutputValue returns a single double precision num-ber or a tuple of double precision numbers. GetQueryOutputXML returns an xml string produced bythe last query. GetQueryOutputObject returns an xml string produced by the last query.
Description:Both the GetQueryOutputString and GetQueryOutputValue functions return information about thelast query to be executed but the type of information returns differs. GetQueryOutputString returnsa string containing the output of the last query. GetQueryOutputValue returns a single number ortuple of numbers, depending on the nature of the last query to be executed. GetQueryOutputXML andGetQueryOutputObject expose more complex query output.
Example:% visit -cliOpenDatabase("/usr/gapps/visit/data/rect2d.silo")AddPlot("Pseudocolor", "d")DrawPlots()Query("MinMax")print GetQueryOutputString()print "The min is: %g and the max is: %g" % GetQueryOutputValue()
128
CHAPTER 4. FUNCTIONS
GetQueryOverTimeAttributes: returns a QueryOverTimeAttributes object containing the settingsthat
Synopsis:GetQueryOverTimeAttributes() -> QueryOverTimeAttributes object
Returns:GetQueryOverTimeAttributes returns a QueryOverTimeAttributes object.
Description:The GetQueryOverTimeAttributes function returns a QueryOverTimeAttributes object containing thesettings that VisIt currently uses for query over time. You can use the returned object to change thosesettings by first setting object properties and then by passing the modified object to the SetQueryOver-TimeAttributes function.
Example:% visit -cliSetWindowLayout(4)OpenDatabase("/usr/gapps/visit/data/allinone00.pdb")AddPlot("Pseudocolor", "mesh/mixvar")DrawPlots()qot = GetQueryOverTimeAttributes()print qot# Make queries over time go to window 4.qot.createWindow,q.windowId = 0, 4SetQueryOverTimeAttributes(qot)QueryOverTime("Min")# Make queries over time only use half of the number of time states.endTime = GetDatabaseNStates() / 2QueryOverTime("Min", end_time=endTime)ResetView()
129
CHAPTER 4. FUNCTIONS
GetQueryParameters: returns information about the default parameters used by the named query.
Synopsis:GetQueryParameters(name) -> python dictonary
Returns:A python dictionary.
Description:The GetQueryParameters function returns a Python dictionary containing the default parameters forthe named query, or None if the query does not accept additional parameters. The returned dictionary(if any) can then be modified if necessary and passed back as an argument to the Query function.
Example:% visit -climinMaxInput = GetQueryParameters("MinMax")minMaxInput["use_actual_data"] = 1Query("MinMax", minMaxInput)xrayInput = GetQueryParameters("XRay Image")xrayInput["origin"]=(0.5, 2.5, 0.)xrayInput["image_size"]=(300,300)xrayInput["vars"]=("p", "d")Query("XRay Image", xrayInput)
130
CHAPTER 4. FUNCTIONS
GetRenderingAttributes: returns a RenderingAttributes object containing VisIt’s current rendering
Synopsis:GetRenderingAttributes() -> RenderingAttributes object
Returns:Returns a RenderingAttributes object.
Description:The GetRenderingAttributes function returns a RenderingAttributes object that contains the render-ing settings that VisIt currently uses. The RenderingAttributes object contains information related torendering such as whether or not specular highlights or shadows are enabled. The RenderingAttributesobject also contains information scalable rendering such as whether or not it is currently in use and thescalable rendering threshold.
Example:% visit -cliOpenDatabase("/usr/gapps/visit/data/noise.silo")AddPlot("Surface", "hgslice")DrawPlots()v = GetView3D()v.viewNormal = (-0.215934, -0.454611, 0.864119)v.viewUp = (0.973938, -0.163188, 0.157523)v.imageZoom = 1.64765SetView3D(v)light = GetLight(0)light.direction = (0,1,-1)SetLight(0, light)r = GetRenderingAttributes()r.scalableActivationMode = r.Alwaysr.doShadowing = 1SetRenderingAttributes(r)
131
CHAPTER 4. FUNCTIONS
GetSaveWindowAttributes: returns an object that contains the attributes used to save windows.
Synopsis:GetSaveWindowAttributes() -> SaveWindowAttributes object
Returns:This function returns a VisIt SaveWindowAttributes object that contains the attributes used in savingwindows.
Description:The GetSaveWindowAttributes function returns a SaveWindowAttributes object that is a structurecontaining several fields which determine how windows are saved to files. The object that us returnedcan be modified and used to set the save window attributes.
Example:% visit -clis = GetSaveWindowAttributes()print ss.width = 600s.height = 600s.format = s.RGBprint s
132
CHAPTER 4. FUNCTIONS
GetSelection: return the selection properties for the specified selection name.
Synopsis:GetSelection(name) -> SelectionProperties object
Arguments:name The name of the selection whose properties we want to
retrieve.
Returns:The GetSelection function returns a SelectionProperties object.
Description:Named selections have properties that describe how the selection is defined. This function lets you querythose selection properties.
Example:CreateNamedSelection(’selection1’)s = GetSelection(’selection1’)s.selectionType = s.CumulativeQuerySelections.histogramType = s.HistogramMatchess.combineRule = s.CombineOrs.variables = (’temperature’,)s.variableMins = (2.9,)s.variableMaxs = (3.1,)UpdateNamedSelection(’selection1’, s)
133
CHAPTER 4. FUNCTIONS
GetSelectionList: return a copy of the selection list.
Synopsis:GetSelectionList() -> SelectionList object
Arguments:none
Returns:The GetSelectionList function returns a SelectionList object.
Description:VisIt maintains a list of named selections, which are sets of cells that are used to restrict the cellsprocessed by other plots. This function returns a list of the selections that VisIt knows about, includingtheir properties.
Example:s = GetSelectionList()
134
CHAPTER 4. FUNCTIONS
GetSelectionSummary: return the selection summary for the specified selection name.
Synopsis:GetSelectionSummary(name) -> SelectionSummary object
Arguments:name The name of the selection whose summary we want to re-
trieve.
Returns:The GetSelectionSummary function returns a SelectionSummary object.
Description:Named selections have both properties, which describe how the selection is defined, and a summarythat desribes the data that was processed while creating the selection. The selection summary objectcontains some statistics about the selection such as how many cells it contains and histograms of thevarious variables that were used in creating the selection.
Example:print GetSelectionSummary(’selection1’)
135
CHAPTER 4. FUNCTIONS
GetTimeSliders: returns a tuple containing the names of all of the available time sliders.
Synopsis:GetTimeSliders() -> tuple of strings
Returns:GetTimeSliders returns a tuple of strings.
Description:The GetTimeSliders function returns a tuple of strings containing the names of each of the availabletime sliders. The list of time sliders contains the names of any open time−varying database, all databasecorrelations, and the keyframing time slider if VisIt is in keyframing mode.
Example:% visit -clipath = "/usr/gapps/visit/data/"dbs = (path + "/dbA00.pdb", path + "dbB00.pdb", path + "dbC00.pdb")for db in dbs:OpenDatabase(db)AddPlot("FilledBoundary", "material(mesh)")DrawPlots()CreateDatabaseCorrelation("common", dbs, 1)print "The list of time sliders is: ", GetTimeSliders()
136
CHAPTER 4. FUNCTIONS
GetUltraScript: return the file to be used by the LoadUltra function.
Synopsis:GetUltraScript() -> string
Arguments:none
Returns:The GetUltraScript function returns a filename.
Description:Return the name of the file in use by the LoadUltra function. Normal users do not need to use thisfunction.
137

CHAPTER 4. FUNCTIONS
GetView2D: return an object containing the current view.
Synopsis:GetViewCurve() -> ViewCurveAttributes objectGetView2D() -> View2DAttributes objectGetView3D() -> View3DAttributes objectGetViewAxisArray() -> ViewAxisArrayAttributes object
Returns:Both functions return objects that represent the curve, 2D, or 3D view information.
Description:The GetView functions return ViewAttributes objects which describe the current camera location.The GetView2D function should be called if the active visualization window contains 2D plots. TheGetView3D function should be called to get the view if the active visualization window contains 3D plots.The GetViewCurve function should be called if the active visualization window contains 1D curve plots.The GetViewAxisArray function should be called if the active visualization window contains axis−arrayplots.
Example:% visit -cliOpenDatabase("/usr/gapps/visit/data/globe.silo")AddPlot("Pseudocolor", "u")DrawPlots()# Change the view interactively using the mouse.v0 = GetView3D()# Change the view again using the mousev1 = GetView3D()print v0for i in range(0,20):t = float(i) / 19.v2 = (1. - t) * v1 + t * v0SetView3D(v2) # Animate the view back to the first view.
138

CHAPTER 4. FUNCTIONS
GetView3D: return an object containing the current view.
Synopsis:GetViewCurve() -> ViewCurveAttributes objectGetView2D() -> View2DAttributes objectGetView3D() -> View3DAttributes objectGetViewAxisArray() -> ViewAxisArrayAttributes object
Returns:Both functions return objects that represent the curve, 2D, or 3D view information.
Description:The GetView functions return ViewAttributes objects which describe the current camera location.The GetView2D function should be called if the active visualization window contains 2D plots. TheGetView3D function should be called to get the view if the active visualization window contains 3D plots.The GetViewCurve function should be called if the active visualization window contains 1D curve plots.The GetViewAxisArray function should be called if the active visualization window contains axis−arrayplots.
Example:% visit -cliOpenDatabase("/usr/gapps/visit/data/globe.silo")AddPlot("Pseudocolor", "u")DrawPlots()# Change the view interactively using the mouse.v0 = GetView3D()# Change the view again using the mousev1 = GetView3D()print v0for i in range(0,20):t = float(i) / 19.v2 = (1. - t) * v1 + t * v0SetView3D(v2) # Animate the view back to the first view.
139
CHAPTER 4. FUNCTIONS
GetViewAxisArray: return an object containing the current view.
Synopsis:GetViewCurve() -> ViewCurveAttributes objectGetView2D() -> View2DAttributes objectGetView3D() -> View3DAttributes objectGetViewAxisArray() -> ViewAxisArrayAttributes object
Returns:Both functions return objects that represent the curve, 2D, or 3D view information.
Description:The GetView functions return ViewAttributes objects which describe the current camera location.The GetView2D function should be called if the active visualization window contains 2D plots. TheGetView3D function should be called to get the view if the active visualization window contains 3D plots.The GetViewCurve function should be called if the active visualization window contains 1D curve plots.The GetViewAxisArray function should be called if the active visualization window contains axis−arrayplots.
Example:% visit -cliOpenDatabase("/usr/gapps/visit/data/globe.silo")AddPlot("Pseudocolor", "u")DrawPlots()# Change the view interactively using the mouse.v0 = GetView3D()# Change the view again using the mousev1 = GetView3D()print v0for i in range(0,20):t = float(i) / 19.v2 = (1. - t) * v1 + t * v0SetView3D(v2) # Animate the view back to the first view.
140
CHAPTER 4. FUNCTIONS
GetViewCurve: return an object containing the current view.
Synopsis:GetViewCurve() -> ViewCurveAttributes objectGetView2D() -> View2DAttributes objectGetView3D() -> View3DAttributes objectGetViewAxisArray() -> ViewAxisArrayAttributes object
Returns:Both functions return objects that represent the curve, 2D, or 3D view information.
Description:The GetView functions return ViewAttributes objects which describe the current camera location.The GetView2D function should be called if the active visualization window contains 2D plots. TheGetView3D function should be called to get the view if the active visualization window contains 3D plots.The GetViewCurve function should be called if the active visualization window contains 1D curve plots.The GetViewAxisArray function should be called if the active visualization window contains axis−arrayplots.
Example:% visit -cliOpenDatabase("/usr/gapps/visit/data/globe.silo")AddPlot("Pseudocolor", "u")DrawPlots()# Change the view interactively using the mouse.v0 = GetView3D()# Change the view again using the mousev1 = GetView3D()print v0for i in range(0,20):t = float(i) / 19.v2 = (1. - t) * v1 + t * v0SetView3D(v2) # Animate the view back to the first view.
141
CHAPTER 4. FUNCTIONS
GetWindowInformation: returns a WindowInformation object that contains information about the
Synopsis:GetWindowInformation() -> WindowInformation object
Returns:The GetWindowInformation object returns a WindowInformation object.
Description:The GetWindowInformation object returns a WindowInformation object that contains informationabout the active visualization window. The WindowInformation object contains the name of the activesource, the active time slider index, the list of available time sliders and their current states, as wellas certain window flags that determine whether a window’s view is locked, etc. Use the WindowInfor-mation object if you need to query any of these types of information in your script to influence how itbehaves.
Example:path = "/usr/gapps/visit/data/"dbs = (path + "dbA00.pdb", path + "dbB00.pdb", path + "dbC00.pdb")for db in dbs:OpenDatabase(db)AddPlot("FilledBoundary", "material(mesh)")DrawPlots()CreateDatabaseCorrelation("common", dbs, 1)# Get the list of available time sliders.tsList = GetWindowInformation().timeSliders# Iterate through "time" on each time slider.for ts in tsList:SetActiveTimeSlider(ts)for state in range(TimeSliderGetNStates()):SetTimeSliderState(state)# Print the window information to examine the other attributes# that are available.GetWindowInformation()
142
CHAPTER 4. FUNCTIONS
HideActivePlots: hides the active plots in the active visualization window.
Synopsis:HideActivePlots() -> integer
Returns:The HideActivePlots function returns an integer value of 1 for success and 0 for failure.
Description:The HideActivePlots function tells the viewer to hide the active plots in the active visualization window.
Example:% visit -cliOpenDatabase("/usr/gapps/visit/data/globe.silo")AddPlot("Pseudocolor", "u")AddPlot("Mesh", "mesh1")DrawPlots()SetActivePlots(0)HideActivePlots()AddPlot("FilledBoundary", "mat1")DrawPlots()
143
CHAPTER 4. FUNCTIONS
HideToolbars: hides the visualization window’s toolbars.
Synopsis:HideToolbars() -> integerHideToolbars(allWindows) ->integer
Arguments:allWindows An optional integer value that tells VisIt to hide the tool-
bars for all windows when it is non−zero.
Returns:The HideToolbars function returns 1 on success and 0 on failure.
Description:The HideToolbars function tells VisIt to hide the toolbars for the active visualization window or for all vi-sualization windows when the optional allWindows argument is provided and is set to a non−zero value.
Example:% visit -cliSetWindowLayout(4)HideToolbars()ShowToolbars()# Hide the toolbars for all windows.HideToolbars(1)
144
CHAPTER 4. FUNCTIONS
IconifyAllWindows: minimizes all of the visualization windows.
Synopsis:IconifyAllWindows()
Returns:The IconifyAllWindows function does not return a value.
Description:The IconifyAllWindows function minimizes all of the hidden visualization windows to get them out ofthe way.
Example:% visit -cliSetWindowLayout(4) # Have 4 windowsIconifyAllWindows()DeIconifyAllWindows()
145
CHAPTER 4. FUNCTIONS
InitializeNamedSelectionVariables: initialize a named selection’s properties with variables fromcompatible plots and operators.
Synopsis:InitializeNamedSelectionVariables(name) -> integer
Arguments:name The name of the named selection to initialize.
Returns:The InitializeNamedSelectionVariables function returns 1 on success and 0 on failure.
Description:Complex thresholds are often defined using the Parallel Coordinates plot or the Threshold operator.This function can copy variable ranges from compatible plots and operators into the specified namedselection’s properties. This can be useful when setting up Cumulative Query selections.
Example:InitializeNamedSelectionVariables(’selection1’)
146
CHAPTER 4. FUNCTIONS
InvertBackgroundColor: swaps the background and foreground colors in the active visualization
Synopsis:InvertBackgroundColor()
Returns:The InvertBackgroundColor function does not return a value.
Description:The InvertBackgroundColor function swaps the background and foreground colors in the active visual-ization window. This function is a cheap alternative to setting the foreground and background colorsthough the AnnotationAttributes in that it is a simple no−argument function call. It is not adequateto set new colors for the background and foreground, but in the event where the two colors can beexchanged favorably, it is a good function to use. An example of when this function is used is after thecreation of a Volume plot.
Example:% visit -cliOpenDatabase("/usr/gapps/visit/data/globe.silo")AddPlot("Volume", "u")DrawPlots()InvertBackgroundColor()
147
CHAPTER 4. FUNCTIONS
Launch: launches VisIt’s viewer
Synopsis:Launch() -> integerLaunch(program) -> integerLaunchNowin() -> integerLaunchNowin(program) -> integer
Arguments:program The complete path to the top level ’visit’ script.
Returns:The Launch functions return 1 for success and 0 for failure
Description:The Launch function is used to launch VisIt’s viewer when the VisIt module is imported into astand−alone Python interpreter. The Launch function has no effect when a viewer already exists.The difference between Launch and LaunchNowin is that LaunchNowin prevents the viewer from evercreating onscreen visualization windows. The LaunchNowin function is primarily used in Python scriptsthat want to generate visualizations using VisIt without the use of a display such as when generatingmovies.
Example 1:import visitvisit.AddArgument("-geometry")visit.AddArgument("1024x1024")visit.LaunchNowin()
Example 2:import visitvisit.AddArgument("-nowin")visit.Launch()
148

CHAPTER 4. FUNCTIONS
LaunchNowin: launches VisIt’s viewer
Synopsis:Launch() -> integerLaunch(program) -> integerLaunchNowin() -> integerLaunchNowin(program) -> integer
Arguments:program The complete path to the top level ’visit’ script.
Returns:The Launch functions return 1 for success and 0 for failure
Description:The Launch function is used to launch VisIt’s viewer when the VisIt module is imported into astand−alone Python interpreter. The Launch function has no effect when a viewer already exists.The difference between Launch and LaunchNowin is that LaunchNowin prevents the viewer from evercreating onscreen visualization windows. The LaunchNowin function is primarily used in Python scriptsthat want to generate visualizations using VisIt without the use of a display such as when generatingmovies.
Example 1:import visitvisit.AddArgument("-geometry")visit.AddArgument("1024x1024")visit.LaunchNowin()
Example 2:import visitvisit.AddArgument("-nowin")visit.Launch()
149
CHAPTER 4. FUNCTIONS
Lineout: performs a lineout.
Synopsis:Lineout(start, end) -> integerLineout(start, end, variables) -> integerLineout(start, end, samples) -> integerLineout(start, end, variables, samples) -> integer
Arguments:start A 2 or 3 item tuple containing the coordinates of the start-
ing point.end A 2 or 3 item tuple containing the coordinates of the end
point.variables A tuple of strings containing the names of the variables for
which lineouts should be created.samples An integer value containing the number of sample points
along the lineout.
Returns:The Lineout function returns 1 on success and 0 on failure.
Description:The Lineout function extracts data along a given line segment and creates curves from it in a new visu-alization window. The start argument is a tuple of numbers that make up the coordinate of the lineout’sstarting location. The end argument is a tuple of numbers that make up the coordinate of the lineout’sending location. The optional variables argument is a tuple of strings that contain the variables thatshould be sampled to create lineouts. The optional samples argument is used to determine the numberof sample points that should be taken along the specified line. If the samples argument is not providedthen VisIt will sample the mesh where it intersects the specified line instead of using the number ofsamples to compute a list of points to sample.
Example:% visit -cliOpenDatabase("/usr/gapps/visit/data/rect2d.silo")AddPlot("Pseudocolor", "ascii")DrawPlots()Lineout((0.2,0.2), (0.8,1.2))Lineout((0.2,1.2), (0.8,0.2), ("default", "d", "u"))Lineout((0.6, 0.1), (0.6, 1.2), 100)
150
CHAPTER 4. FUNCTIONS
ListDomains: lists the members of a SIL restriction category.
Synopsis:ListDomains()ListMaterials()
Returns:The List functions do not return a value.
Description:The List functions: ListDomains, and List Materials prints a list of the domains and the materials forthe active plots, which indicates which domains or materials are on and off. The list functions are usedmostly to print the results of restricting the SIL.
Example:% visit -cliOpenDatabase("/usr/gapps/visit/data/globe.silo")AddPlot("Pseudocolor", "u")DrawPlots()TurnMaterialsOff("4") # Turn off material 4ListMaterials() # List the materials in the SIL restriction
151

CHAPTER 4. FUNCTIONS
ListMaterials: lists the members of a SIL restriction category.
Synopsis:ListDomains()ListMaterials()
Returns:The List functions do not return a value.
Description:The List functions: ListDomains, and List Materials prints a list of the domains and the materials forthe active plots, which indicates which domains or materials are on and off. The list functions are usedmostly to print the results of restricting the SIL.
Example:% visit -cliOpenDatabase("/usr/gapps/visit/data/globe.silo")AddPlot("Pseudocolor", "u")DrawPlots()TurnMaterialsOff("4") # Turn off material 4ListMaterials() # List the materials in the SIL restriction
152
CHAPTER 4. FUNCTIONS
ListPlots: lists the plots in the active visualization window’s plot list.
Synopsis:ListPlots() -> stringListPlots(stringOnly) -> string
Returns:The ListPlots function returns a string containing a representation of the. plot list.
Description:Sometimes it is difficult to remember the order of the plots in the active visualization window’s plot list.The ListPlots function prints the contents of the plot list to the output console and returns that stringas well.
Example:% visit -cliOpenDatabase("/usr/gapps/visit/data/curv2d.silo")AddPlot("Pseudocolor", "u")AddPlot("Contour", "d")DrawPlots()ListPlots()
153

CHAPTER 4. FUNCTIONS
LoadAttribute: loads or saves a single attribute to/from an XML file.
Synopsis:LoadAttribute(filename, object)SaveAttribute(filename, object)
Arguments:filename The name of the XML file to load the attribute from or
save the attribute to.object The object to load or save.
Returns:success or failure
Description:The LoadAttribute and SaveAttribute methods save a single attribute, such as a current plot or operatorpython object, to a standalone XML file. Note that LoadAttribute requires that the target attributealready be created by other means; it fills, but does not create, the attribute.
Example:% visit -clia = MeshPlotAttributes()SaveAttribute(’mesh.xml’, a)b = MeshPlotAttributes()LoadAttribute(’mesh.xml’, b)
154

CHAPTER 4. FUNCTIONS
LoadNamedSelection: loads a named selection from a file.
Synopsis:LoadNamedSelection(name) -> integerLoadNamedSelection(name, engineName) -> integerLoadNamedSelection(name, engineName, simName) -> integer
Arguments:name The name of a named selection.engineName (optional) The name of the engine where the selection was
saved.simName (optional) The name of the simulation that saved the selec-
tion.
Returns:The LoadNamedSelection function returns 1 for success and 0 for failure.
Description:Named Selections allow you to select a group of elements (or particles). One typically creates a namedselection from a group of elements and then later applies the named selection to another plot (thusreducing the set of elements displayed to the ones from when the named selection was created). Namedselections only last for the current session. However, if you find a named selection that is particularlyinteresting, you can save it to a file for use in later sessions. You would use LoadNamedSelection to dothe loading.
Example:% visit -clidb = "/usr/gapps/visit/data/wave*.silo database"OpenDatabase(db)AddPlot("Pseudocolor", "pressure")LoadNamedSelection("selection_from_previous_session")ApplyNamedSelection("selection_from_previous_session")
155
CHAPTER 4. FUNCTIONS
LoadUltra: loads the Ultra command parser.
Synopsis:LoadUltra()
Arguments:none
Returns:LoadUltra does not return a value.
Description:LoadUltra launches the Ultra command parser, allowing you to enter Ultra commands and have VisItprocess them. A new command prompt is presented, and only Ultra commands will be allowed until’end’ or ’quit’ is entered, at which time, you will be returned to VisIt’s cli prompt. For information oncurrently supported commands, type ’help’ at the Ultra prompt Please note that filenames/paths mustbe surrounded by quotes, unlike with Ultra.
Example:% visit -cli>>> LoadUltra()U-> rd "../../data/distribution.ultra"U-> select 1U-> end>>>
156
CHAPTER 4. FUNCTIONS
LocalNameSpace: tells the VisIt module to import plugins into the global namespace.
Synopsis:LocalNamespace()
Arguments:none
Returns:The LocalNamespace function does not return a value.
Description:The LocalNamespace function tells the VisIt module to add plugin functions to the global namespacewhen the VisIt module is imported into a stand−alone Python interpreter. This is the default behaviorwhen using VisIt’s cli program.
Example:import visitvisit.LocalNamespace()visit.Launch()
157
CHAPTER 4. FUNCTIONS
LongFileName: returns the long filename for a short WIN32 filename.
Synopsis:LongFileName(filename) -> string
Arguments:filename A string object containing the short filename to expand.
Returns:The LongFileName function returns a string. Notes: This function returns the input argument unlessyou are on the Windows platform.
Description:On Windows, filenames can have two different sizes: traditional 8.3 format, and long format. The longformat, which lets you name files whatever you want, is implemented using the traditional 8.3 formatunder the covers. Sometimes filenames are given to VisIt in the traditional 8.3 format and must beexpanded to long format before it is possible to open them. If you ever find that you need to do thisconversion, such as when you process command line arguments, then you can use the LongFileNamefunction to return the longer filename.
158
CHAPTER 4. FUNCTIONS
MoveAndResizeWindow: moves and resizes a vis window.
Synopsis:MoveAndResizeWindow(win, x, y, w, h) -> integer
Arguments:win The id of the window to be moved [1..16].x The new x location for the window being moved.y The new y location for the window being moved.w The new width for the window being moved.h The new height for the window being moved.
Returns:MoveAndResizeWindow returns 1 on success and 0 on failure.
Description:MoveAndResizeWindow moves and resizes a visualization window.
Example:% visit -cliMoveAndResizeWindow(1, 100, 100, 300, 600)
159
CHAPTER 4. FUNCTIONS
MovePlotDatabaseKeyframe: moves a database keyframe for a plot.
Synopsis:MovePlotDatabaseKeyframe(index, oldFrame, newFrame)
Arguments:index An integer representing the index of the plof in the plot list.oldFrame The old animation frame where the keyframe is located.newFrame The new animation frame where the keyframe will be
moved.
Returns:MovePlotDatabaseKeyframe does not return a value.
Description:MovePlotDatabaseKeyframe moves a database keyframe for a specified plot to a new animation frame,which changes the list of database time states that are used for each animation frame when VisIt is inkeyframing mode.
Example:% visit -cliOpenDatabase("/usr/gapps/visit/data/wave.visit")k = GetKeyframeAttributes()nFrames = 20k.enabled, k.nFrames, k.nFramesWasUserSet = 1, nFrames, 1AddPlot("Pseudocolor", "pressure")SetPlotFrameRange(0, 0, nFrames-1)SetPlotDatabaseKeyframe(0, 0, 70)SetPlotDatabaseKeyframe(0, nFrames/2, 35)SetPlotDatabaseKeyframe(0, nFrames-1, 0)DrawPlots()for state in list(range(TimeSliderGetNStates())) + [0]:SetTimeSliderState(state)MovePlotDatabaseKeyframe(0, nFrames/2, nFrames/4)for state in list(range(TimeSliderGetNStates())) + [0]:SetTimeSliderState(state)
160
CHAPTER 4. FUNCTIONS
MovePlotKeyframe: moves a keyframe for a plot.
Synopsis:MovePlotKeyframe(index, oldFrame, newFrame)
Arguments:index An integer representing the index of the plof in the plot list.oldFrame The old animation frame where the keyframe is located.newFrame The new animation frame where the keyframe will be
moved.
Returns:MovePlotKeyframe does not return a value.
Description:MovePlotKeyframe moves a keyframe for a specified plot to a new animation frame, which changes theplot attributes that are used for each animation frame when VisIt is in keyframing mode.
Example:% visit -cliOpenDatabase("/usr/gapps/visit/data/noise.silo")AddPlot("Contour", "hgslice")DrawPlots()k = GetKeyframeAttributes()nFrames = 20k.enabled, k.nFrames, k.nFramesWasUserSet = 1, nFrames, 1SetKeyframeAttributes(k)SetPlotFrameRange(0, 0, nFrames-1)c = ContourAttributes()c.contourNLevels = 5SetPlotOptions(c)SetTimeSliderState(nFrames/2)c.contourNLevels = 10SetPlotOptions(c)c.contourLevels = 25SetTimeSliderState(nFrames-1)SetPlotOptions(c)for state in range(TimeSliderGetNStates()):SetTimeSliderState(state)SaveWindow()temp = nFrames-2MovePlotKeyframe(0, nFrames/2, temp)MovePlotKeyframe(0, nFrames-1, nFrames/2)MovePlotKeyframe(0, temp, nFrames-1)for state in range(TimeSliderGetNStates()):SetTimeSliderState(state)SaveWindow()
161
CHAPTER 4. FUNCTIONS
MovePlotOrderTowardFirst: movethe i’th plot towards the start of the plot list.
Synopsis:MovePlotOrderTowardFirst(index) -> integer
Arguments:index The index of the plot that will be moved within the plot
list.
Returns:The MovePlotOrderTowardFirst function returns 1 on success and 0 on failure.
Description:This function shifts the specified plot one slot towards the start of the plot list.
Example:MovePlotOrderTowardFirst(2)
162
CHAPTER 4. FUNCTIONS
MovePlotOrderTowardLast: move the i’th plot towards the end of the plot list.
Synopsis:MovePlotOrderTowardLast(index) -> integer
Arguments:index The index of the plot that will be moved within the plot
list.
Returns:The MovePlotOrderTowardLast function returns 1 on success and 0 on failure.
Description:This function shifts the specified plot one slot towards the end of the plot list.
Example:MovePlotOrderTowardLast(0)
163
CHAPTER 4. FUNCTIONS
MoveViewKeyframe: moves a view keyframe.
Synopsis:MoveViewKeyframe(oldFrame, newFrame) -> integer
Arguments:oldFrame The old animation frame where the keyframe is located.newFrame The new animation frame where the keyframe will be
moved.
Returns:MoveViewKeyframe returns 1 on success and 0 on failure.
Description:MoveViewKeyframe moves a view keyframe to a new animation frame, which changes the view that isused for each animation frame when VisIt is in keyframing mode.
Example:% visit -cliOpenDatabase("/usr/gapps/visit/data/noise.silo")AddPlot("Contour", "hardyglobal")DrawPlots()k = GetKeyframeAttributes()nFrames = 20k.enabled, k.nFrames, k.nFramesWasUserSet = 1, nFrames, 1SetKeyframeAttributes(k)SetViewKeyframe()SetTimeSliderState(nFrames/2)v = GetView3d()v.viewNormal = (-0.616518, 0.676972, 0.402014)v.viewUp = (0.49808, 0.730785, -0.466764)SetViewKeyframe()SetTimeSliderState(0)# Move the view keyframe to the last animation frame.MoveViewKeyframe(nFrames/2, nFrames-1)
164
CHAPTER 4. FUNCTIONS
MoveWindow: moves a vis window.
Synopsis:MoveWindow(win, x, y) -> integer
Arguments:win The id of the window to be moved [1..16].x The new x location for the window being moved.y The new y location for the window being moved.
Returns:MoveWindow returns 1 on success and 0 on failure.
Description:MoveWindow moves a visualization window.
Example:% visit -cliMoveWindow(1, 100, 100)
165

CHAPTER 4. FUNCTIONS
NodePick: performs a nodal pick on a plot.
Synopsis:NodePick(namedarg1=arg1, namedarg2=arg2, ...) -> dictionary
Arguments:coord A tuple of doubles containing the spatial coordinate (x, y,
z).x An integer containing the screen X location (in pixels) offset
from the left side of the visualization window.y An integer containing the screen Y location (in pixels) offset
from the bottom of the visualization window.vars (optional) A tuple of strings with the variable names for which to
return results. (default: currently plotted variable)do_time (optional) An integer indicating whether to do a time pick. 1 −> do
a time pick, 0 (default) −> do not do a time pick.start_time (optional) An integer with the starting frame index (default: 0).end_time (optional) An integer with the ending frame index (default:
num timestates − 1).stride (optional) An integer with the stride for advancing in time (default:
1).preserve_coord (optional) An integer indicating whether to pick an element or a co-
ordinate. 0 −> used picked element (default), 1−> usedpicked coordinate.
curve_plot_type (optional) An integer indicating whether the output should be on asingle axis or with multiple axes. 0 −> single Y axis (de-fault), 1 −> multiple Y Axes.
Returns:NodePick returns a python dictionary of the pick results, unless do time is specified, then a time curveis created in a new window.
Description:The NodePick function prints pick information for the node closest to the specified point. The point canbe specified as a 2D or 3D point in world space or it can be specified as a pixel location in screen space.If the point is specified as a pixel location then VisIt finds the node closest to a ray that is projectedinto the mesh. Once the nodal pick has been calculated, you can use the GetPickOutput function toretrieve the printed pick output as a string which can be used for other purposes.
Example:% visit -cliOpenDatabase("/usr/gapps/visit/data/noise.silo")AddPlot("Pseudocolor", "hgslice")DrawPlots()# Perform node pick in screen spacepick_out = NodePick(x=200,y=200)# Perform node pick in world space.pick_out = NodePick(coord=(-5.0, 5.0, 0))
166
CHAPTER 4. FUNCTIONS
NumColorTableNames: returns the number of color tables that have been defined.
Synopsis:NumColorTableNames() -> integer
Returns:The NumColorTableNames function return an integer.
Description:The NumColorTableNames function returns the number of color tables that have been defined.
Example:% visit -cliOpenDatabase("/usr/gapps/visit/data/globe.silo")AddPlot("Pseudocolor", "u")p = PseudocolorAttributes()p.colorTableName = "default"SetPlotOptions(p)DrawPlots()print "There are %d color tables." % NumColorTableNames()for ct in ColorTableNames():SetActiveContinuousColorTable(ct)SaveWindow()
167
CHAPTER 4. FUNCTIONS
NumOperatorPlugins: returns the number of available operator plugins.
Synopsis:NumOperatorPlugins() -> integer
Returns:The NumOperatorPlugins function returns an integer.
Description:The NumOperatorPlugins function returns the number of available operator plugins.
Example:% visit -cliprint "The number of operator plugins is: ", NumOperatorPlugins()print "The names of the plugins are: ", OperatorPlugins()
168
CHAPTER 4. FUNCTIONS
NumPlotPlugins: returns the number of available plot plugins.
Synopsis:NumPlotPlugins() -> integer
Returns:The NumPlotPlugins function returns an integer.
Description:The NumPlotPlugins function returns the number of available plot plugins.
Example:% visit -cliprint "The number of plot plugins is: ", NumPlotPlugins()print "The names of the plugins are: ", PlotPlugins()
169
CHAPTER 4. FUNCTIONS
OpenComputeEngine: opens a compute engine on the specified computer
Synopsis:OpenComputeEngine() -> integerOpenComputeEngine(hostName) -> integerOpenComputeEngine(hostName, simulation) -> integerOpenComputeEngine(hostName, args) -> integerOpenComputeEngine(MachineProfile) -> integer
Arguments:hostName The name of the computer on which to start the engine.args Optional tuple of command line arguments for the engine.Alternative arguments: MachineProfile object to load with OpenComputeEngine
call
Returns:The OpenComputeEngine function returns an integer value of 1 for success and 0 for failure.
Description:The OpenComputeEngine function is used to explicitly open a compute engine with certain properties.When a compute engine is opened implicitly, the viewer relies on sets of attributes called host profiles.Host profiles determine how compute engines are launched. This allows compute engines to be easilylaunched in parallel. Since the VisIt Python Interface does not expose VisIt’s host profiles, it providesthe OpenComputeEngine function to allow users to launch compute engines. The OpenComputeEnginefunction must be called before opening a database in order to prevent any latent host profiles fromtaking precedence.
Example:% visit -cli# Launch parallel compute engine remotely.args = ("-np", "16", "-nn", "4")OpenComputeEngine("thunder", args)OpenDatabase("thunder:/usr/gapps/visit/data/multi_ucd3d.silo")AddPlot("Pseudocolor", "d")DrawPlots()
170
CHAPTER 4. FUNCTIONS
OpenDatabase: opens a database for plotting.
Synopsis:OpenDatabase(databaseName) -> integerOpenDatabase(databaseName, timeIndex) -> integerOpenDatabase(databaseName, timeIndex, dbPluginName) -> integer
Arguments:databaseName A string containing the name of the database to open.timeIndex This is an optional integer argument indicating the time
index at which to open the database. If it is not specified,a time index of zero is assumed.
dbPluginIndex An optional string containing the name of the plugin touse. Note that this string must also include the plugin’sversion number (with few exceptions, almost all plugins’version numbers are 1.0). Note also that you must cap-italize the spelling identically to what the plugin’s Gen-eralPluginInfo::GetName() method returns. For example,”XYZ 1.0” is the string you would use for the XYZ plugin.
Returns:The OpenDatabase function returns an integer value of 1 for success and 0 for failure.
Description:The OpenDatabase function is one of the most important functions in the VisIt Python Interface becauseit opens a database so it can be plotted. The databaseName argument is a string containing the fullname of the database to be opened. The database name is of the form: computer:/path/filename. Thecomputer part of the filename can be omitted if the database to be opened resides on the local computer.
Example:% visit -cliOpenDatabase("/usr/gapps/visit/data/globe.silo")OpenDatabase("mcr:/usr/gapps/visit/data/multi_ucd3d.silo")OpenDatabase("file.visit")OpenDatabase("file.visit", 4)OpenDatabase("mcr:/usr/gapps/visit/data/multi_ucd3d.silo",0,"Silo_1.0")
171
CHAPTER 4. FUNCTIONS
OpenMDServer: explicitly opens a metadata server.
Synopsis:OpenMDServer() -> integerOpenMDServer(host) -> integerOpenMDServer(host, args) -> integerOpenMDServer(MachineProfile) -> integer
Arguments:host The optional host argument determines the host on which
the metadata server is to be launched. If this argument isnot provided, ”localhost” is assumed.
args A tuple of strings containing command line flags for themetadata server.
Alternative arguments: MachineProfile object to load with OpenMDServer call
Returns:The OpenMDServer function returns 1 on success and 0 on failure.
Description:The OpenMDServer explicitly launches a metadata server on a specified host. This allows you to providecommand line options that influence how the metadata server will run.
Argument Description-debug # The −debug argument allows you to specify a debug level
in the range [1,5] that VisIt uses to write debug logs to disk.-dir visitdir The −dir argument allows you to specify where VisIt is
located on a remote computer. This allows you to success-fully connect to a remote computer in the absence of hostprofiles. It also allows you to debug VisIt in distributedmode.
-fallback_format <format> The −fallback format argument allows you to specify thedatabase plugin that will be used to open files if all otherguessing failed. This is useful when the files that you wantto open do not have file extensions.
-assume_format <format> The −assume format argument allows you to specify thedatabase plugin that will be used FIRST when attemptingto open files. This is useful when the files that you wantto open have a file extension which may match multiple fileformat readers.
Example:-assume_format PDB
Example:% visit -cliargs = ("-dir", "/my/private/visit/version/", "-assume_format", \"PDB", "-debug", "4")# Open a metadata server before the call to OpenDatabase so we# can launch it how we want.OpenMDServer("thunder", args)OpenDatabase("thunder:/usr/gapps/visit/data/allinone00.pdb")# Open a metadata server on localhost too.OpenMDServer()
172
CHAPTER 4. FUNCTIONS
OperatorPlugins: returns a tuple of operator plugin names.
Synopsis:OperatorPlugins() -> tuple of strings
Returns:The OperatorPlugins function returns a tuple of strings.
Description:The OperatorPlugins function returns a tuple of strings that contain the names of the loaded operatorplugins. This can be useful for the creation of scripts that alter their behavior based on the availableoperator plugins.
Example:% visit -clifor plugin in OperatorPlugins():print "The %s operator plugin is loaded." % plugin
173
CHAPTER 4. FUNCTIONS
OverlayDatabase: creates new plots based on current plots but with a new database.
Synopsis:OverlayDatabase(databaseName) -> integerOverlayDatabase(databaseName, state) -> integer
Arguments:databaseName A string containing the name of the new plot database.state The time state at which to open the database.
Returns:The OverlayDatabase function returns an integer value of 1 for success and 0 for failure.
Description:VisIt has the concept of overlaying plots which, in the nutshell, means that the entire plot list is copiedand a new set of plots with exactly the same attributes but a different database is appended to the plotlist of the active window. The OverlayDatabase function allows the VisIt Python Interface to overlayplots. OverlayDatabase takes a single string argument which contains the name of the database. Aftercalling the OverlayDatabase function, the plot list is larger and contains plots of the specified overlaydatabase.
Example:% visit -cliOpenDatabase("/usr/gapps/visit/data/globe.silo")AddPlot("Pseudocolor", "u")DrawPlots()OverlayDatabase("riptide:/usr/gapps/visit/data/curv3d.silo")
174
CHAPTER 4. FUNCTIONS
Pick: performs a zonal pick on a plot.
Synopsis:ZonePick(namedarg1=arg1, namedarg2=arg2, ...) -> dictionary
Arguments:coord A tuple of doubles containing the spatial coordinate (x, y,
z).x An integer containing the screen X location (in pixels) offset
from the left side of the visualization window.y An integer containing the screen Y location (in pixels) offset
from the bottom of the visualization window.vars (optional) A tuple of strings with the variable names for which to
return results. (default: currently plotted variable)do_time (optional) An integer indicating whether to do a time pick. 1 −> do
a time pick, 0 (default) −> do not do a time pick.start_time (optional) An integer with the starting frame index (default: 0).end_time (optional) An integer with the ending frame index (default:
num timestates − 1).stride (optional) An integer with the stride for advancing in time (default:
1).preserve_coord (optional) An integer indicating whether to pick an element or a co-
ordinate. 0 −> used picked element (default), 1−> usedpicked coordinate.
curve_plot_type (optional) An integer indicating whether the output should be on asingle axis or with multiple axes. 0 −> single Y axis (de-fault), 1 −> multiple Y Axes.
Returns:ZonePick returns a python dictionary of the pick results, unless do time is specified, then a time curveis created in a new window. If the picked variable is node centered, the variable values are groupedaccording to incident node ids.
Description:The ZonePick function prints pick information for the cell (a.k.a zone) that contains the specified point.The point can be specified as a 2D or 3D point in world space or it can be specified as a pixel locationin screen space. If the point is specified as a pixel location then VisIt finds the zone that contains theintersection of a cell and a ray that is projected into the mesh. Once the zonal pick has been calculated,you can use the GetPickOutput function to retrieve the printed pick output as a string which can beused for other purposes.
Example:% visit -cliOpenDatabase("/usr/gapps/visit/data/noise.silo")AddPlot("Pseudocolor", "hgslice")DrawPlots()# Perform zone pick in screen spacepick_out = ZonePick(x=200,y=200)# Perform zone pick in world space.pick_out = ZonePick(coord = (-5.0, 5.0, 0))
175

CHAPTER 4. FUNCTIONS
PickByGlobalNode: performs pick operation for a specific node using a global node id.
Synopsis:PickByGlobalNode(namedarg1=arg1, namedarg2=arg2,\
...) -> dictionary
Arguments:element An integer with the global node id.vars (optional) A tuple of strings with the variable names for which to
return results. (default: currently plotted variable)do_time (optional) An integer indicating whether to do a time pick. 1 −> do
a time pick, 0 (default) −> do not do a time pick.start_time (optional) An integer with the starting frame index (default: 0).end_time (optional) An integer with the ending frame index (default:
num timestates − 1).stride (optional) An integer with the stride for advancing in time (default:
1).preserve_coord (optional) An integer indicating whether to pick an element or a co-
ordinate. 0 −> used picked element (default), 1−> usedpicked coordinate.
curve_plot_type (optional) An integer indicating whether the output should be on asingle axis or with multiple axes. 0 −> single Y axis (de-fault), 1 −> multiple Y Axes.
Returns:PickByGlobalNode returns a python dictionary of pick results.
Description:The PickByGlobalNode function tells VisIt to perform pick using a specific global node index for theentire problem. Some meshes are broken up into smaller ”domains” and then these smaller domains canemploy a global indexing scheme to make it appear as though the mesh was still one large mesh. Notall meshes that have been decomposed into domains provide sufficient information to allow global nodeindexing. You can use the GetPickOutput function to retrieve a string containing the pick informationonce you’ve called PickByGlobalNode.
Example:% visit -cliOpenDatabase("/usr/gapps/visit/data/global_node.silo")AddPlot("Pseudocolor", "dist")DrawPlots()# Pick on global node 236827pick_out = PickByGlobalNode(element=246827)# examine outputprint ’value of dist at global node 246827: %g’ % pick_out[’dist’]print ’local domain/node: %d/%d’ % (pick_out[’domain_id’], pick_out[’node_id’])# get last pick output as stringprint ’Last pick = ’, GetPickOutput()
176
CHAPTER 4. FUNCTIONS
PickByGlobalZone: performs pick operation for a specific cell using a global cell id.
Synopsis:PickByGlobalZone(namedarg1=arg1, namedarg2=arg2,\
...) -> dictionary
Arguments:element An integer with the global zone id.vars (optional) A tuple of strings with the variable names for which to
return results. (default: currently plotted variable)do_time (optional) An integer indicating whether to do a time pick. 1 −> do
a time pick, 0 (default) −> do not do a time pick.start_time (optional) An integer with the starting frame index (default: 0).end_time (optional) An integer with the ending frame index (default:
num timestates − 1).stride (optional) An integer with the stride for advancing in time (default:
1).preserve_coord (optional) An integer indicating whether to pick an element or a co-
ordinate. 0 −> used picked element (default), 1−> usedpicked coordinate.
curve_plot_type (optional) An integer indicating whether the output should be on asingle axis or with multiple axes. 0 −> single Y axis (de-fault), 1 −> multiple Y Axes.
Returns:PickByGlobalZone returns a python dictionary of pick results.
Description:The PickByGlobalZone function tells VisIt to perform pick using a specific global cell index for theentire problem. Some meshes are broken up into smaller ”domains” and then these smaller domains canemploy a global indexing scheme to make it appear as though the mesh was still one large mesh. Notall meshes that have been decomposed into domains provide sufficient information to allow global cellindexing. You can use the GetPickOutput function to retrieve a string containing the pick informationonce you’ve called PickByGlobalZone.
Example:OpenDatabase("/usr/gapps/visit/data/global_node.silo")AddPlot("Pseudocolor", "p")DrawPlots()# Pick on global zone 237394pick_out = PickByGlobalZone(element=237394)# examine outputprint ’value of p at global zone 237394: %g’ % pick_out[’p’]print ’local domain/zone: %d/%d’ % (pick_out[’domain_id’], pick_out[’zone_id’])# get last pick output as stringprint ’Last pick = ’, GetPickOutput()
177
CHAPTER 4. FUNCTIONS
PickByNode: performs pick operation for a specific node in a given domain.
Synopsis:PickByNode(namedarg1=arg1, namedarg2=arg2, ...) -> dictionary
Arguments:domain An integer with the domain id.element An integer with the node id.vars (optional) A tuple of strings with the variable names for which to
return results. (default: currently plotted variable)do_time (optional) An integer indicating whether to do a time pick. 1 −> do
a time pick, 0 (default) −> do not do a time pick.start_time (optional) An integer with the starting frame index (default: 0).end_time (optional) An integer with the ending frame index (default:
num timestates − 1).stride (optional) An integer with the stride for advancing in time (default:
1).preserve_coord (optional) An integer indicating whether to pick an element or a co-
ordinate. 0 −> used picked element (default), 1−> usedpicked coordinate.
curve_plot_type (optional) An integer indicating whether the output should be on asingle axis or with multiple axes. 0 −> single Y axis (de-fault), 1 −> multiple Y Axes.
Returns:PickByNode returns a python dictionary of the pick results, unless do time is specified, then a time curveis created in a new window. If the picked variable is zone centered, the variable values are grouped ac-cording to incident zone ids.
Description:The PickByNode function tells VisIt to perform pick using a specific node index in a given domain.Other pick by node variants first determine the node that is closest to some user−specified 3D pointbut the PickByNode functions cuts out this step and allows you to directly pick on the node of yourchoice. You can use the GetPickOutput function to retrieve a string containing the pick informationonce you’ve called PickByNode.
Example:% visit -cliOpenDatabase("/usr/gapps/visit/data/multi_curv2d.silo")AddPlot("Pseudocolor", "u")DrawPlots()# Pick on node 200 in the first domain.pick_out = PickByNode(element=200, domain=1)# examine outputprint ’value of u at node 200: %g’ % pick_out[’u’]# Pick on node 100 in domain 5 and return information for two additionalvariables.pick_out = PickByNode(domain=5, element=100, vars=("u", "v", "d"))# examine outputprint ’incident zones for node 100: ’, pick_out[’incident_zones’]print ’value of d at incident zone %d: %g’ % (pick_out[’incident_zones’][0], pick_out[’d’][str(pick_out[’incident_zones’][0])])# print results formatted as stringprint "Last pick = ", GetPickOutput()
178
CHAPTER 4. FUNCTIONS
PickByZone: performs pick operation for a specific cell in a given domain.
Synopsis:PickByZone(namedarg1=arg1, namedarg2=arg2, ...) -> dictionary
Arguments:domain An integer with the domain id.element An integer with the zone id.vars (optional) A tuple of strings with the variable names for which to
return results. (default: currently plotted variable)do_time (optional) An integer indicating whether to do a time pick. 1 −> do
a time pick, 0 (default) −> do not do a time pick.start_time (optional) An integer with the starting frame index (default: 0).end_time (optional) An integer with the ending frame index (default:
num timestates − 1).stride (optional) An integer with the stride for advancing in time (default:
1).preserve_coord (optional) An integer indicating whether to pick an element or a co-
ordinate. 0 −> used picked element (default), 1−> usedpicked coordinate.
curve_plot_type (optional) An integer indicating whether the output should be on asingle axis or with multiple axes. 0 −> single Y axis (de-fault), 1 −> multiple Y Axes.
Returns:PickByZone returns a python dictionary of the pick results, unless do time is specified, then a time curveis created in a new window. If the picked variable is node centered, the variable values are groupedaccording to incident node ids.
Description:The PickByZone function tells VisIt to perform pick using a specific cell index in a given domain. Otherpick by zone variants first determine the cell that contains some user−specified 3D point but the Pick-ByZone functions cuts out this step and allows you to directly pick on the cell of your choice. You canuse the GetPickOutput function to retrieve a string containing the pick information once you’ve calledPickByZone.
Example:% visit -cliOpenDatabase("/usr/gapps/visit/data/multi_curv2d.silo")AddPlot("Pseudocolor", "d")DrawPlots()# Pick on cell 200 in the second domain.pick_out = PickByZone(element=200, domain=2)# examine outputprint ’value of d at zone 200: %g’ % pick_out[’d’]# Pick on cell 100 in domain 5 and return information for two additionalvariables.pick_out = PickByZone(element=100, domain=5, vars=("d", "u", "v"))# examine outputprint ’incident nodes for zone 100: ’, pick_out[’incident_nodes’]print ’values of u at incident zone %d: %g’ % (pick_out[’incident_nodes’][0], pick_out[’u’][str(pick_out[’incident_zones’][0])])# print results formatted as stringprint "Last pick = ", GetPickOutput()
179

CHAPTER 4. FUNCTIONS
PlotPlugins: returns a tuple of plot plugin names.
Synopsis:PlotPlugins() -> tuple of strings
Returns:The PlotPlugins function returns a tuple of strings.
Description:The PlotPlugins function returns a tuple of strings that contain the names of the loaded plot plugins.This can be useful for the creation of scripts that alter their behavior based on the available plot plugins.
Example:% visit -clifor plugin in PluginPlugins():print "The %s plot plugin is loaded." % plugin
180
CHAPTER 4. FUNCTIONS
PointPick: performs a nodal pick on a plot.
Synopsis:NodePick(namedarg1=arg1, namedarg2=arg2, ...) -> dictionary
Arguments:coord A tuple of doubles containing the spatial coordinate (x, y,
z).x An integer containing the screen X location (in pixels) offset
from the left side of the visualization window.y An integer containing the screen Y location (in pixels) offset
from the bottom of the visualization window.vars (optional) A tuple of strings with the variable names for which to
return results. (default: currently plotted variable)do_time (optional) An integer indicating whether to do a time pick. 1 −> do
a time pick, 0 (default) −> do not do a time pick.start_time (optional) An integer with the starting frame index (default: 0).end_time (optional) An integer with the ending frame index (default:
num timestates − 1).stride (optional) An integer with the stride for advancing in time (default:
1).preserve_coord (optional) An integer indicating whether to pick an element or a co-
ordinate. 0 −> used picked element (default), 1−> usedpicked coordinate.
curve_plot_type (optional) An integer indicating whether the output should be on asingle axis or with multiple axes. 0 −> single Y axis (de-fault), 1 −> multiple Y Axes.
Returns:NodePick returns a python dictionary of the pick results, unless do time is specified, then a time curveis created in a new window.
Description:The NodePick function prints pick information for the node closest to the specified point. The point canbe specified as a 2D or 3D point in world space or it can be specified as a pixel location in screen space.If the point is specified as a pixel location then VisIt finds the node closest to a ray that is projectedinto the mesh. Once the nodal pick has been calculated, you can use the GetPickOutput function toretrieve the printed pick output as a string which can be used for other purposes.
Example:% visit -cliOpenDatabase("/usr/gapps/visit/data/noise.silo")AddPlot("Pseudocolor", "hgslice")DrawPlots()# Perform node pick in screen spacepick_out = NodePick(x=200,y=200)# Perform node pick in world space.pick_out = NodePick(coord=(-5.0, 5.0, 0))
181
CHAPTER 4. FUNCTIONS
PrintWindow: prints the active visualization window.
Synopsis:PrintWindow() -> integer
Returns:The PrintWindow function returns an integer value of 1 for success and 0 for failure.
Description:The PrintWindow function tells the viewer to print the image in the active visualization window usingthe current printer settings.
Example:% visit -cliOpenDatabase("/usr/gapps/visit/data/curv2d.silo")AddPlot("Pseudocolor", "d")AddPlot("Contour", "u")DrawPlots()PrintWindow()
182
CHAPTER 4. FUNCTIONS
PromoteOperator: moves an operator closer to the end of the visualization pipeline.
Synopsis:PromoteOperator(opIndex) -> integerPromoteOperator(opIndex, applyToAllPlots) -> integer
Arguments:opIndex A zero−based integer corresponding to the operator that
should be promoted.applyAll An integer flag that causes all plots in the plot list to be
affected when it is non−zero.
Returns:PromoteOperator returns 1 on success and 0 on failure.
Description:The PromoteOperator function moves an operator closer to the end of the visualization pipeline. Thisallows you to change the order of operators that have been applied to a plot without having to removethem from the plot. For example, consider moving a Slice to after a Reflect operator when it had beenthe other way around. Changing the order of operators can result in vastly different results for a plot.The opposite function is DemoteOperator.
Example:% visit -cliOpenDatabase("/usr/gapps/visit/data/noise.silo")AddPlot("Pseudocolor", "hardyglobal")AddOperator("Slice")s = SliceAttributes()s.project2d = 0s.originPoint = (0,5,0)s.originType=s.Points.normal = (0,1,0)s.upAxis = (-1,0,0)SetOperatorOptions(s)AddOperator("Reflect")DrawPlots()# Now slice after reflect. We’ll only get 1 slice plane instead of 2.PromoteOperator(0)DrawPlots()
183
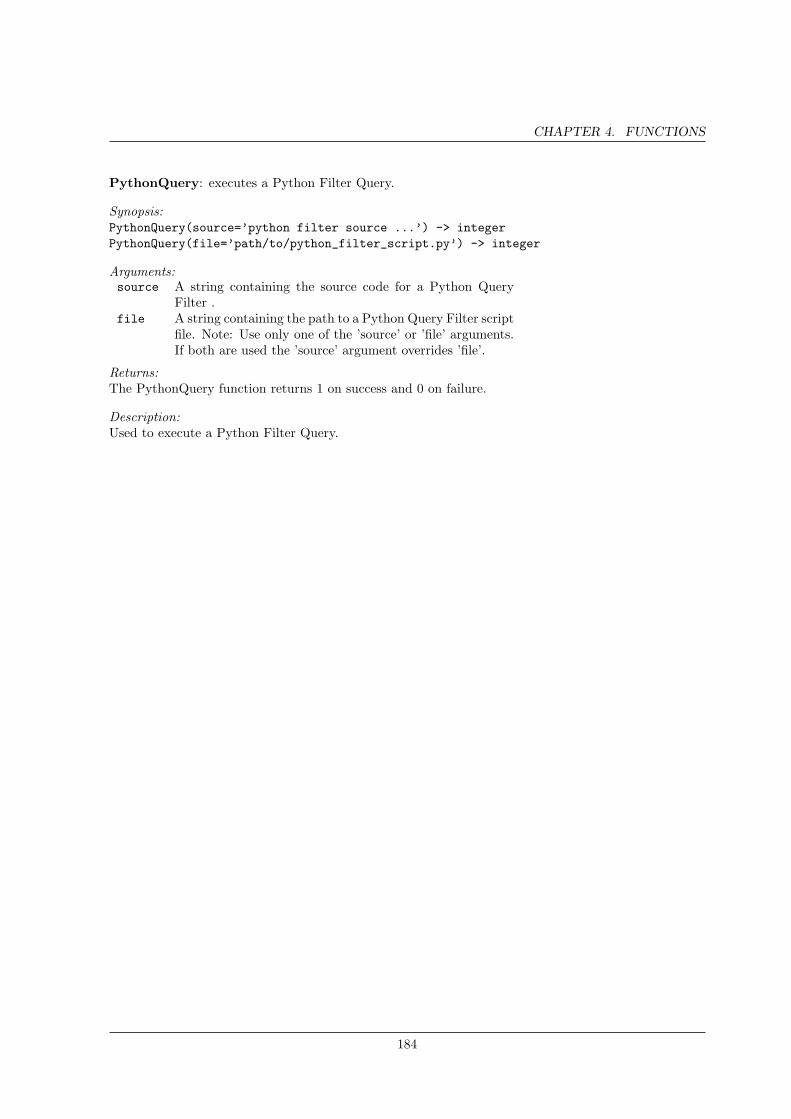
CHAPTER 4. FUNCTIONS
PythonQuery: executes a Python Filter Query.
Synopsis:PythonQuery(source=’python filter source ...’) -> integerPythonQuery(file=’path/to/python_filter_script.py’) -> integer
Arguments:source A string containing the source code for a Python Query
Filter .file A string containing the path to a Python Query Filter script
file. Note: Use only one of the ’source’ or ’file’ arguments.If both are used the ’source’ argument overrides ’file’.
Returns:The PythonQuery function returns 1 on success and 0 on failure.
Description:Used to execute a Python Filter Query.
184
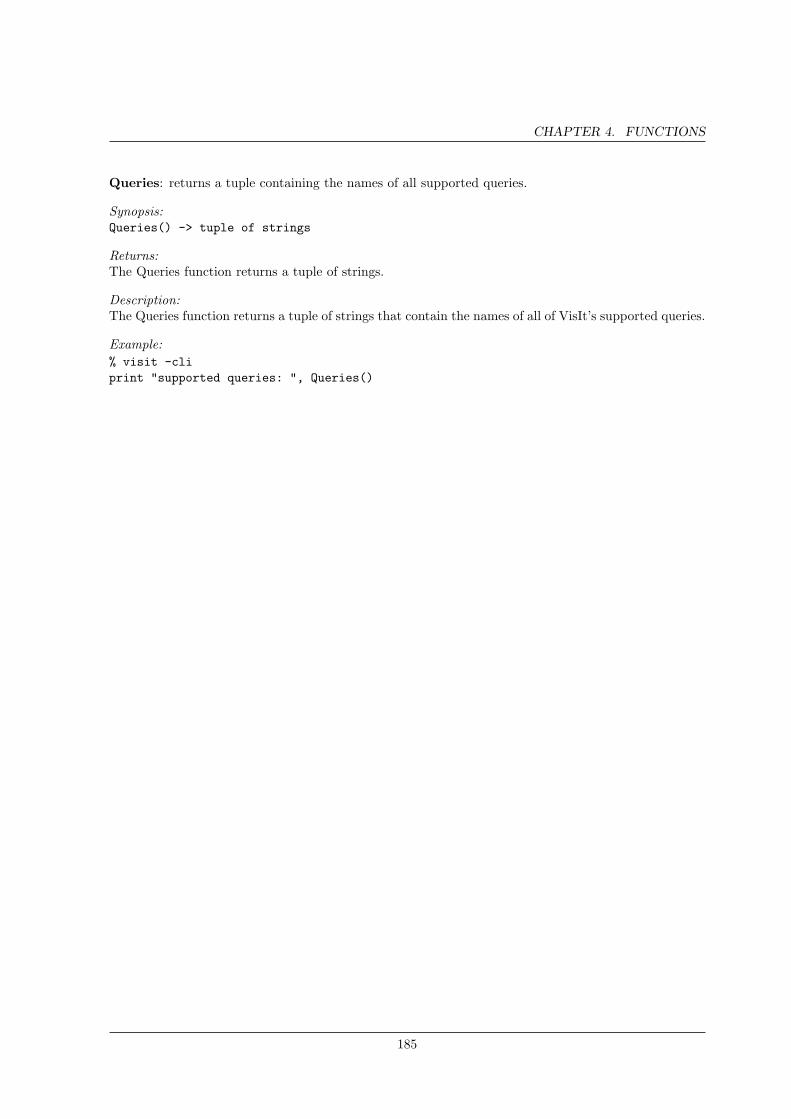
CHAPTER 4. FUNCTIONS
Queries: returns a tuple containing the names of all supported queries.
Synopsis:Queries() -> tuple of strings
Returns:The Queries function returns a tuple of strings.
Description:The Queries function returns a tuple of strings that contain the names of all of VisIt’s supported queries.
Example:% visit -cliprint "supported queries: ", Queries()
185
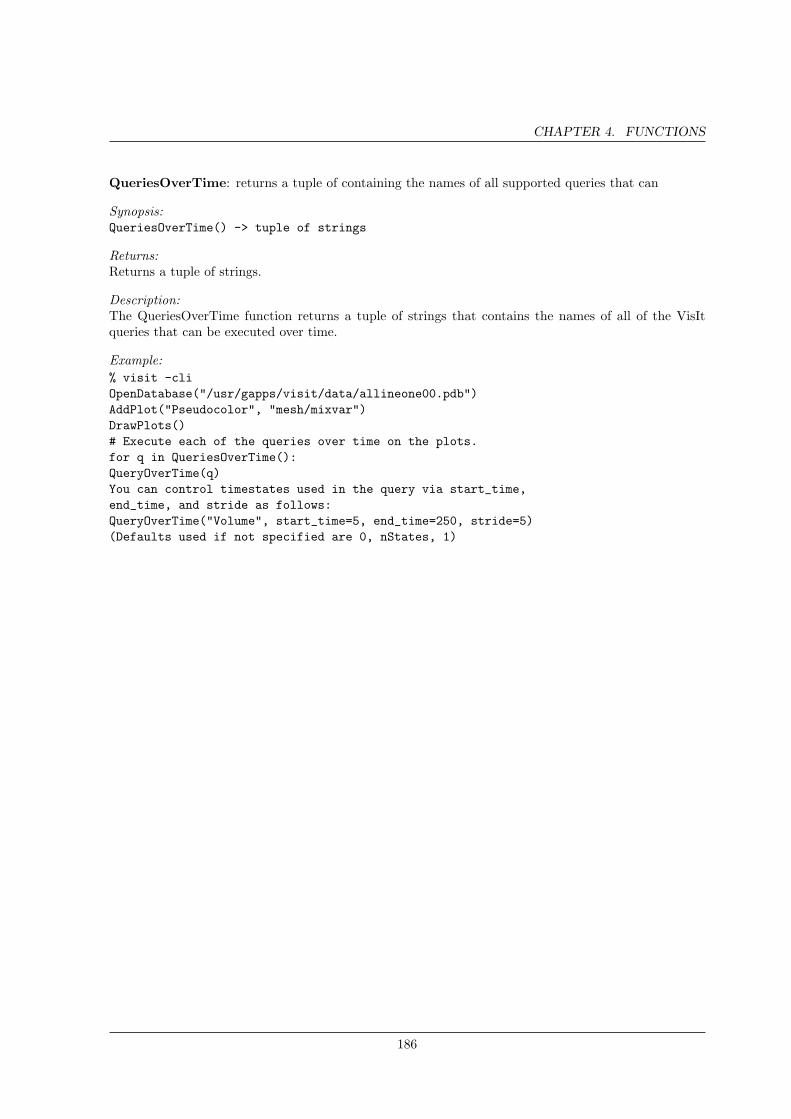
CHAPTER 4. FUNCTIONS
QueriesOverTime: returns a tuple of containing the names of all supported queries that can
Synopsis:QueriesOverTime() -> tuple of strings
Returns:Returns a tuple of strings.
Description:The QueriesOverTime function returns a tuple of strings that contains the names of all of the VisItqueries that can be executed over time.
Example:% visit -cliOpenDatabase("/usr/gapps/visit/data/allineone00.pdb")AddPlot("Pseudocolor", "mesh/mixvar")DrawPlots()# Execute each of the queries over time on the plots.for q in QueriesOverTime():QueryOverTime(q)You can control timestates used in the query via start_time,end_time, and stride as follows:QueryOverTime("Volume", start_time=5, end_time=250, stride=5)(Defaults used if not specified are 0, nStates, 1)
186
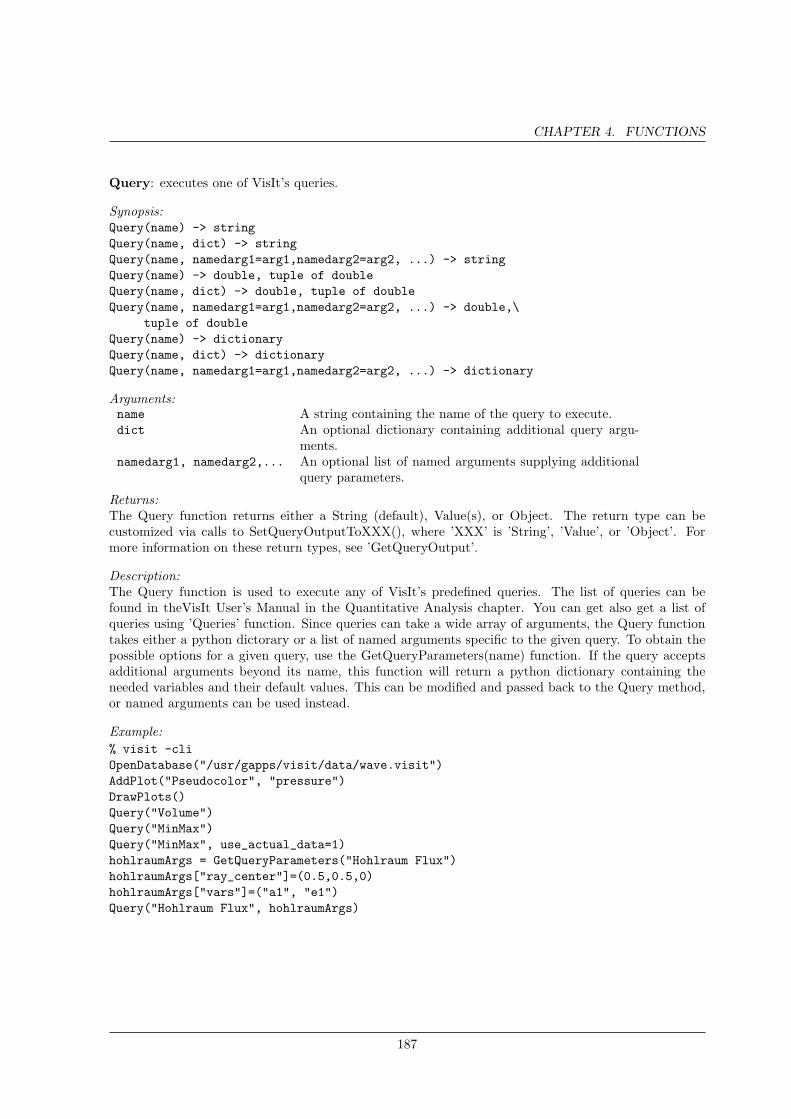
CHAPTER 4. FUNCTIONS
Query: executes one of VisIt’s queries.
Synopsis:Query(name) -> stringQuery(name, dict) -> stringQuery(name, namedarg1=arg1,namedarg2=arg2, ...) -> stringQuery(name) -> double, tuple of doubleQuery(name, dict) -> double, tuple of doubleQuery(name, namedarg1=arg1,namedarg2=arg2, ...) -> double,\
tuple of doubleQuery(name) -> dictionaryQuery(name, dict) -> dictionaryQuery(name, namedarg1=arg1,namedarg2=arg2, ...) -> dictionary
Arguments:name A string containing the name of the query to execute.dict An optional dictionary containing additional query argu-
ments.namedarg1, namedarg2,... An optional list of named arguments supplying additional
query parameters.
Returns:The Query function returns either a String (default), Value(s), or Object. The return type can becustomized via calls to SetQueryOutputToXXX(), where ’XXX’ is ’String’, ’Value’, or ’Object’. Formore information on these return types, see ’GetQueryOutput’.
Description:The Query function is used to execute any of VisIt’s predefined queries. The list of queries can befound in theVisIt User’s Manual in the Quantitative Analysis chapter. You can get also get a list ofqueries using ’Queries’ function. Since queries can take a wide array of arguments, the Query functiontakes either a python dictorary or a list of named arguments specific to the given query. To obtain thepossible options for a given query, use the GetQueryParameters(name) function. If the query acceptsadditional arguments beyond its name, this function will return a python dictionary containing theneeded variables and their default values. This can be modified and passed back to the Query method,or named arguments can be used instead.
Example:% visit -cliOpenDatabase("/usr/gapps/visit/data/wave.visit")AddPlot("Pseudocolor", "pressure")DrawPlots()Query("Volume")Query("MinMax")Query("MinMax", use_actual_data=1)hohlraumArgs = GetQueryParameters("Hohlraum Flux")hohlraumArgs["ray_center"]=(0.5,0.5,0)hohlraumArgs["vars"]=("a1", "e1")Query("Hohlraum Flux", hohlraumArgs)
187
CHAPTER 4. FUNCTIONS
QueryOverTime: executes one of VisIt’s queries over time to produce a curve.
Synopsis:QueryOverTime(name) -> integerQueryOverTime(name, dict) -> integerQueryOverTime(name, namedarg1=val1,namedarg2=val2,\
...) -> integer
Arguments:name A string containing the name of the query to execute.dict An optional dictionary containing additional query argu-
ments.namedarg1, namedarg2,... An optional list of named arguments supplying additional
query parameters.
Returns:The QueryOverTime function returns 1 on success and 0 on failure.
Description:The QueryOverTime function is used to execute any of VisIt’s predefined queries. The list of queriescan be found in the VisIt User’s Manual in the Quantitative Analysis chapter. You can get also geta list of queries that can be executed over time using ’QueriesOverTime’ function. Since queries cantake a wide array of arguments, the Query function takes either a python dictorary or a list of namedarguments specific to the given query. To obtain the possible options for a given query, use the Get-QueryParameters(name) function. If the query accepts additional arguments beyond its name, thisfunction will return a python dictionary containing the needed variables and their default values. Thiscan be modified and passed back to the QueryOverTime method, or named arguments can be usedinstead.
Example:% visit -cliOpenDatabase("/usr/gapps/visit/data/wave.visit")AddPlot("Pseudocolor", "pressure")DrawPlots()for q in QueriesOverTime():
QueryOverTime(q)ResetView()
188
CHAPTER 4. FUNCTIONS
ReOpenDatabase: reopens a database for plotting.
Synopsis:ReOpenDatabase(databaseName) -> integer
Arguments:databaseName A string containing the name of the database to open.
Returns:The ReOpenDatabase function returns an integer value of 1 for success and 0 for failure.
Description:The ReOpenDatabase function reopens a database that has been opened previously with the Open-Database function. The ReOpenDatabase function is primarily used for regenerating plots whosedatabase has been rewritten on disk. ReOpenDatabase allows VisIt to access new variables and newtime states that have been added since the database was opened using the OpenDatabase function.Note that ReOpenDatabase is expensive since it causes all plots that use the specified database to beregenerated. If you want to ensure that a time−varying database has all of its time states as theyare being created by a simulation, try the CheckForNewStates function instead. The databaseNameargument is a string containing the full name of the database to be opened. The database name is of theform: host:/path/filename. The host part of the filename can be omitted if the database to be reopenedresides on the local computer.
Example:% visit -cliOpenDatabase("edge:/usr/gapps/visit/data/wave*.silo database")AddPlot("Pseudocolor", "pressure")DrawPlots()last = TimeSliderGetNStates()for state in range(last):SetTimeSliderState(state)SaveWindow()ReOpenDatabase("edge:/usr/gapps/visit/data/wave*.silo database")for state in range(last, TimeSliderGetNStates()):SetTimeSliderState(state)SaveWindow()
189
CHAPTER 4. FUNCTIONS
ReadHostProfilesFromDirectory: reads host profiles from a specified directory.
Synopsis:ReadHostProfilesFromDirectory(directory, clear) -> integer
Arguments:directory The name of the directory that contains the host profile
XML files.clear A flag indicating whether the host profile list should cleared
first.
Returns:The ReadHostProfilesFromDirectory function returns an integer value of 1 for success and 0 for failure.
Description:The ReadHostProfilesFromDirectory provides a way to tell VisIt to load host profiles from the XML filesin a specified directory. This is needed because the machine profile for host profiles contains client/serveroptions that sometimes cannot be specified via the VisIt command line.
Example:ReadHostProfilesFromDirectory("/usr/gapps/visit/2.8.2/linux-x86_64/resources/hosts/llnl", 1)
190
CHAPTER 4. FUNCTIONS
RecenterView: recalculates the view for the active visualization window so that its
Synopsis:RecenterView() -> integer
Returns:The RecenterView function returns 1 on success and 0 on failure.
Description:After adding plots to a visualization window or applying operators to those plots, it is sometimes nec-essary to recenter the view. When the view is recentered, the orientation does not change but the viewis shifted to make better use of the screen.
Example:OpenDatabase("/usr/gapps/visit/data/globe.silo")AddPlot("Pseudocolor", "u")DrawPlots()OpenDatabase("/usr/gapps/visit/data/curv3d.silo")AddPlot("Pseudocolor", "d")DrawPlots()RecenterView()
191
CHAPTER 4. FUNCTIONS
RedoView: restores a view that has been undone with UndoView.
Synopsis:RedoView() -> integer
Returns:The RedoView function returns 1 on success and 0 on failure.
Description:When the view changes in the visualization window, it puts the old view on a stack of views. VisItprovides the UndoView function that lets you undo view changes. The RedoView function re−appliesany views that have been undone by the UndoView function.
Example:% visit -cliOpenDatabase("/usr/gapps/visit/data/curv2d.silo")AddPlot("Subset", "mat1")DrawPlots()v = GetView2D()v.windowCoords = (-2.3,2.4,0.2,4.9)SetView2D(v)UndoView()RedoView()
192
CHAPTER 4. FUNCTIONS
RedrawWindow: enables redraws and forces the active visualization window to redraw.
Synopsis:RedrawWindow() -> integer
Returns:The RedrawWindow function returns 1 on success and 0 on failure.
Description:The RedrawWindow function allows a visualization window to redraw itself and then forces the windowto redraw. This function does the opposite of the DisableRedraw function and is used to recover from it.
Example:% visit -cliOpenDatabase("/usr/gapps/visit/data/globe.silo")AddPlot("Contour", "u")AddPlot("Pseudocolor", "w")DrawPlots()DisableRedraw()AddOperator("Slice")# Set the slice operator attributes# Redraw now that the operator attributes are set. This will# prevent 1 redraw.RedrawWindow()
193
CHAPTER 4. FUNCTIONS
RegisterCallback: register a user-defined callback function that gets called when a state object changesor when an rpc is called.
Synopsis:RegisterCallback(callbackname, callback) --> integer
Arguments:callbackname A string object designating the callback that we’re in-
stalling. Allowable values are returned by the GetCallback-Names() function.
callback A Python function, typically with one argument by whichVisIt passes the object that caused the callback to be called.
Returns:RegisterCallback returns 1 on success.
Description:The RegisterCallback function is used to associate a user−defined callback function with the updatingof a state object or execution of a particular rpc
Example:import visitdef print_sliceatts(atts):
print "SLICEATTS=", attsvisit.RegisterCallback("SliceAttributes", print_sliceatts)
194
CHAPTER 4. FUNCTIONS
RegisterMacro: associates a user-defined Python function with a macro name.
Synopsis:RegisterMacro(name, callable)
Arguments:name A string containing the name of the macro.callable A Python function that will be associated with the macro
name.
Returns:The RegisterMacro function does not return a value.
Description:The RegisterMacro function lets you associate a Python function with a name so when VisIt’s gui callsdown into Python to execute a macro, it ends up executing the registered Python function. Macroslet users define complex new behaviors using Python functions yet still call them simply by clicking abutton within VisIt’s gui. When a new macro function is registered, a message is sent to the gui thatadds the known macros as buttons in the Macros window.
Example:def SetupMyPlots():
OpenDatabase(’noise.silo’)AddPlot(’Pseudocolor’, ’hardyglobal’)DrawPlots()
RegisterMacro(’Setup My Plots’, SetupMyPlots)
195
CHAPTER 4. FUNCTIONS
RemoveAllOperators: removes operators from plots.
Synopsis:RemoveAllOperators() -> integerRemoveAllOperators(all) -> integerRemoveLastOperator() -> integerRemoveLastOperator(all) -> integerRemoveOperator(index) -> integerRemoveOperator(index, all) -> integer
Arguments:all An optional integer argument that tells the function to ig-
nore the active plots and use all plots in the plot list if thevalue of the argument is non−zero.
index The zero−based integer index into a plot’s operator list thatspecifies which operator is to be deleted.
Returns:All functions return an integer value of 1 for success and 0 for failure.
Description:The RemoveOperator functions allow operators to be removed from plots. The RemoveLastOperatorfunction removes the operator that was last applied to the active plots. The RemoveAllOperators func-tion removes all operators from the active plots in the active visualization window. If the all argumentis provided and contains a non−zero value, all plots in the active visualization window are affected. Ifthe value is zero or if the argument is not provided, only the active plots are affected.
Example:% visit -cliOpenDatabase("/usr/gapps/visit/data/globe.silo")AddPlot("Pseudocolor", "u")AddOperator("Threshold")AddOperator("Slice")AddOperator("SphereSlice")DrawPlots()RemoveLastOperator() # Remove SphereSliceRemoveOperator(0) # Remove ThresholdRemoveAllOperators() # Remove the rest of the operators
196
CHAPTER 4. FUNCTIONS
RemoveLastOperator: removes operators from plots.
Synopsis:RemoveAllOperators() -> integerRemoveAllOperators(all) -> integerRemoveLastOperator() -> integerRemoveLastOperator(all) -> integerRemoveOperator(index) -> integerRemoveOperator(index, all) -> integer
Arguments:all An optional integer argument that tells the function to ig-
nore the active plots and use all plots in the plot list if thevalue of the argument is non−zero.
index The zero−based integer index into a plot’s operator list thatspecifies which operator is to be deleted.
Returns:All functions return an integer value of 1 for success and 0 for failure.
Description:The RemoveOperator functions allow operators to be removed from plots. The RemoveLastOperatorfunction removes the operator that was last applied to the active plots. The RemoveAllOperators func-tion removes all operators from the active plots in the active visualization window. If the all argumentis provided and contains a non−zero value, all plots in the active visualization window are affected. Ifthe value is zero or if the argument is not provided, only the active plots are affected.
Example:% visit -cliOpenDatabase("/usr/gapps/visit/data/globe.silo")AddPlot("Pseudocolor", "u")AddOperator("Threshold")AddOperator("Slice")AddOperator("SphereSlice")DrawPlots()RemoveLastOperator() # Remove SphereSliceRemoveOperator(0) # Remove ThresholdRemoveAllOperators() # Remove the rest of the operators
197
CHAPTER 4. FUNCTIONS
RemoveMachineProfile: ¡description¿
Synopsis:RemoveMachineProfile(hostname) -> integer
Arguments:hostname
Description:Removes machine profile with hostname from HostProfileList
198
CHAPTER 4. FUNCTIONS
RemoveOperator: removes operators from plots.
Synopsis:RemoveAllOperators() -> integerRemoveAllOperators(all) -> integerRemoveLastOperator() -> integerRemoveLastOperator(all) -> integerRemoveOperator(index) -> integerRemoveOperator(index, all) -> integer
Arguments:all An optional integer argument that tells the function to ig-
nore the active plots and use all plots in the plot list if thevalue of the argument is non−zero.
index The zero−based integer index into a plot’s operator list thatspecifies which operator is to be deleted.
Returns:All functions return an integer value of 1 for success and 0 for failure.
Description:The RemoveOperator functions allow operators to be removed from plots. The RemoveLastOperatorfunction removes the operator that was last applied to the active plots. The RemoveAllOperators func-tion removes all operators from the active plots in the active visualization window. If the all argumentis provided and contains a non−zero value, all plots in the active visualization window are affected. Ifthe value is zero or if the argument is not provided, only the active plots are affected.
Example:% visit -cliOpenDatabase("/usr/gapps/visit/data/globe.silo")AddPlot("Pseudocolor", "u")AddOperator("Threshold")AddOperator("Slice")AddOperator("SphereSlice")DrawPlots()RemoveLastOperator() # Remove SphereSliceRemoveOperator(0) # Remove ThresholdRemoveAllOperators() # Remove the rest of the operators
199
CHAPTER 4. FUNCTIONS
RenamePickLabel: let the user rename the pick label to provide a more descriptive string.
Synopsis:RenamePickLabel(oldLabel, newLabel) -> integer
Arguments:oldLabel The old pick label to replace. (e.g. ’A’, ’B’).newLabel A new label to display in place of the old label.
Returns:The RenamePickLabel function returns 1 on success and 0 on failure.
Description:The RenamePickLabel function can be used to replace an automatically generated pick label such as’A’ with a user−defined string.
Example:RenamePickLabel(’A’, ’Point of interest’)
200
CHAPTER 4. FUNCTIONS
ReplaceDatabase: replaces the database in the current plots with a new database.
Synopsis:ReplaceDatabase(databaseName) -> integerReplaceDatabase(databaseName, timeState) -> integer
Arguments:databaseName A string containing the name of the new database.timeState A zero−based integer containing the time state that should
be made active once the database has been replaced.
Returns:The ReplaceDatabase function returns an integer value of 1 for success and 0 for failure.
Description:The ReplaceDatabase function replaces the database in the current plots with a new database. Thisis one way of switching timesteps if no ”.visit” file was ever created. If two databases have the samevariable name then replace is usually a success. In the case where the new database does not have thedesired variable, the plot with the variable not contained in the new database does not get regeneratedwith the new database.
Example:% visit -cliOpenDatabase("/usr/gapps/visit/data/globe.silo)AddPlot("Pseudocolor", "u")DrawPlots()ReplaceDatabase("/usr/gapps/visit/data/curv3d.silo")SaveWindow()# Replace with a time-varying database and change the time# state to 17.ReplaceDatabase("/usr/gapps/visit/data/wave.visit", 17)
201

CHAPTER 4. FUNCTIONS
ResetLineoutColor: resets the color used by lineout to the first color.
Synopsis:ResetLineoutColor() -> integer
Returns:ResetLineoutColor returns 1 on success and 0 on failure.
Description:Lineouts on VisIt cause reference lines to be drawn over the plot where the lineout was being extracted.Each reference line uses a different color in a discrete color table. Once the colors in the discrete colortable are used up, the reference lines start using the color from the start of the discrete color table andso on. ResetLineoutColor forces reference lines to start using the color at the start of the discrete colortable again thus resetting the lineout color.
202
CHAPTER 4. FUNCTIONS
ResetOperatorOptions: resets operator attributes back to the default values.
Synopsis:ResetOperatorOptions(operatorType) -> integerResetOperatorOptions(operatorType, all) -> integer
Arguments:operatorType A string containing the name of a valid operator type.all An optional integer argument that tells the function to reset
the operator options for all plots regardless of whether ornot they are active.
Returns:The ResetOperatorOptions function returns an integer value of 1 for success and 0 for failure.
Description:The ResetOperatorOptions function resets the operator attributes of the specified operator type forthe active plots back to the default values. The operatorType argument is a string containing thename of the type of operator whose attributes are to be reset. The all argument is an optional flagthat tells the function to reset the operator attributes for the indicated operator in all plots regard-less of whether the plots are active. When non−zero values are passed for the all argument, all plotsare reset. When the all argument is zero or not provided, only the operators on active plots are modified.
Example:% visit -cliOpenDatabase("/usr/gapps/visit/data/globe.silo")AddPlot("Pseudocolor", "u")DrawPlots()AddOperator("Slice")a = SliceAttributes()a.normal,a.upAxis = (0,0,1),(0,1,0)SetOperatorOptions(a)ResetOperatorOptions("Slice")
203
CHAPTER 4. FUNCTIONS
ResetPickLetter: resets the pick marker letter back to ”A”.
Synopsis:ResetPickLetter() -> integer
Returns:ResetPickLetter returns 1 on success and 0 on failure.
Description:The ResetPickLetter function resets the pick marker back to ”A” so that the next pick will use ”A” asthe pick letter and then ”B” and so on.
204
CHAPTER 4. FUNCTIONS
ResetPlotOptions: resets plot attributes back to the default values.
Synopsis:ResetPlotOptions(plotType) -> integer
Arguments:plotType A string containing the name of the plot type.
Returns:The ResetPlotOptions function returns an integer value of 1 for success and 0 for failure.
Description:The ResetPlotOptions function resets the plot attributes of the specified plot type for the active plotsback to the default values. The plotType argument is a string containing the name of the type of plotwhose attributes are to be reset.
Example:% visit -cliOpenDatabase("/usr/gapps/visit/data/globe.silo")AddPlot("Pseudocolor", "u")DrawPlots()p = PseudocolorAttributes()p.colorTableName = "calewhite"p.minFlag,p.maxFlag = 1,1p.min,p.max = -5.0, 8.0SetPlotOptions(p)ResetPlotOptions("Pseudocolor")
205
CHAPTER 4. FUNCTIONS
ResetView: resets the view to the initial view
Synopsis:ResetView() -> integer
Returns:The ResetView function returns 1 on success and 0 on failure.
Description:The ResetView function resets the camera to the initial view.
Example:% visit -cliOpenDatabase("/usr/gapps/visit/data/curv3d.silo")AddPlot("Mesh", "curvmesh3d")v = ViewAttributes()v.camera = (-0.45396, 0.401908, 0.79523)v.focus = (0, 2.5, 15)v.viewUp = (0.109387, 0.910879, -0.397913)v.viewAngle = 30v.setScale = 1v.parallelScale = 16.0078v.nearPlane = -32.0156v.farPlane = 32.0156v.perspective = 1SetView3D(v) # Set the 3D viewDrawPlots()ResetView()
206
CHAPTER 4. FUNCTIONS
ResizeWindow: resizes a vis window.
Synopsis:ResizeWindow(win, w, h) -> integer
Arguments:win The id of the window to be moved [1..16].w The new width for the window.h The new height for the window.
Returns:ResizeWindow returns 1 on success and 0 on failure.
Description:ResizeWindow resizes a visualization window.
Example:% visit -cliResizeWindow(1, 300, 600)
207
CHAPTER 4. FUNCTIONS
RestoreSession: restores a VisIt session.
Synopsis:RestoreSession(filename, visitDir) -> integerRestoreSessionWithDifferentSources(filename, visitDir,\
tuple of strings) -> integer
Arguments:filename The name of the session file to restore.visitDir An integer flag that indicates whether the filename to be
restored is located in the user’s VisIt directory. If the flagis set to 1 then the session file is assumed to be locatedin the user’s VisIt directory otherwise the filename mustcontain an absolute path. tuple of strings A tuple of stringsrepresenting the maping from sources as specified in theoriginal session file to new sources. Sources in the originalsession file are numbered starting from 0. So, this tupleof strings simply contains the new names for each of thesources, in order.
Returns:RestoreSession returns 1 on success and 0 on failure.
Description:The RestoreSession function is important for setting up complex visualizations because you can designa VisIt session file, which is an XML file that describes exactly how plots are set up, using the VisItGUI and then use that same session file in the CLI to generate movies in batch. The RestoreSessionfunction takes 2 arguments. The first argument specifies the filename that contains the VisIt session tobe restored. The second argument determines whether the session file is assumed to be in the user’sVisIt directory. If the visitDir argument is set to 0 then the filename argument must contain the absolutepath to the session file.
Example:% visit -cli# Restore my session file for a time-varying database from# my .visit directory.RestoreSessionFile("visit.session", 1)for state in range(TimeSliderGetNStates()):SetTimeSliderState(state)SaveWindow()
208
CHAPTER 4. FUNCTIONS
RestoreSessionWithDifferentSources: restores a VisIt session.
Synopsis:RestoreSession(filename, visitDir) -> integerRestoreSessionWithDifferentSources(filename, visitDir,\
tuple of strings) -> integer
Arguments:filename The name of the session file to restore.visitDir An integer flag that indicates whether the filename to be
restored is located in the user’s VisIt directory. If the flagis set to 1 then the session file is assumed to be locatedin the user’s VisIt directory otherwise the filename mustcontain an absolute path. tuple of strings A tuple of stringsrepresenting the maping from sources as specified in theoriginal session file to new sources. Sources in the originalsession file are numbered starting from 0. So, this tupleof strings simply contains the new names for each of thesources, in order.
Returns:RestoreSession returns 1 on success and 0 on failure.
Description:The RestoreSession function is important for setting up complex visualizations because you can designa VisIt session file, which is an XML file that describes exactly how plots are set up, using the VisItGUI and then use that same session file in the CLI to generate movies in batch. The RestoreSessionfunction takes 2 arguments. The first argument specifies the filename that contains the VisIt session tobe restored. The second argument determines whether the session file is assumed to be in the user’sVisIt directory. If the visitDir argument is set to 0 then the filename argument must contain the absolutepath to the session file.
Example:% visit -cli# Restore my session file for a time-varying database from# my .visit directory.RestoreSessionFile("visit.session", 1)for state in range(TimeSliderGetNStates()):SetTimeSliderState(state)SaveWindow()
209
CHAPTER 4. FUNCTIONS
SaveAttribute: loads or saves a single attribute to/from an XML file.
Synopsis:LoadAttribute(filename, object)SaveAttribute(filename, object)
Arguments:filename The name of the XML file to load the attribute from or
save the attribute to.object The object to load or save.
Returns:success or failure
Description:The LoadAttribute and SaveAttribute methods save a single attribute, such as a current plot or operatorpython object, to a standalone XML file. Note that LoadAttribute requires that the target attributealready be created by other means; it fills, but does not create, the attribute.
Example:% visit -clia = MeshPlotAttributes()SaveAttribute(’mesh.xml’, a)b = MeshPlotAttributes()LoadAttribute(’mesh.xml’, b)
210
CHAPTER 4. FUNCTIONS
SaveNamedSelection: saves a named selection from the active plot to a file.
Synopsis:SaveNamedSelection(name) -> integer
Arguments:name The name of a named selection.
Returns:The SaveNamedSelection function returns 1 for success and 0 for failure.
Description:Named Selections allow you to select a group of elements (or particles). One typically creates a namedselection from a group of elements and then later applies the named selection to another plot (thusreducing the set of elements displayed to the ones from when the named selection was created). Namedselections only last for the current session. If you create a named selection that you want to use overand over, you can save it to a file with the SaveNamedSelection function.
Example:% visit -clidb = "/usr/gapps/visit/data/wave*.silo database"OpenDatabase(db)AddPlot("Pseudocolor", "pressure")AddOperator("Clip")c = ClipAttributes()c.plane1Origin = (0,0.6,0)c.plane1Normal = (0,-1,0)SetOperatorOption(c)DrawPlots()CreateNamedSelection("els_above_at_time_0")SaveNamedSelection("els_above_at_time_0")
211
CHAPTER 4. FUNCTIONS
SaveSession: tells VisIt to save a session file describing the current visualization.
Synopsis:SaveSession(filename) -> integer
Arguments:filename The filename argument is the filename that is used to save
the session file. The filename is relative to the current work-ing directory.
Returns:The SaveSession function returns 1 on success and 0 on failure.
Description:The SaveSession function tells VisIt to save an XML session file that describes everything about thecurrent visualization. Session files are very useful for creating movies and also as shortcuts for settingup complex visualizations.
Example:% visit -cliOpenDatabase("/usr/gapps/visit/data/noise.silo")# Set up a keyframe animation of view and save a session file of it.k = GetKeyframeAttributes()k.enabled,k.nFrames,k.nFramesWasUserSet = 1,20,1SetKeyframeAttributes(k)AddPlot("Surface", "hgslice")DrawPlots()v = GetView3D()v.viewNormal = (0.40823, -0.826468, 0.387684)v.viewUp, v.imageZoom = (-0.261942, 0.300775, 0.917017), 1.60684SetView3D(v)SetViewKeyframe()SetTimeSliderState(TimeSliderGetNStates() - 1)v.viewNormal = (-0.291901, -0.435608, 0.851492)v.viewUp = (0.516969, 0.677156, 0.523644)SetView3D(v)SetViewKeyframe()ToggleCameraViewMode()SaveSession("~/.visit/keyframe.session")
212
CHAPTER 4. FUNCTIONS
SaveWindow: save the contents of the active window
Synopsis:SaveWindow() -> string
Returns:The SaveWindow function returns a string containing the name of the file that was saved.
Description:The SaveWindow function saves the contents of the active visualization window. The format of the savedwindow is dictated by the SaveWindowAttributes which can be set using the SetSaveWindowAttributesfunction. The contents of the active visualization window can be saved as TIFF, JPEG, RGB, PPM,PNG images or they can be saved as curve, Alias Wavefront Obj, or VTK geometry files.
Example:% visit -cliOpenDatabase("/usr/gapps/visit/data/curv3d.silo")AddPlot("Pseudocolor", "d")DrawPlots()# Set the save window attributes.s = SaveWindowAttributes()s.fileName = "test"s.format = s.JPEGs.progressive = 1s.fileName = "test"SetSaveWindowAttributes(s)name = SaveWindow()print "name = %s" % name
213
CHAPTER 4. FUNCTIONS
SendSimulationCommand: sends a command to an active simulation.
Synopsis:SendSimulationCommand(host, simulation, command)SendSimulationCommand(host, simulation, command, argument)
Arguments:host The name of the computer where the simulation is running.simulation The name of the simulation being processed at the specified
host.command The command to send to the simulation.argument An argument to the command.
Returns:The SendSimulationCommand method does not return a value.
Description:The SendSimulationCommand method tells the viewer to send a command to a simulation that is run-ning on the specified host. The host argument is a string that contains the name of the computer wherethe simulation is running. The simulation argument is a string that contains the name of the simulationto send the command to.
214
CHAPTER 4. FUNCTIONS
SetActiveContinuousColorTable: sets the color table that is used by plots that use a ”default” color
Synopsis:SetActiveContinuousColorTable(name) -> integerSetActiveDiscreteColorTable(name) -> integer
Arguments:name The name of the color table to use for the active color table.
The name must be present in the tuple returned by theColorTableNames function.
Returns:Both functions return 1 on success and 0 on failure.
Description:VisIt supports two flavors of color tables: continuous and discrete. Both types of color tables have thesame underlying representation but each type of color table is used a slightly different way. Continuouscolor tables are made of a small number of color control points and the gaps in the color table betweentwo color control points are filled by interpolating the colors of the color control points. Discrete colortables do not use any kind of interpolation and like continuous color tables, they are made up of controlpoints. The color control points in a discrete color table repeat infinitely such that if we have 4 colorcontrol points: A, B, C, D then the pattern of repetition is: ABCDABCDABCD... Discrete color tablesare mainly used for plots that have a discrete set of items to display (e.g. Subset plot). Continuouscolor tables are used in plots that display a continuous range of values (e.g. Pseudocolor).
Example:% visit -cliOpenDatabase("/usr/gapps/visit/data/noise.silo")AddPlot("Contour", "hgslice")DrawPlots()SetActiveDiscreteColorTable("levels")
215

CHAPTER 4. FUNCTIONS
SetActiveDiscreteColorTable: sets the color table that is used by plots that use a ”default” color
Synopsis:SetActiveContinuousColorTable(name) -> integerSetActiveDiscreteColorTable(name) -> integer
Arguments:name The name of the color table to use for the active color table.
The name must be present in the tuple returned by theColorTableNames function.
Returns:Both functions return 1 on success and 0 on failure.
Description:VisIt supports two flavors of color tables: continuous and discrete. Both types of color tables have thesame underlying representation but each type of color table is used a slightly different way. Continuouscolor tables are made of a small number of color control points and the gaps in the color table betweentwo color control points are filled by interpolating the colors of the color control points. Discrete colortables do not use any kind of interpolation and like continuous color tables, they are made up of controlpoints. The color control points in a discrete color table repeat infinitely such that if we have 4 colorcontrol points: A, B, C, D then the pattern of repetition is: ABCDABCDABCD... Discrete color tablesare mainly used for plots that have a discrete set of items to display (e.g. Subset plot). Continuouscolor tables are used in plots that display a continuous range of values (e.g. Pseudocolor).
Example:% visit -cliOpenDatabase("/usr/gapps/visit/data/noise.silo")AddPlot("Contour", "hgslice")DrawPlots()SetActiveDiscreteColorTable("levels")
216
CHAPTER 4. FUNCTIONS
SetActivePlots: sets the active plots in the plot list.
Synopsis:SetActivePlots(plots) -> integer
Arguments:plots A tuple of integer plot indices starting at zero. A single
integer is also accepted
Returns:The SetActivePlots function returns an integer value of 1 for success and 0 for failure.
Description:Any time VisIt sets the attributes for a plot, it only sets the attributes for plots which are active. TheSetActivePlots function must be called to set the active plots. The function takes one argument whichis a tuple of integer plot indices that start at zero. If only one plot is being selected, the plots argumentcan be an integer instead of a tuple.
Example:% visit -cliOpenDatabase("/usr/gapps/visit/data/globe.silo")AddPlot("Subset", "mat1")AddPlot("Mesh", "mesh1")AddPlot("Contour", "u")DrawPlots()SetActivePlots((0,1,2)) # Make all plots activeSetActivePlots(0) # Make only the Subset plot active
217
CHAPTER 4. FUNCTIONS
SetActiveTimeSlider: sets the active time slider.
Synopsis:SetActiveTimeSlider(tsName) -> integer
Arguments:tsName A string containing the name of the time slider that should
be made active.
Returns:SetActiveTimeSlider returns 1 on success and 0 on failure.
Description:Sets the active time slider, which is the time slider that is used to change time states.
Example:% visit -clipath = "/usr/gapps/visit/data/"dbs = (path + "dbA00.pdb", path + "dbB00.pdb", path + "dbC00.pdb")for db in dbs:
OpenDatabase(db)AddPlot("FilledBoundary", "material(mesh)")DrawPlots()
CreateDatabaseCorrelation("common", dbs, 1)tsNames = GetWindowInformation().timeSlidersfor ts in tsNames:
SetActiveTimeSlider(ts)for state in list(range(TimeSliderGetNStates())) + [0]:
SetTimeSliderState(state)
218
CHAPTER 4. FUNCTIONS
SetActiveWindow: sets the active visualization window.
Synopsis:SetActiveWindow(windowIndex) -> integerSetActiveWindow(windowIndex, raiseWindow) -> integer
Arguments:windowIndex An integer window index starting at 1.raiseWindow This is an optional integer argument that raises and acti-
vates the window if set to 1. If omitted, the default behavioris to raise and activate the window.
Returns:The SetActiveWindow function returns an integer value of 1 for success and 0 for failure.
Description:Most of the functions in the VisIt Python Interface operate on the contents of the active window. Ifthere is more than one window, it is very important to be able to set the active window. To set theactive window, use the SetActiveWindow function. The SetActiveWindow function takes a single inte-ger argument which is the index of the new active window. The new window index must be an integergreater than zero and less than or equal to the number of open windows.
Example:% visit -cliSetWindowLayout(2)SetActiveWindow(2)OpenDatabase("/usr/gapps/visit/data/globe.silo")AddPlot("Mesh", "mesh1")DrawPlots()
219
CHAPTER 4. FUNCTIONS
SetAnimationTimeout: sets the speed at which animations play.
Synopsis:SetAnimationTimeout(milliseconds) -> integer
Returns:The SetAnimationTimeout function returns 1 for success and 0 for failure.
Description:The SetAnimationTimeout function sets the animation timeout which is a value that governs how fastanimations play. The timeout is specified in milliseconds and has a default value of 1 millisecond. Largertimeout values decrease the speed at which animations play.
Example:%visit -cli# Play a new frame every 5 seconds.SetAnimationTimeout(5000)OpenDatabase("/usr/gapps/visit/data/wave.visit")AddPlot("Pseudocolor", "pressure")DrawPlots()# Click the play button in the toolbar
220
CHAPTER 4. FUNCTIONS
SetAnnotationAttributes: sets the annotation attributes for the active window.
Synopsis:SetAnnotationAttributes(atts) -> integerSetDefaultAnnotationAttributes(atts) -> integer
Arguments:atts An AnnotationAttributes object containing the annotation
settings.
Returns:Both functions return 1 on success and 0 on failure.
Description:The annotation settings control what bits of text are drawn in the visualization window. Among theannotations are the plot legends, database information, user information, plot axes, triad, and thebackground style and colors. Setting the annotation attributes is important for producing quality visu-alizations. The annotation settings are stored in AnnotationAttributes objects. To set the annotationattributes, first create an AnnotationAttributes object using the AnnotationAttributes function andthen pass the object to the SetAnnotationAttributes function. To set the default annotation attributes,also pass the object to the SetDefaultAnnotationAttributes function.
Example:% visit -cliOpenDatabase("/usr/gapps/visit/data/wave.visit")AddPlot("Pseudocolor", "pressure")DrawPlots()a = AnnotationAttributes()a.gradientBackgroundStyle = a.GRADIENTSTYLE_RADIALa.gradientColor1 = (0,255,255)a.gradientColor2 = (0,0,0)a.backgroundMode = a.BACKGROUNDMODE_GRADIENTSetAnnotationAttributes(a)
221
CHAPTER 4. FUNCTIONS
SetCenterOfRotation: sets the center of rotation for plots in a 3D vis window.
Synopsis:SetCenterOfRotation(x,y,z) -> integer
Arguments:x The x component of the center of rotation.y The y component of the center of rotation.z The z component of the center of rotation.
Returns:The SetCenterOfRotation function returns 1 on success and 0 on failure.
Description:The SetCenterOfRotation function sets the center of rotation for plots in a 3D visualization window.The center of rotation, is the point about which plots are rotated when you interactively spin the plotsusing the mouse. It is useful to set the center of rotation if you’ve zoomed in on any 3D plots so in theevent that you rotate the plots, the point of interest remains fixed on the screen.
Example:% visit -cliOpenDatabase("/usr/gapps/visit/data/globe.silo")AddPlot("Pseudocolor", "u")AddPlot("Mesh", "mesh1")DrawPlots()v = GetView3D()v.viewNormal = (-0.409139, 0.631025, 0.6591)v.viewUp = (0.320232, 0.775678, -0.543851)v.imageZoom = 4.8006SetCenterOfRotation(-4.755280, 6.545080, 5.877850)# Rotate the plots interactively.
222
CHAPTER 4. FUNCTIONS
SetColorTexturingEnabled: sets whether nodal values will be drawn using hardware texturing in-stead of
Synopsis:SetColorTexturingEnabled(enabled) -> integer
Arguments:enabled A integer value. Non−zero values enable color texturing
and zero disables it.
Returns:The SetColorTexturingEnabled function returns 1 on success and 0 on failure.
Description:Node−centered variables are drawn on plots such as the Pseudocolor plot such that the nodal valuelooks interpolated throughout the zone. This can be done by interpolating colors, which can producesome colors that do not appear in a color table. Alternatively, the nodal values can be mapped to atexture coordinate in a 1D texture and those values can be interpolated, with colors being selected afterinterpolating the texture coordinate. This method always uses colors that are defined in the color table.
Example:SetColorTexturingEnabled(1)
223
CHAPTER 4. FUNCTIONS
SetCreateMeshQualityExpressions: sets global attribute boolean to automatically create MeshQuality
Synopsis:SetCreateMeshQualityExpressions(val) -> integer
Arguments:val Either a zero (false) or non−zero (true) integer value to in-
dicate if Mesh Quality expressions should be automaticallycreated when a database is opened.
Returns:The SetCreateMeshQualityExpressions function returns 1 on success and 0 on failure.
Description:The SetCreateMeshQualityExpressions function sets a boolean in the global attributes indicating whetheror not Mesh Quality expressions should be automatically created. The default behavior is for the expres-sions to be created, which may slow down VisIt’s performance if there is an extraordinary large numberof meshes. Turning this feature off tells VisIt to skip automatic creation of the Mesh Quality expressions.
Example:% visit -cliSetCreateMeshQualityExpressions(1) # turn this feature onSetCreateMeshQualityExpressions(0) # turn this feature off
224
CHAPTER 4. FUNCTIONS
SetCreateTimeDerivativeExpressions: sets global attribute boolean to automatically create TimeDerivative
Synopsis:SetCreateTimeDerivativeExpressions(val) -> integer
Arguments:val Either a zero (false) or non−zero (true) integer value to
indicate if Time Derivative expressions should be automat-ically created when a database is opened.
Returns:The SetCreateTimeDerivativeExpressions function returns 1 on success and 0 on failure.
Description:The SetCreateTimeDerivativeExpressions function sets a boolean in the global attributes indicatingwhether or not Time Derivative expressions should be automatically created. The default behavior isfor the expressions to be created, which may slow down VisIt’s performance if there is an extraordinarylarge number of variables. Turning this feature off tells VisIt to skip automatic creation of the TimeDerivative expressions.
Example:% visit -cliSetCreateTimeDerivativeExpressions(1) # turn this feature onSetCreateTimeDerivativeExpressions(0) # turn this feature off
225
CHAPTER 4. FUNCTIONS
SetCreateVectorMagnitudeExpressions: sets global attribute boolean to automatically create Vec-tor Magnitude
Synopsis:SetCreateVectorMagnitudeExpressions(val) -> integer
Arguments:val Either a zero (false) or non−zero (true) integer value to
indicate if Vector magnitude expressions should be auto-matically created when a database is opened.
Returns:The SetCreateVectorMagnitudeExpressions function returns 1 on success and 0 on failure.
Description:The SetCreateVectorMagnitudeExpressions function sets a boolean in the global attributes indicatingwhether or not vector magnitude expressions should be automatically created. The default behavior isfor the expressions to be created, which may slow down VisIt’s performance if there is an extraordinarylarge number of vector variables. Turning this feature off tells VisIt to skip automatic creation of thevector magnitude expressions. expressions.
Example:% visit -cliSetCreateVectorMagnitudeExpressions(1) # turn this feature onSetCreateVectorMagnitudeExpressions(0) # turn this feature off
226
CHAPTER 4. FUNCTIONS
SetDatabaseCorrelationOptions: sets the global options for database correlations.
Synopsis:SetDatabaseCorrelationOptions(method, whenToCreate) -> integer
Arguments:method An integer that tells VisIt what default method to use when
automatically creating a database correlation. The valuemust be in the range [0,3].
whenToCreate An integer that tells VisIt when to automatically createdatabase correlations.
Returns:SetDatabaseCorrelationOptions returns 1 on success and 0 on failure.
Description:VisIt provides functions to explicitly create and alter database correlations but there are also a numberof occasions where VisIt can automatically create a database correlation. The SetDatabaseCorrela-tionOptions function allows you to tell VisIt the default correlation method to use when automaticallycreating a new database correlation and it also allows you to tell VisIt when database correlations canbe automatically created.
method Description0 IndexForIndexCorrelation1 StretchedIndexCorrelation2 TimeCorrelation3 CycleCorrelation
whenToCreate Description0 Always create database correlation1 Never create database correlation2 Create database correlation only if the new time−varying
database has the same length as another time−varyingdatabase already being used in a plot.
Example:% visit -cliOpenDatabase("/usr/gapps/visit/data/dbA00.pdb")AddPlot("FilledBoundary", "material(mesh)")DrawPlots()# Always create a stretched index correlation.SetDatabaseCorrelationOptions(1, 0)OpenDatabase("/usr/gapps/visit/data/dbB00.pdb")AddPlot("FilledBoundary", "material(mesh)")# The AddPlot caused a database correlation to be created.DrawPlots()wi = GetWindowInformation()print "Active time slider: " % wi.timeSliders[wi.activeTimeSlider]# This will set time for both databases since the database correlation isthe active time slider.SetTimeSliderState(5)
227

CHAPTER 4. FUNCTIONS
SetDebugLevel: set or Get the VisIt module’s debug level.
Synopsis:GetDebugLevel() -> integerSetDebugLevel(level)
Arguments:level A string ’1’, ’2’, ’3’, ’4’, ’5’ with an optional ’b’ suffix to
indicate whether the output should be buffered. A value of’1’ is a low debug level , which should be used to producelittle output while a value of 5 should produce a lot of debugoutput.
Returns:The GetDebugLevel function returns the debug level of the VisIt module.
Description:The GetDebugLevel and SetDebugLevel functions are used when debugging VisIt Python scripts. TheSetDebugLevel function sets the debug level for VisIt’s viewer thus it must be called before a Launchmethod. The debug level determines how much detail is written to VisIt’s execution logs when it exe-cutes. The GetDebugLevel function can be used in Python scripts to alter the behavior of the script.For instance, the debug level can be used to selectively print values to the console.
Example:% visit -cli -debug 2print "VisIt’s debug level is: %d" % GetDebugLevel()
228
CHAPTER 4. FUNCTIONS
SetDefaultAnnotationAttributes: sets the annotation attributes for the active window.
Synopsis:SetAnnotationAttributes(atts) -> integerSetDefaultAnnotationAttributes(atts) -> integer
Arguments:atts An AnnotationAttributes object containing the annotation
settings.
Returns:Both functions return 1 on success and 0 on failure.
Description:The annotation settings control what bits of text are drawn in the visualization window. Among theannotations are the plot legends, database information, user information, plot axes, triad, and thebackground style and colors. Setting the annotation attributes is important for producing quality visu-alizations. The annotation settings are stored in AnnotationAttributes objects. To set the annotationattributes, first create an AnnotationAttributes object using the AnnotationAttributes function andthen pass the object to the SetAnnotationAttributes function. To set the default annotation attributes,also pass the object to the SetDefaultAnnotationAttributes function.
Example:% visit -cliOpenDatabase("/usr/gapps/visit/data/wave.visit")AddPlot("Pseudocolor", "pressure")DrawPlots()a = AnnotationAttributes()a.gradientBackgroundStyle = a.GRADIENTSTYLE_RADIALa.gradientColor1 = (0,255,255)a.gradientColor2 = (0,0,0)a.backgroundMode = a.BACKGROUNDMODE_GRADIENTSetAnnotationAttributes(a)
229
CHAPTER 4. FUNCTIONS
SetDefaultFileOpenOptions: sets the current default options used when opening files for a
Synopsis:GetDefaultFileOpenOptions(pluginName, options) -> integer
Arguments:pluginName The name of a plugin.options A dictionary containing the new default options for that
plugin.
Returns:The SetDefaultFileOpenOptions function returns 1 on success and 0 on failure.
Description:SetDefaultFileOpenOptions sets the current options used to open new files when a specific plugin istriggered.
Example:% visit -cliOpenMDServer()opts = GetDefaultFileOpenOptions("VASP")opts["Allow multiple timesteps"] = 1SetDefaultFileOpenOptions("VASP", opts)OpenDatabase("CHGCAR")
230

CHAPTER 4. FUNCTIONS
SetDefaultInteractorAttributes: sets VisIt’s interactor attributes.
Synopsis:SetInteractorAttributes(atts) -> integerSetDefaultInteractorAttributes(atts) -> integer
Arguments:atts An InteractorAttributes object that contains the new inter-
actor attributes that you want to use.
Returns:SetInteractorAttributes returns 1 on success and 0 on failure.
Description:The SetInteractorAttributes function is used to set certain interactor properties. Interactors, can bethought of as how mouse clicks and movements are translated into actions in the vis window. To set theinteractor attributes, first get the interactor attributes using the GetInteractorAttributes function. Onceyou’ve set the object’s properties, call the SetInteractorAttributes function to make VisIt use the newinteractor attributes. The SetDefaultInteractorAttributes function sets the default interactor attributes,which are used for new visualization windows. The default interactor attributes can also be saved tothe VisIt configuration file to ensure that future VisIt sessions have the right default interactor attributes.
Example:% visit -cliia = GetInteractorAttributes()print iaia.showGuidelines = 0SetInteractorAttributes(ia)
231
CHAPTER 4. FUNCTIONS
SetDefaultMaterialAttributes: sets VisIts material interface reconstruction options.
Synopsis:SetMaterialAttributes(atts) -> integerSetDefaultMaterialAttributes(atts) -> integer
Arguments:atts A MaterialAttributes object containing the new settings.
Returns:Both functions return 1 on success and 0 on failure.
Description:The SetMaterialAttributes function takes a MaterialAttributes object and makes VisIt use the materialsettings that it contains. You use the SetMaterialAttributes function when you want to change howVisIt performs material interface reconstruction. The SetDefaultMaterialAttributes function sets thedefault material attributes, which are saved to the config file and are also used by new visualizationwindows.
Example:% visit -cliOpenDatabase("/usr/gapps/visit/data/allinone00.pdb")AddPlot("Pseudocolor", "mesh/mixvar")p = PseudocolorAttributes()p.min,p.minFlag = 4.0, 1p.max,p.maxFlag = 13.0, 1SetPlotOptions(p)DrawPlots()# Tell VisIt to always do material interface reconstruction.m = GetMaterialAttributes()m.forceMIR = 1SetMaterialAttributes(m)ClearWindow()# Redraw the plot forcing VisIt to use the mixed variable information.DrawPlots()
232

CHAPTER 4. FUNCTIONS
SetDefaultMeshManagementAttributes: returns a MeshManagementAttributes object containingVisIt’s current mesh
Synopsis:GetMeshmanagementAttributes() -> MeshmanagementAttributes object
Returns:Returns a MeshmanagementAttributes object.
Description:The GetMeshmanagementAttributes function returns a MeshmanagementAttributes object that con-tains VisIt’s current mesh discretization settings. You can set properties on the MeshManagementAt-tributes object and then pass it to SetMeshManagementAttributes to make VisIt use the new materialattributes that you’ve specified:
Example:% visit -cliOpenDatabase("/usr/gapps/visit/data/csg.silo")AddPlot("Mesh", "csgmesh")DrawPlots()# Tell VisIt to always do material interface reconstruction.mma = GetMeshManagementAttributes()mma.discretizationTolernace = (0.01, 0.025)SetMeshManagementAttributes(mma)ClearWindow()# Redraw the plot forcing VisIt to use the mixed variable information.DrawPlots()
233

CHAPTER 4. FUNCTIONS
SetDefaultOperatorOptions: sets the attributes for an operator.
Synopsis:SetOperatorOptions(atts) -> integerSetOperatorOptions(atts, operatorIndex) -> integerSetOperatorOptions(atts, operatorIndex, all) -> integerSetDefaultOperatorOptions(atts) -> integer
Arguments:atts Any type of operator attributes object.operatorIndex An optional zero−based integer that serves as an index into
the active plot’s operator list. Use this argument if youwant to set the operator attributes for a plot that has mul-tiple instances of the same type of operator. For example,if the active plot had a Transform operator followed by aSlice operator followed by another Transform operator andyou wanted to adjust the attributes of the second Trans-form operator, you would pass an operatorIndex value of2.
all An optional integer argument that tells the function to ap-ply the operator attributes to all plots containing the spec-ified operator if the value of the argument is non−zero.
Returns:All functions return an integer value of 1 for success and 0 for failure.
Description:Each operator in VisIt has a group of attributes that controls the operator. To set the attributes for anoperator, first create an operator attributes object. This is done by calling a function which is the nameof the operator plus the word ”Attributes”. For example, a Slice operator’s operator attributes objectis created and returned by the SliceAttributes function. Assign the new operator attributes object intoa variable and set its fields. After setting the desired fields in the operator attributes object, pass theobject to the SetOperatorOptions function. The SetOperatorOptions function determines the type ofoperator to which the operator attributes object applies and sets the attributes for that operator type.To set the default plot attributes, use the SetDefaultOperatorOptions function. Setting the defaultattributes ensures that all future instances of a certain operator are initialized with the new defaultvalues. Note that there is no SetOperatorOptions(atts, all) variant of this call. To set operator optionsfor all plots that have a an instance of the associated operator, you must first make all plots active withSetActivePlots() and then use the SetOperatorOptions(atts) variant.
Example:% visit -cliOpenDatabase("/usr/gapps/visit/data/globe.silo")AddPlot("Pseudocolor", "u")AddPlot("Mesh", "mesh1")AddOperator("Slice", 1) # Add the operator to both plotsa = SliceAttributes()a.normal, a.upAxis = (0,0,1), (0,1,0)# Only set the attributes for the active plot.SetOperatorOptions(a)DrawPlots()
234
CHAPTER 4. FUNCTIONS
SetDefaultPickAttributes: changes the pick settings that VisIt uses when picking on plots.
Synopsis:SetPickAttributes(atts) -> integerSetDefaultPickAttributes(atts) -> integerResetPickAttributes() -> integer
Arguments:atts A PickAttributes object containing the new pick settings.
Returns:All functions return 1 on success and 0 on failure.
Description:The SetPickAttributes function changes the pick attributes that are used when VisIt picks on plots.The pick attributes allow you to format your pick output in various ways and also allows you to selectauxiliary pick variables.
Example:OpenDatabase("/usr/gapps/visit/data/noise.silo")AddPlot("Pseudocolor", "hgslice")DrawPlots()ZonePick(coord=(-5,5,0))p = GetPickAttributes()p.showTimeStep = 0p.showMeshName = 0p.showZoneId = 0SetPickAttributes(p)ZonePick(coord=(0,5,0))
235
CHAPTER 4. FUNCTIONS
SetDefaultPlotOptions: sets plot attributes for the active plots.
Synopsis:SetPlotOptions(atts) -> integerSetDefaultPlotOptions(atts) -> integer
Arguments:atts Any type of plot attributes object.
Returns:All functions return an integer value of 1 for success and 0 for failure.
Description:Each plot in VisIt has a group of attributes that controls the appearance of the plot. To set the at-tributes for a plot, first create a plot attributes object. This is done by calling a function which is thename of the plot plus the word ”Attributes”. For example, a Pseudocolor plot’s plotattributes objectis created and returned by the PseudocolorAttributes function. Assign the new plot attributes objectinto a variable and set its fields. After setting the desired fields in the plot attributes object, pass theobject to the SetPlotOptions function. The SetPlotOptions function determines the type of plot towhich the plot attributes object applies and sets the attributes for that plot type. To set the defaultplot attributes, use the SetDefaultPlotOptions function. Setting the default attributes ensures that allfuture instances of a certain plot are initialized with the new default values.
Example:% visit -cliOpenDatabase("/usr/gapps/visit/data/globe.silo")AddPlot("Pseudocolor", "u")p = PseudocolorAttributes()p.colorTableName = "calewhite"p.minFlag,p.maxFlag = 1,1p.min,p.max = -5.0, 8.0SetPlotOptions(p)DrawPlots()
236
CHAPTER 4. FUNCTIONS
SetGlobalLineoutAttributes: sets global lineout attributes that are used for all lineouts.
Synopsis:SetGlobalLineoutAttributes(atts) -> integer
Arguments:atts A GlobalLineoutAttributes object that contains the new
settings.
Returns:The SetGlobalLineoutAttributes function returns 1 on success and 0 on failure.
Description:The SetGlobalLineoutAttributes function allows you to set global lineout options that are used in thecreation of all lineouts. You can, for example, specify the destination window and the number of samplepoints for lineouts.
Example:% visit -cliSetWindowLayout(4)OpenDatabase("/usr/gapps/visit/data/noise.silo")AddPlot("Pseudocolor", "hgslice")DrawPlots()gla = GetGlobalLineoutAttributes()gla.createWindow = 0gla.windowId = 4gla.samplingOn = 1gla.numSamples = 150SetGlobalLineoutAttributes(gla)Lineout((-5,-8), (-3.5, 8))
237
CHAPTER 4. FUNCTIONS
SetInteractorAttributes: sets VisIt’s interactor attributes.
Synopsis:SetInteractorAttributes(atts) -> integerSetDefaultInteractorAttributes(atts) -> integer
Arguments:atts An InteractorAttributes object that contains the new inter-
actor attributes that you want to use.
Returns:SetInteractorAttributes returns 1 on success and 0 on failure.
Description:The SetInteractorAttributes function is used to set certain interactor properties. Interactors, can bethought of as how mouse clicks and movements are translated into actions in the vis window. To set theinteractor attributes, first get the interactor attributes using the GetInteractorAttributes function. Onceyou’ve set the object’s properties, call the SetInteractorAttributes function to make VisIt use the newinteractor attributes. The SetDefaultInteractorAttributes function sets the default interactor attributes,which are used for new visualization windows. The default interactor attributes can also be saved tothe VisIt configuration file to ensure that future VisIt sessions have the right default interactor attributes.
Example:% visit -cliia = GetInteractorAttributes()print iaia.showGuidelines = 0SetInteractorAttributes(ia)
238
CHAPTER 4. FUNCTIONS
SetKeyframeAttributes: sets VisIt’s keyframing attributes.
Synopsis:SetKeyframeAttributes(kfAtts) -> integer
Arguments:kfAtts A KeyframeAttributes object that contains the new
keyframing attributes to use.
Returns:SetKeyframeAttributes returns 1 on success and 0 on failure.
Description:Use the SetKeyframeAttributes function when you want to change VisIt’s keyframing settings. Youmust pass a KeyframeAttributes object, which you can create using the GetKeyframeAttributes func-tion. The KeyframeAttributes object must contain the keyframing settings that you want VisIt to use.For example, you would use the SetKeyframeAttributes function if you wanted to turn on keyframingmode and set the number of animation frames.
Example:% visit -clik = GetKeyframeAttributes()print kk.enabled,k.nFrames,k.nFramesWasUserSet = 1, 100, 1SetKeyframeAttributes(k)
239
CHAPTER 4. FUNCTIONS
SetLight: returns a light object containing the attributes for a specified light.
Synopsis:SetLight(index, light) -> integer
Arguments:index A zero−based integer index into the light list. Index can
be in the range [0,7].light A LightAttributes object containing the properties to use
for the specified light.
Returns:SetLight returns 1 on success and 0 on failure.
Description:The SetLight function sets the attributes for a specific light.
Example:% visit -cliOpenDatabase("/usr/gapps/visit/data/globe.silo")AddPlot("Pseudocolor", "w")p = PseudocolorAttributes()p.colorTableName = "xray"SetPlotOptions(p)DrawPlots()InvertBackgroundColor()light = GetLight(0)print lightlight.enabledFlag = 1light.direction = (0,-1,0)light.color = (255,0,0,255)SetLight(0, light)light.color,light.direction = (0,255,0,255), (-1,0,0)SetLight(1, light)
240
CHAPTER 4. FUNCTIONS
SetMachineProfile: ¡description¿
Synopsis:SetMachineProfile(MachineProfile) -> integer
Arguments:MachineProfile
Description:Sets the input machine profile in the HostProfileList, replaces if one already exists Otherwise adds tothe list
241
CHAPTER 4. FUNCTIONS
SetMaterialAttributes: sets VisIts material interface reconstruction options.
Synopsis:SetMaterialAttributes(atts) -> integerSetDefaultMaterialAttributes(atts) -> integer
Arguments:atts A MaterialAttributes object containing the new settings.
Returns:Both functions return 1 on success and 0 on failure.
Description:The SetMaterialAttributes function takes a MaterialAttributes object and makes VisIt use the materialsettings that it contains. You use the SetMaterialAttributes function when you want to change howVisIt performs material interface reconstruction. The SetDefaultMaterialAttributes function sets thedefault material attributes, which are saved to the config file and are also used by new visualizationwindows.
Example:% visit -cliOpenDatabase("/usr/gapps/visit/data/allinone00.pdb")AddPlot("Pseudocolor", "mesh/mixvar")p = PseudocolorAttributes()p.min,p.minFlag = 4.0, 1p.max,p.maxFlag = 13.0, 1SetPlotOptions(p)DrawPlots()# Tell VisIt to always do material interface reconstruction.m = GetMaterialAttributes()m.forceMIR = 1SetMaterialAttributes(m)ClearWindow()# Redraw the plot forcing VisIt to use the mixed variable information.DrawPlots()
242

CHAPTER 4. FUNCTIONS
SetMeshManagementAttributes: returns a MeshManagementAttributes object containing VisIt’scurrent mesh
Synopsis:GetMeshmanagementAttributes() -> MeshmanagementAttributes object
Returns:Returns a MeshmanagementAttributes object.
Description:The GetMeshmanagementAttributes function returns a MeshmanagementAttributes object that con-tains VisIt’s current mesh discretization settings. You can set properties on the MeshManagementAt-tributes object and then pass it to SetMeshManagementAttributes to make VisIt use the new materialattributes that you’ve specified:
Example:% visit -cliOpenDatabase("/usr/gapps/visit/data/csg.silo")AddPlot("Mesh", "csgmesh")DrawPlots()# Tell VisIt to always do material interface reconstruction.mma = GetMeshManagementAttributes()mma.discretizationTolernace = (0.01, 0.025)SetMeshManagementAttributes(mma)ClearWindow()# Redraw the plot forcing VisIt to use the mixed variable information.DrawPlots()
243
CHAPTER 4. FUNCTIONS
SetNamedSelectionAutoApply: set whether plots that create named selections should cause theirnamed
Synopsis:SetNamedSelectionAutoApply(flag) -> integer
Arguments:flag Non−zero values turn on selection auto apply mode.
Returns:The SetNamedSelectionAutoApply function returns 1 on success and 0 on failure.
Description:Named selections are often associated with plots for their data source. When those plots update, theirnamed selections can be updated, which in turn will update any plots that use the named selection.When this mode is enabled, changes to a named selection’s originating plot will cause the selection tobe updated automatically.
Example:SetNamedSelectionAutoApply(1)
244
CHAPTER 4. FUNCTIONS
SetOperatorOptions: sets the attributes for an operator.
Synopsis:SetOperatorOptions(atts) -> integerSetOperatorOptions(atts, operatorIndex) -> integerSetOperatorOptions(atts, operatorIndex, all) -> integerSetDefaultOperatorOptions(atts) -> integer
Arguments:atts Any type of operator attributes object.operatorIndex An optional zero−based integer that serves as an index into
the active plot’s operator list. Use this argument if youwant to set the operator attributes for a plot that has mul-tiple instances of the same type of operator. For example,if the active plot had a Transform operator followed by aSlice operator followed by another Transform operator andyou wanted to adjust the attributes of the second Trans-form operator, you would pass an operatorIndex value of2.
all An optional integer argument that tells the function to ap-ply the operator attributes to all plots containing the spec-ified operator if the value of the argument is non−zero.
Returns:All functions return an integer value of 1 for success and 0 for failure.
Description:Each operator in VisIt has a group of attributes that controls the operator. To set the attributes for anoperator, first create an operator attributes object. This is done by calling a function which is the nameof the operator plus the word ”Attributes”. For example, a Slice operator’s operator attributes objectis created and returned by the SliceAttributes function. Assign the new operator attributes object intoa variable and set its fields. After setting the desired fields in the operator attributes object, pass theobject to the SetOperatorOptions function. The SetOperatorOptions function determines the type ofoperator to which the operator attributes object applies and sets the attributes for that operator type.To set the default plot attributes, use the SetDefaultOperatorOptions function. Setting the defaultattributes ensures that all future instances of a certain operator are initialized with the new defaultvalues. Note that there is no SetOperatorOptions(atts, all) variant of this call. To set operator optionsfor all plots that have a an instance of the associated operator, you must first make all plots active withSetActivePlots() and then use the SetOperatorOptions(atts) variant.
Example:% visit -cliOpenDatabase("/usr/gapps/visit/data/globe.silo")AddPlot("Pseudocolor", "u")AddPlot("Mesh", "mesh1")AddOperator("Slice", 1) # Add the operator to both plotsa = SliceAttributes()a.normal, a.upAxis = (0,0,1), (0,1,0)# Only set the attributes for the active plot.SetOperatorOptions(a)DrawPlots()
245
CHAPTER 4. FUNCTIONS
SetPickAttributes: changes the pick settings that VisIt uses when picking on plots.
Synopsis:SetPickAttributes(atts) -> integerSetDefaultPickAttributes(atts) -> integerResetPickAttributes() -> integer
Arguments:atts A PickAttributes object containing the new pick settings.
Returns:All functions return 1 on success and 0 on failure.
Description:The SetPickAttributes function changes the pick attributes that are used when VisIt picks on plots.The pick attributes allow you to format your pick output in various ways and also allows you to selectauxiliary pick variables.
Example:OpenDatabase("/usr/gapps/visit/data/noise.silo")AddPlot("Pseudocolor", "hgslice")DrawPlots()ZonePick(coord=(-5,5,0))p = GetPickAttributes()p.showTimeStep = 0p.showMeshName = 0p.showZoneId = 0SetPickAttributes(p)ZonePick(coord=(0,5,0))
246
CHAPTER 4. FUNCTIONS
SetPipelineCachingMode: sets the pipeline caching mode.
Synopsis:SetPipelineCachingMode(mode) -> integer
Returns:The SetPipelineCachingMode function returns 1 for success and 0 for failure.
Description:The SetPipelineCachingMode function turns pipeline caching on or off in the viewer. When pipelinecaching is enabled, animation timesteps are cached for fast playback. This can be a disadvantage forlarge databases or for plots with many timesteps because it increases memory consumption. In thosecases, it is often useful to disable pipeline caching so the viewer does not use as much memory. Whenthe viewer does not cache pipelines, each plot for a timestep must be recalculated each time the timestepis visited.
Example:% visit -cliSetPipelineCachingMode(0) # Disable cachingOpenDatabase("/usr/gapps/visit/data/wave.visit")AddPlot("Pseudocolor", "pressure")AddPlot("Mesh", "quadmesh")DrawPlots()for state in range(TimeSliderGetNStates()):
SetTimeSliderState(state)
247
CHAPTER 4. FUNCTIONS
SetPlotDatabaseState: sets a database keyframe for a specific plot.
Synopsis:SetPlotDatabaseState(index, frame, state)
Arguments:index A zero−based integer index that is the plot’s location in
the plot list.frame A zero−baed integer index representing the animation
frame for which we’re going to add a database keyframe.state A zero−based integer index representating the database
time state that we’re going to use at the specified animationframe.
Returns:The SetPlotDatabaseState function does not return a value.
Description:The SetPlotDatabaseState function is used when VisIt is in keyframing mode to add a database keyframefor a specific plot. VisIt uses database keyframes to determine which database state is to be used fora given animation frame. Database keyframes can be used to stop ”database time” while ”animationtime” continues forward and they can also be used to make ”database time” go in reverse, etc.
Example:% visit -cliOpenDatabase("/usr/gapps/visit/data/wave.visit")k = GetKeyframeAttributes()nFrames = 20k.enabled, k.nFrames, k.nFramesWasUserSet = 1, nFrames, 1SetKeyframeAttributes(k)AddPlot("Pseudocolor", "pressure")AddPlot("Mesh", "quadmesh")DrawPlots()# Make "database time" for the Pseudocolor plot go in reverseSetPlotDatabaseState(0, 0, 70)SetPlotDatabaseState(0, nFrames-1, 0)# Animate through the animation frames since the "Keyframe animation"time slider is active.for state in range(TimeSliderGetNStates()):
SetTimeSliderState(state)
248
CHAPTER 4. FUNCTIONS
SetPlotDescription: provide text that will be shown in the plot list instead of a plot’s usual
Synopsis:SetPlotDescription(index, description) -> integer
Arguments:index The index of the plot within the plot list.description A new description that will be shown in the plot list so the
plot can be identified readily.
Returns:The SetPlotDescription function returns 1 on success and 0 on failure.
Description:Managing many related plots can be a complex task. This function lets users provide meaningful de-scriptions for each plot so they can more easily be identified in the plot list.
Example:SetPlotDescription(0, ’Mesh for reflected pressure plot’)
249
CHAPTER 4. FUNCTIONS
SetPlotFollowsTime: set whether the active plots follow their time slider.
Synopsis:SetPlotFollowsTime(val) -> integer
Arguments:val An optional flag indicating whether the plot should follow
the time slider. The default behavior is for the plot to followthe time slider.
Returns:The function returns 1 on success and 0 on failure.
Description:SetPlotFollowsTime can let you set whether the active plot follows the time slider.
Example:SetPlotFollowsTime()
250
CHAPTER 4. FUNCTIONS
SetPlotFrameRange: sets the range of animation frames over which a plot is valid.
Synopsis:SetPlotFrameRange(index, start, end)
Arguments:index A zero−based integer representing an index into the plot
list.start A zero−based integer representing the animation frame
where the plot first appears in the visualization.end A zero−based integer representing the animation frame
where the plot disappears from the visualization.
Returns:The SetPlotFrameRange function does not return a value.
Description:The SetPlotFrameRange function sets the start and end frames for a plot when VisIt is in keyframingmode. Outside of this frame range, the plot does not appear in the visualization. By default, plots arevalid over the entire range of animation frames when they are first created. Frame ranges allow you toconstruct complex animations where plots appear and disappear dynamically.
Example:% visit -cliOpenDatabase("/usr/gapps/visit/data/wave.visit")k = GetKeyframeAttributes()nFrames = 20k.enabled, k.nFrames, k.nFramesWasUserSet = 1, nFrames, 1SetKeyframeAttributes(k)AddPlot("Pseudocolor", "pressure")AddPlot("Mesh", "quadmesh")DrawPlots()# Make the Pseudocolor plot take up the first half of the animation framesbefore it disappears.SetPlotFrameRange(0, 0, nFrames/2-1)# Make the Mesh plot take up the second half of the animation frames.SetPlotFrameRange(1, nFrames/2, nFrames-1)for state in range(TimeSliderGetNStates())SetTimeSliderState(state)SaveWindow()
251
CHAPTER 4. FUNCTIONS
SetPlotOptions: sets plot attributes for the active plots.
Synopsis:SetPlotOptions(atts) -> integerSetDefaultPlotOptions(atts) -> integer
Arguments:atts Any type of plot attributes object.
Returns:All functions return an integer value of 1 for success and 0 for failure.
Description:Each plot in VisIt has a group of attributes that controls the appearance of the plot. To set the at-tributes for a plot, first create a plot attributes object. This is done by calling a function which is thename of the plot plus the word ”Attributes”. For example, a Pseudocolor plot’s plotattributes objectis created and returned by the PseudocolorAttributes function. Assign the new plot attributes objectinto a variable and set its fields. After setting the desired fields in the plot attributes object, pass theobject to the SetPlotOptions function. The SetPlotOptions function determines the type of plot towhich the plot attributes object applies and sets the attributes for that plot type. To set the defaultplot attributes, use the SetDefaultPlotOptions function. Setting the default attributes ensures that allfuture instances of a certain plot are initialized with the new default values.
Example:% visit -cliOpenDatabase("/usr/gapps/visit/data/globe.silo")AddPlot("Pseudocolor", "u")p = PseudocolorAttributes()p.colorTableName = "calewhite"p.minFlag,p.maxFlag = 1,1p.min,p.max = -5.0, 8.0SetPlotOptions(p)DrawPlots()
252
CHAPTER 4. FUNCTIONS
SetPlotOrderToFirst: move the i’th plot in the plot list to the start of the plot list.
Synopsis:SetPlotOrderToFirst(index) -> integer
Arguments:index The index of the plot within the plot list.
Returns:The SetPlotOrderToFirst function returns 1 on success and 0 on failure.
Description:Move the i’th plot in the plot list to the start of the plot list.
Example:AddPlot(’Mesh’, ’mesh’)AddPlot(’Pseudocolor’, ’pressure’)# Make the Pseudocolor plot first in the plot listSetPlotOrderToFirst(1)
253
CHAPTER 4. FUNCTIONS
SetPlotOrderToLast: move the i’th plot in the plot list to the end of the plot list.
Synopsis:SetPlotOrderToLast(index) -> integer
Arguments:index The index of the plot within the plot list.
Returns:The SetPlotOrderToLast function returns 1 on success and 0 on failure.
Description:Move the i’th plot in the plot list to the end of the plot list.
Example:AddPlot(’Mesh’, ’mesh’)AddPlot(’Pseudocolor’, ’pressure’)# Make the Mesh plot last in the plot listSetPlotOrderToLast(0)
254
CHAPTER 4. FUNCTIONS
SetPlotSILRestriction: set the SIL restriction for the active plots.
Synopsis:SetPlotSILRestriction(silr) -> integerSetPlotSILRestriction(silr, all) -> integer
Arguments:silr A SIL restriction object.all An optional argument that tells the function if the SIL
restriction should be applied to all plots in the plot list.
Returns:The SetPlotSILRestriction function returns an integer value of 1 for success and 0 for failure.
Description:VisIt allows the user to select subsets of databases. The description of the subset is called a SubsetInclusion Lattice Restriction, or SIL restriction. The SIL restriction allows databases to be subselectedin several different ways. The VisIt Python Interface provides the SetPlotSILRestriction function toallow Python scripts to turn off portions of the plotted database. The SetPlotSILRestriction functionaccepts a SILRestriction object that contains the SIL restriction for the active plots. The optional allargument is an integer that tells the function to apply the SIL restriction to all plots when the value ofthe argument is non−zero. If the all argument is not supplied, then the SIL restriction is only appliedto the active plots.
Example:% visit -cliOpenDatabase("/usr/gapps/visit/data/multi_curv2d.silo")AddPlot("Subset", "mat1")silr = SILRestriction()silr.TurnOffSet(silr.SetsInCategory(’mat1’)[1])SetPlotSILRestriction(silr)DrawPlots()
255
CHAPTER 4. FUNCTIONS
SetPrecisionType: sets the floating-point precision used by VisIt’s pipeline.
Synopsis:SetPrecisionType(typeAsInt)SetPrecisionType(typeAsString)
Arguments:typeAsInt Precision type specified as an integer.
0 = float1 = native2 = double
typeAsStringOptions: ”float” ”native” ”double”
Returns:The SetPrecisionType function does not return a value.
Description:The SetPrecisionType function sets the floating point pecision used by VisIt’s pipeline. The functionaccepts a single argument either an integer or string representing the precision desired. 0 = ”float”, 1= ”native”, 2 = ”double”
Examples:SetPrecisionType("double")SetPrecisionType(2)
256
CHAPTER 4. FUNCTIONS
SetPreferredFileFormats: sets the list of preferred file format IDs.
Synopsis:SetPreferredFileFormats(pluginIDs) -> integer
Arguments:pluginIDs A tuple of plugin IDs to be attempted first when opening
files.
Returns:The SetPreferredFileFormats method does not return a value.
Description:The SetPreferredFileFormats method is a way to set the list of file format reader plugins which are triedbefore any others. These IDs must be full IDs, not just names, and are tried in order.
Example:SetPreferredFileFormats(’Silo_1.0’)SetPreferredFileFormats((’Silo_1.0’,’PDB_1.0’))
257
CHAPTER 4. FUNCTIONS
SetPrinterAttributes: sets the printer attributes.
Synopsis:SetPrinterAttributes(atts)
Arguments:atts A PrinterAttributes object.
Returns:The SetPrinterAttributes function does not return a value.
Description:The SetPrinterAttributes function sets the printer attributes. VisIt uses the printer attributes to deter-mine how the active visualization window should be printed. The function accepts a single argumentwhich is a PrinterAttributes object containing the printer attributes to use for future printing. VisItallows images to be printed to a network printer or to a PostScript file that can be printed later byother applications.
Example:% visit -cliOpenDatabase("/usr/gapps/visit/data/curv2d.silo")AddPlot("Surface", "v")DrawPlots()# Make it print to a file.p = PrinterAttributes()p.outputToFile = 1p.outputToFileName = "printfile"SetPrinterAttributes(p)PrintWindow()
258
CHAPTER 4. FUNCTIONS
SetQueryFloatFormat: sets the floating point format string used to generate query output.
Synopsis:SetQueryFloatFormat(format_string)
Arguments:format_string A string object that provides a printf style floating point
format.
Returns:The SetQueryFloatFormat does not return a value.
Description:The SetQueryFloatFormat method sets a printf style format string that isused by VisIt’s querys toproduce textual output.
Example:% visit -cliOpenDatabase("/usr/gapps/visit/data/rect2d.silo")AddPlot("Pseudocolor", "d")DrawPlots()# Set floating point format string.SetQueryFloatFormat("%.1f")Query("MinMax")# Set format back to default "%g".SetQueryFloatFormat("%g")Query("MinMax")
259
CHAPTER 4. FUNCTIONS
SetQueryOutputToObject: sets the query return type to ’Object’ (python dictionary).
Synopsis:SetQueryOutputToObject()
Returns:SetQueryOutputToObject does not return a value.
Description:SetQueryOutputToObject changes the return type of future Queries to the ’object’ or Python dictio-nary form. This is the same object that would be returned by calling ’GetQueryOutputObject()’ aftera Query call. All other output modes are still available after the Query call (eg GetQueryOutput-Value(),GetQueryOutputObject(), GetQueryOutputString()).
Example:% visit -cliOpenDatabase("/usr/gapps/visit/data/rect2d.silo")AddPlot("Pseudocolor", "d")DrawPlots()# Set query output type.SetQueryOutputToObject()query_output = Query("MinMax")print query_output{’min’: 0.02357020415365696, ’max’: 0.9489759802818298, ’max_element_num’: 1170, ’min_coord’: (0.4833333343267441, 0.4833333343267441), ’max_coord’: (0.01666666753590107, 1.3166666626930237), ’max_domain’: 0, ’min_element_num’: 434, ’min_domain’: 0}
260
CHAPTER 4. FUNCTIONS
SetQueryOutputToString: sets the query return type to ’String’ form.
Synopsis:SetQueryOutputToString()
Returns:SetQueryOutputToString does not return a value.
Description:SetQueryOutputToString changes the return type of future Queries to the ’string’ form. This is thesame as what would be returned by calling ’GetQueryOutputString’ after a Query call. All other outputmodes are still available after the Query call (eg GetQueryOutputValue(), GetQueryOutputObject(),GetQueryOutputString()).
Example:% visit -cliOpenDatabase("/usr/gapps/visit/data/rect2d.silo")AddPlot("Pseudocolor", "d")DrawPlots()# Set query output type.SetQueryOutputToString()query_output = Query("MinMax")print query_output’d -- Min = 0.0235702 (zone 434 at coord <0.483333, 0.483333>)d -- Max = 0.948976 (zone 1170 at coord <0.0166667, 1.31667>)’
261
CHAPTER 4. FUNCTIONS
SetQueryOutputToValue: sets the query return type to ’Value’ form.
Synopsis:SetQueryOutputToValue()
Returns:SetQueryOutputToValue does not return a value.
Description:SetQueryOutputToValue changes the return type of future Queries to the ’value’ form. This is the sameas what would be returned by calling ’GetQueryOutputValue()’ after a Query call. All other outputmodes are still available after the Query call (eg GetQueryOutputValue(), GetQueryOutputObject(),GetQueryOutputString()).
Example:% visit -cliOpenDatabase("/usr/gapps/visit/data/rect2d.silo")AddPlot("Pseudocolor", "d")DrawPlots()# Set query output type.SetQueryOutputToValue()query_output = Query("MinMax")print query_output(0.02357020415365696, 0.9489759802818298)
262
CHAPTER 4. FUNCTIONS
SetQueryOverTimeAttributes: changes the settings that VisIt uses for queries over time.
Synopsis:SetQueryOverTimeAttributes(atts) -> integerSetDefaultQueryOverTimeAttributes(atts) -> integerResetQueryOverTimeAttributes() -> integer
Arguments:atts A QueryOverTimeAttributes object containing the new set-
tings to use for queries over time.
Returns:All functions return 1 on success and 0 on failure.
Description:The SetQueryOverTimeAttributes function changes the settings that VisIt uses for query over time.The SetDefaultQueryOverTimeAttributes function changes the settings that new visualization windowsinherit for doing query over time. Finally, the ResetQueryOverTimeAttributes function forces VisIt touse the stored default query over time attributes instead of the previous settings.
Example:% visit -cliSetWindowLayout(4)OpenDatabase("/usr/gapps/visit/data/allinone00.pdb")AddPlot("Pseudocolor", "mesh/mixvar")DrawPlots()qot = GetQueryOverTimeAttributes()# Make queries over time go to window 4.qot.createWindow,q.windowId = 0, 4SetQueryOverTimeAttributes(qot)QueryOverTime("Min")# Make queries over time only use half of the number of time states.qot.endTimeFlag,qot.endTime = 1, GetDatabaseNStates() / 2SetQueryOverTimeAttributes(qot)QueryOverTime("Min")ResetView()
263
CHAPTER 4. FUNCTIONS
SetRemoveDuplicateNodes: sets global attribute boolean to automatically remove duplicate nodesfrom
Synopsis:SetRemoveDuplicateNodes(val) -> integer
Arguments:val Either a zero (false) or non−zero (true) integer value to in-
dicate if duplicate nodes in fully disconnected unstructuredgrids should be automatically removed by visit.
Returns:The SetRemoveDuplicateNodes function returns 1 on success and 0 on failure.
Description:The SetRemoveDuplicateNodes function sets a boolean in the global attributes indicating whether ornot duplicate nodes in fully disconnected unstructured grids should be automatically removed. Thedefault behavior is for the original grid to be left as read, which may slow down VisIt’s performance forextraordinary large meshes. Turning this feature off tells VisIt to remove the duplicate nodes after themesh is read, but before further processing in VisIt.
Example:% visit -cliSetRemoveDuplicateNodes(1) # turn this feature onSetRemoveDuplicateNodes(0) # turn this feature off
264
CHAPTER 4. FUNCTIONS
SetRenderingAttributes: sets global rendering attributes that control the look and feel of the
Synopsis:SetRenderingAttributes(atts) -> integer
Arguments:atts A RenderingAttributes object that contains the rendering
attributes that we want to make VisIt use.
Returns:The SetRenderingAttributes function returns 1 on success and 0 on failure.
Description:The SetRenderingAttributes makes VisIt use the rendering attributes stored in the specified Ren-deringAttributes object. The RenderingAttributes object stores rendering attributes such as: scalablerendering options, shadows, specular highlights, display lists, etc.
Example:% visit -cliOpenDatabase("/usr/gapps/visit/data/noise.silo")AddPlot("Surface", "hgslice")DrawPlots()v = GetView2D()v.viewNormal = (-0.215934, -0.454611, 0.864119)v.viewUp = (0.973938, -0.163188, 0.157523)v.imageZoom = 1.64765SetView3D(v)light = GetLight(0)light.direction = (0,1,-1)SetLight(0, light)r = GetRenderingAttributes()print rr.scalableActivationMode = r.Alwaysr.doShadowing = 1SetRenderingAttributes(r)
265
CHAPTER 4. FUNCTIONS
SetSaveWindowAttributes: set the attributes used to save windows.
Synopsis:SetSaveWindowAttributes(atts)
Arguments:atts A SaveWindowAttributes object.
Returns:The SetSaveWindowAttributes object does not return a value.
Description:The SetSaveWindowAttributes function sets the format and filename that are used to save windowswhen the SaveWindow function is called. The contents of the active visualization window can be savedas TIFF, JPEG, RGB, PPM, PNG images or they can be saved as curve, Alias Wavefront Obj, orVTK geometry files. To set the SaveWindowAttributes, create a SaveWindowAttributes object usingthe SaveWindowAttributes function and assign it into a variable. Set the fields in the object and passit to the SetSaveWindowAttributes function.
Example:% visit -cliOpenDatabase("/usr/gapps/visit/data/curv3d.silo")AddPlot("Pseudocolor", "d")DrawPlots()# Set the save window attributess = SaveWindowAttributes()s.fileName = "test"s.format = s.JPEGs.progressive = 1s.fileName = "test"SetSaveWindowAttributes(s)# Save the windowSaveWindow()
266
CHAPTER 4. FUNCTIONS
SetTimeSliderState: sets the time state for the active time slider.
Synopsis:SetTimeSliderState(state) -> integer
Arguments:state A zero−based integer containing the time state that we
want to make active.
Returns:The SetTimeSliderState function returns 1 on success and 0 on failure.
Description:The SetTimeSliderState function sets the time state for the active time slider. This is the function touse if you want to animate through time or change the current keyframe frame.
Example:% visit -clipath = "/usr/gapps/visit/data/"dbs = (path + "dbA00.pdb", path + "dbB00.pdb", path + "dbC00.pdb")for db in dbs:OpenDatabase(db)AddPlot("FilledBoundary", "material(mesh)")DrawPlots()CreateDatabaseCorrelation("common", dbs, 1)tsNames = GetWindowInformation().timeSlidersfor ts in tsNames:SetActiveTimeSlider(ts)for state in list(range(TimeSliderGetNStates())) + [0]:SetTimeSliderState(state)
267
CHAPTER 4. FUNCTIONS
SetTreatAllDBsAsTimeVarying: sets global attribute boolean to treat all databases as time varying.
Synopsis:SetTreatAllDBsAsTimeVarying(val) -> integer
Arguments:val Either a zero (false) or non−zero (true) integer value to
indicate if all databases should be treated as time varying(true) or not (false).
Returns:The SetTreatAllDBsAsTimeVarying function returns 1 on success and 0 on failure.
Description:The SetTreatAllDBsAsTimeVarying function sets a boolean in the global attributes indicating if alldatabases should be treated as time varying or not. Ordinarily, VisIt tries to minimize file I/O anddatabase interaction by avoiding re−reading metadata that is ’time−invariant’ and, therefore, assumedto be the same in a database from one time step to the next. However, sometimes, portions of themetadata, such as the list of variable names and/or number of domains, does in fact vary. In this case,VisIt can actually fail to acknowledge the existence of new variables in the file. Turning this feature onforces VisIt to re−read metadata each time the time−state is changed.
Example:% visit -cliSetTreatAllDBsAsTimeVarying(1) # turn this feature onSetTreatAllDBsAsTimeVarying(0) # turn this feature off
268
CHAPTER 4. FUNCTIONS
SetTryHarderCyclesTimes: sets global attribute boolean to force VisIt to read all cycles/times.
Synopsis:SetTryHarderCyclesTimes(val) -> integer
Arguments:val Either a zero (false) or non−zero (true) integer value to in-
dicate if VisIt read cycle/time information for all timestateswhen opening a database.
Returns:The SetTryHarderCyclesTimes function returns 1 on success and 0 on failure.
Description:For certain classes of databases, obtaining cycle/time information for all time states in the database isan expensive operation, requiring each file to be opened and queried. The cost of the operation getsworse the more time states there are in the database. Ordinarily, VisIt does not bother to query eachtime state for precise cycle/time information. In fact, often VisIt can guess this information from thefilename(s) comprising the databse. However, turning this feature on will force VisIt to obtain accuratecycle/time information for all time states by opening and querying all file(s) in the database.
Example:% visit -cliSetTryHarderCyclesTimes(1) # Turn this feature onSetTryHarderCyclesTimes(0) # Turn this feature off
269

CHAPTER 4. FUNCTIONS
SetUltraScript: set the path to the script to be used by the LoadUltra command.
Synopsis:SetUltraScript(filename) -> integer
Arguments:filename The name of the file to be used as the ultra script when
LoadUltra is called.
Returns:The SetUltraScript function returns 1.
Description:Set the path to the script to be used by the LoadUltra command. Normal users do not need to use thisfunction.
270
CHAPTER 4. FUNCTIONS
SetView2D: sets the view for the active visualization window.
Synopsis:SetViewCurve(ViewCurveAttributes) -> integerSetView2D(View2DAttributes) -> integerSetView3D(View3DAttributes) -> integerSetViewAxisArray(ViewAxisArrayAttributes) -> integer
Arguments:view A ViewAttributes object containing the view.
Returns:All functions returns 1 on success and 0 on failure.
Description:The view is a crucial part of a visualization since it determines which parts of the database are exam-ined. The VisIt Python Interface provides four functions for setting the view: SetView2D, SetView3D,SetViewCurve, and SetViewAxisArray. If the visualization window contains 2D plots, use the SetView2Dfunction. Use the SetView3D function when the visualization window contains 3D plots. Similarly forwindows containing curve or axis−array based plots. To set the view, first create the appropriateViewAttributes object and set the object’s fields to set a new view. After setting the fields, pass theobject to the matching SetView function. A common use of the SetView functions is to animate theview to produce simple animations where the camera appears to fly around the plots in the visualizationwindow. A View3D object also supports the RotateAxis(int axis, double deg) method which mimics the’rotx’, ’roty’ and ’rotz’ view commands in the GUI.
Examples:% visit -cliOpenDatabase("/usr/gapps/visit/data/globe.silo")AddPlot("Pseudocolor", "v")DrawPlots()va = GetView3D()va.RotateAxis(1,30.0) # rotate around the y axis 30 degrees.SetView3D(va)v0 = GetView3D()v1 = GetView3D()v1.camera,v1.viewUp = (1,1,1),(-1,1,-1)v1.parallelScale = 10.for i in range(0,20):t = float(i) / 19.v2 = (1. - t) * v0 + t * v1SetView3D(v2) # Animate the view.
271

CHAPTER 4. FUNCTIONS
SetView3D: sets the view for the active visualization window.
Synopsis:SetViewCurve(ViewCurveAttributes) -> integerSetView2D(View2DAttributes) -> integerSetView3D(View3DAttributes) -> integerSetViewAxisArray(ViewAxisArrayAttributes) -> integer
Arguments:view A ViewAttributes object containing the view.
Returns:All functions returns 1 on success and 0 on failure.
Description:The view is a crucial part of a visualization since it determines which parts of the database are exam-ined. The VisIt Python Interface provides four functions for setting the view: SetView2D, SetView3D,SetViewCurve, and SetViewAxisArray. If the visualization window contains 2D plots, use the SetView2Dfunction. Use the SetView3D function when the visualization window contains 3D plots. Similarly forwindows containing curve or axis−array based plots. To set the view, first create the appropriateViewAttributes object and set the object’s fields to set a new view. After setting the fields, pass theobject to the matching SetView function. A common use of the SetView functions is to animate theview to produce simple animations where the camera appears to fly around the plots in the visualizationwindow. A View3D object also supports the RotateAxis(int axis, double deg) method which mimics the’rotx’, ’roty’ and ’rotz’ view commands in the GUI.
Examples:% visit -cliOpenDatabase("/usr/gapps/visit/data/globe.silo")AddPlot("Pseudocolor", "v")DrawPlots()va = GetView3D()va.RotateAxis(1,30.0) # rotate around the y axis 30 degrees.SetView3D(va)v0 = GetView3D()v1 = GetView3D()v1.camera,v1.viewUp = (1,1,1),(-1,1,-1)v1.parallelScale = 10.for i in range(0,20):t = float(i) / 19.v2 = (1. - t) * v0 + t * v1SetView3D(v2) # Animate the view.
272

CHAPTER 4. FUNCTIONS
SetViewAxisArray: sets the view for the active visualization window.
Synopsis:SetViewCurve(ViewCurveAttributes) -> integerSetView2D(View2DAttributes) -> integerSetView3D(View3DAttributes) -> integerSetViewAxisArray(ViewAxisArrayAttributes) -> integer
Arguments:view A ViewAttributes object containing the view.
Returns:All functions returns 1 on success and 0 on failure.
Description:The view is a crucial part of a visualization since it determines which parts of the database are exam-ined. The VisIt Python Interface provides four functions for setting the view: SetView2D, SetView3D,SetViewCurve, and SetViewAxisArray. If the visualization window contains 2D plots, use the SetView2Dfunction. Use the SetView3D function when the visualization window contains 3D plots. Similarly forwindows containing curve or axis−array based plots. To set the view, first create the appropriateViewAttributes object and set the object’s fields to set a new view. After setting the fields, pass theobject to the matching SetView function. A common use of the SetView functions is to animate theview to produce simple animations where the camera appears to fly around the plots in the visualizationwindow. A View3D object also supports the RotateAxis(int axis, double deg) method which mimics the’rotx’, ’roty’ and ’rotz’ view commands in the GUI.
Examples:% visit -cliOpenDatabase("/usr/gapps/visit/data/globe.silo")AddPlot("Pseudocolor", "v")DrawPlots()va = GetView3D()va.RotateAxis(1,30.0) # rotate around the y axis 30 degrees.SetView3D(va)v0 = GetView3D()v1 = GetView3D()v1.camera,v1.viewUp = (1,1,1),(-1,1,-1)v1.parallelScale = 10.for i in range(0,20):t = float(i) / 19.v2 = (1. - t) * v0 + t * v1SetView3D(v2) # Animate the view.
273
CHAPTER 4. FUNCTIONS
SetViewCurve: sets the view for the active visualization window.
Synopsis:SetViewCurve(ViewCurveAttributes) -> integerSetView2D(View2DAttributes) -> integerSetView3D(View3DAttributes) -> integerSetViewAxisArray(ViewAxisArrayAttributes) -> integer
Arguments:view A ViewAttributes object containing the view.
Returns:All functions returns 1 on success and 0 on failure.
Description:The view is a crucial part of a visualization since it determines which parts of the database are exam-ined. The VisIt Python Interface provides four functions for setting the view: SetView2D, SetView3D,SetViewCurve, and SetViewAxisArray. If the visualization window contains 2D plots, use the SetView2Dfunction. Use the SetView3D function when the visualization window contains 3D plots. Similarly forwindows containing curve or axis−array based plots. To set the view, first create the appropriateViewAttributes object and set the object’s fields to set a new view. After setting the fields, pass theobject to the matching SetView function. A common use of the SetView functions is to animate theview to produce simple animations where the camera appears to fly around the plots in the visualizationwindow. A View3D object also supports the RotateAxis(int axis, double deg) method which mimics the’rotx’, ’roty’ and ’rotz’ view commands in the GUI.
Examples:% visit -cliOpenDatabase("/usr/gapps/visit/data/globe.silo")AddPlot("Pseudocolor", "v")DrawPlots()va = GetView3D()va.RotateAxis(1,30.0) # rotate around the y axis 30 degrees.SetView3D(va)v0 = GetView3D()v1 = GetView3D()v1.camera,v1.viewUp = (1,1,1),(-1,1,-1)v1.parallelScale = 10.for i in range(0,20):t = float(i) / 19.v2 = (1. - t) * v0 + t * v1SetView3D(v2) # Animate the view.
274
CHAPTER 4. FUNCTIONS
SetViewExtentsType: tells VisIt how to use extents when computing the view.
Synopsis:SetViewExtentsType(type) -> integer
Arguments:type An integer 0, 1 or one of the strings: ”original”, ”actual”.
Returns:SetViewExtentsType returns 1 on success and 0 on failure.
Description:VisIt can use a plot’s spatial extents in two ways when computing the view. The first way of using theextents is to use the ”original” extents, which are the spatial extents before any modifications, such assubset selection, have been made to the plot. This ensures that the view will remain relatively constantfor a plot. Alternatively, you can use the ”actual” extents, which are the spatial extents of the pieces ofthe plot that remain after operations such as subset selection.
Example:% visit -cliOpenDatabase("/usr/gapps/visit/data/globe.silo")SetViewExtentsType("actual")AddPlot("FilledBoundary", "mat1")DrawPlots()v = GetView3D()v.viewNormal = (-0.618945, 0.450655, 0.643286)v.viewUp = (0.276106, 0.891586, -0.358943)SetView3D(v)mats = GetMaterials()nmats = len(mats):# Turn off all but the last material in sequence and watch# the view update each time.for i in range(nmats-1):index = nmats-1-iTurnMaterialsOff(mats[index])SaveWindow()SetViewExtentsType("original")
275
CHAPTER 4. FUNCTIONS
SetViewKeyframe: adds a view keyframe.
Synopsis:SetViewKeyframe() -> integer
Returns:The SetViewKeyframe function returns 1 on success and 0 on failure.
Description:The SetViewKeyframe function adds a view keyframe when VisIt is in keyframing mode. View keyframesare used to set the view at crucial points during an animation. Frames that lie between view keyframeshave an interpolated view that is based on the view keyframes. You can use the SetViewKeyframe func-tion to create complex camera animations that allow you to fly around (or through) your visualization.
Example:% visit -cliOpenDatabase("/usr/gapps/visit/data/noise.silo")AddPlot("Contour", "hardyglobal")DrawPlots()k = GetKeyframeAttributes()nFrames = 20k.enabled, k.nFrames, k.nFramesWasUserSet = 1, nFrames, 1SetKeyframeAttributes(k)SetPlotFrameRange(0, 0, nFrames-1)SetViewKeyframe()SetTimeSliderState(10)v = GetView3D()v.viewNormal = (-0.721721, 0.40829, 0.558944)v.viewUp = (0.294696, 0.911913, -0.285604)SetView3D(v)SetViewKeyframe()SetTimeSliderState(nFrames-1)v.viewNormal = (-0.74872, 0.423588, -0.509894)v.viewUp = (0.369095, 0.905328, 0.210117)SetView3D()SetViewKeyframe()ToggleCameraViewMode()for state in range(TimeSliderGetNStates()):SetTimeSliderState(state)SaveWindow()
276
CHAPTER 4. FUNCTIONS
SetWindowArea: set the screen area devoted to visualization windows.
Synopsis:SetWindowArea(x, y, width, height) -> integer
Arguments:x Left X coordinate in screen pixels.y Top Y coordinate in screen pixels.width Width of the window area in pixels.height Height of the window area in pixels.
Returns:The SetWindowArea function returns 1 on success and 0 on failure.
Description:The SetWindowArea method sets the area of the screen that can be used by VisIt’s visualization win-dows. This is useful for making sure windows are a certain size when running a Python script.
Example:import visitvisit.Launch()visit.SetWindowArea(0, 0, 600, 600)visit.SetWindowLayout(4)
277
CHAPTER 4. FUNCTIONS
SetWindowLayout: sets the window layout
Synopsis:SetWindowLayout(layout) -> integer
Arguments:layout An integer that specifies the window layout. (1,2,4,8,9,16
are valid)
Returns:The SetWindowLayout function returns an integer value of 1 for success and 0 for failure.
Description:VisIt’s visualization windows can be arranged in various tiled patterns that allow VisIt to make gooduse of the screen while displaying several visualization windows. The window layout determines howwindows are shown on the screen. The SetWindowLayout function sets the window layout. The layoutargument is an integer value equal to 1,2,4,8,9, or 16.
Example:% visit -cliSetWindowLayout(2) # switch to 1x2 layoutSetWindowLayout(4) # switch to 2x2 layoutSetWindowLayout(8) # switch to 2x4 layout
278
CHAPTER 4. FUNCTIONS
SetWindowMode: sets the window mode of the active visualization window.
Synopsis:SetWindowMode(mode) -> integer
Arguments:mode A string containing the new mode: ’navigate’, ’zoom’, ’li-
neout’, ’pick’, ’zone pick’, ’node pick’, ’spreadsheet pick’.
Returns:The SetWindowMode function returns 1 on success and 0 on failure.
Description:VisIt’s visualization windows have various window modes that alter their behavior. Most of the timea visualization window is in ”navigate” mode which changes the view when the mouse is moved in thewindow. The ”zoom” mode allows a zoom rectangle to be drawn in the window for changing the view.The ”pick” mode retrieves information about the plots when the mouse is clicked in the window. The”lineout” mode allows the user to draw lines which produce curve plots.
Example:% visit -cliOpenDatabase("/usr/gapps/visit/data/curv2d.silo")AddPlot("Pseudocolor", "d")DrawPlots()SetWindowMode("zoom")# Draw a rectangle in the visualization window to zoom the plots
279
CHAPTER 4. FUNCTIONS
ShowAllWindows: tells VisIt to show its visualization windows.
Synopsis:ShowAllWindows() -> integer
Returns:The ShowAllWindows function returns 1 on success and 0 on failure.
Description:The ShowAllWindows function tells VisIt’s viewer to show all of its visualization windows. The com-mand line interface calls ShowAllWindows before giving control to any user−supplied script to ensurethat the visualization windows appear as expected. Call the ShowAllWindows function when using theVisIt module inside another Python interpreter so the visualization windows are made visible.
Example:% pythonimport visitvisit.Launch()visit.ShowAllWindows()
280
CHAPTER 4. FUNCTIONS
ShowToolbars: shows the visualization window’s toolbars.
Synopsis:ShowToolbars() -> integerShowToolbars(allWindows) ->integer
Arguments:allWindows An integer value that tells VisIt to show the toolbars for all
windows when it is non−zero.
Returns:The ShowToolbars function returns 1 on success and 0 on failure.
Description:The ShowToolbars function tells VisIt to show the toolbars for the active visualization window or forall visualization windows when the optional allWindows argument is provided and is set to a non−zerovalue.
Example:% visit -cliSetWindowLayout(4)HideToolbars(1)ShowToolbars()# Show the toolbars for all windows.ShowToolbars(1)
281
CHAPTER 4. FUNCTIONS
Source: executes the specified Python script
Synopsis:Source(filename)
Returns:The Source function does not return a value.
Description:The Source function reads in the contents of a text file and interprets it with the Python interpreter.This is a simple mechanism that allows simple scripts to be included in larger scripts. The Sourcefunction takes a single string argument that contains the name of the script to execute.
Example:% visit -cliOpenDatabase("/usr/gapps/visit/data/globe.silo")AddPlot("Pseudocolor", "u")DrawPlots()# include another script that does some animation.Source("Animate.py")
282
CHAPTER 4. FUNCTIONS
SuppressMessages: suppresses the printing of Error, Warning, Message messages
Synopsis:SuppressMessages(int level) ->integer
Arguments:int level An integer value of 1,2,3 or 4
Returns:The SuppressMessages function returns the previous suppression level on success and 0 on failure.
Description:The SuppressMessage function sets the supression level for status messages generated by VisIt. A valueof 1 suppresses all types of messages. A value of 2 suppresses Warnings and Messages but does NOTsuppress Errors. A value of 3 suppresses Messages but does not suppress Warnings or Errors. A valueof 4 does not suppress any messages. The default setting is 4.
Example:% visit -cliOpenDatabase("/usr/gapps/visit/data/rect2d.silo")AddPlot("Pseudocolor", "d")DrawPlots()# Turn off Warning and Message messages.SuppressMessages(2)SaveWindow()
283

CHAPTER 4. FUNCTIONS
SuppressQueryOutputOff: suppresses the printing of QueryOutput
Synopsis:SuppressQueryOutputOn() ->integerSuppressQueryOutputOff() ->integer
Arguments:None
Returns:The SuppressQueryOutput function returns 1 on success and 0 on failure.
Description:The SuppressQueryOutput function tells VisIt to turn on/off the automatic printing of query output.Query output will still be available via GetQueryOutputString and GetQueryOutputValue.
Example:% visit -cliOpenDatabase("/usr/gapps/visit/data/rect2d.silo")AddPlot("Pseudocolor", "d")DrawPlots()# Turn off automatic printing of Query output.SuppressQueryOutputOn()Query("MinMax")print "The min is: %g and the max is: %g" % GetQueryOutputValue()# Turn on automatic printing of Query output.SuppressQueryOutputOff()Query("MinMax")
284
CHAPTER 4. FUNCTIONS
SuppressQueryOutputOn: suppresses the printing of QueryOutput
Synopsis:SuppressQueryOutputOn() ->integerSuppressQueryOutputOff() ->integer
Arguments:None
Returns:The SuppressQueryOutput function returns 1 on success and 0 on failure.
Description:The SuppressQueryOutput function tells VisIt to turn on/off the automatic printing of query output.Query output will still be available via GetQueryOutputString and GetQueryOutputValue.
Example:% visit -cliOpenDatabase("/usr/gapps/visit/data/rect2d.silo")AddPlot("Pseudocolor", "d")DrawPlots()# Turn off automatic printing of Query output.SuppressQueryOutputOn()Query("MinMax")print "The min is: %g and the max is: %g" % GetQueryOutputValue()# Turn on automatic printing of Query output.SuppressQueryOutputOff()Query("MinMax")
285
CHAPTER 4. FUNCTIONS
TimeSliderGetNStates: returns the number of time states for the active time slider.
Synopsis:TimeSliderGetNStates() -> integer
Returns:Returns an integer containing the number of time states for the current time slider.
Description:The TimeSliderGetNStates function returns the number of time states for the active time slider. Re-member that the length of the time slider does not have to be equal to the number of time states in atime−varying database because of database correlations and keyframing. If you want to iterate throughtime, use this function to determine the number of iterations that are required to reach the end of theactive time slider.
Example:OpenDatabase("/usr/gapps/visit/data/wave.visit")AddPlot("Pseudocolor", "pressure")DrawPlots()for state in range(TimeSliderGetNStates()):
SetTimeSliderState(state)SaveWindow()
286
CHAPTER 4. FUNCTIONS
TimeSliderNextState: advances the active time slider to the next state.
Synopsis:TimeSliderNextState() -> integer
Returns:The TimeSliderNextState function returns 1 on success and 0 on failure.
Description:The TimeSliderNextState function advances the active time slider to the next time slider state.
Example:# Assume that files are being written to the disk.% visit -cliOpenDatabase("dynamic*.silo database")AddPlot("Pseudocolor", "var")AddPlot("Mesh", "mesh")DrawPlots()SetTimeSliderState(TimeSliderGetNStates() - 1)while 1:
SaveWindow()TimeSliderPreviousState()
287
CHAPTER 4. FUNCTIONS
TimeSliderPreviousState: moves the active time slider to the previous time state.
Synopsis:TimeSliderPreviousState() -> integer
Returns:The TimeSliderPreviousState function returns 1 on success and 0 on failure.
Description:The TimeSliderPreviousState function moves the active time slider to the previous time slider state.
Example:# Assume that files are being written to the disk.% visit -cliOpenDatabase("dynamic*.silo database")AddPlot("Pseudocolor", "var")AddPlot("Mesh", "mesh")DrawPlots()while 1:
TimeSliderNextState()SaveWindow()
288

CHAPTER 4. FUNCTIONS
TimeSliderSetState: sets the time state for the active time slider.
Synopsis:SetTimeSliderState(state) -> integer
Arguments:state A zero−based integer containing the time state that we
want to make active.
Returns:The SetTimeSliderState function returns 1 on success and 0 on failure.
Description:The SetTimeSliderState function sets the time state for the active time slider. This is the function touse if you want to animate through time or change the current keyframe frame.
Example:% visit -clipath = "/usr/gapps/visit/data/"dbs = (path + "dbA00.pdb", path + "dbB00.pdb", path + "dbC00.pdb")for db in dbs:OpenDatabase(db)AddPlot("FilledBoundary", "material(mesh)")DrawPlots()CreateDatabaseCorrelation("common", dbs, 1)tsNames = GetWindowInformation().timeSlidersfor ts in tsNames:SetActiveTimeSlider(ts)for state in list(range(TimeSliderGetNStates())) + [0]:SetTimeSliderState(state)
289

CHAPTER 4. FUNCTIONS
ToggleBoundingBoxMode: toggle a visualization window mode
Synopsis:ToggleBoundingBoxMode() -> integerToggleCameraViewMode() -> integerToggleFullFrameMode() -> integerToggleLockTime() -> integerToggleLockViewMode() -> integerToggleMaintainDataMode() -> integerToggleMaintainViewMode() -> integerToggleSpinMode() -> integer
Returns:All functions return 1 on success and 0 on failure.
Description:The visualization window has various modes that affect its behavior and the VisIt Python Interfaceprovides a few functions to toggle some of those modes. The ToggleBoundingBoxMode function togglesbounding box mode on and off. When the visualization window is in bounding box mode, any plots itcontains are hidden while the view is being changed so the window redraws faster. The ToggleCam-eraViewMode function toggles camera view mode on and off. When the visualization window is incamera view mode, the view is updated using any view keyframes that have been defined when VisIt isin keyframing mode. The ToggleFullFrameMode function toggles fullframe mode on and off. When thevisualization window is in fullframe mode, the viewport is stretched non−uniformly so that it coversmost of the visualization window. While not maintaining a 1:1 aspect ratio, it does make better use ofthe visualization window. The ToggleLockTime function turns time locking on and off in a visualiza-tion window. When time locking is on in a visualization window, VisIt creates a database correlationthat works for the databases in all visualization windows that are time−locked. When you change thetime state using the time slider for the the afore−mentioned database correlation, it has the effect ofupdating time in all time−locked visualization windows. The ToggleLockViewMode function turns lockview mode on and off. When windows are in lock view mode, each view change is broadcast to otherwindows that are also in lock view mode. This allows windows containing similar plots to be comparedeasily. The ToggleMaintainDataMode and ToggleMaintainViewMode functions force the data rangeand the view, respectively, that was in effect when the mode was toggled to be used for all subsequenttime states. The ToggleSpinMode function turns spin mode on and off. When the visualization win-dow is in spin mode, it continues to spin along the axis of rotation when the view is changed interactively.
Example:% visit -cliOpenDatabase("/usr/gapps/visit/data/globe.silo")AddPlot("Pseudocolor", "u")DrawPlots()# Turn on spin mode.ToggleSpinMode()# Rotate the plot interactively using the mouse and watch it keep spinningafter the mouse release.# Turn off spin mode.ToggleSpinMode()
290

CHAPTER 4. FUNCTIONS
ToggleCameraViewMode: toggle a visualization window mode
Synopsis:ToggleBoundingBoxMode() -> integerToggleCameraViewMode() -> integerToggleFullFrameMode() -> integerToggleLockTime() -> integerToggleLockViewMode() -> integerToggleMaintainDataMode() -> integerToggleMaintainViewMode() -> integerToggleSpinMode() -> integer
Returns:All functions return 1 on success and 0 on failure.
Description:The visualization window has various modes that affect its behavior and the VisIt Python Interfaceprovides a few functions to toggle some of those modes. The ToggleBoundingBoxMode function togglesbounding box mode on and off. When the visualization window is in bounding box mode, any plots itcontains are hidden while the view is being changed so the window redraws faster. The ToggleCam-eraViewMode function toggles camera view mode on and off. When the visualization window is incamera view mode, the view is updated using any view keyframes that have been defined when VisIt isin keyframing mode. The ToggleFullFrameMode function toggles fullframe mode on and off. When thevisualization window is in fullframe mode, the viewport is stretched non−uniformly so that it coversmost of the visualization window. While not maintaining a 1:1 aspect ratio, it does make better use ofthe visualization window. The ToggleLockTime function turns time locking on and off in a visualiza-tion window. When time locking is on in a visualization window, VisIt creates a database correlationthat works for the databases in all visualization windows that are time−locked. When you change thetime state using the time slider for the the afore−mentioned database correlation, it has the effect ofupdating time in all time−locked visualization windows. The ToggleLockViewMode function turns lockview mode on and off. When windows are in lock view mode, each view change is broadcast to otherwindows that are also in lock view mode. This allows windows containing similar plots to be comparedeasily. The ToggleMaintainDataMode and ToggleMaintainViewMode functions force the data rangeand the view, respectively, that was in effect when the mode was toggled to be used for all subsequenttime states. The ToggleSpinMode function turns spin mode on and off. When the visualization win-dow is in spin mode, it continues to spin along the axis of rotation when the view is changed interactively.
Example:% visit -cliOpenDatabase("/usr/gapps/visit/data/globe.silo")AddPlot("Pseudocolor", "u")DrawPlots()# Turn on spin mode.ToggleSpinMode()# Rotate the plot interactively using the mouse and watch it keep spinningafter the mouse release.# Turn off spin mode.ToggleSpinMode()
291

CHAPTER 4. FUNCTIONS
ToggleFullFrameMode: toggle a visualization window mode
Synopsis:ToggleBoundingBoxMode() -> integerToggleCameraViewMode() -> integerToggleFullFrameMode() -> integerToggleLockTime() -> integerToggleLockViewMode() -> integerToggleMaintainDataMode() -> integerToggleMaintainViewMode() -> integerToggleSpinMode() -> integer
Returns:All functions return 1 on success and 0 on failure.
Description:The visualization window has various modes that affect its behavior and the VisIt Python Interfaceprovides a few functions to toggle some of those modes. The ToggleBoundingBoxMode function togglesbounding box mode on and off. When the visualization window is in bounding box mode, any plots itcontains are hidden while the view is being changed so the window redraws faster. The ToggleCam-eraViewMode function toggles camera view mode on and off. When the visualization window is incamera view mode, the view is updated using any view keyframes that have been defined when VisIt isin keyframing mode. The ToggleFullFrameMode function toggles fullframe mode on and off. When thevisualization window is in fullframe mode, the viewport is stretched non−uniformly so that it coversmost of the visualization window. While not maintaining a 1:1 aspect ratio, it does make better use ofthe visualization window. The ToggleLockTime function turns time locking on and off in a visualiza-tion window. When time locking is on in a visualization window, VisIt creates a database correlationthat works for the databases in all visualization windows that are time−locked. When you change thetime state using the time slider for the the afore−mentioned database correlation, it has the effect ofupdating time in all time−locked visualization windows. The ToggleLockViewMode function turns lockview mode on and off. When windows are in lock view mode, each view change is broadcast to otherwindows that are also in lock view mode. This allows windows containing similar plots to be comparedeasily. The ToggleMaintainDataMode and ToggleMaintainViewMode functions force the data rangeand the view, respectively, that was in effect when the mode was toggled to be used for all subsequenttime states. The ToggleSpinMode function turns spin mode on and off. When the visualization win-dow is in spin mode, it continues to spin along the axis of rotation when the view is changed interactively.
Example:% visit -cliOpenDatabase("/usr/gapps/visit/data/globe.silo")AddPlot("Pseudocolor", "u")DrawPlots()# Turn on spin mode.ToggleSpinMode()# Rotate the plot interactively using the mouse and watch it keep spinningafter the mouse release.# Turn off spin mode.ToggleSpinMode()
292

CHAPTER 4. FUNCTIONS
ToggleLockTime: toggle a visualization window mode
Synopsis:ToggleBoundingBoxMode() -> integerToggleCameraViewMode() -> integerToggleFullFrameMode() -> integerToggleLockTime() -> integerToggleLockViewMode() -> integerToggleMaintainDataMode() -> integerToggleMaintainViewMode() -> integerToggleSpinMode() -> integer
Returns:All functions return 1 on success and 0 on failure.
Description:The visualization window has various modes that affect its behavior and the VisIt Python Interfaceprovides a few functions to toggle some of those modes. The ToggleBoundingBoxMode function togglesbounding box mode on and off. When the visualization window is in bounding box mode, any plots itcontains are hidden while the view is being changed so the window redraws faster. The ToggleCam-eraViewMode function toggles camera view mode on and off. When the visualization window is incamera view mode, the view is updated using any view keyframes that have been defined when VisIt isin keyframing mode. The ToggleFullFrameMode function toggles fullframe mode on and off. When thevisualization window is in fullframe mode, the viewport is stretched non−uniformly so that it coversmost of the visualization window. While not maintaining a 1:1 aspect ratio, it does make better use ofthe visualization window. The ToggleLockTime function turns time locking on and off in a visualiza-tion window. When time locking is on in a visualization window, VisIt creates a database correlationthat works for the databases in all visualization windows that are time−locked. When you change thetime state using the time slider for the the afore−mentioned database correlation, it has the effect ofupdating time in all time−locked visualization windows. The ToggleLockViewMode function turns lockview mode on and off. When windows are in lock view mode, each view change is broadcast to otherwindows that are also in lock view mode. This allows windows containing similar plots to be comparedeasily. The ToggleMaintainDataMode and ToggleMaintainViewMode functions force the data rangeand the view, respectively, that was in effect when the mode was toggled to be used for all subsequenttime states. The ToggleSpinMode function turns spin mode on and off. When the visualization win-dow is in spin mode, it continues to spin along the axis of rotation when the view is changed interactively.
Example:% visit -cliOpenDatabase("/usr/gapps/visit/data/globe.silo")AddPlot("Pseudocolor", "u")DrawPlots()# Turn on spin mode.ToggleSpinMode()# Rotate the plot interactively using the mouse and watch it keep spinningafter the mouse release.# Turn off spin mode.ToggleSpinMode()
293
CHAPTER 4. FUNCTIONS
ToggleLockTools: toggle a visualization window mode
Synopsis:ToggleBoundingBoxMode() -> integerToggleCameraViewMode() -> integerToggleFullFrameMode() -> integerToggleLockTime() -> integerToggleLockViewMode() -> integerToggleMaintainDataMode() -> integerToggleMaintainViewMode() -> integerToggleSpinMode() -> integer
Returns:All functions return 1 on success and 0 on failure.
Description:The visualization window has various modes that affect its behavior and the VisIt Python Interfaceprovides a few functions to toggle some of those modes. The ToggleBoundingBoxMode function togglesbounding box mode on and off. When the visualization window is in bounding box mode, any plots itcontains are hidden while the view is being changed so the window redraws faster. The ToggleCam-eraViewMode function toggles camera view mode on and off. When the visualization window is incamera view mode, the view is updated using any view keyframes that have been defined when VisIt isin keyframing mode. The ToggleFullFrameMode function toggles fullframe mode on and off. When thevisualization window is in fullframe mode, the viewport is stretched non−uniformly so that it coversmost of the visualization window. While not maintaining a 1:1 aspect ratio, it does make better use ofthe visualization window. The ToggleLockTime function turns time locking on and off in a visualiza-tion window. When time locking is on in a visualization window, VisIt creates a database correlationthat works for the databases in all visualization windows that are time−locked. When you change thetime state using the time slider for the the afore−mentioned database correlation, it has the effect ofupdating time in all time−locked visualization windows. The ToggleLockViewMode function turns lockview mode on and off. When windows are in lock view mode, each view change is broadcast to otherwindows that are also in lock view mode. This allows windows containing similar plots to be comparedeasily. The ToggleMaintainDataMode and ToggleMaintainViewMode functions force the data rangeand the view, respectively, that was in effect when the mode was toggled to be used for all subsequenttime states. The ToggleSpinMode function turns spin mode on and off. When the visualization win-dow is in spin mode, it continues to spin along the axis of rotation when the view is changed interactively.
Example:% visit -cliOpenDatabase("/usr/gapps/visit/data/globe.silo")AddPlot("Pseudocolor", "u")DrawPlots()# Turn on spin mode.ToggleSpinMode()# Rotate the plot interactively using the mouse and watch it keep spinningafter the mouse release.# Turn off spin mode.ToggleSpinMode()
294

CHAPTER 4. FUNCTIONS
ToggleLockViewMode: toggle a visualization window mode
Synopsis:ToggleBoundingBoxMode() -> integerToggleCameraViewMode() -> integerToggleFullFrameMode() -> integerToggleLockTime() -> integerToggleLockViewMode() -> integerToggleMaintainDataMode() -> integerToggleMaintainViewMode() -> integerToggleSpinMode() -> integer
Returns:All functions return 1 on success and 0 on failure.
Description:The visualization window has various modes that affect its behavior and the VisIt Python Interfaceprovides a few functions to toggle some of those modes. The ToggleBoundingBoxMode function togglesbounding box mode on and off. When the visualization window is in bounding box mode, any plots itcontains are hidden while the view is being changed so the window redraws faster. The ToggleCam-eraViewMode function toggles camera view mode on and off. When the visualization window is incamera view mode, the view is updated using any view keyframes that have been defined when VisIt isin keyframing mode. The ToggleFullFrameMode function toggles fullframe mode on and off. When thevisualization window is in fullframe mode, the viewport is stretched non−uniformly so that it coversmost of the visualization window. While not maintaining a 1:1 aspect ratio, it does make better use ofthe visualization window. The ToggleLockTime function turns time locking on and off in a visualiza-tion window. When time locking is on in a visualization window, VisIt creates a database correlationthat works for the databases in all visualization windows that are time−locked. When you change thetime state using the time slider for the the afore−mentioned database correlation, it has the effect ofupdating time in all time−locked visualization windows. The ToggleLockViewMode function turns lockview mode on and off. When windows are in lock view mode, each view change is broadcast to otherwindows that are also in lock view mode. This allows windows containing similar plots to be comparedeasily. The ToggleMaintainDataMode and ToggleMaintainViewMode functions force the data rangeand the view, respectively, that was in effect when the mode was toggled to be used for all subsequenttime states. The ToggleSpinMode function turns spin mode on and off. When the visualization win-dow is in spin mode, it continues to spin along the axis of rotation when the view is changed interactively.
Example:% visit -cliOpenDatabase("/usr/gapps/visit/data/globe.silo")AddPlot("Pseudocolor", "u")DrawPlots()# Turn on spin mode.ToggleSpinMode()# Rotate the plot interactively using the mouse and watch it keep spinningafter the mouse release.# Turn off spin mode.ToggleSpinMode()
295
CHAPTER 4. FUNCTIONS
ToggleMaintainViewMode: toggle a visualization window mode
Synopsis:ToggleBoundingBoxMode() -> integerToggleCameraViewMode() -> integerToggleFullFrameMode() -> integerToggleLockTime() -> integerToggleLockViewMode() -> integerToggleMaintainDataMode() -> integerToggleMaintainViewMode() -> integerToggleSpinMode() -> integer
Returns:All functions return 1 on success and 0 on failure.
Description:The visualization window has various modes that affect its behavior and the VisIt Python Interfaceprovides a few functions to toggle some of those modes. The ToggleBoundingBoxMode function togglesbounding box mode on and off. When the visualization window is in bounding box mode, any plots itcontains are hidden while the view is being changed so the window redraws faster. The ToggleCam-eraViewMode function toggles camera view mode on and off. When the visualization window is incamera view mode, the view is updated using any view keyframes that have been defined when VisIt isin keyframing mode. The ToggleFullFrameMode function toggles fullframe mode on and off. When thevisualization window is in fullframe mode, the viewport is stretched non−uniformly so that it coversmost of the visualization window. While not maintaining a 1:1 aspect ratio, it does make better use ofthe visualization window. The ToggleLockTime function turns time locking on and off in a visualiza-tion window. When time locking is on in a visualization window, VisIt creates a database correlationthat works for the databases in all visualization windows that are time−locked. When you change thetime state using the time slider for the the afore−mentioned database correlation, it has the effect ofupdating time in all time−locked visualization windows. The ToggleLockViewMode function turns lockview mode on and off. When windows are in lock view mode, each view change is broadcast to otherwindows that are also in lock view mode. This allows windows containing similar plots to be comparedeasily. The ToggleMaintainDataMode and ToggleMaintainViewMode functions force the data rangeand the view, respectively, that was in effect when the mode was toggled to be used for all subsequenttime states. The ToggleSpinMode function turns spin mode on and off. When the visualization win-dow is in spin mode, it continues to spin along the axis of rotation when the view is changed interactively.
Example:% visit -cliOpenDatabase("/usr/gapps/visit/data/globe.silo")AddPlot("Pseudocolor", "u")DrawPlots()# Turn on spin mode.ToggleSpinMode()# Rotate the plot interactively using the mouse and watch it keep spinningafter the mouse release.# Turn off spin mode.ToggleSpinMode()
296

CHAPTER 4. FUNCTIONS
ToggleSpinMode: toggle a visualization window mode
Synopsis:ToggleBoundingBoxMode() -> integerToggleCameraViewMode() -> integerToggleFullFrameMode() -> integerToggleLockTime() -> integerToggleLockViewMode() -> integerToggleMaintainDataMode() -> integerToggleMaintainViewMode() -> integerToggleSpinMode() -> integer
Returns:All functions return 1 on success and 0 on failure.
Description:The visualization window has various modes that affect its behavior and the VisIt Python Interfaceprovides a few functions to toggle some of those modes. The ToggleBoundingBoxMode function togglesbounding box mode on and off. When the visualization window is in bounding box mode, any plots itcontains are hidden while the view is being changed so the window redraws faster. The ToggleCam-eraViewMode function toggles camera view mode on and off. When the visualization window is incamera view mode, the view is updated using any view keyframes that have been defined when VisIt isin keyframing mode. The ToggleFullFrameMode function toggles fullframe mode on and off. When thevisualization window is in fullframe mode, the viewport is stretched non−uniformly so that it coversmost of the visualization window. While not maintaining a 1:1 aspect ratio, it does make better use ofthe visualization window. The ToggleLockTime function turns time locking on and off in a visualiza-tion window. When time locking is on in a visualization window, VisIt creates a database correlationthat works for the databases in all visualization windows that are time−locked. When you change thetime state using the time slider for the the afore−mentioned database correlation, it has the effect ofupdating time in all time−locked visualization windows. The ToggleLockViewMode function turns lockview mode on and off. When windows are in lock view mode, each view change is broadcast to otherwindows that are also in lock view mode. This allows windows containing similar plots to be comparedeasily. The ToggleMaintainDataMode and ToggleMaintainViewMode functions force the data rangeand the view, respectively, that was in effect when the mode was toggled to be used for all subsequenttime states. The ToggleSpinMode function turns spin mode on and off. When the visualization win-dow is in spin mode, it continues to spin along the axis of rotation when the view is changed interactively.
Example:% visit -cliOpenDatabase("/usr/gapps/visit/data/globe.silo")AddPlot("Pseudocolor", "u")DrawPlots()# Turn on spin mode.ToggleSpinMode()# Rotate the plot interactively using the mouse and watch it keep spinningafter the mouse release.# Turn off spin mode.ToggleSpinMode()
297
CHAPTER 4. FUNCTIONS
TurnDomainsOff: turns materials or domains on or off.
Synopsis:TurnMaterialsOn() -> integerTurnMaterialsOn(string) -> integerTurnMaterialsOn(tuple of strings) -> integerTurnMaterialsOff() -> integerTurnMaterialsOff(string) -> integerTurnMaterialsOff(tuple of strings) -> integerTurnDomainsOn() -> integerTurnDomainsOn(string) -> integerTurnDomainsOn(tuple of strings) -> integerTurnDomainsOff() -> integerTurnDomainsOff(string) -> integerTurnDomainsOff(tuple of strings) -> integer
Returns:The Turn functions return an integer with a value of 1 for success or 0 for failure.
Description:The Turn functions are provided to simplify the removal of material or domain subsets. Instead ofcreating a SILRestriction object, you can use the Turn functions to turn materials or domains on oroff. The TurnMaterialsOn function turns materials on and the TurnMaterialsOff function turns themoff. The TurnDomainsOn function turns domains on and the TurnDomainsOff function turns them off.All of the Turn functions have three possible argument lists. When you do not provide any arguments,the function applies to all subsets in the SIL so if you called the TurnMaterialsOff function with noarguments, all materials would be turned off. Calling TurnMaterialsOn with no arguments would turnall materials on. All functions can also take a string argument, which is the name of the set to modify.For example, you could turn off domain 0 by calling the TurnDomainsOff with a single argument of”domain0” (or the appropriate set name). All of the Turn functions can also be used to modify morethan one set if you provide a tuple of set names. After you use the Turn functions to change the SILrestriction, you might want to call the ListMaterials or ListDomains functions to make sure that theSIL restriction was actually modified.
Example:% visit -cliOpenDatabase("/usr/gapps/visit/data/globe.silo")AddPlot("Pseudocolor", "u")DrawPlots()TurnMaterialsOff("4") # Turn off material 4TurnMaterialsOff(("1", "2")) # Turn off materials 1 and 2TurnMaterialsOn() # Turn on all materials
298

CHAPTER 4. FUNCTIONS
TurnDomainsOn: turns materials or domains on or off.
Synopsis:TurnMaterialsOn() -> integerTurnMaterialsOn(string) -> integerTurnMaterialsOn(tuple of strings) -> integerTurnMaterialsOff() -> integerTurnMaterialsOff(string) -> integerTurnMaterialsOff(tuple of strings) -> integerTurnDomainsOn() -> integerTurnDomainsOn(string) -> integerTurnDomainsOn(tuple of strings) -> integerTurnDomainsOff() -> integerTurnDomainsOff(string) -> integerTurnDomainsOff(tuple of strings) -> integer
Returns:The Turn functions return an integer with a value of 1 for success or 0 for failure.
Description:The Turn functions are provided to simplify the removal of material or domain subsets. Instead ofcreating a SILRestriction object, you can use the Turn functions to turn materials or domains on oroff. The TurnMaterialsOn function turns materials on and the TurnMaterialsOff function turns themoff. The TurnDomainsOn function turns domains on and the TurnDomainsOff function turns them off.All of the Turn functions have three possible argument lists. When you do not provide any arguments,the function applies to all subsets in the SIL so if you called the TurnMaterialsOff function with noarguments, all materials would be turned off. Calling TurnMaterialsOn with no arguments would turnall materials on. All functions can also take a string argument, which is the name of the set to modify.For example, you could turn off domain 0 by calling the TurnDomainsOff with a single argument of”domain0” (or the appropriate set name). All of the Turn functions can also be used to modify morethan one set if you provide a tuple of set names. After you use the Turn functions to change the SILrestriction, you might want to call the ListMaterials or ListDomains functions to make sure that theSIL restriction was actually modified.
Example:% visit -cliOpenDatabase("/usr/gapps/visit/data/globe.silo")AddPlot("Pseudocolor", "u")DrawPlots()TurnMaterialsOff("4") # Turn off material 4TurnMaterialsOff(("1", "2")) # Turn off materials 1 and 2TurnMaterialsOn() # Turn on all materials
299

CHAPTER 4. FUNCTIONS
TurnMaterialsOff: turns materials or domains on or off.
Synopsis:TurnMaterialsOn() -> integerTurnMaterialsOn(string) -> integerTurnMaterialsOn(tuple of strings) -> integerTurnMaterialsOff() -> integerTurnMaterialsOff(string) -> integerTurnMaterialsOff(tuple of strings) -> integerTurnDomainsOn() -> integerTurnDomainsOn(string) -> integerTurnDomainsOn(tuple of strings) -> integerTurnDomainsOff() -> integerTurnDomainsOff(string) -> integerTurnDomainsOff(tuple of strings) -> integer
Returns:The Turn functions return an integer with a value of 1 for success or 0 for failure.
Description:The Turn functions are provided to simplify the removal of material or domain subsets. Instead ofcreating a SILRestriction object, you can use the Turn functions to turn materials or domains on oroff. The TurnMaterialsOn function turns materials on and the TurnMaterialsOff function turns themoff. The TurnDomainsOn function turns domains on and the TurnDomainsOff function turns them off.All of the Turn functions have three possible argument lists. When you do not provide any arguments,the function applies to all subsets in the SIL so if you called the TurnMaterialsOff function with noarguments, all materials would be turned off. Calling TurnMaterialsOn with no arguments would turnall materials on. All functions can also take a string argument, which is the name of the set to modify.For example, you could turn off domain 0 by calling the TurnDomainsOff with a single argument of”domain0” (or the appropriate set name). All of the Turn functions can also be used to modify morethan one set if you provide a tuple of set names. After you use the Turn functions to change the SILrestriction, you might want to call the ListMaterials or ListDomains functions to make sure that theSIL restriction was actually modified.
Example:% visit -cliOpenDatabase("/usr/gapps/visit/data/globe.silo")AddPlot("Pseudocolor", "u")DrawPlots()TurnMaterialsOff("4") # Turn off material 4TurnMaterialsOff(("1", "2")) # Turn off materials 1 and 2TurnMaterialsOn() # Turn on all materials
300

CHAPTER 4. FUNCTIONS
TurnMaterialsOn: turns materials or domains on or off.
Synopsis:TurnMaterialsOn() -> integerTurnMaterialsOn(string) -> integerTurnMaterialsOn(tuple of strings) -> integerTurnMaterialsOff() -> integerTurnMaterialsOff(string) -> integerTurnMaterialsOff(tuple of strings) -> integerTurnDomainsOn() -> integerTurnDomainsOn(string) -> integerTurnDomainsOn(tuple of strings) -> integerTurnDomainsOff() -> integerTurnDomainsOff(string) -> integerTurnDomainsOff(tuple of strings) -> integer
Returns:The Turn functions return an integer with a value of 1 for success or 0 for failure.
Description:The Turn functions are provided to simplify the removal of material or domain subsets. Instead ofcreating a SILRestriction object, you can use the Turn functions to turn materials or domains on oroff. The TurnMaterialsOn function turns materials on and the TurnMaterialsOff function turns themoff. The TurnDomainsOn function turns domains on and the TurnDomainsOff function turns them off.All of the Turn functions have three possible argument lists. When you do not provide any arguments,the function applies to all subsets in the SIL so if you called the TurnMaterialsOff function with noarguments, all materials would be turned off. Calling TurnMaterialsOn with no arguments would turnall materials on. All functions can also take a string argument, which is the name of the set to modify.For example, you could turn off domain 0 by calling the TurnDomainsOff with a single argument of”domain0” (or the appropriate set name). All of the Turn functions can also be used to modify morethan one set if you provide a tuple of set names. After you use the Turn functions to change the SILrestriction, you might want to call the ListMaterials or ListDomains functions to make sure that theSIL restriction was actually modified.
Example:% visit -cliOpenDatabase("/usr/gapps/visit/data/globe.silo")AddPlot("Pseudocolor", "u")DrawPlots()TurnMaterialsOff("4") # Turn off material 4TurnMaterialsOff(("1", "2")) # Turn off materials 1 and 2TurnMaterialsOn() # Turn on all materials
301
CHAPTER 4. FUNCTIONS
UndoView: restores the previous view
Synopsis:UndoView()
Returns:The UndoView function does not return a value.
Description:When the view changes in the visualization window, it puts the old view on a stack of views. TheUndoView function restores the view on top of the stack and removes it. This allows the user to undoup to ten view changes.
Example:% visit -cliOpenDatabase("/usr/gapps/visit/data/curv2d.silo")AddPlot("Subset", "mat1")DrawPlots()v = GetView2D()v.windowCoords = (-2.3,2.4,0.2,4.9)SetView2D(v)UndoView()
302
CHAPTER 4. FUNCTIONS
UpdateNamedSelection: recalculate a named selection using new selection properties.
Synopsis:UpdateNamedSelection(name) -> integerUpdateNamedSelection(name, properties) -> integer
Arguments:name The name of the selection to update.properties An optional SelectionProperties object that contains the
selection properties to use when reevaluating the selection.
Returns:The UpdateNamedSelection function returns 1 on success and 0 on failure.
Description:This function causes VisIt to reevaluate a named selection using new selection properties. If no selectionproperties are provided then the selection will be reevaluated using data for the plot that was associatedwith the selection when it was created. This is useful if you want to change a plot in several ways beforecausing its associated named selection to update using the changes.
Example:s = GetSelection(’selection1’)s.selectionType = s.CumulativeQuerySelections.histogramType = s.HistogramMatchess.combineRule = s.CombineOrs.variables = (’temperature’,)s.variableMins = (2.9,)s.variableMaxs = (3.1,)UpdateNamedSelection(’selection1’, s)
303
CHAPTER 4. FUNCTIONS
Version: returns VisIt’s version string.
Synopsis:Version() -> string
Returns:The Version function return a string that represents VisIt’s version.
Description:The Version function returns a string that represents VisIt’s version. The version string can be used inPython scripts to make sure that the VisIt module is a certain version before processing the rest of thePython script.
Example:% visit -cliprint "We are running VisIt version %s" % Version()
304
CHAPTER 4. FUNCTIONS
WriteConfigFile: tells the viewer to write its configuration file.
Synopsis:WriteConfigFile()
Returns:The WriteconfigFile function does not return a value.
Description:The viewer maintains internal settings which determine the default values for objects like plots andoperators. The viewer can save out the default values so they can be used in future VisIt sessions. TheWriteConfig function tells the viewer to write out the settings to the VisIt configuration file.
Example:% visit -clip = PseudocolorAttributes()p.minFlag, p.min = 1, 5.0p.maxFlag, p.max = 1, 20.0SetDefaultPlotOptions(p)# Save the new default Pseudocolor settings to the config file.WriteConfig()
305
CHAPTER 4. FUNCTIONS
Example:f = open(’script.py’, ’wt’)WriteScript(f)f.close()
306

CHAPTER 4. FUNCTIONS
ZonePick: performs a zonal pick on a plot.
Synopsis:ZonePick(namedarg1=arg1, namedarg2=arg2, ...) -> dictionary
Arguments:coord A tuple of doubles containing the spatial coordinate (x, y,
z).x An integer containing the screen X location (in pixels) offset
from the left side of the visualization window.y An integer containing the screen Y location (in pixels) offset
from the bottom of the visualization window.vars (optional) A tuple of strings with the variable names for which to
return results. (default: currently plotted variable)do_time (optional) An integer indicating whether to do a time pick. 1 −> do
a time pick, 0 (default) −> do not do a time pick.start_time (optional) An integer with the starting frame index (default: 0).end_time (optional) An integer with the ending frame index (default:
num timestates − 1).stride (optional) An integer with the stride for advancing in time (default:
1).preserve_coord (optional) An integer indicating whether to pick an element or a co-
ordinate. 0 −> used picked element (default), 1−> usedpicked coordinate.
curve_plot_type (optional) An integer indicating whether the output should be on asingle axis or with multiple axes. 0 −> single Y axis (de-fault), 1 −> multiple Y Axes.
Returns:ZonePick returns a python dictionary of the pick results, unless do time is specified, then a time curveis created in a new window. If the picked variable is node centered, the variable values are groupedaccording to incident node ids.
Description:The ZonePick function prints pick information for the cell (a.k.a zone) that contains the specified point.The point can be specified as a 2D or 3D point in world space or it can be specified as a pixel locationin screen space. If the point is specified as a pixel location then VisIt finds the zone that contains theintersection of a cell and a ray that is projected into the mesh. Once the zonal pick has been calculated,you can use the GetPickOutput function to retrieve the printed pick output as a string which can beused for other purposes.
Example:% visit -cliOpenDatabase("/usr/gapps/visit/data/noise.silo")AddPlot("Pseudocolor", "hgslice")DrawPlots()# Perform zone pick in screen spacepick_out = ZonePick(x=200,y=200)# Perform zone pick in world space.pick_out = ZonePick(coord = (-5.0, 5.0, 0))
307
Chapter 5
Attribute References
This chapter shows all the attributes that can be set to control the behavior of VisIt. The attributesthemselves are not documented, but their names are usually quite explanatory. When an attribute canhave values from a given list of options, the default option is printed and the other available options areprinted in a column beneath in italic.
The listing is ordered in alphabetical ordering of the name of the attribute set. For each set the functionthat will provide you with these attributes is printed in italic.
308
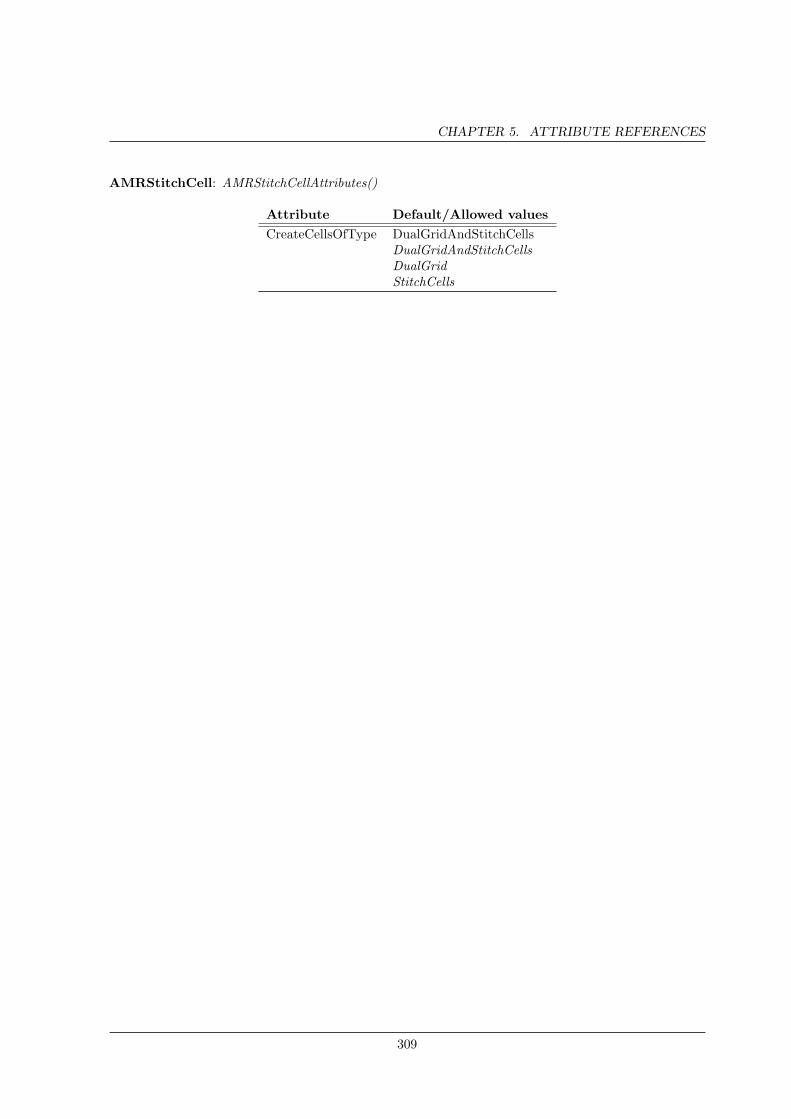
CHAPTER 5. ATTRIBUTE REFERENCES
AMRStitchCell: AMRStitchCellAttributes()
Attribute Default/Allowed valuesCreateCellsOfType DualGridAndStitchCells
DualGridAndStitchCellsDualGridStitchCells
309
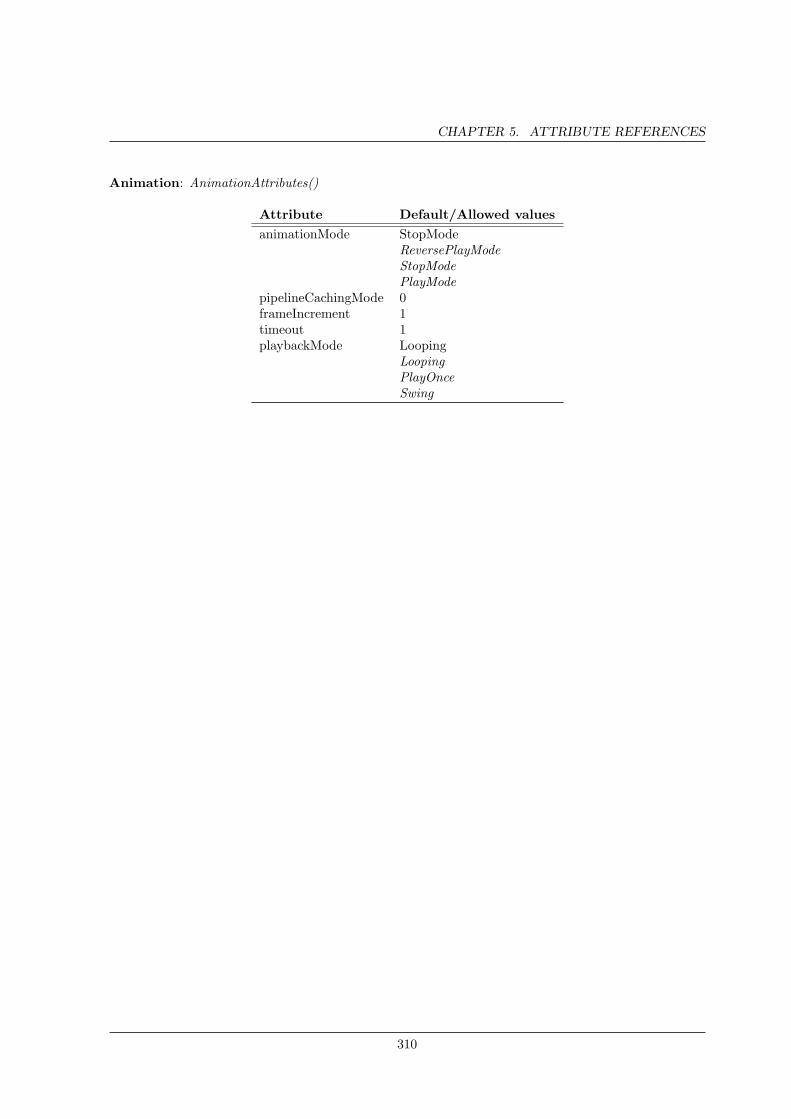
CHAPTER 5. ATTRIBUTE REFERENCES
Animation: AnimationAttributes()
Attribute Default/Allowed valuesanimationMode StopMode
ReversePlayModeStopModePlayMode
pipelineCachingMode 0frameIncrement 1timeout 1playbackMode Looping
LoopingPlayOnceSwing
310
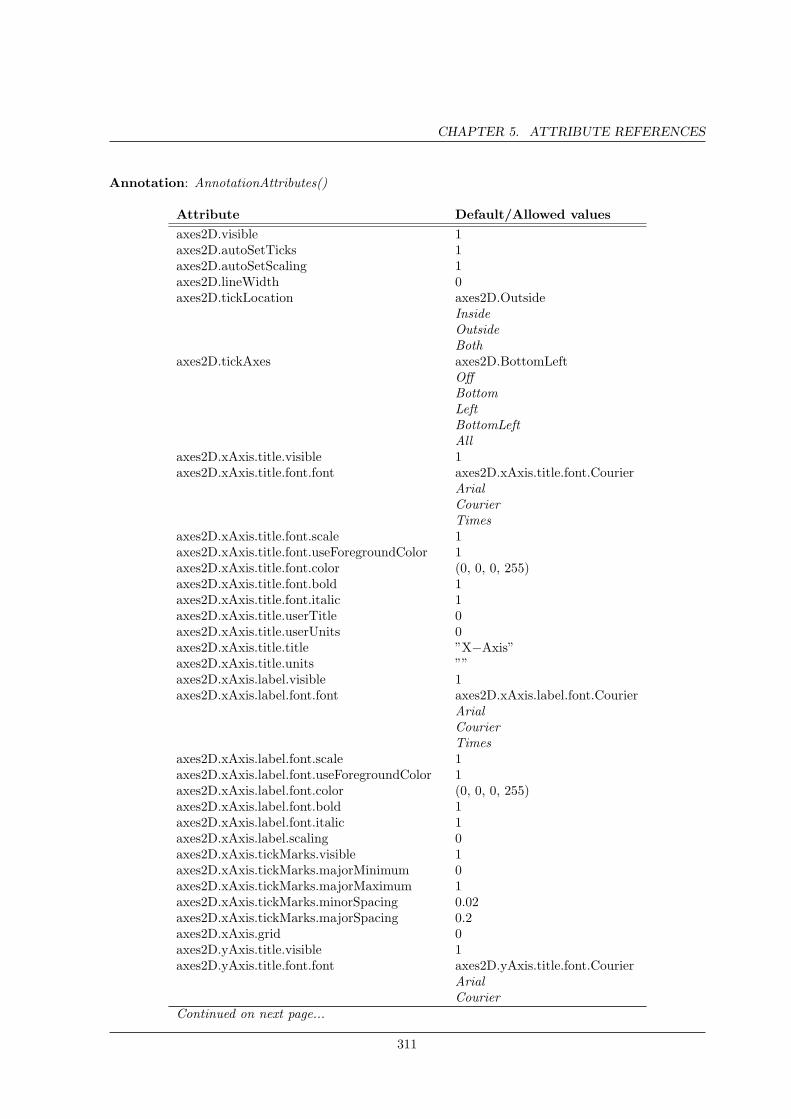
CHAPTER 5. ATTRIBUTE REFERENCES
Annotation: AnnotationAttributes()
Attribute Default/Allowed valuesaxes2D.visible 1axes2D.autoSetTicks 1axes2D.autoSetScaling 1axes2D.lineWidth 0axes2D.tickLocation axes2D.Outside
InsideOutsideBoth
axes2D.tickAxes axes2D.BottomLeftOffBottomLeftBottomLeftAll
axes2D.xAxis.title.visible 1axes2D.xAxis.title.font.font axes2D.xAxis.title.font.Courier
ArialCourierTimes
axes2D.xAxis.title.font.scale 1axes2D.xAxis.title.font.useForegroundColor 1axes2D.xAxis.title.font.color (0, 0, 0, 255)axes2D.xAxis.title.font.bold 1axes2D.xAxis.title.font.italic 1axes2D.xAxis.title.userTitle 0axes2D.xAxis.title.userUnits 0axes2D.xAxis.title.title ”X−Axis”axes2D.xAxis.title.units ””axes2D.xAxis.label.visible 1axes2D.xAxis.label.font.font axes2D.xAxis.label.font.Courier
ArialCourierTimes
axes2D.xAxis.label.font.scale 1axes2D.xAxis.label.font.useForegroundColor 1axes2D.xAxis.label.font.color (0, 0, 0, 255)axes2D.xAxis.label.font.bold 1axes2D.xAxis.label.font.italic 1axes2D.xAxis.label.scaling 0axes2D.xAxis.tickMarks.visible 1axes2D.xAxis.tickMarks.majorMinimum 0axes2D.xAxis.tickMarks.majorMaximum 1axes2D.xAxis.tickMarks.minorSpacing 0.02axes2D.xAxis.tickMarks.majorSpacing 0.2axes2D.xAxis.grid 0axes2D.yAxis.title.visible 1axes2D.yAxis.title.font.font axes2D.yAxis.title.font.Courier
ArialCourier
Continued on next page...
311

CHAPTER 5. ATTRIBUTE REFERENCES
... Annotation attributes continuedAttribute Default/Allowed values
Timesaxes2D.yAxis.title.font.scale 1axes2D.yAxis.title.font.useForegroundColor 1axes2D.yAxis.title.font.color (0, 0, 0, 255)axes2D.yAxis.title.font.bold 1axes2D.yAxis.title.font.italic 1axes2D.yAxis.title.userTitle 0axes2D.yAxis.title.userUnits 0axes2D.yAxis.title.title ”Y−Axis”axes2D.yAxis.title.units ””axes2D.yAxis.label.visible 1axes2D.yAxis.label.font.font axes2D.yAxis.label.font.Courier
ArialCourierTimes
axes2D.yAxis.label.font.scale 1axes2D.yAxis.label.font.useForegroundColor 1axes2D.yAxis.label.font.color (0, 0, 0, 255)axes2D.yAxis.label.font.bold 1axes2D.yAxis.label.font.italic 1axes2D.yAxis.label.scaling 0axes2D.yAxis.tickMarks.visible 1axes2D.yAxis.tickMarks.majorMinimum 0axes2D.yAxis.tickMarks.majorMaximum 1axes2D.yAxis.tickMarks.minorSpacing 0.02axes2D.yAxis.tickMarks.majorSpacing 0.2axes2D.yAxis.grid 0axes3D.visible 1axes3D.autoSetTicks 1axes3D.autoSetScaling 1axes3D.lineWidth 0axes3D.tickLocation axes3D.Inside
InsideOutsideBoth
axes3D.axesType axes3D.ClosestTriadClosestTriadFurthestTriadOutsideEdgesStaticTriadStaticEdges
axes3D.triadFlag 1axes3D.bboxFlag 1axes3D.xAxis.title.visible 1axes3D.xAxis.title.font.font axes3D.xAxis.title.font.Arial
ArialCourierTimes
axes3D.xAxis.title.font.scale 1Continued on next page...
312
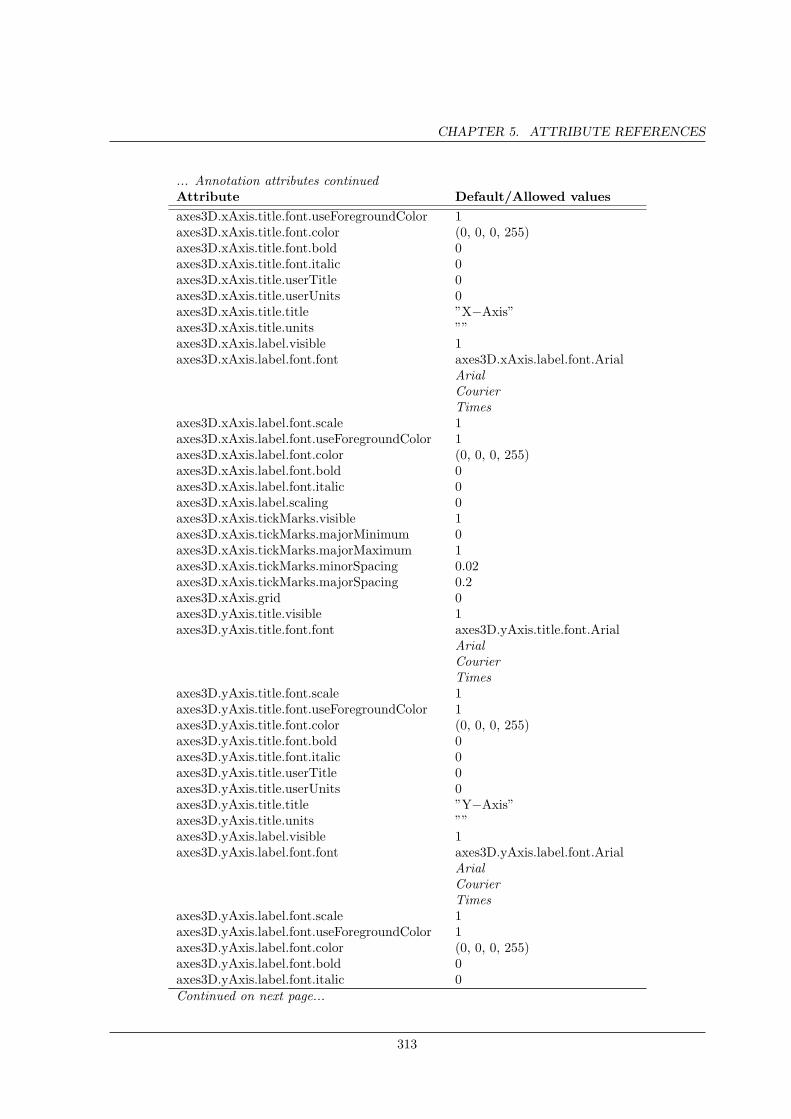
CHAPTER 5. ATTRIBUTE REFERENCES
... Annotation attributes continuedAttribute Default/Allowed valuesaxes3D.xAxis.title.font.useForegroundColor 1axes3D.xAxis.title.font.color (0, 0, 0, 255)axes3D.xAxis.title.font.bold 0axes3D.xAxis.title.font.italic 0axes3D.xAxis.title.userTitle 0axes3D.xAxis.title.userUnits 0axes3D.xAxis.title.title ”X−Axis”axes3D.xAxis.title.units ””axes3D.xAxis.label.visible 1axes3D.xAxis.label.font.font axes3D.xAxis.label.font.Arial
ArialCourierTimes
axes3D.xAxis.label.font.scale 1axes3D.xAxis.label.font.useForegroundColor 1axes3D.xAxis.label.font.color (0, 0, 0, 255)axes3D.xAxis.label.font.bold 0axes3D.xAxis.label.font.italic 0axes3D.xAxis.label.scaling 0axes3D.xAxis.tickMarks.visible 1axes3D.xAxis.tickMarks.majorMinimum 0axes3D.xAxis.tickMarks.majorMaximum 1axes3D.xAxis.tickMarks.minorSpacing 0.02axes3D.xAxis.tickMarks.majorSpacing 0.2axes3D.xAxis.grid 0axes3D.yAxis.title.visible 1axes3D.yAxis.title.font.font axes3D.yAxis.title.font.Arial
ArialCourierTimes
axes3D.yAxis.title.font.scale 1axes3D.yAxis.title.font.useForegroundColor 1axes3D.yAxis.title.font.color (0, 0, 0, 255)axes3D.yAxis.title.font.bold 0axes3D.yAxis.title.font.italic 0axes3D.yAxis.title.userTitle 0axes3D.yAxis.title.userUnits 0axes3D.yAxis.title.title ”Y−Axis”axes3D.yAxis.title.units ””axes3D.yAxis.label.visible 1axes3D.yAxis.label.font.font axes3D.yAxis.label.font.Arial
ArialCourierTimes
axes3D.yAxis.label.font.scale 1axes3D.yAxis.label.font.useForegroundColor 1axes3D.yAxis.label.font.color (0, 0, 0, 255)axes3D.yAxis.label.font.bold 0axes3D.yAxis.label.font.italic 0Continued on next page...
313
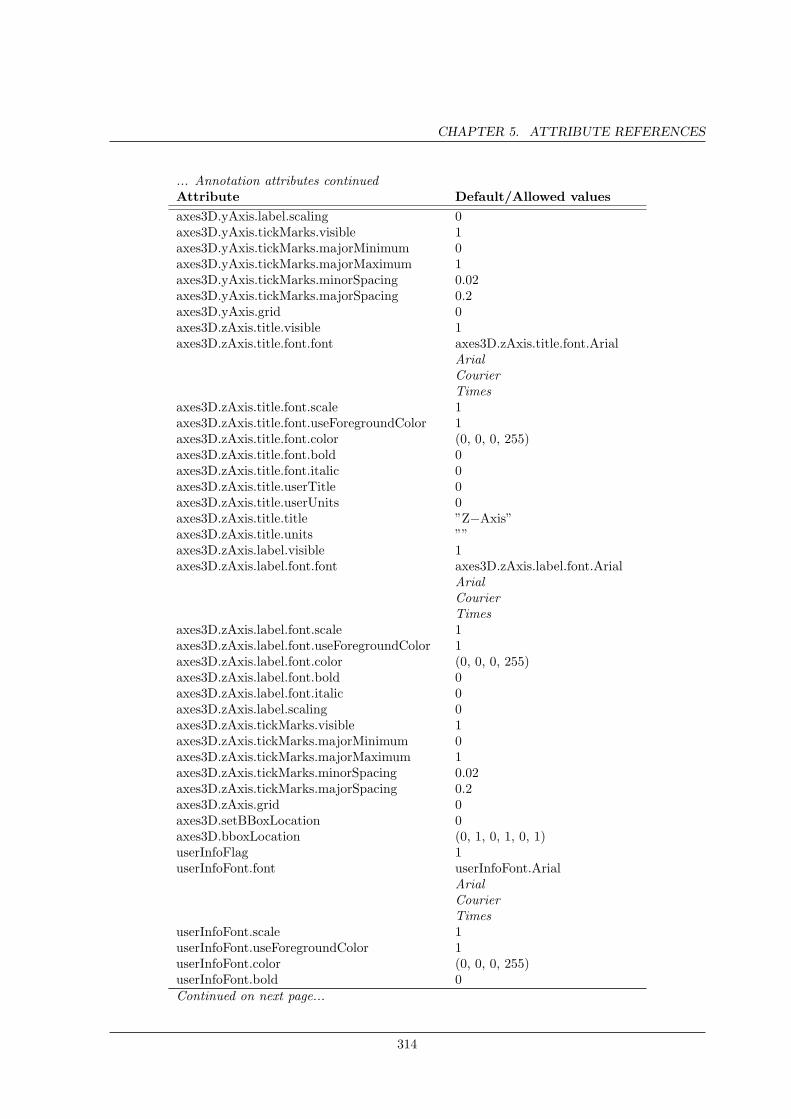
CHAPTER 5. ATTRIBUTE REFERENCES
... Annotation attributes continuedAttribute Default/Allowed valuesaxes3D.yAxis.label.scaling 0axes3D.yAxis.tickMarks.visible 1axes3D.yAxis.tickMarks.majorMinimum 0axes3D.yAxis.tickMarks.majorMaximum 1axes3D.yAxis.tickMarks.minorSpacing 0.02axes3D.yAxis.tickMarks.majorSpacing 0.2axes3D.yAxis.grid 0axes3D.zAxis.title.visible 1axes3D.zAxis.title.font.font axes3D.zAxis.title.font.Arial
ArialCourierTimes
axes3D.zAxis.title.font.scale 1axes3D.zAxis.title.font.useForegroundColor 1axes3D.zAxis.title.font.color (0, 0, 0, 255)axes3D.zAxis.title.font.bold 0axes3D.zAxis.title.font.italic 0axes3D.zAxis.title.userTitle 0axes3D.zAxis.title.userUnits 0axes3D.zAxis.title.title ”Z−Axis”axes3D.zAxis.title.units ””axes3D.zAxis.label.visible 1axes3D.zAxis.label.font.font axes3D.zAxis.label.font.Arial
ArialCourierTimes
axes3D.zAxis.label.font.scale 1axes3D.zAxis.label.font.useForegroundColor 1axes3D.zAxis.label.font.color (0, 0, 0, 255)axes3D.zAxis.label.font.bold 0axes3D.zAxis.label.font.italic 0axes3D.zAxis.label.scaling 0axes3D.zAxis.tickMarks.visible 1axes3D.zAxis.tickMarks.majorMinimum 0axes3D.zAxis.tickMarks.majorMaximum 1axes3D.zAxis.tickMarks.minorSpacing 0.02axes3D.zAxis.tickMarks.majorSpacing 0.2axes3D.zAxis.grid 0axes3D.setBBoxLocation 0axes3D.bboxLocation (0, 1, 0, 1, 0, 1)userInfoFlag 1userInfoFont.font userInfoFont.Arial
ArialCourierTimes
userInfoFont.scale 1userInfoFont.useForegroundColor 1userInfoFont.color (0, 0, 0, 255)userInfoFont.bold 0Continued on next page...
314
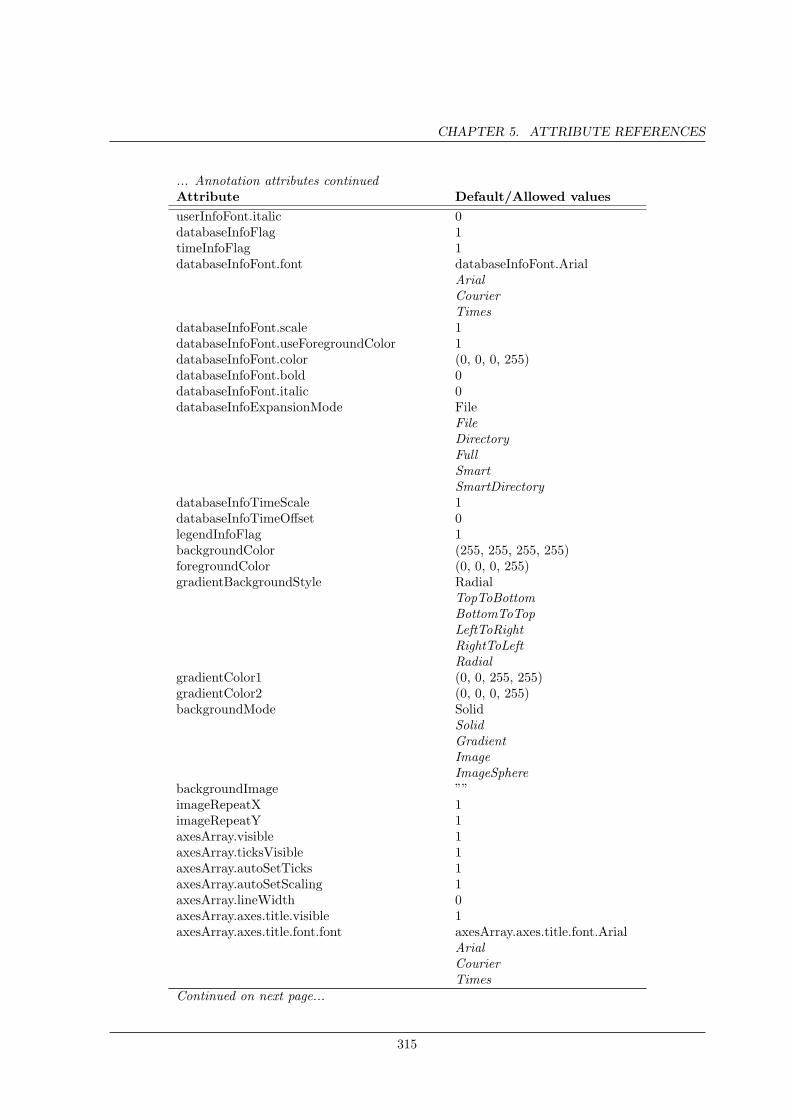
CHAPTER 5. ATTRIBUTE REFERENCES
... Annotation attributes continuedAttribute Default/Allowed valuesuserInfoFont.italic 0databaseInfoFlag 1timeInfoFlag 1databaseInfoFont.font databaseInfoFont.Arial
ArialCourierTimes
databaseInfoFont.scale 1databaseInfoFont.useForegroundColor 1databaseInfoFont.color (0, 0, 0, 255)databaseInfoFont.bold 0databaseInfoFont.italic 0databaseInfoExpansionMode File
FileDirectoryFullSmartSmartDirectory
databaseInfoTimeScale 1databaseInfoTimeOffset 0legendInfoFlag 1backgroundColor (255, 255, 255, 255)foregroundColor (0, 0, 0, 255)gradientBackgroundStyle Radial
TopToBottomBottomToTopLeftToRightRightToLeftRadial
gradientColor1 (0, 0, 255, 255)gradientColor2 (0, 0, 0, 255)backgroundMode Solid
SolidGradientImageImageSphere
backgroundImage ””imageRepeatX 1imageRepeatY 1axesArray.visible 1axesArray.ticksVisible 1axesArray.autoSetTicks 1axesArray.autoSetScaling 1axesArray.lineWidth 0axesArray.axes.title.visible 1axesArray.axes.title.font.font axesArray.axes.title.font.Arial
ArialCourierTimes
Continued on next page...
315
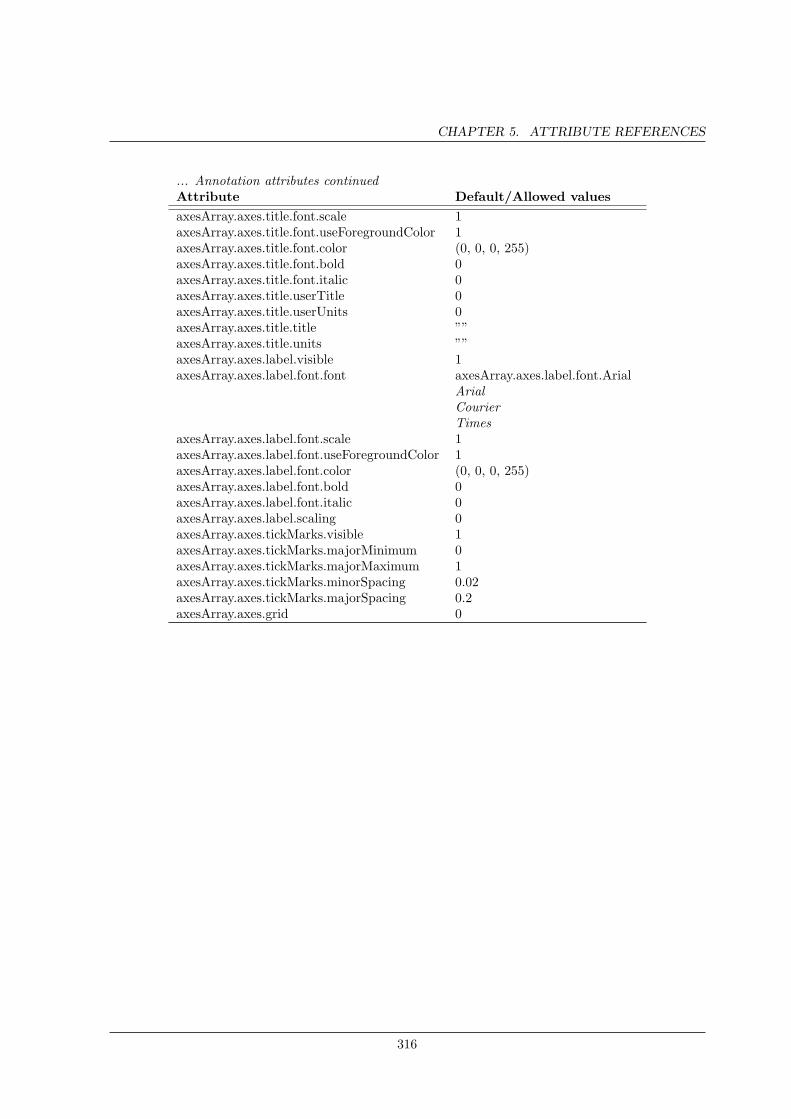
CHAPTER 5. ATTRIBUTE REFERENCES
... Annotation attributes continuedAttribute Default/Allowed valuesaxesArray.axes.title.font.scale 1axesArray.axes.title.font.useForegroundColor 1axesArray.axes.title.font.color (0, 0, 0, 255)axesArray.axes.title.font.bold 0axesArray.axes.title.font.italic 0axesArray.axes.title.userTitle 0axesArray.axes.title.userUnits 0axesArray.axes.title.title ””axesArray.axes.title.units ””axesArray.axes.label.visible 1axesArray.axes.label.font.font axesArray.axes.label.font.Arial
ArialCourierTimes
axesArray.axes.label.font.scale 1axesArray.axes.label.font.useForegroundColor 1axesArray.axes.label.font.color (0, 0, 0, 255)axesArray.axes.label.font.bold 0axesArray.axes.label.font.italic 0axesArray.axes.label.scaling 0axesArray.axes.tickMarks.visible 1axesArray.axes.tickMarks.majorMinimum 0axesArray.axes.tickMarks.majorMaximum 1axesArray.axes.tickMarks.minorSpacing 0.02axesArray.axes.tickMarks.majorSpacing 0.2axesArray.axes.grid 0
316
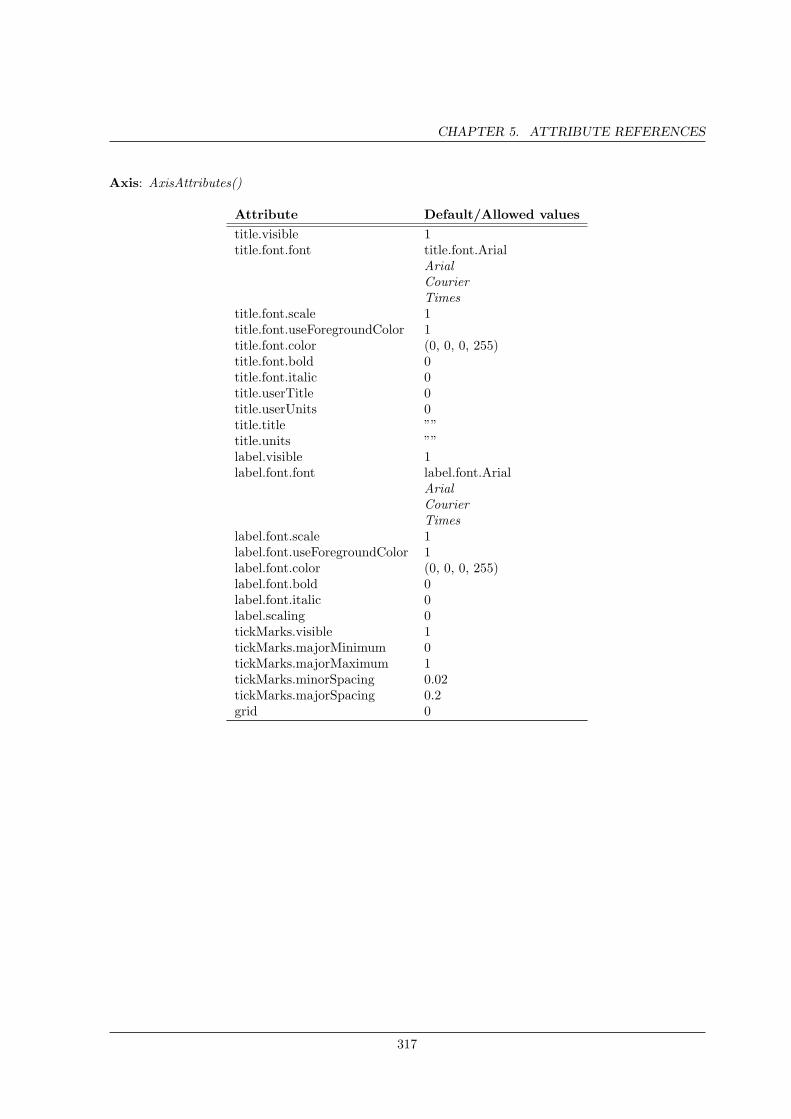
CHAPTER 5. ATTRIBUTE REFERENCES
Axis: AxisAttributes()
Attribute Default/Allowed valuestitle.visible 1title.font.font title.font.Arial
ArialCourierTimes
title.font.scale 1title.font.useForegroundColor 1title.font.color (0, 0, 0, 255)title.font.bold 0title.font.italic 0title.userTitle 0title.userUnits 0title.title ””title.units ””label.visible 1label.font.font label.font.Arial
ArialCourierTimes
label.font.scale 1label.font.useForegroundColor 1label.font.color (0, 0, 0, 255)label.font.bold 0label.font.italic 0label.scaling 0tickMarks.visible 1tickMarks.majorMinimum 0tickMarks.majorMaximum 1tickMarks.minorSpacing 0.02tickMarks.majorSpacing 0.2grid 0
317
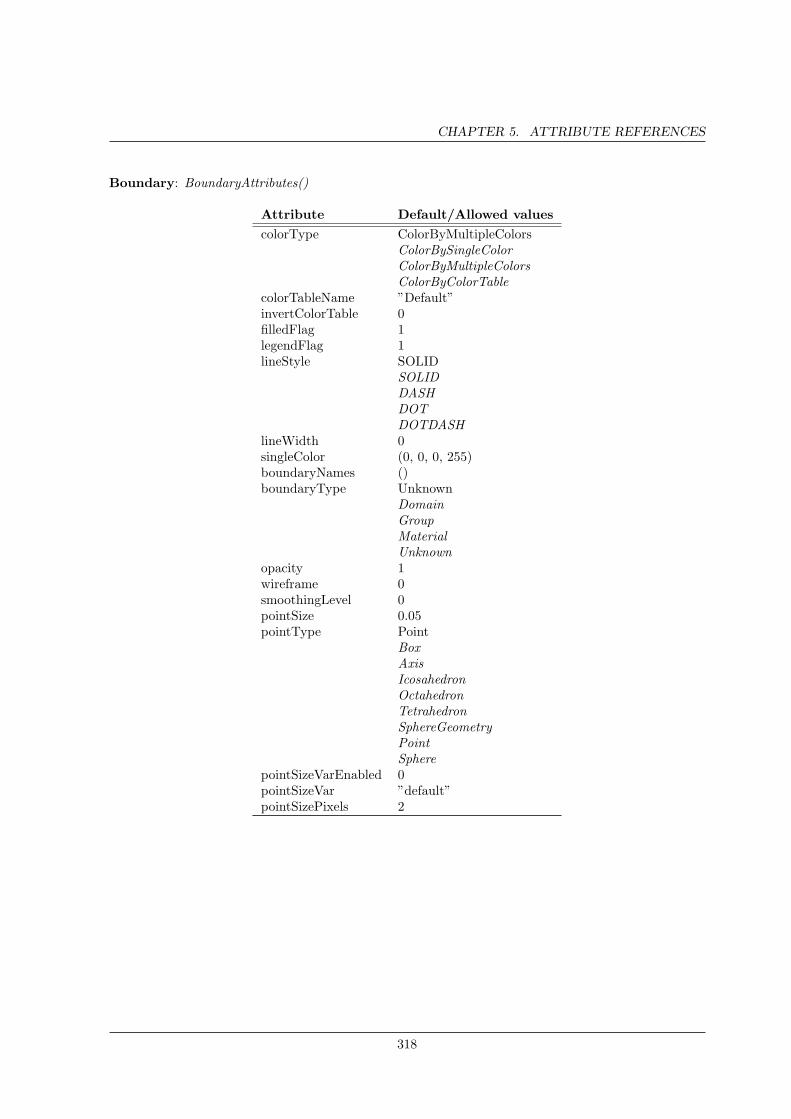
CHAPTER 5. ATTRIBUTE REFERENCES
Boundary: BoundaryAttributes()
Attribute Default/Allowed valuescolorType ColorByMultipleColors
ColorBySingleColorColorByMultipleColorsColorByColorTable
colorTableName ”Default”invertColorTable 0filledFlag 1legendFlag 1lineStyle SOLID
SOLIDDASHDOTDOTDASH
lineWidth 0singleColor (0, 0, 0, 255)boundaryNames ()boundaryType Unknown
DomainGroupMaterialUnknown
opacity 1wireframe 0smoothingLevel 0pointSize 0.05pointType Point
BoxAxisIcosahedronOctahedronTetrahedronSphereGeometryPointSphere
pointSizeVarEnabled 0pointSizeVar ”default”pointSizePixels 2
318
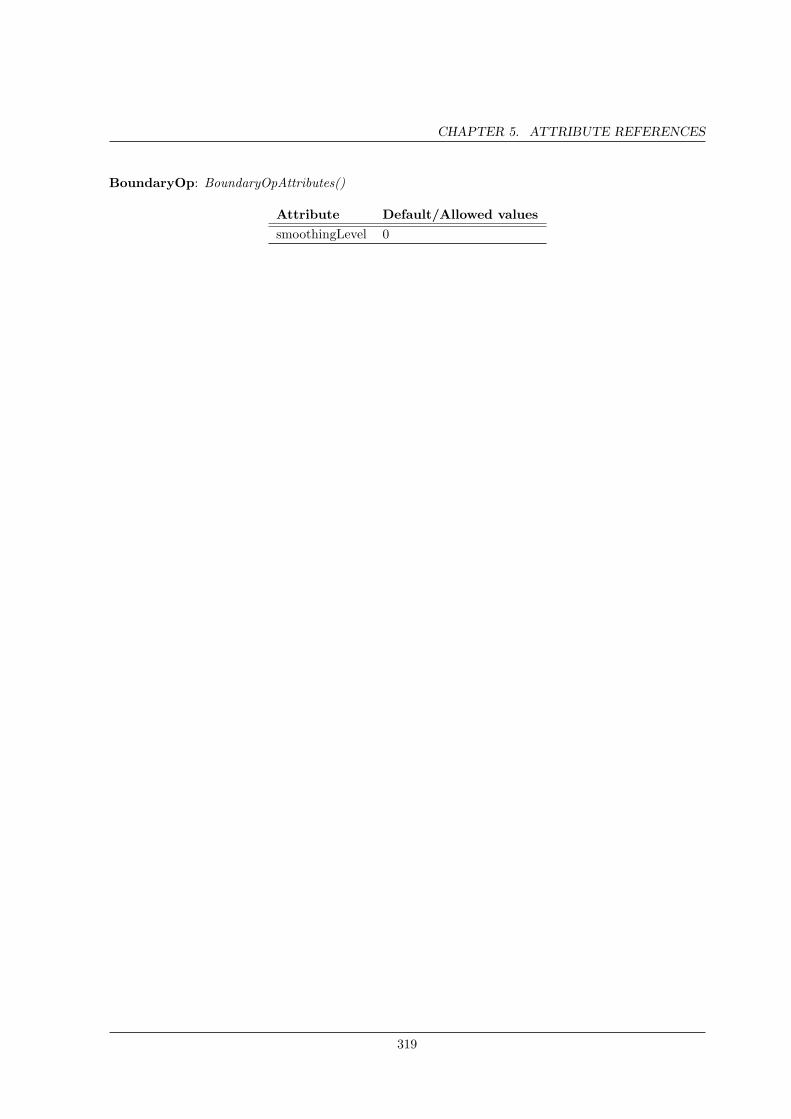
CHAPTER 5. ATTRIBUTE REFERENCES
BoundaryOp: BoundaryOpAttributes()
Attribute Default/Allowed valuessmoothingLevel 0
319
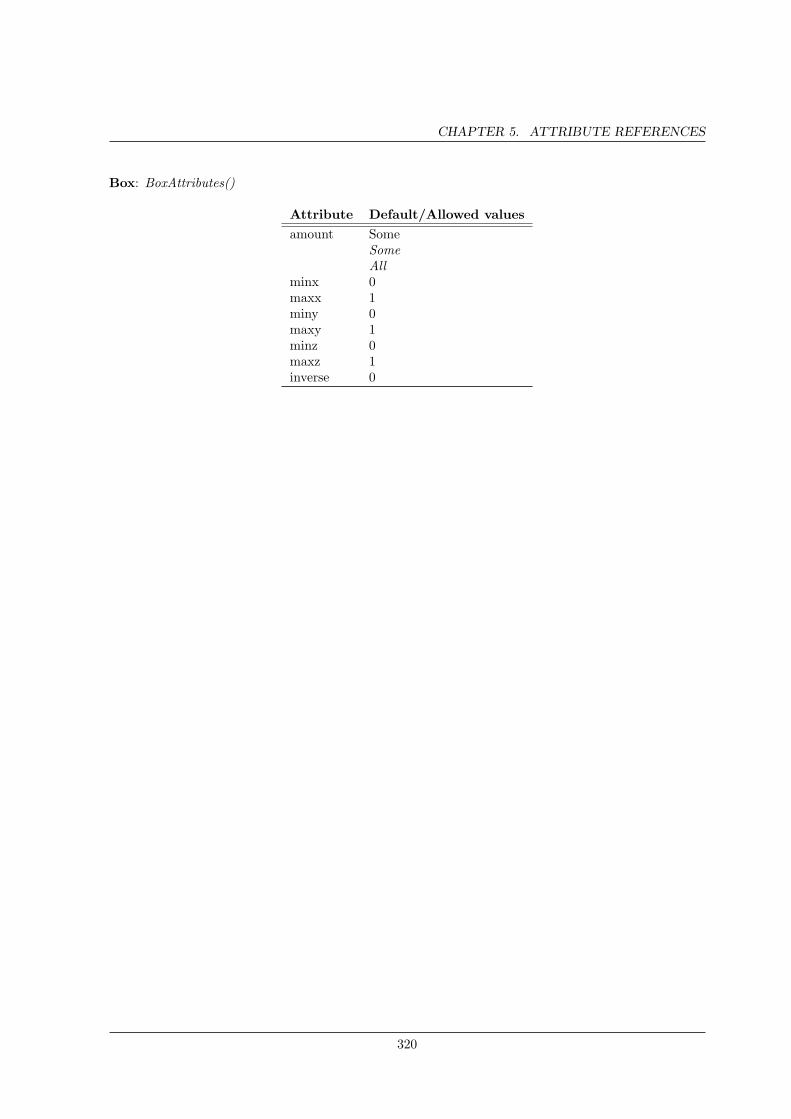
CHAPTER 5. ATTRIBUTE REFERENCES
Box: BoxAttributes()
Attribute Default/Allowed valuesamount Some
SomeAll
minx 0maxx 1miny 0maxy 1minz 0maxz 1inverse 0
320

CHAPTER 5. ATTRIBUTE REFERENCES
CartographicProjection: CartographicProjectionAttributes()
Attribute Default/Allowed valuesprojectionID aitoff
aitoffeck4eqdchammerlaealccmercmillmollorthowink2
centralMeridian 0
321
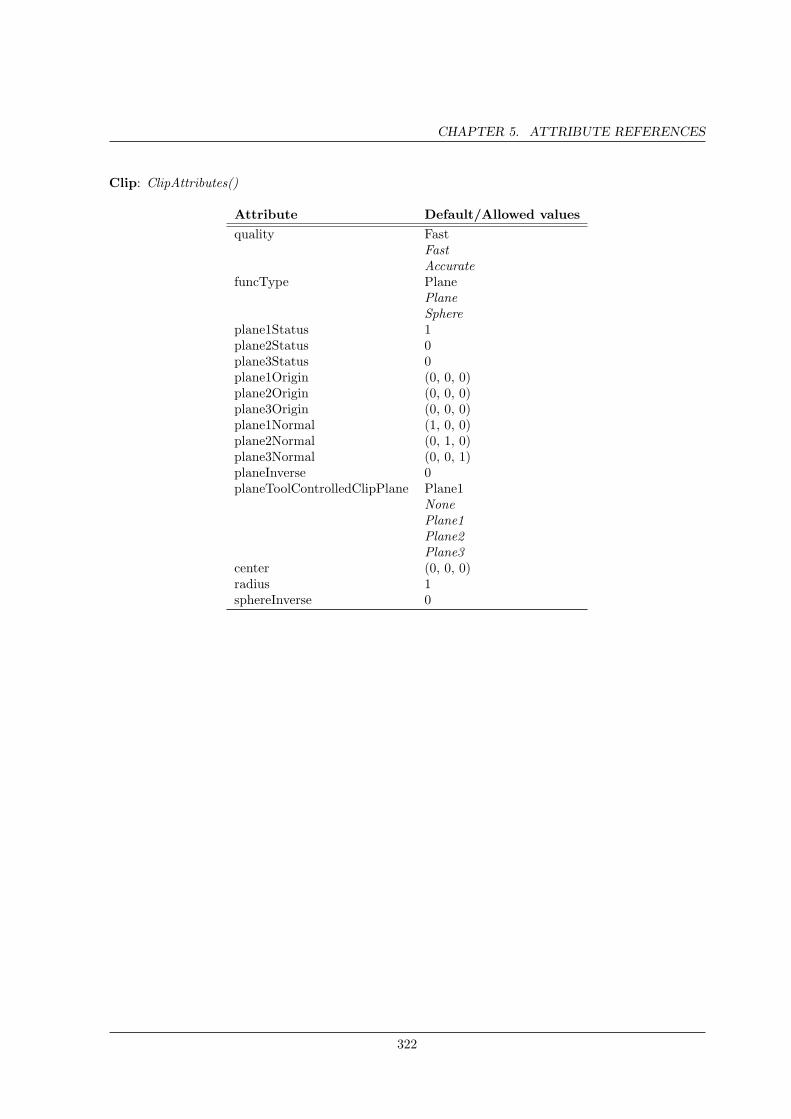
CHAPTER 5. ATTRIBUTE REFERENCES
Clip: ClipAttributes()
Attribute Default/Allowed valuesquality Fast
FastAccurate
funcType PlanePlaneSphere
plane1Status 1plane2Status 0plane3Status 0plane1Origin (0, 0, 0)plane2Origin (0, 0, 0)plane3Origin (0, 0, 0)plane1Normal (1, 0, 0)plane2Normal (0, 1, 0)plane3Normal (0, 0, 1)planeInverse 0planeToolControlledClipPlane Plane1
NonePlane1Plane2Plane3
center (0, 0, 0)radius 1sphereInverse 0
322
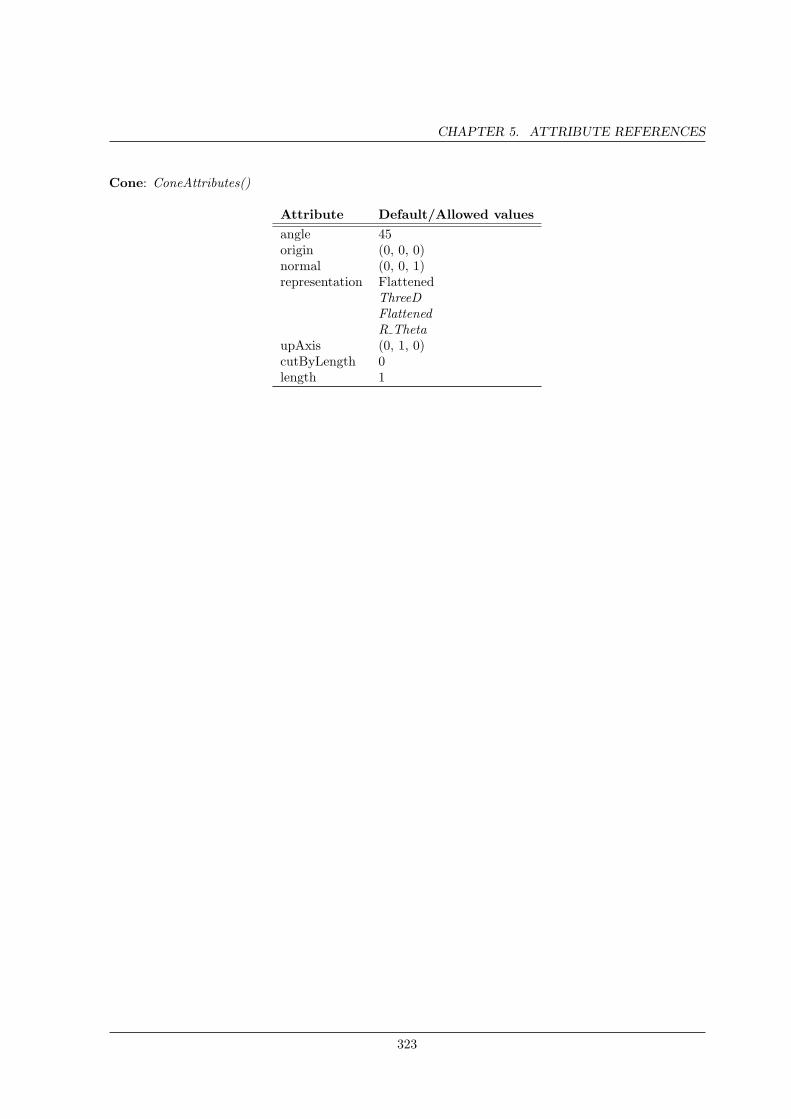
CHAPTER 5. ATTRIBUTE REFERENCES
Cone: ConeAttributes()
Attribute Default/Allowed valuesangle 45origin (0, 0, 0)normal (0, 0, 1)representation Flattened
ThreeDFlattenedR Theta
upAxis (0, 1, 0)cutByLength 0length 1
323
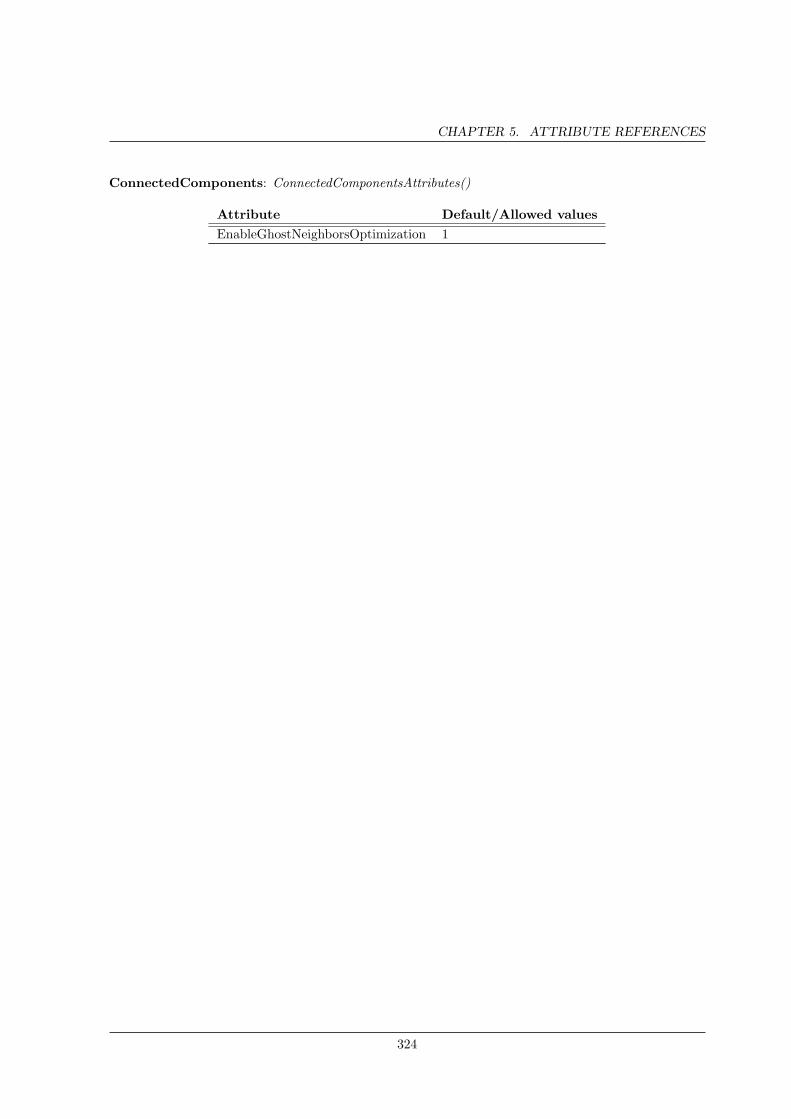
CHAPTER 5. ATTRIBUTE REFERENCES
ConnectedComponents: ConnectedComponentsAttributes()
Attribute Default/Allowed valuesEnableGhostNeighborsOptimization 1
324
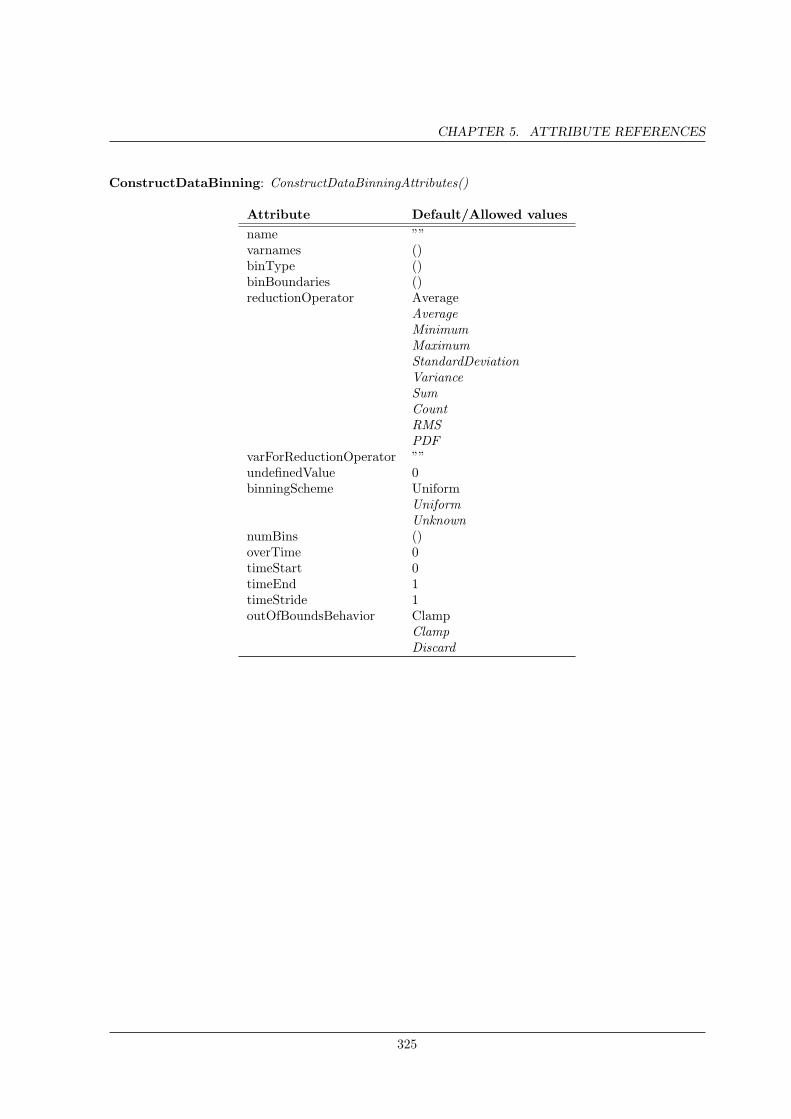
CHAPTER 5. ATTRIBUTE REFERENCES
ConstructDataBinning: ConstructDataBinningAttributes()
Attribute Default/Allowed valuesname ””varnames ()binType ()binBoundaries ()reductionOperator Average
AverageMinimumMaximumStandardDeviationVarianceSumCountRMSPDF
varForReductionOperator ””undefinedValue 0binningScheme Uniform
UniformUnknown
numBins ()overTime 0timeStart 0timeEnd 1timeStride 1outOfBoundsBehavior Clamp
ClampDiscard
325
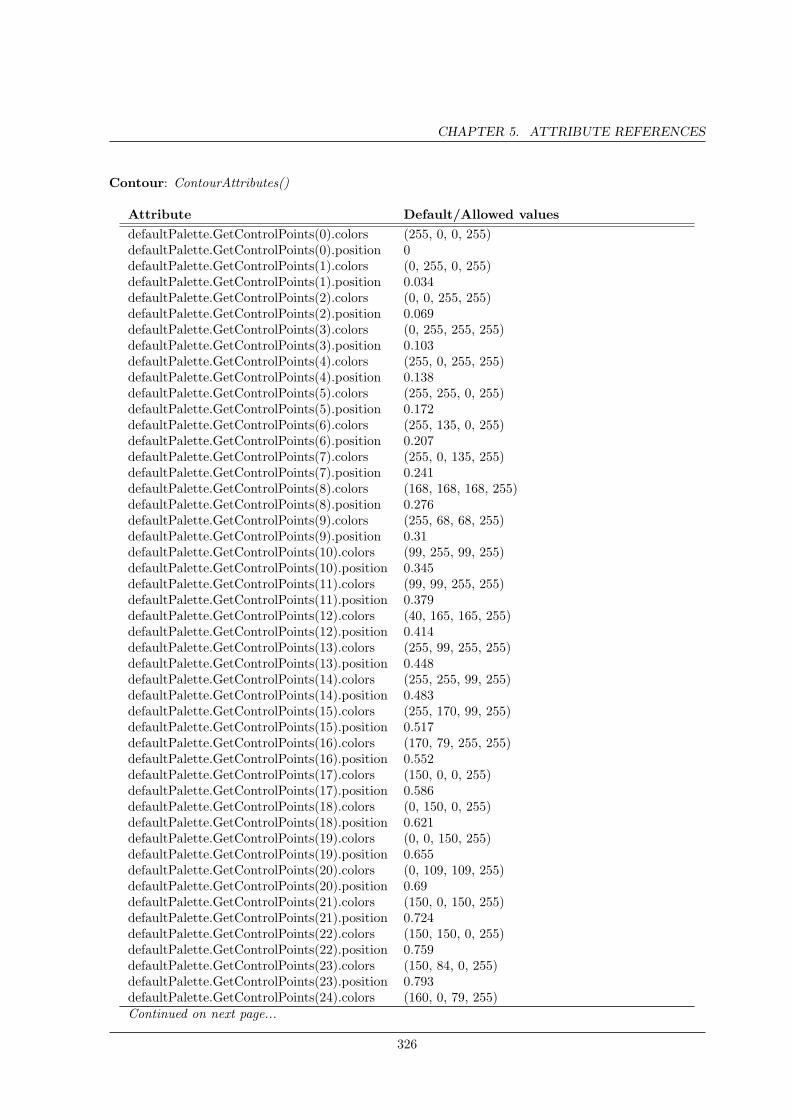
CHAPTER 5. ATTRIBUTE REFERENCES
Contour: ContourAttributes()
Attribute Default/Allowed valuesdefaultPalette.GetControlPoints(0).colors (255, 0, 0, 255)defaultPalette.GetControlPoints(0).position 0defaultPalette.GetControlPoints(1).colors (0, 255, 0, 255)defaultPalette.GetControlPoints(1).position 0.034defaultPalette.GetControlPoints(2).colors (0, 0, 255, 255)defaultPalette.GetControlPoints(2).position 0.069defaultPalette.GetControlPoints(3).colors (0, 255, 255, 255)defaultPalette.GetControlPoints(3).position 0.103defaultPalette.GetControlPoints(4).colors (255, 0, 255, 255)defaultPalette.GetControlPoints(4).position 0.138defaultPalette.GetControlPoints(5).colors (255, 255, 0, 255)defaultPalette.GetControlPoints(5).position 0.172defaultPalette.GetControlPoints(6).colors (255, 135, 0, 255)defaultPalette.GetControlPoints(6).position 0.207defaultPalette.GetControlPoints(7).colors (255, 0, 135, 255)defaultPalette.GetControlPoints(7).position 0.241defaultPalette.GetControlPoints(8).colors (168, 168, 168, 255)defaultPalette.GetControlPoints(8).position 0.276defaultPalette.GetControlPoints(9).colors (255, 68, 68, 255)defaultPalette.GetControlPoints(9).position 0.31defaultPalette.GetControlPoints(10).colors (99, 255, 99, 255)defaultPalette.GetControlPoints(10).position 0.345defaultPalette.GetControlPoints(11).colors (99, 99, 255, 255)defaultPalette.GetControlPoints(11).position 0.379defaultPalette.GetControlPoints(12).colors (40, 165, 165, 255)defaultPalette.GetControlPoints(12).position 0.414defaultPalette.GetControlPoints(13).colors (255, 99, 255, 255)defaultPalette.GetControlPoints(13).position 0.448defaultPalette.GetControlPoints(14).colors (255, 255, 99, 255)defaultPalette.GetControlPoints(14).position 0.483defaultPalette.GetControlPoints(15).colors (255, 170, 99, 255)defaultPalette.GetControlPoints(15).position 0.517defaultPalette.GetControlPoints(16).colors (170, 79, 255, 255)defaultPalette.GetControlPoints(16).position 0.552defaultPalette.GetControlPoints(17).colors (150, 0, 0, 255)defaultPalette.GetControlPoints(17).position 0.586defaultPalette.GetControlPoints(18).colors (0, 150, 0, 255)defaultPalette.GetControlPoints(18).position 0.621defaultPalette.GetControlPoints(19).colors (0, 0, 150, 255)defaultPalette.GetControlPoints(19).position 0.655defaultPalette.GetControlPoints(20).colors (0, 109, 109, 255)defaultPalette.GetControlPoints(20).position 0.69defaultPalette.GetControlPoints(21).colors (150, 0, 150, 255)defaultPalette.GetControlPoints(21).position 0.724defaultPalette.GetControlPoints(22).colors (150, 150, 0, 255)defaultPalette.GetControlPoints(22).position 0.759defaultPalette.GetControlPoints(23).colors (150, 84, 0, 255)defaultPalette.GetControlPoints(23).position 0.793defaultPalette.GetControlPoints(24).colors (160, 0, 79, 255)Continued on next page...
326
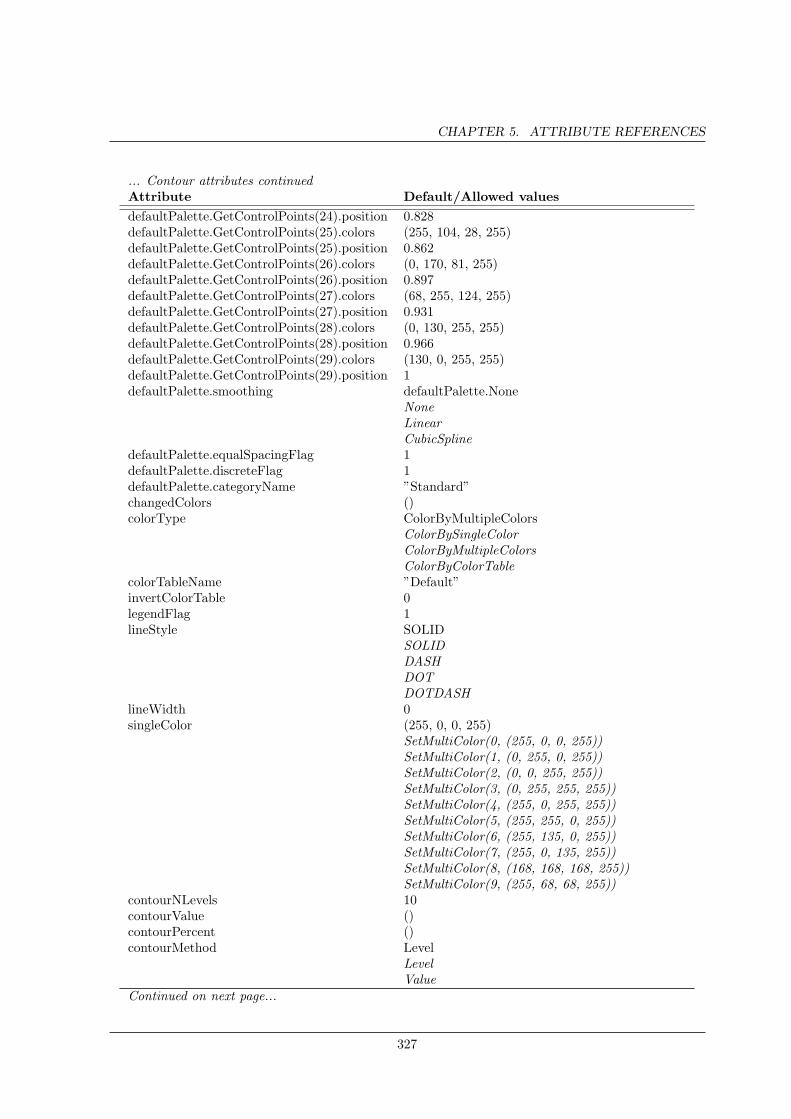
CHAPTER 5. ATTRIBUTE REFERENCES
... Contour attributes continuedAttribute Default/Allowed valuesdefaultPalette.GetControlPoints(24).position 0.828defaultPalette.GetControlPoints(25).colors (255, 104, 28, 255)defaultPalette.GetControlPoints(25).position 0.862defaultPalette.GetControlPoints(26).colors (0, 170, 81, 255)defaultPalette.GetControlPoints(26).position 0.897defaultPalette.GetControlPoints(27).colors (68, 255, 124, 255)defaultPalette.GetControlPoints(27).position 0.931defaultPalette.GetControlPoints(28).colors (0, 130, 255, 255)defaultPalette.GetControlPoints(28).position 0.966defaultPalette.GetControlPoints(29).colors (130, 0, 255, 255)defaultPalette.GetControlPoints(29).position 1defaultPalette.smoothing defaultPalette.None
NoneLinearCubicSpline
defaultPalette.equalSpacingFlag 1defaultPalette.discreteFlag 1defaultPalette.categoryName ”Standard”changedColors ()colorType ColorByMultipleColors
ColorBySingleColorColorByMultipleColorsColorByColorTable
colorTableName ”Default”invertColorTable 0legendFlag 1lineStyle SOLID
SOLIDDASHDOTDOTDASH
lineWidth 0singleColor (255, 0, 0, 255)
SetMultiColor(0, (255, 0, 0, 255))SetMultiColor(1, (0, 255, 0, 255))SetMultiColor(2, (0, 0, 255, 255))SetMultiColor(3, (0, 255, 255, 255))SetMultiColor(4, (255, 0, 255, 255))SetMultiColor(5, (255, 255, 0, 255))SetMultiColor(6, (255, 135, 0, 255))SetMultiColor(7, (255, 0, 135, 255))SetMultiColor(8, (168, 168, 168, 255))SetMultiColor(9, (255, 68, 68, 255))
contourNLevels 10contourValue ()contourPercent ()contourMethod Level
LevelValue
Continued on next page...
327
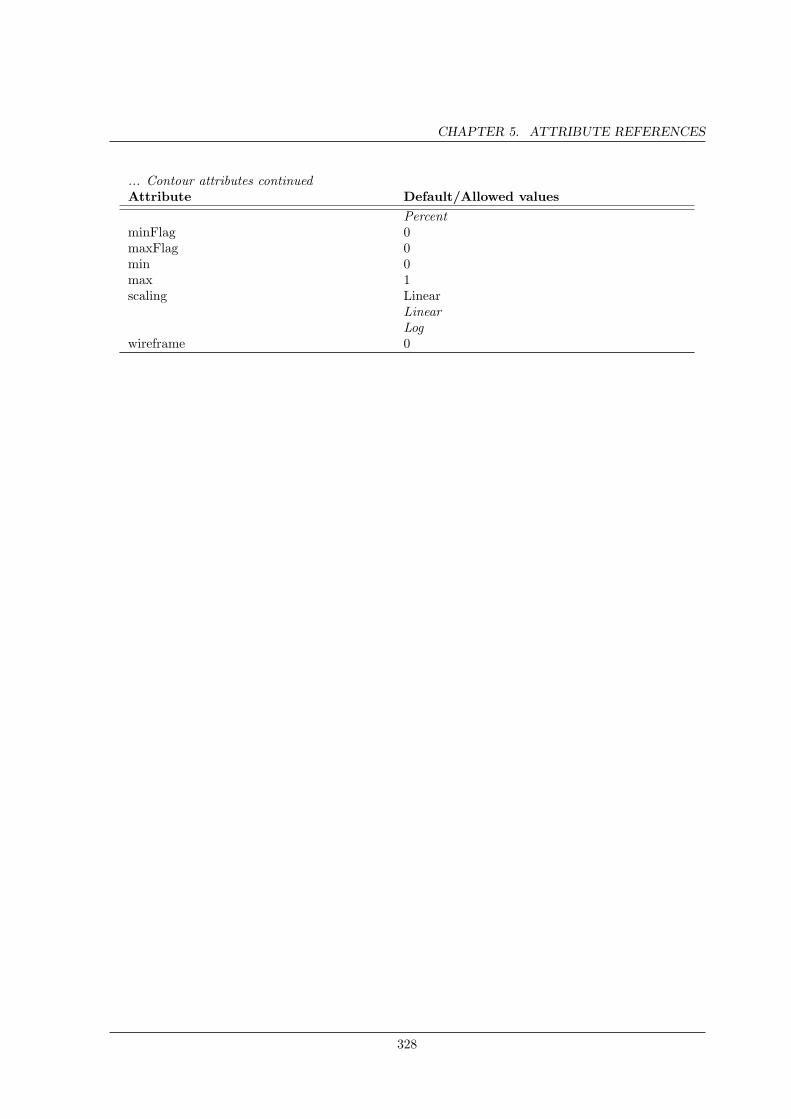
CHAPTER 5. ATTRIBUTE REFERENCES
... Contour attributes continuedAttribute Default/Allowed values
PercentminFlag 0maxFlag 0min 0max 1scaling Linear
LinearLog
wireframe 0
328
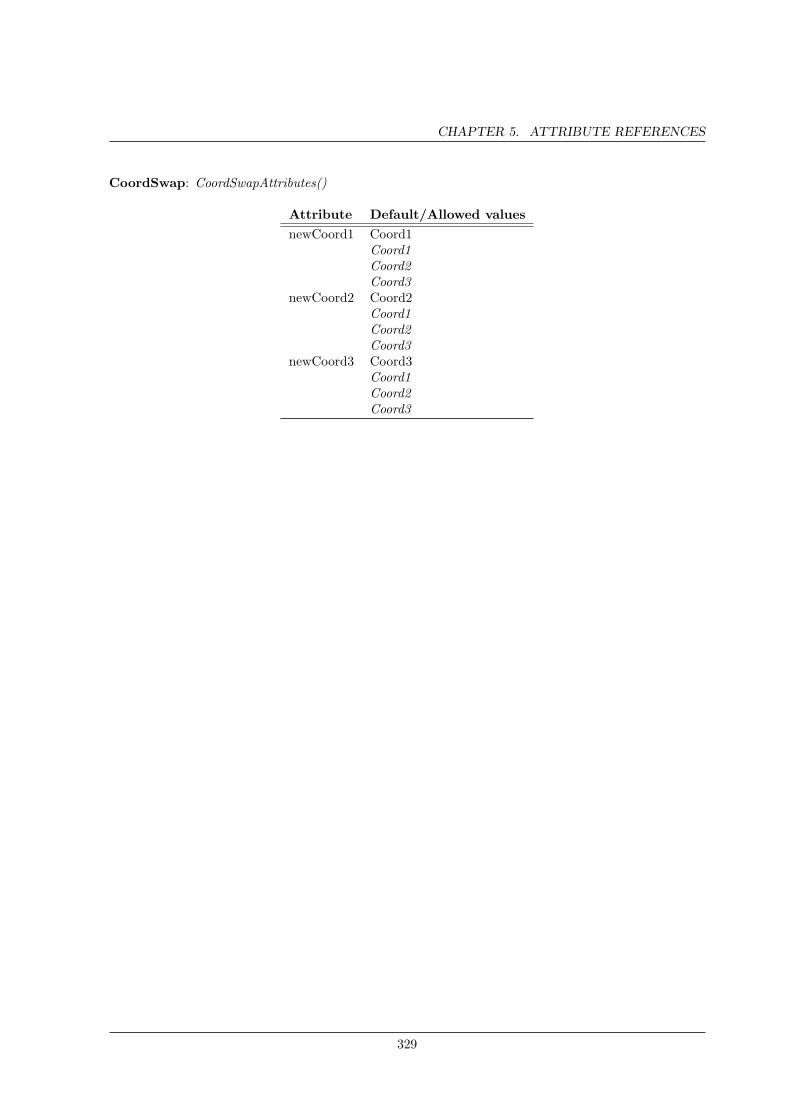
CHAPTER 5. ATTRIBUTE REFERENCES
CoordSwap: CoordSwapAttributes()
Attribute Default/Allowed valuesnewCoord1 Coord1
Coord1Coord2Coord3
newCoord2 Coord2Coord1Coord2Coord3
newCoord3 Coord3Coord1Coord2Coord3
329
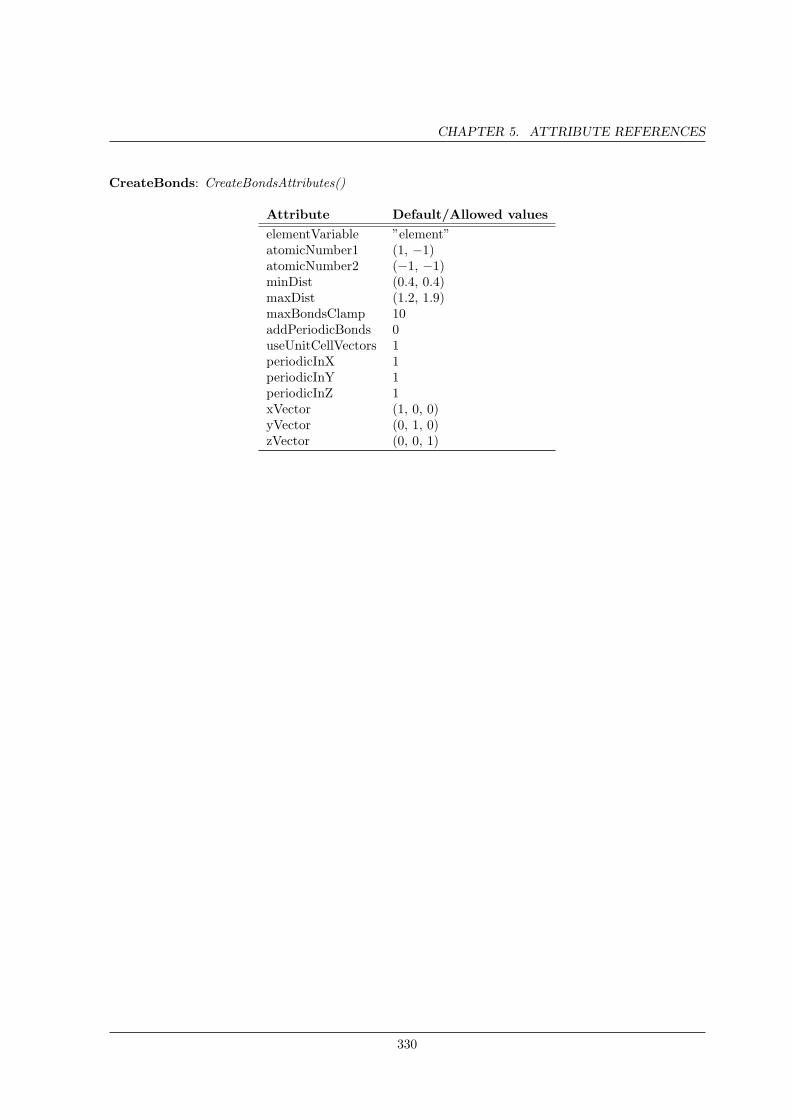
CHAPTER 5. ATTRIBUTE REFERENCES
CreateBonds: CreateBondsAttributes()
Attribute Default/Allowed valueselementVariable ”element”atomicNumber1 (1, −1)atomicNumber2 (−1, −1)minDist (0.4, 0.4)maxDist (1.2, 1.9)maxBondsClamp 10addPeriodicBonds 0useUnitCellVectors 1periodicInX 1periodicInY 1periodicInZ 1xVector (1, 0, 0)yVector (0, 1, 0)zVector (0, 0, 1)
330
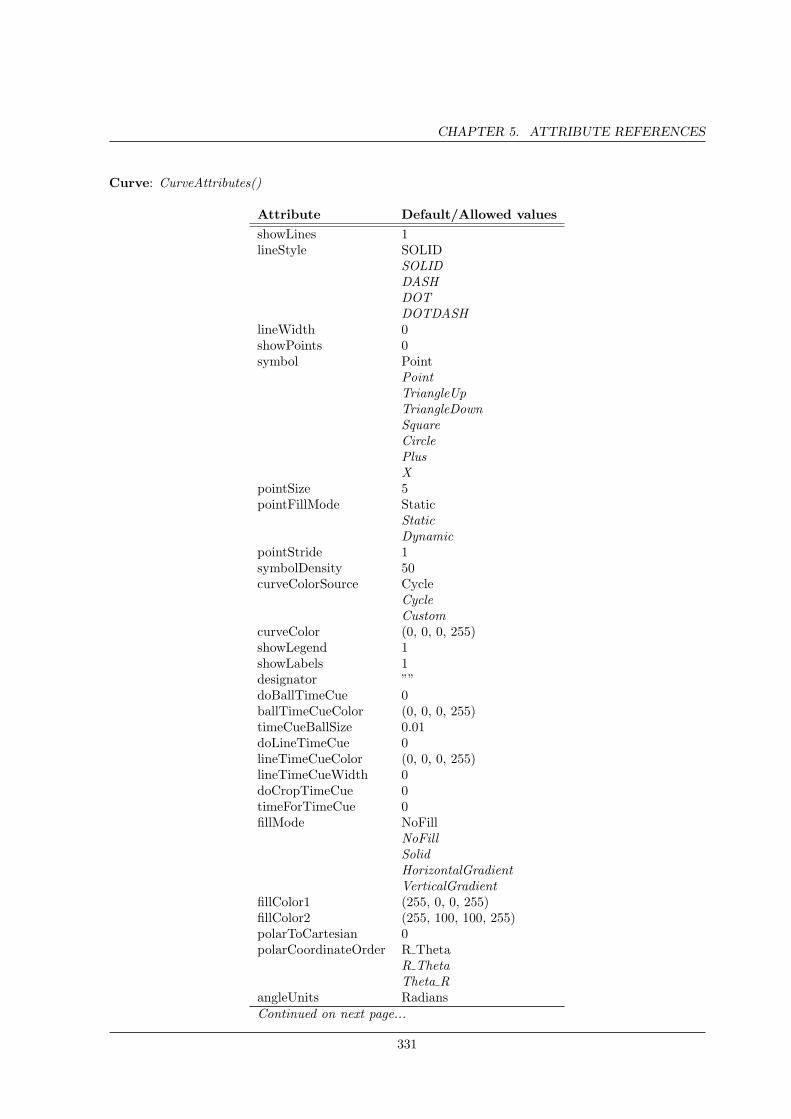
CHAPTER 5. ATTRIBUTE REFERENCES
Curve: CurveAttributes()
Attribute Default/Allowed valuesshowLines 1lineStyle SOLID
SOLIDDASHDOTDOTDASH
lineWidth 0showPoints 0symbol Point
PointTriangleUpTriangleDownSquareCirclePlusX
pointSize 5pointFillMode Static
StaticDynamic
pointStride 1symbolDensity 50curveColorSource Cycle
CycleCustom
curveColor (0, 0, 0, 255)showLegend 1showLabels 1designator ””doBallTimeCue 0ballTimeCueColor (0, 0, 0, 255)timeCueBallSize 0.01doLineTimeCue 0lineTimeCueColor (0, 0, 0, 255)lineTimeCueWidth 0doCropTimeCue 0timeForTimeCue 0fillMode NoFill
NoFillSolidHorizontalGradientVerticalGradient
fillColor1 (255, 0, 0, 255)fillColor2 (255, 100, 100, 255)polarToCartesian 0polarCoordinateOrder R Theta
R ThetaTheta R
angleUnits RadiansContinued on next page...
331

CHAPTER 5. ATTRIBUTE REFERENCES
... Curve attributes continuedAttribute Default/Allowed values
RadiansDegrees
332
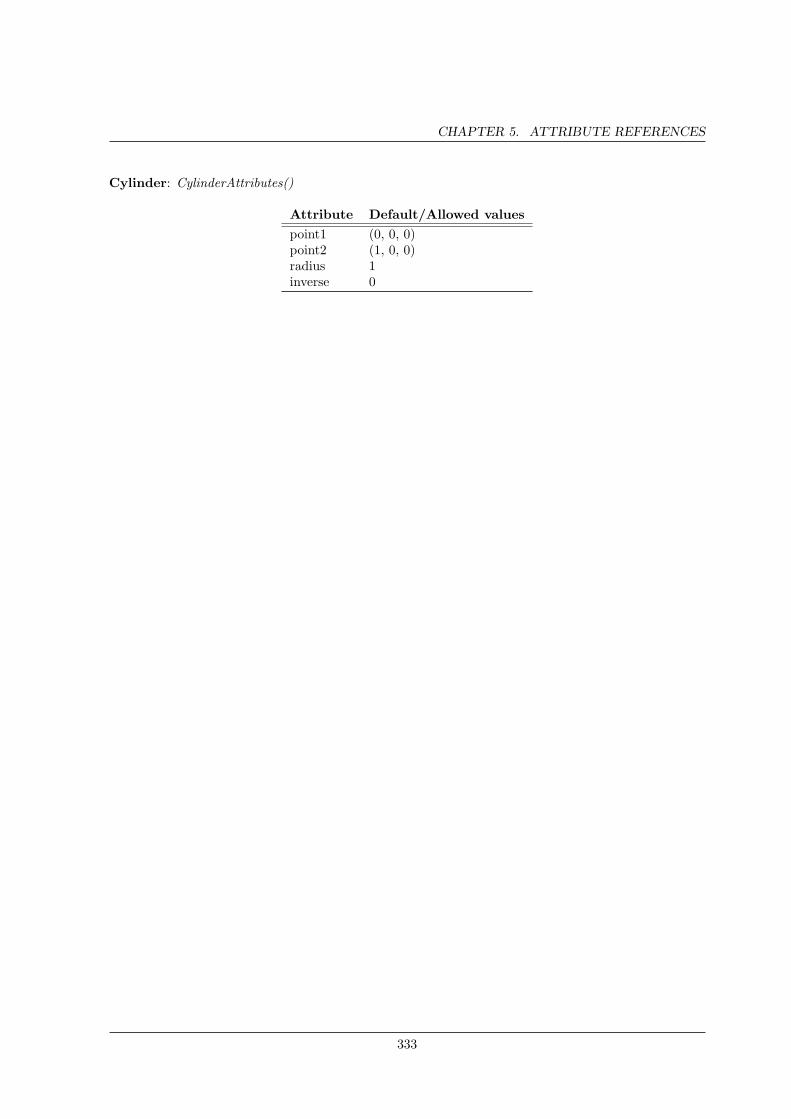
CHAPTER 5. ATTRIBUTE REFERENCES
Cylinder: CylinderAttributes()
Attribute Default/Allowed valuespoint1 (0, 0, 0)point2 (1, 0, 0)radius 1inverse 0
333
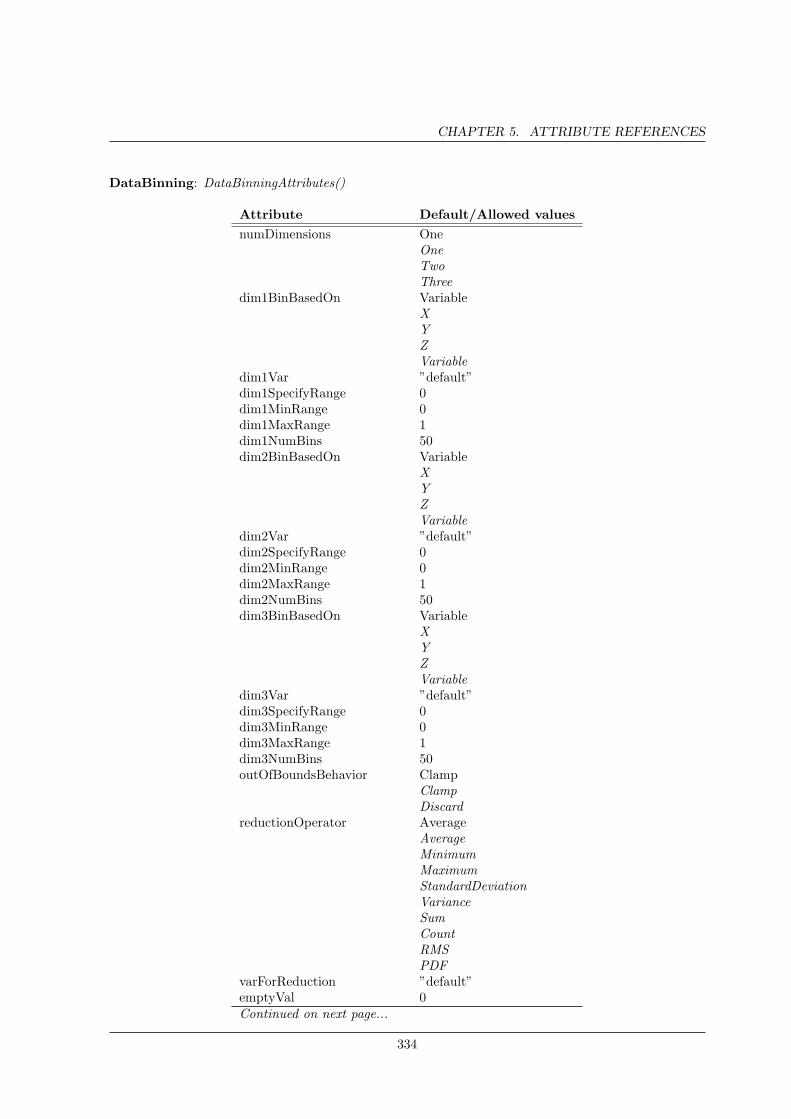
CHAPTER 5. ATTRIBUTE REFERENCES
DataBinning: DataBinningAttributes()
Attribute Default/Allowed valuesnumDimensions One
OneTwoThree
dim1BinBasedOn VariableXYZVariable
dim1Var ”default”dim1SpecifyRange 0dim1MinRange 0dim1MaxRange 1dim1NumBins 50dim2BinBasedOn Variable
XYZVariable
dim2Var ”default”dim2SpecifyRange 0dim2MinRange 0dim2MaxRange 1dim2NumBins 50dim3BinBasedOn Variable
XYZVariable
dim3Var ”default”dim3SpecifyRange 0dim3MinRange 0dim3MaxRange 1dim3NumBins 50outOfBoundsBehavior Clamp
ClampDiscard
reductionOperator AverageAverageMinimumMaximumStandardDeviationVarianceSumCountRMSPDF
varForReduction ”default”emptyVal 0Continued on next page...
334
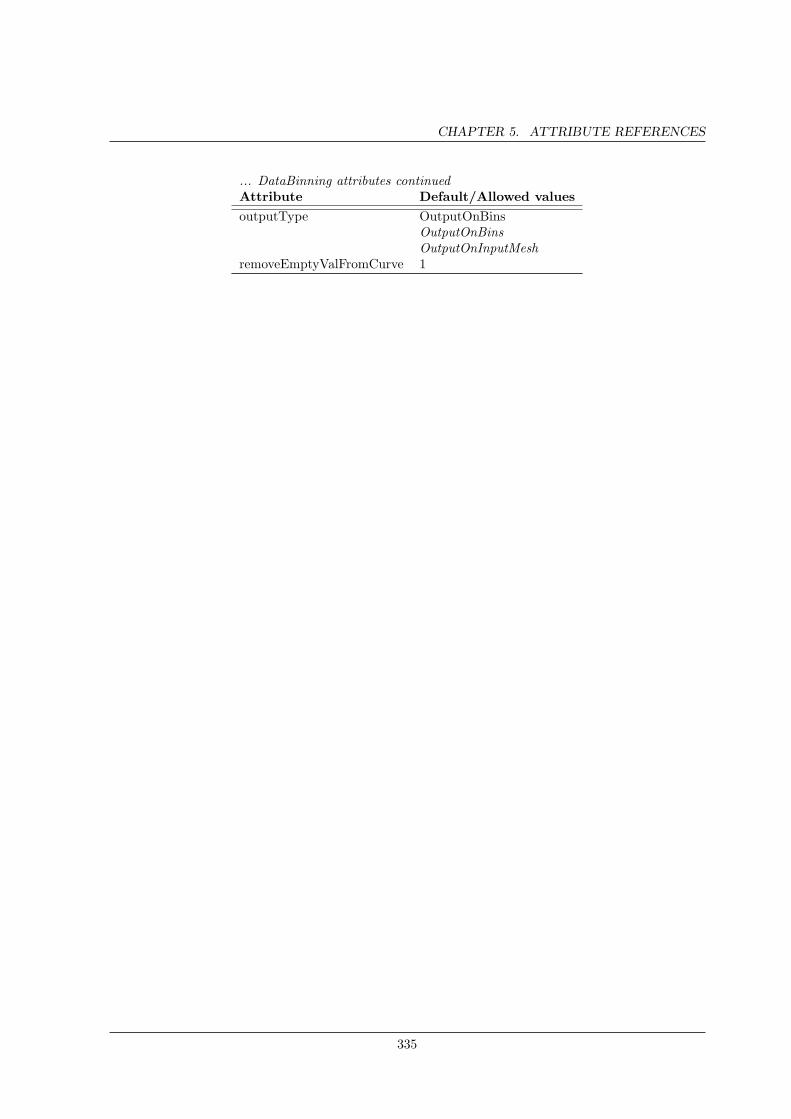
CHAPTER 5. ATTRIBUTE REFERENCES
... DataBinning attributes continuedAttribute Default/Allowed valuesoutputType OutputOnBins
OutputOnBinsOutputOnInputMesh
removeEmptyValFromCurve 1
335
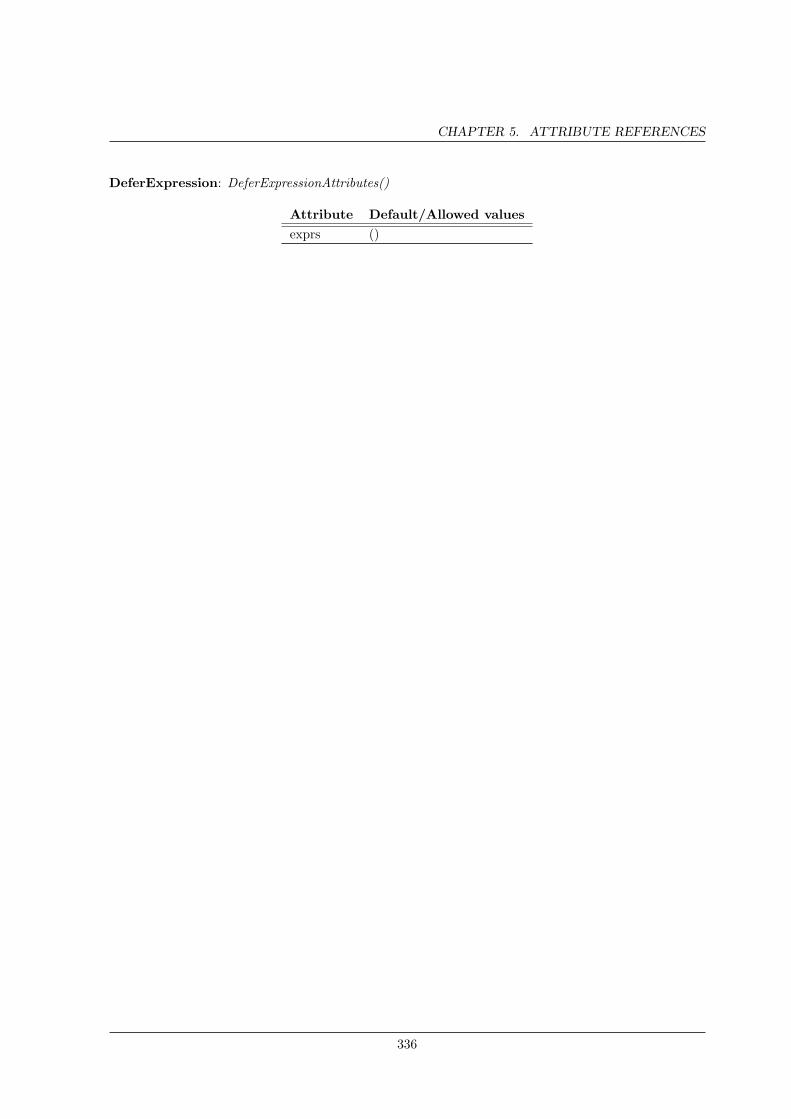
CHAPTER 5. ATTRIBUTE REFERENCES
DeferExpression: DeferExpressionAttributes()
Attribute Default/Allowed valuesexprs ()
336

CHAPTER 5. ATTRIBUTE REFERENCES
Displace: DisplaceAttributes()
Attribute Default/Allowed valuesfactor 1variable ”default”
337
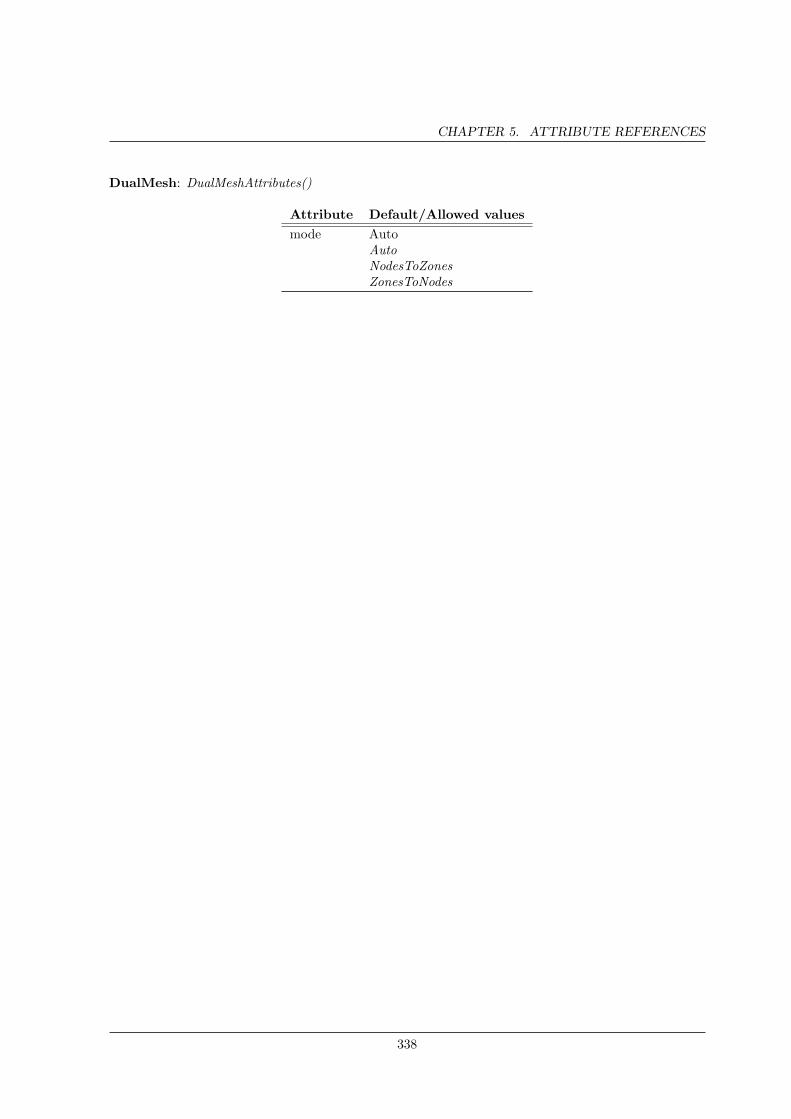
CHAPTER 5. ATTRIBUTE REFERENCES
DualMesh: DualMeshAttributes()
Attribute Default/Allowed valuesmode Auto
AutoNodesToZonesZonesToNodes
338

CHAPTER 5. ATTRIBUTE REFERENCES
Edge: EdgeAttributes()
Attribute Default/Allowed valuesdummy 1
339
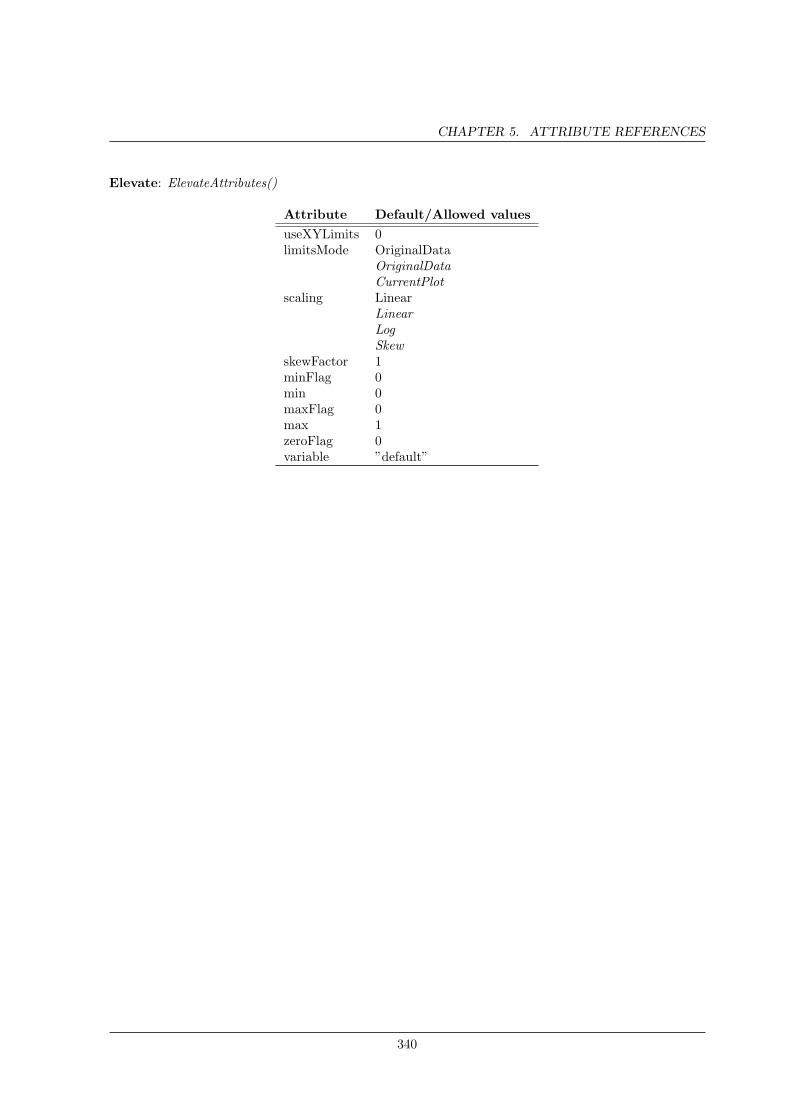
CHAPTER 5. ATTRIBUTE REFERENCES
Elevate: ElevateAttributes()
Attribute Default/Allowed valuesuseXYLimits 0limitsMode OriginalData
OriginalDataCurrentPlot
scaling LinearLinearLogSkew
skewFactor 1minFlag 0min 0maxFlag 0max 1zeroFlag 0variable ”default”
340
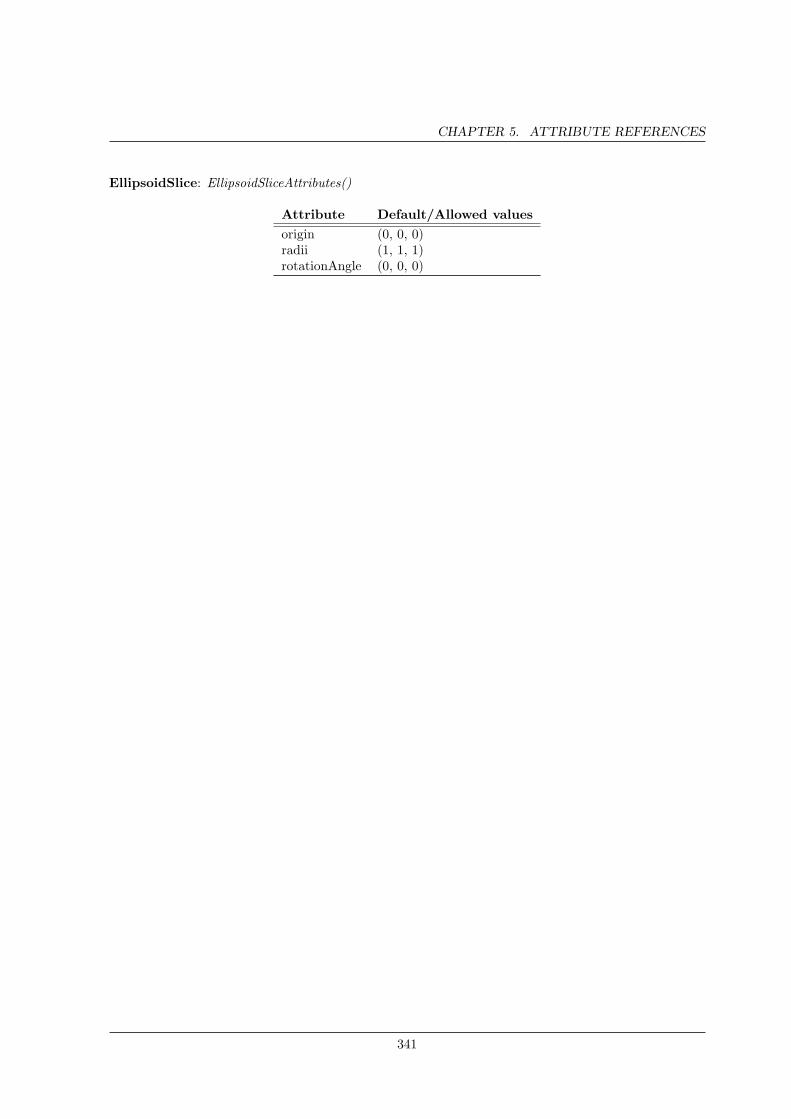
CHAPTER 5. ATTRIBUTE REFERENCES
EllipsoidSlice: EllipsoidSliceAttributes()
Attribute Default/Allowed valuesorigin (0, 0, 0)radii (1, 1, 1)rotationAngle (0, 0, 0)
341
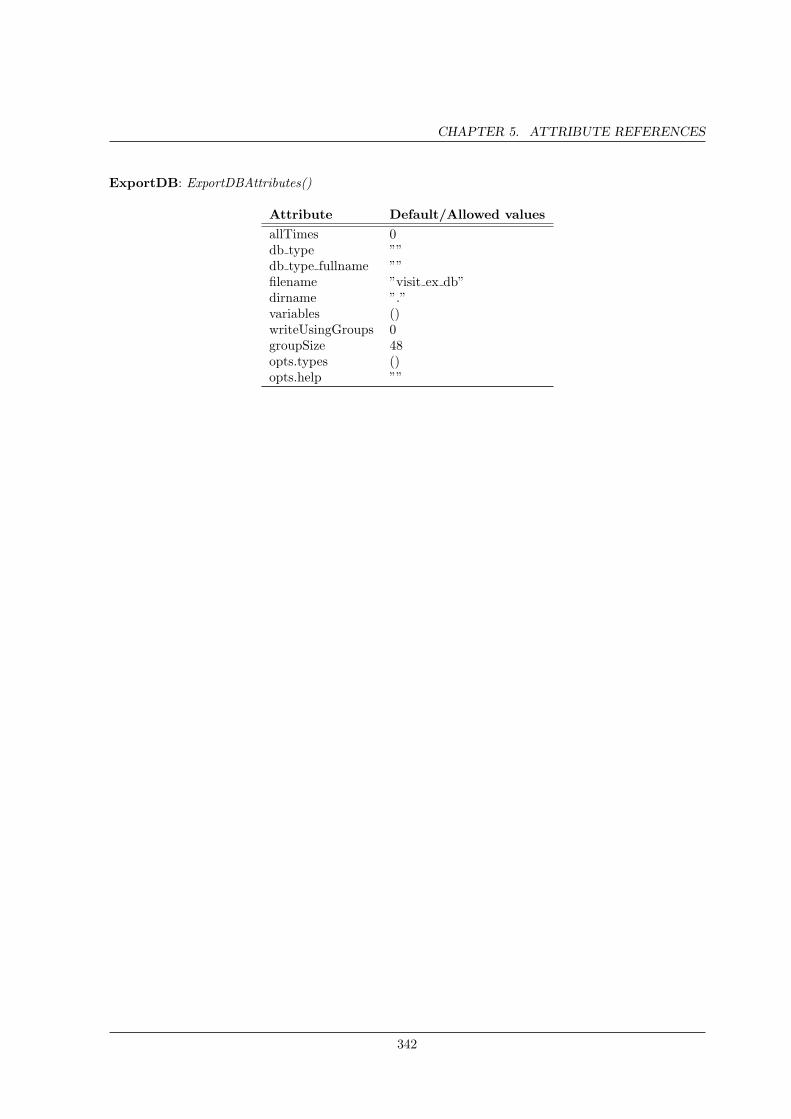
CHAPTER 5. ATTRIBUTE REFERENCES
ExportDB: ExportDBAttributes()
Attribute Default/Allowed valuesallTimes 0db type ””db type fullname ””filename ”visit ex db”dirname ”.”variables ()writeUsingGroups 0groupSize 48opts.types ()opts.help ””
342
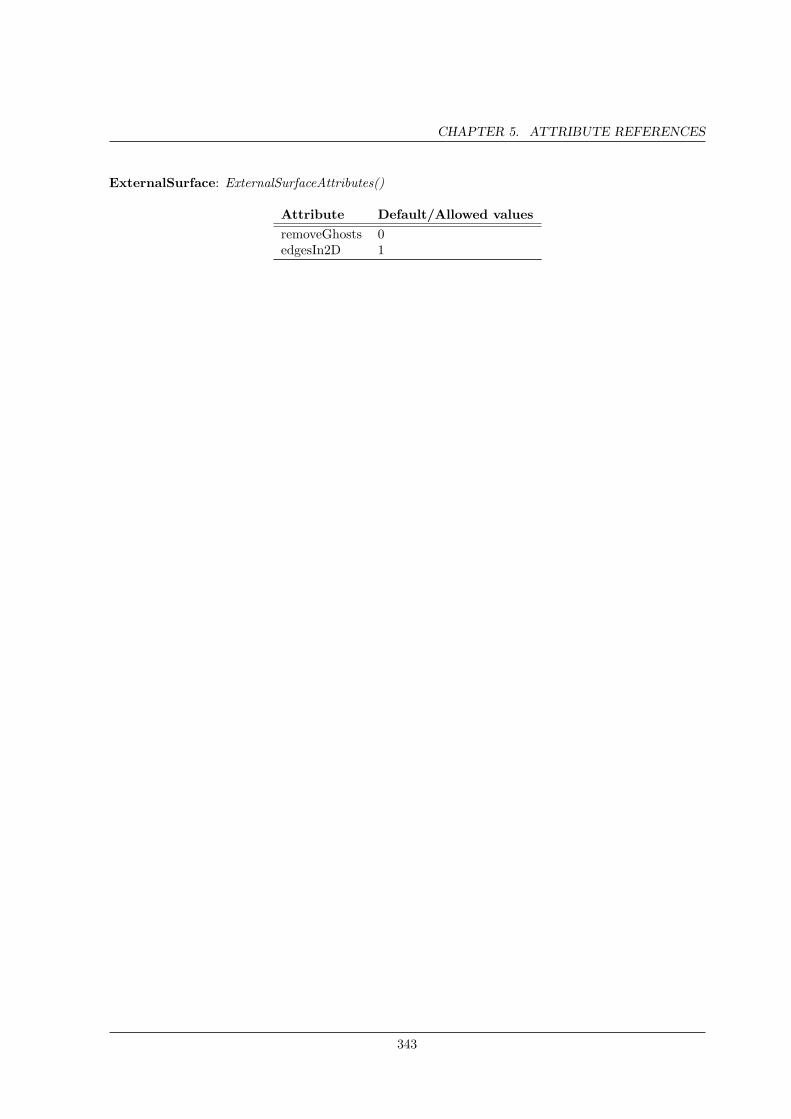
CHAPTER 5. ATTRIBUTE REFERENCES
ExternalSurface: ExternalSurfaceAttributes()
Attribute Default/Allowed valuesremoveGhosts 0edgesIn2D 1
343
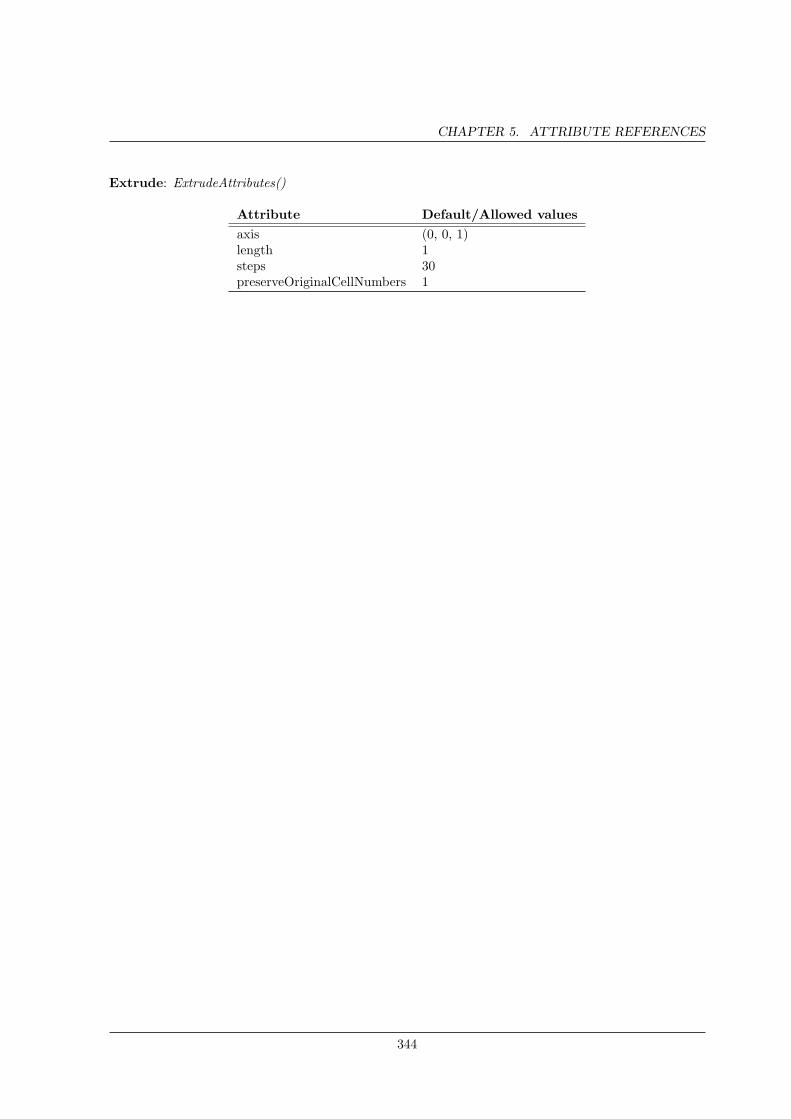
CHAPTER 5. ATTRIBUTE REFERENCES
Extrude: ExtrudeAttributes()
Attribute Default/Allowed valuesaxis (0, 0, 1)length 1steps 30preserveOriginalCellNumbers 1
344
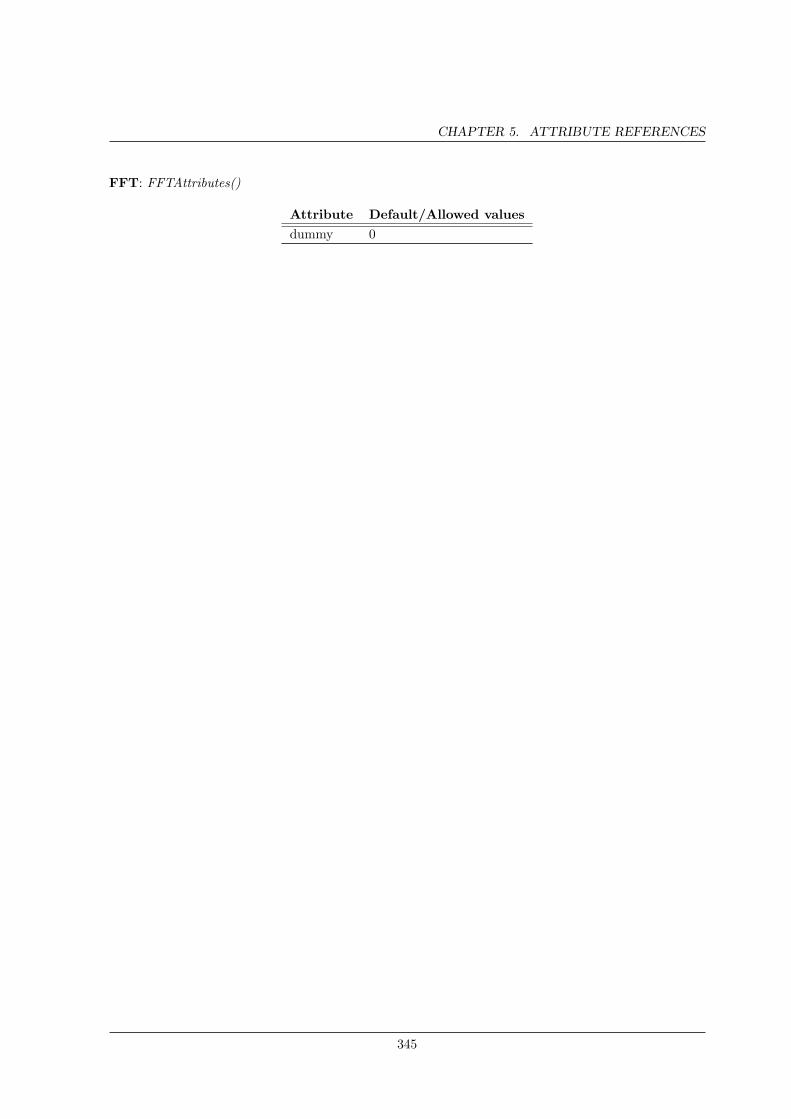
CHAPTER 5. ATTRIBUTE REFERENCES
FFT: FFTAttributes()
Attribute Default/Allowed valuesdummy 0
345
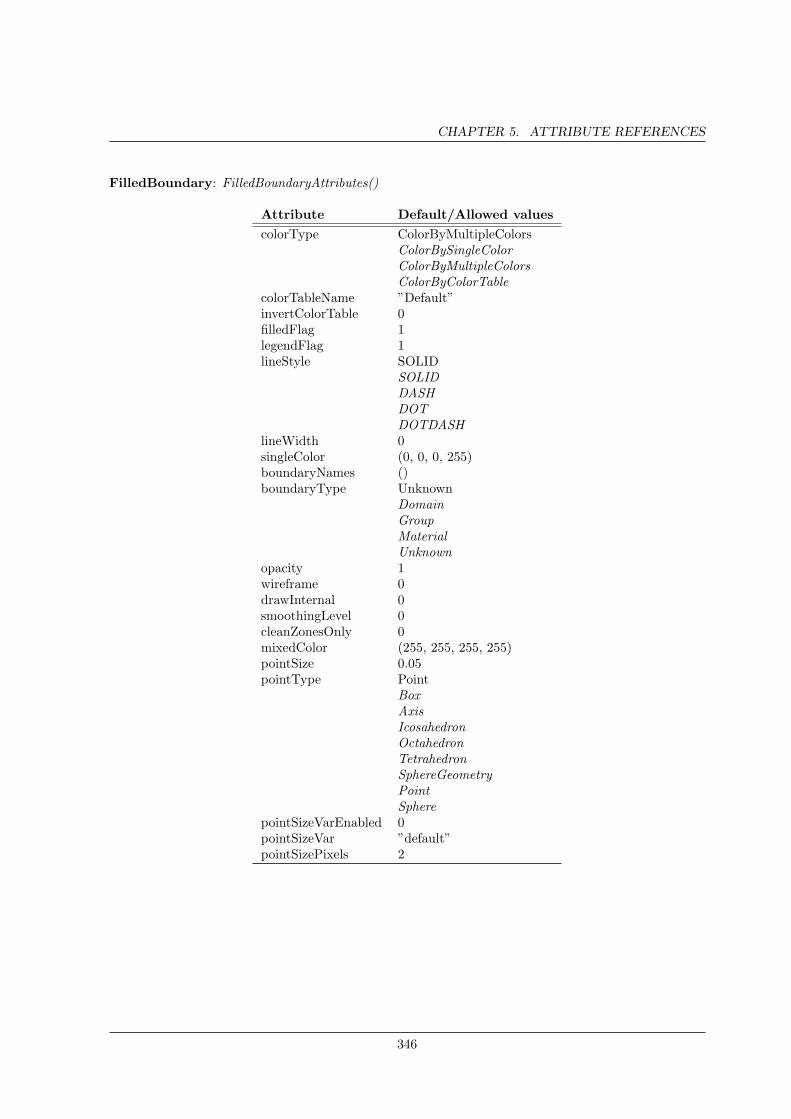
CHAPTER 5. ATTRIBUTE REFERENCES
FilledBoundary: FilledBoundaryAttributes()
Attribute Default/Allowed valuescolorType ColorByMultipleColors
ColorBySingleColorColorByMultipleColorsColorByColorTable
colorTableName ”Default”invertColorTable 0filledFlag 1legendFlag 1lineStyle SOLID
SOLIDDASHDOTDOTDASH
lineWidth 0singleColor (0, 0, 0, 255)boundaryNames ()boundaryType Unknown
DomainGroupMaterialUnknown
opacity 1wireframe 0drawInternal 0smoothingLevel 0cleanZonesOnly 0mixedColor (255, 255, 255, 255)pointSize 0.05pointType Point
BoxAxisIcosahedronOctahedronTetrahedronSphereGeometryPointSphere
pointSizeVarEnabled 0pointSizeVar ”default”pointSizePixels 2
346
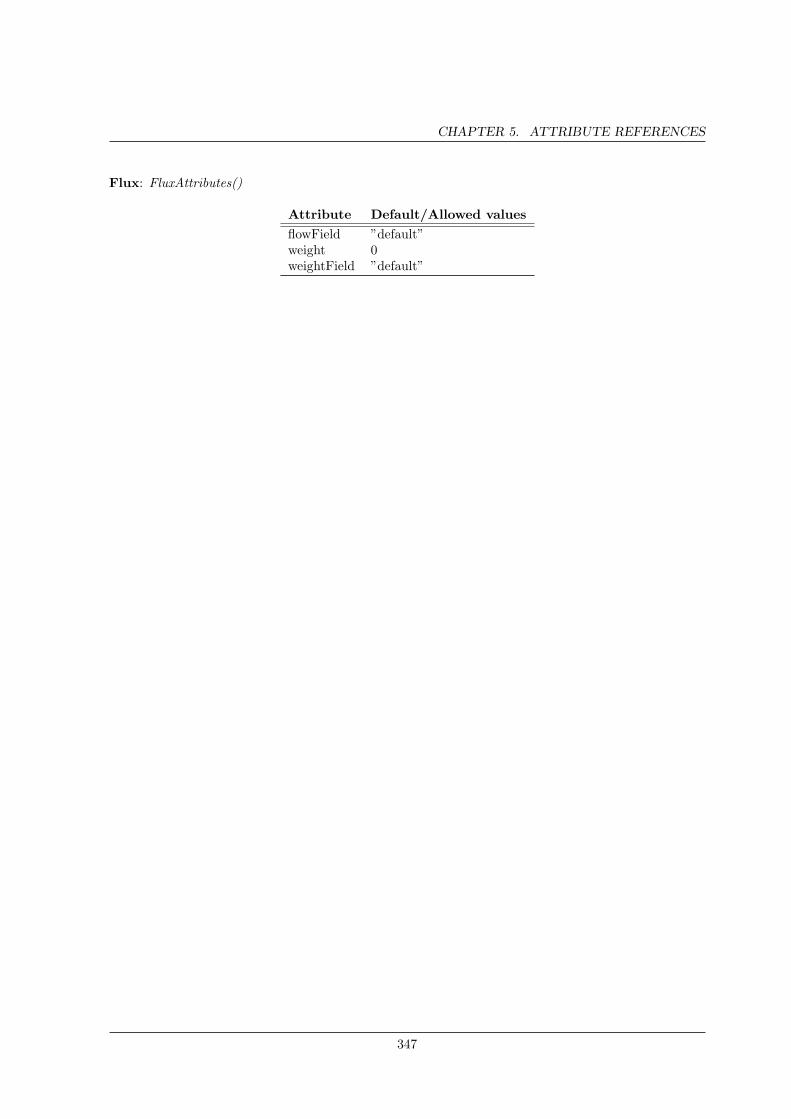
CHAPTER 5. ATTRIBUTE REFERENCES
Flux: FluxAttributes()
Attribute Default/Allowed valuesflowField ”default”weight 0weightField ”default”
347
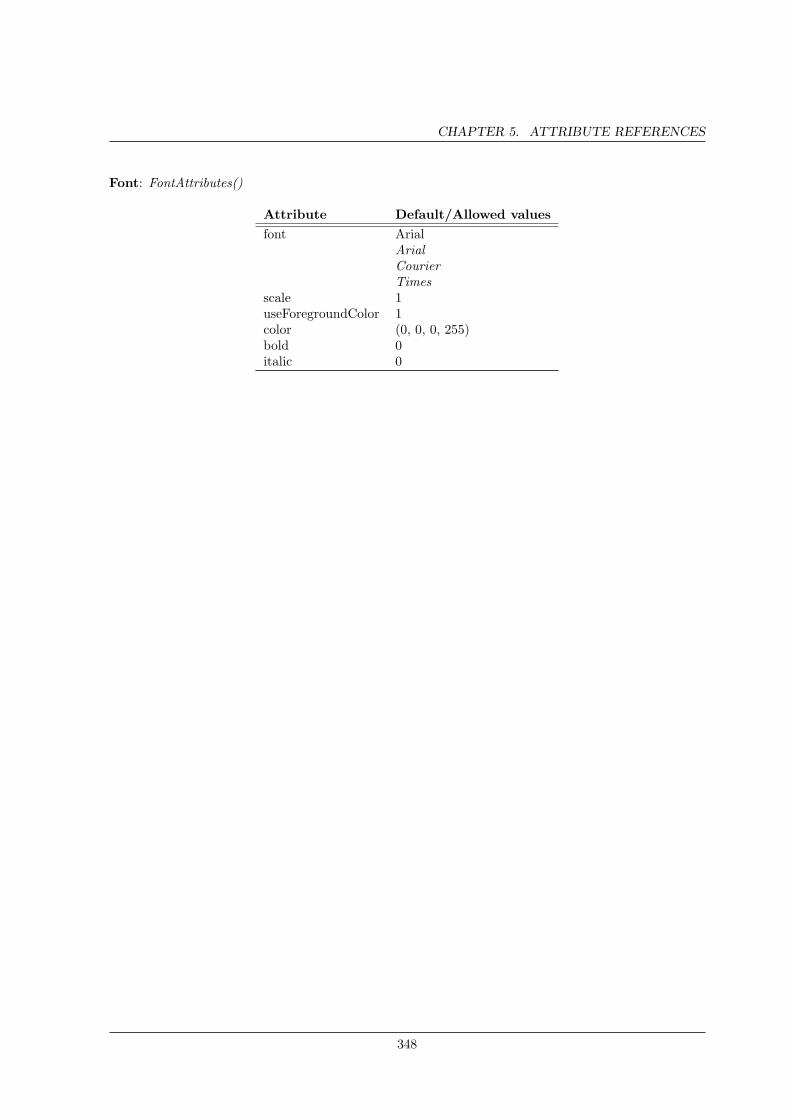
CHAPTER 5. ATTRIBUTE REFERENCES
Font: FontAttributes()
Attribute Default/Allowed valuesfont Arial
ArialCourierTimes
scale 1useForegroundColor 1color (0, 0, 0, 255)bold 0italic 0
348
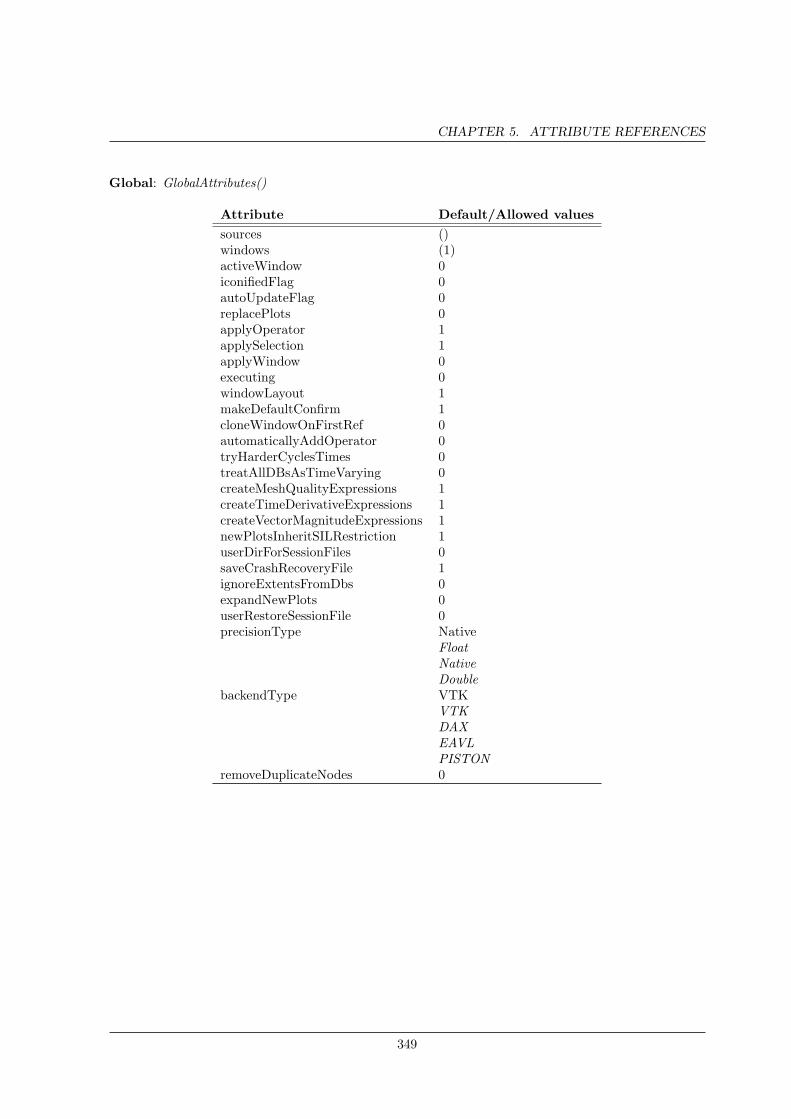
CHAPTER 5. ATTRIBUTE REFERENCES
Global: GlobalAttributes()
Attribute Default/Allowed valuessources ()windows (1)activeWindow 0iconifiedFlag 0autoUpdateFlag 0replacePlots 0applyOperator 1applySelection 1applyWindow 0executing 0windowLayout 1makeDefaultConfirm 1cloneWindowOnFirstRef 0automaticallyAddOperator 0tryHarderCyclesTimes 0treatAllDBsAsTimeVarying 0createMeshQualityExpressions 1createTimeDerivativeExpressions 1createVectorMagnitudeExpressions 1newPlotsInheritSILRestriction 1userDirForSessionFiles 0saveCrashRecoveryFile 1ignoreExtentsFromDbs 0expandNewPlots 0userRestoreSessionFile 0precisionType Native
FloatNativeDouble
backendType VTKVTKDAXEAVLPISTON
removeDuplicateNodes 0
349
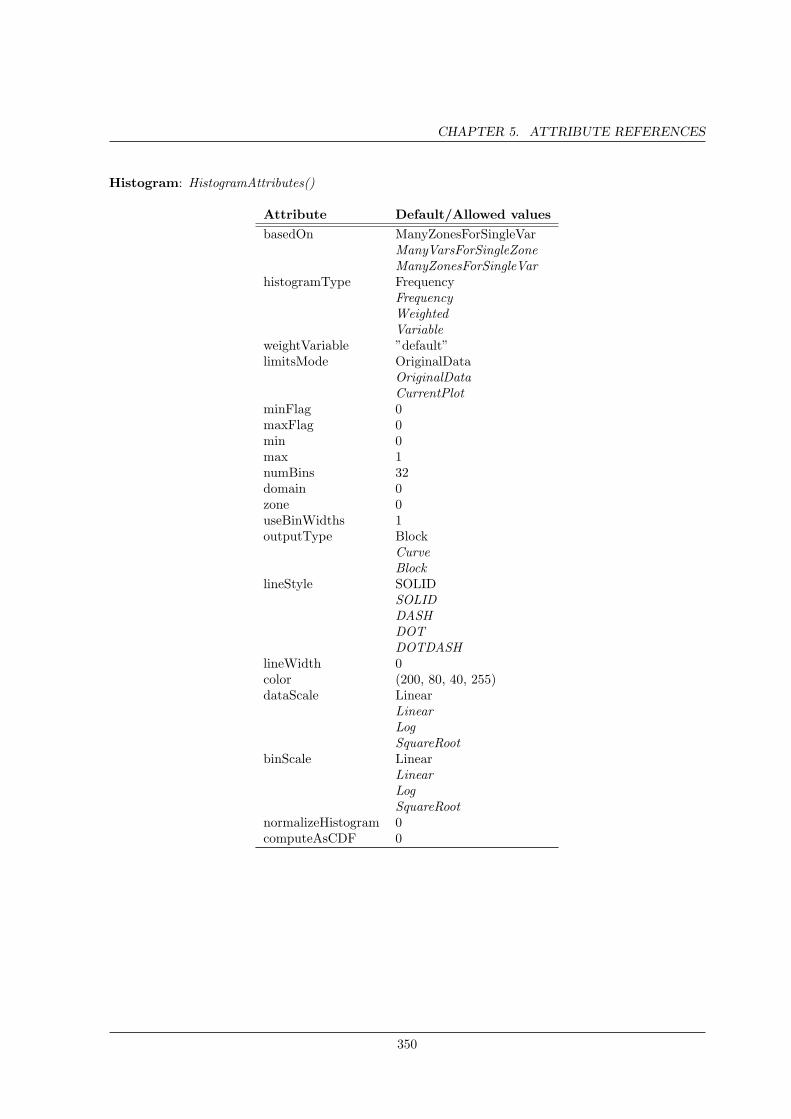
CHAPTER 5. ATTRIBUTE REFERENCES
Histogram: HistogramAttributes()
Attribute Default/Allowed valuesbasedOn ManyZonesForSingleVar
ManyVarsForSingleZoneManyZonesForSingleVar
histogramType FrequencyFrequencyWeightedVariable
weightVariable ”default”limitsMode OriginalData
OriginalDataCurrentPlot
minFlag 0maxFlag 0min 0max 1numBins 32domain 0zone 0useBinWidths 1outputType Block
CurveBlock
lineStyle SOLIDSOLIDDASHDOTDOTDASH
lineWidth 0color (200, 80, 40, 255)dataScale Linear
LinearLogSquareRoot
binScale LinearLinearLogSquareRoot
normalizeHistogram 0computeAsCDF 0
350
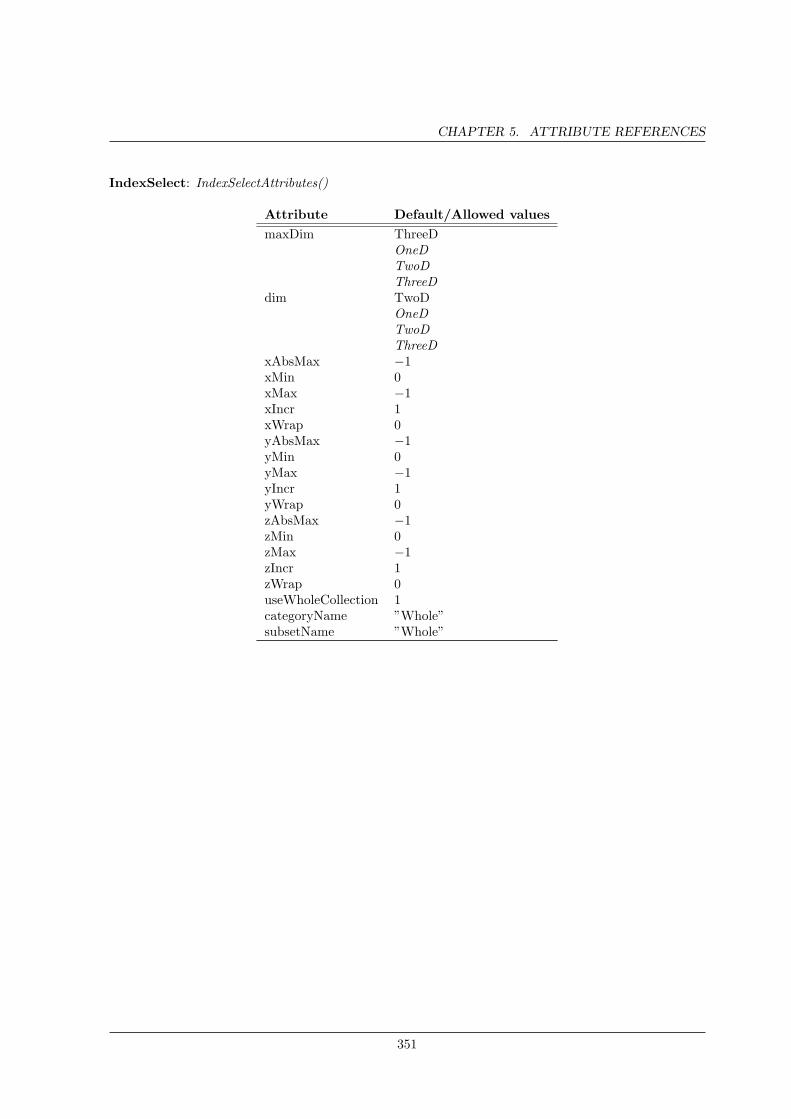
CHAPTER 5. ATTRIBUTE REFERENCES
IndexSelect: IndexSelectAttributes()
Attribute Default/Allowed valuesmaxDim ThreeD
OneDTwoDThreeD
dim TwoDOneDTwoDThreeD
xAbsMax −1xMin 0xMax −1xIncr 1xWrap 0yAbsMax −1yMin 0yMax −1yIncr 1yWrap 0zAbsMax −1zMin 0zMax −1zIncr 1zWrap 0useWholeCollection 1categoryName ”Whole”subsetName ”Whole”
351
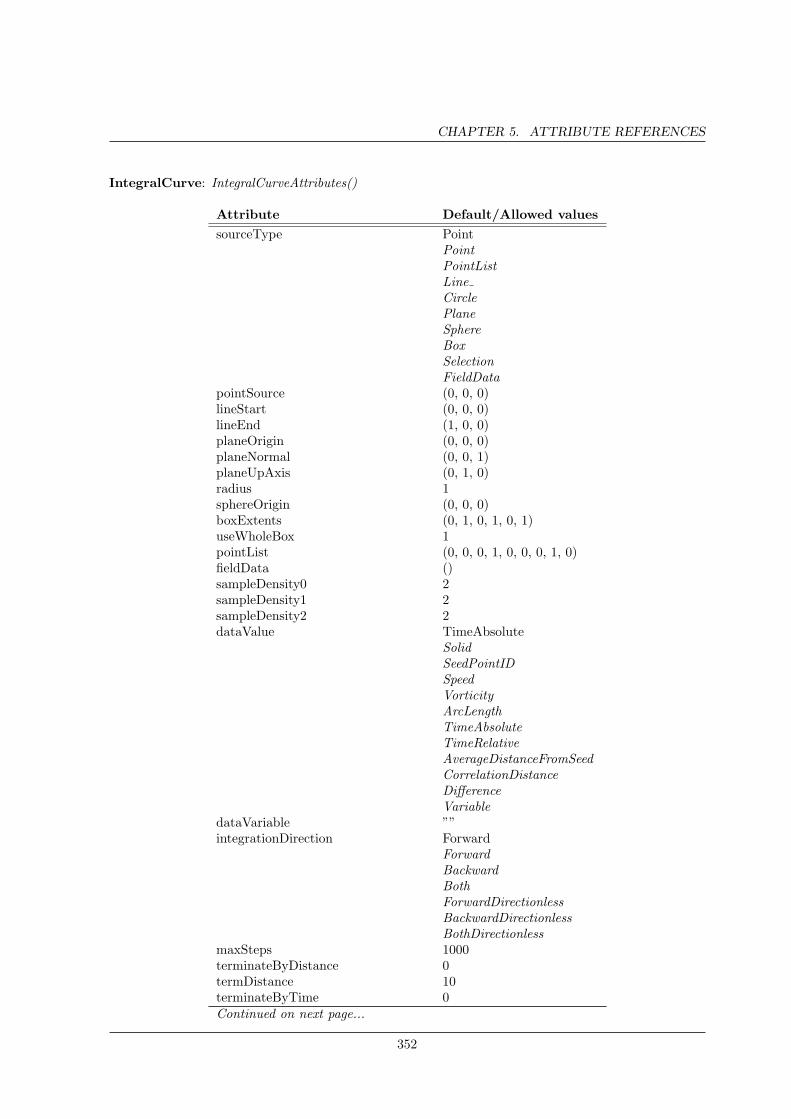
CHAPTER 5. ATTRIBUTE REFERENCES
IntegralCurve: IntegralCurveAttributes()
Attribute Default/Allowed valuessourceType Point
PointPointListLineCirclePlaneSphereBoxSelectionFieldData
pointSource (0, 0, 0)lineStart (0, 0, 0)lineEnd (1, 0, 0)planeOrigin (0, 0, 0)planeNormal (0, 0, 1)planeUpAxis (0, 1, 0)radius 1sphereOrigin (0, 0, 0)boxExtents (0, 1, 0, 1, 0, 1)useWholeBox 1pointList (0, 0, 0, 1, 0, 0, 0, 1, 0)fieldData ()sampleDensity0 2sampleDensity1 2sampleDensity2 2dataValue TimeAbsolute
SolidSeedPointIDSpeedVorticityArcLengthTimeAbsoluteTimeRelativeAverageDistanceFromSeedCorrelationDistanceDifferenceVariable
dataVariable ””integrationDirection Forward
ForwardBackwardBothForwardDirectionlessBackwardDirectionlessBothDirectionless
maxSteps 1000terminateByDistance 0termDistance 10terminateByTime 0Continued on next page...
352
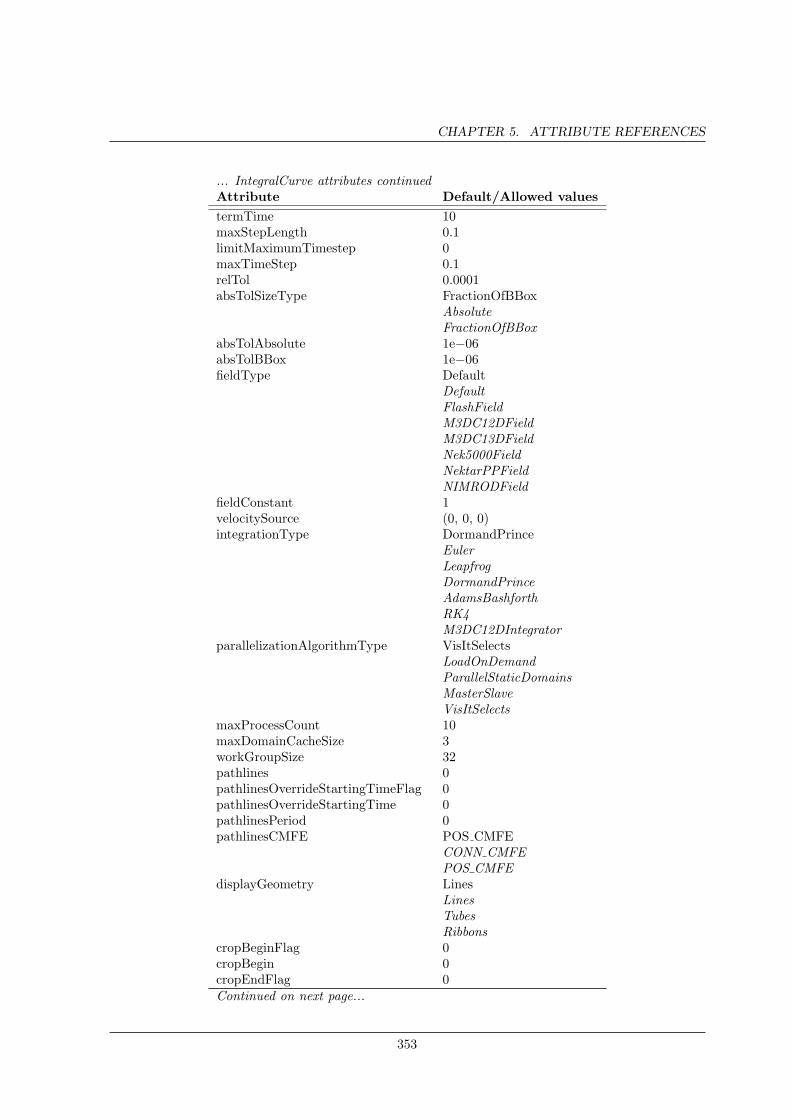
CHAPTER 5. ATTRIBUTE REFERENCES
... IntegralCurve attributes continuedAttribute Default/Allowed valuestermTime 10maxStepLength 0.1limitMaximumTimestep 0maxTimeStep 0.1relTol 0.0001absTolSizeType FractionOfBBox
AbsoluteFractionOfBBox
absTolAbsolute 1e−06absTolBBox 1e−06fieldType Default
DefaultFlashFieldM3DC12DFieldM3DC13DFieldNek5000FieldNektarPPFieldNIMRODField
fieldConstant 1velocitySource (0, 0, 0)integrationType DormandPrince
EulerLeapfrogDormandPrinceAdamsBashforthRK4M3DC12DIntegrator
parallelizationAlgorithmType VisItSelectsLoadOnDemandParallelStaticDomainsMasterSlaveVisItSelects
maxProcessCount 10maxDomainCacheSize 3workGroupSize 32pathlines 0pathlinesOverrideStartingTimeFlag 0pathlinesOverrideStartingTime 0pathlinesPeriod 0pathlinesCMFE POS CMFE
CONN CMFEPOS CMFE
displayGeometry LinesLinesTubesRibbons
cropBeginFlag 0cropBegin 0cropEndFlag 0Continued on next page...
353
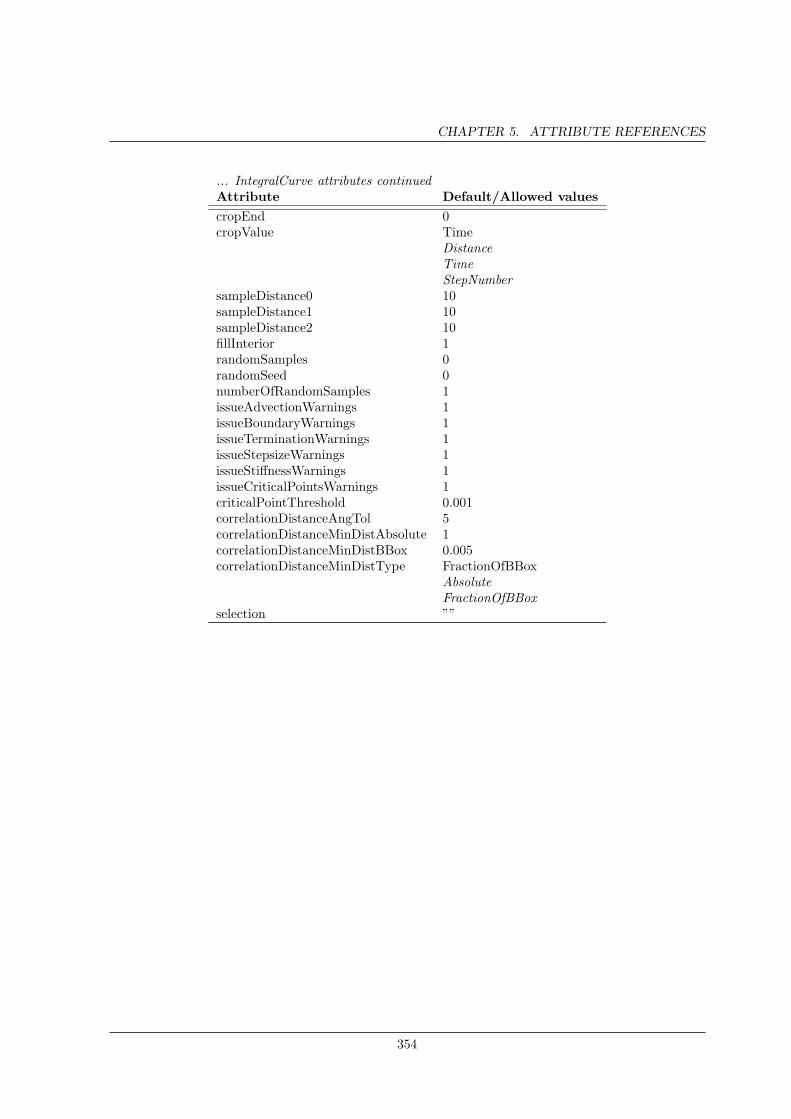
CHAPTER 5. ATTRIBUTE REFERENCES
... IntegralCurve attributes continuedAttribute Default/Allowed valuescropEnd 0cropValue Time
DistanceTimeStepNumber
sampleDistance0 10sampleDistance1 10sampleDistance2 10fillInterior 1randomSamples 0randomSeed 0numberOfRandomSamples 1issueAdvectionWarnings 1issueBoundaryWarnings 1issueTerminationWarnings 1issueStepsizeWarnings 1issueStiffnessWarnings 1issueCriticalPointsWarnings 1criticalPointThreshold 0.001correlationDistanceAngTol 5correlationDistanceMinDistAbsolute 1correlationDistanceMinDistBBox 0.005correlationDistanceMinDistType FractionOfBBox
AbsoluteFractionOfBBox
selection ””
354
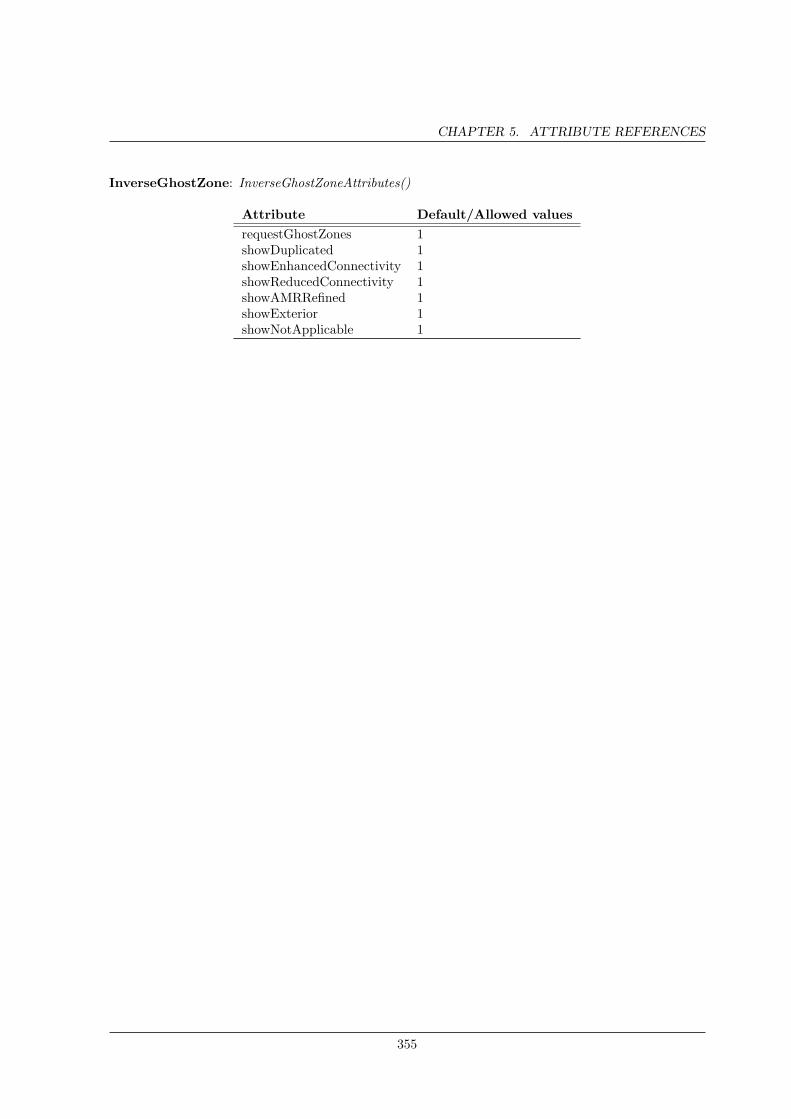
CHAPTER 5. ATTRIBUTE REFERENCES
InverseGhostZone: InverseGhostZoneAttributes()
Attribute Default/Allowed valuesrequestGhostZones 1showDuplicated 1showEnhancedConnectivity 1showReducedConnectivity 1showAMRRefined 1showExterior 1showNotApplicable 1
355
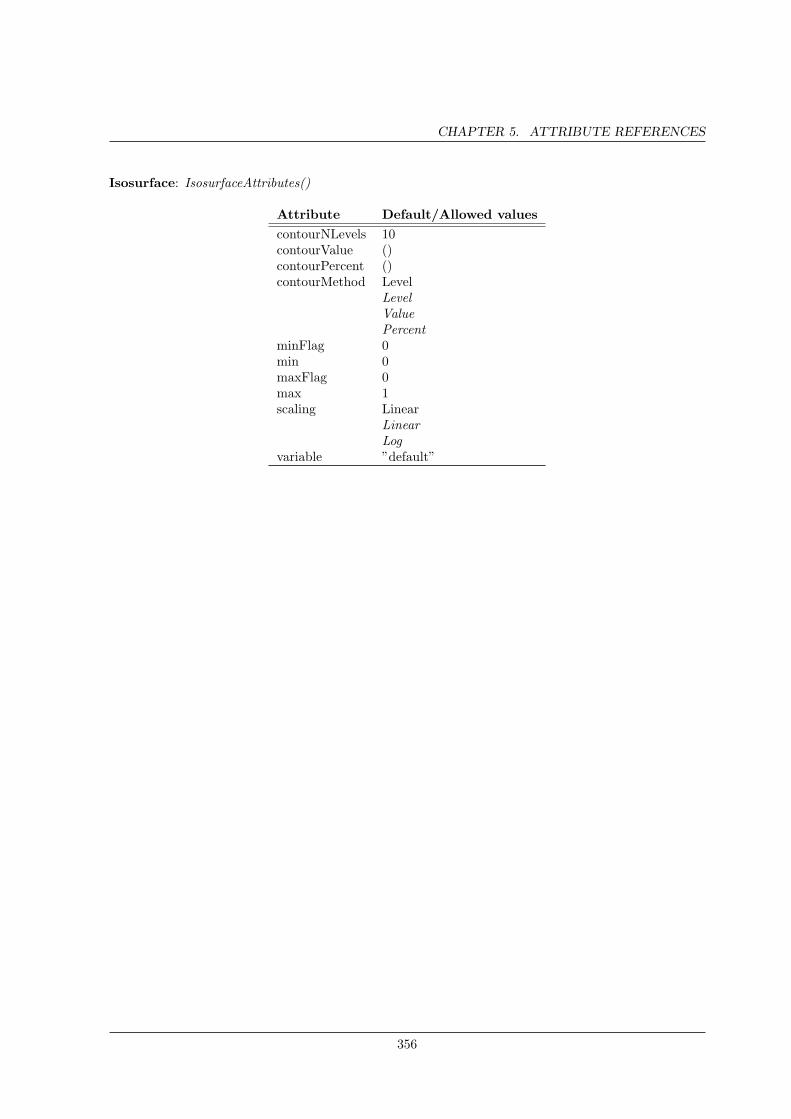
CHAPTER 5. ATTRIBUTE REFERENCES
Isosurface: IsosurfaceAttributes()
Attribute Default/Allowed valuescontourNLevels 10contourValue ()contourPercent ()contourMethod Level
LevelValuePercent
minFlag 0min 0maxFlag 0max 1scaling Linear
LinearLog
variable ”default”
356
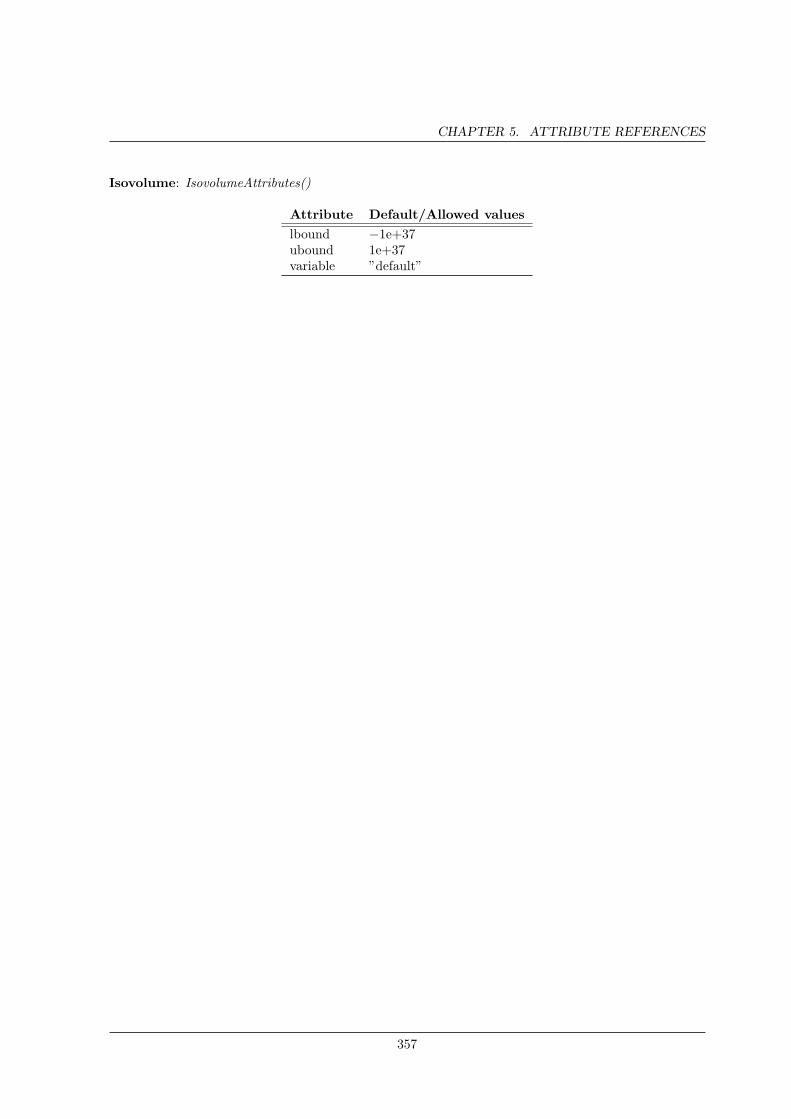
CHAPTER 5. ATTRIBUTE REFERENCES
Isovolume: IsovolumeAttributes()
Attribute Default/Allowed valueslbound −1e+37ubound 1e+37variable ”default”
357
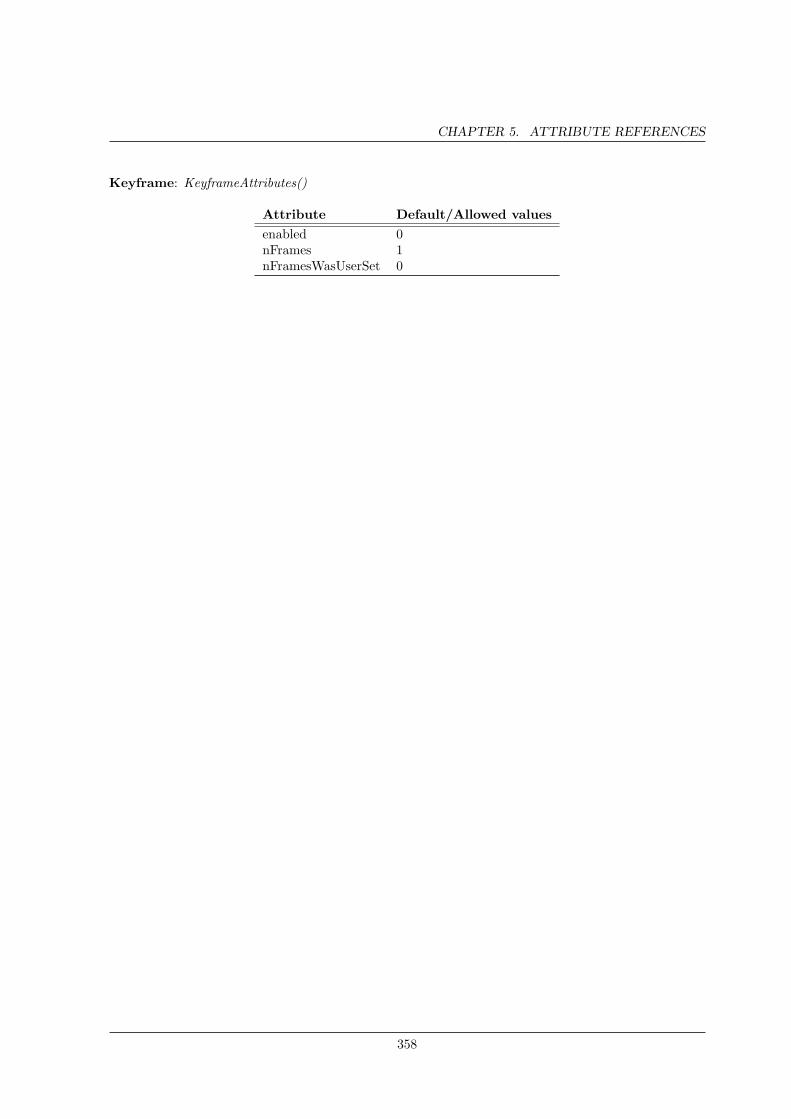
CHAPTER 5. ATTRIBUTE REFERENCES
Keyframe: KeyframeAttributes()
Attribute Default/Allowed valuesenabled 0nFrames 1nFramesWasUserSet 0
358
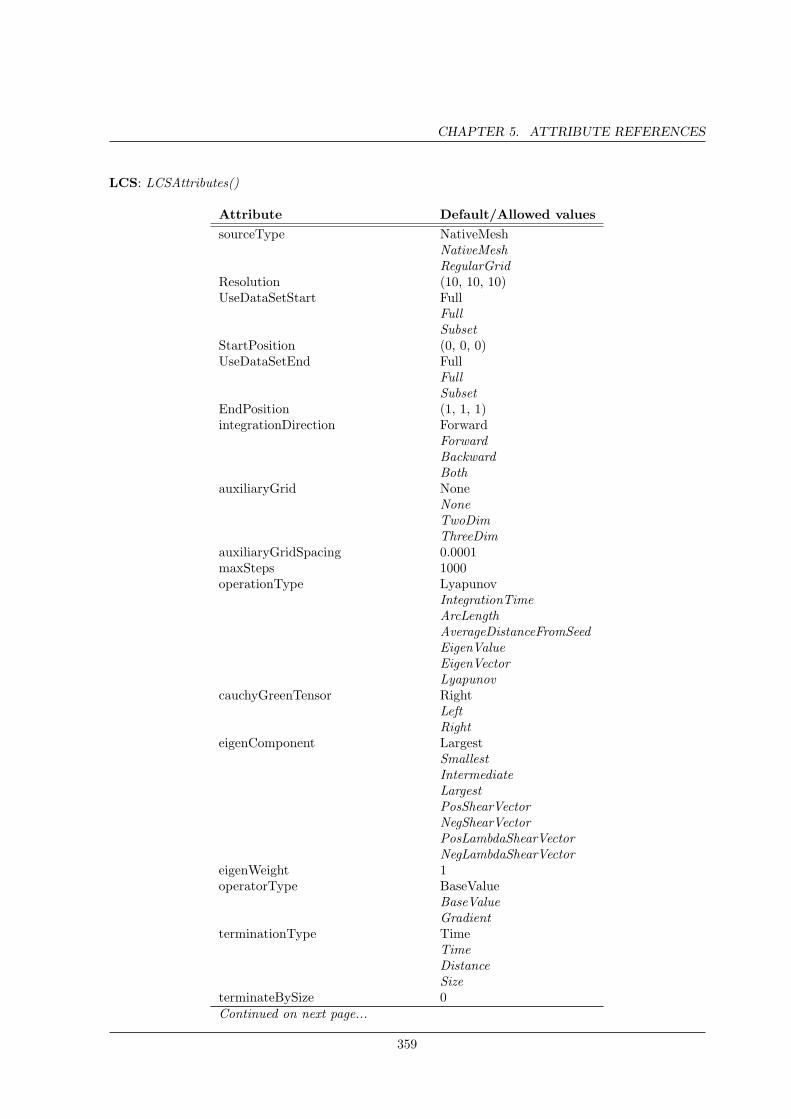
CHAPTER 5. ATTRIBUTE REFERENCES
LCS: LCSAttributes()
Attribute Default/Allowed valuessourceType NativeMesh
NativeMeshRegularGrid
Resolution (10, 10, 10)UseDataSetStart Full
FullSubset
StartPosition (0, 0, 0)UseDataSetEnd Full
FullSubset
EndPosition (1, 1, 1)integrationDirection Forward
ForwardBackwardBoth
auxiliaryGrid NoneNoneTwoDimThreeDim
auxiliaryGridSpacing 0.0001maxSteps 1000operationType Lyapunov
IntegrationTimeArcLengthAverageDistanceFromSeedEigenValueEigenVectorLyapunov
cauchyGreenTensor RightLeftRight
eigenComponent LargestSmallestIntermediateLargestPosShearVectorNegShearVectorPosLambdaShearVectorNegLambdaShearVector
eigenWeight 1operatorType BaseValue
BaseValueGradient
terminationType TimeTimeDistanceSize
terminateBySize 0Continued on next page...
359
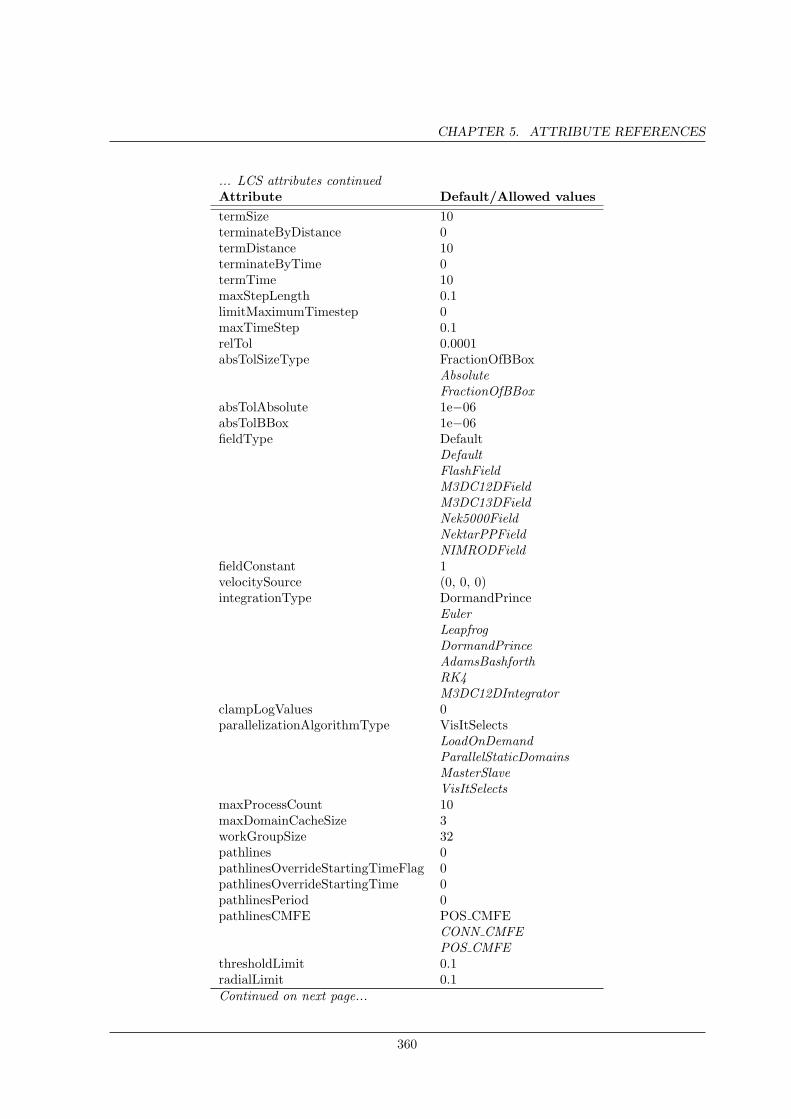
CHAPTER 5. ATTRIBUTE REFERENCES
... LCS attributes continuedAttribute Default/Allowed valuestermSize 10terminateByDistance 0termDistance 10terminateByTime 0termTime 10maxStepLength 0.1limitMaximumTimestep 0maxTimeStep 0.1relTol 0.0001absTolSizeType FractionOfBBox
AbsoluteFractionOfBBox
absTolAbsolute 1e−06absTolBBox 1e−06fieldType Default
DefaultFlashFieldM3DC12DFieldM3DC13DFieldNek5000FieldNektarPPFieldNIMRODField
fieldConstant 1velocitySource (0, 0, 0)integrationType DormandPrince
EulerLeapfrogDormandPrinceAdamsBashforthRK4M3DC12DIntegrator
clampLogValues 0parallelizationAlgorithmType VisItSelects
LoadOnDemandParallelStaticDomainsMasterSlaveVisItSelects
maxProcessCount 10maxDomainCacheSize 3workGroupSize 32pathlines 0pathlinesOverrideStartingTimeFlag 0pathlinesOverrideStartingTime 0pathlinesPeriod 0pathlinesCMFE POS CMFE
CONN CMFEPOS CMFE
thresholdLimit 0.1radialLimit 0.1Continued on next page...
360
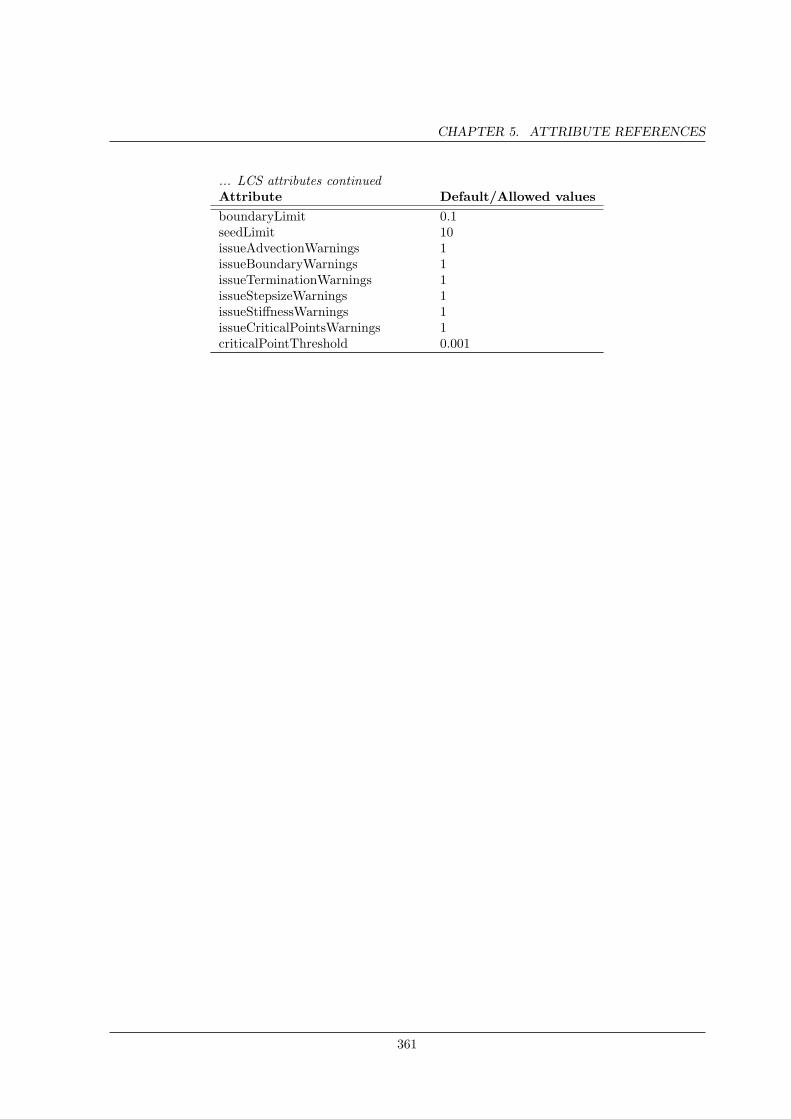
CHAPTER 5. ATTRIBUTE REFERENCES
... LCS attributes continuedAttribute Default/Allowed valuesboundaryLimit 0.1seedLimit 10issueAdvectionWarnings 1issueBoundaryWarnings 1issueTerminationWarnings 1issueStepsizeWarnings 1issueStiffnessWarnings 1issueCriticalPointsWarnings 1criticalPointThreshold 0.001
361
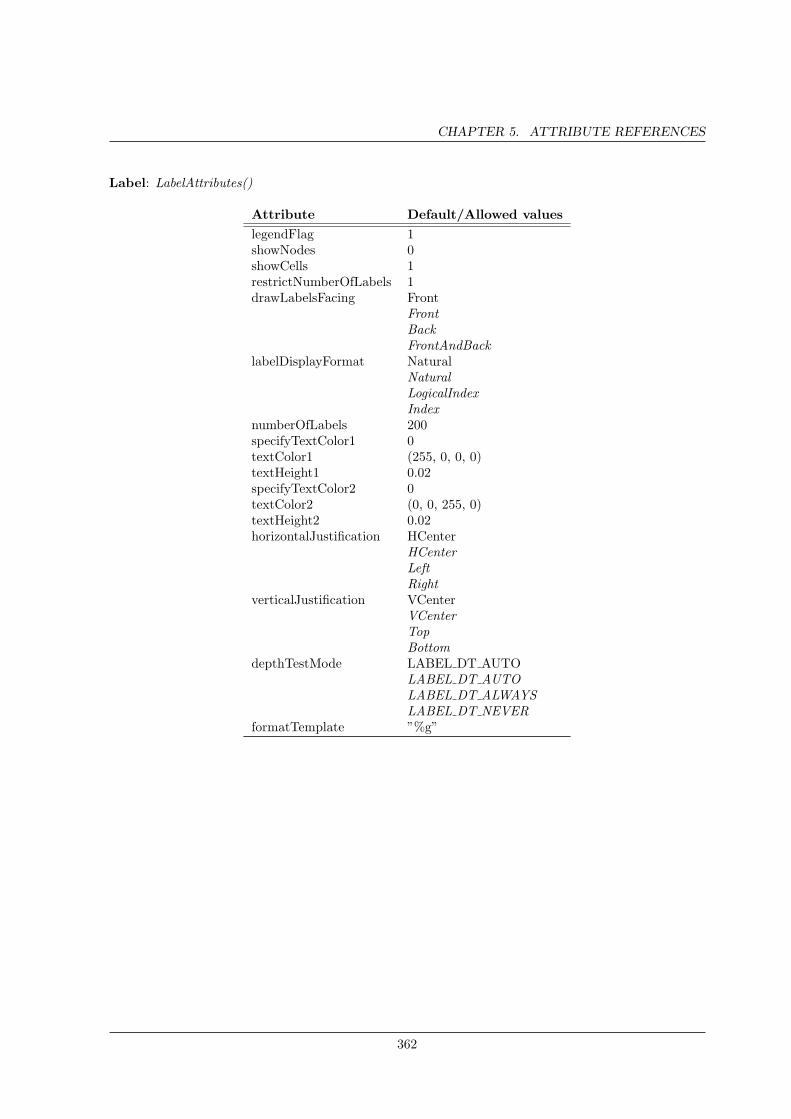
CHAPTER 5. ATTRIBUTE REFERENCES
Label: LabelAttributes()
Attribute Default/Allowed valueslegendFlag 1showNodes 0showCells 1restrictNumberOfLabels 1drawLabelsFacing Front
FrontBackFrontAndBack
labelDisplayFormat NaturalNaturalLogicalIndexIndex
numberOfLabels 200specifyTextColor1 0textColor1 (255, 0, 0, 0)textHeight1 0.02specifyTextColor2 0textColor2 (0, 0, 255, 0)textHeight2 0.02horizontalJustification HCenter
HCenterLeftRight
verticalJustification VCenterVCenterTopBottom
depthTestMode LABEL DT AUTOLABEL DT AUTOLABEL DT ALWAYSLABEL DT NEVER
formatTemplate ”%g”
362

CHAPTER 5. ATTRIBUTE REFERENCES
Lagrangian: LagrangianAttributes()
Attribute Default/Allowed valuesseedPoint (0, 0, 0)numSteps 1000XAxisSample Step
StepTimeArcLengthSpeedVorticityVariable
YAxisSample StepStepTimeArcLengthSpeedVorticityVariable
variable ”default”
363
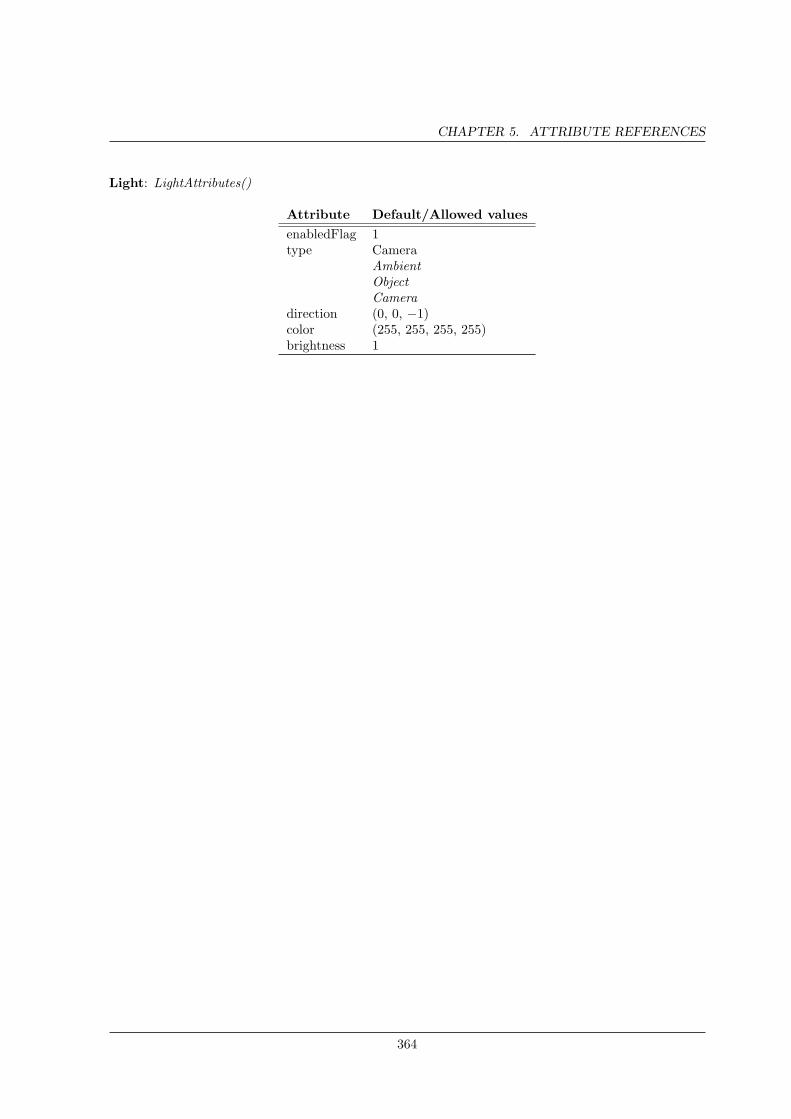
CHAPTER 5. ATTRIBUTE REFERENCES
Light: LightAttributes()
Attribute Default/Allowed valuesenabledFlag 1type Camera
AmbientObjectCamera
direction (0, 0, −1)color (255, 255, 255, 255)brightness 1
364
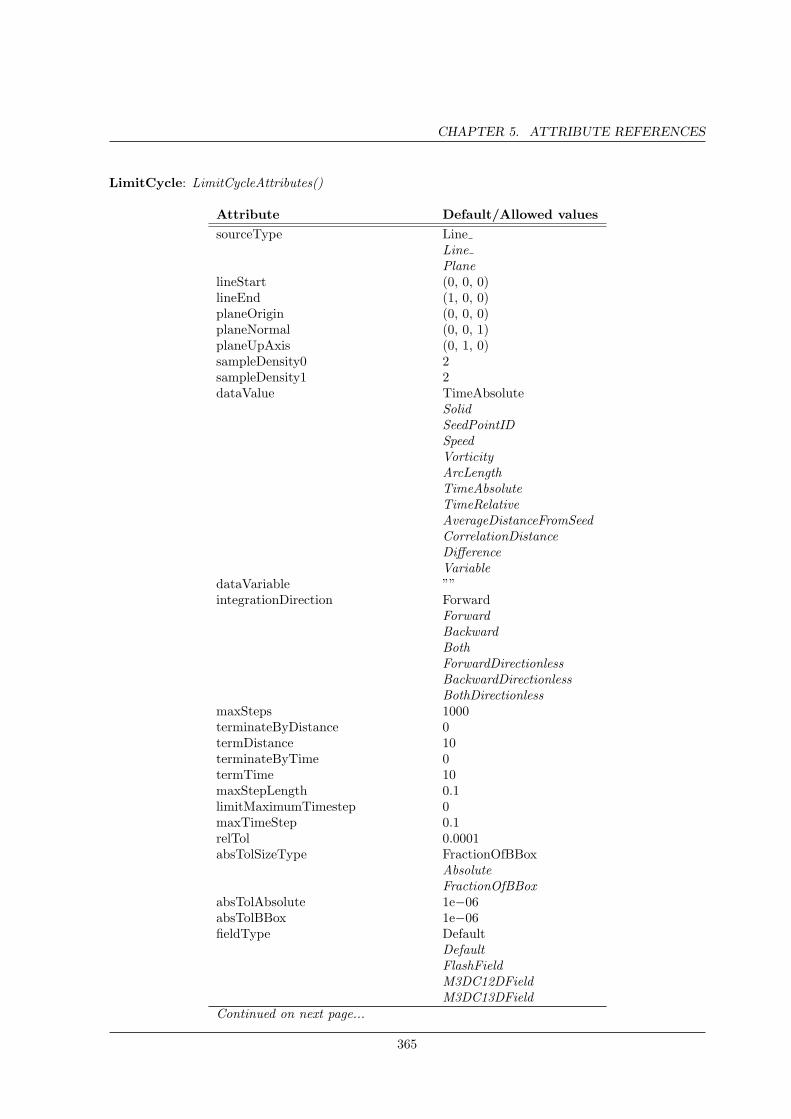
CHAPTER 5. ATTRIBUTE REFERENCES
LimitCycle: LimitCycleAttributes()
Attribute Default/Allowed valuessourceType Line
LinePlane
lineStart (0, 0, 0)lineEnd (1, 0, 0)planeOrigin (0, 0, 0)planeNormal (0, 0, 1)planeUpAxis (0, 1, 0)sampleDensity0 2sampleDensity1 2dataValue TimeAbsolute
SolidSeedPointIDSpeedVorticityArcLengthTimeAbsoluteTimeRelativeAverageDistanceFromSeedCorrelationDistanceDifferenceVariable
dataVariable ””integrationDirection Forward
ForwardBackwardBothForwardDirectionlessBackwardDirectionlessBothDirectionless
maxSteps 1000terminateByDistance 0termDistance 10terminateByTime 0termTime 10maxStepLength 0.1limitMaximumTimestep 0maxTimeStep 0.1relTol 0.0001absTolSizeType FractionOfBBox
AbsoluteFractionOfBBox
absTolAbsolute 1e−06absTolBBox 1e−06fieldType Default
DefaultFlashFieldM3DC12DFieldM3DC13DField
Continued on next page...
365
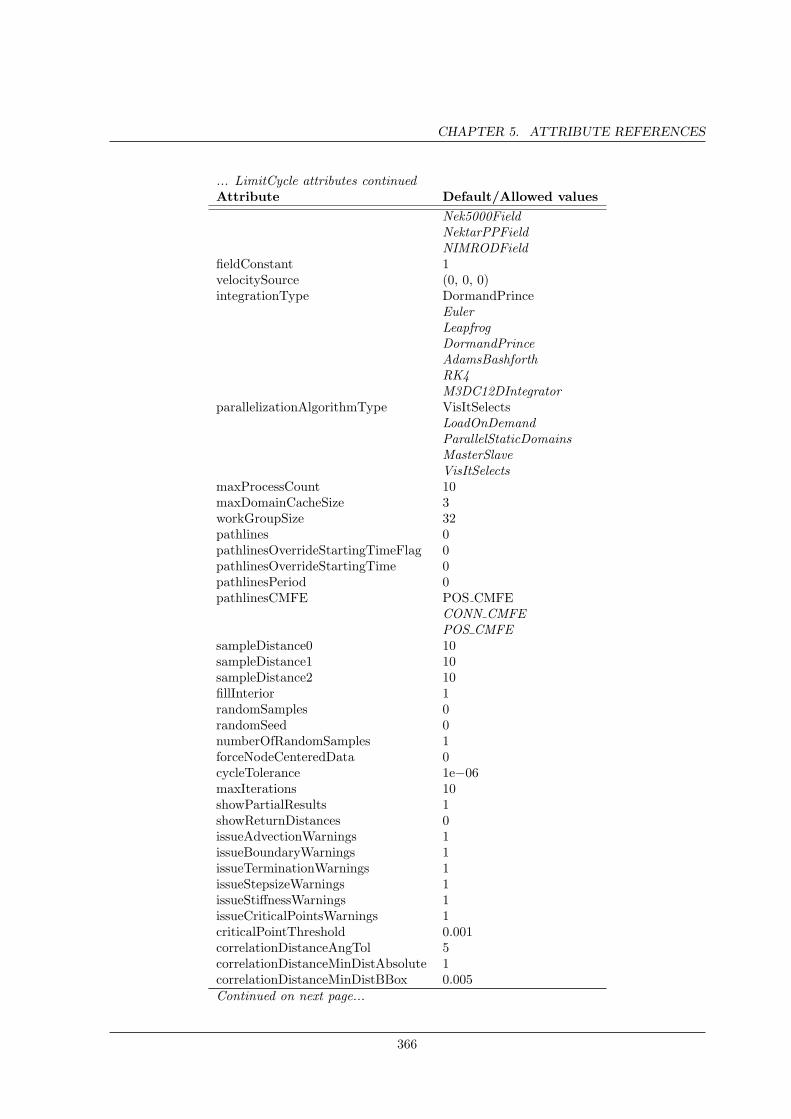
CHAPTER 5. ATTRIBUTE REFERENCES
... LimitCycle attributes continuedAttribute Default/Allowed values
Nek5000FieldNektarPPFieldNIMRODField
fieldConstant 1velocitySource (0, 0, 0)integrationType DormandPrince
EulerLeapfrogDormandPrinceAdamsBashforthRK4M3DC12DIntegrator
parallelizationAlgorithmType VisItSelectsLoadOnDemandParallelStaticDomainsMasterSlaveVisItSelects
maxProcessCount 10maxDomainCacheSize 3workGroupSize 32pathlines 0pathlinesOverrideStartingTimeFlag 0pathlinesOverrideStartingTime 0pathlinesPeriod 0pathlinesCMFE POS CMFE
CONN CMFEPOS CMFE
sampleDistance0 10sampleDistance1 10sampleDistance2 10fillInterior 1randomSamples 0randomSeed 0numberOfRandomSamples 1forceNodeCenteredData 0cycleTolerance 1e−06maxIterations 10showPartialResults 1showReturnDistances 0issueAdvectionWarnings 1issueBoundaryWarnings 1issueTerminationWarnings 1issueStepsizeWarnings 1issueStiffnessWarnings 1issueCriticalPointsWarnings 1criticalPointThreshold 0.001correlationDistanceAngTol 5correlationDistanceMinDistAbsolute 1correlationDistanceMinDistBBox 0.005Continued on next page...
366
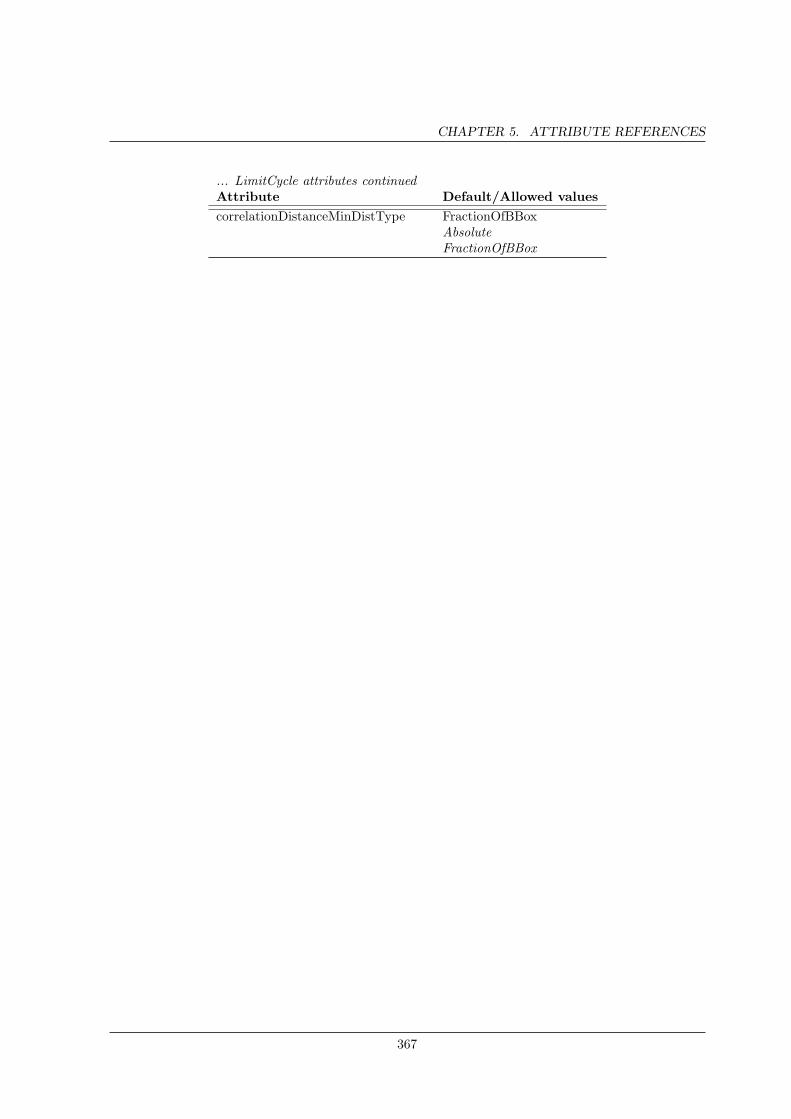
CHAPTER 5. ATTRIBUTE REFERENCES
... LimitCycle attributes continuedAttribute Default/Allowed valuescorrelationDistanceMinDistType FractionOfBBox
AbsoluteFractionOfBBox
367
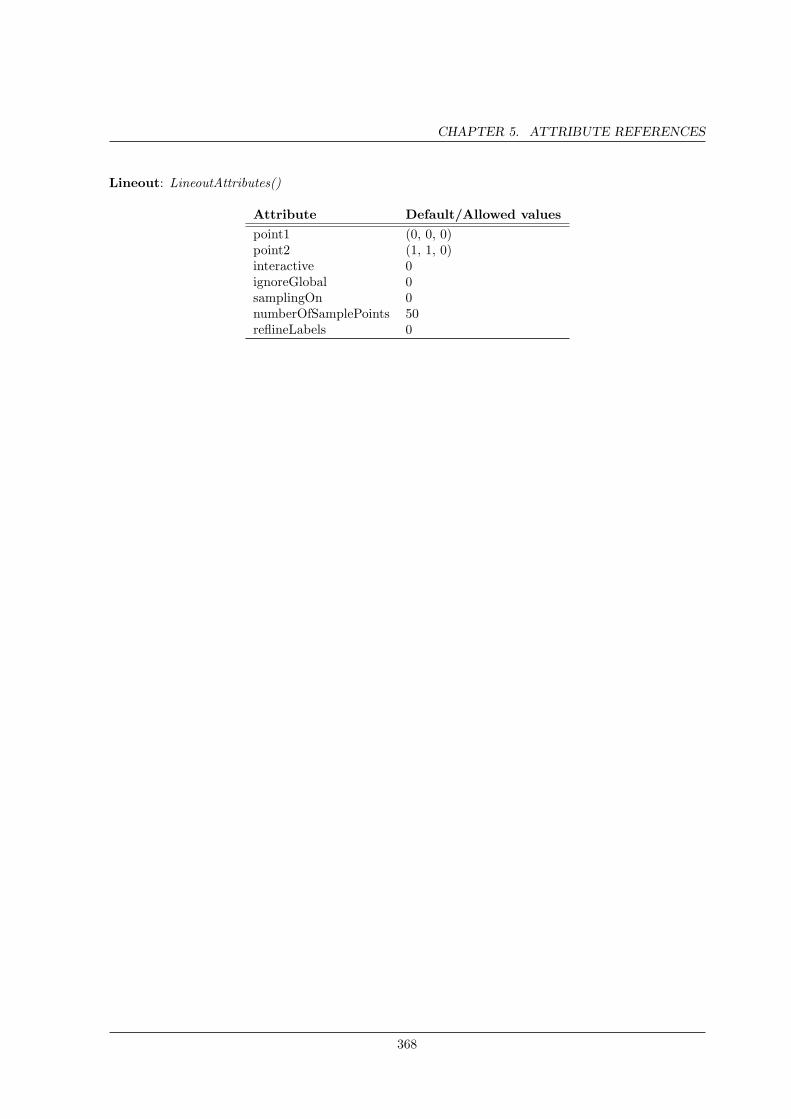
CHAPTER 5. ATTRIBUTE REFERENCES
Lineout: LineoutAttributes()
Attribute Default/Allowed valuespoint1 (0, 0, 0)point2 (1, 1, 0)interactive 0ignoreGlobal 0samplingOn 0numberOfSamplePoints 50reflineLabels 0
368
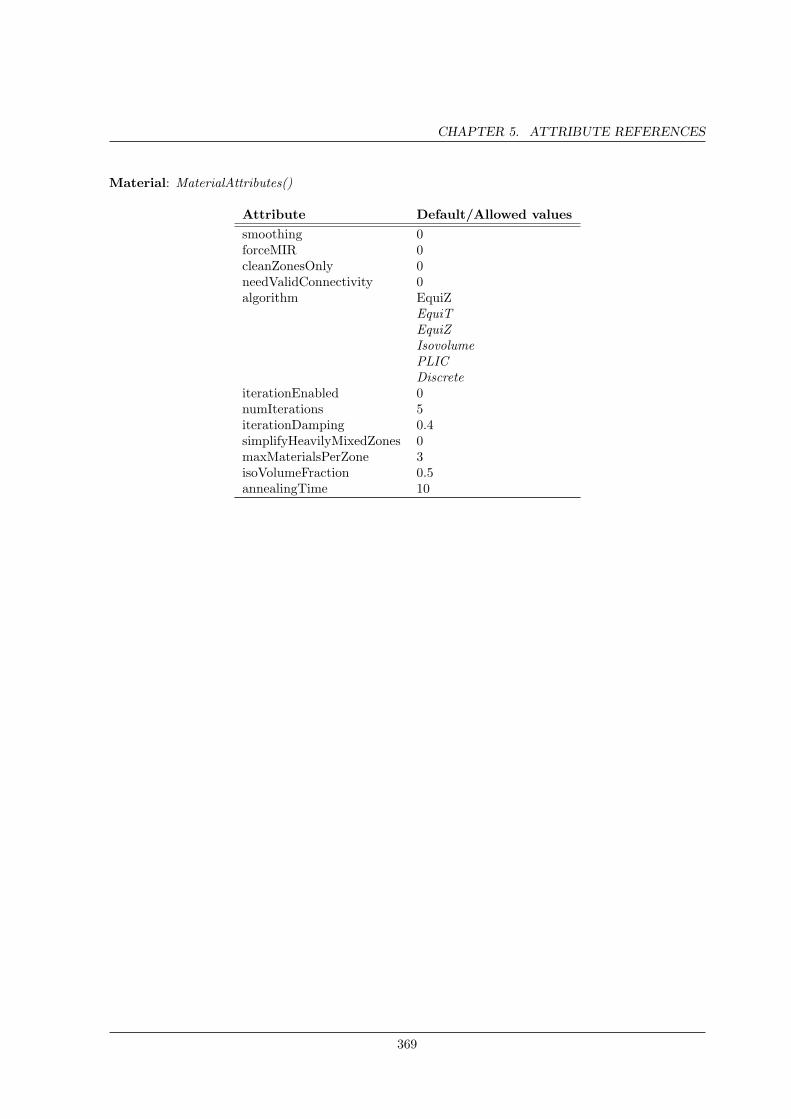
CHAPTER 5. ATTRIBUTE REFERENCES
Material: MaterialAttributes()
Attribute Default/Allowed valuessmoothing 0forceMIR 0cleanZonesOnly 0needValidConnectivity 0algorithm EquiZ
EquiTEquiZIsovolumePLICDiscrete
iterationEnabled 0numIterations 5iterationDamping 0.4simplifyHeavilyMixedZones 0maxMaterialsPerZone 3isoVolumeFraction 0.5annealingTime 10
369
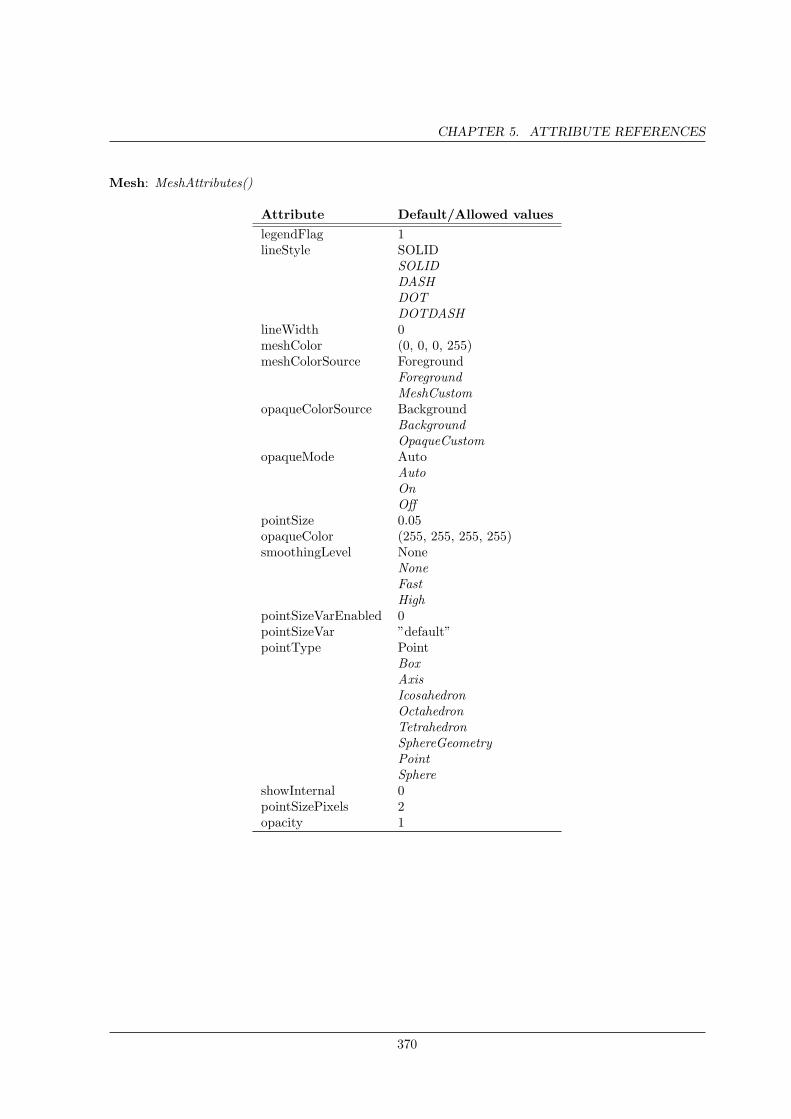
CHAPTER 5. ATTRIBUTE REFERENCES
Mesh: MeshAttributes()
Attribute Default/Allowed valueslegendFlag 1lineStyle SOLID
SOLIDDASHDOTDOTDASH
lineWidth 0meshColor (0, 0, 0, 255)meshColorSource Foreground
ForegroundMeshCustom
opaqueColorSource BackgroundBackgroundOpaqueCustom
opaqueMode AutoAutoOnOff
pointSize 0.05opaqueColor (255, 255, 255, 255)smoothingLevel None
NoneFastHigh
pointSizeVarEnabled 0pointSizeVar ”default”pointType Point
BoxAxisIcosahedronOctahedronTetrahedronSphereGeometryPointSphere
showInternal 0pointSizePixels 2opacity 1
370
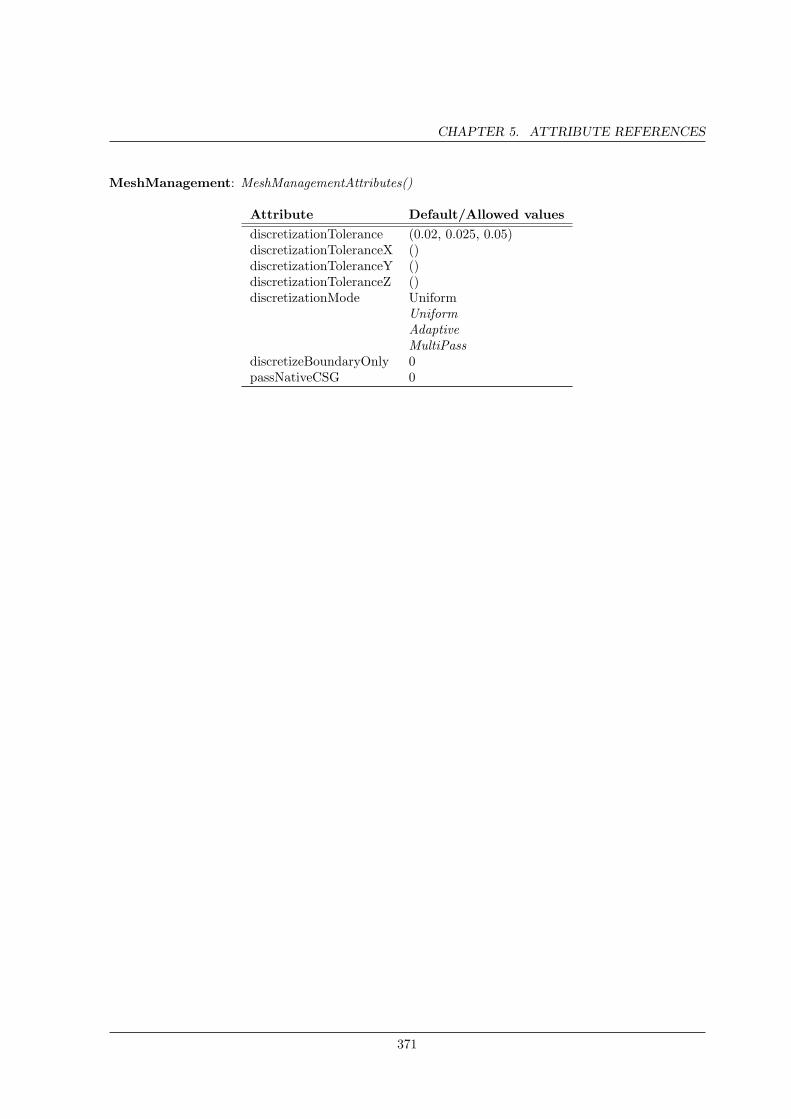
CHAPTER 5. ATTRIBUTE REFERENCES
MeshManagement: MeshManagementAttributes()
Attribute Default/Allowed valuesdiscretizationTolerance (0.02, 0.025, 0.05)discretizationToleranceX ()discretizationToleranceY ()discretizationToleranceZ ()discretizationMode Uniform
UniformAdaptiveMultiPass
discretizeBoundaryOnly 0passNativeCSG 0
371
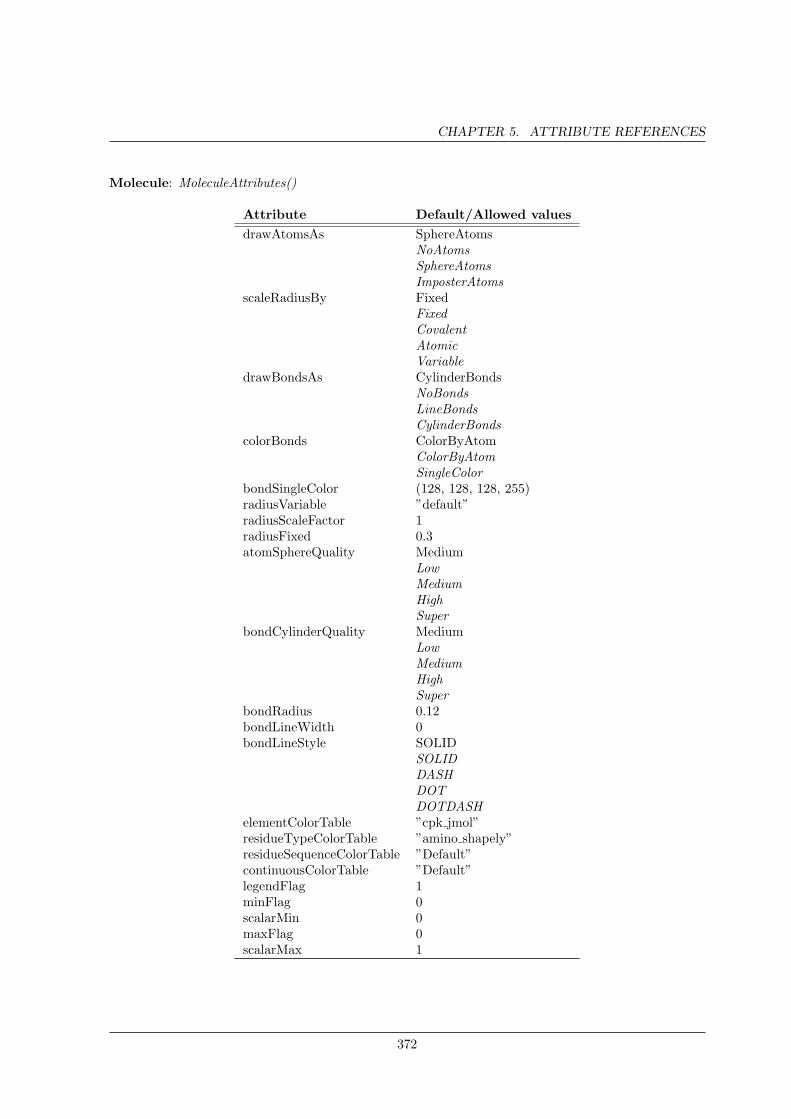
CHAPTER 5. ATTRIBUTE REFERENCES
Molecule: MoleculeAttributes()
Attribute Default/Allowed valuesdrawAtomsAs SphereAtoms
NoAtomsSphereAtomsImposterAtoms
scaleRadiusBy FixedFixedCovalentAtomicVariable
drawBondsAs CylinderBondsNoBondsLineBondsCylinderBonds
colorBonds ColorByAtomColorByAtomSingleColor
bondSingleColor (128, 128, 128, 255)radiusVariable ”default”radiusScaleFactor 1radiusFixed 0.3atomSphereQuality Medium
LowMediumHighSuper
bondCylinderQuality MediumLowMediumHighSuper
bondRadius 0.12bondLineWidth 0bondLineStyle SOLID
SOLIDDASHDOTDOTDASH
elementColorTable ”cpk jmol”residueTypeColorTable ”amino shapely”residueSequenceColorTable ”Default”continuousColorTable ”Default”legendFlag 1minFlag 0scalarMin 0maxFlag 0scalarMax 1
372
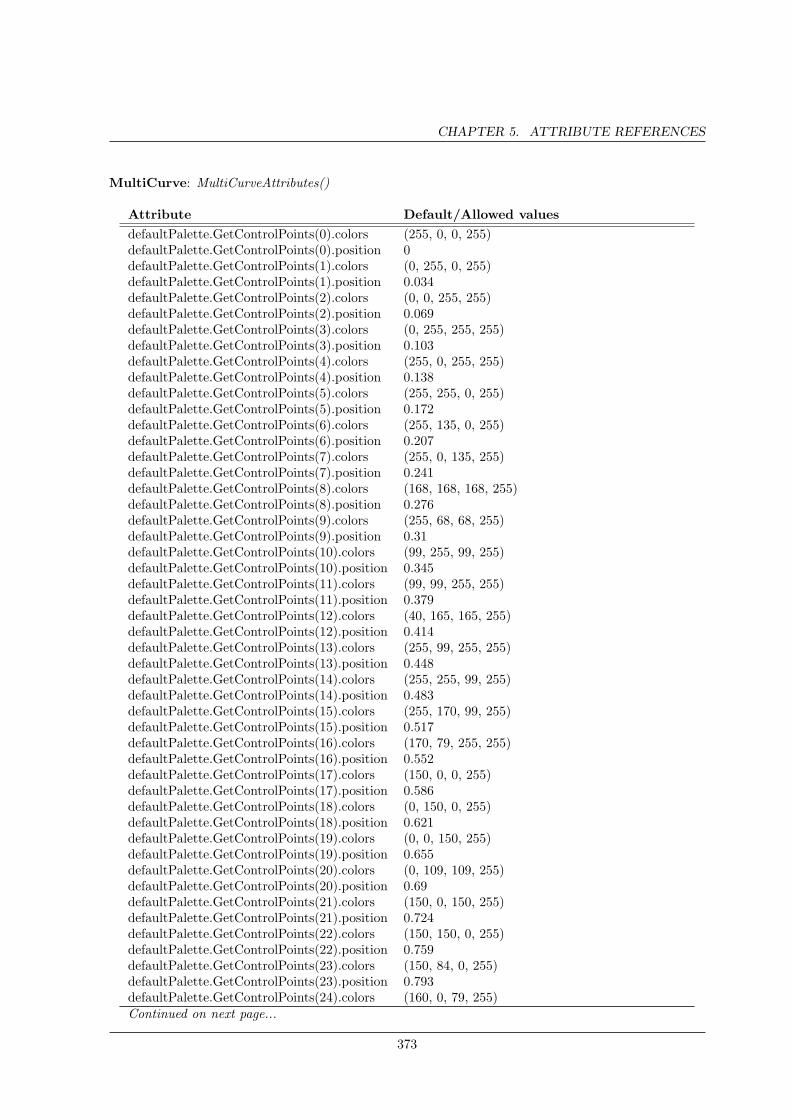
CHAPTER 5. ATTRIBUTE REFERENCES
MultiCurve: MultiCurveAttributes()
Attribute Default/Allowed valuesdefaultPalette.GetControlPoints(0).colors (255, 0, 0, 255)defaultPalette.GetControlPoints(0).position 0defaultPalette.GetControlPoints(1).colors (0, 255, 0, 255)defaultPalette.GetControlPoints(1).position 0.034defaultPalette.GetControlPoints(2).colors (0, 0, 255, 255)defaultPalette.GetControlPoints(2).position 0.069defaultPalette.GetControlPoints(3).colors (0, 255, 255, 255)defaultPalette.GetControlPoints(3).position 0.103defaultPalette.GetControlPoints(4).colors (255, 0, 255, 255)defaultPalette.GetControlPoints(4).position 0.138defaultPalette.GetControlPoints(5).colors (255, 255, 0, 255)defaultPalette.GetControlPoints(5).position 0.172defaultPalette.GetControlPoints(6).colors (255, 135, 0, 255)defaultPalette.GetControlPoints(6).position 0.207defaultPalette.GetControlPoints(7).colors (255, 0, 135, 255)defaultPalette.GetControlPoints(7).position 0.241defaultPalette.GetControlPoints(8).colors (168, 168, 168, 255)defaultPalette.GetControlPoints(8).position 0.276defaultPalette.GetControlPoints(9).colors (255, 68, 68, 255)defaultPalette.GetControlPoints(9).position 0.31defaultPalette.GetControlPoints(10).colors (99, 255, 99, 255)defaultPalette.GetControlPoints(10).position 0.345defaultPalette.GetControlPoints(11).colors (99, 99, 255, 255)defaultPalette.GetControlPoints(11).position 0.379defaultPalette.GetControlPoints(12).colors (40, 165, 165, 255)defaultPalette.GetControlPoints(12).position 0.414defaultPalette.GetControlPoints(13).colors (255, 99, 255, 255)defaultPalette.GetControlPoints(13).position 0.448defaultPalette.GetControlPoints(14).colors (255, 255, 99, 255)defaultPalette.GetControlPoints(14).position 0.483defaultPalette.GetControlPoints(15).colors (255, 170, 99, 255)defaultPalette.GetControlPoints(15).position 0.517defaultPalette.GetControlPoints(16).colors (170, 79, 255, 255)defaultPalette.GetControlPoints(16).position 0.552defaultPalette.GetControlPoints(17).colors (150, 0, 0, 255)defaultPalette.GetControlPoints(17).position 0.586defaultPalette.GetControlPoints(18).colors (0, 150, 0, 255)defaultPalette.GetControlPoints(18).position 0.621defaultPalette.GetControlPoints(19).colors (0, 0, 150, 255)defaultPalette.GetControlPoints(19).position 0.655defaultPalette.GetControlPoints(20).colors (0, 109, 109, 255)defaultPalette.GetControlPoints(20).position 0.69defaultPalette.GetControlPoints(21).colors (150, 0, 150, 255)defaultPalette.GetControlPoints(21).position 0.724defaultPalette.GetControlPoints(22).colors (150, 150, 0, 255)defaultPalette.GetControlPoints(22).position 0.759defaultPalette.GetControlPoints(23).colors (150, 84, 0, 255)defaultPalette.GetControlPoints(23).position 0.793defaultPalette.GetControlPoints(24).colors (160, 0, 79, 255)Continued on next page...
373
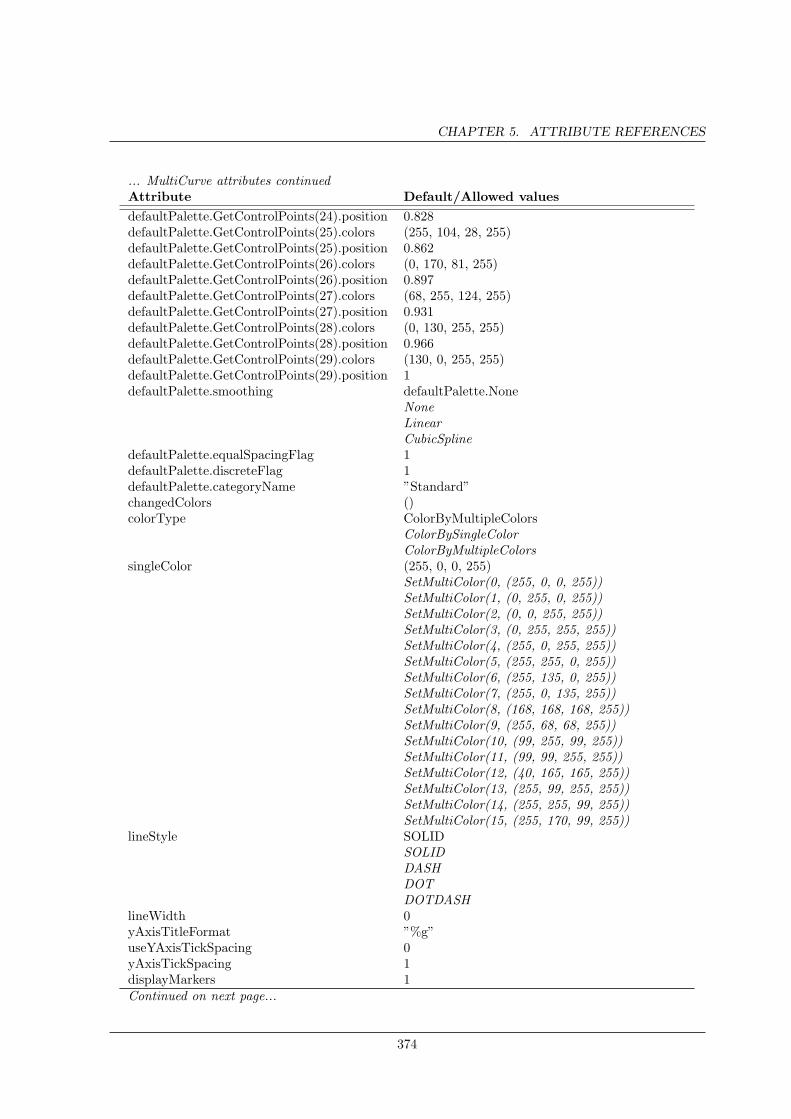
CHAPTER 5. ATTRIBUTE REFERENCES
... MultiCurve attributes continuedAttribute Default/Allowed valuesdefaultPalette.GetControlPoints(24).position 0.828defaultPalette.GetControlPoints(25).colors (255, 104, 28, 255)defaultPalette.GetControlPoints(25).position 0.862defaultPalette.GetControlPoints(26).colors (0, 170, 81, 255)defaultPalette.GetControlPoints(26).position 0.897defaultPalette.GetControlPoints(27).colors (68, 255, 124, 255)defaultPalette.GetControlPoints(27).position 0.931defaultPalette.GetControlPoints(28).colors (0, 130, 255, 255)defaultPalette.GetControlPoints(28).position 0.966defaultPalette.GetControlPoints(29).colors (130, 0, 255, 255)defaultPalette.GetControlPoints(29).position 1defaultPalette.smoothing defaultPalette.None
NoneLinearCubicSpline
defaultPalette.equalSpacingFlag 1defaultPalette.discreteFlag 1defaultPalette.categoryName ”Standard”changedColors ()colorType ColorByMultipleColors
ColorBySingleColorColorByMultipleColors
singleColor (255, 0, 0, 255)SetMultiColor(0, (255, 0, 0, 255))SetMultiColor(1, (0, 255, 0, 255))SetMultiColor(2, (0, 0, 255, 255))SetMultiColor(3, (0, 255, 255, 255))SetMultiColor(4, (255, 0, 255, 255))SetMultiColor(5, (255, 255, 0, 255))SetMultiColor(6, (255, 135, 0, 255))SetMultiColor(7, (255, 0, 135, 255))SetMultiColor(8, (168, 168, 168, 255))SetMultiColor(9, (255, 68, 68, 255))SetMultiColor(10, (99, 255, 99, 255))SetMultiColor(11, (99, 99, 255, 255))SetMultiColor(12, (40, 165, 165, 255))SetMultiColor(13, (255, 99, 255, 255))SetMultiColor(14, (255, 255, 99, 255))SetMultiColor(15, (255, 170, 99, 255))
lineStyle SOLIDSOLIDDASHDOTDOTDASH
lineWidth 0yAxisTitleFormat ”%g”useYAxisTickSpacing 0yAxisTickSpacing 1displayMarkers 1Continued on next page...
374
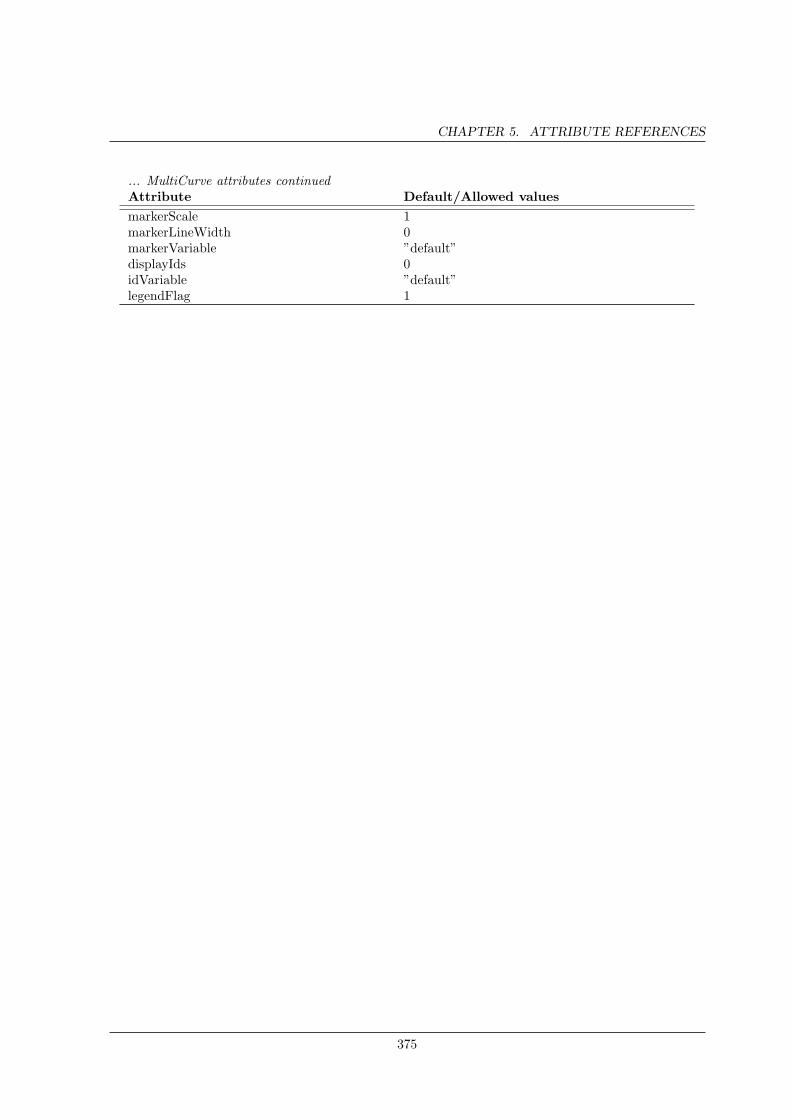
CHAPTER 5. ATTRIBUTE REFERENCES
... MultiCurve attributes continuedAttribute Default/Allowed valuesmarkerScale 1markerLineWidth 0markerVariable ”default”displayIds 0idVariable ”default”legendFlag 1
375
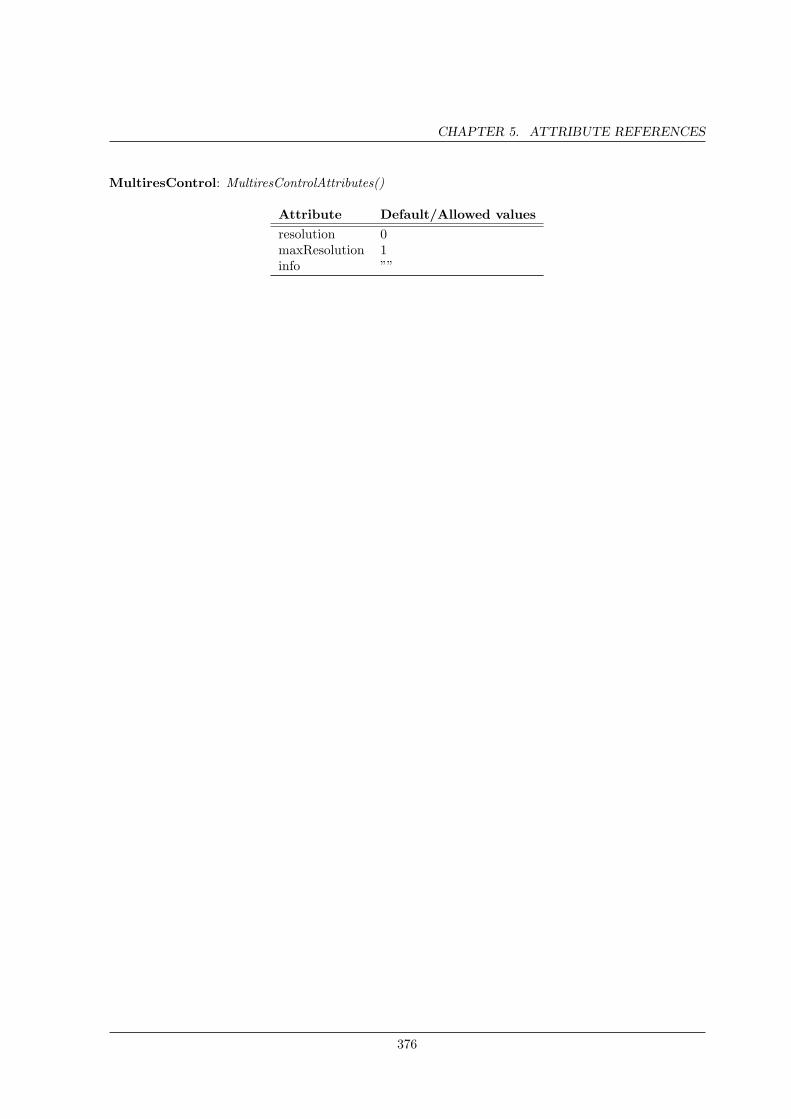
CHAPTER 5. ATTRIBUTE REFERENCES
MultiresControl: MultiresControlAttributes()
Attribute Default/Allowed valuesresolution 0maxResolution 1info ””
376

CHAPTER 5. ATTRIBUTE REFERENCES
OnionPeel: OnionPeelAttributes()
Attribute Default/Allowed valuesadjacencyType Node
NodeFace
useGlobalId 0categoryName ”Whole”subsetName ”Whole”index (1)logical 0requestedLayer 0seedType SeedCell
SeedCellSeedNode
honorOriginalMesh 1
377
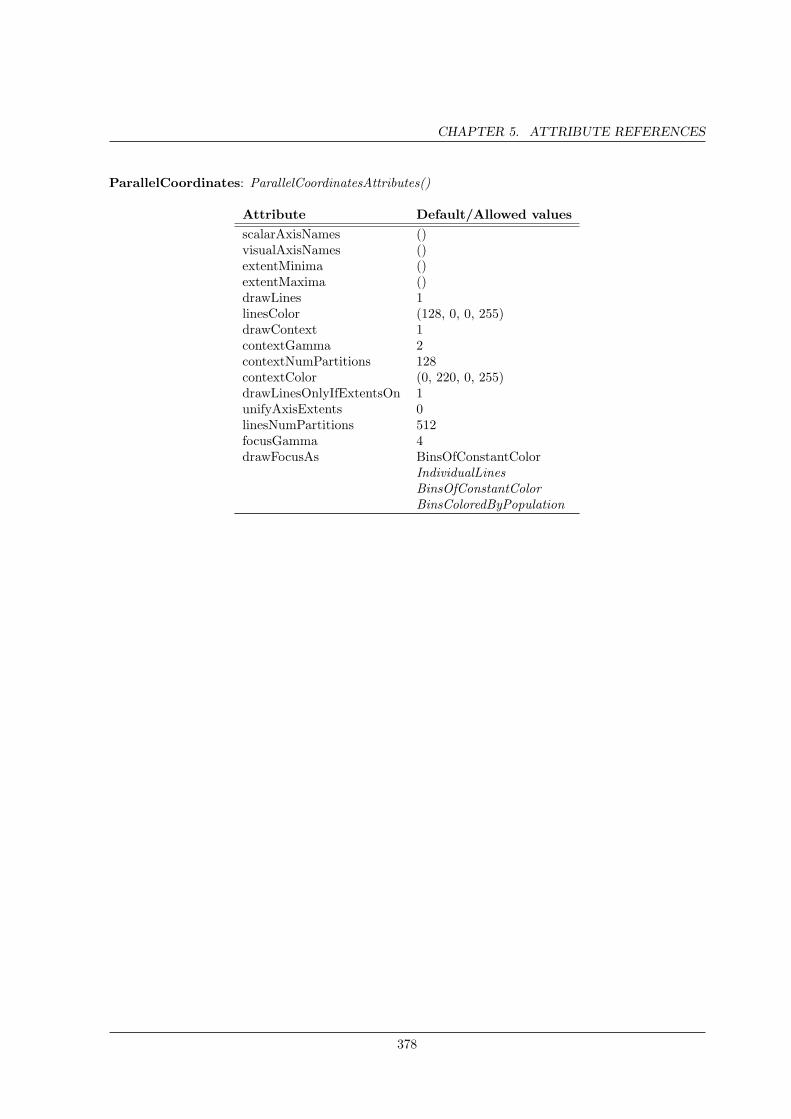
CHAPTER 5. ATTRIBUTE REFERENCES
ParallelCoordinates: ParallelCoordinatesAttributes()
Attribute Default/Allowed valuesscalarAxisNames ()visualAxisNames ()extentMinima ()extentMaxima ()drawLines 1linesColor (128, 0, 0, 255)drawContext 1contextGamma 2contextNumPartitions 128contextColor (0, 220, 0, 255)drawLinesOnlyIfExtentsOn 1unifyAxisExtents 0linesNumPartitions 512focusGamma 4drawFocusAs BinsOfConstantColor
IndividualLinesBinsOfConstantColorBinsColoredByPopulation
378
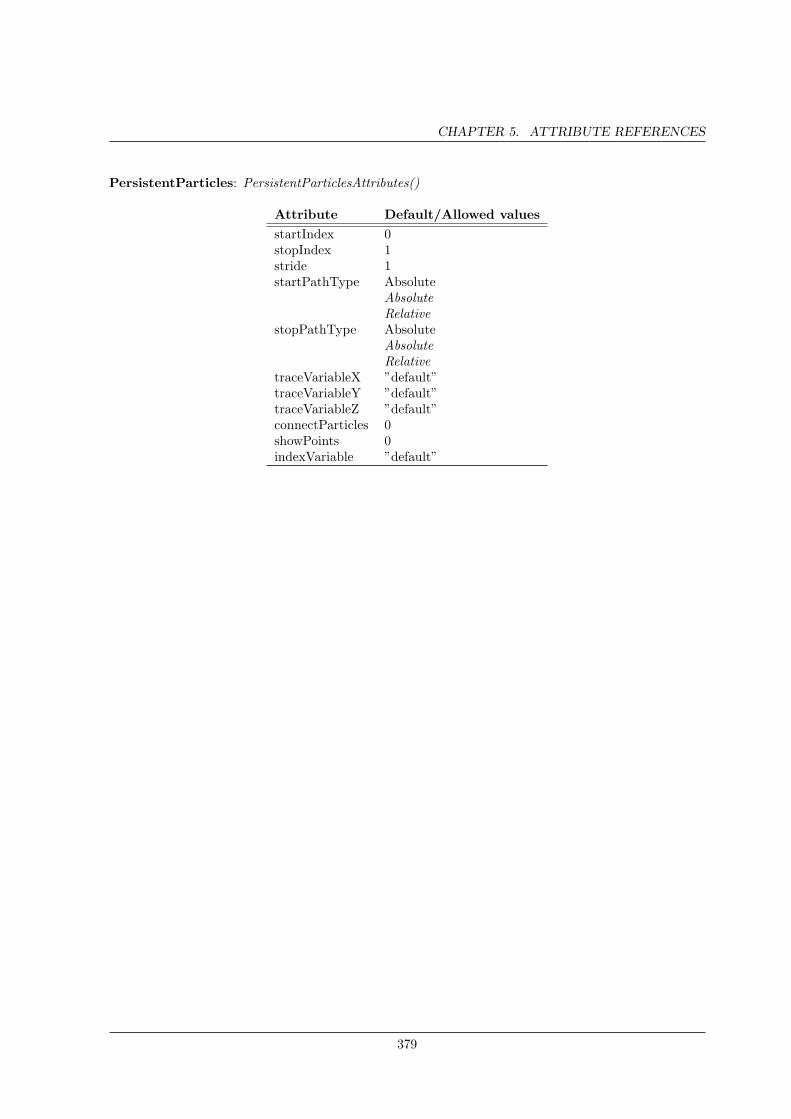
CHAPTER 5. ATTRIBUTE REFERENCES
PersistentParticles: PersistentParticlesAttributes()
Attribute Default/Allowed valuesstartIndex 0stopIndex 1stride 1startPathType Absolute
AbsoluteRelative
stopPathType AbsoluteAbsoluteRelative
traceVariableX ”default”traceVariableY ”default”traceVariableZ ”default”connectParticles 0showPoints 0indexVariable ”default”
379
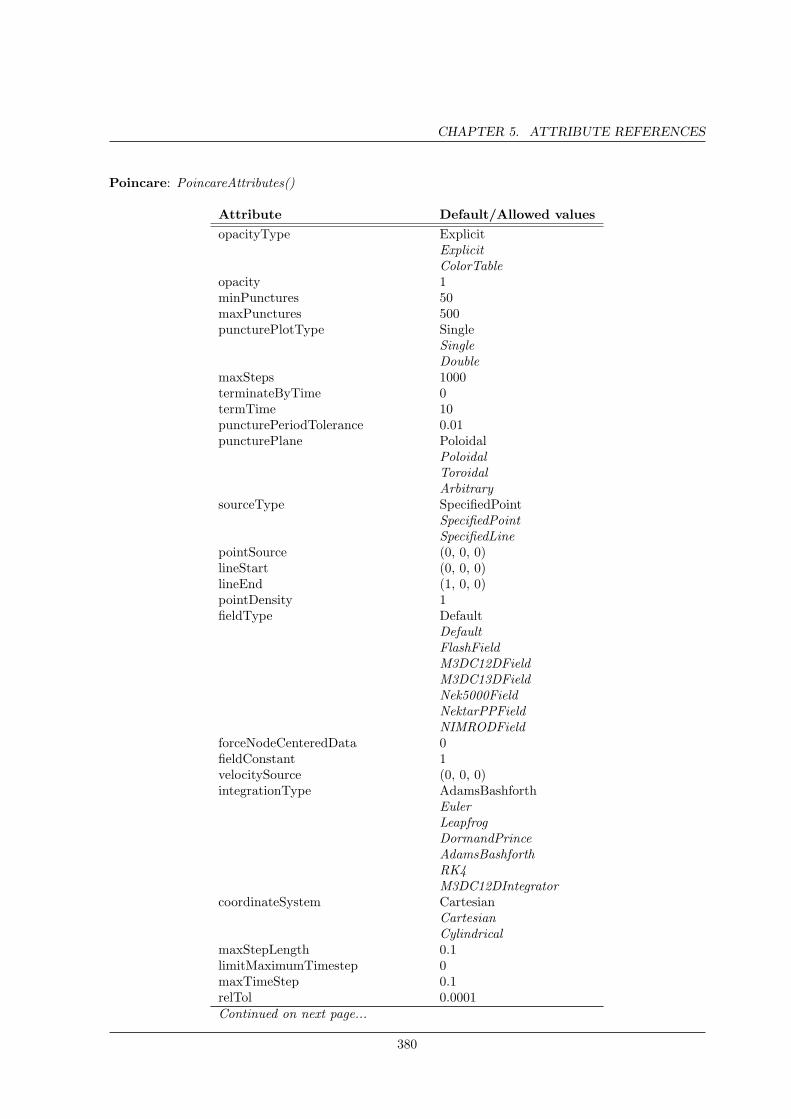
CHAPTER 5. ATTRIBUTE REFERENCES
Poincare: PoincareAttributes()
Attribute Default/Allowed valuesopacityType Explicit
ExplicitColorTable
opacity 1minPunctures 50maxPunctures 500puncturePlotType Single
SingleDouble
maxSteps 1000terminateByTime 0termTime 10puncturePeriodTolerance 0.01puncturePlane Poloidal
PoloidalToroidalArbitrary
sourceType SpecifiedPointSpecifiedPointSpecifiedLine
pointSource (0, 0, 0)lineStart (0, 0, 0)lineEnd (1, 0, 0)pointDensity 1fieldType Default
DefaultFlashFieldM3DC12DFieldM3DC13DFieldNek5000FieldNektarPPFieldNIMRODField
forceNodeCenteredData 0fieldConstant 1velocitySource (0, 0, 0)integrationType AdamsBashforth
EulerLeapfrogDormandPrinceAdamsBashforthRK4M3DC12DIntegrator
coordinateSystem CartesianCartesianCylindrical
maxStepLength 0.1limitMaximumTimestep 0maxTimeStep 0.1relTol 0.0001Continued on next page...
380
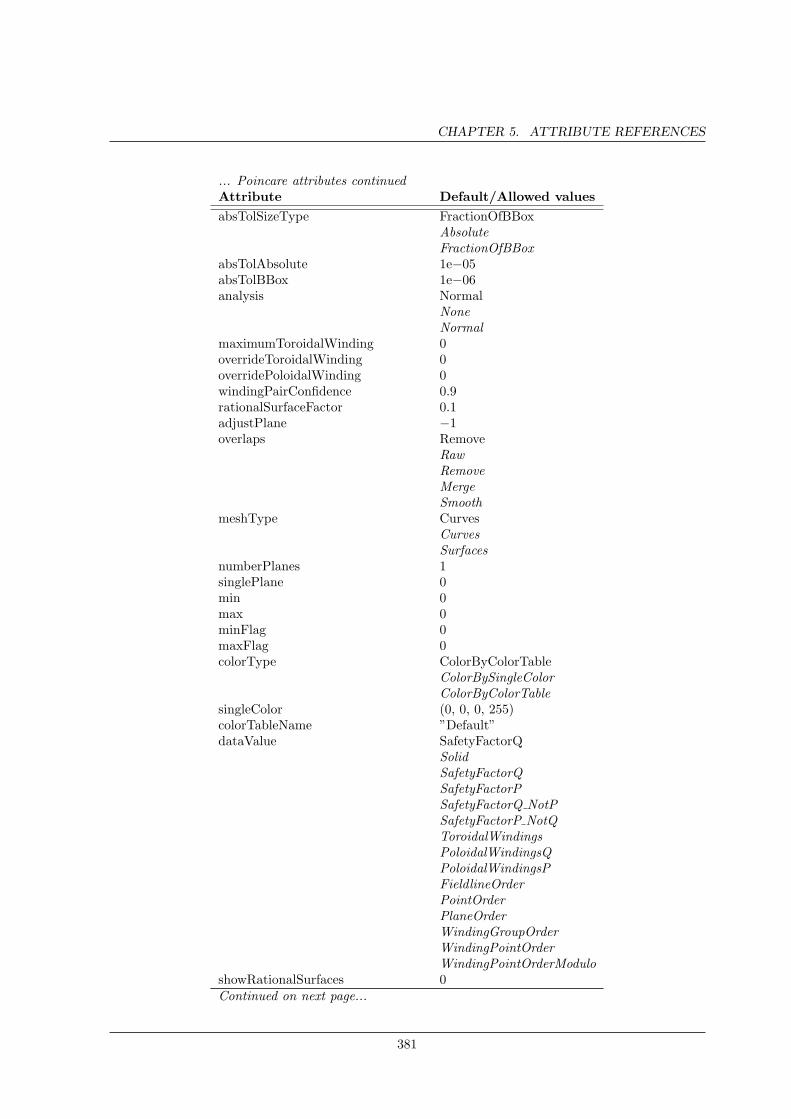
CHAPTER 5. ATTRIBUTE REFERENCES
... Poincare attributes continuedAttribute Default/Allowed valuesabsTolSizeType FractionOfBBox
AbsoluteFractionOfBBox
absTolAbsolute 1e−05absTolBBox 1e−06analysis Normal
NoneNormal
maximumToroidalWinding 0overrideToroidalWinding 0overridePoloidalWinding 0windingPairConfidence 0.9rationalSurfaceFactor 0.1adjustPlane −1overlaps Remove
RawRemoveMergeSmooth
meshType CurvesCurvesSurfaces
numberPlanes 1singlePlane 0min 0max 0minFlag 0maxFlag 0colorType ColorByColorTable
ColorBySingleColorColorByColorTable
singleColor (0, 0, 0, 255)colorTableName ”Default”dataValue SafetyFactorQ
SolidSafetyFactorQSafetyFactorPSafetyFactorQ NotPSafetyFactorP NotQToroidalWindingsPoloidalWindingsQPoloidalWindingsPFieldlineOrderPointOrderPlaneOrderWindingGroupOrderWindingPointOrderWindingPointOrderModulo
showRationalSurfaces 0Continued on next page...
381

CHAPTER 5. ATTRIBUTE REFERENCES
... Poincare attributes continuedAttribute Default/Allowed valuesRationalSurfaceMaxIterations 2showOPoints 0OPointMaxIterations 2showXPoints 0XPointMaxIterations 2performOLineAnalysis 0OLineToroidalWinding 1OLineAxisFileName ””showChaotic 0showIslands 0SummaryFlag 1verboseFlag 0show1DPlots 0showLines 1showPoints 0parallelizationAlgorithmType VisItSelects
LoadOnDemandParallelStaticDomainsMasterSlaveVisItSelects
maxProcessCount 10maxDomainCacheSize 3workGroupSize 32pathlines 0pathlinesOverrideStartingTimeFlag 0pathlinesOverrideStartingTime 0pathlinesPeriod 0pathlinesCMFE POS CMFE
CONN CMFEPOS CMFE
issueTerminationWarnings 1issueStepsizeWarnings 1issueStiffnessWarnings 1issueCriticalPointsWarnings 1criticalPointThreshold 0.001
382

CHAPTER 5. ATTRIBUTE REFERENCES
Printer: PrinterAttributes()
Attribute Default/Allowed valuesprinterName ””printProgram ”lpr”documentName ”untitled”creator ””numCopies 1portrait 1printColor 1outputToFile 0outputToFileName ”untitled”pageSize 2
383
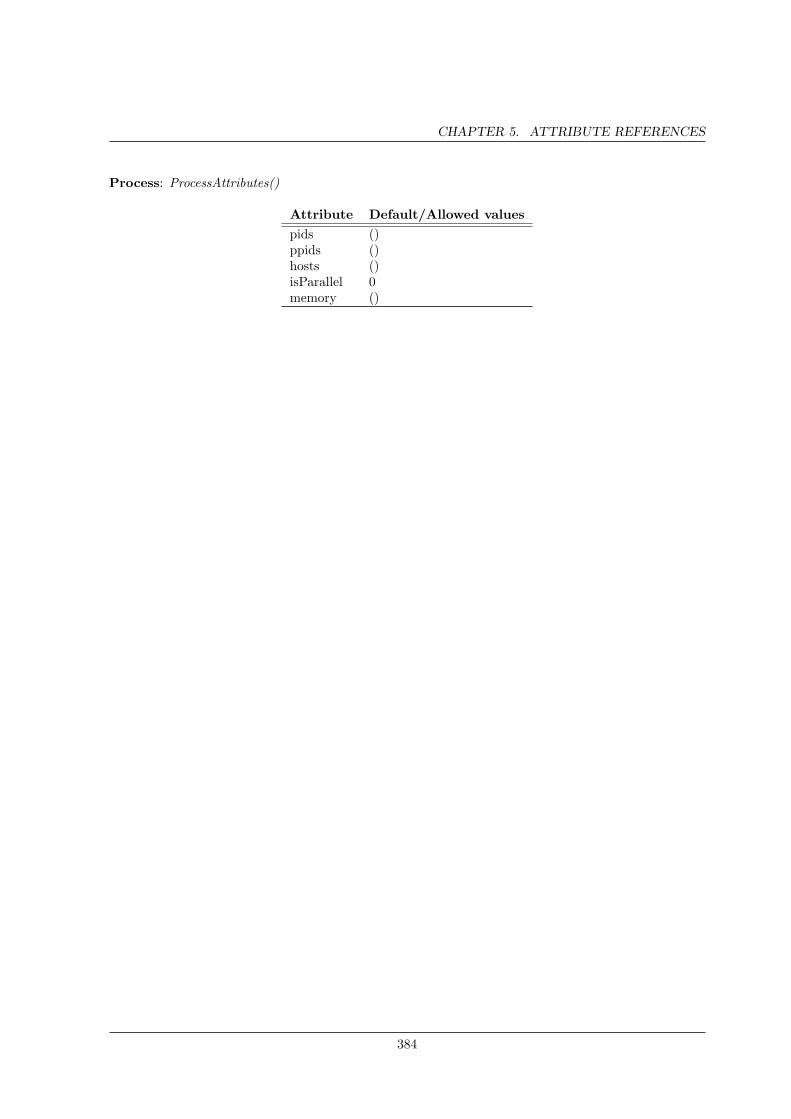
CHAPTER 5. ATTRIBUTE REFERENCES
Process: ProcessAttributes()
Attribute Default/Allowed valuespids ()ppids ()hosts ()isParallel 0memory ()
384
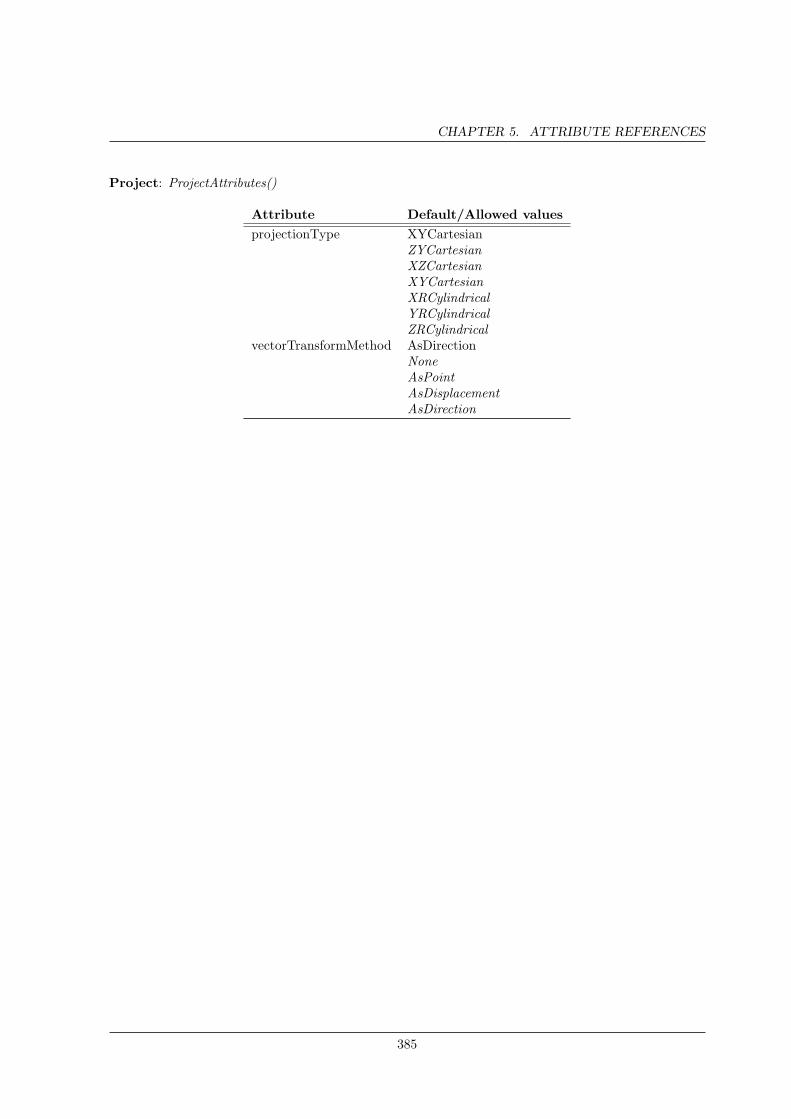
CHAPTER 5. ATTRIBUTE REFERENCES
Project: ProjectAttributes()
Attribute Default/Allowed valuesprojectionType XYCartesian
ZYCartesianXZCartesianXYCartesianXRCylindricalYRCylindricalZRCylindrical
vectorTransformMethod AsDirectionNoneAsPointAsDisplacementAsDirection
385
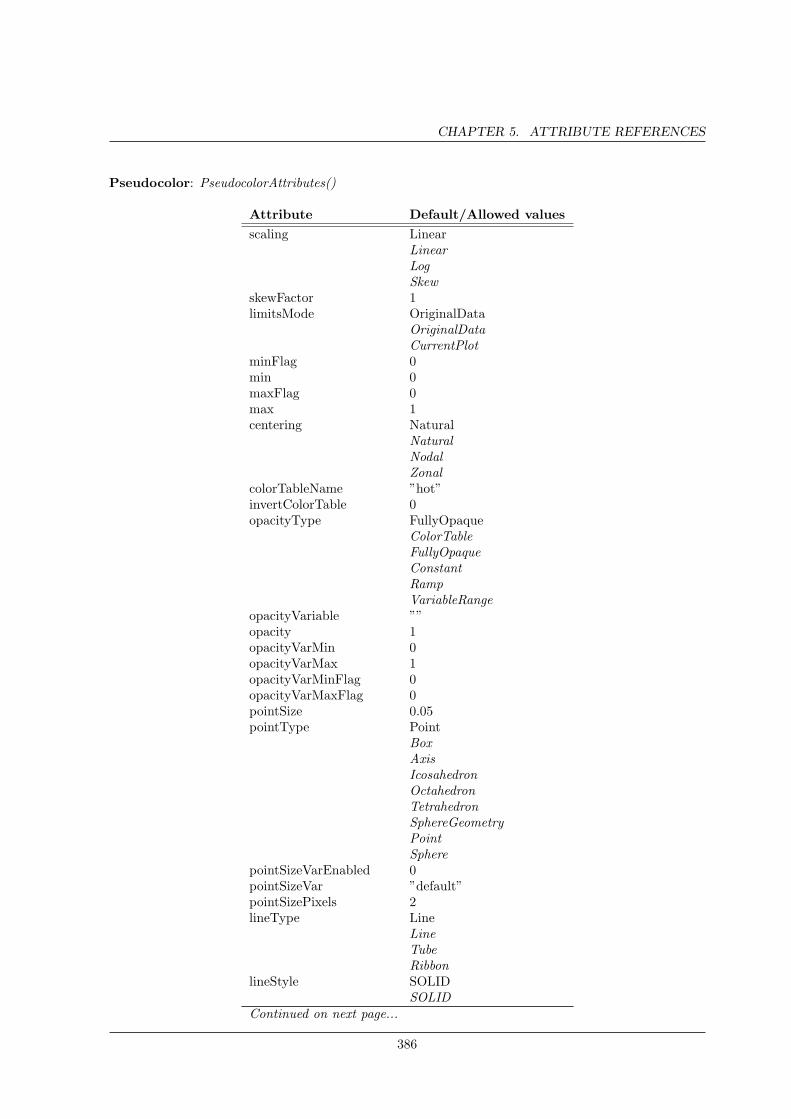
CHAPTER 5. ATTRIBUTE REFERENCES
Pseudocolor: PseudocolorAttributes()
Attribute Default/Allowed valuesscaling Linear
LinearLogSkew
skewFactor 1limitsMode OriginalData
OriginalDataCurrentPlot
minFlag 0min 0maxFlag 0max 1centering Natural
NaturalNodalZonal
colorTableName ”hot”invertColorTable 0opacityType FullyOpaque
ColorTableFullyOpaqueConstantRampVariableRange
opacityVariable ””opacity 1opacityVarMin 0opacityVarMax 1opacityVarMinFlag 0opacityVarMaxFlag 0pointSize 0.05pointType Point
BoxAxisIcosahedronOctahedronTetrahedronSphereGeometryPointSphere
pointSizeVarEnabled 0pointSizeVar ”default”pointSizePixels 2lineType Line
LineTubeRibbon
lineStyle SOLIDSOLID
Continued on next page...
386
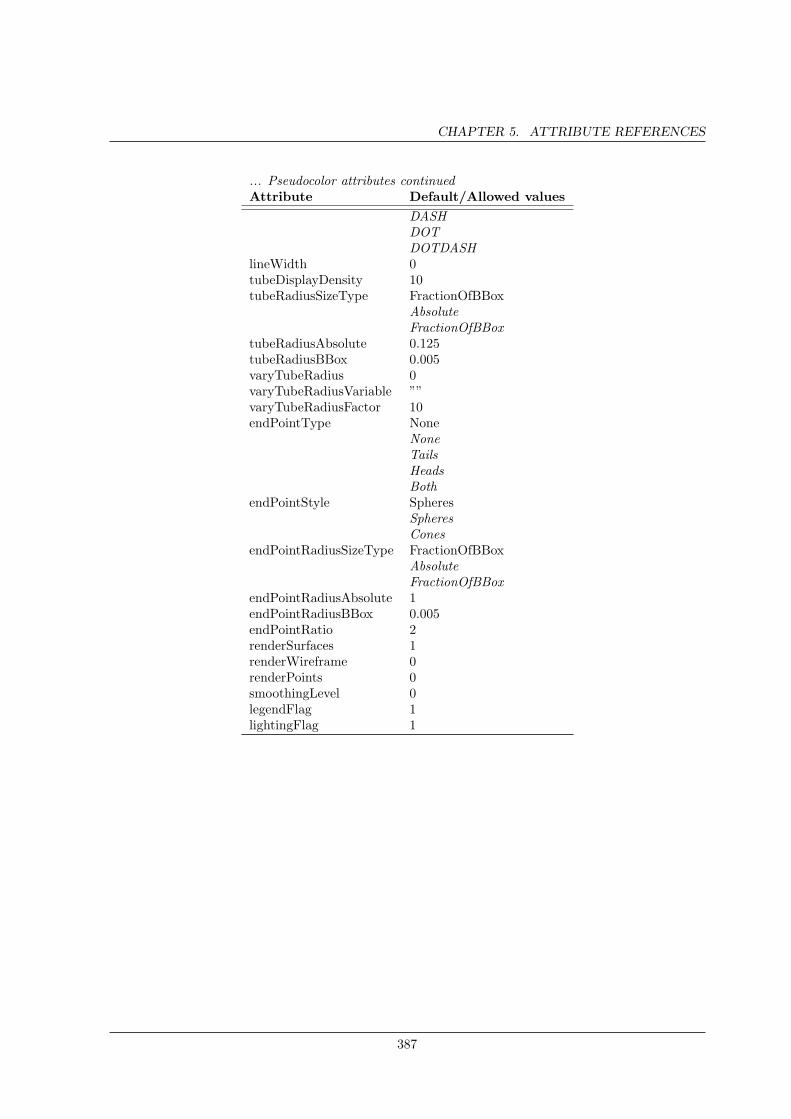
CHAPTER 5. ATTRIBUTE REFERENCES
... Pseudocolor attributes continuedAttribute Default/Allowed values
DASHDOTDOTDASH
lineWidth 0tubeDisplayDensity 10tubeRadiusSizeType FractionOfBBox
AbsoluteFractionOfBBox
tubeRadiusAbsolute 0.125tubeRadiusBBox 0.005varyTubeRadius 0varyTubeRadiusVariable ””varyTubeRadiusFactor 10endPointType None
NoneTailsHeadsBoth
endPointStyle SpheresSpheresCones
endPointRadiusSizeType FractionOfBBoxAbsoluteFractionOfBBox
endPointRadiusAbsolute 1endPointRadiusBBox 0.005endPointRatio 2renderSurfaces 1renderWireframe 0renderPoints 0smoothingLevel 0legendFlag 1lightingFlag 1
387
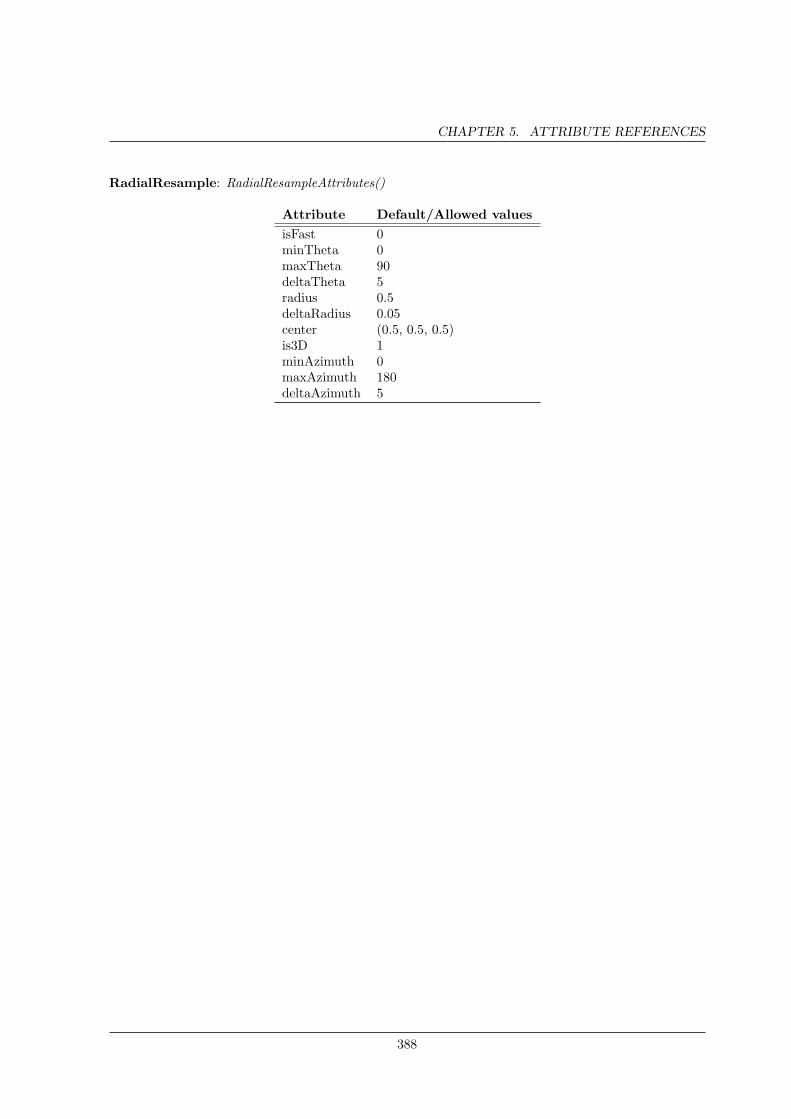
CHAPTER 5. ATTRIBUTE REFERENCES
RadialResample: RadialResampleAttributes()
Attribute Default/Allowed valuesisFast 0minTheta 0maxTheta 90deltaTheta 5radius 0.5deltaRadius 0.05center (0.5, 0.5, 0.5)is3D 1minAzimuth 0maxAzimuth 180deltaAzimuth 5
388
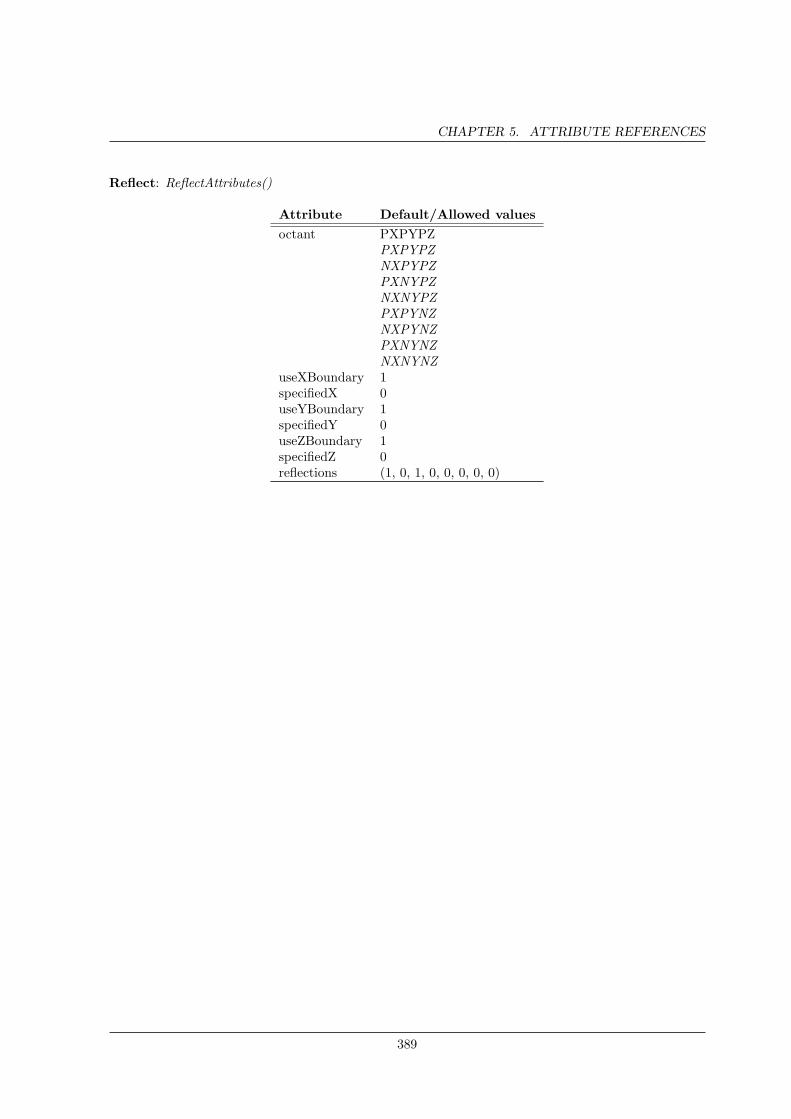
CHAPTER 5. ATTRIBUTE REFERENCES
Reflect: ReflectAttributes()
Attribute Default/Allowed valuesoctant PXPYPZ
PXPYPZNXPYPZPXNYPZNXNYPZPXPYNZNXPYNZPXNYNZNXNYNZ
useXBoundary 1specifiedX 0useYBoundary 1specifiedY 0useZBoundary 1specifiedZ 0reflections (1, 0, 1, 0, 0, 0, 0, 0)
389
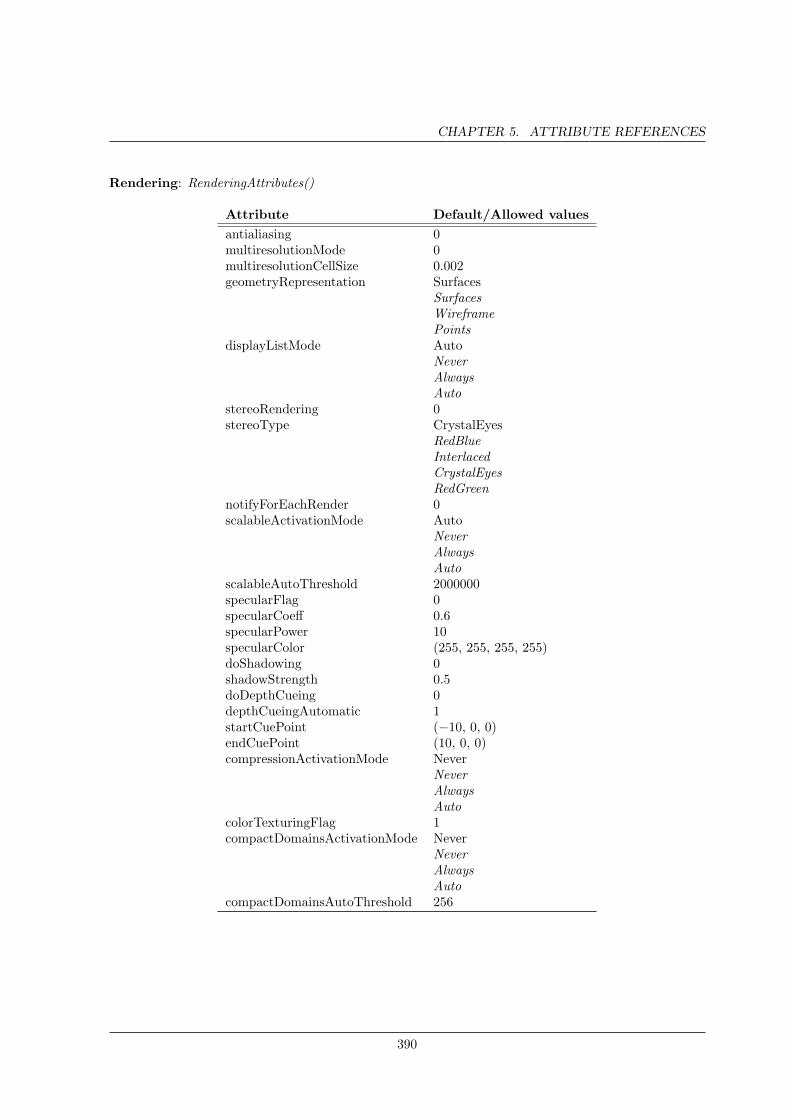
CHAPTER 5. ATTRIBUTE REFERENCES
Rendering: RenderingAttributes()
Attribute Default/Allowed valuesantialiasing 0multiresolutionMode 0multiresolutionCellSize 0.002geometryRepresentation Surfaces
SurfacesWireframePoints
displayListMode AutoNeverAlwaysAuto
stereoRendering 0stereoType CrystalEyes
RedBlueInterlacedCrystalEyesRedGreen
notifyForEachRender 0scalableActivationMode Auto
NeverAlwaysAuto
scalableAutoThreshold 2000000specularFlag 0specularCoeff 0.6specularPower 10specularColor (255, 255, 255, 255)doShadowing 0shadowStrength 0.5doDepthCueing 0depthCueingAutomatic 1startCuePoint (−10, 0, 0)endCuePoint (10, 0, 0)compressionActivationMode Never
NeverAlwaysAuto
colorTexturingFlag 1compactDomainsActivationMode Never
NeverAlwaysAuto
compactDomainsAutoThreshold 256
390
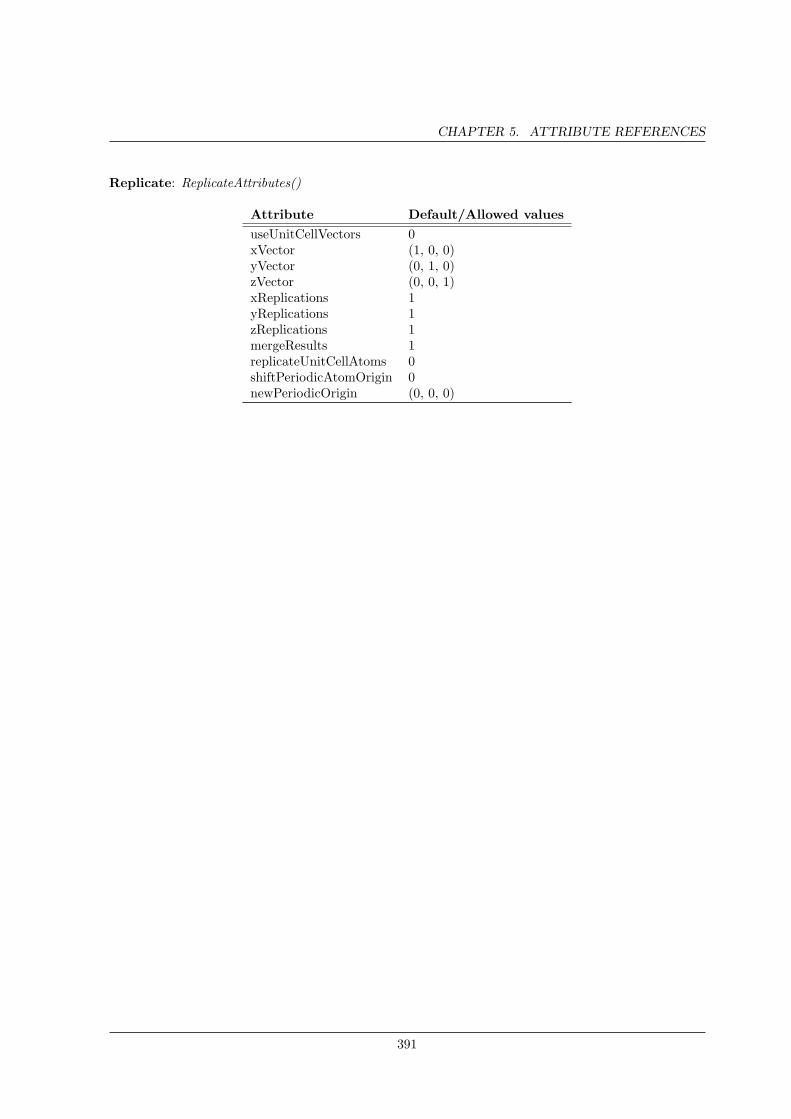
CHAPTER 5. ATTRIBUTE REFERENCES
Replicate: ReplicateAttributes()
Attribute Default/Allowed valuesuseUnitCellVectors 0xVector (1, 0, 0)yVector (0, 1, 0)zVector (0, 0, 1)xReplications 1yReplications 1zReplications 1mergeResults 1replicateUnitCellAtoms 0shiftPeriodicAtomOrigin 0newPeriodicOrigin (0, 0, 0)
391
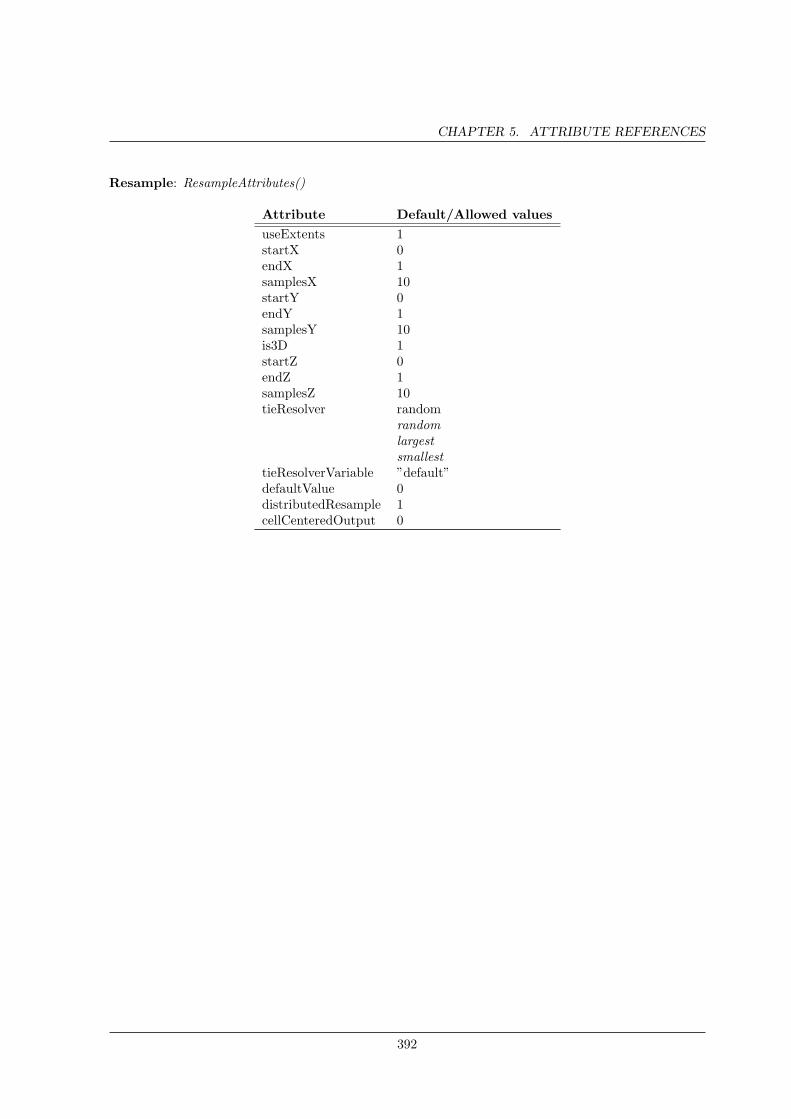
CHAPTER 5. ATTRIBUTE REFERENCES
Resample: ResampleAttributes()
Attribute Default/Allowed valuesuseExtents 1startX 0endX 1samplesX 10startY 0endY 1samplesY 10is3D 1startZ 0endZ 1samplesZ 10tieResolver random
randomlargestsmallest
tieResolverVariable ”default”defaultValue 0distributedResample 1cellCenteredOutput 0
392
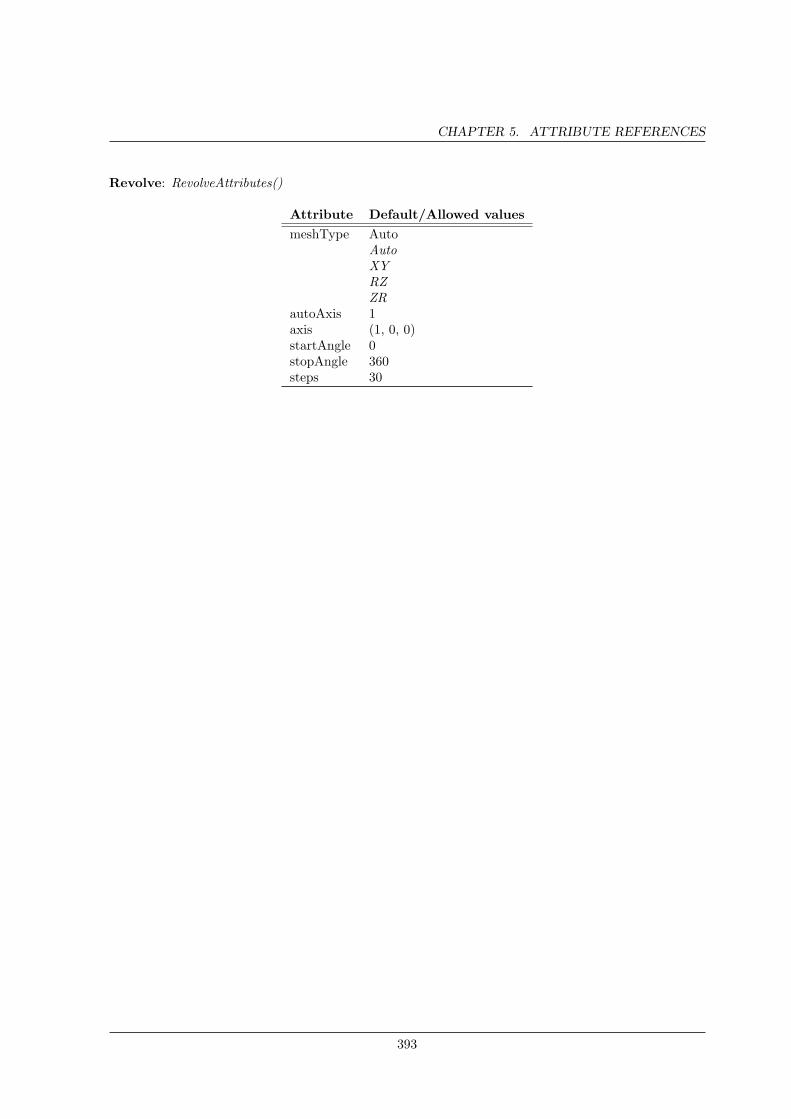
CHAPTER 5. ATTRIBUTE REFERENCES
Revolve: RevolveAttributes()
Attribute Default/Allowed valuesmeshType Auto
AutoXYRZZR
autoAxis 1axis (1, 0, 0)startAngle 0stopAngle 360steps 30
393
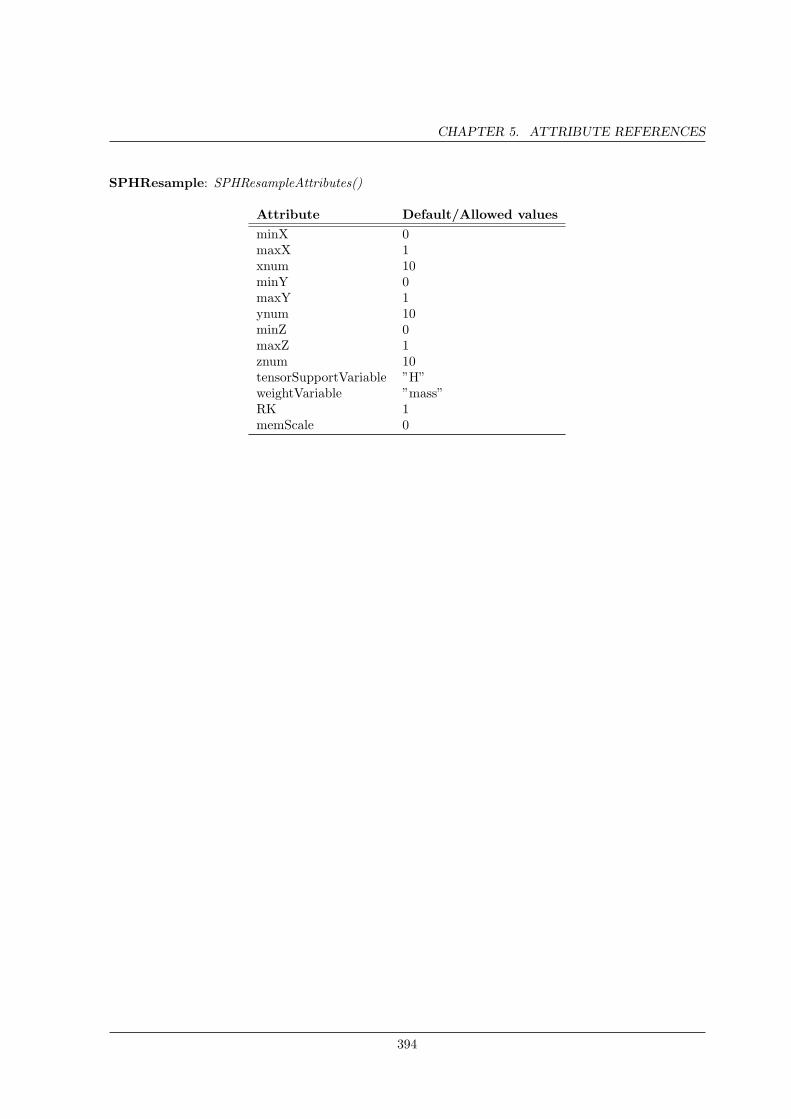
CHAPTER 5. ATTRIBUTE REFERENCES
SPHResample: SPHResampleAttributes()
Attribute Default/Allowed valuesminX 0maxX 1xnum 10minY 0maxY 1ynum 10minZ 0maxZ 1znum 10tensorSupportVariable ”H”weightVariable ”mass”RK 1memScale 0
394
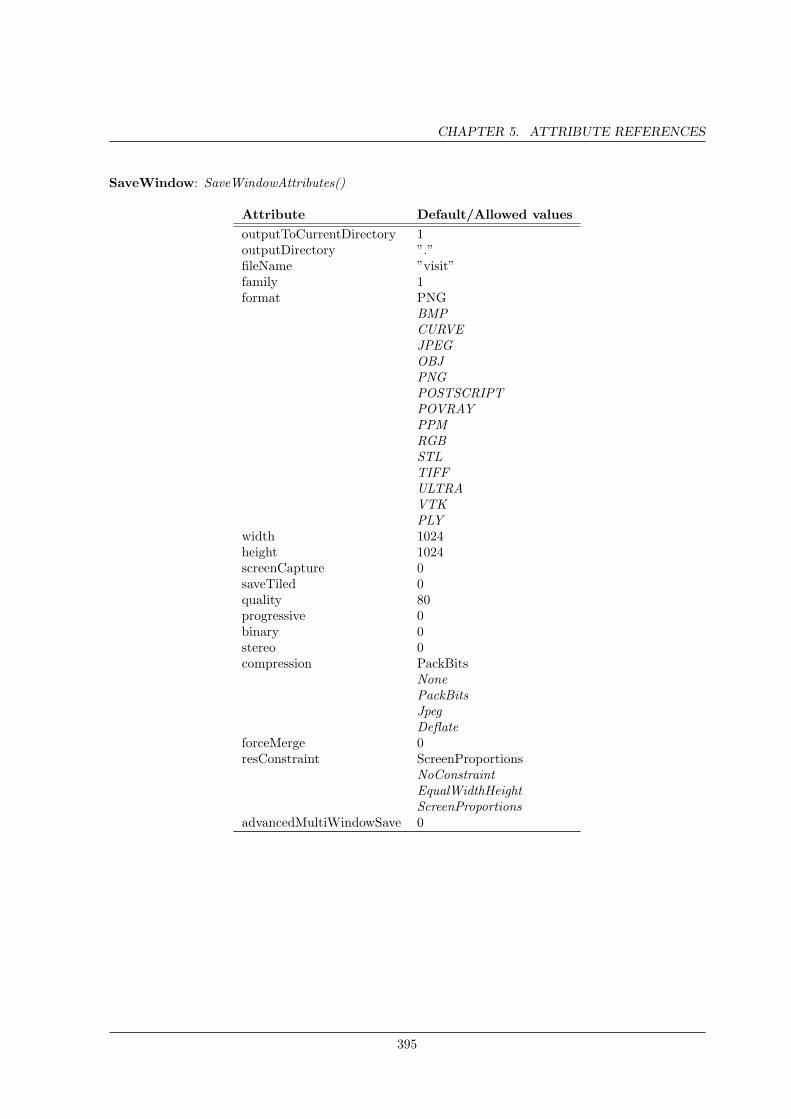
CHAPTER 5. ATTRIBUTE REFERENCES
SaveWindow: SaveWindowAttributes()
Attribute Default/Allowed valuesoutputToCurrentDirectory 1outputDirectory ”.”fileName ”visit”family 1format PNG
BMPCURVEJPEGOBJPNGPOSTSCRIPTPOVRAYPPMRGBSTLTIFFULTRAVTKPLY
width 1024height 1024screenCapture 0saveTiled 0quality 80progressive 0binary 0stereo 0compression PackBits
NonePackBitsJpegDeflate
forceMerge 0resConstraint ScreenProportions
NoConstraintEqualWidthHeightScreenProportions
advancedMultiWindowSave 0
395
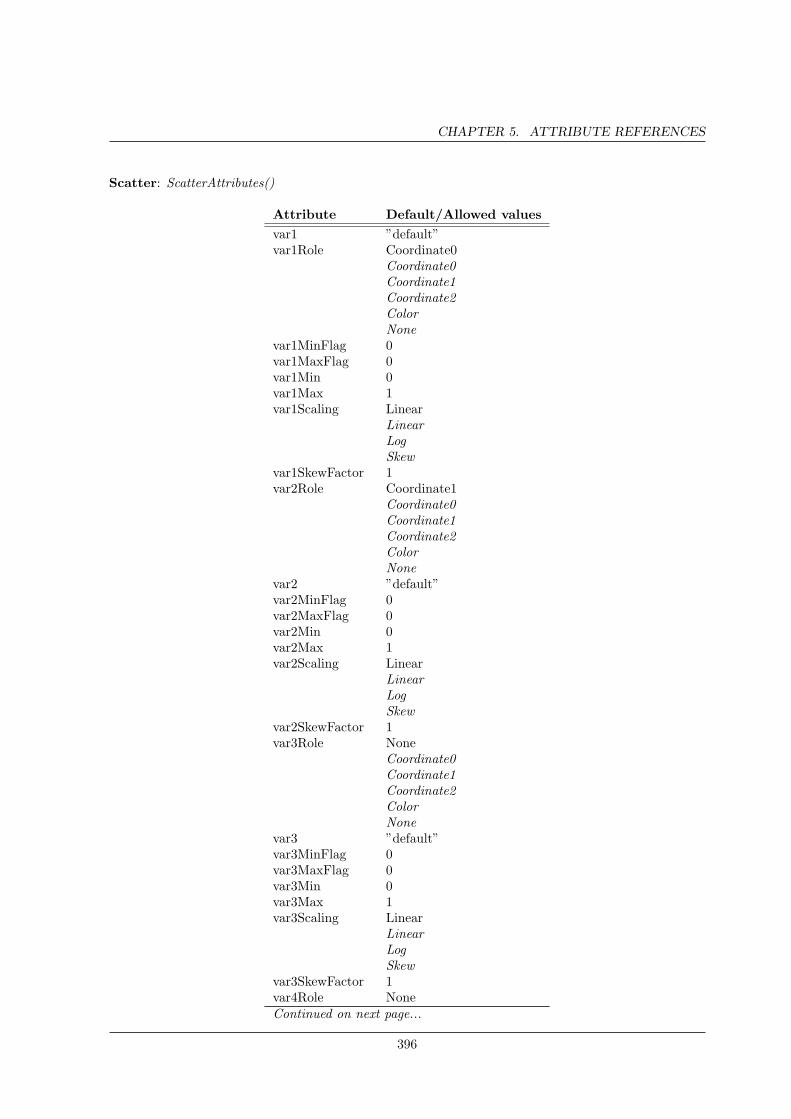
CHAPTER 5. ATTRIBUTE REFERENCES
Scatter: ScatterAttributes()
Attribute Default/Allowed valuesvar1 ”default”var1Role Coordinate0
Coordinate0Coordinate1Coordinate2ColorNone
var1MinFlag 0var1MaxFlag 0var1Min 0var1Max 1var1Scaling Linear
LinearLogSkew
var1SkewFactor 1var2Role Coordinate1
Coordinate0Coordinate1Coordinate2ColorNone
var2 ”default”var2MinFlag 0var2MaxFlag 0var2Min 0var2Max 1var2Scaling Linear
LinearLogSkew
var2SkewFactor 1var3Role None
Coordinate0Coordinate1Coordinate2ColorNone
var3 ”default”var3MinFlag 0var3MaxFlag 0var3Min 0var3Max 1var3Scaling Linear
LinearLogSkew
var3SkewFactor 1var4Role NoneContinued on next page...
396
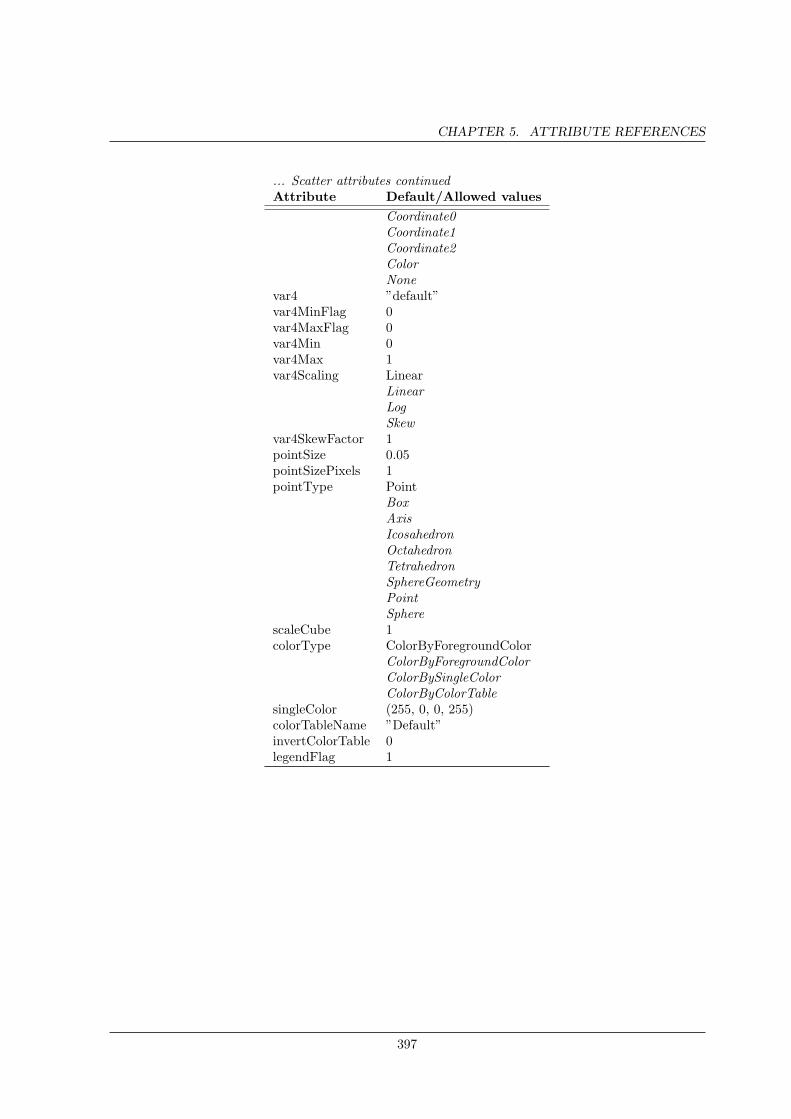
CHAPTER 5. ATTRIBUTE REFERENCES
... Scatter attributes continuedAttribute Default/Allowed values
Coordinate0Coordinate1Coordinate2ColorNone
var4 ”default”var4MinFlag 0var4MaxFlag 0var4Min 0var4Max 1var4Scaling Linear
LinearLogSkew
var4SkewFactor 1pointSize 0.05pointSizePixels 1pointType Point
BoxAxisIcosahedronOctahedronTetrahedronSphereGeometryPointSphere
scaleCube 1colorType ColorByForegroundColor
ColorByForegroundColorColorBySingleColorColorByColorTable
singleColor (255, 0, 0, 255)colorTableName ”Default”invertColorTable 0legendFlag 1
397
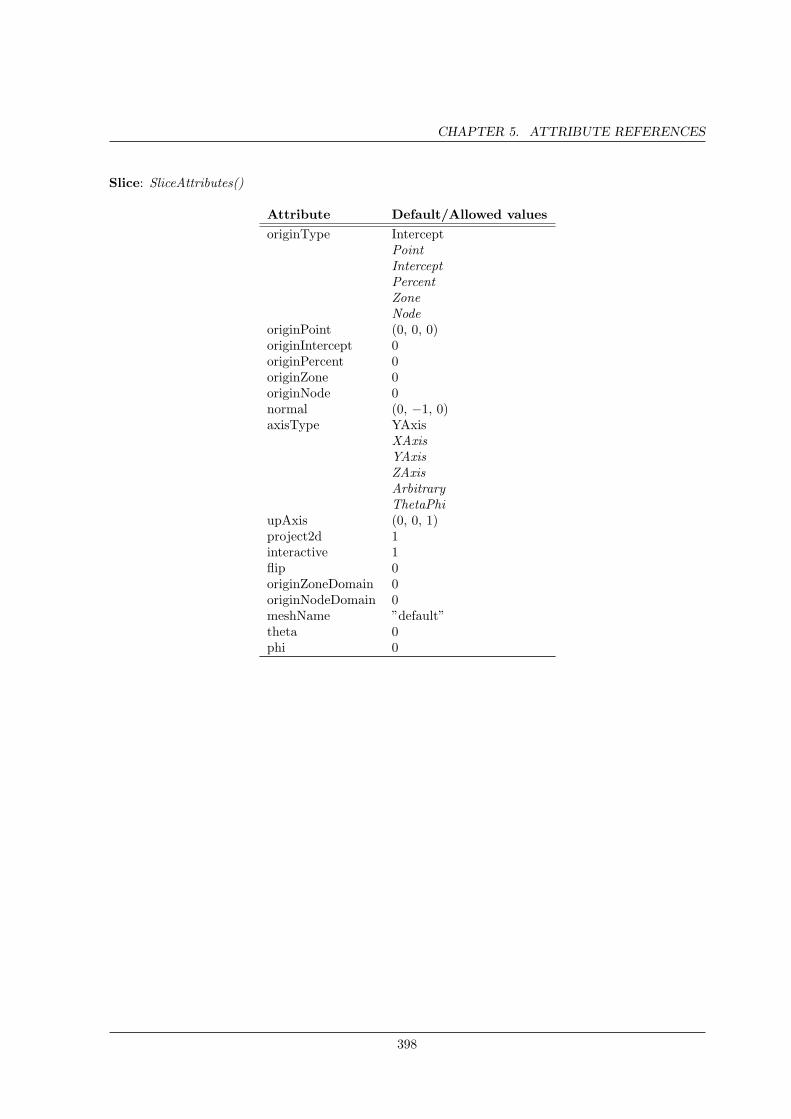
CHAPTER 5. ATTRIBUTE REFERENCES
Slice: SliceAttributes()
Attribute Default/Allowed valuesoriginType Intercept
PointInterceptPercentZoneNode
originPoint (0, 0, 0)originIntercept 0originPercent 0originZone 0originNode 0normal (0, −1, 0)axisType YAxis
XAxisYAxisZAxisArbitraryThetaPhi
upAxis (0, 0, 1)project2d 1interactive 1flip 0originZoneDomain 0originNodeDomain 0meshName ”default”theta 0phi 0
398

CHAPTER 5. ATTRIBUTE REFERENCES
SmoothOperator: SmoothOperatorAttributes()
Attribute Default/Allowed valuesnumIterations 20relaxationFactor 0.01convergence 0maintainFeatures 1featureAngle 45edgeAngle 15smoothBoundaries 0
399
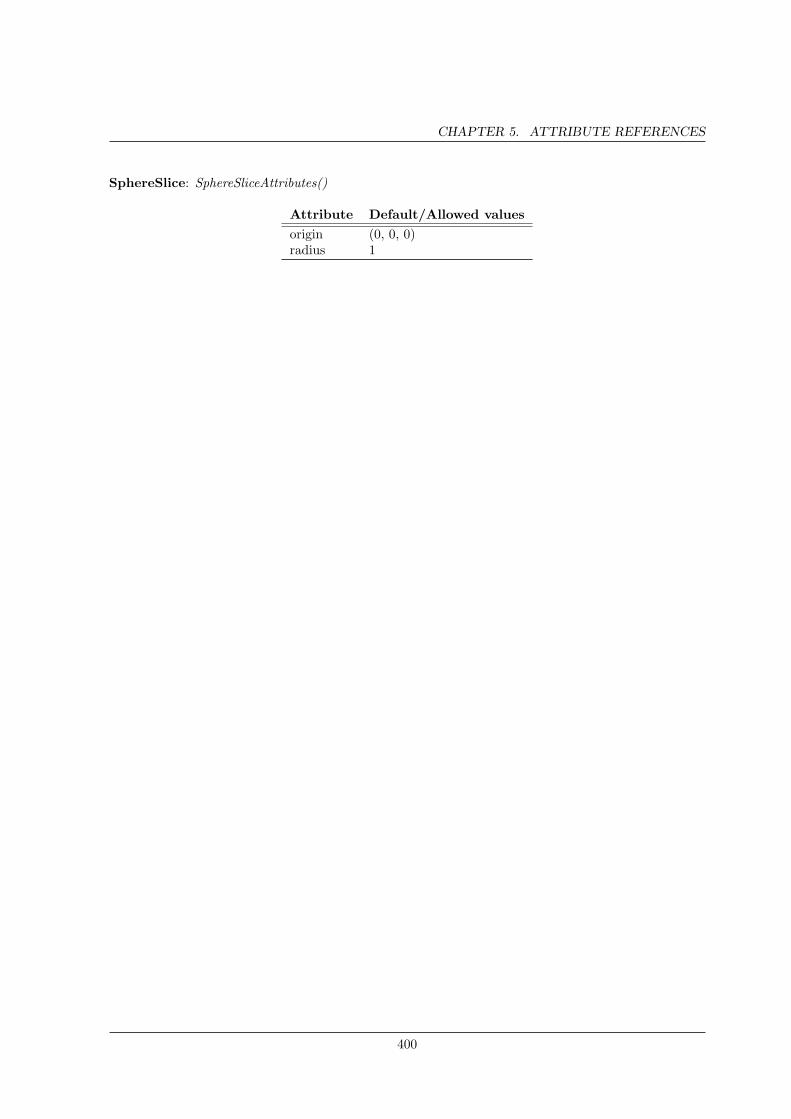
CHAPTER 5. ATTRIBUTE REFERENCES
SphereSlice: SphereSliceAttributes()
Attribute Default/Allowed valuesorigin (0, 0, 0)radius 1
400
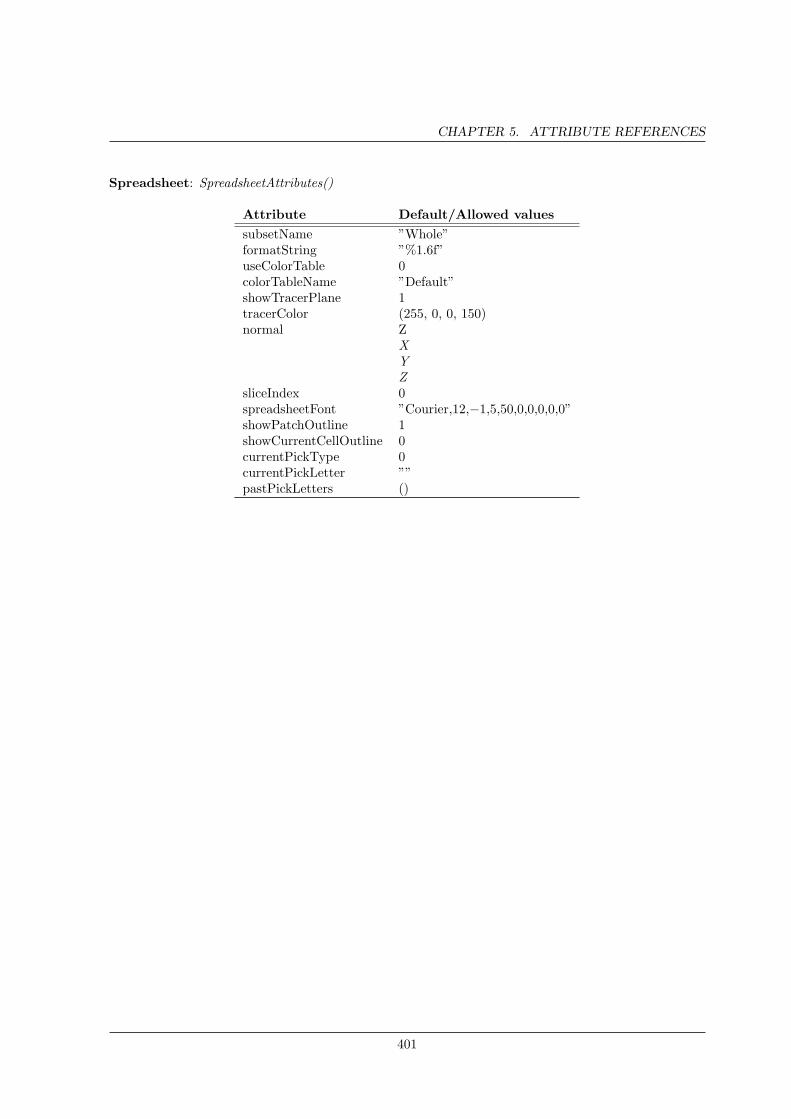
CHAPTER 5. ATTRIBUTE REFERENCES
Spreadsheet: SpreadsheetAttributes()
Attribute Default/Allowed valuessubsetName ”Whole”formatString ”%1.6f”useColorTable 0colorTableName ”Default”showTracerPlane 1tracerColor (255, 0, 0, 150)normal Z
XYZ
sliceIndex 0spreadsheetFont ”Courier,12,−1,5,50,0,0,0,0,0”showPatchOutline 1showCurrentCellOutline 0currentPickType 0currentPickLetter ””pastPickLetters ()
401
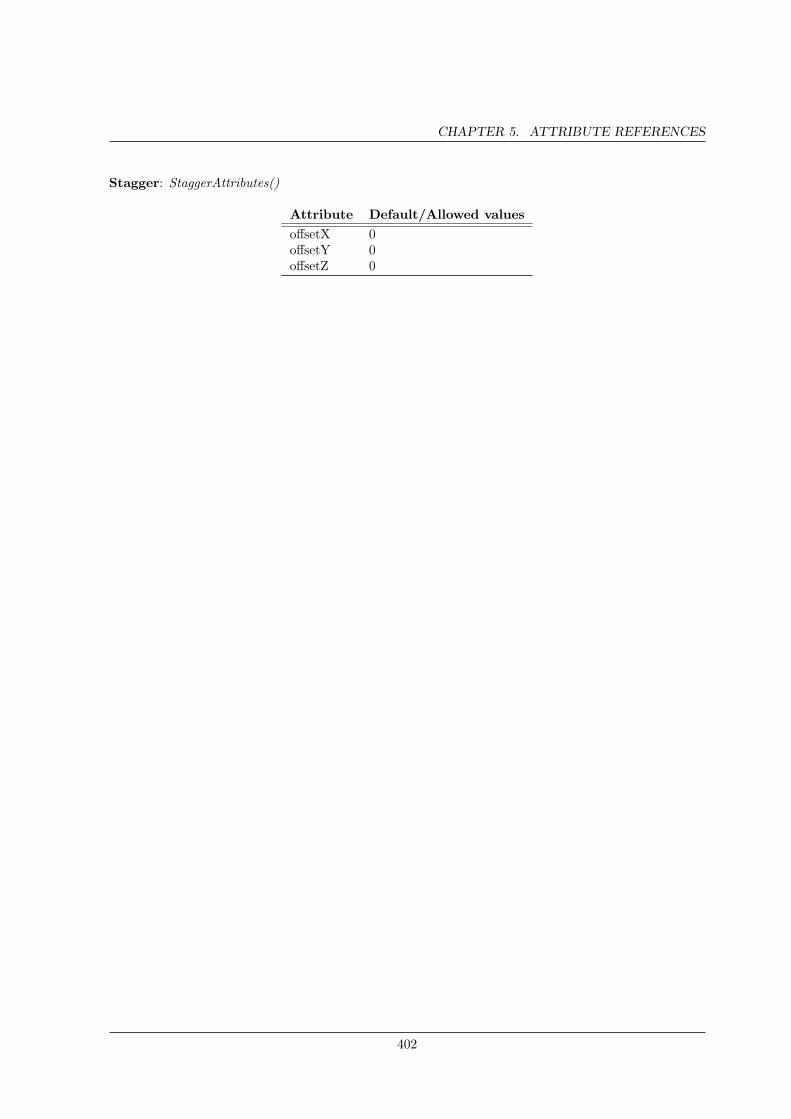
CHAPTER 5. ATTRIBUTE REFERENCES
Stagger: StaggerAttributes()
Attribute Default/Allowed valuesoffsetX 0offsetY 0offsetZ 0
402
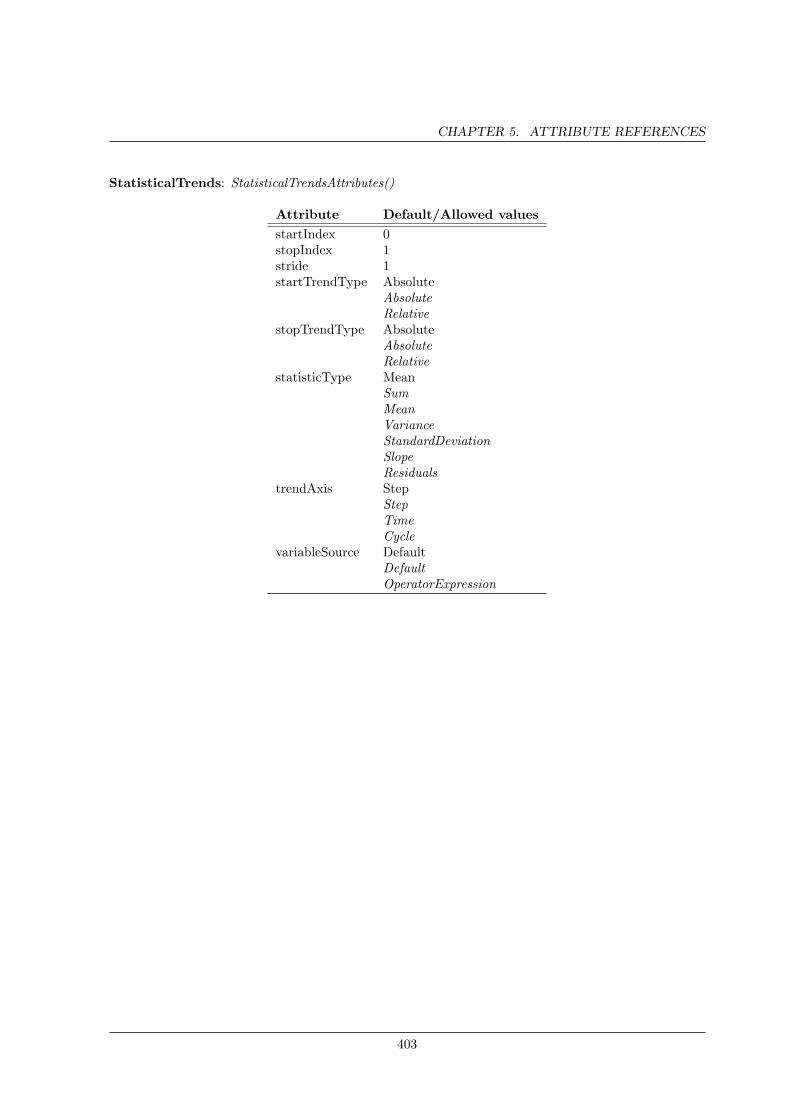
CHAPTER 5. ATTRIBUTE REFERENCES
StatisticalTrends: StatisticalTrendsAttributes()
Attribute Default/Allowed valuesstartIndex 0stopIndex 1stride 1startTrendType Absolute
AbsoluteRelative
stopTrendType AbsoluteAbsoluteRelative
statisticType MeanSumMeanVarianceStandardDeviationSlopeResiduals
trendAxis StepStepTimeCycle
variableSource DefaultDefaultOperatorExpression
403
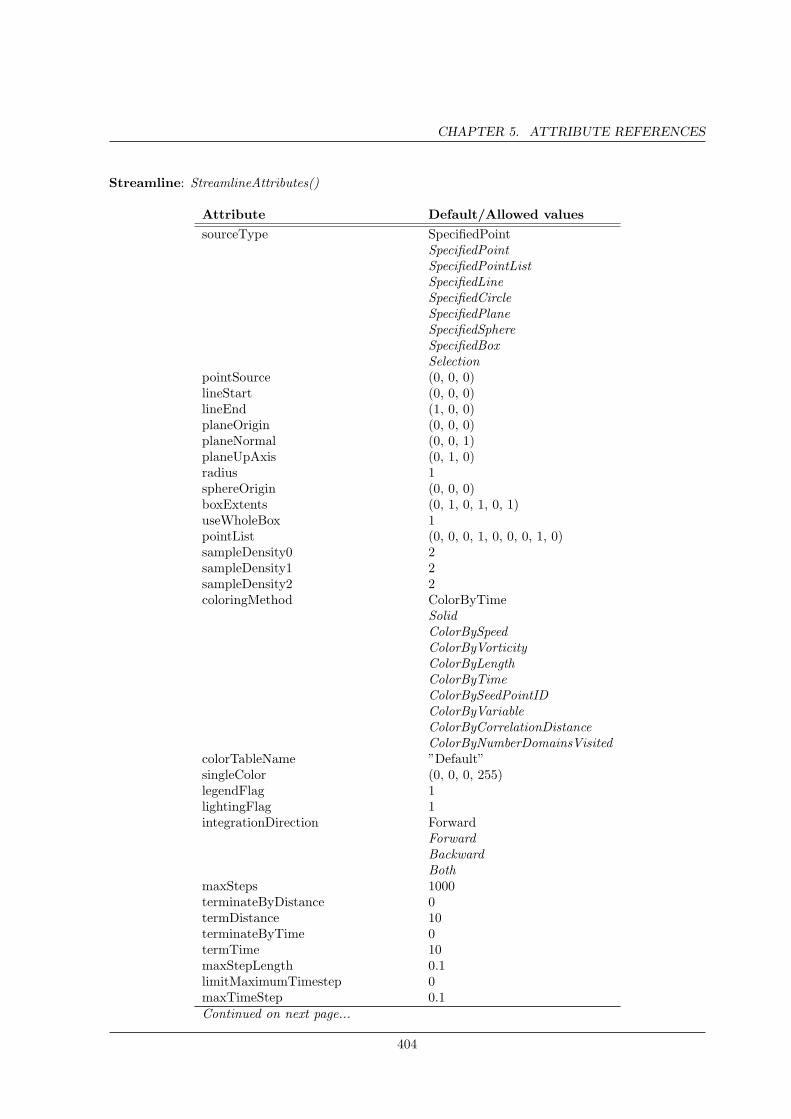
CHAPTER 5. ATTRIBUTE REFERENCES
Streamline: StreamlineAttributes()
Attribute Default/Allowed valuessourceType SpecifiedPoint
SpecifiedPointSpecifiedPointListSpecifiedLineSpecifiedCircleSpecifiedPlaneSpecifiedSphereSpecifiedBoxSelection
pointSource (0, 0, 0)lineStart (0, 0, 0)lineEnd (1, 0, 0)planeOrigin (0, 0, 0)planeNormal (0, 0, 1)planeUpAxis (0, 1, 0)radius 1sphereOrigin (0, 0, 0)boxExtents (0, 1, 0, 1, 0, 1)useWholeBox 1pointList (0, 0, 0, 1, 0, 0, 0, 1, 0)sampleDensity0 2sampleDensity1 2sampleDensity2 2coloringMethod ColorByTime
SolidColorBySpeedColorByVorticityColorByLengthColorByTimeColorBySeedPointIDColorByVariableColorByCorrelationDistanceColorByNumberDomainsVisited
colorTableName ”Default”singleColor (0, 0, 0, 255)legendFlag 1lightingFlag 1integrationDirection Forward
ForwardBackwardBoth
maxSteps 1000terminateByDistance 0termDistance 10terminateByTime 0termTime 10maxStepLength 0.1limitMaximumTimestep 0maxTimeStep 0.1Continued on next page...
404
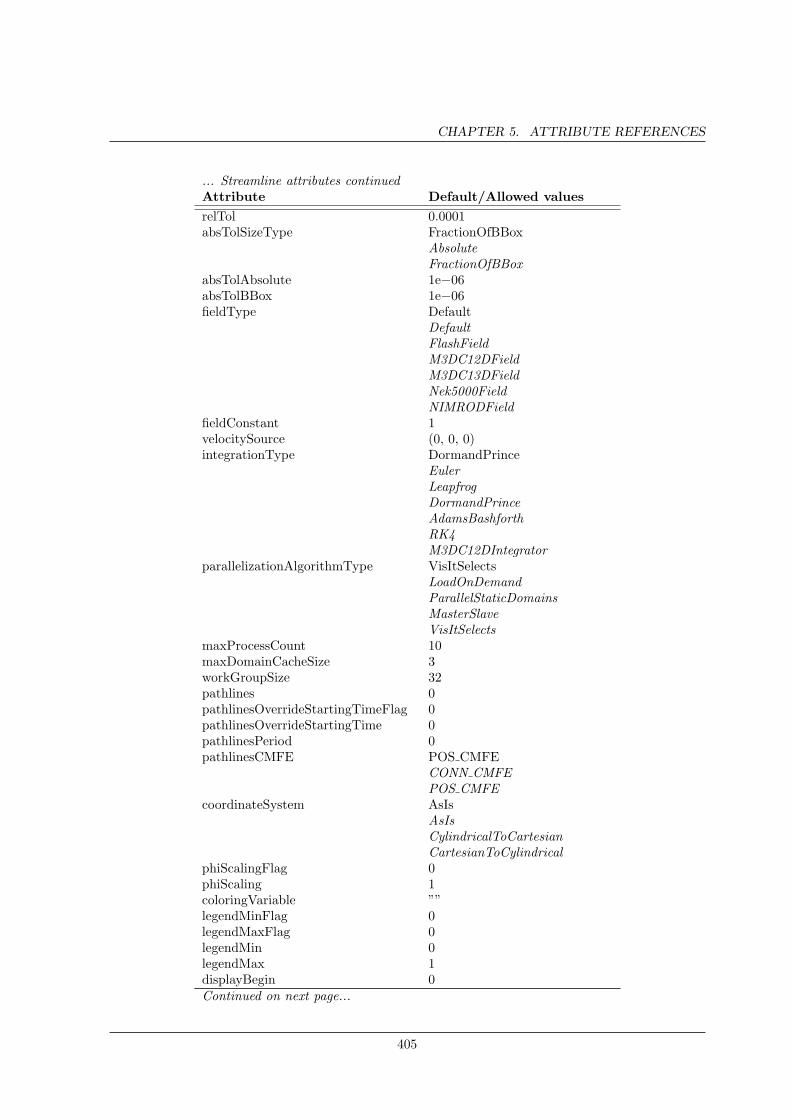
CHAPTER 5. ATTRIBUTE REFERENCES
... Streamline attributes continuedAttribute Default/Allowed valuesrelTol 0.0001absTolSizeType FractionOfBBox
AbsoluteFractionOfBBox
absTolAbsolute 1e−06absTolBBox 1e−06fieldType Default
DefaultFlashFieldM3DC12DFieldM3DC13DFieldNek5000FieldNIMRODField
fieldConstant 1velocitySource (0, 0, 0)integrationType DormandPrince
EulerLeapfrogDormandPrinceAdamsBashforthRK4M3DC12DIntegrator
parallelizationAlgorithmType VisItSelectsLoadOnDemandParallelStaticDomainsMasterSlaveVisItSelects
maxProcessCount 10maxDomainCacheSize 3workGroupSize 32pathlines 0pathlinesOverrideStartingTimeFlag 0pathlinesOverrideStartingTime 0pathlinesPeriod 0pathlinesCMFE POS CMFE
CONN CMFEPOS CMFE
coordinateSystem AsIsAsIsCylindricalToCartesianCartesianToCylindrical
phiScalingFlag 0phiScaling 1coloringVariable ””legendMinFlag 0legendMaxFlag 0legendMin 0legendMax 1displayBegin 0Continued on next page...
405
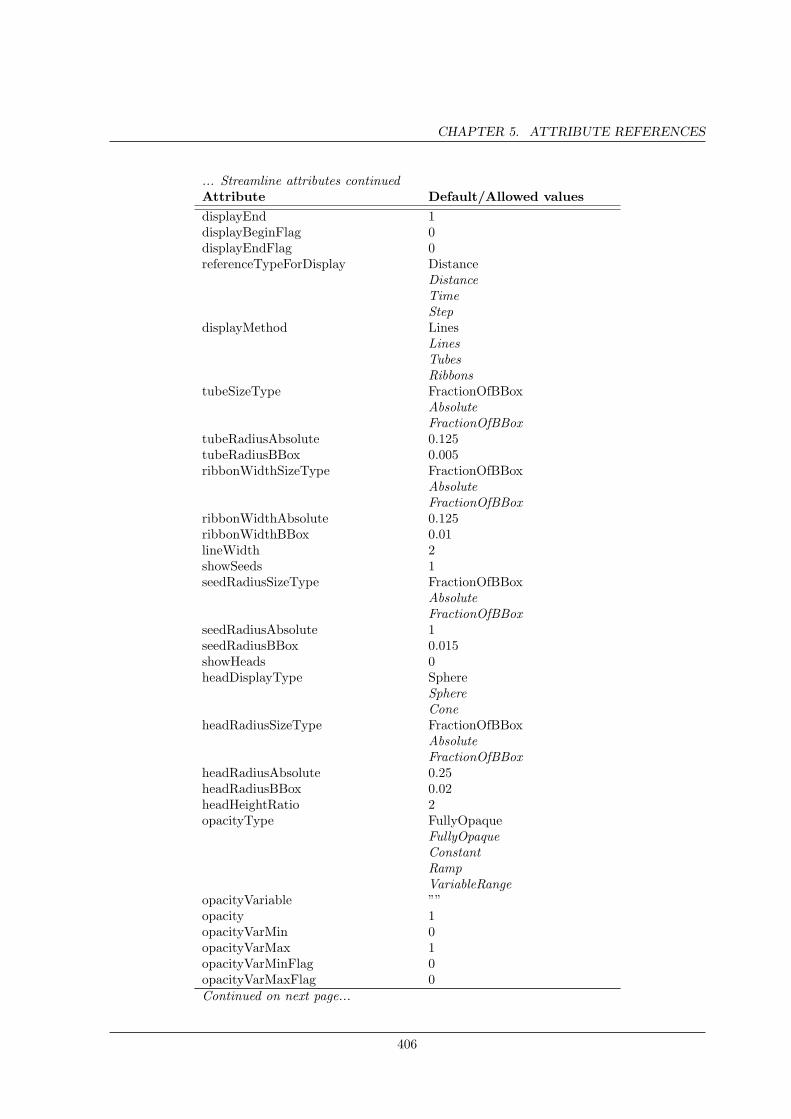
CHAPTER 5. ATTRIBUTE REFERENCES
... Streamline attributes continuedAttribute Default/Allowed valuesdisplayEnd 1displayBeginFlag 0displayEndFlag 0referenceTypeForDisplay Distance
DistanceTimeStep
displayMethod LinesLinesTubesRibbons
tubeSizeType FractionOfBBoxAbsoluteFractionOfBBox
tubeRadiusAbsolute 0.125tubeRadiusBBox 0.005ribbonWidthSizeType FractionOfBBox
AbsoluteFractionOfBBox
ribbonWidthAbsolute 0.125ribbonWidthBBox 0.01lineWidth 2showSeeds 1seedRadiusSizeType FractionOfBBox
AbsoluteFractionOfBBox
seedRadiusAbsolute 1seedRadiusBBox 0.015showHeads 0headDisplayType Sphere
SphereCone
headRadiusSizeType FractionOfBBoxAbsoluteFractionOfBBox
headRadiusAbsolute 0.25headRadiusBBox 0.02headHeightRatio 2opacityType FullyOpaque
FullyOpaqueConstantRampVariableRange
opacityVariable ””opacity 1opacityVarMin 0opacityVarMax 1opacityVarMinFlag 0opacityVarMaxFlag 0Continued on next page...
406
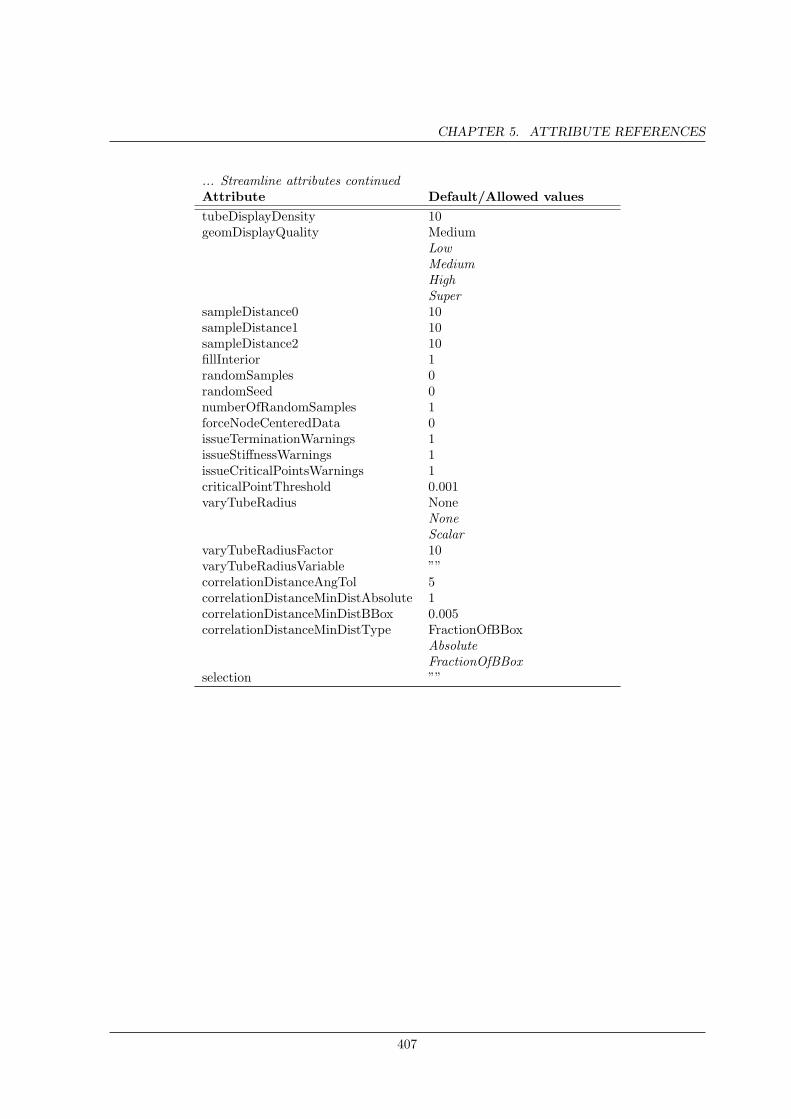
CHAPTER 5. ATTRIBUTE REFERENCES
... Streamline attributes continuedAttribute Default/Allowed valuestubeDisplayDensity 10geomDisplayQuality Medium
LowMediumHighSuper
sampleDistance0 10sampleDistance1 10sampleDistance2 10fillInterior 1randomSamples 0randomSeed 0numberOfRandomSamples 1forceNodeCenteredData 0issueTerminationWarnings 1issueStiffnessWarnings 1issueCriticalPointsWarnings 1criticalPointThreshold 0.001varyTubeRadius None
NoneScalar
varyTubeRadiusFactor 10varyTubeRadiusVariable ””correlationDistanceAngTol 5correlationDistanceMinDistAbsolute 1correlationDistanceMinDistBBox 0.005correlationDistanceMinDistType FractionOfBBox
AbsoluteFractionOfBBox
selection ””
407
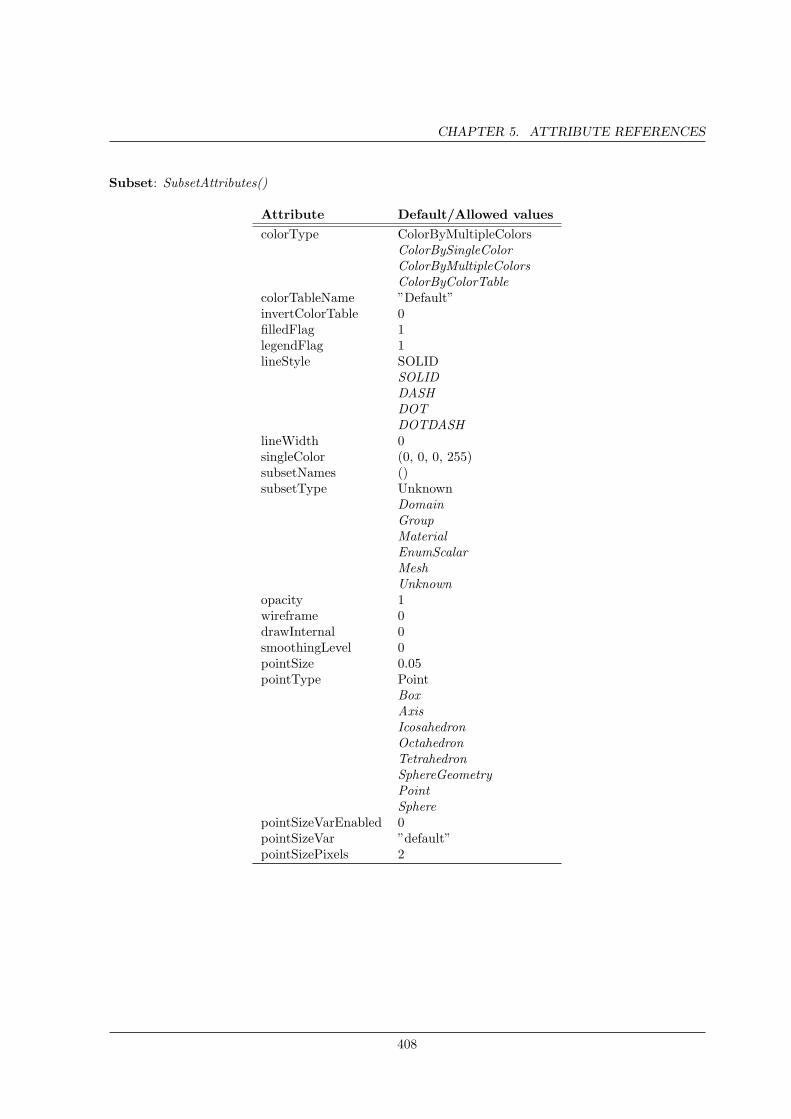
CHAPTER 5. ATTRIBUTE REFERENCES
Subset: SubsetAttributes()
Attribute Default/Allowed valuescolorType ColorByMultipleColors
ColorBySingleColorColorByMultipleColorsColorByColorTable
colorTableName ”Default”invertColorTable 0filledFlag 1legendFlag 1lineStyle SOLID
SOLIDDASHDOTDOTDASH
lineWidth 0singleColor (0, 0, 0, 255)subsetNames ()subsetType Unknown
DomainGroupMaterialEnumScalarMeshUnknown
opacity 1wireframe 0drawInternal 0smoothingLevel 0pointSize 0.05pointType Point
BoxAxisIcosahedronOctahedronTetrahedronSphereGeometryPointSphere
pointSizeVarEnabled 0pointSizeVar ”default”pointSizePixels 2
408
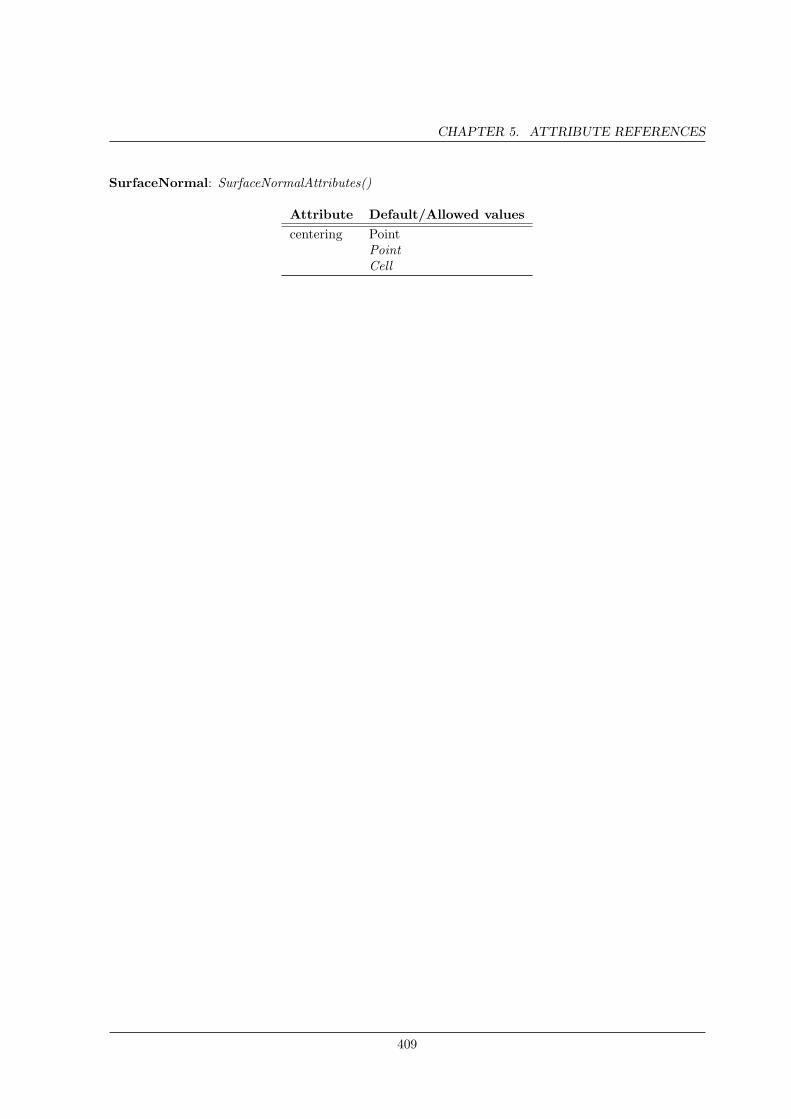
CHAPTER 5. ATTRIBUTE REFERENCES
SurfaceNormal: SurfaceNormalAttributes()
Attribute Default/Allowed valuescentering Point
PointCell
409
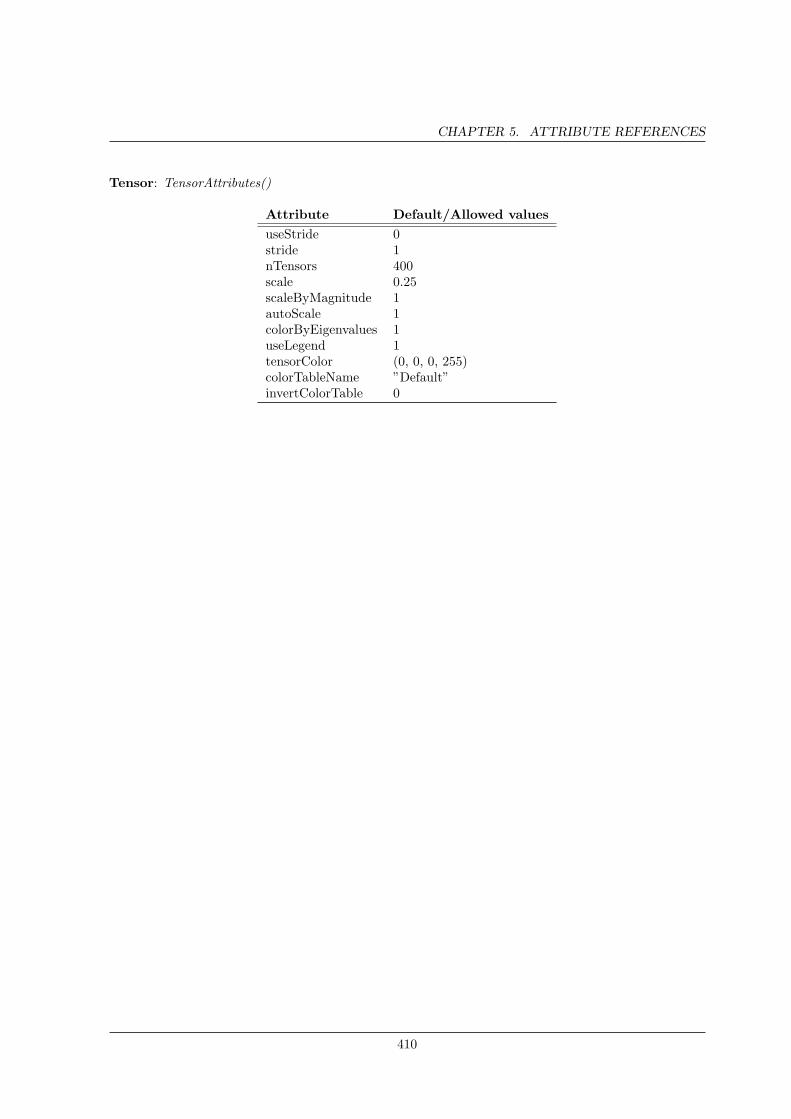
CHAPTER 5. ATTRIBUTE REFERENCES
Tensor: TensorAttributes()
Attribute Default/Allowed valuesuseStride 0stride 1nTensors 400scale 0.25scaleByMagnitude 1autoScale 1colorByEigenvalues 1useLegend 1tensorColor (0, 0, 0, 255)colorTableName ”Default”invertColorTable 0
410
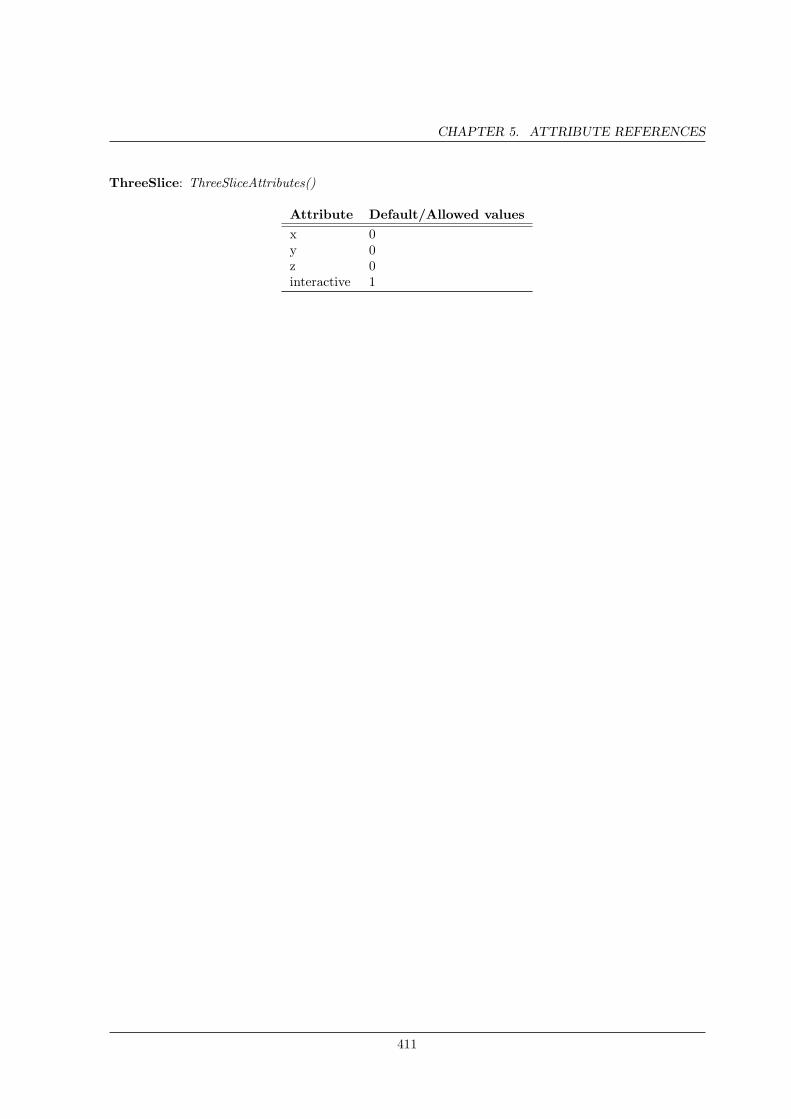
CHAPTER 5. ATTRIBUTE REFERENCES
ThreeSlice: ThreeSliceAttributes()
Attribute Default/Allowed valuesx 0y 0z 0interactive 1
411
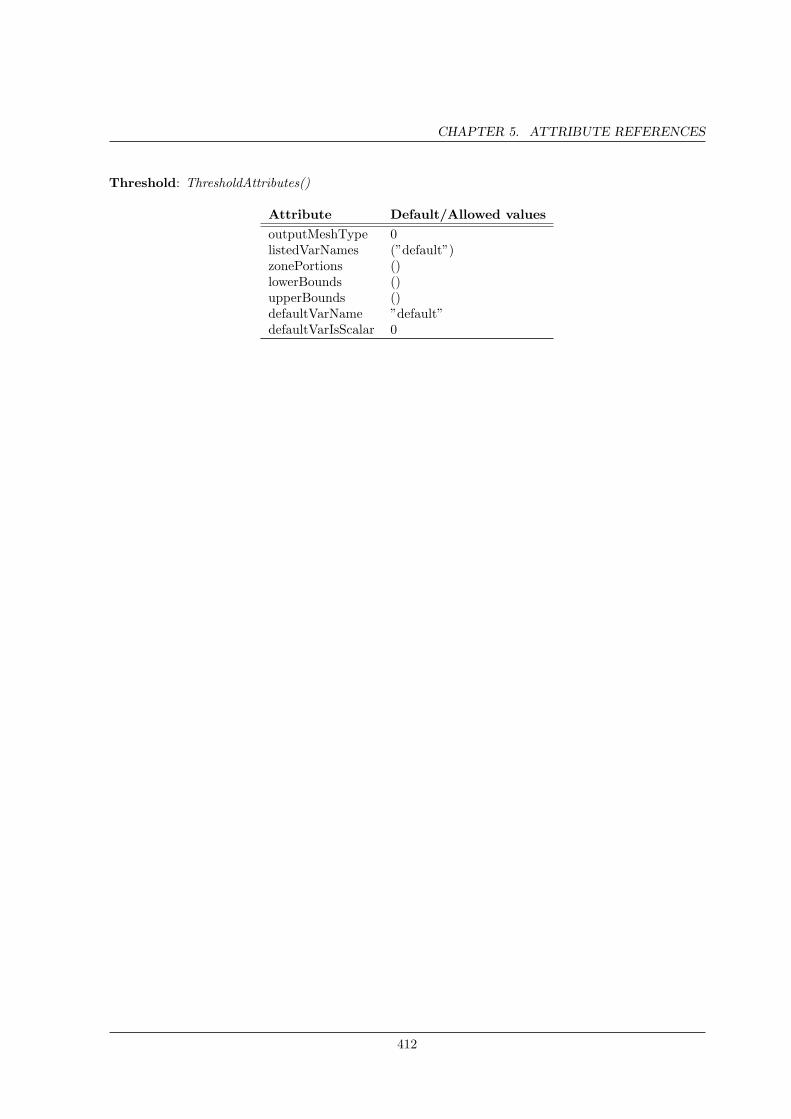
CHAPTER 5. ATTRIBUTE REFERENCES
Threshold: ThresholdAttributes()
Attribute Default/Allowed valuesoutputMeshType 0listedVarNames (”default”)zonePortions ()lowerBounds ()upperBounds ()defaultVarName ”default”defaultVarIsScalar 0
412
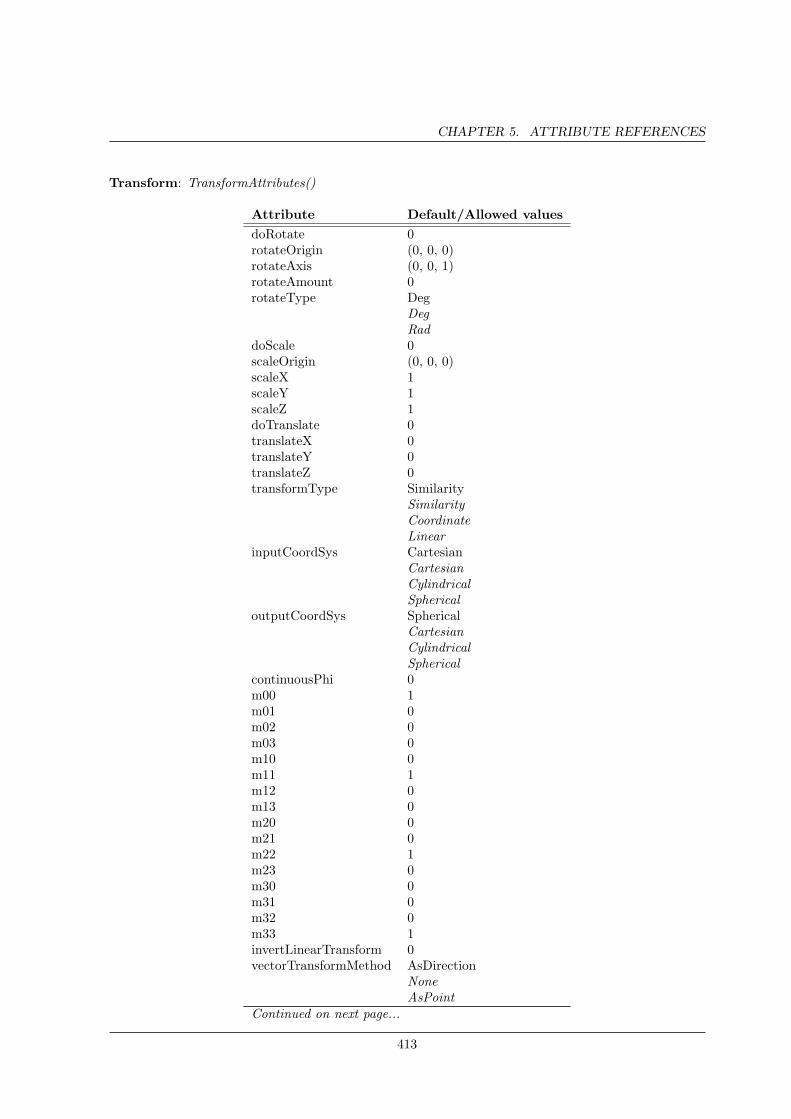
CHAPTER 5. ATTRIBUTE REFERENCES
Transform: TransformAttributes()
Attribute Default/Allowed valuesdoRotate 0rotateOrigin (0, 0, 0)rotateAxis (0, 0, 1)rotateAmount 0rotateType Deg
DegRad
doScale 0scaleOrigin (0, 0, 0)scaleX 1scaleY 1scaleZ 1doTranslate 0translateX 0translateY 0translateZ 0transformType Similarity
SimilarityCoordinateLinear
inputCoordSys CartesianCartesianCylindricalSpherical
outputCoordSys SphericalCartesianCylindricalSpherical
continuousPhi 0m00 1m01 0m02 0m03 0m10 0m11 1m12 0m13 0m20 0m21 0m22 1m23 0m30 0m31 0m32 0m33 1invertLinearTransform 0vectorTransformMethod AsDirection
NoneAsPoint
Continued on next page...
413
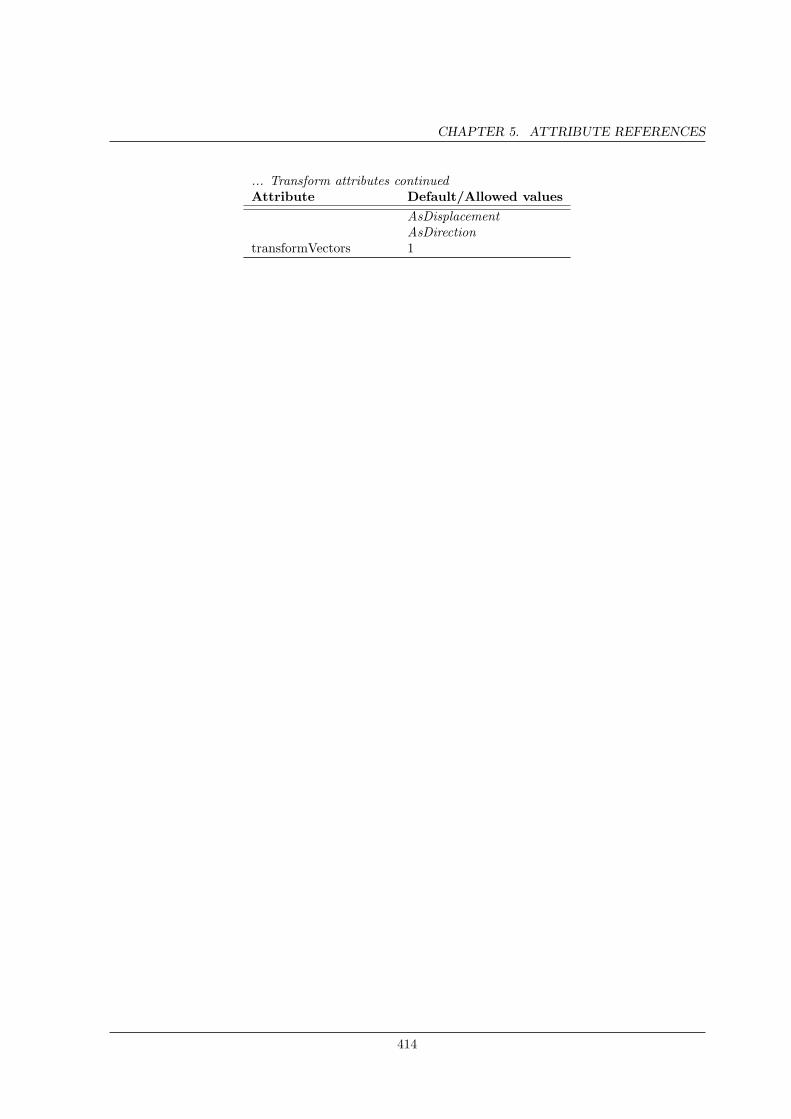
CHAPTER 5. ATTRIBUTE REFERENCES
... Transform attributes continuedAttribute Default/Allowed values
AsDisplacementAsDirection
transformVectors 1
414
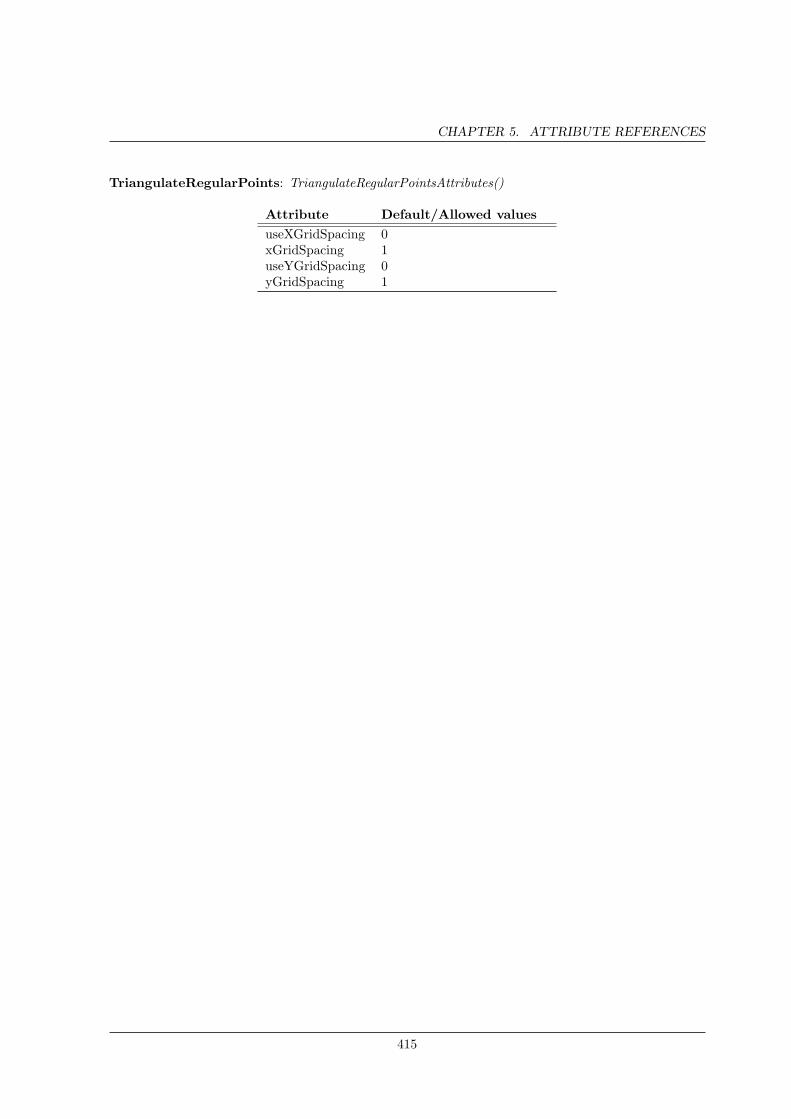
CHAPTER 5. ATTRIBUTE REFERENCES
TriangulateRegularPoints: TriangulateRegularPointsAttributes()
Attribute Default/Allowed valuesuseXGridSpacing 0xGridSpacing 1useYGridSpacing 0yGridSpacing 1
415

CHAPTER 5. ATTRIBUTE REFERENCES
Truecolor: TruecolorAttributes()
Attribute Default/Allowed valuesopacity 1lightingFlag 1
416
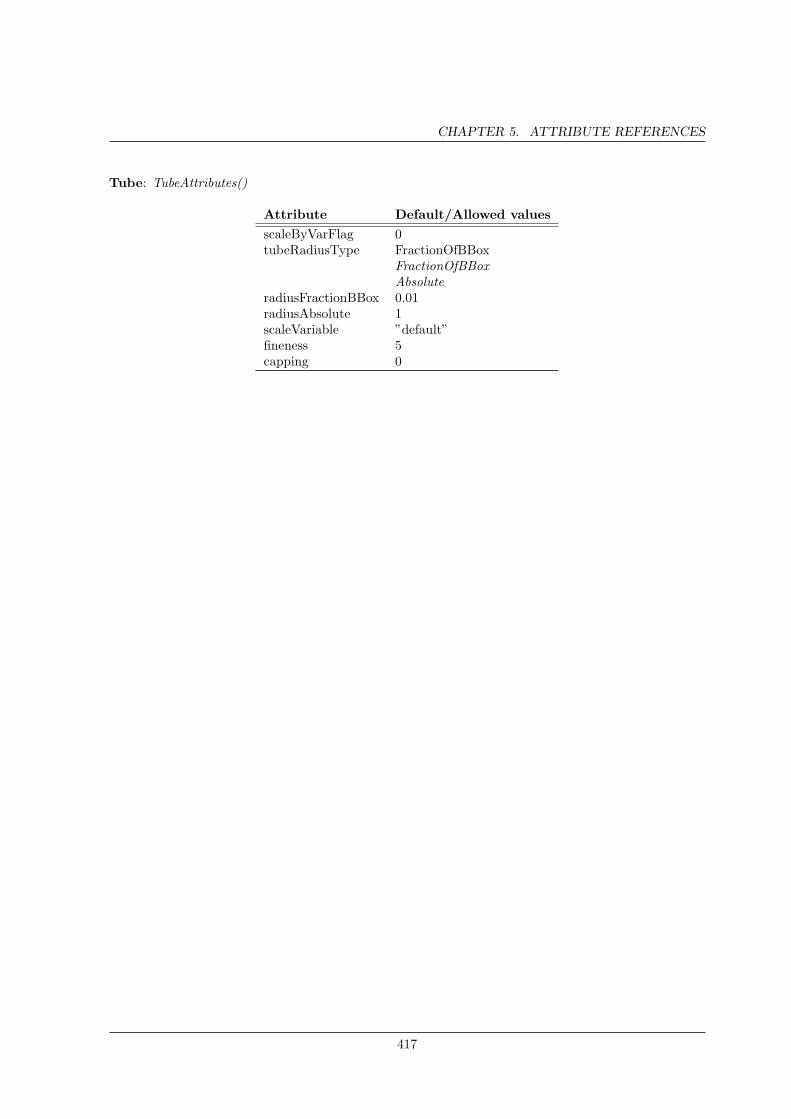
CHAPTER 5. ATTRIBUTE REFERENCES
Tube: TubeAttributes()
Attribute Default/Allowed valuesscaleByVarFlag 0tubeRadiusType FractionOfBBox
FractionOfBBoxAbsolute
radiusFractionBBox 0.01radiusAbsolute 1scaleVariable ”default”fineness 5capping 0
417
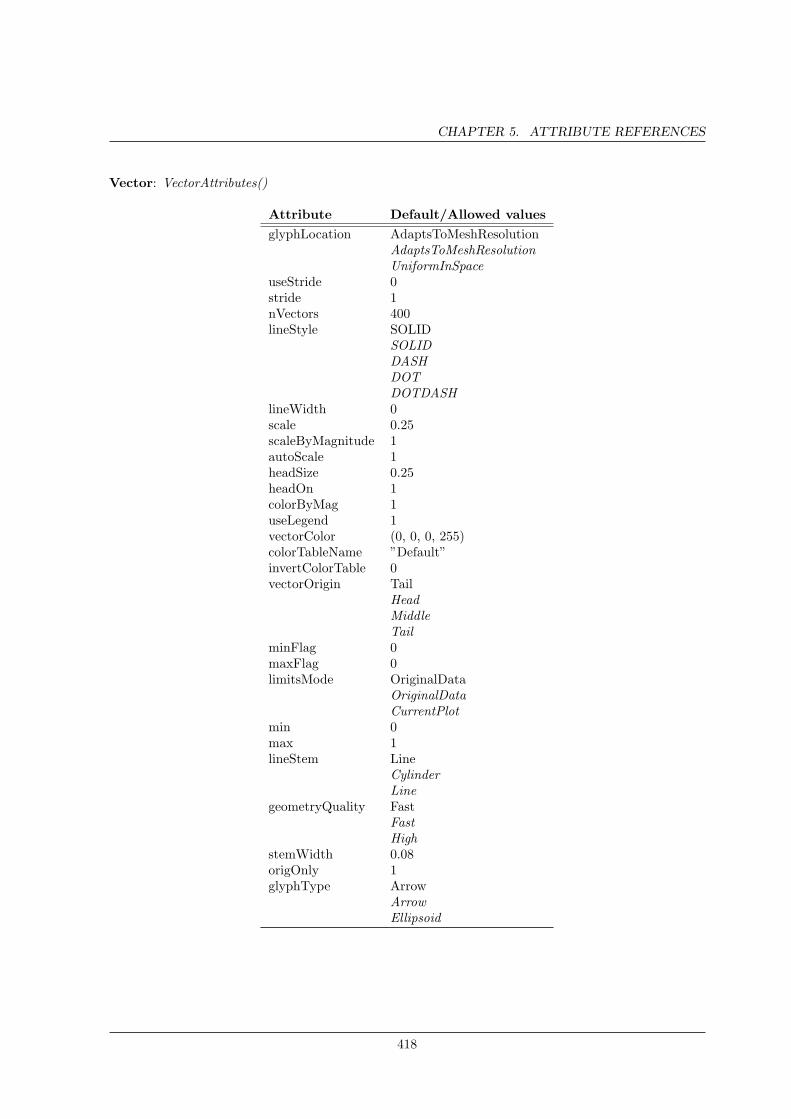
CHAPTER 5. ATTRIBUTE REFERENCES
Vector: VectorAttributes()
Attribute Default/Allowed valuesglyphLocation AdaptsToMeshResolution
AdaptsToMeshResolutionUniformInSpace
useStride 0stride 1nVectors 400lineStyle SOLID
SOLIDDASHDOTDOTDASH
lineWidth 0scale 0.25scaleByMagnitude 1autoScale 1headSize 0.25headOn 1colorByMag 1useLegend 1vectorColor (0, 0, 0, 255)colorTableName ”Default”invertColorTable 0vectorOrigin Tail
HeadMiddleTail
minFlag 0maxFlag 0limitsMode OriginalData
OriginalDataCurrentPlot
min 0max 1lineStem Line
CylinderLine
geometryQuality FastFastHigh
stemWidth 0.08origOnly 1glyphType Arrow
ArrowEllipsoid
418
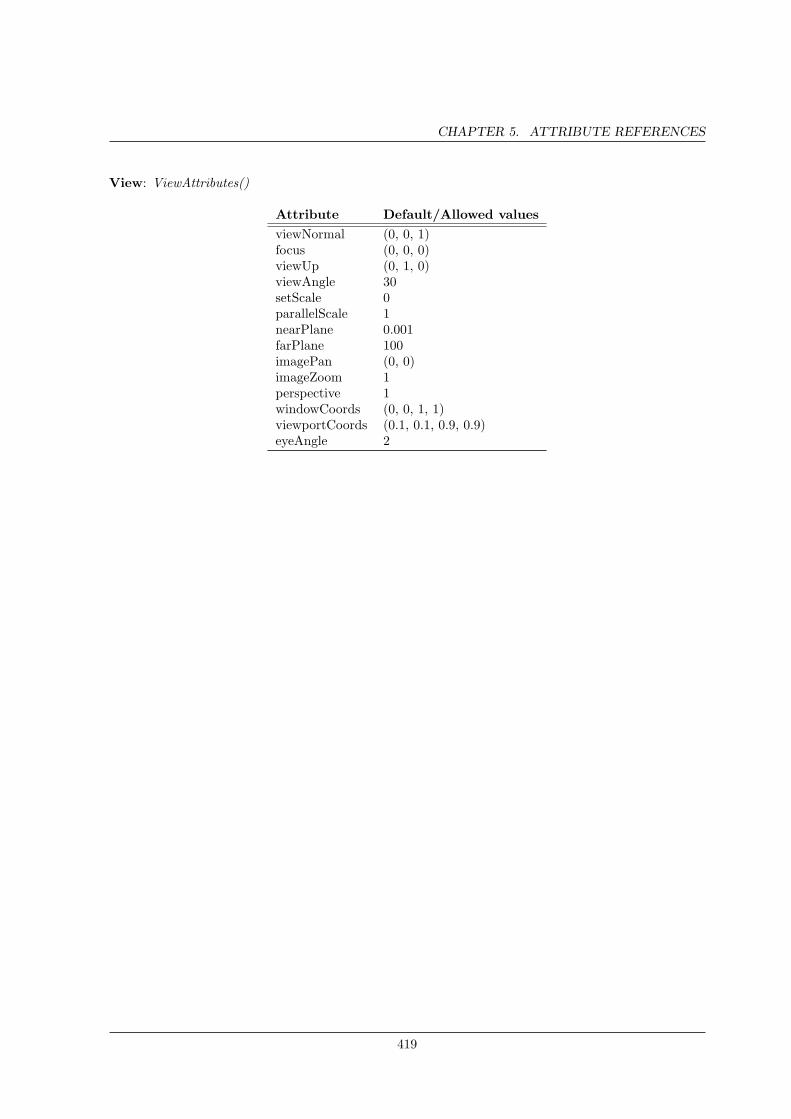
CHAPTER 5. ATTRIBUTE REFERENCES
View: ViewAttributes()
Attribute Default/Allowed valuesviewNormal (0, 0, 1)focus (0, 0, 0)viewUp (0, 1, 0)viewAngle 30setScale 0parallelScale 1nearPlane 0.001farPlane 100imagePan (0, 0)imageZoom 1perspective 1windowCoords (0, 0, 1, 1)viewportCoords (0.1, 0.1, 0.9, 0.9)eyeAngle 2
419
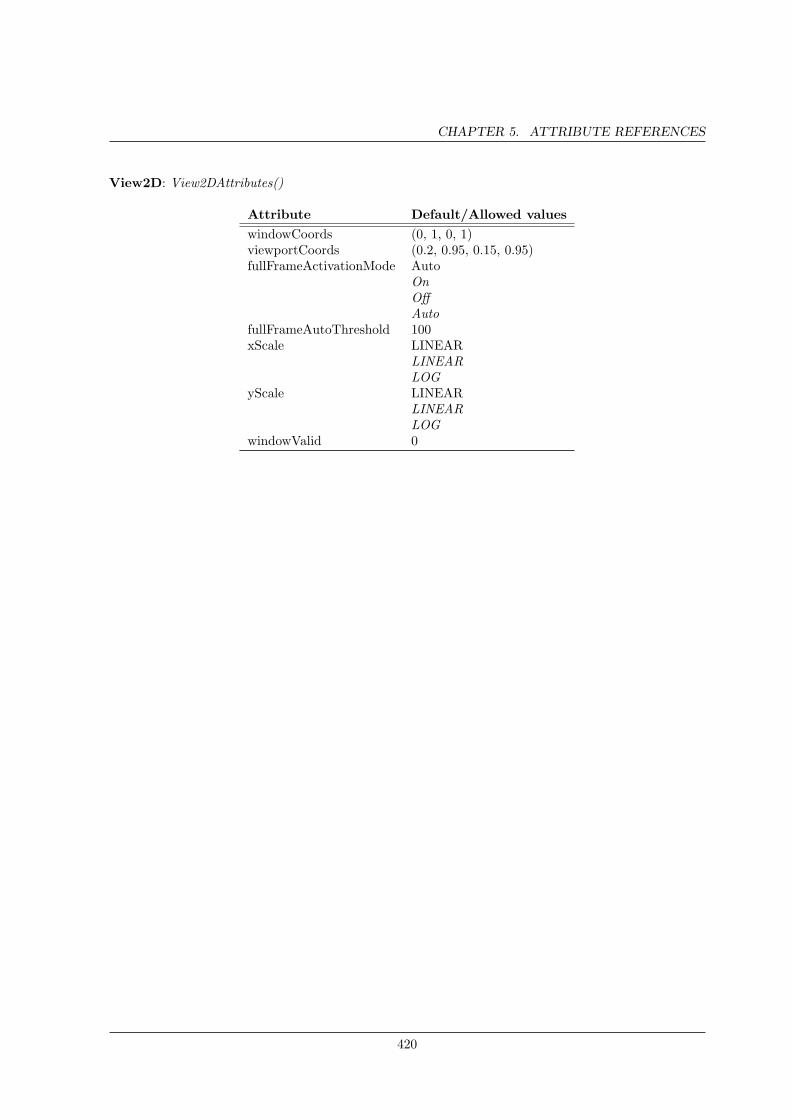
CHAPTER 5. ATTRIBUTE REFERENCES
View2D: View2DAttributes()
Attribute Default/Allowed valueswindowCoords (0, 1, 0, 1)viewportCoords (0.2, 0.95, 0.15, 0.95)fullFrameActivationMode Auto
OnOffAuto
fullFrameAutoThreshold 100xScale LINEAR
LINEARLOG
yScale LINEARLINEARLOG
windowValid 0
420

CHAPTER 5. ATTRIBUTE REFERENCES
View3D: View3DAttributes()
Attribute Default/Allowed valuesviewNormal (0, 0, 1)focus (0, 0, 0)viewUp (0, 1, 0)viewAngle 30parallelScale 0.5nearPlane −0.5farPlane 0.5imagePan (0, 0)imageZoom 1perspective 1eyeAngle 2centerOfRotationSet 0centerOfRotation (0, 0, 0)axis3DScaleFlag 0axis3DScales (1, 1, 1)shear (0, 0, 1)windowValid 0
421
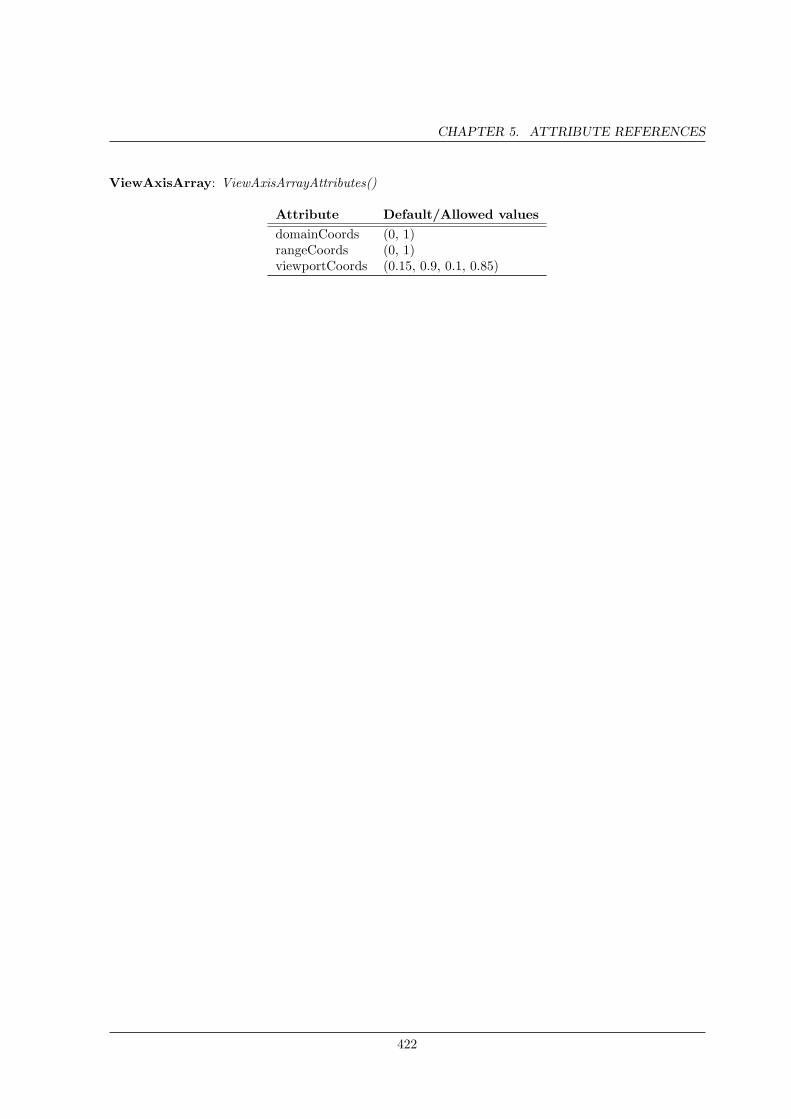
CHAPTER 5. ATTRIBUTE REFERENCES
ViewAxisArray: ViewAxisArrayAttributes()
Attribute Default/Allowed valuesdomainCoords (0, 1)rangeCoords (0, 1)viewportCoords (0.15, 0.9, 0.1, 0.85)
422
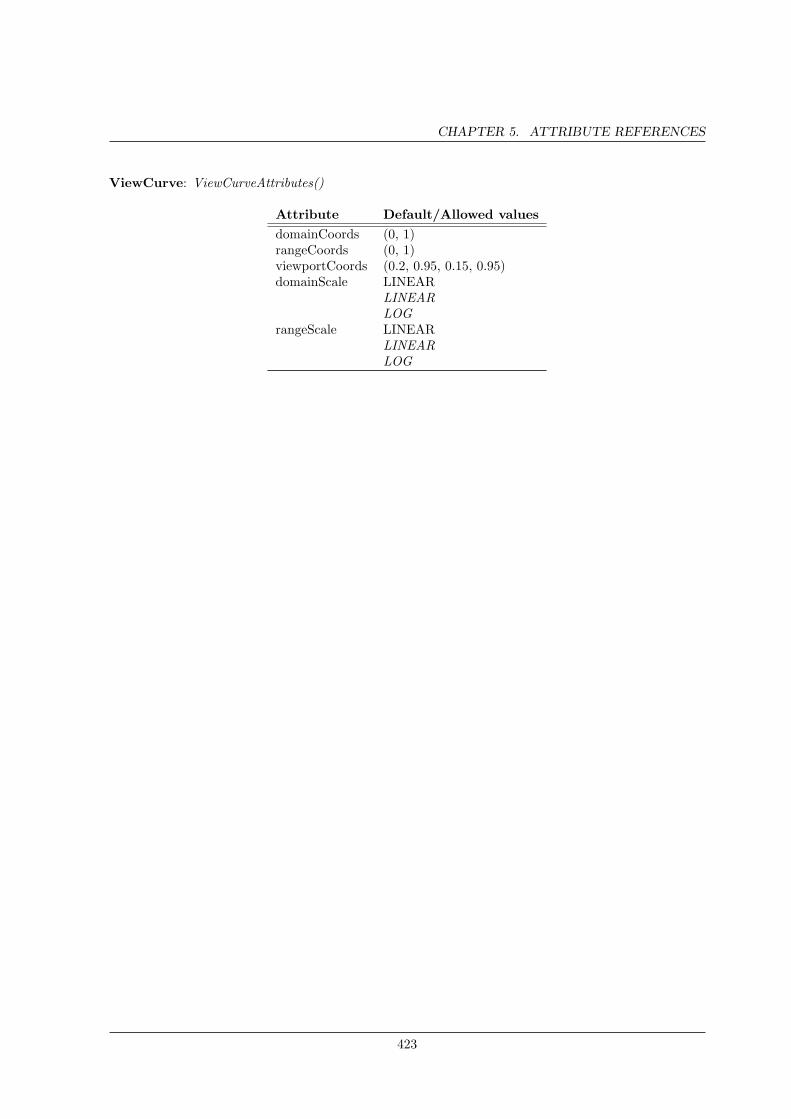
CHAPTER 5. ATTRIBUTE REFERENCES
ViewCurve: ViewCurveAttributes()
Attribute Default/Allowed valuesdomainCoords (0, 1)rangeCoords (0, 1)viewportCoords (0.2, 0.95, 0.15, 0.95)domainScale LINEAR
LINEARLOG
rangeScale LINEARLINEARLOG
423
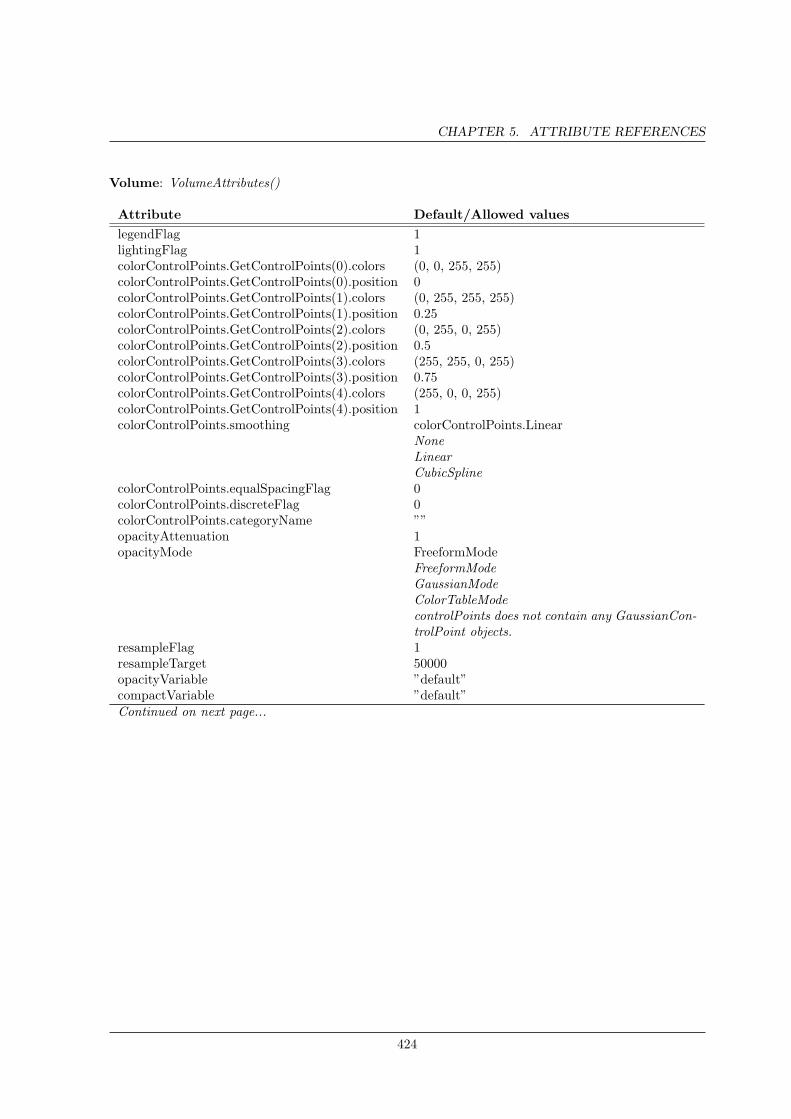
CHAPTER 5. ATTRIBUTE REFERENCES
Volume: VolumeAttributes()
Attribute Default/Allowed valueslegendFlag 1lightingFlag 1colorControlPoints.GetControlPoints(0).colors (0, 0, 255, 255)colorControlPoints.GetControlPoints(0).position 0colorControlPoints.GetControlPoints(1).colors (0, 255, 255, 255)colorControlPoints.GetControlPoints(1).position 0.25colorControlPoints.GetControlPoints(2).colors (0, 255, 0, 255)colorControlPoints.GetControlPoints(2).position 0.5colorControlPoints.GetControlPoints(3).colors (255, 255, 0, 255)colorControlPoints.GetControlPoints(3).position 0.75colorControlPoints.GetControlPoints(4).colors (255, 0, 0, 255)colorControlPoints.GetControlPoints(4).position 1colorControlPoints.smoothing colorControlPoints.Linear
NoneLinearCubicSpline
colorControlPoints.equalSpacingFlag 0colorControlPoints.discreteFlag 0colorControlPoints.categoryName ””opacityAttenuation 1opacityMode FreeformMode
FreeformModeGaussianModeColorTableModecontrolPoints does not contain any GaussianCon-trolPoint objects.
resampleFlag 1resampleTarget 50000opacityVariable ”default”compactVariable ”default”Continued on next page...
424
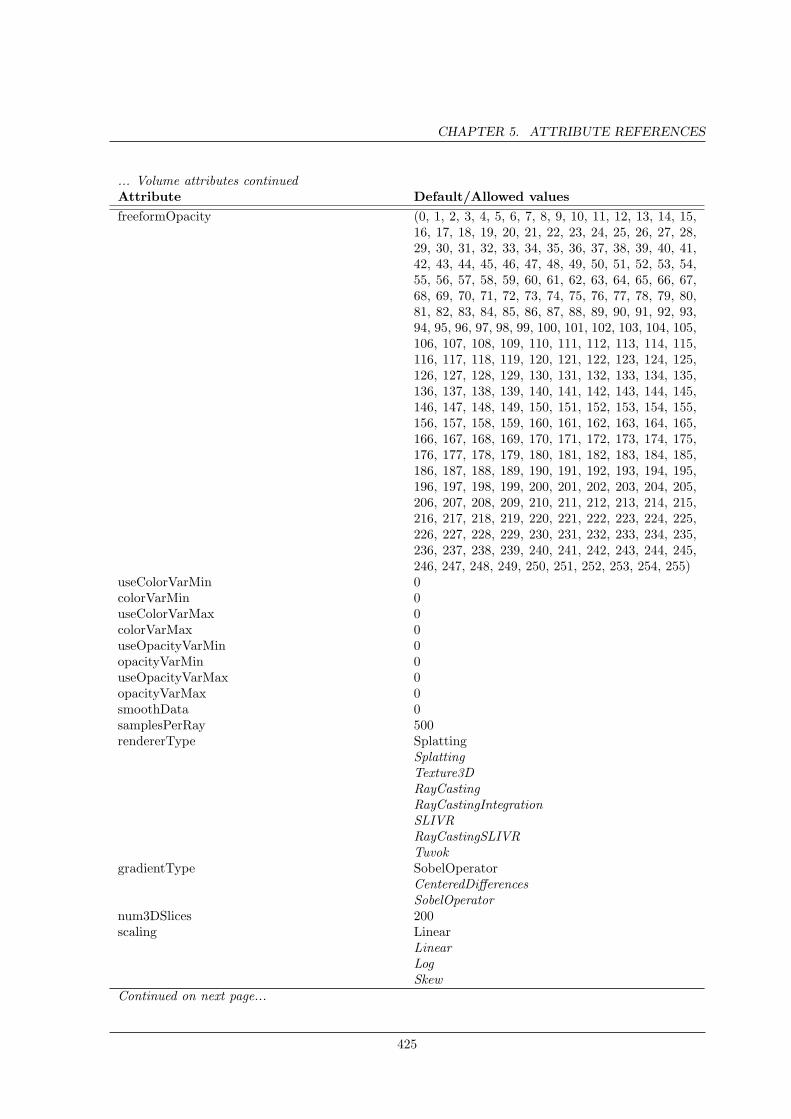
CHAPTER 5. ATTRIBUTE REFERENCES
... Volume attributes continuedAttribute Default/Allowed valuesfreeformOpacity (0, 1, 2, 3, 4, 5, 6, 7, 8, 9, 10, 11, 12, 13, 14, 15,
16, 17, 18, 19, 20, 21, 22, 23, 24, 25, 26, 27, 28,29, 30, 31, 32, 33, 34, 35, 36, 37, 38, 39, 40, 41,42, 43, 44, 45, 46, 47, 48, 49, 50, 51, 52, 53, 54,55, 56, 57, 58, 59, 60, 61, 62, 63, 64, 65, 66, 67,68, 69, 70, 71, 72, 73, 74, 75, 76, 77, 78, 79, 80,81, 82, 83, 84, 85, 86, 87, 88, 89, 90, 91, 92, 93,94, 95, 96, 97, 98, 99, 100, 101, 102, 103, 104, 105,106, 107, 108, 109, 110, 111, 112, 113, 114, 115,116, 117, 118, 119, 120, 121, 122, 123, 124, 125,126, 127, 128, 129, 130, 131, 132, 133, 134, 135,136, 137, 138, 139, 140, 141, 142, 143, 144, 145,146, 147, 148, 149, 150, 151, 152, 153, 154, 155,156, 157, 158, 159, 160, 161, 162, 163, 164, 165,166, 167, 168, 169, 170, 171, 172, 173, 174, 175,176, 177, 178, 179, 180, 181, 182, 183, 184, 185,186, 187, 188, 189, 190, 191, 192, 193, 194, 195,196, 197, 198, 199, 200, 201, 202, 203, 204, 205,206, 207, 208, 209, 210, 211, 212, 213, 214, 215,216, 217, 218, 219, 220, 221, 222, 223, 224, 225,226, 227, 228, 229, 230, 231, 232, 233, 234, 235,236, 237, 238, 239, 240, 241, 242, 243, 244, 245,246, 247, 248, 249, 250, 251, 252, 253, 254, 255)
useColorVarMin 0colorVarMin 0useColorVarMax 0colorVarMax 0useOpacityVarMin 0opacityVarMin 0useOpacityVarMax 0opacityVarMax 0smoothData 0samplesPerRay 500rendererType Splatting
SplattingTexture3DRayCastingRayCastingIntegrationSLIVRRayCastingSLIVRTuvok
gradientType SobelOperatorCenteredDifferencesSobelOperator
num3DSlices 200scaling Linear
LinearLogSkew
Continued on next page...
425
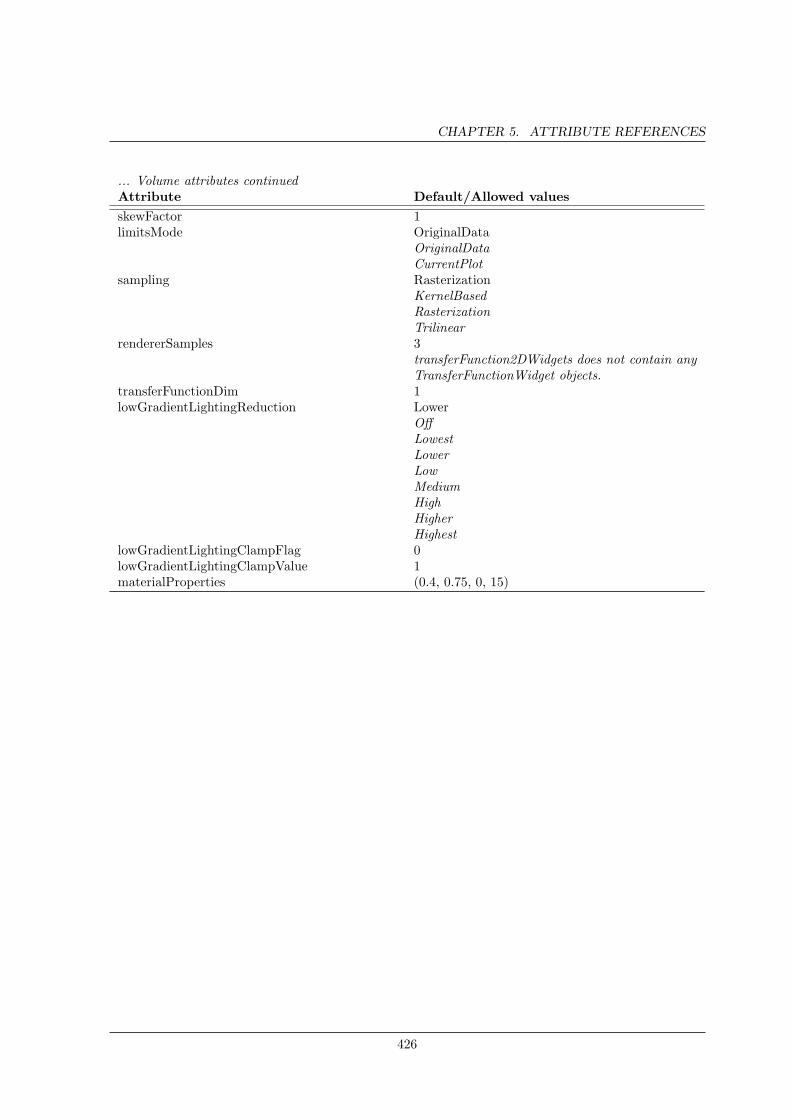
CHAPTER 5. ATTRIBUTE REFERENCES
... Volume attributes continuedAttribute Default/Allowed valuesskewFactor 1limitsMode OriginalData
OriginalDataCurrentPlot
sampling RasterizationKernelBasedRasterizationTrilinear
rendererSamples 3transferFunction2DWidgets does not contain anyTransferFunctionWidget objects.
transferFunctionDim 1lowGradientLightingReduction Lower
OffLowestLowerLowMediumHighHigherHighest
lowGradientLightingClampFlag 0lowGradientLightingClampValue 1materialProperties (0.4, 0.75, 0, 15)
426
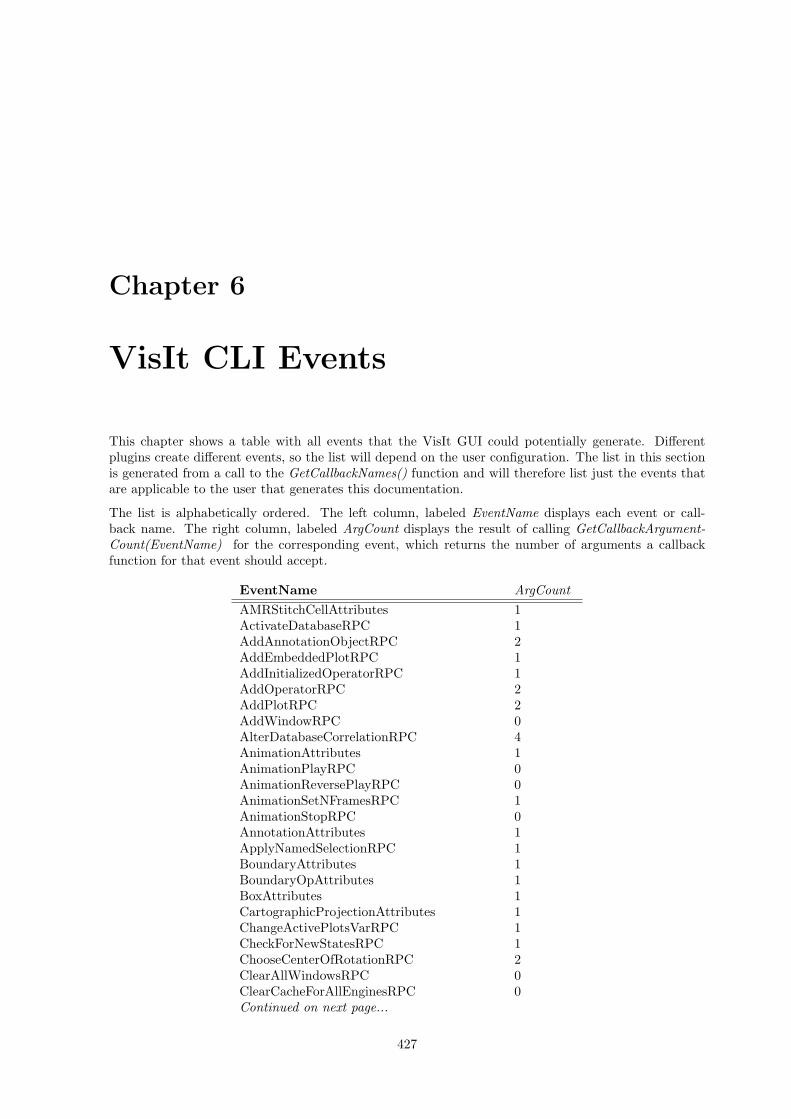
Chapter 6
VisIt CLI Events
This chapter shows a table with all events that the VisIt GUI could potentially generate. Differentplugins create different events, so the list will depend on the user configuration. The list in this sectionis generated from a call to the GetCallbackNames() function and will therefore list just the events thatare applicable to the user that generates this documentation.
The list is alphabetically ordered. The left column, labeled EventName displays each event or call-back name. The right column, labeled ArgCount displays the result of calling GetCallbackArgument-Count(EventName) for the corresponding event, which returns the number of arguments a callbackfunction for that event should accept.
EventName ArgCountAMRStitchCellAttributes 1ActivateDatabaseRPC 1AddAnnotationObjectRPC 2AddEmbeddedPlotRPC 1AddInitializedOperatorRPC 1AddOperatorRPC 2AddPlotRPC 2AddWindowRPC 0AlterDatabaseCorrelationRPC 4AnimationAttributes 1AnimationPlayRPC 0AnimationReversePlayRPC 0AnimationSetNFramesRPC 1AnimationStopRPC 0AnnotationAttributes 1ApplyNamedSelectionRPC 1BoundaryAttributes 1BoundaryOpAttributes 1BoxAttributes 1CartographicProjectionAttributes 1ChangeActivePlotsVarRPC 1CheckForNewStatesRPC 1ChooseCenterOfRotationRPC 2ClearAllWindowsRPC 0ClearCacheForAllEnginesRPC 0Continued on next page...
427
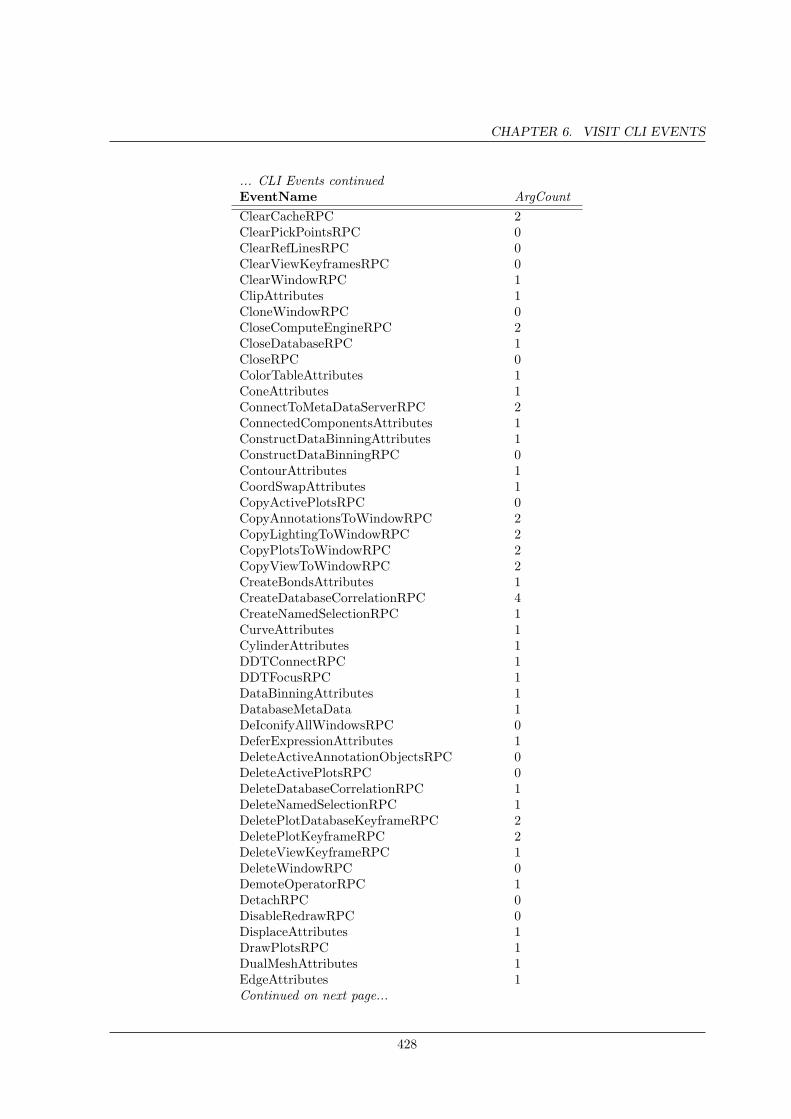
CHAPTER 6. VISIT CLI EVENTS
... CLI Events continuedEventName ArgCountClearCacheRPC 2ClearPickPointsRPC 0ClearRefLinesRPC 0ClearViewKeyframesRPC 0ClearWindowRPC 1ClipAttributes 1CloneWindowRPC 0CloseComputeEngineRPC 2CloseDatabaseRPC 1CloseRPC 0ColorTableAttributes 1ConeAttributes 1ConnectToMetaDataServerRPC 2ConnectedComponentsAttributes 1ConstructDataBinningAttributes 1ConstructDataBinningRPC 0ContourAttributes 1CoordSwapAttributes 1CopyActivePlotsRPC 0CopyAnnotationsToWindowRPC 2CopyLightingToWindowRPC 2CopyPlotsToWindowRPC 2CopyViewToWindowRPC 2CreateBondsAttributes 1CreateDatabaseCorrelationRPC 4CreateNamedSelectionRPC 1CurveAttributes 1CylinderAttributes 1DDTConnectRPC 1DDTFocusRPC 1DataBinningAttributes 1DatabaseMetaData 1DeIconifyAllWindowsRPC 0DeferExpressionAttributes 1DeleteActiveAnnotationObjectsRPC 0DeleteActivePlotsRPC 0DeleteDatabaseCorrelationRPC 1DeleteNamedSelectionRPC 1DeletePlotDatabaseKeyframeRPC 2DeletePlotKeyframeRPC 2DeleteViewKeyframeRPC 1DeleteWindowRPC 0DemoteOperatorRPC 1DetachRPC 0DisableRedrawRPC 0DisplaceAttributes 1DrawPlotsRPC 1DualMeshAttributes 1EdgeAttributes 1Continued on next page...
428
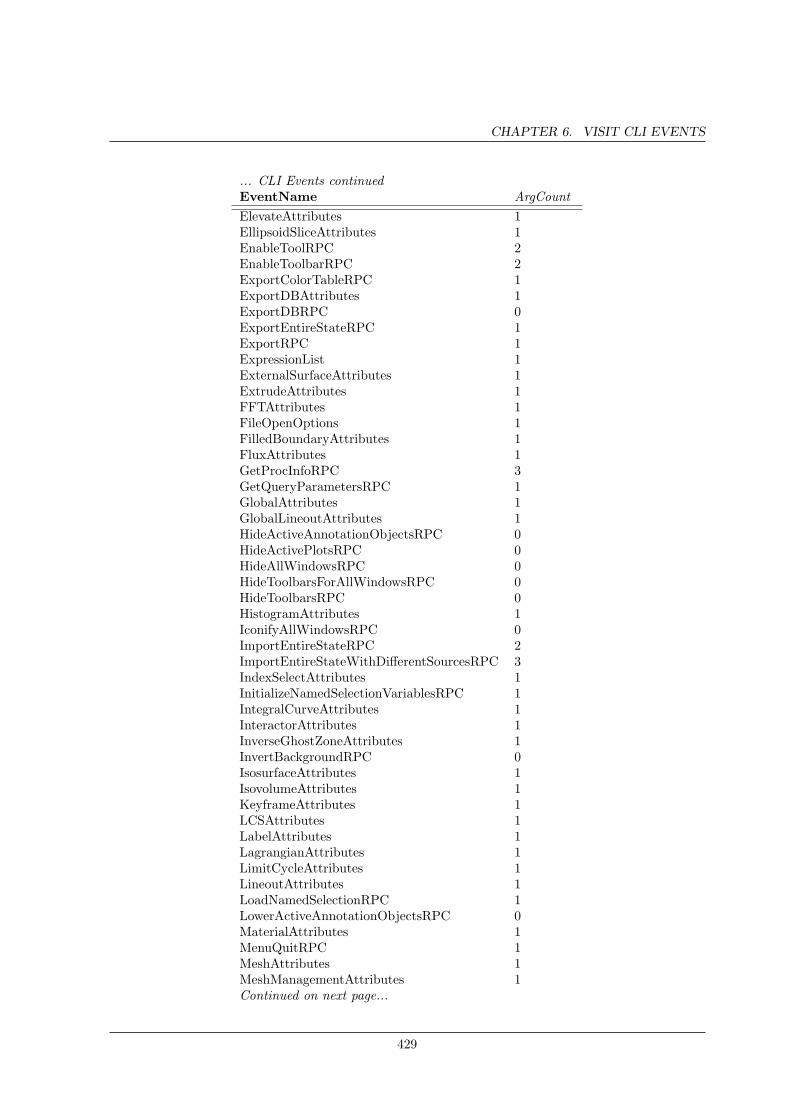
CHAPTER 6. VISIT CLI EVENTS
... CLI Events continuedEventName ArgCountElevateAttributes 1EllipsoidSliceAttributes 1EnableToolRPC 2EnableToolbarRPC 2ExportColorTableRPC 1ExportDBAttributes 1ExportDBRPC 0ExportEntireStateRPC 1ExportRPC 1ExpressionList 1ExternalSurfaceAttributes 1ExtrudeAttributes 1FFTAttributes 1FileOpenOptions 1FilledBoundaryAttributes 1FluxAttributes 1GetProcInfoRPC 3GetQueryParametersRPC 1GlobalAttributes 1GlobalLineoutAttributes 1HideActiveAnnotationObjectsRPC 0HideActivePlotsRPC 0HideAllWindowsRPC 0HideToolbarsForAllWindowsRPC 0HideToolbarsRPC 0HistogramAttributes 1IconifyAllWindowsRPC 0ImportEntireStateRPC 2ImportEntireStateWithDifferentSourcesRPC 3IndexSelectAttributes 1InitializeNamedSelectionVariablesRPC 1IntegralCurveAttributes 1InteractorAttributes 1InverseGhostZoneAttributes 1InvertBackgroundRPC 0IsosurfaceAttributes 1IsovolumeAttributes 1KeyframeAttributes 1LCSAttributes 1LabelAttributes 1LagrangianAttributes 1LimitCycleAttributes 1LineoutAttributes 1LoadNamedSelectionRPC 1LowerActiveAnnotationObjectsRPC 0MaterialAttributes 1MenuQuitRPC 1MeshAttributes 1MeshManagementAttributes 1Continued on next page...
429
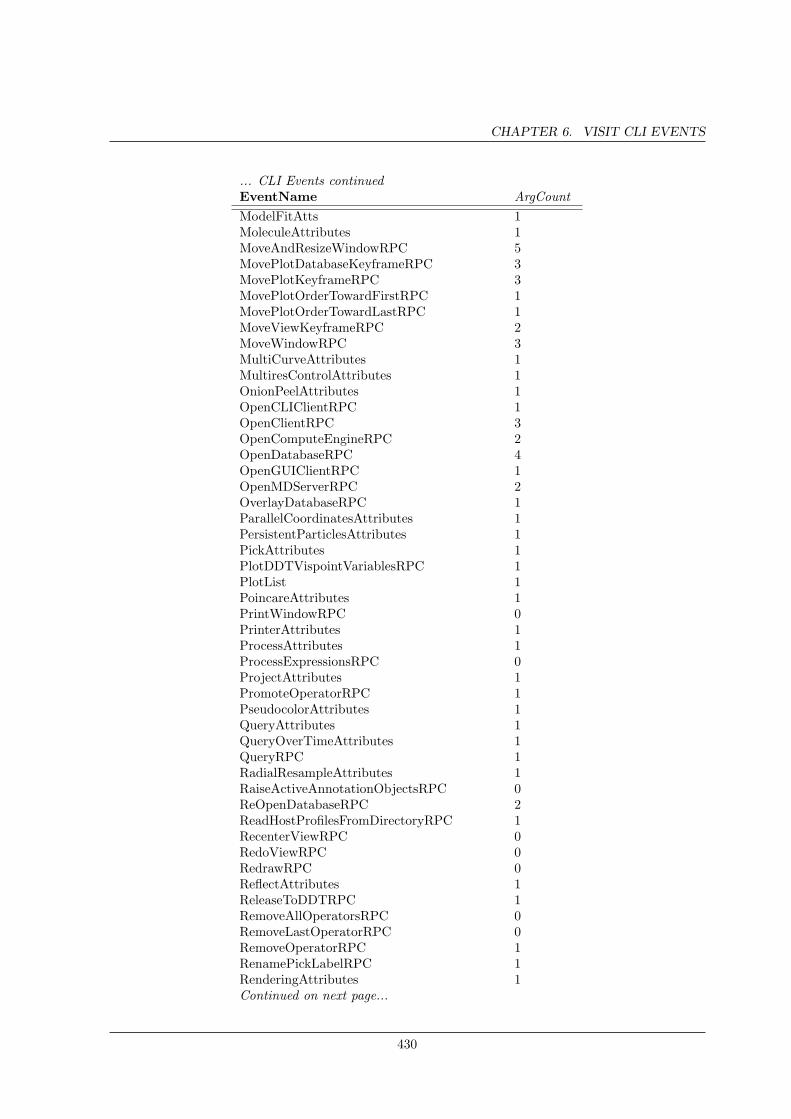
CHAPTER 6. VISIT CLI EVENTS
... CLI Events continuedEventName ArgCountModelFitAtts 1MoleculeAttributes 1MoveAndResizeWindowRPC 5MovePlotDatabaseKeyframeRPC 3MovePlotKeyframeRPC 3MovePlotOrderTowardFirstRPC 1MovePlotOrderTowardLastRPC 1MoveViewKeyframeRPC 2MoveWindowRPC 3MultiCurveAttributes 1MultiresControlAttributes 1OnionPeelAttributes 1OpenCLIClientRPC 1OpenClientRPC 3OpenComputeEngineRPC 2OpenDatabaseRPC 4OpenGUIClientRPC 1OpenMDServerRPC 2OverlayDatabaseRPC 1ParallelCoordinatesAttributes 1PersistentParticlesAttributes 1PickAttributes 1PlotDDTVispointVariablesRPC 1PlotList 1PoincareAttributes 1PrintWindowRPC 0PrinterAttributes 1ProcessAttributes 1ProcessExpressionsRPC 0ProjectAttributes 1PromoteOperatorRPC 1PseudocolorAttributes 1QueryAttributes 1QueryOverTimeAttributes 1QueryRPC 1RadialResampleAttributes 1RaiseActiveAnnotationObjectsRPC 0ReOpenDatabaseRPC 2ReadHostProfilesFromDirectoryRPC 1RecenterViewRPC 0RedoViewRPC 0RedrawRPC 0ReflectAttributes 1ReleaseToDDTRPC 1RemoveAllOperatorsRPC 0RemoveLastOperatorRPC 0RemoveOperatorRPC 1RenamePickLabelRPC 1RenderingAttributes 1Continued on next page...
430
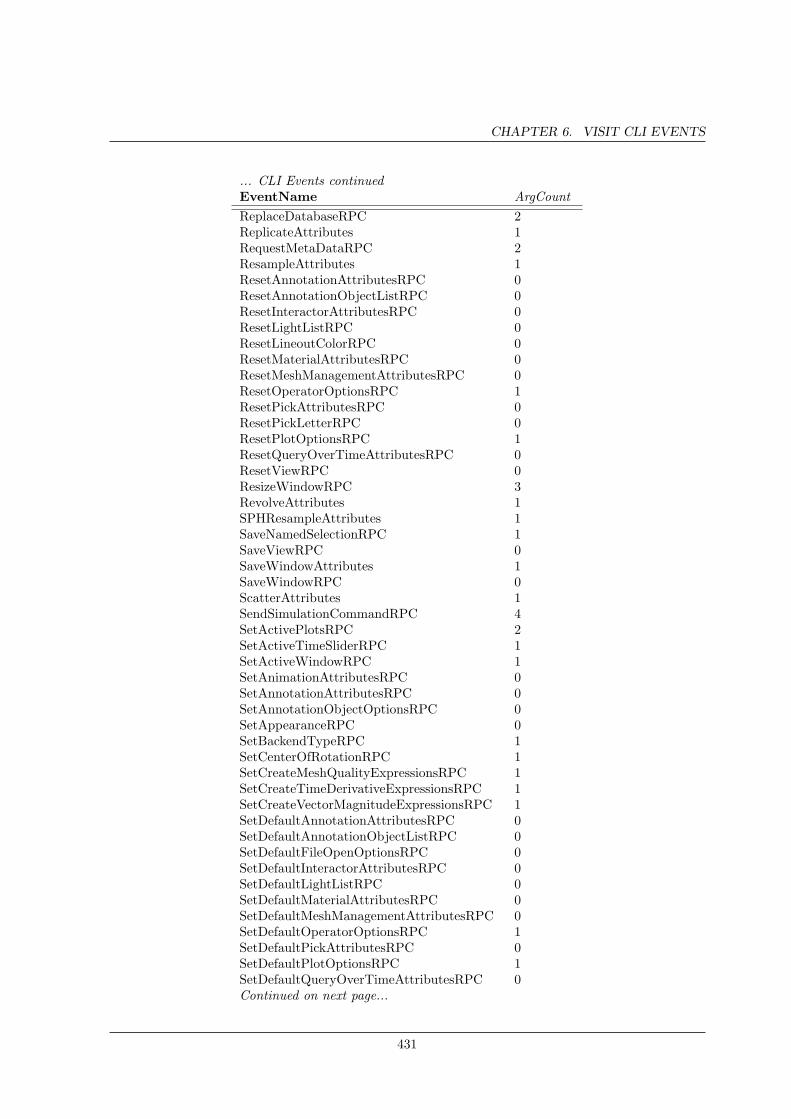
CHAPTER 6. VISIT CLI EVENTS
... CLI Events continuedEventName ArgCountReplaceDatabaseRPC 2ReplicateAttributes 1RequestMetaDataRPC 2ResampleAttributes 1ResetAnnotationAttributesRPC 0ResetAnnotationObjectListRPC 0ResetInteractorAttributesRPC 0ResetLightListRPC 0ResetLineoutColorRPC 0ResetMaterialAttributesRPC 0ResetMeshManagementAttributesRPC 0ResetOperatorOptionsRPC 1ResetPickAttributesRPC 0ResetPickLetterRPC 0ResetPlotOptionsRPC 1ResetQueryOverTimeAttributesRPC 0ResetViewRPC 0ResizeWindowRPC 3RevolveAttributes 1SPHResampleAttributes 1SaveNamedSelectionRPC 1SaveViewRPC 0SaveWindowAttributes 1SaveWindowRPC 0ScatterAttributes 1SendSimulationCommandRPC 4SetActivePlotsRPC 2SetActiveTimeSliderRPC 1SetActiveWindowRPC 1SetAnimationAttributesRPC 0SetAnnotationAttributesRPC 0SetAnnotationObjectOptionsRPC 0SetAppearanceRPC 0SetBackendTypeRPC 1SetCenterOfRotationRPC 1SetCreateMeshQualityExpressionsRPC 1SetCreateTimeDerivativeExpressionsRPC 1SetCreateVectorMagnitudeExpressionsRPC 1SetDefaultAnnotationAttributesRPC 0SetDefaultAnnotationObjectListRPC 0SetDefaultFileOpenOptionsRPC 0SetDefaultInteractorAttributesRPC 0SetDefaultLightListRPC 0SetDefaultMaterialAttributesRPC 0SetDefaultMeshManagementAttributesRPC 0SetDefaultOperatorOptionsRPC 1SetDefaultPickAttributesRPC 0SetDefaultPlotOptionsRPC 1SetDefaultQueryOverTimeAttributesRPC 0Continued on next page...
431
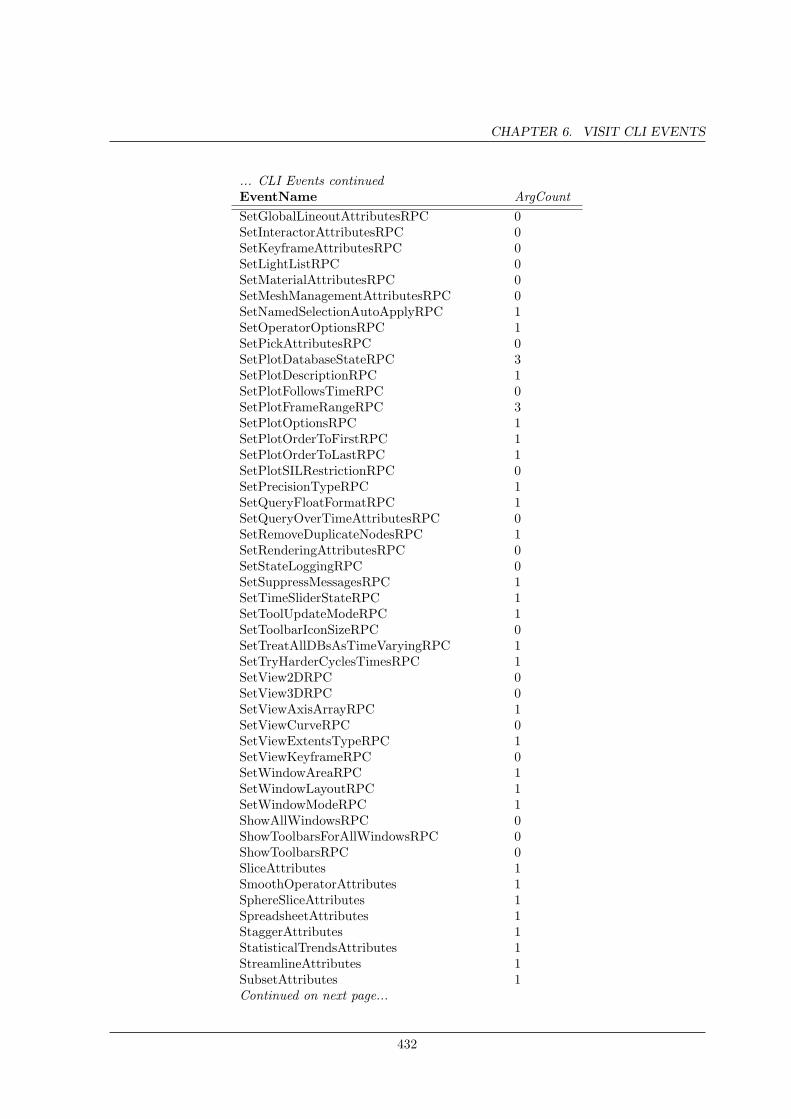
CHAPTER 6. VISIT CLI EVENTS
... CLI Events continuedEventName ArgCountSetGlobalLineoutAttributesRPC 0SetInteractorAttributesRPC 0SetKeyframeAttributesRPC 0SetLightListRPC 0SetMaterialAttributesRPC 0SetMeshManagementAttributesRPC 0SetNamedSelectionAutoApplyRPC 1SetOperatorOptionsRPC 1SetPickAttributesRPC 0SetPlotDatabaseStateRPC 3SetPlotDescriptionRPC 1SetPlotFollowsTimeRPC 0SetPlotFrameRangeRPC 3SetPlotOptionsRPC 1SetPlotOrderToFirstRPC 1SetPlotOrderToLastRPC 1SetPlotSILRestrictionRPC 0SetPrecisionTypeRPC 1SetQueryFloatFormatRPC 1SetQueryOverTimeAttributesRPC 0SetRemoveDuplicateNodesRPC 1SetRenderingAttributesRPC 0SetStateLoggingRPC 0SetSuppressMessagesRPC 1SetTimeSliderStateRPC 1SetToolUpdateModeRPC 1SetToolbarIconSizeRPC 0SetTreatAllDBsAsTimeVaryingRPC 1SetTryHarderCyclesTimesRPC 1SetView2DRPC 0SetView3DRPC 0SetViewAxisArrayRPC 1SetViewCurveRPC 0SetViewExtentsTypeRPC 1SetViewKeyframeRPC 0SetWindowAreaRPC 1SetWindowLayoutRPC 1SetWindowModeRPC 1ShowAllWindowsRPC 0ShowToolbarsForAllWindowsRPC 0ShowToolbarsRPC 0SliceAttributes 1SmoothOperatorAttributes 1SphereSliceAttributes 1SpreadsheetAttributes 1StaggerAttributes 1StatisticalTrendsAttributes 1StreamlineAttributes 1SubsetAttributes 1Continued on next page...
432
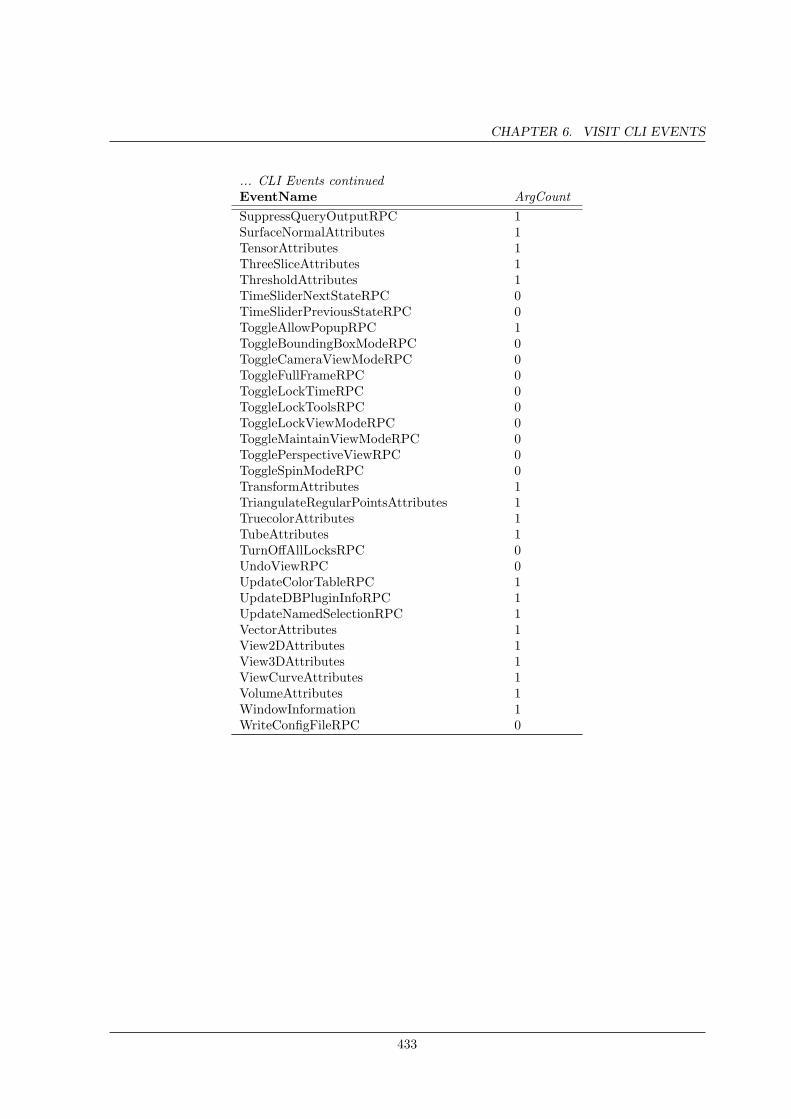
CHAPTER 6. VISIT CLI EVENTS
... CLI Events continuedEventName ArgCountSuppressQueryOutputRPC 1SurfaceNormalAttributes 1TensorAttributes 1ThreeSliceAttributes 1ThresholdAttributes 1TimeSliderNextStateRPC 0TimeSliderPreviousStateRPC 0ToggleAllowPopupRPC 1ToggleBoundingBoxModeRPC 0ToggleCameraViewModeRPC 0ToggleFullFrameRPC 0ToggleLockTimeRPC 0ToggleLockToolsRPC 0ToggleLockViewModeRPC 0ToggleMaintainViewModeRPC 0TogglePerspectiveViewRPC 0ToggleSpinModeRPC 0TransformAttributes 1TriangulateRegularPointsAttributes 1TruecolorAttributes 1TubeAttributes 1TurnOffAllLocksRPC 0UndoViewRPC 0UpdateColorTableRPC 1UpdateDBPluginInfoRPC 1UpdateNamedSelectionRPC 1VectorAttributes 1View2DAttributes 1View3DAttributes 1ViewCurveAttributes 1VolumeAttributes 1WindowInformation 1WriteConfigFileRPC 0
433
Chapter 7
Acknowledgments
This document is primarily based on the excellent manual put together by Brad Whitlock of LawrenceLivermore in 2005. Several years afterwards, the content from that manual was converted to serveas online help for the command line interpreter itself. As new routines were added, this online helpwas updated. In 2010, Jakob van Bethlehem of the University of Groningen wrote a wonderful scriptto convert the online help to manual form. In 2011, Hank Childs of Lawrence Berkeley merged thedescriptions from Brad Whitlock’s original manual with the function definitions produced by Jakob’sconversion of the online help. The result is this manual.
434