vis-health: exploratory analysis and visualization of dengue … · vis-health: exploratory...
TRANSCRIPT
Vis-Health: Exploratory Analysis and Visualization of Dengue Cases in Brazil.
Naira Kaieski, Luiz Paulo Luna de Oliveira and Marta Becker Villamil
Universidade do Vale do Rio dos Sinos [email protected], [email protected], [email protected]
Abstract This paper presents a tool, Vis-Health, for analysis
and visualization of public health data covariance with variables chosen by the user, in order to give her/him clues for a better understanding of disease occurrences. Vis-Health is a system that allows: (a) the government authorities store data of different nature and from different methods, (b) the user (common citizen or government) to choose an interest variable as dependent(output) and n other as dependent (or inputs), in order to study the covariance study between them and (c) visualize the result in a clear way. The covariance study is made by the use of Principal Component Analysis (PCA), resulting in a linear orthogonal regression. The method permits that many users, choosing different variables as dependent or independent, can use Vis-Health simultaneously, thanks to the optimized performance of the included algorithm based on PCA. Vis-Health is an open tool, and can help government to have more adequate actions, but any common citizen can use Vis-Health for making her/his particular exploration. As a illustration, a study of the numbers of cases of Dengue in Brazil is studied as a function of climatic variables.
1. Introduction
The use of information technology in health care has rapidly grown as a new paradigm for individual and collective medicine practices [6]. This comes together with the tendency of the cities to become smart cities. In a scenario where the demand for the medical assistance has been intensified factors as population growth, longevity increase, and with the rising of new pathologies and diseases associated to new virus and their mutations, the application of digital solutions usually makes medical processes more efficient, cheaper and more qualified [7].
In Brazil, several diseases are of compulsory notification and their associated data are collected periodically. The usage of the resulting amount of data can help the public health politics in a number of ways.
For example, detecting and monitoring time patterns can help on predicting or alerting for possible outbreaks of infectious diseases. Also, the study of fluctuation of each kind of disease and correlations between it and other factors can help to establish relations of cause and effect and even to make relevant predictions. These information from time series analysis may open the perspective of introducing preventive measures to prevent or to lessen diseases social consequences [9].
Brazilian government provides an important source of data on public health is called Sinan (Information System for Notifiable Diseases). This system provides information about the occurrence of several diseases. The data set is open to anyone to consult. Sinan is one of the government initiatives for a greater transparency in public administration, providing public health information to the public and encouraging social participation [10]. The proposed tool, Vis-Health, use data from Sinan. Considering that the objective is to demonstrate the methodology of analysis and data visualization used in Vis-Health, only records on dengue cases will be utilized in the demonstrations. The number of dengue cases will be the dependent variable. Dengue incidence, the output of our analysis, will be studied by Vis-Health in relation to some climatic factors, the inputs, since it is widely accepted that those factors are of most relevance. For each considered climactic factor, it will be considered the average of its time series for a chosen period of time. It will be done for a variety of important Brazilian cities. More specific justifications for these choices are given below.
Although historically the dengue cases have a higher concentration in southeast asian countries, Brazil have become one the countries with the highest number of cases in the world [11]. Figure 1 show the average number of dengue cases reported by the World Health Organization (WHO) in the most 30 endemic countries between the years 2004 to 2010. Based on these data, Brazil leads the negative ranking of dengue incidence. The choice of dengue to demonstrate the proposed methodology in the Vis-Health is even more
2016 49th Hawaii International Conference on System Sciences
1530-1605/16 $31.00 © 2016 IEEE
DOI 10.1109/HICSS.2016.385
3063
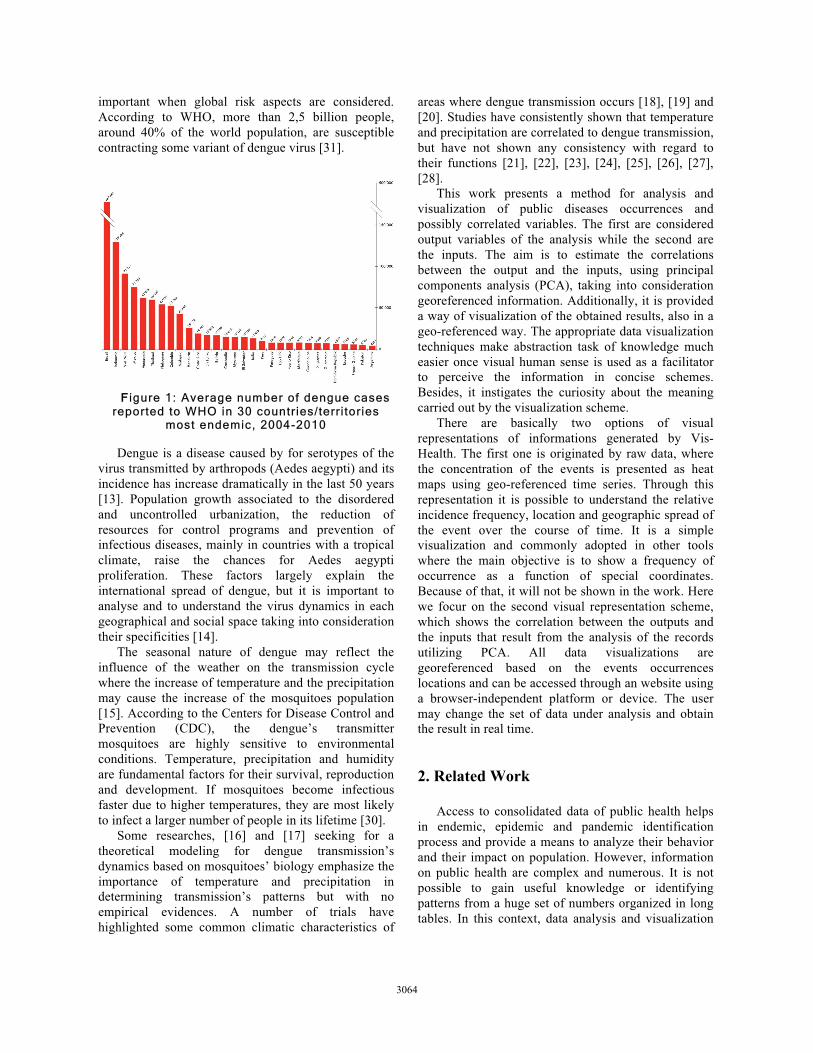
important when global risk aspects are considered. According to WHO, more than 2,5 billion people, around 40% of the world population, are susceptible contracting some variant of dengue virus [31].
FFigure 1: Average number of dengue cases
reported to WHO in 30 countries/terr i tories most endemic, 2004-2010
Dengue is a disease caused by for serotypes of the
virus transmitted by arthropods (Aedes aegypti) and its incidence has increase dramatically in the last 50 years [13]. Population growth associated to the disordered and uncontrolled urbanization, the reduction of resources for control programs and prevention of infectious diseases, mainly in countries with a tropical climate, raise the chances for Aedes aegypti proliferation. These factors largely explain the international spread of dengue, but it is important to analyse and to understand the virus dynamics in each geographical and social space taking into consideration their specificities [14].
The seasonal nature of dengue may reflect the influence of the weather on the transmission cycle where the increase of temperature and the precipitation may cause the increase of the mosquitoes population [15]. According to the Centers for Disease Control and Prevention (CDC), the dengue’s transmitter mosquitoes are highly sensitive to environmental conditions. Temperature, precipitation and humidity are fundamental factors for their survival, reproduction and development. If mosquitoes become infectious faster due to higher temperatures, they are most likely to infect a larger number of people in its lifetime [30].
Some researches, [16] and [17] seeking for a theoretical modeling for dengue transmission’s dynamics based on mosquitoes’ biology emphasize the importance of temperature and precipitation in determining transmission’s patterns but with no empirical evidences. A number of trials have highlighted some common climatic characteristics of
areas where dengue transmission occurs [18], [19] and [20]. Studies have consistently shown that temperature and precipitation are correlated to dengue transmission, but have not shown any consistency with regard to their functions [21], [22], [23], [24], [25], [26], [27], [28].
This work presents a method for analysis and visualization of public diseases occurrences and possibly correlated variables. The first are considered output variables of the analysis while the second are the inputs. The aim is to estimate the correlations between the output and the inputs, using principal components analysis (PCA), taking into consideration georeferenced information. Additionally, it is provided a way of visualization of the obtained results, also in a geo-referenced way. The appropriate data visualization techniques make abstraction task of knowledge much easier once visual human sense is used as a facilitator to perceive the information in concise schemes. Besides, it instigates the curiosity about the meaning carried out by the visualization scheme.
There are basically two options of visual representations of informations generated by Vis-Health. The first one is originated by raw data, where the concentration of the events is presented as heat maps using geo-referenced time series. Through this representation it is possible to understand the relative incidence frequency, location and geographic spread of the event over the course of time. It is a simple visualization and commonly adopted in other tools where the main objective is to show a frequency of occurrence as a function of special coordinates. Because of that, it will not be shown in the work. Here we focur on the second visual representation scheme, which shows the correlation between the outputs and the inputs that result from the analysis of the records utilizing PCA. All data visualizations are georeferenced based on the events occurrences locations and can be accessed through an website using a browser-independent platform or device. The user may change the set of data under analysis and obtain the result in real time.
2. Related Work
Access to consolidated data of public health helps in endemic, epidemic and pandemic identification process and provide a means to analyze their behavior and their impact on population. However, information on public health are complex and numerous. It is not possible to gain useful knowledge or identifying patterns from a huge set of numbers organized in long tables. In this context, data analysis and visualization
3064
techniques are mandatory, otherwise a huge amount of data is, in large part, useless.
The app HealthMap shows over a geographic map, disease warning markers where the concentration of the number of occurrences of each disease is represented by a different color on each marker. The information used in this system are from different data sources, including aggregators of online news, eyewitness reports, experts and official reports. The system is updated continuously through an automated process to disseminate online information about emerging diseases, facilitating early detection of global public health threats [2].
The website "Flu Near You" [2], presents statistics on the flu’s occurrence in the United States and Canada similarly to HealthMap. In this system the user can visualize the evolution of the flu cases through an animation with the passage of time per week with the concentration of marked records in every state.
The website BioCaster [1], also uses markers in a world geographical map, of events, whether they are earthquakes, typhoons, nuclear events, chemical or biological events that affect humans, animals or plants. BioCaster does not contemplate just events related to health, but presents a global coverage and enables the visualization of events in time series with animation according to the passage of time.
Google developed an experimental tool called Google Trends, which allows the investigation of diseases’ activity, as flu and dengue, based on the search terms utilized by the users of specific regions. The data is displayed on a geographic map with the delimitation of the countries. Flu activity is classified into 5 levels, where a different color is assigned to each level, when the system user clicks on one country, a new screen is presented with specifics data to this region and graphics indicating the estimated flu’s activity in each month in the country is selected [3].
In no one of the above works, data analysis involving input variables are available. And as far as we are aware, there is no work in the literature with this one characteristic of Vis-Health.
3. Principal component analysis
The principal components analysis (PCA) is one of the older statistical techniques and known for multivariate data analysis. The PCA’s main ideia is to reduce the dimensionality of the data set analyzed in which there is a large number of correlated variables while maintaining the maximum of variation of the original data [5]. This reduction in the size of data is obtained by the transformation into a new set of variables, principal components (PCs), which are equal
in number to the original variables, however, are not correlated and result from the linear combination of the original variables. These new variables are ordered such that the first retain much of this variation in all of the original variables. So, by using major components, a large number of complex data can be represented by a relatively small number of new variables. This simplification together with data visualization techniques, may assess visually similarities and differences between the data and determine whether there may be a grouping of information [8].
Considering a set of data involving variables V, that is, the assembly is V comprises time series. This set will also have V main components, which are linear combinations of the original variables. Where linear combinations are given by algebraic manipulations of the matrix of covariance V variables. The method by PC’s analysis finds the same number of several new (major components), however, only some of those usually explain the biggest part of the process variability. Then, it is possible to reduce the number of analysis variables, without significant loss of informations [4]. Given a set of data with V variables and N observations, for analysis purposes, you can arrange them in the following matrix:
where the subscript indicates the variable and the superscript indicates the observation. So we have in the columns of the matrix the analysis of variables and in the lines the observations. In general, we consider the analysis of variables as �-dimensional column vectors, in other words:
��
� ���
���
�� �
�
��� ��� ��
�
���
�� �
�
��� � �� � ���
����
� �����
where apostrophes indicate transposition of
matrices/vectors. The method of obtaining the principal components,
considering this process � variables, consists in finding the W covariance matrix given by:
(2) (3) (4) (5)
(1)
3065
where, as usual, ��� is the variable variance � and
��� is the covariance between the variables � and �. Note that ��� and ���, are, essentially, inner products between the analysis of variables. In fact, considering that the analysis variables are centralized, that is, each observation of each variable was decreased from its average, we can define ��� and ��� as:
������� ����
� � �����
����� ����
� � �
where ����� represents the usual inner product. The
analysis by PCs is based on linear algebra, in fact, note that � is a symmetric matrix, then diagonalizable. More precisely, there is an orthonormal matrix � such that:
���� � ��
where �� denotes the transpose of the matrix �, and � is a diagonal matrix whose elements the main diagonal are the eigenvalues �� � �� � � �� of �. Further the columns ���� ��� � �� of � are the respective normalized eigenvectors (with norm 1) of � respectively associated those eigenvalues, in that order. These eigenvectors are mutually orthogonal between each other. This way the matrices �� and � are matrices of basis change between the old variables (originals) in not necessarily orthogonal directions, and the new variables, orthogonal to each other. More information about PCA can be found in [4].
3.1. Calculating dependencies between the considered variable
Once found the main components, ���� ��� � ��, we take the last (�-esima) to compose the equation of the hyperplane of ��� that best approximates the � points �-dimensionals data by the � lines. In fact, �� is orthogonal to that plane. So, the searched plane is that one of the points x=���� ���� � ��� � ��� such that
����� � ��������
where �� is the average of those � points.
Denoting �= ��, this equation can be placed in the form
��
�
���
�� � ��
where �= �� ��� and �� � � = ����� ���variables. If we want to explain the correlation, �, of a
variable � as a function of one of the � remaining variables we write
�� � �
��������
�
������
where � = ����� ���variables. The smallest eigenvalue, that is ���of matrix �, has
a considerable relevance for the correlation analysis between the variables. This eigenvalue represents the informations that could not be explained by the correlation between the � variables. To measure the not explained information we can utilize the formulation
���=
��
���
���
������������� � ������������������� ������������
�������������������� ��� �������������� �����
�������� � ���������� ����� ��������������
� � ���������������� ��� ������������� �����
���� ����������� ������
�
4. Vis-Health
One of the objectives of the work is to propose a methodology of analysis and representation of the relationship of dependency between the variables selected for analysis, with the purpose of explain the occurrence of a particular event in the funcion of these.
Vis-Health contemplates the development of an analysis methodology and consolidated data visualization of public health. Where a health event, such as dengue incidence is analyzed against variables possibly correlated as climate. The objective of the analysis is identify and study the relationship of dependence between the variables in order to seek explanations about the event focus of the study.
It is also contemplated by the system the implementation of visualization techniques of health records organized in time series as the concentration of incidence of dengue in a region. All data presented by Vis-Health are georeferenced and displayed on a map. The system user must set the period of data to be analyzed, select an analysis variable (corresponding to
(7)
(10)
(11)
(8)
(9)
(12)
(6)
3066
the event being investigated) and the other dependent variables.
The processing of the relationship of dependency between the variables is calculated in real time developed in a web environment with open source solutions. So the system user can change the analysis of variables by judging necessary to facilitate an understanding of the information and a visualization of the new results in a few moments. The presentation of the relationship of dependence of an event in relation to the analysis variables is expressed through pizza graphics which are presented on the map, one for each state or region of interest.
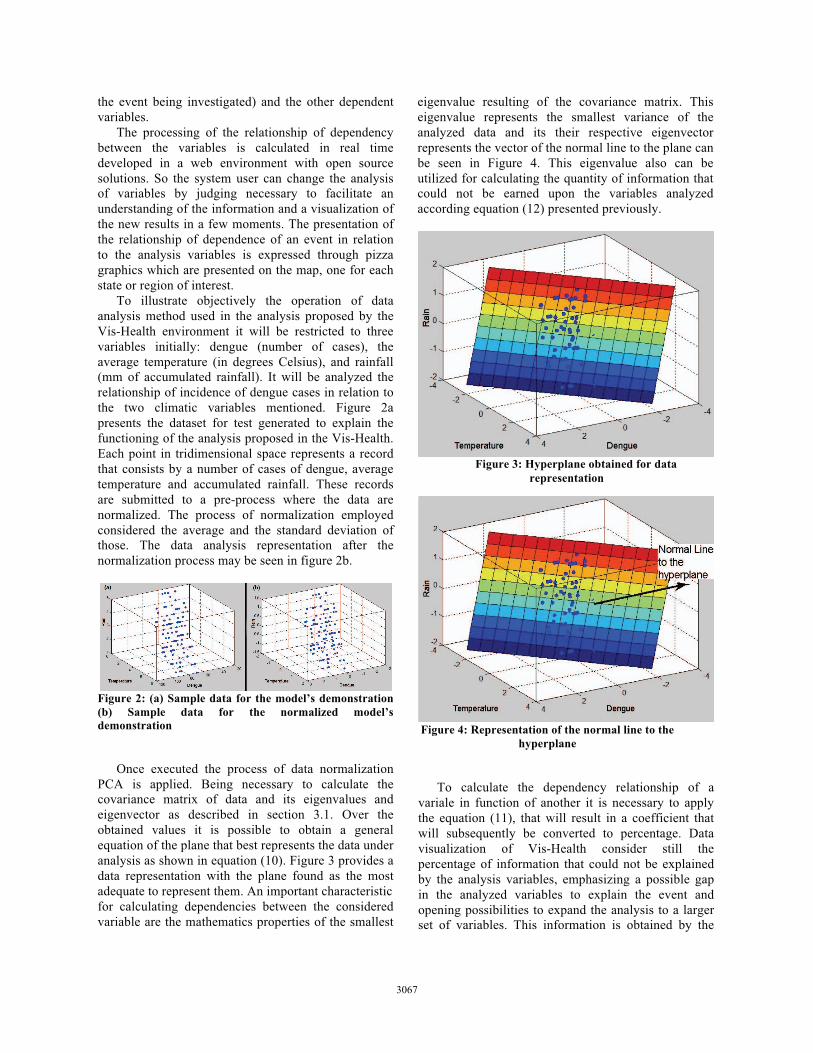
To illustrate objectively the operation of data analysis method used in the analysis proposed by the Vis-Health environment it will be restricted to three variables initially: dengue (number of cases), the average temperature (in degrees Celsius), and rainfall (mm of accumulated rainfall). It will be analyzed the relationship of incidence of dengue cases in relation to the two climatic variables mentioned. Figure 2a presents the dataset for test generated to explain the functioning of the analysis proposed in the Vis-Health. Each point in tridimensional space represents a record that consists by a number of cases of dengue, average temperature and accumulated rainfall. These records are submitted to a pre-process where the data are normalized. The process of normalization employed considered the average and the standard deviation of those. The data analysis representation after the normalization process may be seen in figure 2b.
Figure 2: (a) Sample data for the model’s demonstration (b) Sample data for the normalized model’s demonstration
Once executed the process of data normalization
PCA is applied. Being necessary to calculate the covariance matrix of data and its eigenvalues and eigenvector as described in section 3.1. Over the obtained values it is possible to obtain a general equation of the plane that best represents the data under analysis as shown in equation (10). Figure 3 provides a data representation with the plane found as the most adequate to represent them. An important characteristic for calculating dependencies between the considered variable are the mathematics properties of the smallest
eigenvalue resulting of the covariance matrix. This eigenvalue represents the smallest variance of the analyzed data and its their respective eigenvector represents the vector of the normal line to the plane can be seen in Figure 4. This eigenvalue also can be utilized for calculating the quantity of information that could not be earned upon the variables analyzed according equation (12) presented previously.
Figure 3: Hyperplane obtained for data
representation
Figure 4: Representation of the normal line to the
hyperplane
To calculate the dependency relationship of a
variale in function of another it is necessary to apply the equation (11), that will result in a coefficient that will subsequently be converted to percentage. Data visualization of Vis-Health consider still the percentage of information that could not be explained by the analysis variables, emphasizing a possible gap in the analyzed variables to explain the event and opening possibilities to expand the analysis to a larger set of variables. This information is obtained by the
3067
calculate of representation of the smallest eigenvalue founded in the calculation of PCA compared to the other eigenvalues according equation (12).
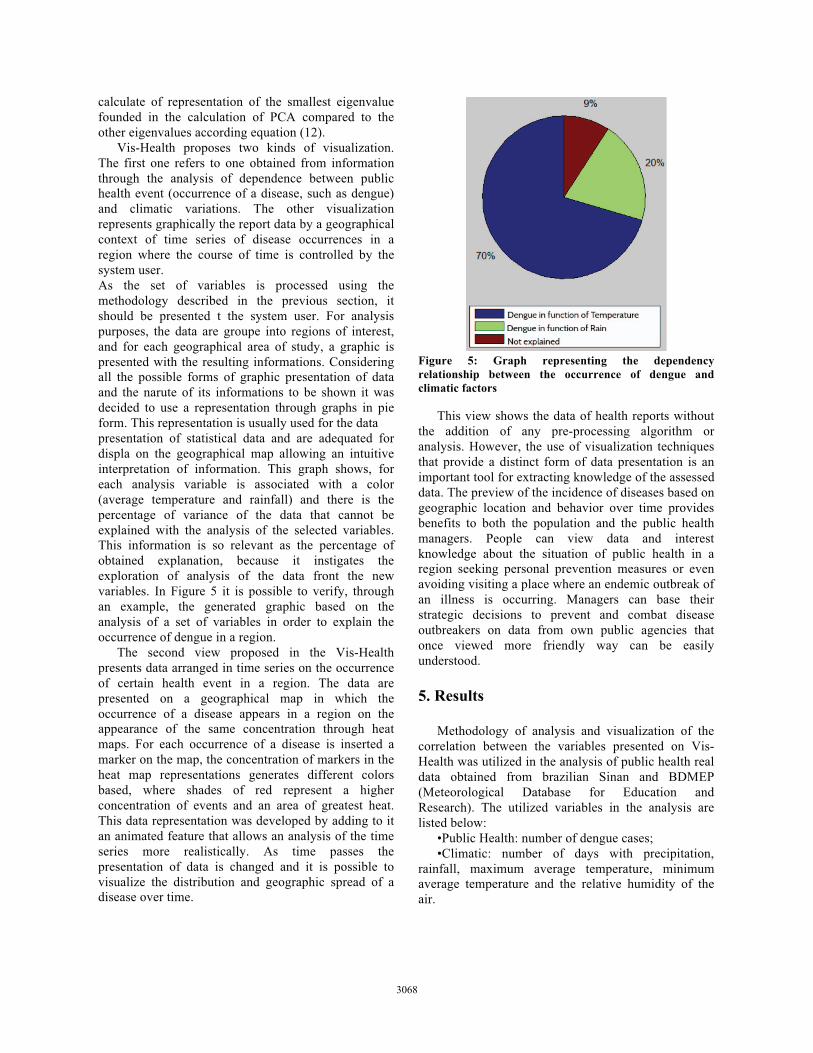
Vis-Health proposes two kinds of visualization. The first one refers to one obtained from information through the analysis of dependence between public health event (occurrence of a disease, such as dengue) and climatic variations. The other visualization represents graphically the report data by a geographical context of time series of disease occurrences in a region where the course of time is controlled by the system user. As the set of variables is processed using the methodology described in the previous section, it should be presented t the system user. For analysis purposes, the data are groupe into regions of interest, and for each geographical area of study, a graphic is presented with the resulting informations. Considering all the possible forms of graphic presentation of data and the narute of its informations to be shown it was decided to use a representation through graphs in pie form. This representation is usually used for the data presentation of statistical data and are adequated for displa on the geographical map allowing an intuitive interpretation of information. This graph shows, for each analysis variable is associated with a color (average temperature and rainfall) and there is the percentage of variance of the data that cannot be explained with the analysis of the selected variables. This information is so relevant as the percentage of obtained explanation, because it instigates the exploration of analysis of the data front the new variables. In Figure 5 it is possible to verify, through an example, the generated graphic based on the analysis of a set of variables in order to explain the occurrence of dengue in a region.
The second view proposed in the Vis-Health presents data arranged in time series on the occurrence of certain health event in a region. The data are presented on a geographical map in which the occurrence of a disease appears in a region on the appearance of the same concentration through heat maps. For each occurrence of a disease is inserted a marker on the map, the concentration of markers in the heat map representations generates different colors based, where shades of red represent a higher concentration of events and an area of greatest heat. This data representation was developed by adding to it an animated feature that allows an analysis of the time series more realistically. As time passes the presentation of data is changed and it is possible to visualize the distribution and geographic spread of a disease over time.
Figure 5: Graph representing the dependency relationship between the occurrence of dengue and climatic factors
This view shows the data of health reports without the addition of any pre-processing algorithm or analysis. However, the use of visualization techniques that provide a distinct form of data presentation is an important tool for extracting knowledge of the assessed data. The preview of the incidence of diseases based on geographic location and behavior over time provides benefits to both the population and the public health managers. People can view data and interest knowledge about the situation of public health in a region seeking personal prevention measures or even avoiding visiting a place where an endemic outbreak of an illness is occurring. Managers can base their strategic decisions to prevent and combat disease outbreakers on data from own public agencies that once viewed more friendly way can be easily understood. 5. Results
Methodology of analysis and visualization of the correlation between the variables presented on Vis-Health was utilized in the analysis of public health real data obtained from brazilian Sinan and BDMEP (Meteorological Database for Education and Research). The utilized variables in the analysis are listed below:
•Public Health: number of dengue cases; •Climatic: number of days with precipitation,
rainfall, maximum average temperature, minimum average temperature and the relative humidity of the air.
3068
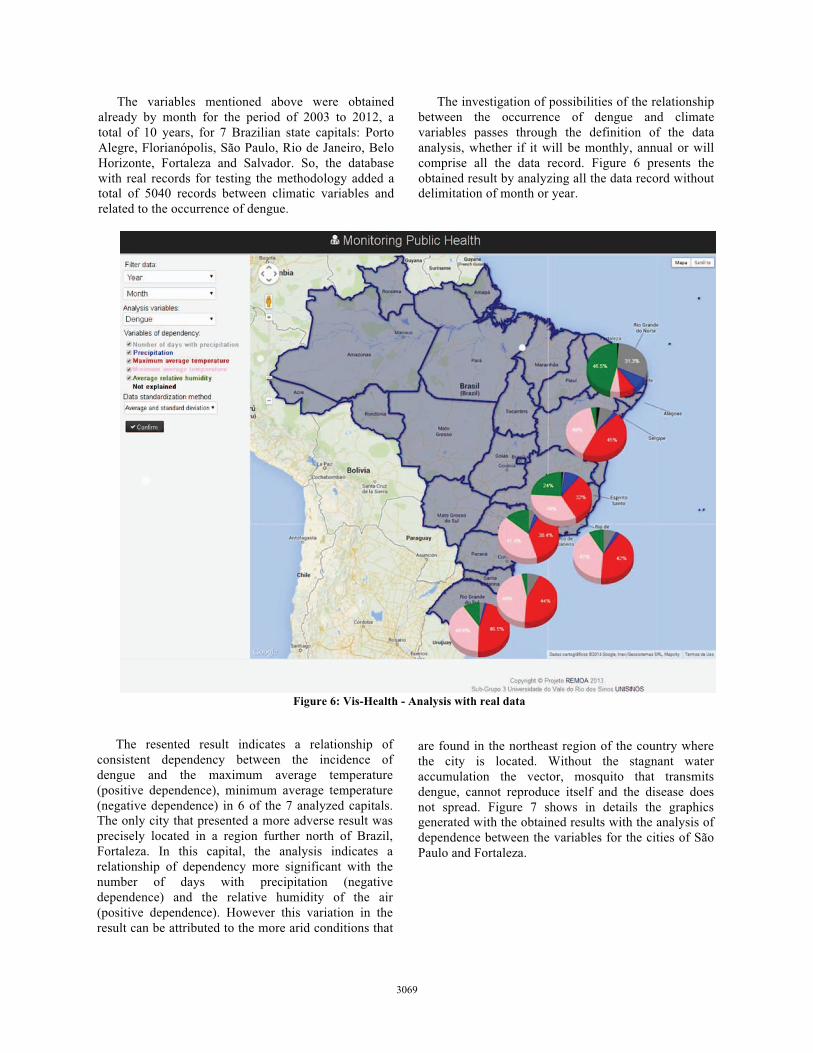
The variables mentioned above were obtained already by month for the period of 2003 to 2012, a total of 10 years, for 7 Brazilian state capitals: Porto Alegre, Florianópolis, São Paulo, Rio de Janeiro, Belo Horizonte, Fortaleza and Salvador. So, the database with real records for testing the methodology added a total of 5040 records between climatic variables and related to the occurrence of dengue.
The investigation of possibilities of the relationship between the occurrence of dengue and climate variables passes through the definition of the data analysis, whether if it will be monthly, annual or will comprise all the data record. Figure 6 presents the obtained result by analyzing all the data record without delimitation of month or year.
Figure 6: Vis-Health - Analysis with real data
The resented result indicates a relationship of consistent dependency between the incidence of dengue and the maximum average temperature (positive dependence), minimum average temperature (negative dependence) in 6 of the 7 analyzed capitals. The only city that presented a more adverse result was precisely located in a region further north of Brazil, Fortaleza. In this capital, the analysis indicates a relationship of dependency more significant with the number of days with precipitation (negative dependence) and the relative humidity of the air (positive dependence). However this variation in the result can be attributed to the more arid conditions that
are found in the northeast region of the country where the city is located. Without the stagnant water accumulation the vector, mosquito that transmits dengue, cannot reproduce itself and the disease does not spread. Figure 7 shows in details the graphics generated with the obtained results with the analysis of dependence between the variables for the cities of São Paulo and Fortaleza.
3069
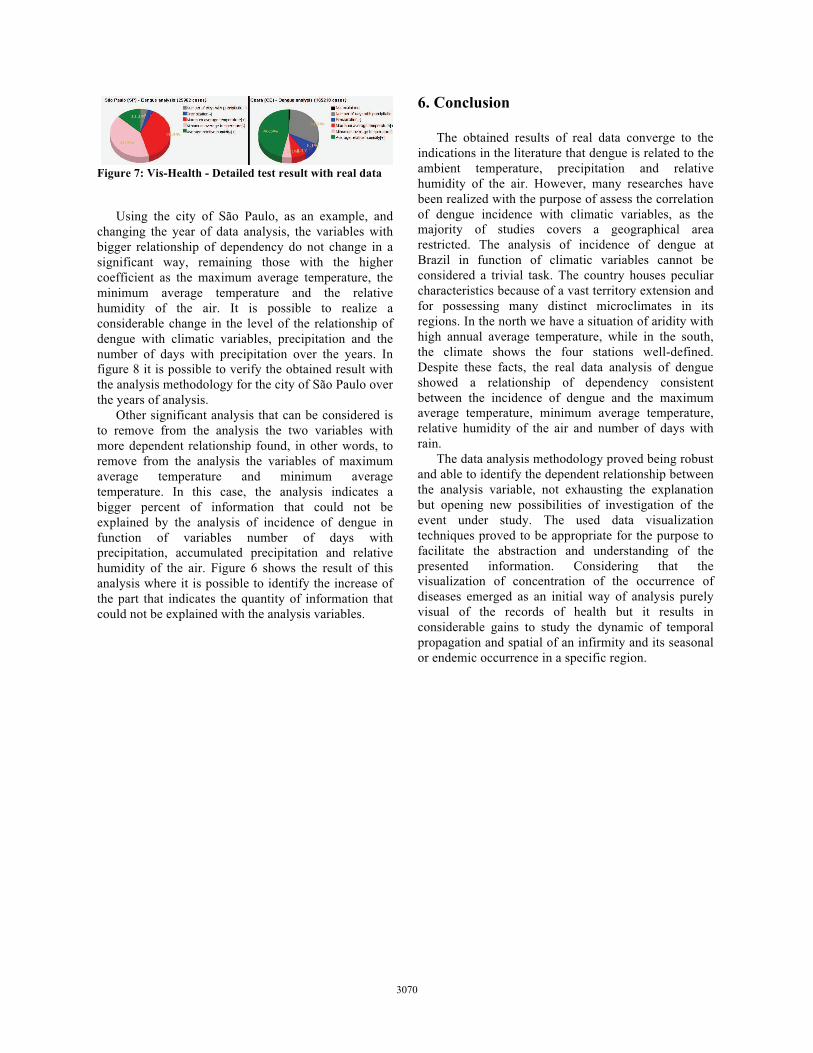
Figure 7: Vis-Health - Detailed test result with real data
Using the city of São Paulo, as an example, and
changing the year of data analysis, the variables with bigger relationship of dependency do not change in a significant way, remaining those with the higher coefficient as the maximum average temperature, the minimum average temperature and the relative humidity of the air. It is possible to realize a considerable change in the level of the relationship of dengue with climatic variables, precipitation and the number of days with precipitation over the years. In figure 8 it is possible to verify the obtained result with the analysis methodology for the city of São Paulo over the years of analysis.
Other significant analysis that can be considered is to remove from the analysis the two variables with more dependent relationship found, in other words, to remove from the analysis the variables of maximum average temperature and minimum average temperature. In this case, the analysis indicates a bigger percent of information that could not be explained by the analysis of incidence of dengue in function of variables number of days with precipitation, accumulated precipitation and relative humidity of the air. Figure 6 shows the result of this analysis where it is possible to identify the increase of the part that indicates the quantity of information that could not be explained with the analysis variables.
6. Conclusion
The obtained results of real data converge to the indications in the literature that dengue is related to the ambient temperature, precipitation and relative humidity of the air. However, many researches have been realized with the purpose of assess the correlation of dengue incidence with climatic variables, as the majority of studies covers a geographical area restricted. The analysis of incidence of dengue at Brazil in function of climatic variables cannot be considered a trivial task. The country houses peculiar characteristics because of a vast territory extension and for possessing many distinct microclimates in its regions. In the north we have a situation of aridity with high annual average temperature, while in the south, the climate shows the four stations well-defined. Despite these facts, the real data analysis of dengue showed a relationship of dependency consistent between the incidence of dengue and the maximum average temperature, minimum average temperature, relative humidity of the air and number of days with rain.
The data analysis methodology proved being robust and able to identify the dependent relationship between the analysis variable, not exhausting the explanation but opening new possibilities of investigation of the event under study. The used data visualization techniques proved to be appropriate for the purpose to facilitate the abstraction and understanding of the presented information. Considering that the visualization of concentration of the occurrence of diseases emerged as an initial way of analysis purely visual of the records of health but it results in considerable gains to study the dynamic of temporal propagation and spatial of an infirmity and its seasonal or endemic occurrence in a specific region.
3070
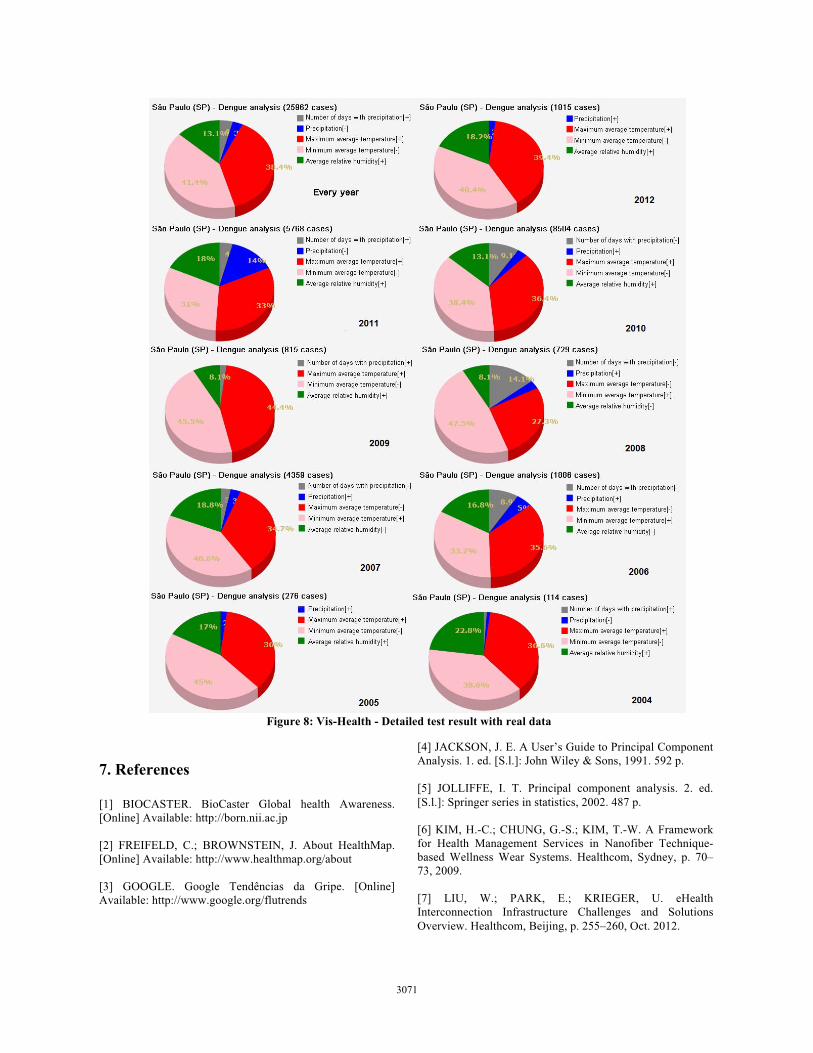
Figure 8: Vis-Health - Detailed test result with real data
7. References [1] BIOCASTER. BioCaster Global health Awareness. [Online] Available: http://born.nii.ac.jp [2] FREIFELD, C.; BROWNSTEIN, J. About HealthMap. [Online] Available: http://www.healthmap.org/about [3] GOOGLE. Google Tendências da Gripe. [Online] Available: http://www.google.org/flutrends
[4] JACKSON, J. E. A User’s Guide to Principal Component Analysis. 1. ed. [S.l.]: John Wiley & Sons, 1991. 592 p. [5] JOLLIFFE, I. T. Principal component analysis. 2. ed. [S.l.]: Springer series in statistics, 2002. 487 p. [6] KIM, H.-C.; CHUNG, G.-S.; KIM, T.-W. A Framework for Health Management Services in Nanofiber Technique-based Wellness Wear Systems. Healthcom, Sydney, p. 70–73, 2009. [7] LIU, W.; PARK, E.; KRIEGER, U. eHealth Interconnection Infrastructure Challenges and Solutions Overview. Healthcom, Beijing, p. 255–260, Oct. 2012.
3071
[8] RINGNÉR, M. What is principal component analysis? Nature Biotechnology, [S.l.], v. 26, n. 3, p. 303–304, Mar. 2008. [9] MASSAD, E.; RENéE X, d. M.; SILVEIRA, P. S. P.; ORTEGA, N. R. S. Métodos quantitativos em medicina. 1. ed. Barueri, SP: Manole, 2004. 570 p. [10] [10] Controladoria Geral da União. Parceria para Governo Aberto. [Online] Available: http://www.cgu.gov.br/PrevencaodaCorrupcao/CompromissosInternacionais/GovernoAberto [11] RODRIGUEZ-BARRAQUER, I.; CORDEIRO, M. T.; BRAGA, C.; SOUZA, W. V. de; MARQUES, E. T.; CUMMINGS, D. A. T. From Re-Emergence to Hyperendemicity: the natural history of the dengue epidemic in brazil. PLoS Neglected Tropical Diseases, [S.l.], Jan. 2011. [12] World Health Organization. Global strategy for dengue prevention and control 2012-2020. , [S.l.], 2012. [13] KYLE, J. L.; HARRIS, E. Global Spread and Persistence of Dengue. Annual Review of Microbiology, [S.l.], v. 62, p. 71–92, Oct. 2008. [14] TEIXEIRA, M. G.; CONCEIçãO N. COSTA, M. da; BARRETO, F.; BARRETO, M. L. Dengue: twenty-five years since reemergence in brazil. Caderno Saúde Pública, Rio de Janeiro, v. 25, 2009. [15] JOHANSSON, M. A.; DOMINICI, F.; GLASS, G. E. Local and Global Effects of Climate on Dengue Transmission in Puerto Rico. PLoS Neglected Tropical Diseases, [S.l.], v. 3, n. 2, 2009. [16] HARTLEY, L.; DONNELLY, C.; GARNETT, G. The seasonal pattern of dengue in endemic areas: mathematical models of mechanisms. TransR Soc Trop Med Hyg, [S.l.], v. 96, n. 4, p. 387–397, 2002. [17] HOPP, M. J.; FOLEY, J. A. Worldwide fluctuations in dengue fever cases related to climate variability. Climate Research, [S.l.], v. 25, n. 1, p. 85–94, 2003. [18] HALES, S.; WET, N. de; MAINDONALD, J.; WOODWARD, A. Potential effect of population and climate changes on global distribution of dengue fever: an empirical model. Lancet, [S.l.], n. 360, p. 830–834, 2002. [19] PETERSONA, A. T.; MARTíNEZ-CAMPOSB, C.; NAKAZAWAC, Y.; MARTíNEZ-MEYER, E. Time-specific ecological niche modeling predicts spatial dynamics of vector insects and human dengue cases. Transactions of the Royal Society of Tropical Medicine and Hygiene, [S.l.], n. 99, p. 647–655, 2005.
[20] ROGERS, D.; WILSON, A.; HAY, S.; GRAHAM, A. The Global Distribution of Yellow Fever and Dengue. Advances in Parasitology, [S.l.], v. 62, p. 181–220, 2006. [21] HAY, S. I.; MYERS, M. F.; BURKE, D. S.; VAUGHN, D. W.; ENDY, T.; ANANDA, N.; SHANKS, G. D.; SNOW, R. W.; ROGERS, D. J. Etiology of interepidemic periods of mosquito-borne disease. Proceedings of the National Academy of Sciences of the United States of America, [S.l.], v. 97, n. 16, p. 181–220, 2000 [22] CAMPBELL, K. M.; LIN, C. D.; IAMSIRITHAWORN, S.; SCOTT, T. W. The Complex Relationship between Weather and Dengue Virus Transmission in Thailand. The American Journal of Tropical Medicine and Hygiene, [S.l.], v. 89, n. 6, p. 1066–1080, 2013. [23] � !"#$ ��%#$$#&�#��'�(�)*"!&�$��+��� ��� ���,��
+��� ���-�������-������!�������������������+ �� ��
!�� ��� ���#���� ��.�� ���� ��� ��'�������� ���
�������&�/����0&����11&����2&����3456315&�7859��
[24] TUN-LIN, W.; BURKOT, T. R.; KAY, B. H. Effects of temperature and larval diet on development rates and survival of the dengue vector Aedes aegypti in north Queensland, Australia. Medical and Veterinary Entomology, [S.l.], v. 14, n. 1, p. 31–37, 2000. [25] KEATING, J. An investigation into the cyclical incidence of dengue fever. Social Science and Medicine, [S.l.], v. 55, n. 9, p. 1691, 2001. [26] THAMMAPALO, S.; CHONGSUWIWATWONG, V.; MCNEIL, D.; GEATER, A. The climatic factors influencing the occurrence of dengue hemorrhagic fever in Thailand. Southeast Asian Journal Tropical Medicine and Public Health, [S.l.], v. 36, n. 1, p. 191–196, 2005. [27] LOWEA, R.; BAILEYA, T. C.; STEPHENSONA, D. B.; GRAHAMB, R. J.; COELHOC, C. A.; CARVALHOD, M. S.; BARCELLOSD, C. Spatio-temporal modelling of climate-sensitive disease risk: towards an early warning system for dengue in brazil. Computers & Geosciences, [S.l.], v. 37, n. 3, p. 371–381, 2011. [28] PROMPROU, S.; JAROENSUTASINEE, M.; JAROENSUTASINEE, K. Climatic Factors Affecting Dengue Haemorrhagic Fever Incidence in Southern Thailand. WHO Regional Office for South-East Asia, [S.l.], v. 29, p. 41–48, 2005. [29] World Health Organization. Global strategy for dengue prevention and control 2012-2020. , [S.l.], 2012. [30] CDC. Dengue and Climate. [Online] Available: http://www.cdc.gov/Dengue/entomologyEcology/climate.html [31] World Health Organization. Dengue and severe dengue. Fact sheet, [S.l.], v. 177, Mar. 2014.
3072