violence against women survey in indonesia - · pdf fileinformation about violence of women...
TRANSCRIPT

Violence Against Women Survey In Indonesia
Dwi Retno Wilujeng Wahyu Utami Division Chief of Region Resilience Statistics BPS – STATISTICS INDONESIA
Workshop on Improving the Integration of Gender Perspective into Official Statistics, Chiba, Japan, 16-19 April 2013
1

Topics
The 2006 Survey of Violence against Women and Children in Indonesia
The Planning of 2014 Survey of Violence against Women in Indonesia
2
The 2006 Survey of Violence against Women and Children in Indonesia
3

Data collection Type of data collection: module integrated in the 2006
National Socio Economic Survey (SUSENAS), using special questionnaire
Sample: 68,800 households Estimation level: province and national Method: Interview Interviewers: Susenas interviewers
Target respondent: (1) Women: All women aged 18+ or ever married
women of aged less than 18 (2) Children: Aged less than 18 years old and never
married.
4

Sampling Design Two Stage Double Sampling Design for both urban and
rural areas First Stage, From 13.097 core cb selected 4.300 cb
were then selected by linear systematic for 2006 Violence against Women and Children Survey
Second Stage, 16 household were then systematically
selected from the listing. From each selected hhs could be elected one or more
women depending on the existing of experiencing violence
5

Training and Interviewer Provided only one day training for VAW after 3 days of
SUSENAS training Aspect covered in the training were how to asking
questions, type, concep and definition of violence, private place for victim
Interviewer: mix men and women, but SUSENAS interviewers dominated by man
6
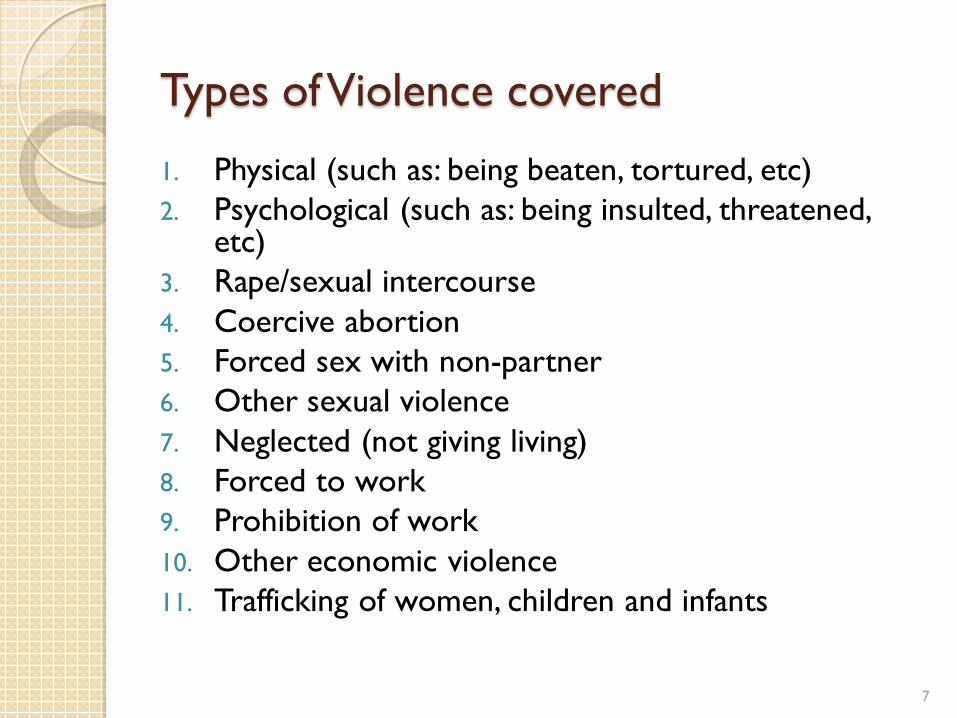
Types of Violence covered
1. Physical (such as: being beaten, tortured, etc) 2. Psychological (such as: being insulted, threatened,
etc) 3. Rape/sexual intercourse 4. Coercive abortion 5. Forced sex with non-partner 6. Other sexual violence 7. Neglected (not giving living) 8. Forced to work 9. Prohibition of work 10. Other economic violence 11. Trafficking of women, children and infants
7
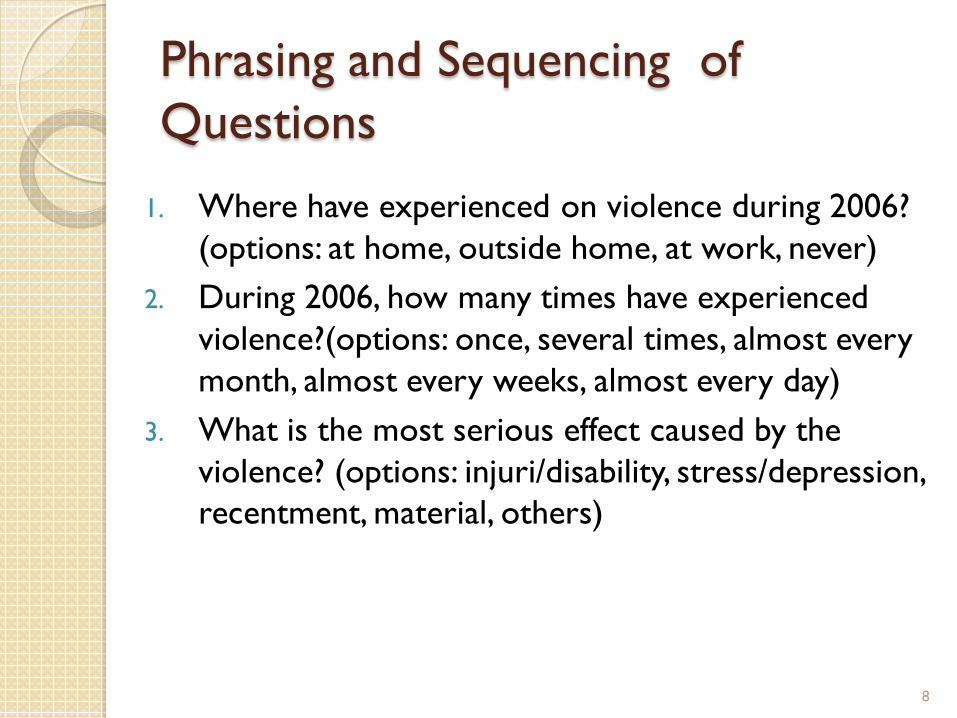
Phrasing and Sequencing of Questions
1. Where have experienced on violence during 2006? (options: at home, outside home, at work, never)
2. During 2006, how many times have experienced violence?(options: once, several times, almost every month, almost every weeks, almost every day)
3. What is the most serious effect caused by the violence? (options: injuri/disability, stress/depression, recentment, material, others)
8
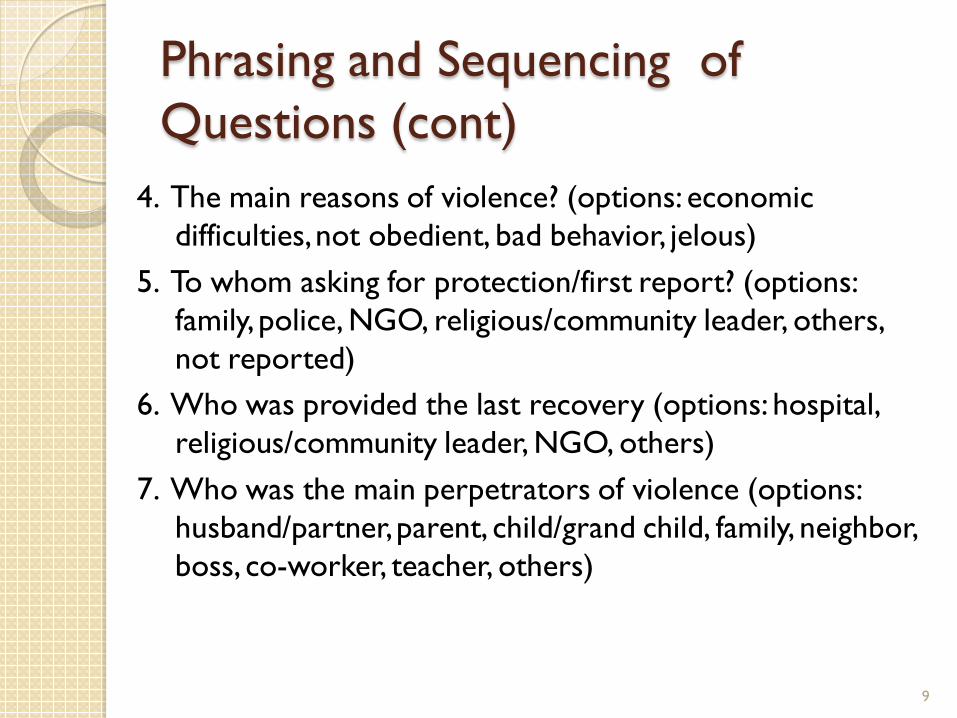
Phrasing and Sequencing of Questions (cont)
4. The main reasons of violence? (options: economic difficulties, not obedient, bad behavior, jelous)
5. To whom asking for protection/first report? (options: family, police, NGO, religious/community leader, others, not reported)
6. Who was provided the last recovery (options: hospital, religious/community leader, NGO, others)
7. Who was the main perpetrators of violence (options: husband/partner, parent, child/grand child, family, neighbor, boss, co-worker, teacher, others)
9

Main Challenges in Data Collection
VAW survey interviews conducted after the enumeration of SUSENAS questionnaires
It is not easy to collect data on sensitive topics, such as information about violence of women who are victims, especially when the perpetrator is her husband
Women and Children regard the domestic violence as private matter, not for the public domain (taboo)
10

3.07
3.08
3.06
Total Urban Rural
The Results Figure 1. Woman Victim by Area (%)
Total number of woman victims in 2006 was 2.3 million or 3. 07 percent. Victims of violence against women in rural areas are
higher than in urban areas (1.3 million versus 1.0 million)
11
23.3
65.3
11.3
17.9 16.2 20.7
64.7
12.8
17.7 18.2
25.3
65.8
10.2
18.0 14.5
Persecution Humiliation Harassment Neglect Others
Total
Urban
Rural
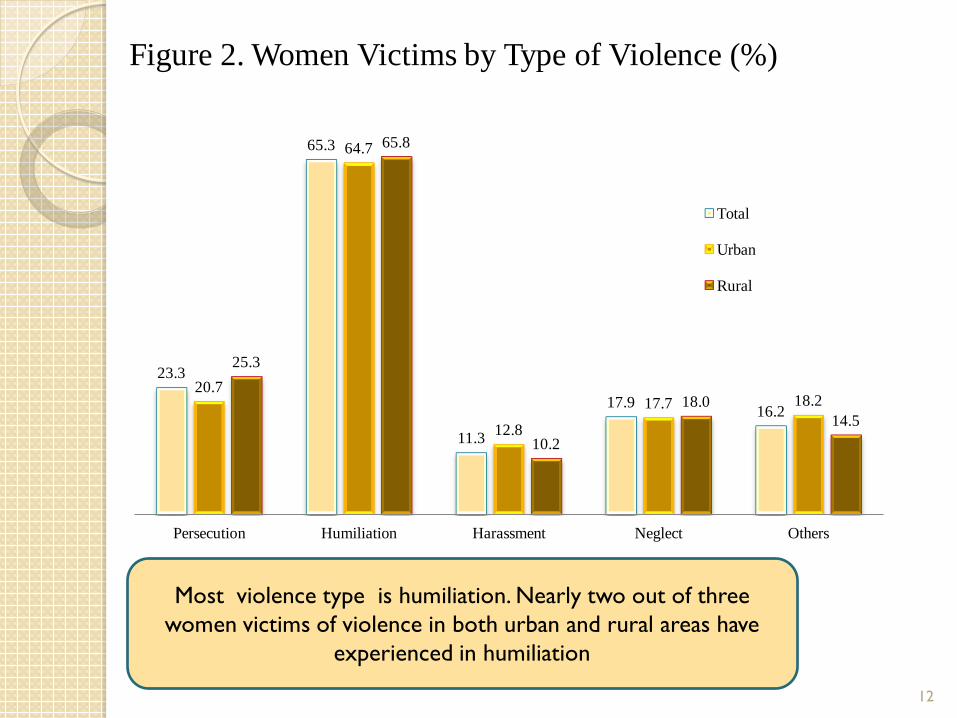
Figure 2. Women Victims by Type of Violence (%)
Most violence type is humiliation. Nearly two out of three women victims of violence in both urban and rural areas have
experienced in humiliation
12

Figure 3. Violence against Women by The Worst Consequence (%)
The most effect received by the victim was resentment, reaching 69.5 percent. This is in line with the highest type of violence
experienced by victims is humiliation
4.6
9.0
69.5
10.0
6.9
4.6
11.2
67.7
10.0
6.5
4.6
7.2
71.0
9.9
7.3
Wound/disabilities
Stress/Depression
Resentment
Material
Others Rural
Urban
Total
13

Figure 4. Women Victims by Crime Scene and Area
64.1
30.2
4.8 0.9
72.1
24.4
2.2 2.1
68
27
3.4 1.5
at home outside working place two place or more
Urban
Rural
Total
14
34.2
12.5 13.6 14
25.8
Economic Difficulties
Non-compliant Bad Behavior Jealous Others
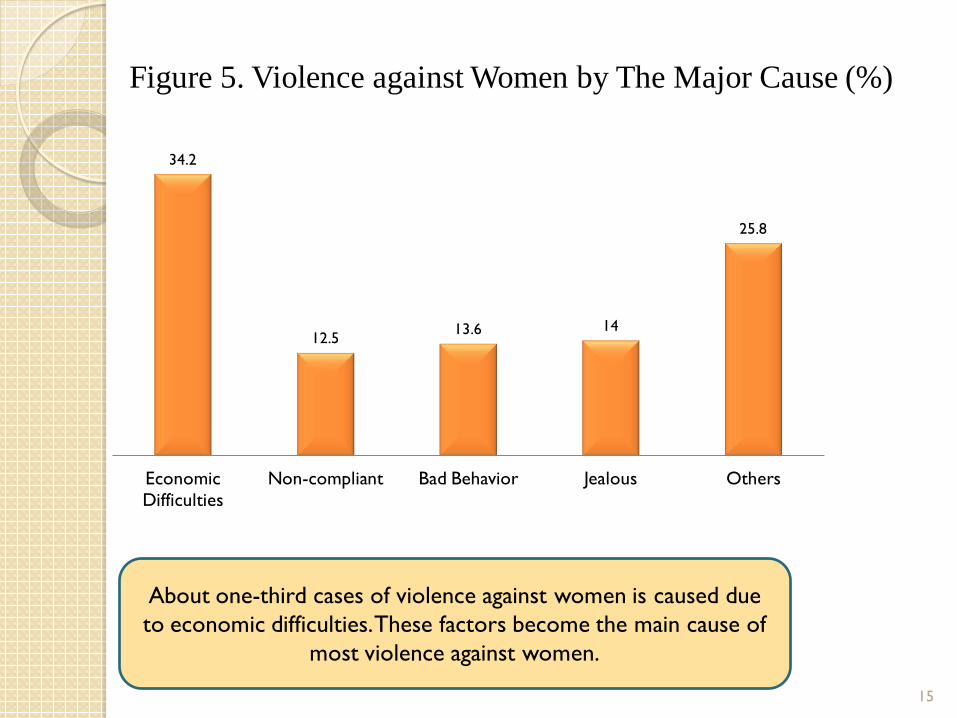
Figure 5. Violence against Women by The Major Cause (%)
About one-third cases of violence against women is caused due to economic difficulties. These factors become the main cause of
most violence against women.
15

31.9
50.6
7.1 2.8
7.6
Once Several Times Almost Every Month
Almost Every Week
Almost Everyday
Figure 6. Violence against Women by Frequency of Occurrence (%)
Half of the number cases of violence against women occur over several times. Only about one-third of the number of cases of violence, done only once. This fact indicates that two-thirds of
cases of violence against women occur more than once. 16
Subject Urban Rural Total Husband 50.6 58.8 55.1
Parents/Parents in law 3.8 5.4 4.7
Children/Grandchildren 2.4 1.7 2.0
Family 4.9 5.2 5.0
Neighbor 17.9 21.0 19.6
Boss 3.6 1.6 2.5 Co-workers 4.4 1.7 2.9
Teacher 0.3 0.0 0.2
Others 12.1 4.6 8.0
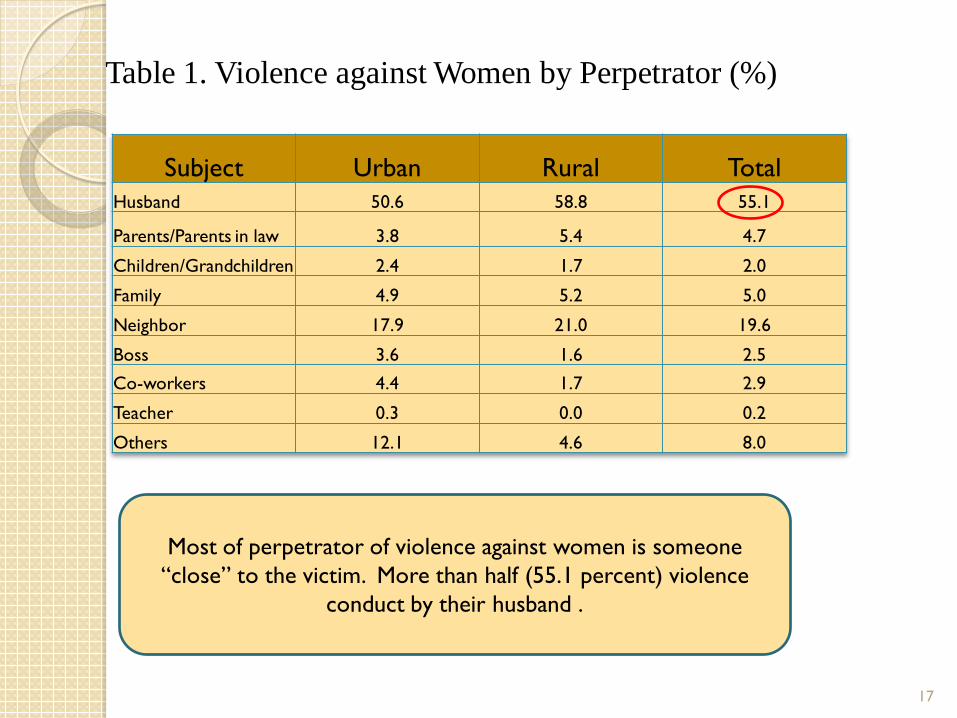
Table 1. Violence against Women by Perpetrator (%)
Most of perpetrator of violence against women is someone “close” to the victim. More than half (55.1 percent) violence
conduct by their husband .
17

Figure 7. Violence against Women by The Place to Ask for Protection (%)
32.2
1.9
0.2
2.5
4.0
54.9
4.4
Family
Police
NGO/social worker
Religious/Community Figures
Others
Not Reported
Don't Know
18
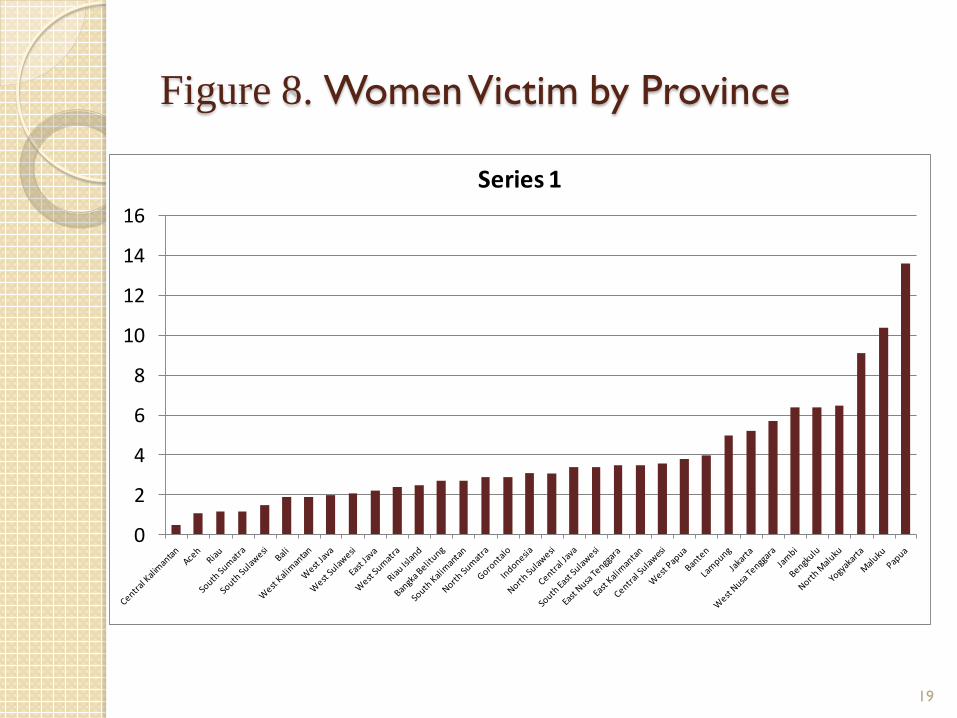
Figure 8. Women Victim by Province
0
2
4
6
8
10
12
14
16
Series 1
19
Follow Up Study In 2007, on 16 regency/municipality of 8 provinces, with
the objectives are: To completed the information about the main reason of
violence, Get a picture about attitudes toward violence victims
that they had experienced Attempt of victim to find help Attempt of related institutions in handling the victim of
violence
20
Follow Up Study (cont) In 2007, research on Evaluation of Implementation Law
No. 23/2004 on Domestic Violence Elimination Conducted in 5 provinces At 6 related institutions in district/municipality: women
empowerment bureau, health department, police, hospital, Social department and NGO/legal aid
21
Lesson Learned from 2006 VAW Survey
VAW survey should be conducted as dedicated survey, with specific training and specific interviewer
Eligible respondent not women aged 18+, but should woman aged 15-64 years and only elected one women per household
Used women interviewers Taking into account the sensitivity of the issue, not
elected 16 household per cencus block but reducing to 10 hhs per cencus block
Should refer to safety of the respondent and ethical behavior of interviewer
22

The Planning of 2014 Survey of Violence against Women in Indonesia
In 2012, developing the questionnaires and manual used for 2014 VAW survey (adopting WHO methodology)
In 2013, instrumen testing in 4 regency/municipality In 2014, VAW survey that will cover 24 provinces with
9.000 samples, interview using handheld/PDA Financial Supporting by UNFPA
23

24