vintersykling i oulu
TRANSCRIPT
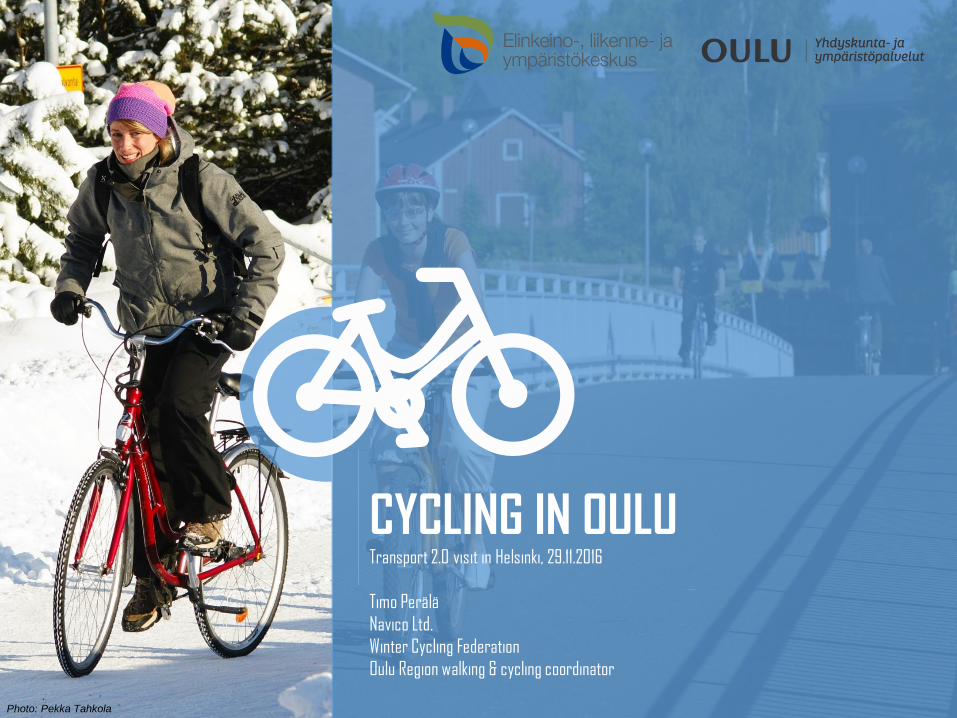
CYCLING IN OULUTransport 2.0 visit in Helsinki, 29.11.2016
Timo Perälä
Navico Ltd.
Winter Cycling Federation
Oulu Region walking & cycling coordinator
Photo: Pekka Tahkola
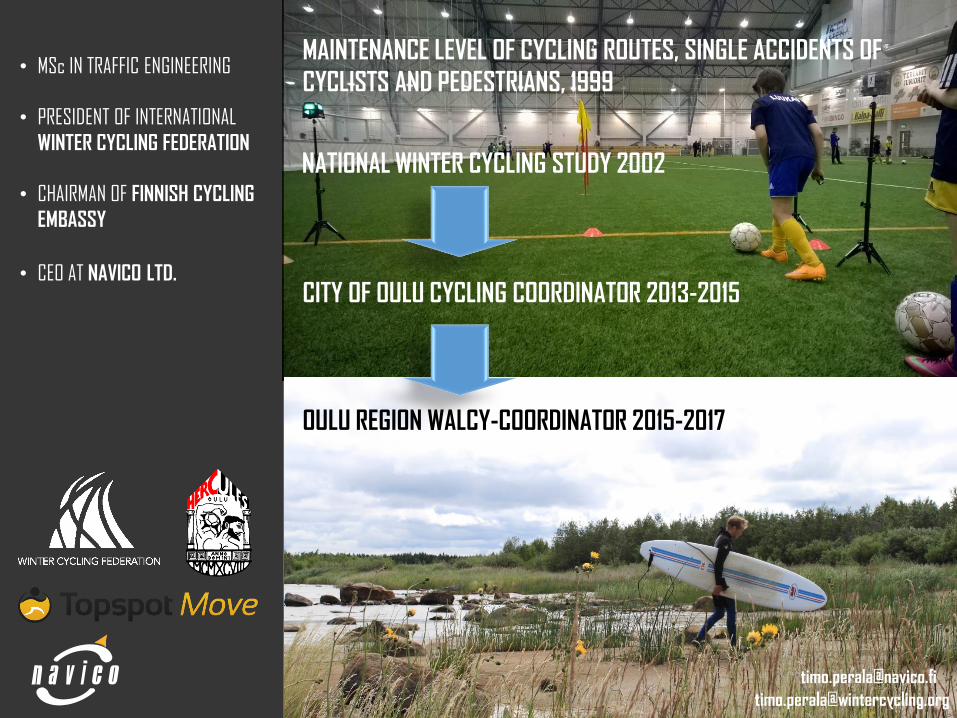
Photo: Anu Perälä
NATIONAL WINTER CYCLING STUDY 2002
MAINTENANCE LEVEL OF CYCLING ROUTES, SINGLE ACCIDENTS OF
CYCLISTS AND PEDESTRIANS, 1999
CITY OF OULU CYCLING COORDINATOR 2013-2015
OULU REGION WALCY-COORDINATOR 2015-2017
• MSc IN TRAFFIC ENGINEERING
• PRESIDENT OF INTERNATIONAL
WINTER CYCLING FEDERATION
• CHAIRMAN OF FINNISH CYCLING
EMBASSY
• CEO AT NAVICO LTD.
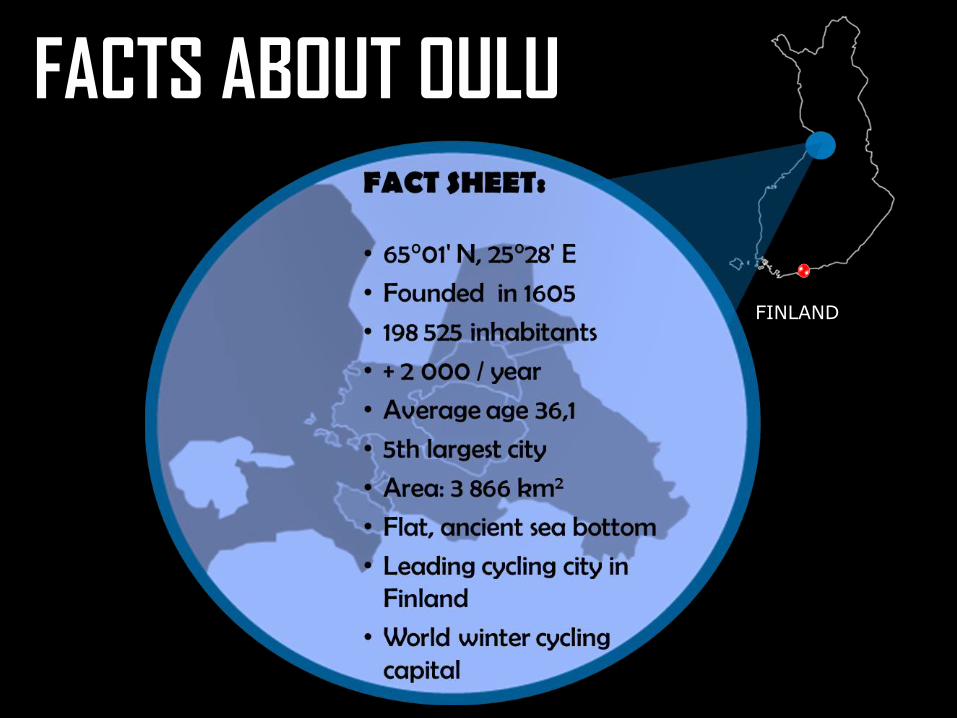
FINLAND
FACTS ABOUT OULU
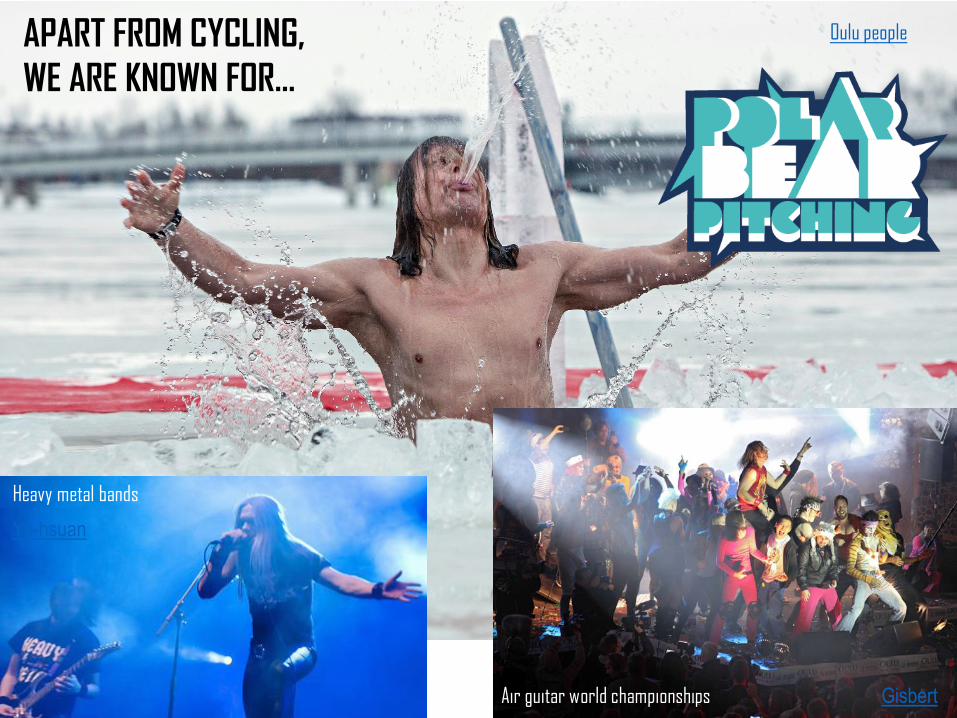
APART FROM CYCLING,
WE ARE KNOWN FOR…
Oulu people
GisbertAir guitar world championships
Yu-hsuan
Heavy metal bands
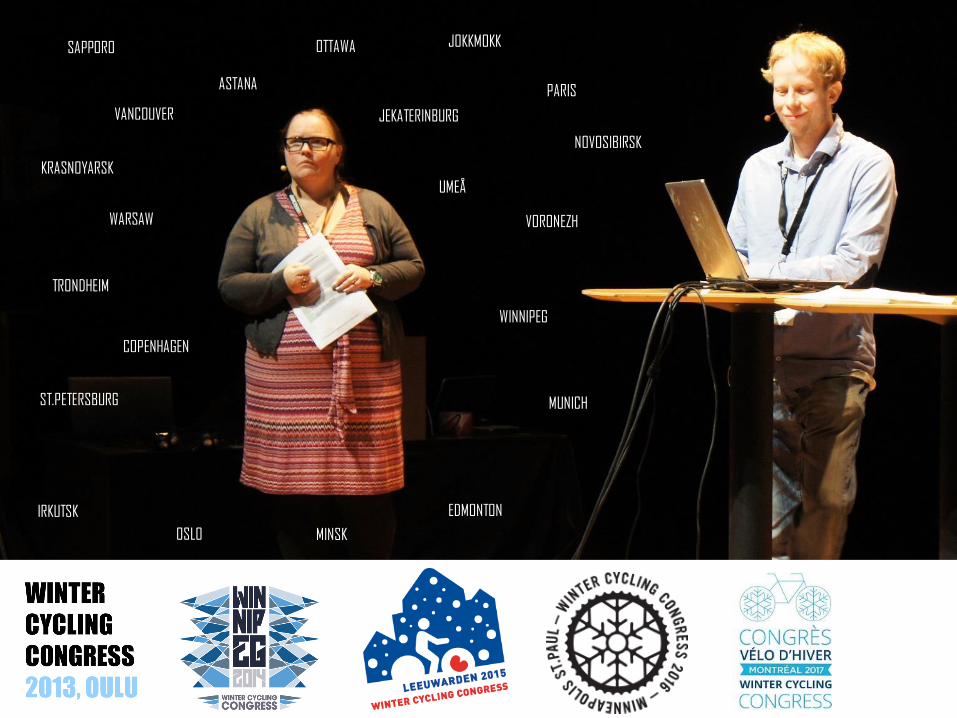
SAPPORO
VANCOUVER
PARIS
OTTAWA
NOVOSIBIRSK
TRONDHEIM
JOKKMOKK
UMEÅ
OSLO
COPENHAGEN
ST.PETERSBURG MUNICH
WARSAW
ASTANA
JEKATERINBURG
WINNIPEG
EDMONTON
VORONEZH
IRKUTSK
KRASNOYARSK
MINSK
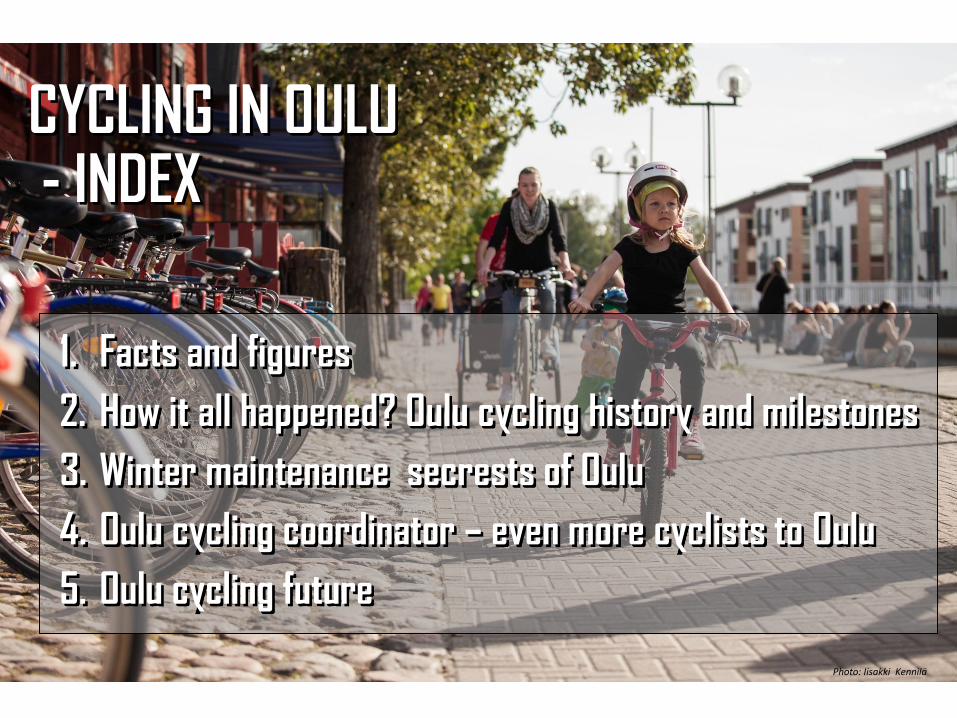
CYCLING IN OULU- INDEX
1. Facts and figures
2. How it all happened? Oulu cycling history and milestones
3. Winter maintenance secrests of Oulu
4. Oulu cycling coordinator – even more cyclists to Oulu
5. Oulu cycling future
Photo: Iisakki Kennilä
OULU CYCLING
FACTS & FIGURES1
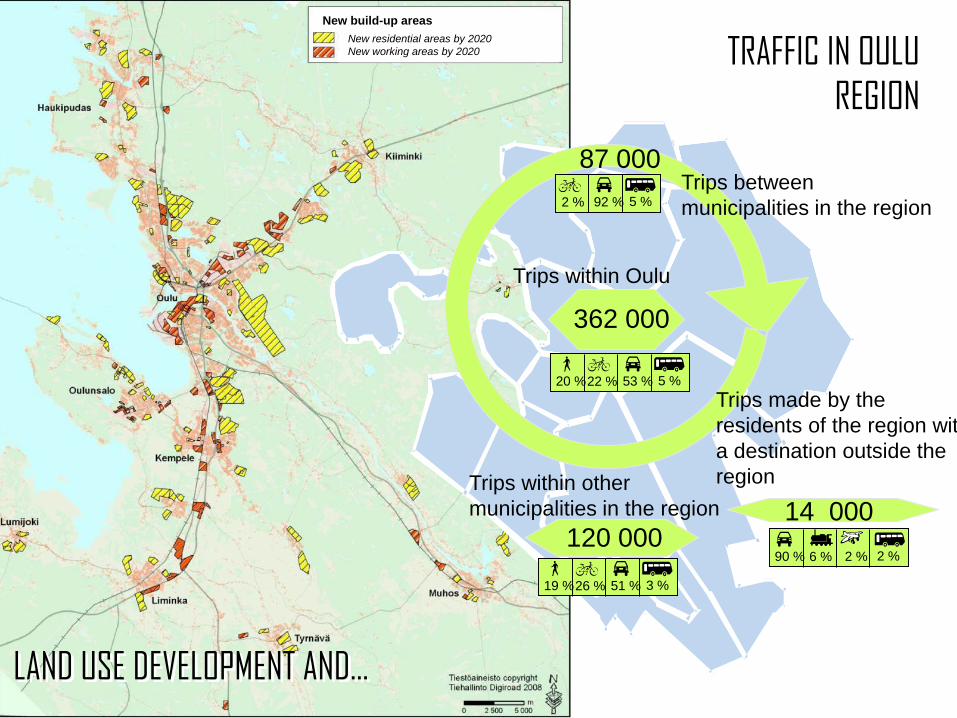
LAND USE DEVELOPMENT AND…
Trips within Oulu
362 000
Trips within other
municipalities in the region
120 00014 000
87 000
92 %2 % 5 %
53 %22 % 5 %20 %
51 %26 % 3 %19 %
2 %6 % 2 %90 %
Trips made by the
residents of the region with
a destination outside the
region
TRAFFIC IN OULU
REGION
Trips between
municipalities in the region
New build-up areas
New residential areas by 2020
New working areas by 2020
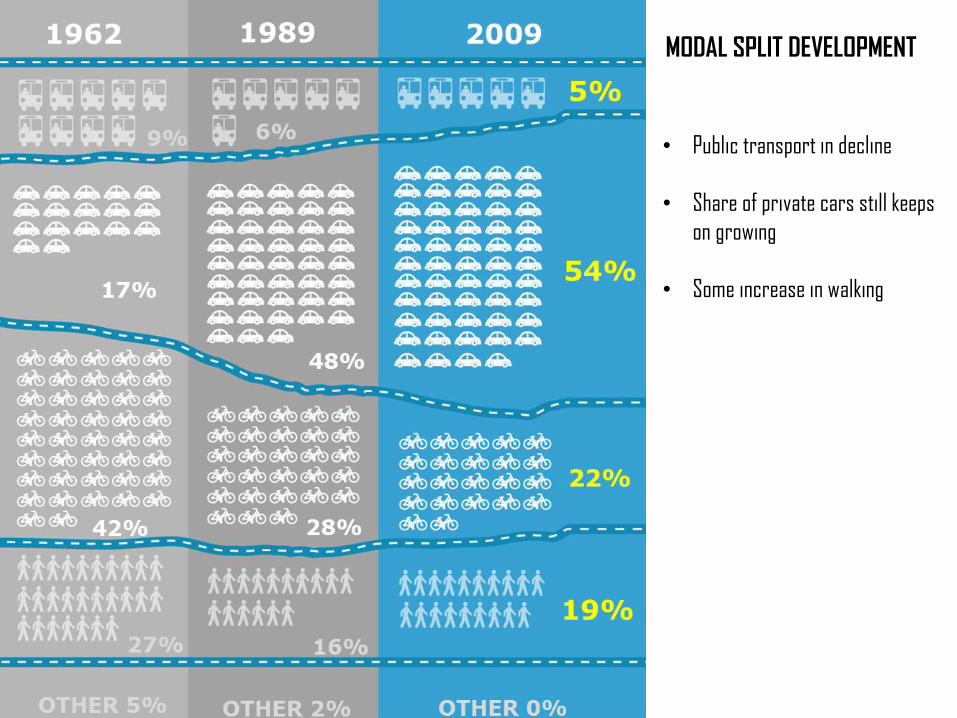
• Public transport in decline
• Share of private cars still keeps
on growing
• Some increase in walking
MODAL SPLIT DEVELOPMENT
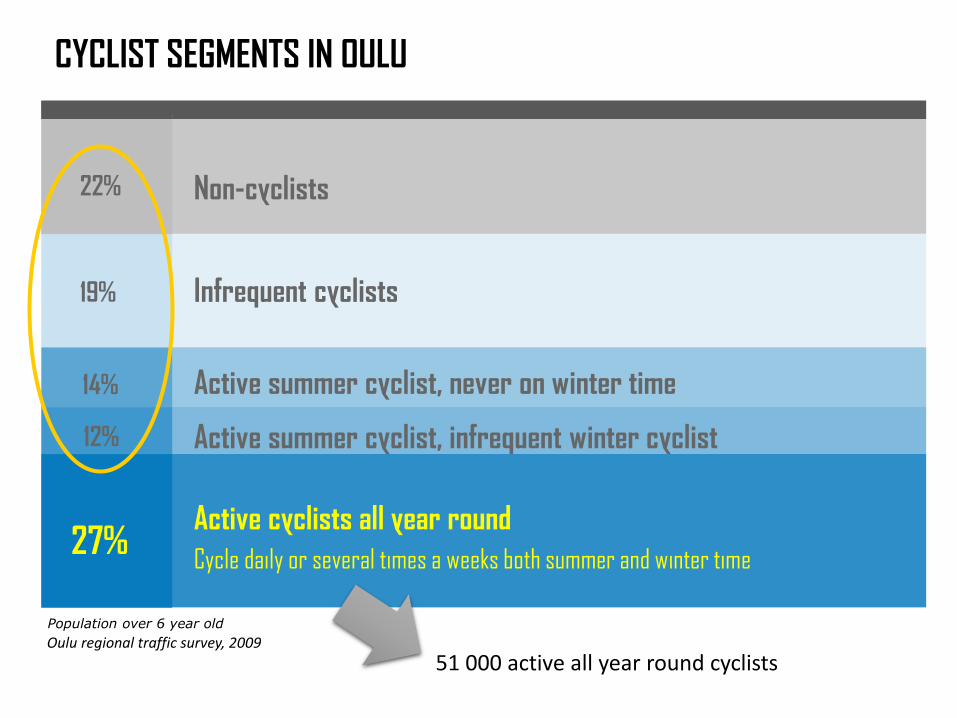
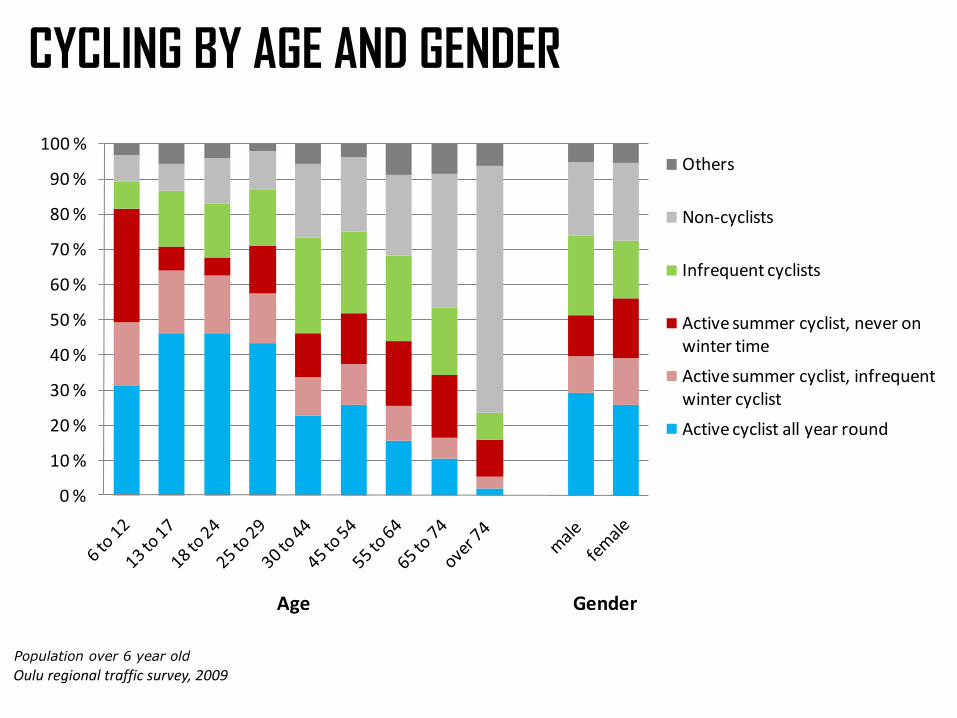
Population over 6 year old
CYCLIST SEGMENTS IN OULU
27%
12%
14%
19%
22%
Active cyclists all year round
Cycle daily or several times a weeks both summer and winter time
Active summer cyclist, infrequent winter cyclist
Active summer cyclist, never on winter time
Infrequent cyclists
Non-cyclists
Oulu regional traffic survey, 2009
51 000 active all year round cyclists
0 %
10 %
20 %
30 %
40 %
50 %
60 %
70 %
80 %
90 %
100 %
Age Gender
Others
Non-cyclists
Infrequent cyclists
Active summer cyclist, never on winter time
Active summer cyclist, infrequent winter cyclist
Active cyclist all year round
CYCLING BY AGE AND GENDER
Population over 6 year old
Oulu regional traffic survey, 2009
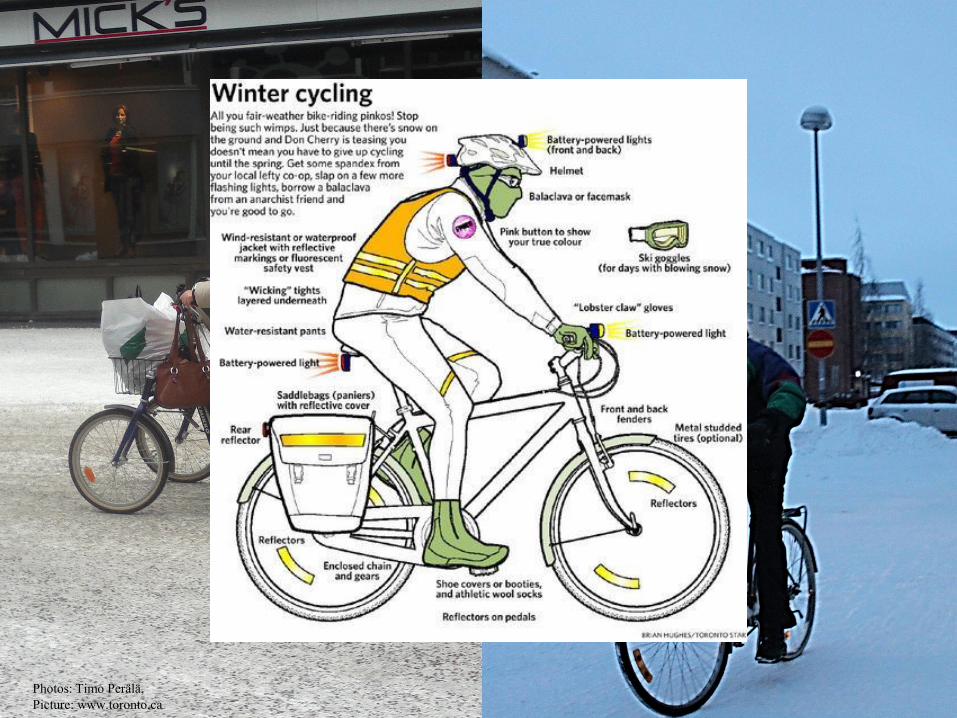
Photos: Timo Perälä,
Picture: www.toronto.ca
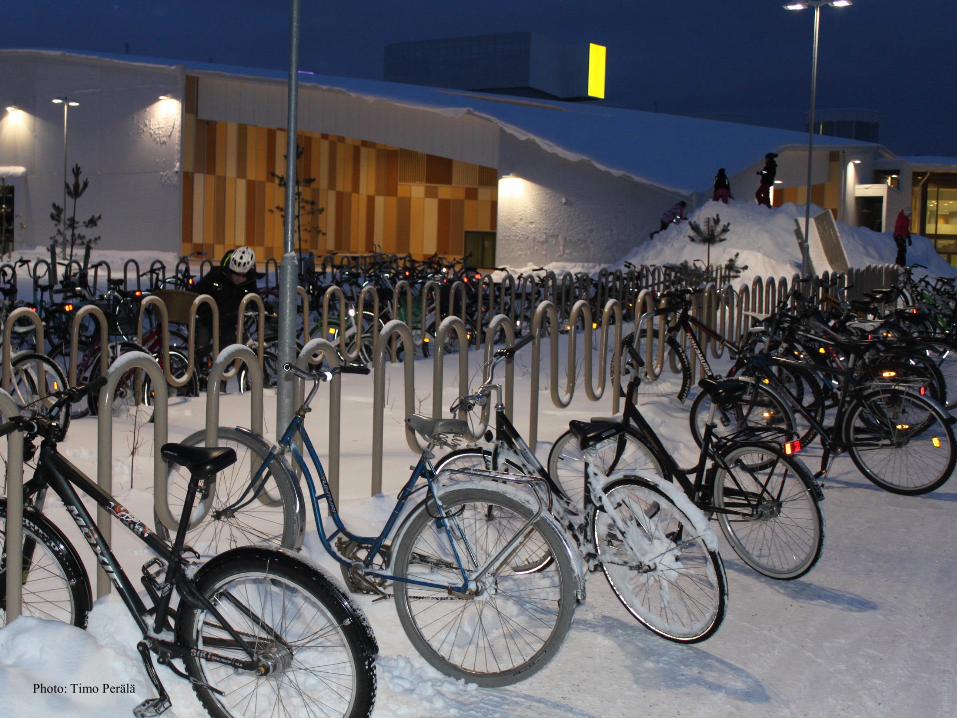
Photo: Timo Perälä
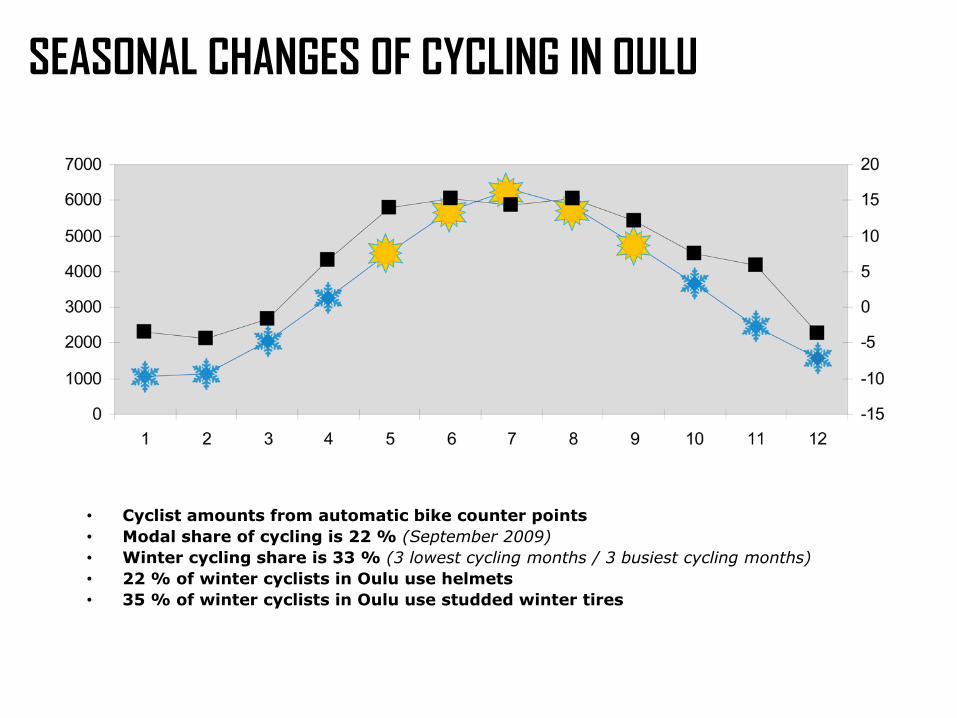
• Cyclist amounts from automatic bike counter points
• Modal share of cycling is 22 % (September 2009)
• Winter cycling share is 33 % (3 lowest cycling months / 3 busiest cycling months)
• 22 % of winter cyclists in Oulu use helmets
• 35 % of winter cyclists in Oulu use studded winter tires
SEASONAL CHANGES OF CYCLING IN OULU
CYCLING SAFETY IN
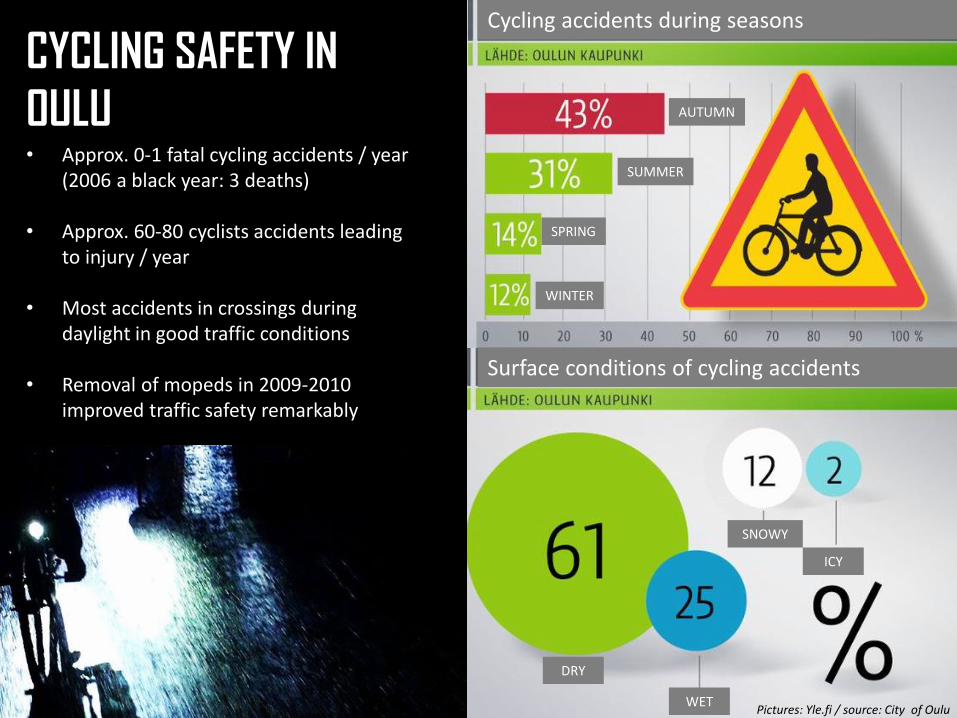
OULU• Approx. 0-1 fatal cycling accidents / year
(2006 a black year: 3 deaths)
• Approx. 60-80 cyclists accidents leading to injury / year
• Most accidents in crossings during daylight in good traffic conditions
• Removal of mopeds in 2009-2010 improved traffic safety remarkably
Pictures: Yle.fi / source: City of Oulu
Cycling accidents during seasons
Surface conditions of cycling accidents
AUTUMN
SUMMER
SPRING
WINTER
DRY
WET
SNOWY
ICY
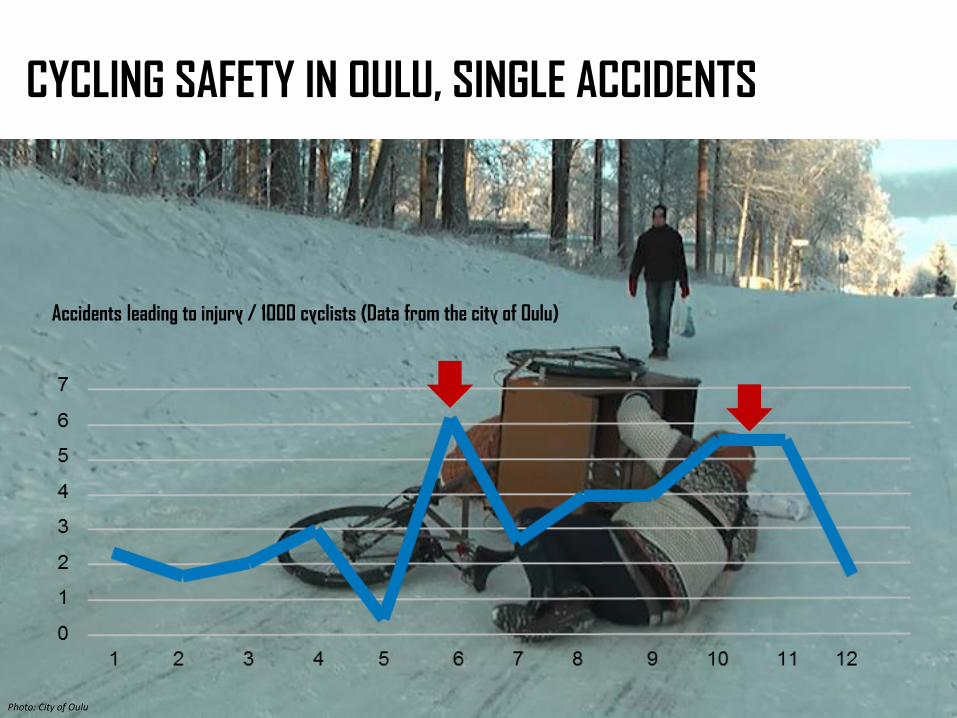
Photo: City of Oulu
CYCLING SAFETY IN OULU, SINGLE ACCIDENTS
Accidents leading to injury / 1000 cyclists (Data from the city of Oulu)
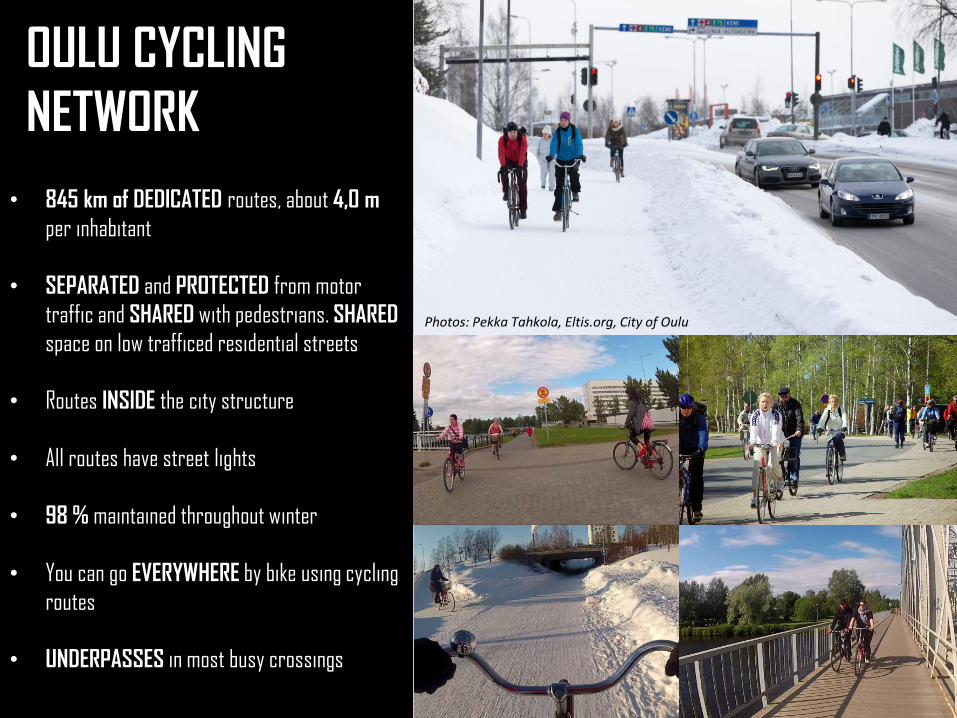
OULU CYCLING
NETWORK
• 845 km of DEDICATED routes, about 4,0 m
per inhabitant
• SEPARATED and PROTECTED from motor
traffic and SHARED with pedestrians. SHARED
space on low trafficed residential streets
• Routes INSIDE the city structure
• All routes have street lights
• 98 % maintained throughout winter
• You can go EVERYWHERE by bike using cycling
routes
• UNDERPASSES in most busy crossings
Photos: Pekka Tahkola, Eltis.org, City of Oulu
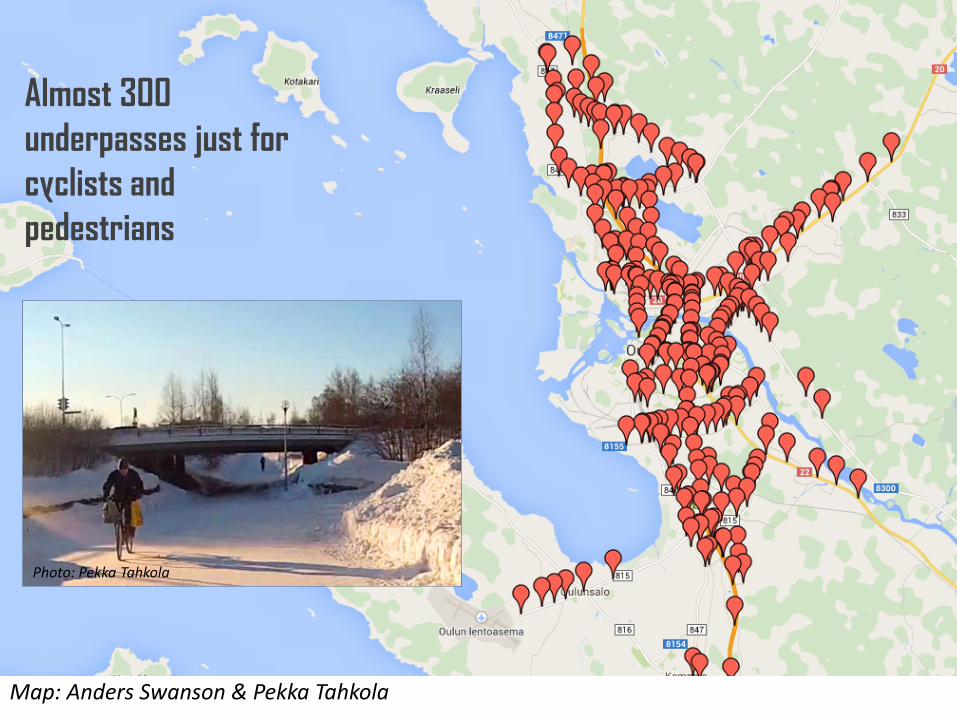
Almost 300
underpasses just for
cyclists and
pedestrians
Map: Anders Swanson & Pekka Tahkola
Photo: Pekka Tahkola
OULU CYCLING
HISTORY2
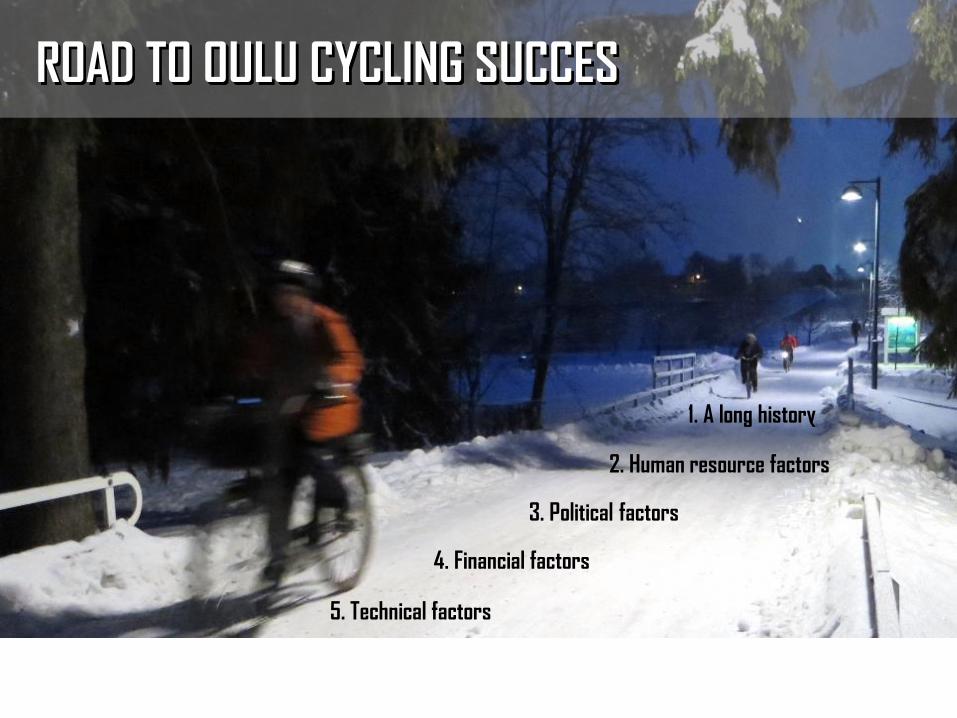
2. Human resource factors
3. Political factors
4. Financial factors
2. TRAFFIC PLANNING HISTORY
1. A long history
5. Technical factors
ROAD TO OULU CYCLING SUCCES
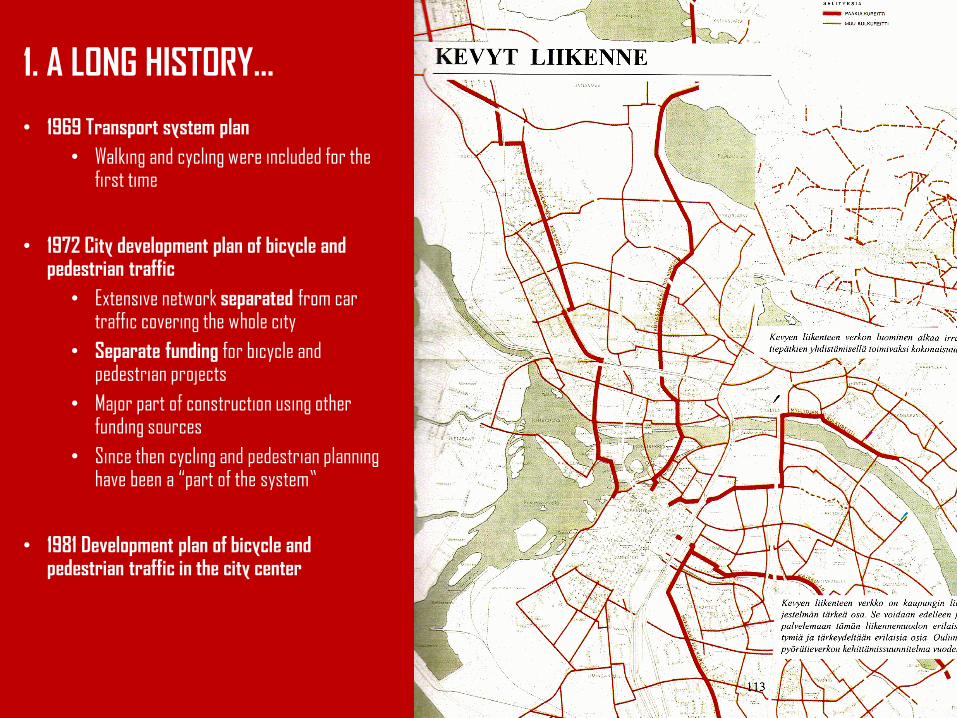
• 1969 Transport system plan
• Walking and cycling were included for the first time
• 1972 City development plan of bicycle and pedestrian traffic
• Extensive network separated from car traffic covering the whole city
• Separate funding for bicycle and pedestrian projects
• Major part of construction using other funding sources
• Since then cycling and pedestrian planning have been a “part of the system”
• 1981 Development plan of bicycle and pedestrian traffic in the city center
1. A LONG HISTORY…
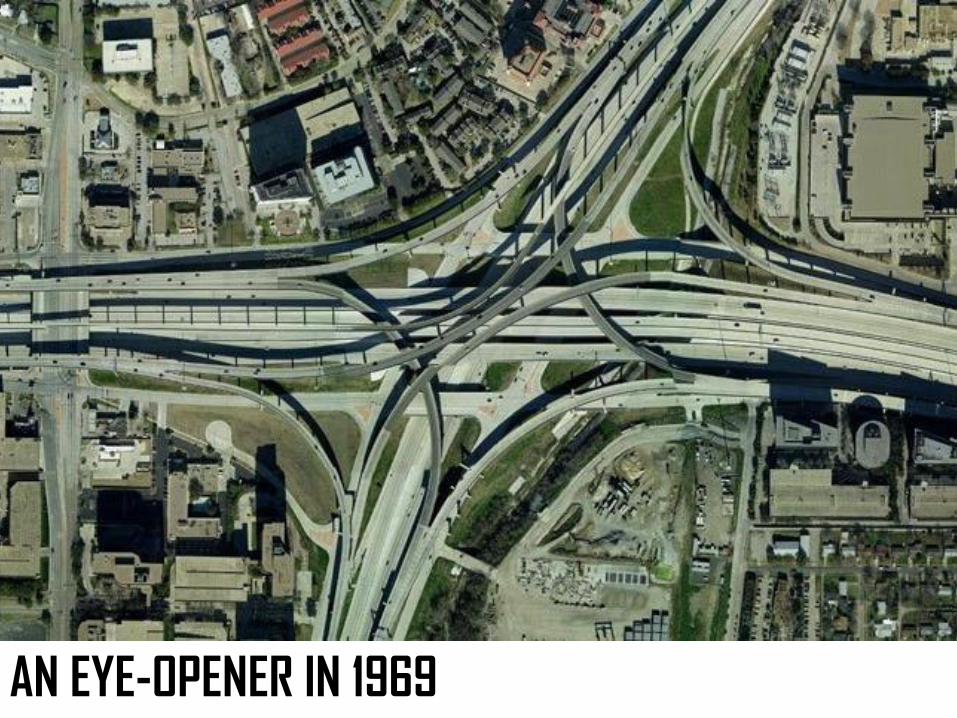
2. TRAFFIC PLANNING HISTORYAN EYE-OPENER IN 1969
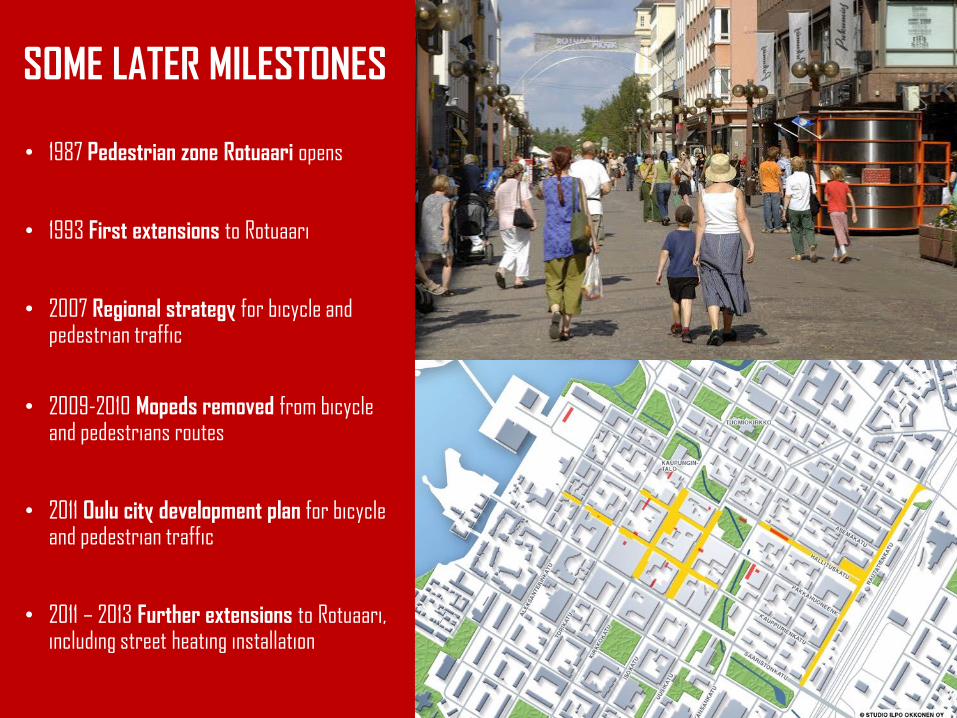
• 1987 Pedestrian zone Rotuaari opens
• 1993 First extensions to Rotuaari
• 2007 Regional strategy for bicycle and pedestrian traffic
• 2009-2010 Mopeds removed from bicycle and pedestrians routes
• 2011 Oulu city development plan for bicycle and pedestrian traffic
• 2011 – 2013 Further extensions to Rotuaari, including street heating installation
SOME LATER MILESTONES
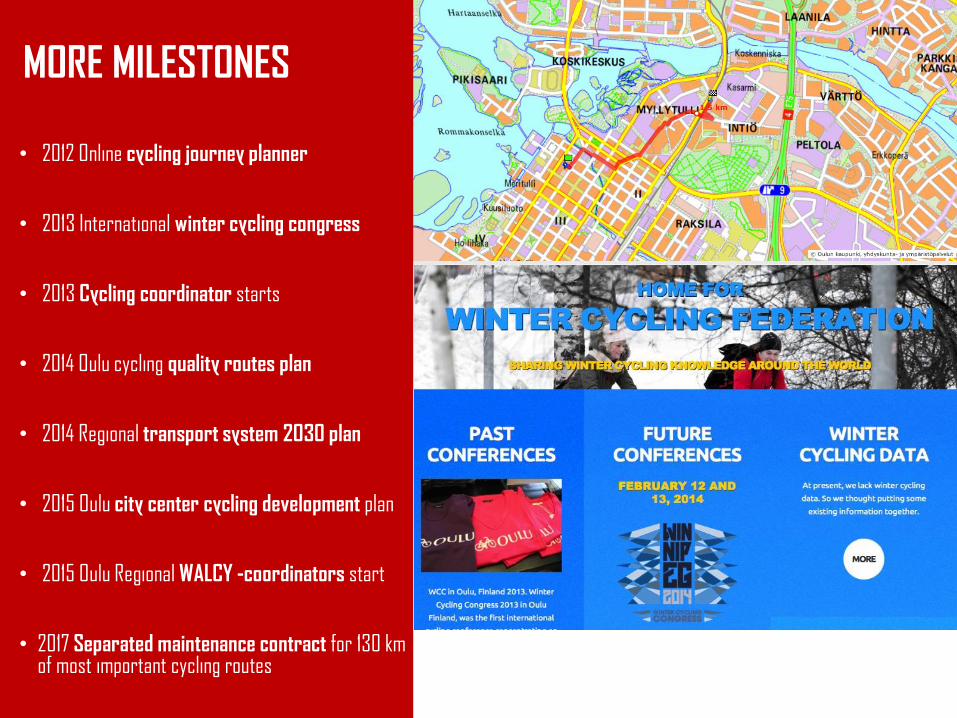
• 2012 Online cycling journey planner
• 2013 International winter cycling congress
• 2013 Cycling coordinator starts
• 2014 Oulu cycling quality routes plan
• 2014 Regional transport system 2030 plan
• 2015 Oulu city center cycling development plan
• 2015 Oulu Regional WALCY -coordinators start
• 2017 Separated maintenance contract for 130 km of most important cycling routes
MORE MILESTONES
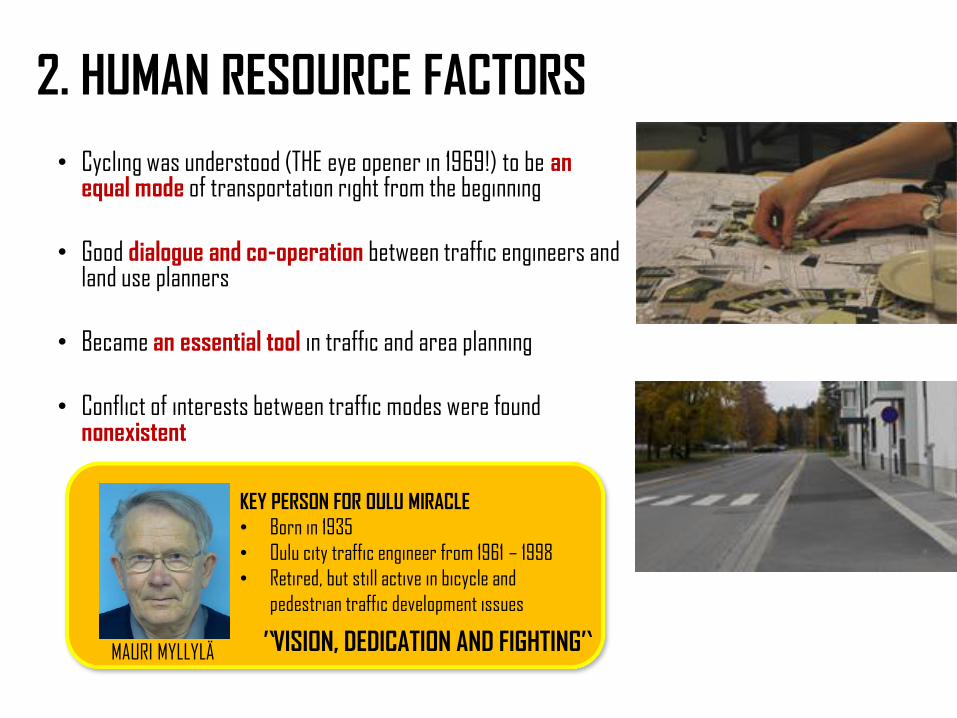
2. HUMAN RESOURCE FACTORS
• Cycling was understood (THE eye opener in 1969!) to be an equal mode of transportation right from the beginning
• Good dialogue and co-operation between traffic engineers and land use planners
• Became an essential tool in traffic and area planning
• Conflict of interests between traffic modes were found nonexistent
MAURI MYLLYLÄ
KEY PERSON FOR OULU MIRACLE
• Born in 1935
• Oulu city traffic engineer from 1961 – 1998
• Retired, but still active in bicycle and
pedestrian traffic development issues
”VISION, DEDICATION AND FIGHTING”
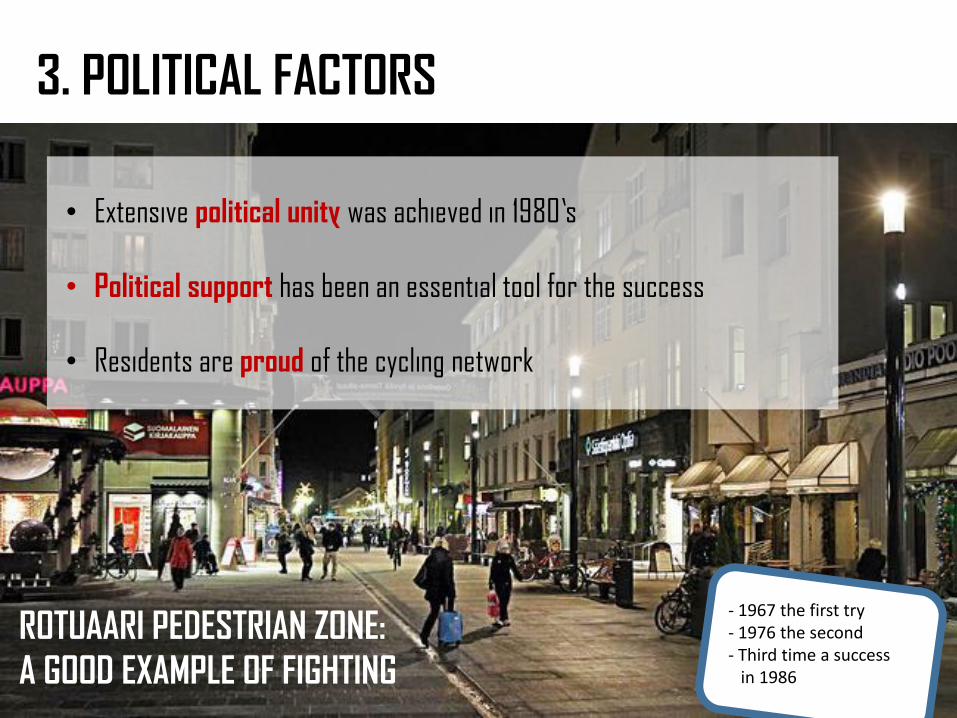
3. POLITICAL FACTORS
• Extensive political unity was achieved in 1980’s
• Political support has been an essential tool for the success
• Residents are proud of the cycling network
ROTUAARI PEDESTRIAN ZONE:
A GOOD EXAMPLE OF FIGHTING
- 1967 the first try- 1976 the second- Third time a success
in 1986
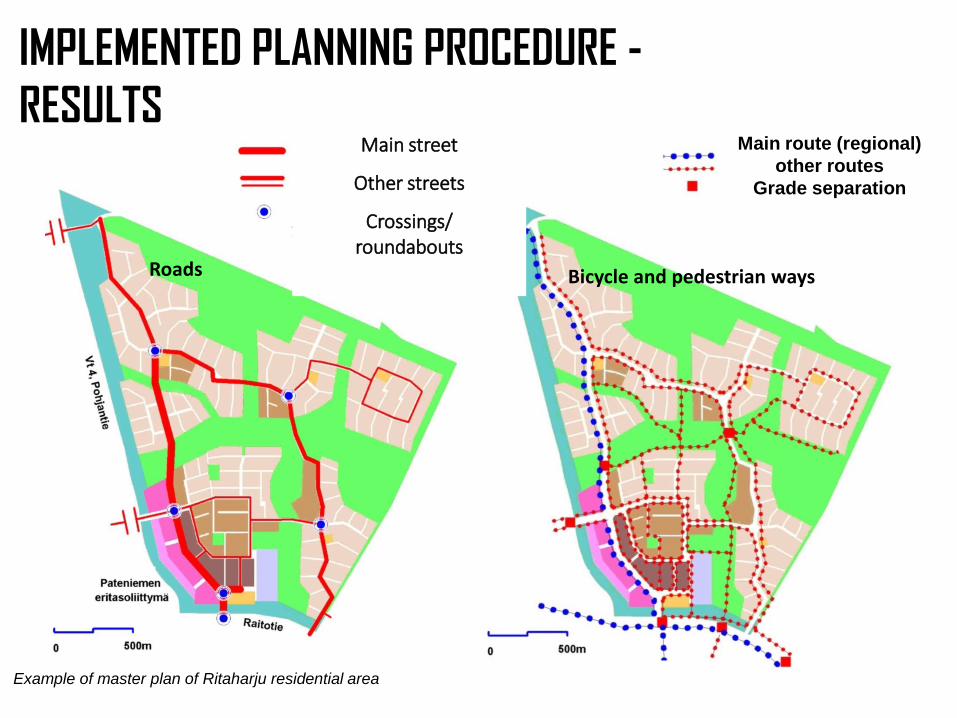
Main street
Other streets
Crossings/roundabouts
Main route (regional)
other routes
Grade separation
Example of master plan of Ritaharju residential area
Roads Bicycle and pedestrian ways
IMPLEMENTED PLANNING PROCEDURE -
RESULTS
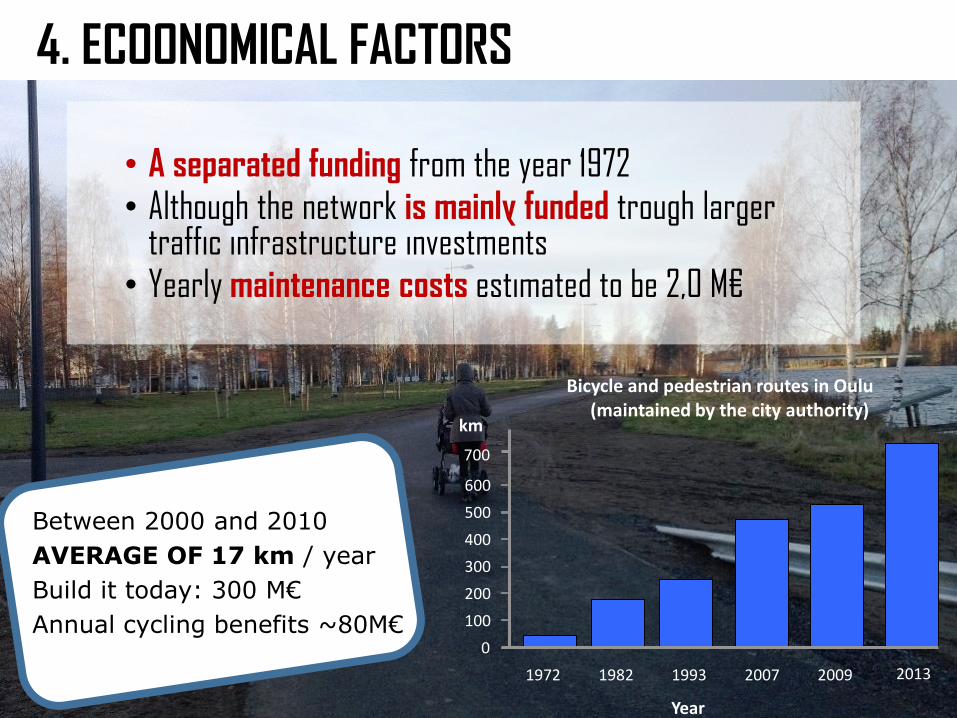
4. ECOONOMICAL FACTORS
• A separated funding from the year 1972• Although the network is mainly funded trough larger
traffic infrastructure investments• Yearly maintenance costs estimated to be 2,0 M€
0
100
200
300
400
500
600
1972 1982 1993 2007 2009
Year
Bicycle and pedestrian routes in Oulu (maintained by the city authority)
2013
700
km
Between 2000 and 2010
AVERAGE OF 17 km / year
Build it today: 300 M€
Annual cycling benefits ~80M€
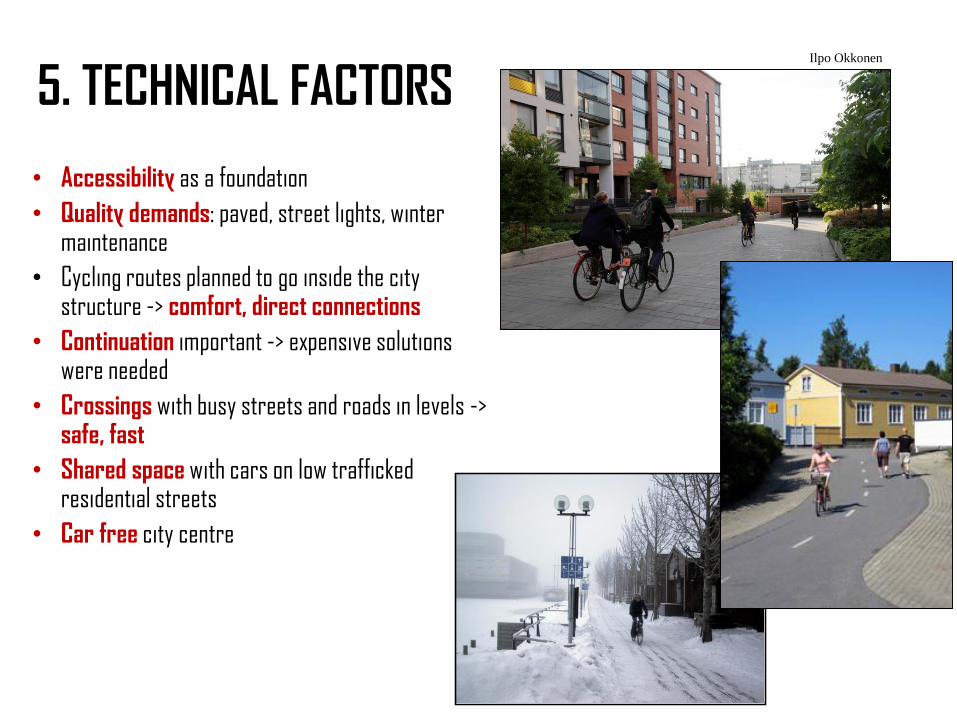
5. TECHNICAL FACTORS
• Accessibility as a foundation
• Quality demands: paved, street lights, winter maintenance
• Cycling routes planned to go inside the city structure -> comfort, direct connections
• Continuation important -> expensive solutions were needed
• Crossings with busy streets and roads in levels -> safe, fast
• Shared space with cars on low trafficked residential streets
• Car free city centre
Ilpo Okkonen
2. TRAFFIC PLANNING HISTORY
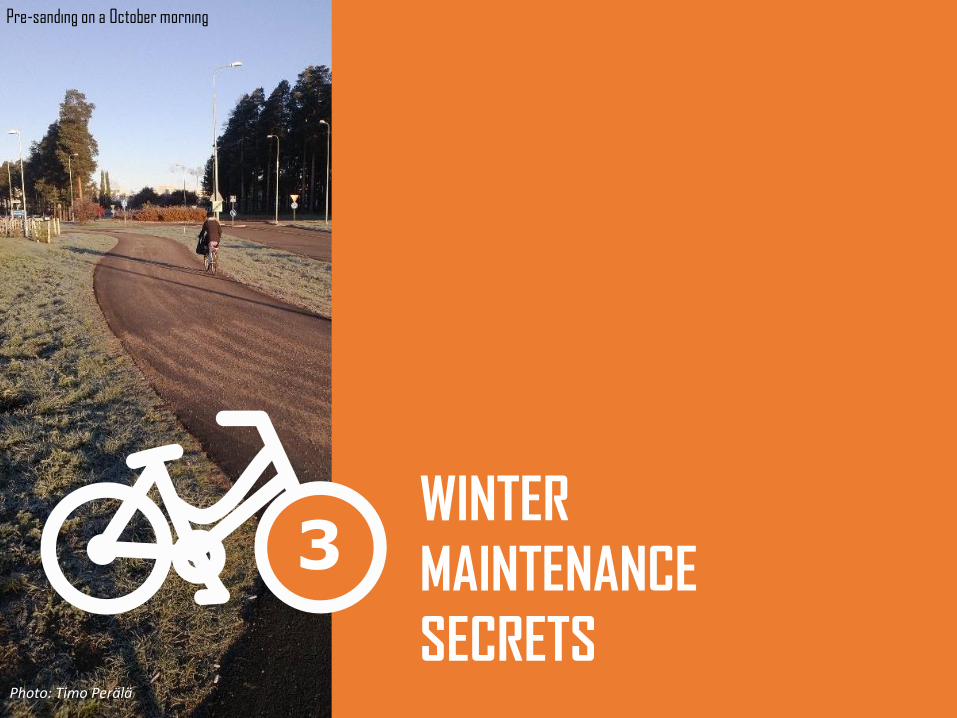
3
Photo: Timo Perälä
WINTER
MAINTENANCE
SECRETS
Pre-sanding on a October morning
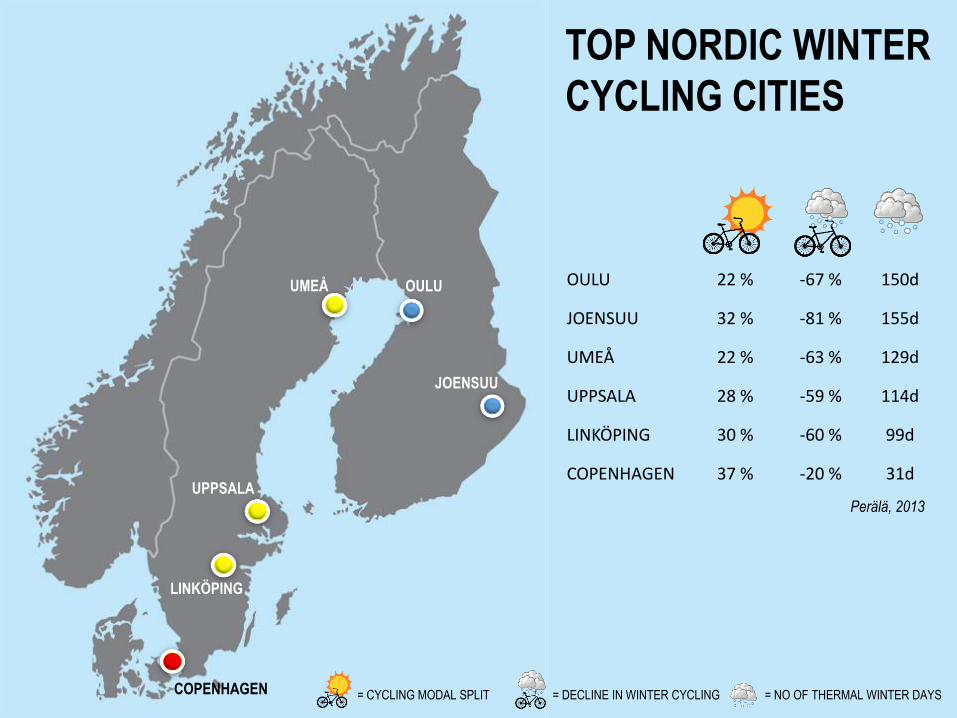
TOP NORDIC WINTER
CYCLING CITIES
OULU
JOENSUU
UMEÅ
UPPSALA
LINKÖPING
COPENHAGEN
OULU 22 % -67 % 150d
JOENSUU 32 % -81 % 155d
UMEÅ 22 % -63 % 129d
UPPSALA 28 % -59 % 114d
LINKÖPING 30 % -60 % 99d
COPENHAGEN 37 % -20 % 31d
= CYCLING MODAL SPLIT = DECLINE IN WINTER CYCLING = NO OF THERMAL WINTER DAYS
Perälä, 2013
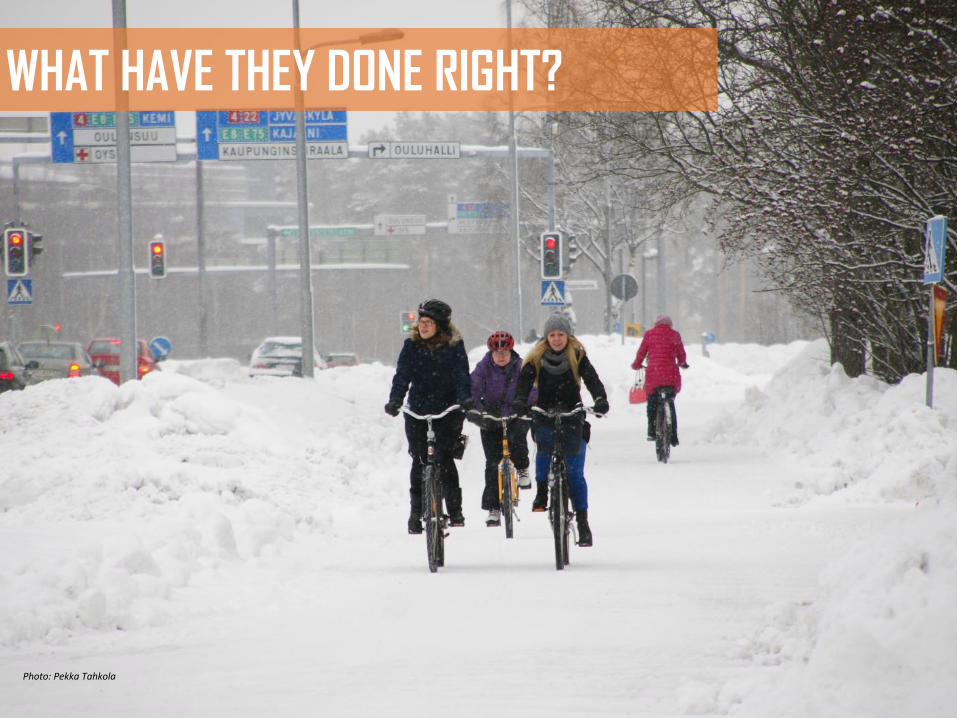
WHAT HAVE THEY DONE RIGHT?
Photo: Pekka Tahkola
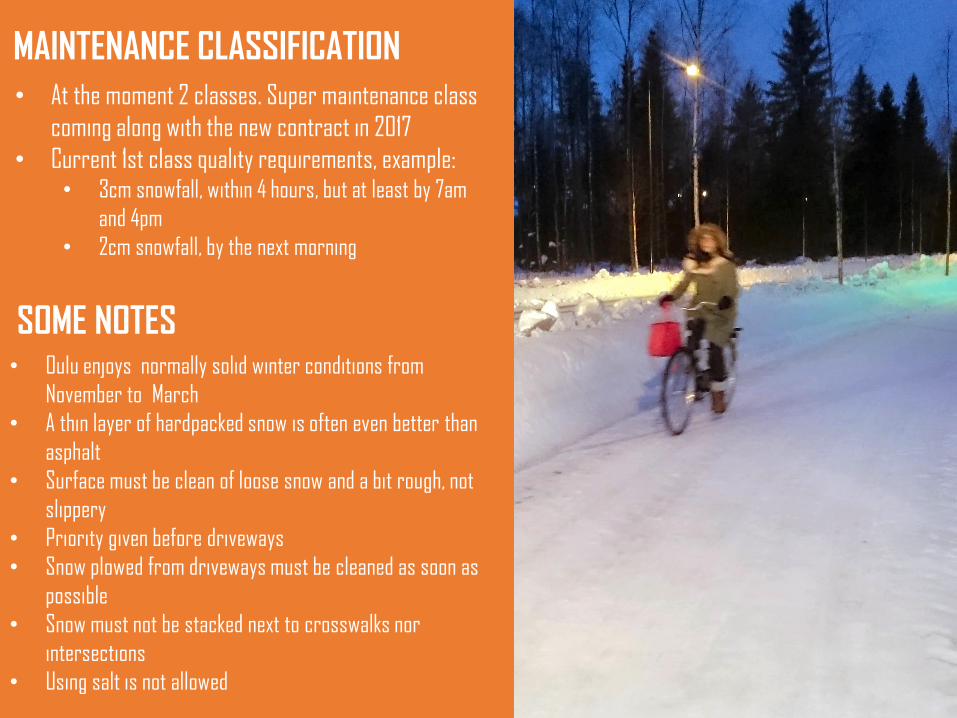
• At the moment 2 classes. Super maintenance class
coming along with the new contract in 2017
• Current 1st class quality requirements, example:• 3cm snowfall, within 4 hours, but at least by 7am
and 4pm
• 2cm snowfall, by the next morning
MAINTENANCE CLASSIFICATION
• Oulu enjoys normally solid winter conditions from
November to March
• A thin layer of hardpacked snow is often even better than
asphalt
• Surface must be clean of loose snow and a bit rough, not
slippery
• Priority given before driveways
• Snow plowed from driveways must be cleaned as soon as
possible
• Snow must not be stacked next to crosswalks nor
intersections
• Using salt is not allowed
SOME NOTES
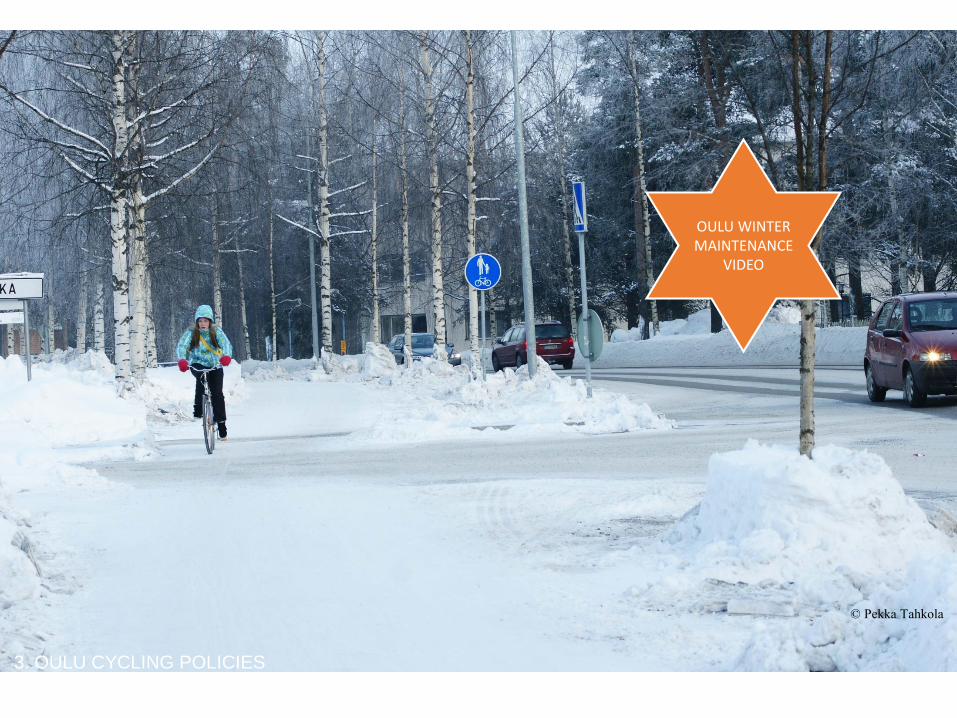
3. OULU CYCLING POLICIES
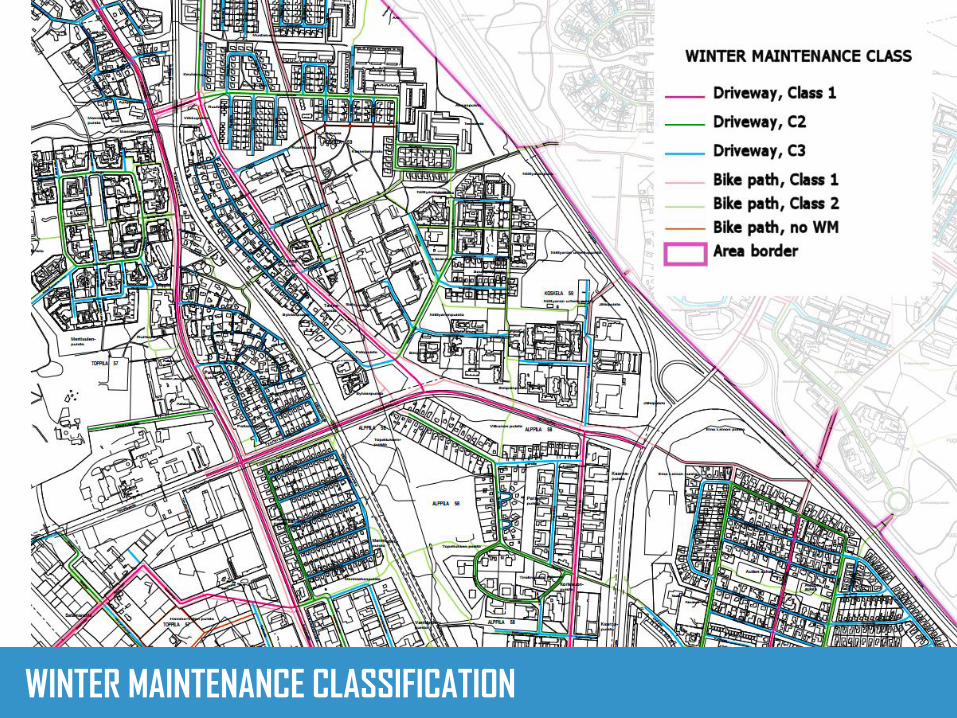
Cycling network, underpassesWINTER MAINTENANCE CLASSIFICATION
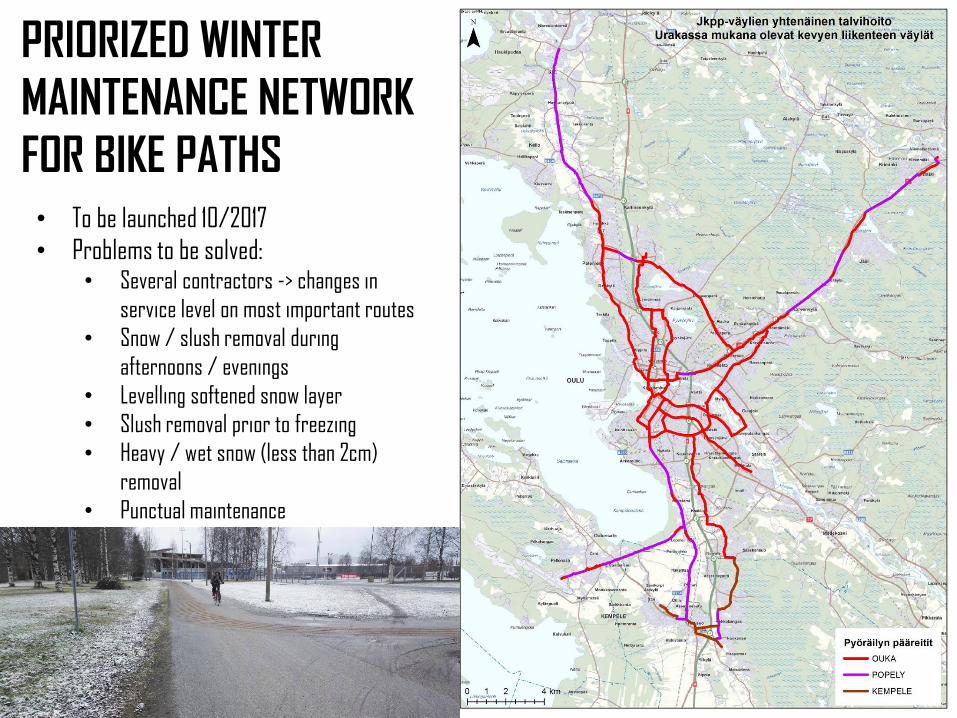
PRIORIZED WINTER
MAINTENANCE NETWORK
FOR BIKE PATHS• To be launched 10/2017
• Problems to be solved:• Several contractors -> changes in
service level on most important routes
• Snow / slush removal during
afternoons / evenings
• Levelling softened snow layer
• Slush removal prior to freezing
• Heavy / wet snow (less than 2cm)
removal
• Punctual maintenance
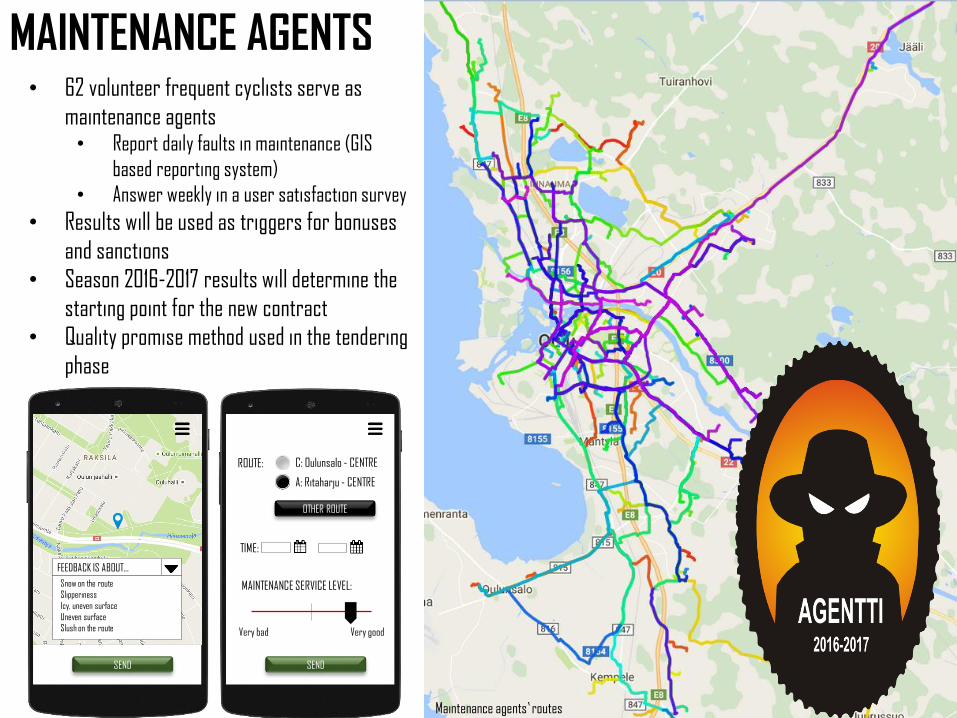
MAINTENANCE AGENTS• 62 volunteer frequent cyclists serve as
maintenance agents • Report daily faults in maintenance (GIS
based reporting system)
• Answer weekly in a user satisfaction survey
• Results will be used as triggers for bonuses
and sanctions
• Season 2016-2017 results will determine the
starting point for the new contract
• Quality promise method used in the tendering
phase
Very bad Very good
ROUTE: C: Oulunsalo - CENTRE
A: Ritaharju - CENTRE
OTHER ROUTE
SEND
TIME:
MAINTENANCE SERVICE LEVEL:
SEND
FEEDBACK IS ABOUT…
Snow on the route
Slipperiness
Icy, uneven surface
Uneven surface
Slush on the route
Maintenance agents’ routes
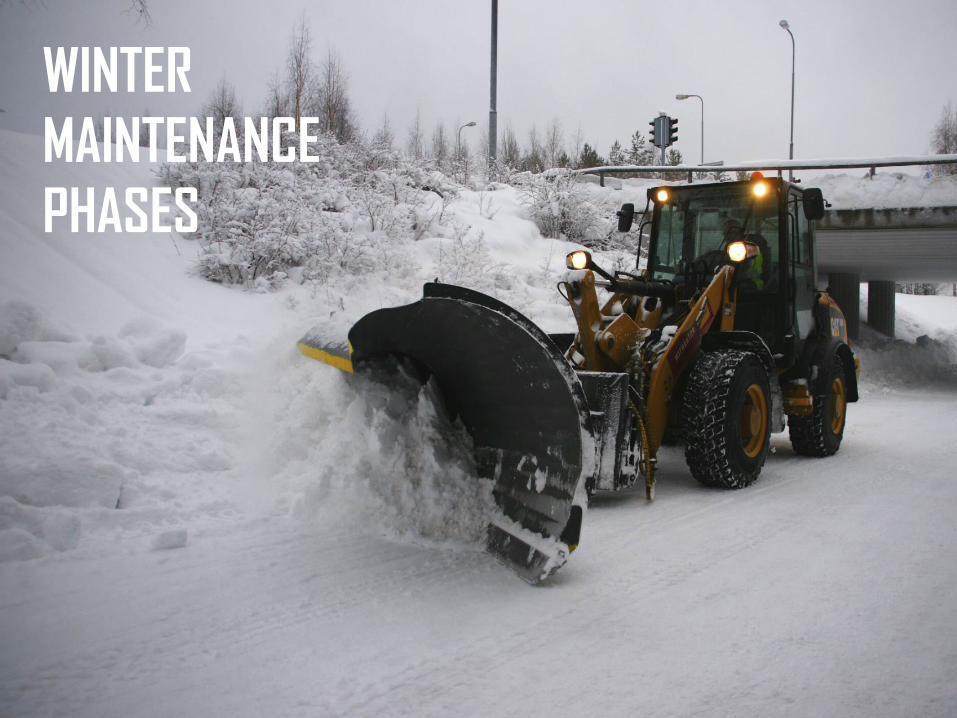
WINTER
MAINTENANCE
PHASES
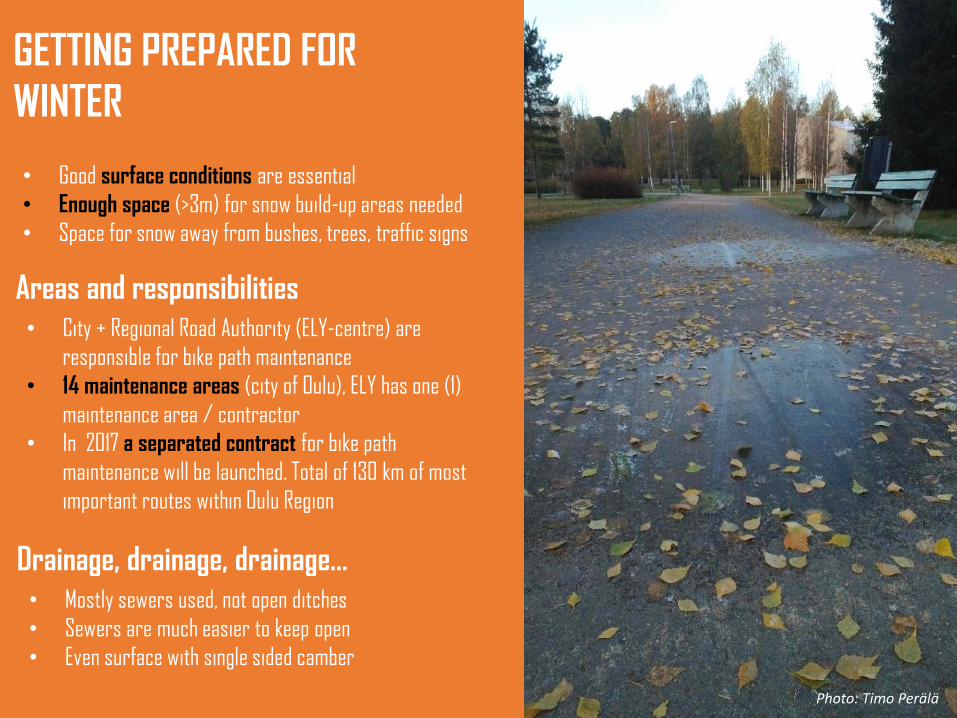
• Good surface conditions are essential
• Enough space (>3m) for snow build-up areas needed
• Space for snow away from bushes, trees, traffic signs
GETTING PREPARED FOR
WINTER
Drainage, drainage, drainage…• Mostly sewers used, not open ditches
• Sewers are much easier to keep open
• Even surface with single sided camber
Areas and responsibilities• City + Regional Road Authority (ELY-centre) are
responsible for bike path maintenance
• 14 maintenance areas (city of Oulu), ELY has one (1)
maintenance area / contractor
• In 2017 a separated contract for bike path
maintenance will be launched. Total of 130 km of most
important routes within Oulu Region
Photo: Timo Perälä
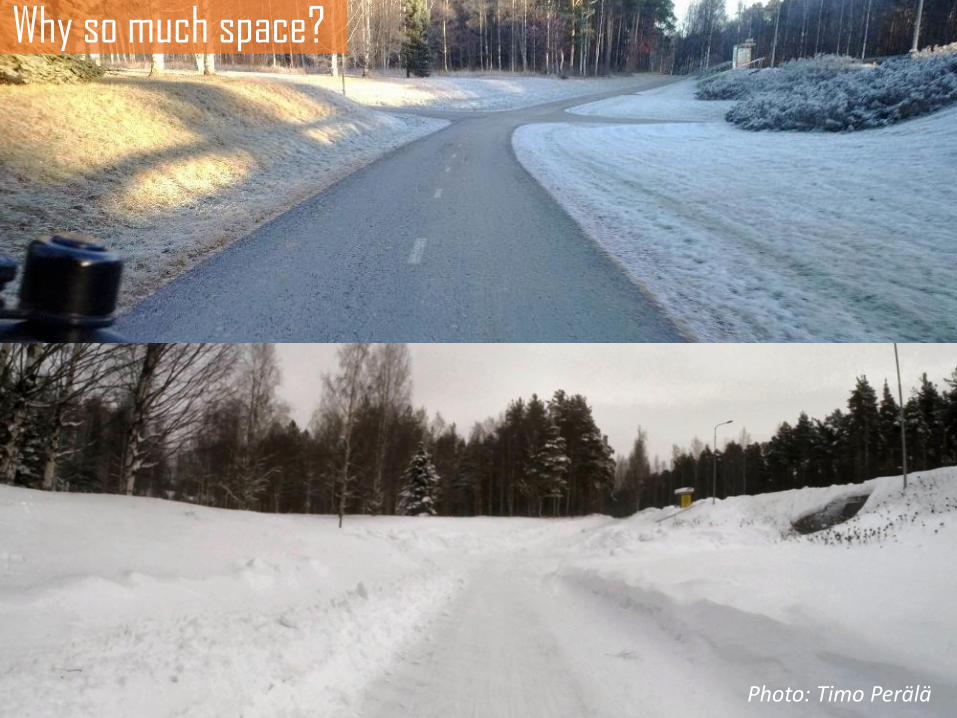
Why so much space?
Photo: Timo Perälä
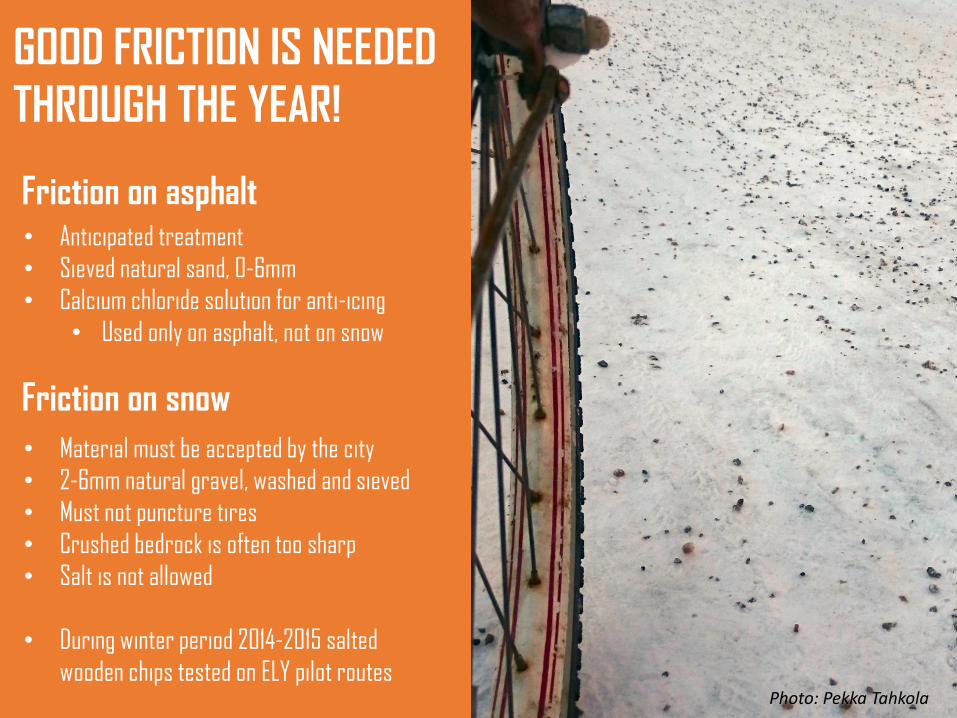
• Anticipated treatment
• Sieved natural sand, 0-6mm
• Calcium chloride solution for anti-icing
• Used only on asphalt, not on snow
Friction on asphalt
• Material must be accepted by the city
• 2-6mm natural gravel, washed and sieved
• Must not puncture tires
• Crushed bedrock is often too sharp
• Salt is not allowed
• During winter period 2014-2015 salted
wooden chips tested on ELY pilot routes
Friction on snow
Photo: Pekka Tahkola
GOOD FRICTION IS NEEDED
THROUGH THE YEAR!
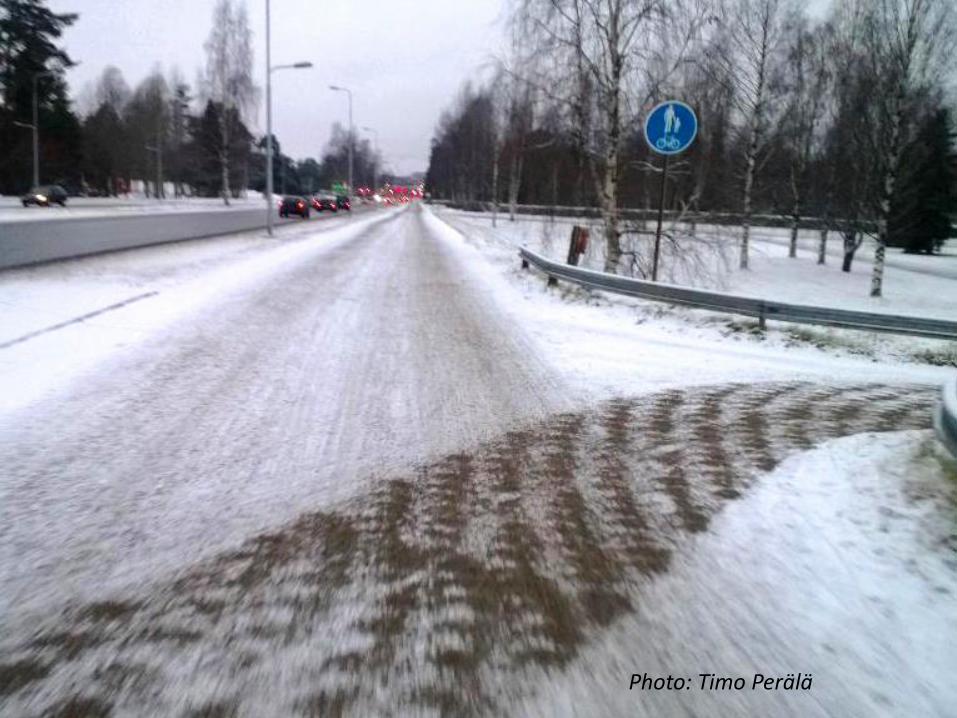
Photo: Timo Perälä
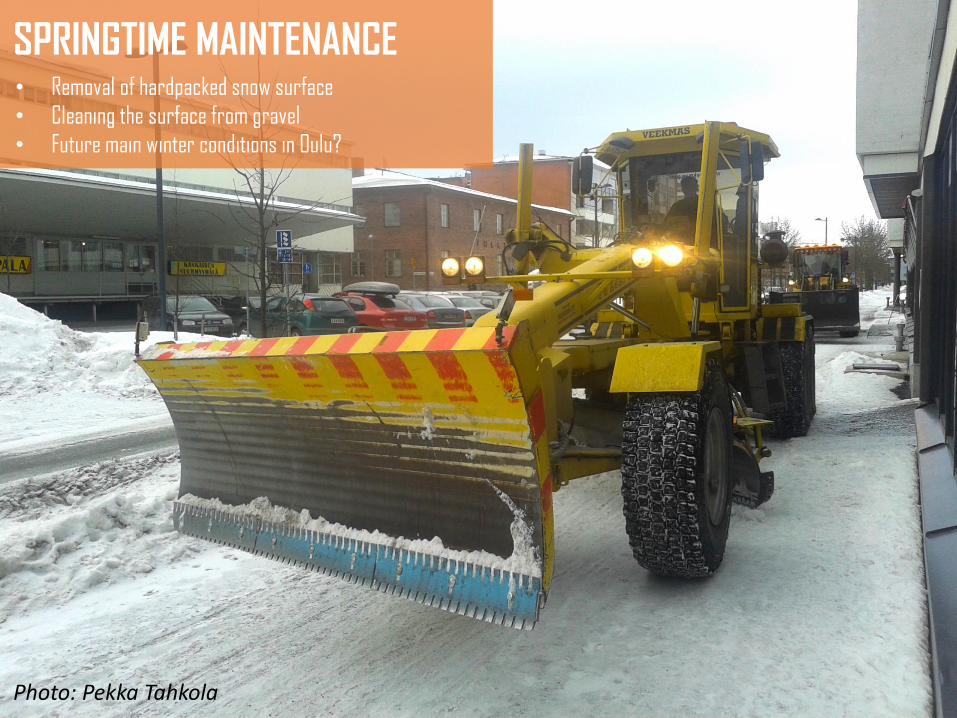
Photo: Pekka Tahkola
• Removal of hardpacked snow surface
• Cleaning the surface from gravel
• Future main winter conditions in Oulu?
SPRINGTIME MAINTENANCE
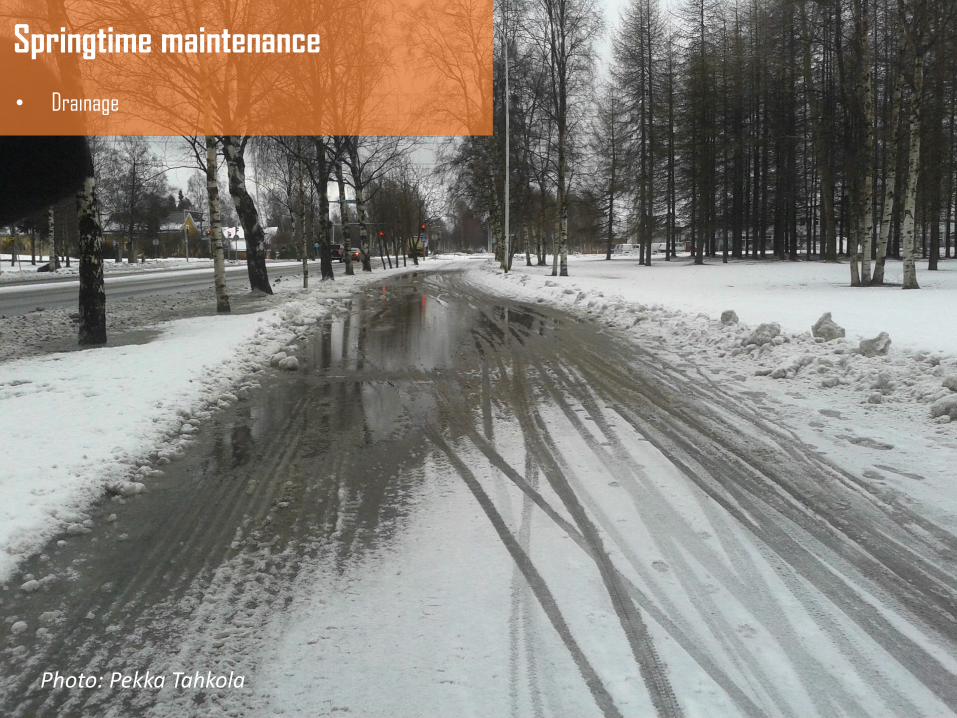
Photo: Pekka Tahkola
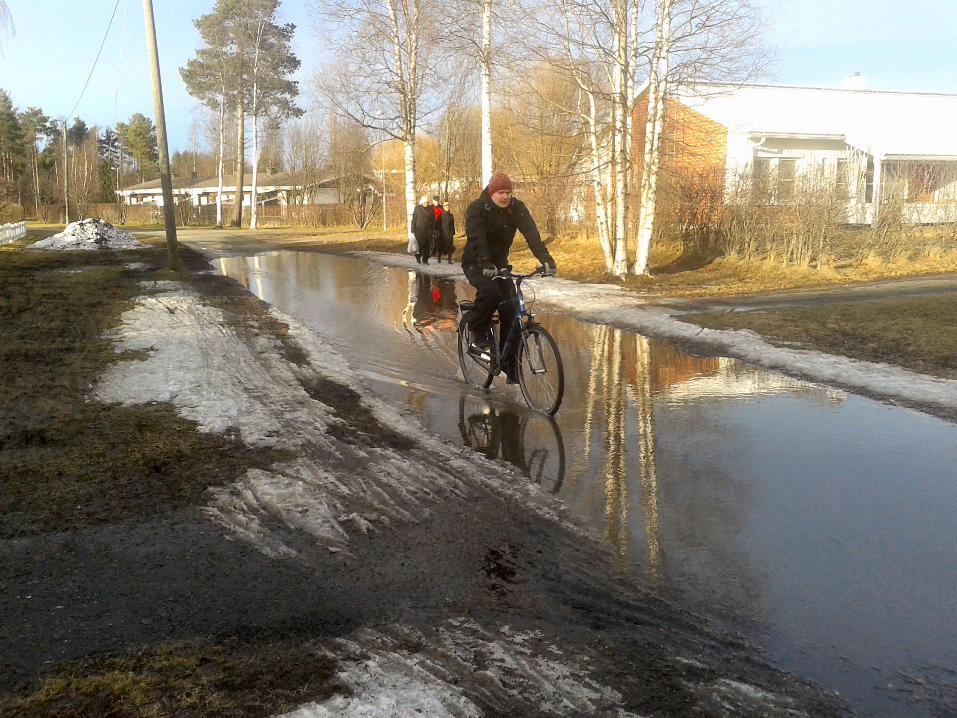
• Drainage
Springtime maintenance
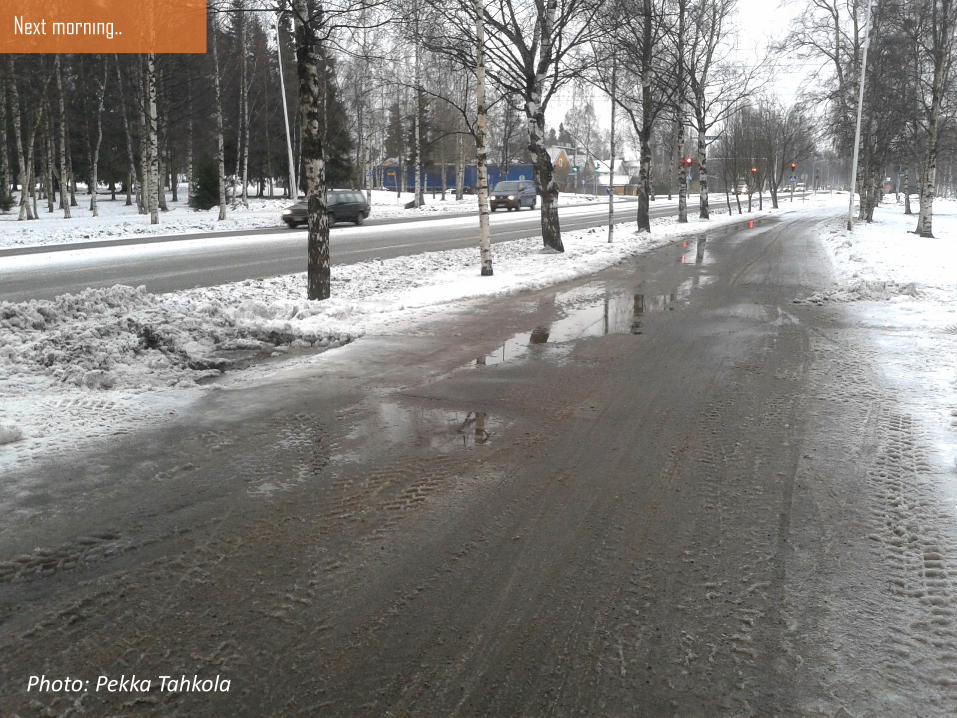
Photo: Pekka Tahkola
Next morning..
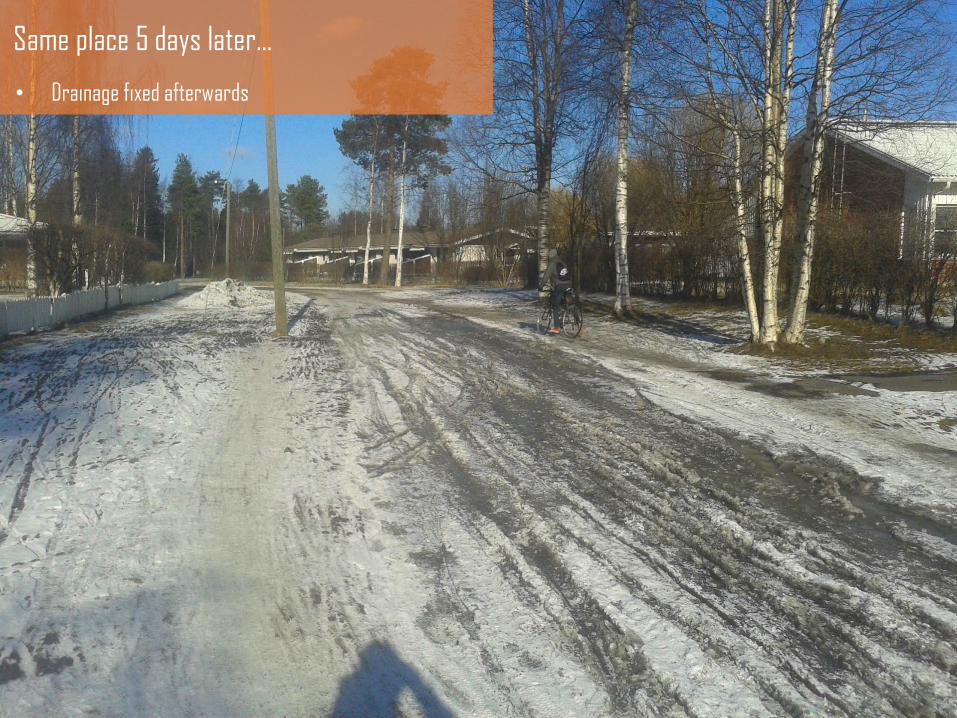
Same place 5 days later…
• Drainage fixed afterwards
© Pekka Tahkola
3. OULU CYCLING POLICIES
Cycling network, maintenance
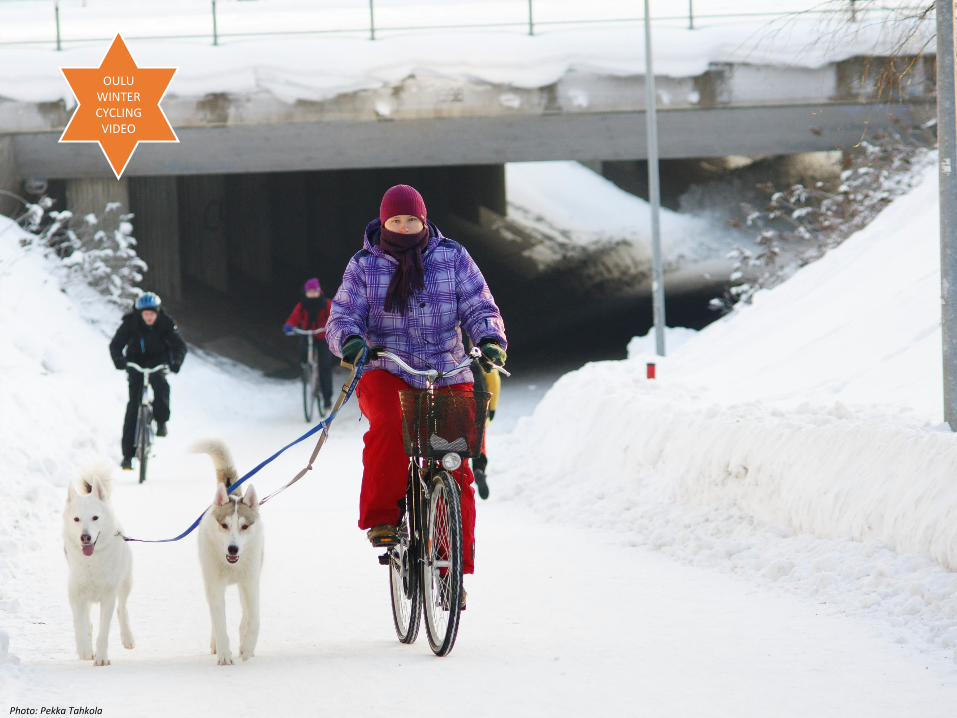
OULU WINTER MAINTENANCE
VIDEO
OULU CYCLING
COORDINATOR
4
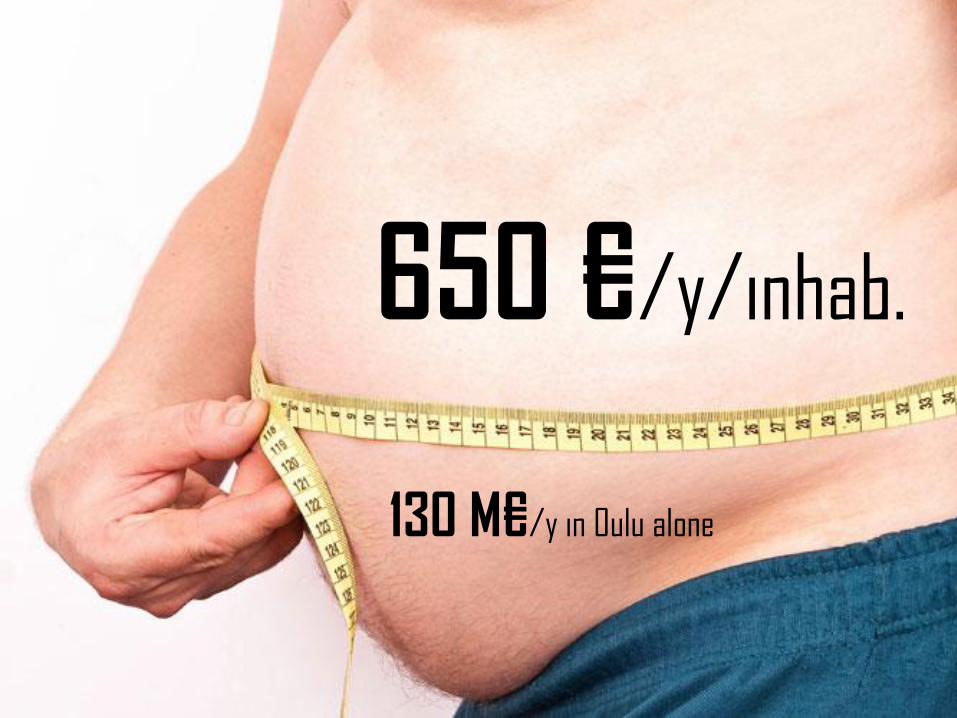
650 €/y/inhab.
130 M€/y in Oulu alone
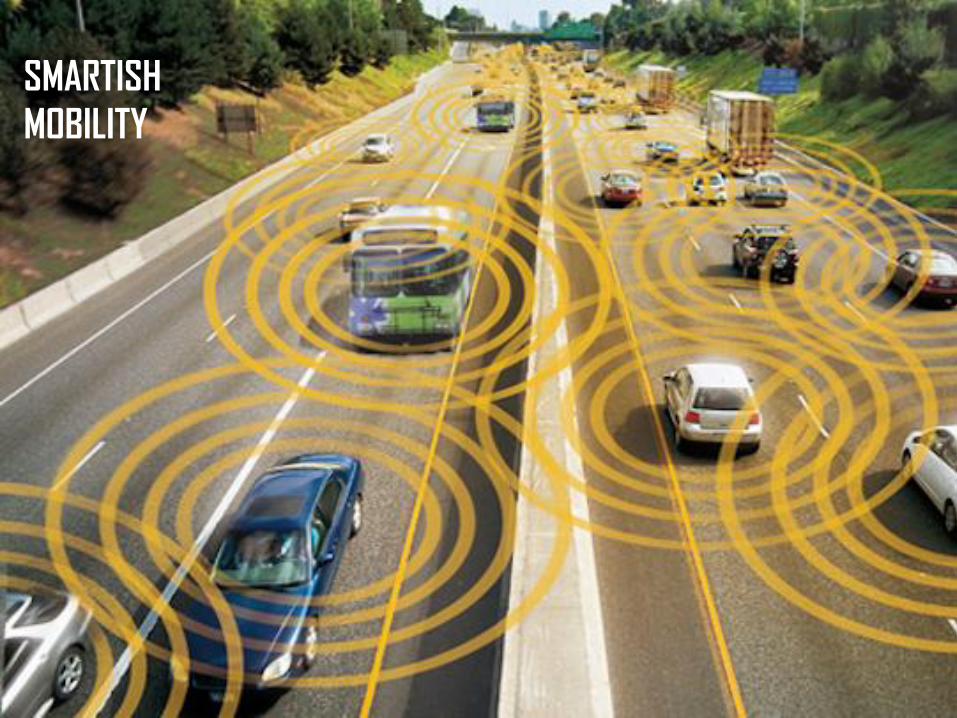
SMARTISH
MOBILITY
SMART
MOBILITY,
INNOVATIONS
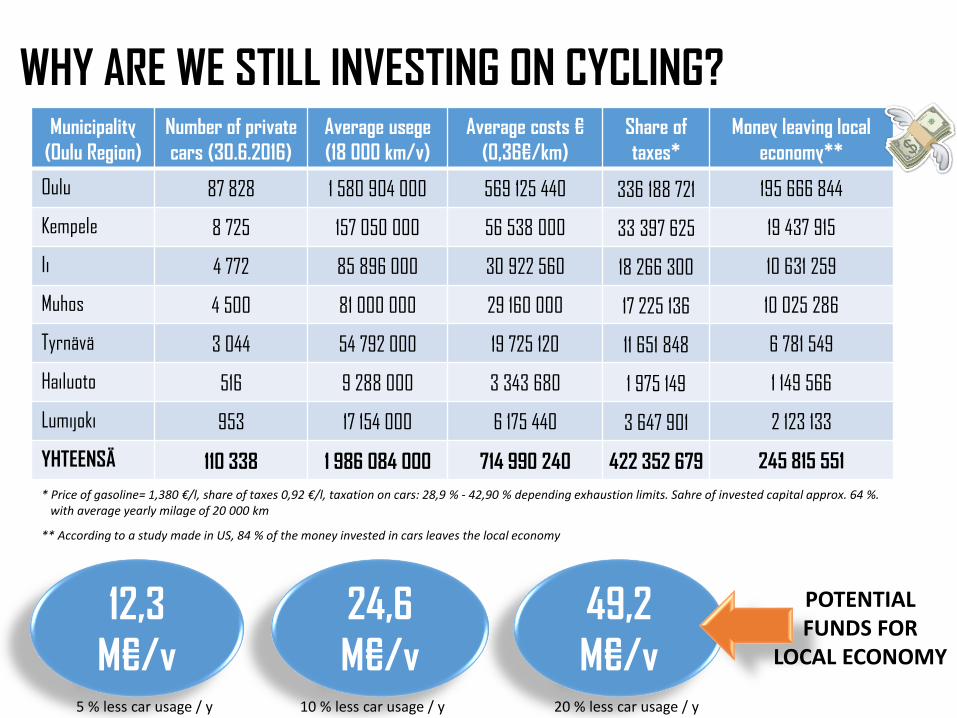
Municipality
(Oulu Region)
Number of private
cars (30.6.2016)
Average usege
(18 000 km/v)
Average costs €
(0,36€/km)
Share of
taxes*
Money leaving local
economy**
Oulu 87 828 1 580 904 000 569 125 440 336 188 721 195 666 844
Kempele 8 725 157 050 000 56 538 000 33 397 625 19 437 915
Ii 4 772 85 896 000 30 922 560 18 266 300 10 631 259
Muhos 4 500 81 000 000 29 160 000 17 225 136 10 025 286
Tyrnävä 3 044 54 792 000 19 725 120 11 651 848 6 781 549
Hailuoto 516 9 288 000 3 343 680 1 975 149 1 149 566
Lumijoki 953 17 154 000 6 175 440 3 647 901 2 123 133
YHTEENSÄ 110 338 1 986 084 000 714 990 240 422 352 679 245 815 551
WHY ARE WE STILL INVESTING ON CYCLING?
* Price of gasoline= 1,380 €/l, share of taxes 0,92 €/l, taxation on cars: 28,9 % - 42,90 % depending exhaustion limits. Sahre of invested capital approx. 64 %. with average yearly milage of 20 000 km
** According to a study made in US, 84 % of the money invested in cars leaves the local economy
12,3
M€/v
24,6
M€/v
49,2
M€/v5 % less car usage / y 10 % less car usage / y 20 % less car usage / y
POTENTIALFUNDS FOR
LOCAL ECONOMY
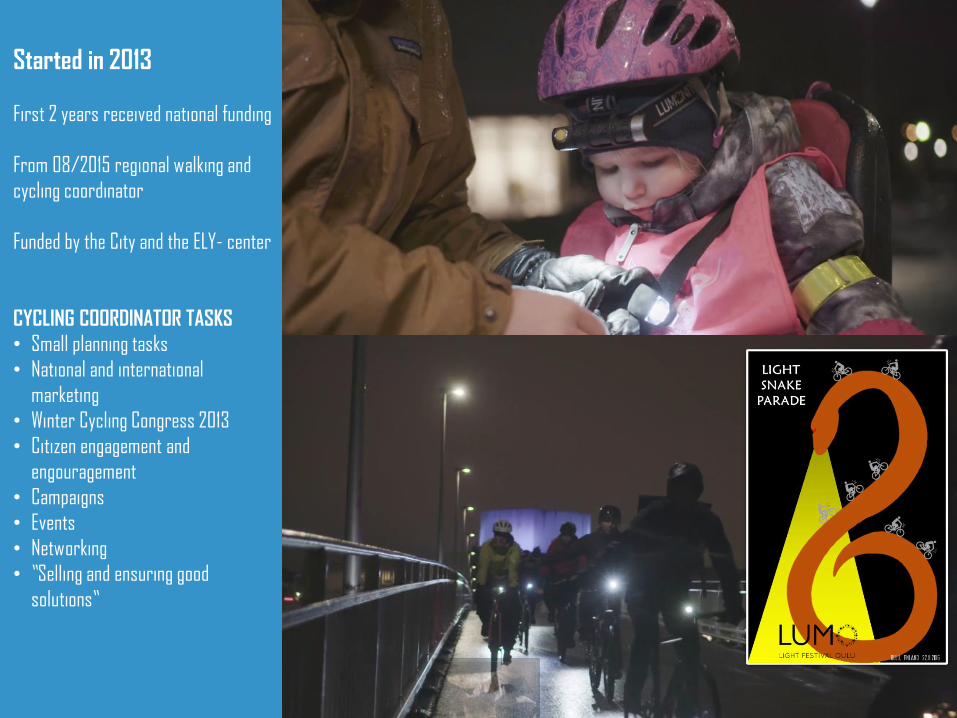
Started in 2013
First 2 years received national funding
From 08/2015 regional walking and
cycling coordinator
Funded by the City and the ELY- center
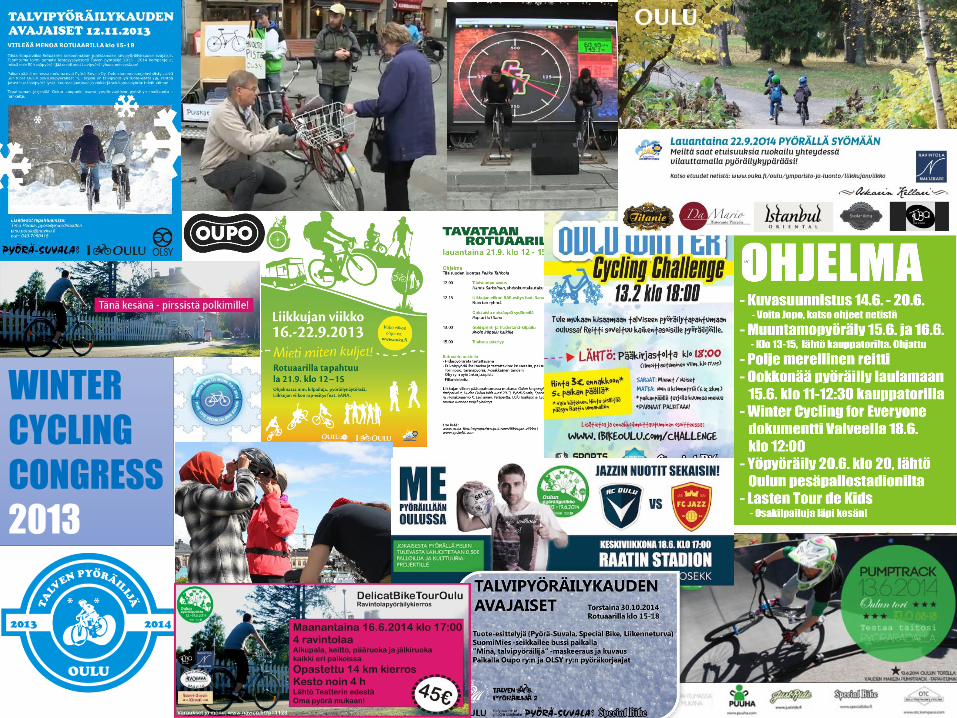
CYCLING COORDINATOR TASKS
• Small planning tasks
• National and international
marketing
• Winter Cycling Congress 2013
• Citizen engagement and
engouragement
• Campaigns
• Events
• Networking
• ”Selling and ensuring good
solutions”
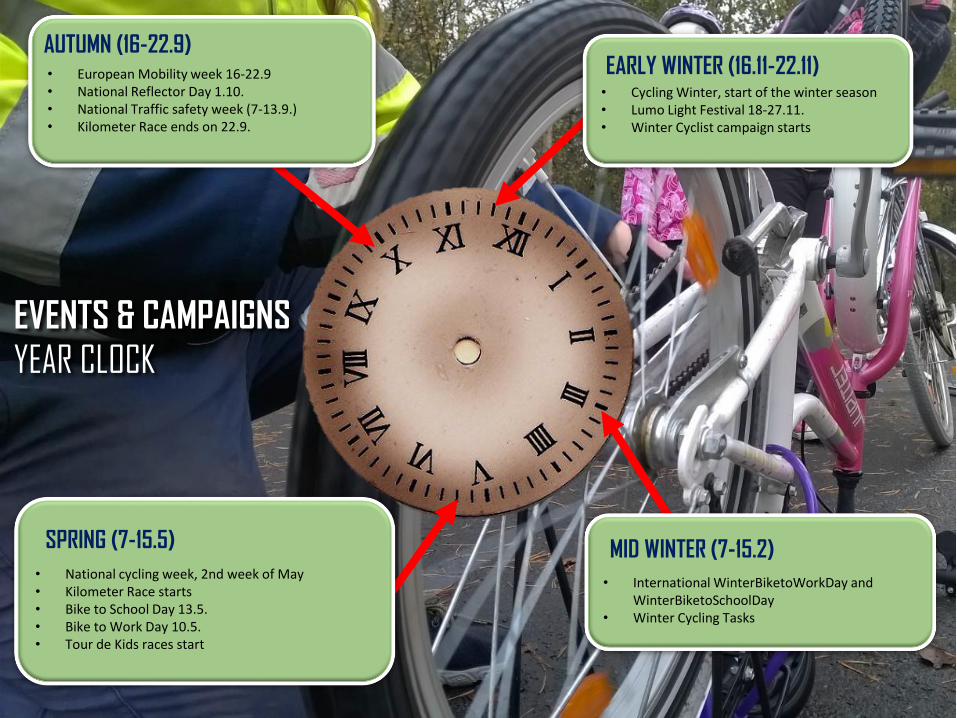
• European Mobility week 16-22.9• National Reflector Day 1.10.• National Traffic safety week (7-13.9.)• Kilometer Race ends on 22.9.
AUTUMN (16-22.9)
• International WinterBiketoWorkDay and WinterBiketoSchoolDay
• Winter Cycling Tasks
MID WINTER (7-15.2)• National cycling week, 2nd week of May• Kilometer Race starts• Bike to School Day 13.5.• Bike to Work Day 10.5.• Tour de Kids races start
SPRING (7-15.5)
• Cycling Winter, start of the winter season• Lumo Light Festival 18-27.11.• Winter Cyclist campaign starts
EARLY WINTER (16.11-22.11)
EVENTS & CAMPAIGNS
YEAR CLOCK
WINTER
CYCLING
CONGRESS
2013
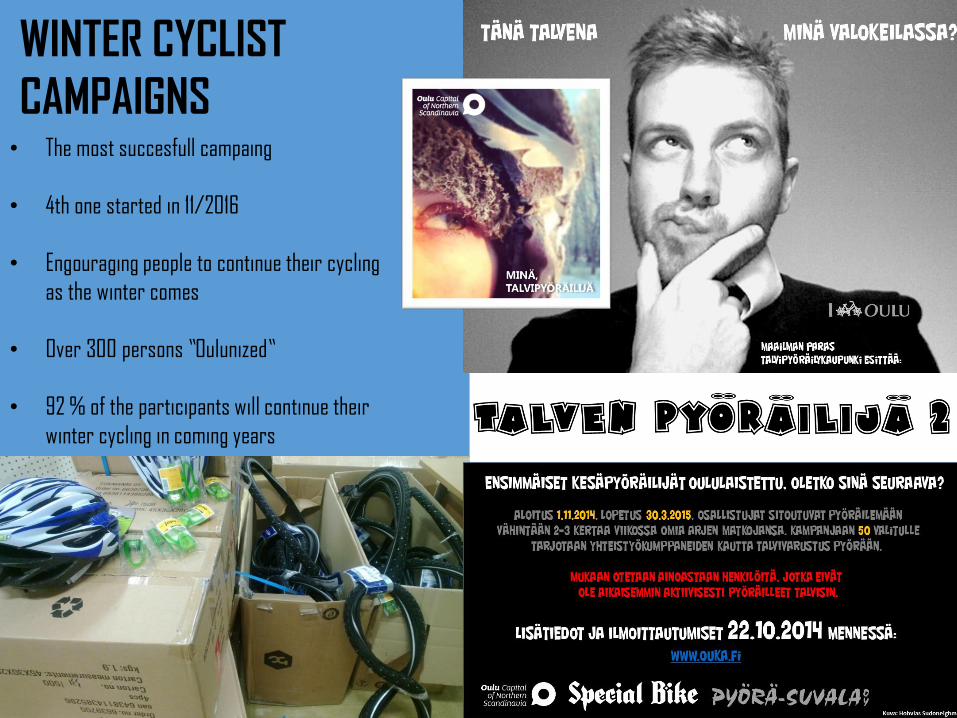
• The most succesfull campaing
• 4th one started in 11/2016
• Engouraging people to continue their cycling
as the winter comes
• Over 300 persons ”Oulunized”
• 92 % of the participants will continue their
winter cycling in coming years
WINTER CYCLIST
CAMPAIGNS
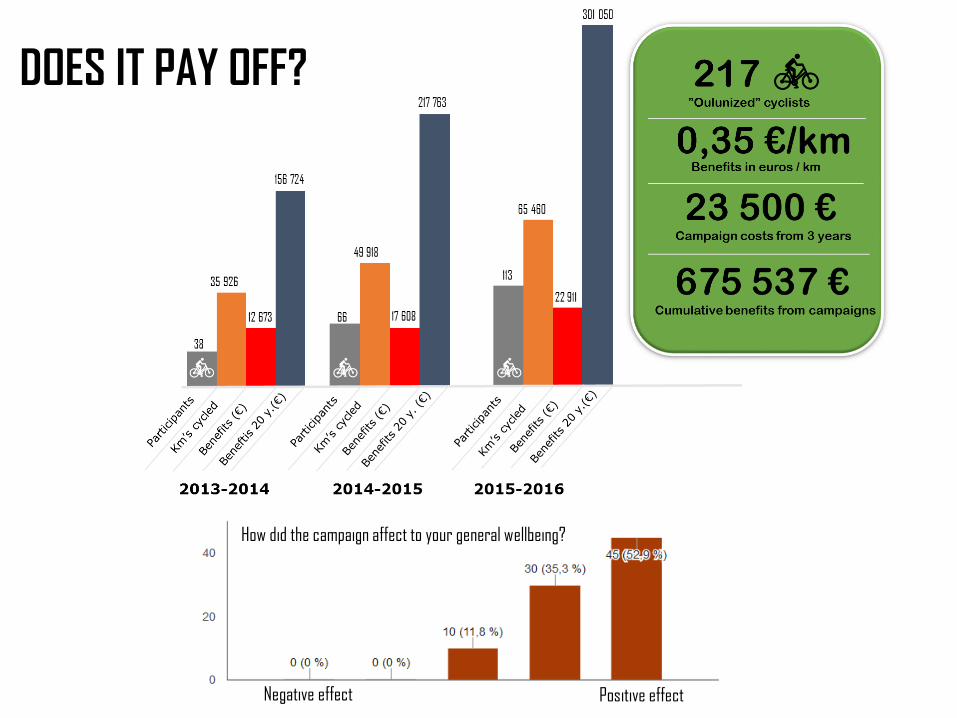
DOES IT PAY OFF?
How did the campaign affect to your general wellbeing?
Negative effect Positive effect
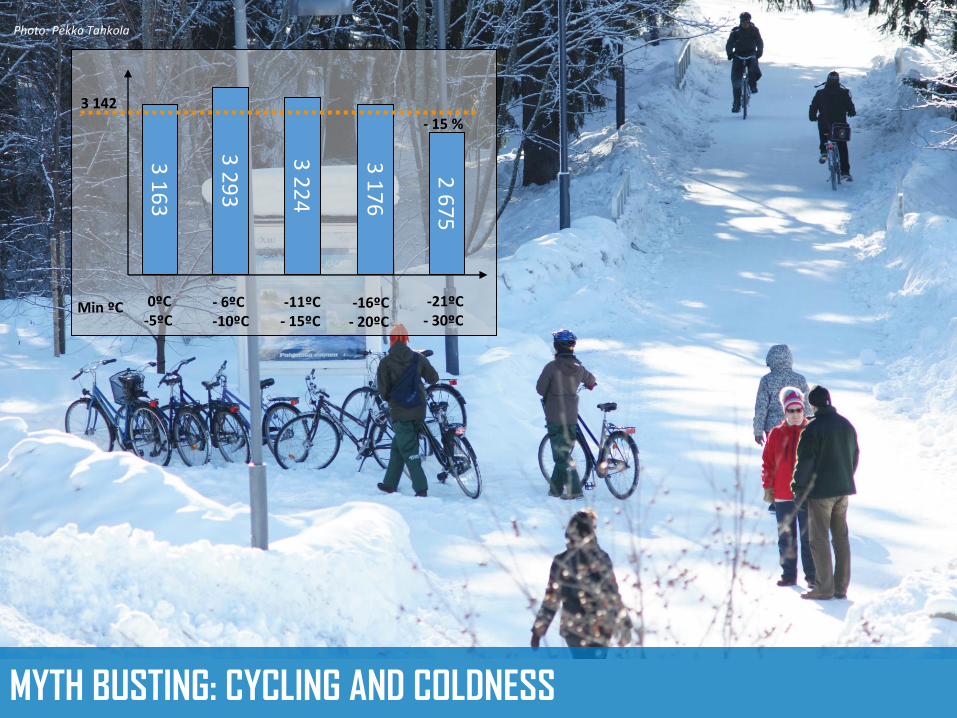
MYTH BUSTING: CYCLING AND COLDNESS
Photo: Pekka Tahkola
0ºC -5ºC
- 6ºC -10ºC
-11ºC - 15ºC
-16ºC - 20ºC
-21ºC - 30ºC
3 1
63
3 2
93
3 2
24
3 142
3 1
76
2 6
75
- 15 %
Min ºC
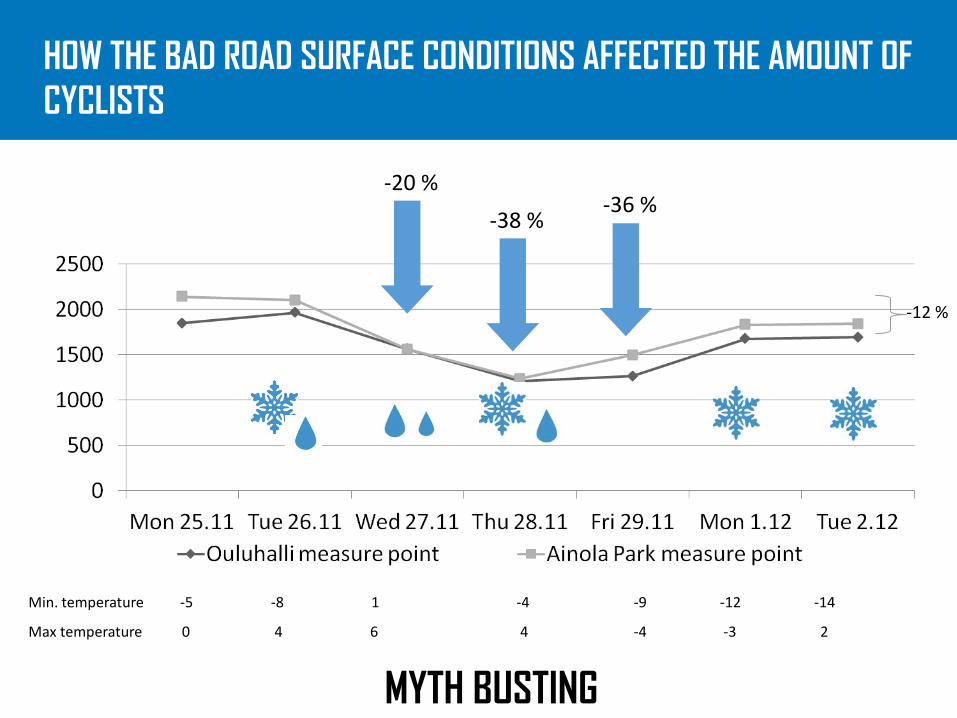
HOW THE BAD ROAD SURFACE CONDITIONS AFFECTED THE AMOUNT OF
CYCLISTS
Min. temperature -5 -8 1 -4 -9 -12 -14
Max temperature 0 4 6 4 -4 -3 2
-38 %-36 %
-20 %
-12 %
MYTH BUSTING
LINNANMAA
KESKUSTA
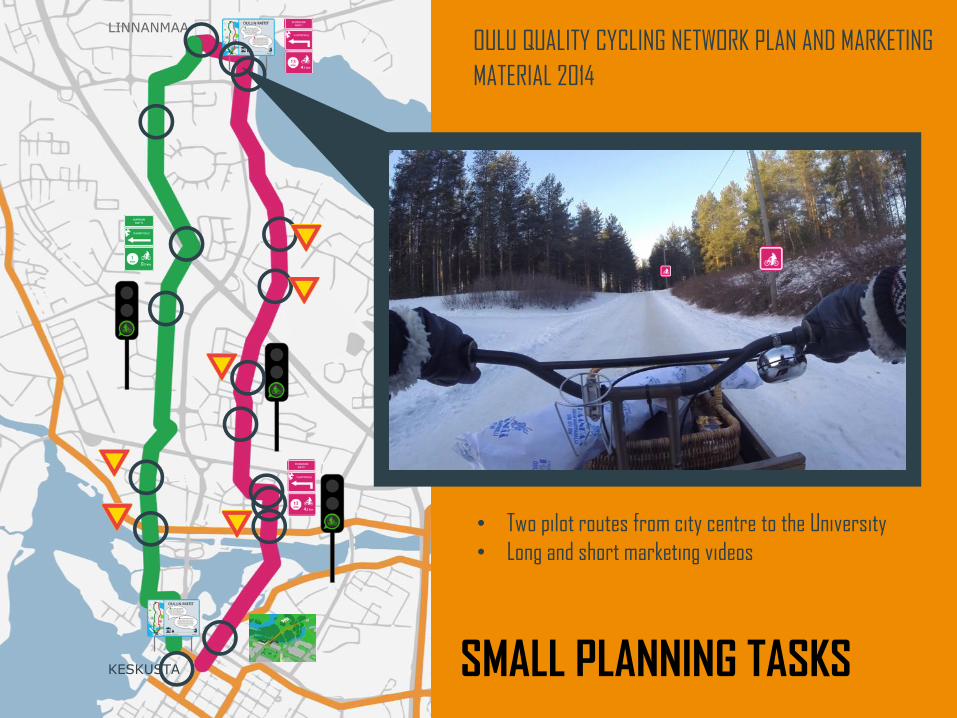
OULU QUALITY CYCLING NETWORK PLAN AND MARKETING
MATERIAL 2014
• Two pilot routes from city centre to the University
• Long and short marketing videos
SMALL PLANNING TASKS
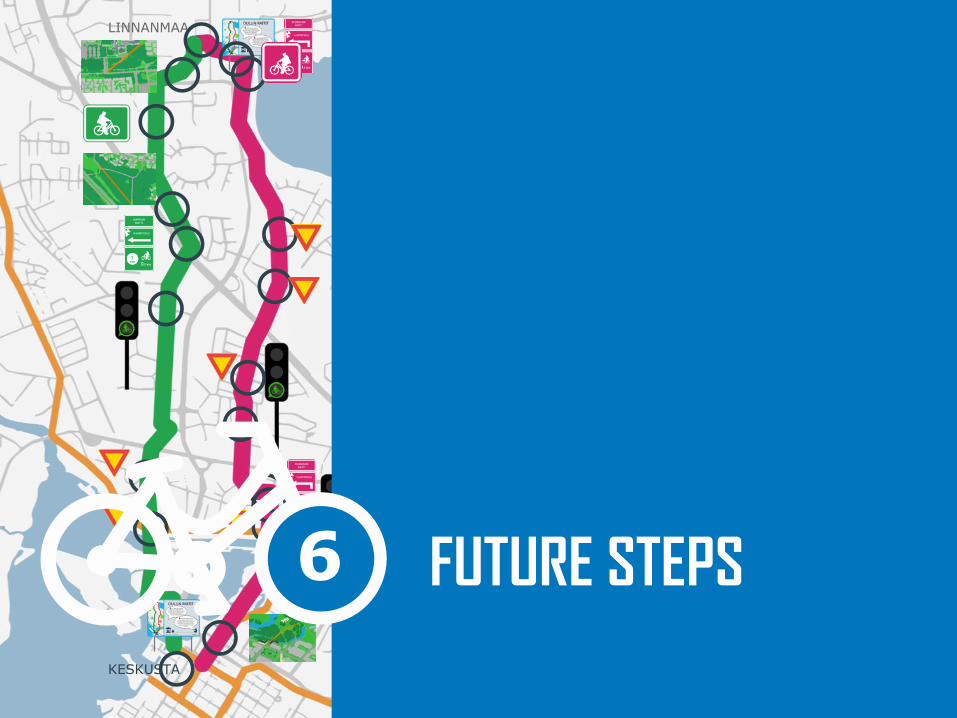
LINNANMAA
KESKUSTA
FUTURE STEPS6
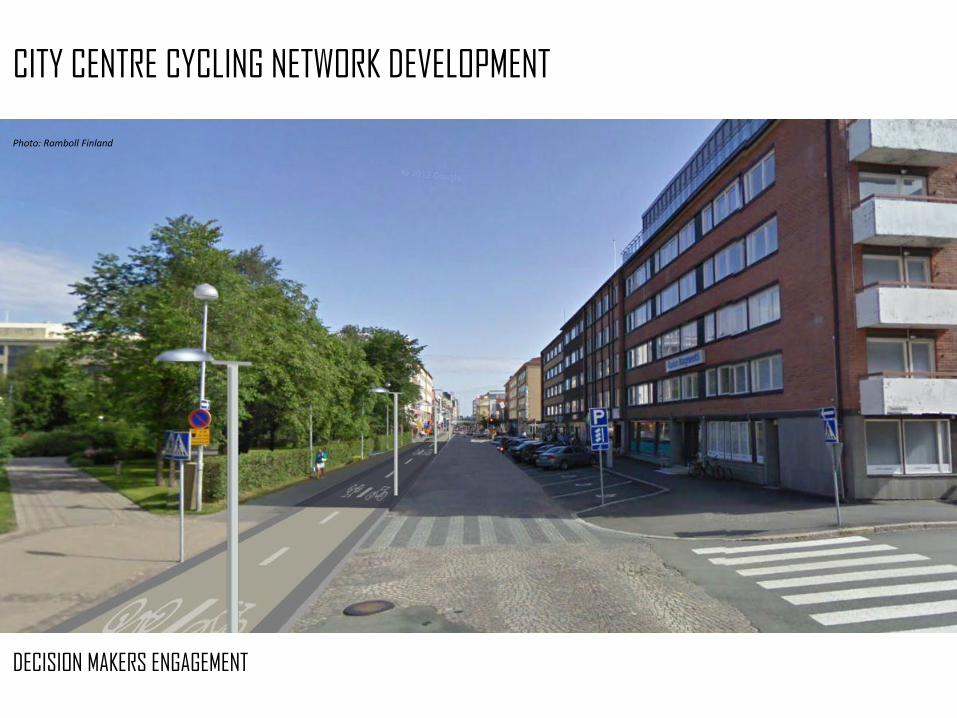
CITY CENTRE CYCLING NETWORK DEVELOPMENT
DECISION MAKERS ENGAGEMENT
Photo: Ramboll Finland
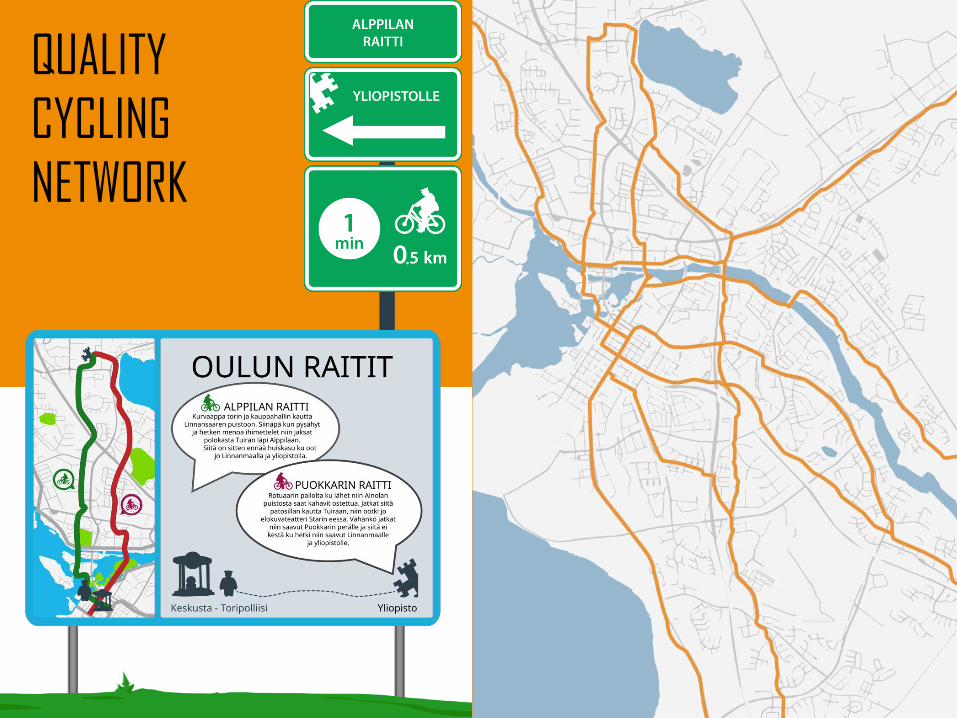
QUALITY
CYCLING
NETWORK
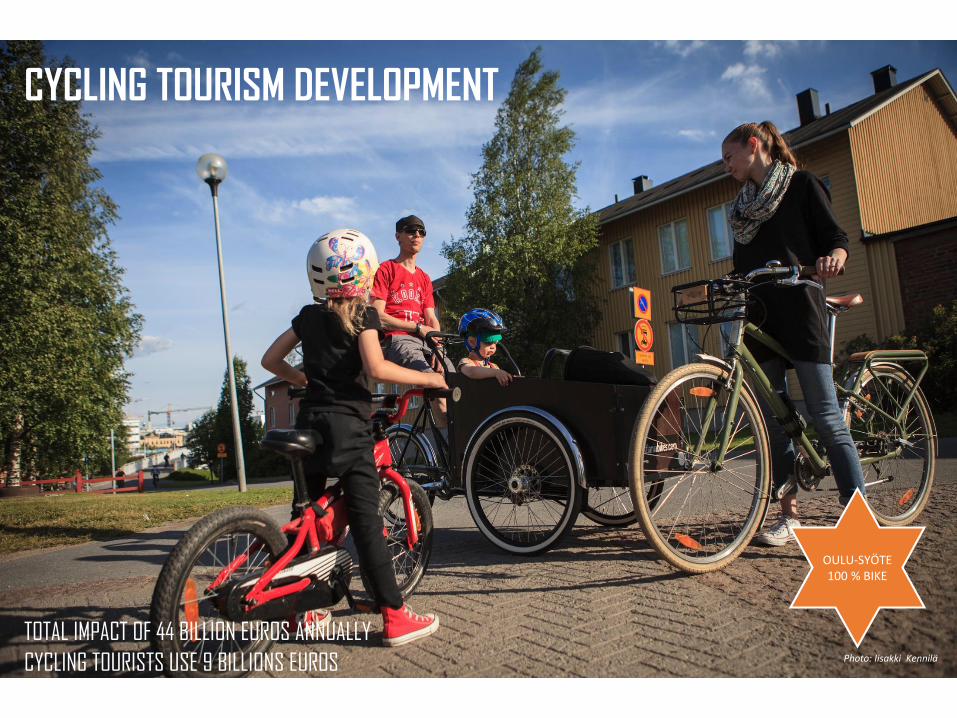
OULU-SYÖTE100 % BIKE
CYCLING TOURISM DEVELOPMENT
TOTAL IMPACT OF 44 BILLION EUROS ANNUALLY
CYCLING TOURISTS USE 9 BILLIONS EUROS Photo: Iisakki Kennilä
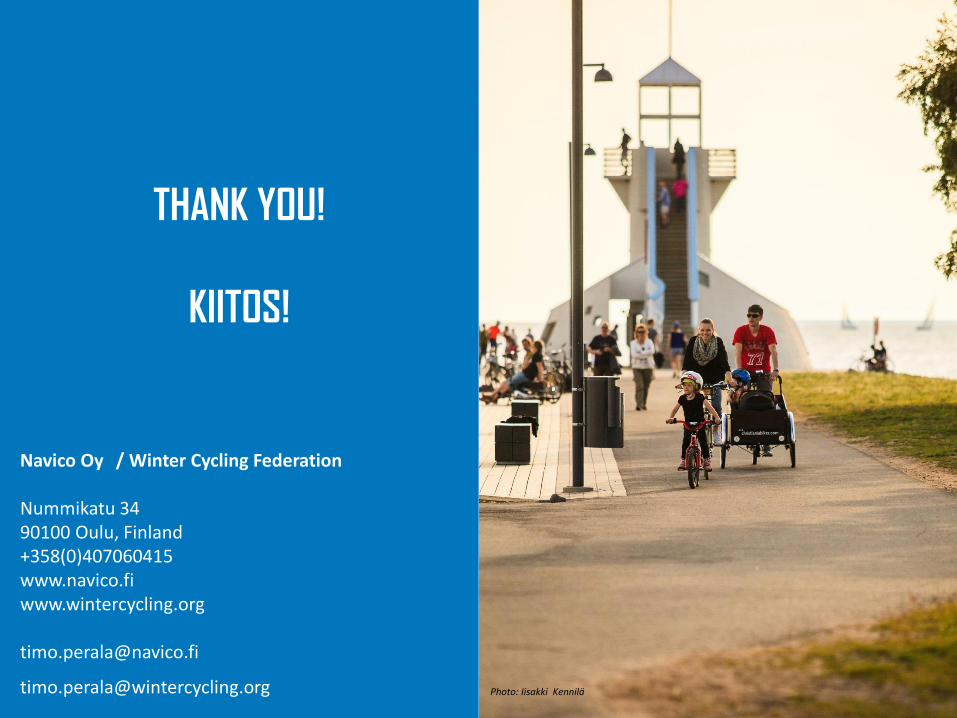
Navico Oy / Winter Cycling Federation
Nummikatu 3490100 Oulu, Finland+358(0)407060415www.navico.fiwww.wintercycling.org
THANK YOU!
KIITOS!
Photo: Iisakki Kennilä