village of mundelein water reclamation … · water reclamation facility chemical phosphorus...
TRANSCRIPT
VILLAGE OF MUNDELEIN WATER RECLAMATION FACILITY
CHEMICAL PHOSPHORUS REMOVAL ENGINEERING DESIGN SERVICES
Owner:
Village of Mundelein Public Works and Engineering 440 East Crystal Street Mundelein, IL 60060

REQUEST FOR PROPOSALS The Village of Mundelein will receive sealed proposals for Design Services for Chemical Phosphorus Removal Improvements at the Mundelein Public Works and Engineering Complex #1, 440 East Crystal Street, Mundelein, IL until June 9, 2016 at 3 p.m.
Prospective bidders are encouraged to attend a Pre-Bid Meeting scheduled for Wednesday, May 31, 2016 at 2:00 p.m. at the Mundelein Water Reclamation Facility at 1610 S. Milwaukee Avenue, Libertyville, IL to review the scope of the work and the project specifications.
Bidders must submit a firm proposal. The outside of the proposal must clearly identify the firm, individual, or organization that is submitting the proposal. All proposals must be accompanied by a Bid Bond, Certified Check, or Bank Cashier’s Check made payable to the Village of Mundelein, in the amount of $5,000.
Relevant portions of "An Act to Prohibit Discrimination and Intimidation on Account of Race or Color in Employment under Contracts for Public Buildings or Public Works", approved July 8, 1933, as amended, "Fair Employment Practices Act", approved July 21, 1961, as amended and "The Prevailing Wage Act", Illinois Revised Statutes, as amended. (Contract Provisions required by Section 85.38 of the Code of Federal Regulations, US Department of Housing and Urban Development apply to this proposal.)
Contractor understands the Illinois Freedom of Information Act requiring the Contractor to produce to the Requester any of its company records and documents which are in any way related to the performance of services under this agreement and not exempt from disclosure within five business days of the Village’s receipt of a request for said records. The Contractor agrees to be bound by the provisions of the Illinois Freedom of Information Act and agrees to deliver to the Village all records in its possession relating to this agreement within three (3) business days of a request by the Village for said records. Contractor agrees to reimburse the Village any fees, fines, or costs incurred by or assessed against the Village for its failure to deliver requested records in the possession of the Contractor, and which the Contractor failed to deliver to the Village within three (3) business days of its receipt of a request from the Village to do so. An e-mail request for records and documents will be considered received by the Contractor on the day sent.
Proposal Documents may be obtained through the following:
1. Internet at http://www.mundelein.org/bidsproposals/bidsproposals.htm- no charge Any questions regarding the proposal specifications can be directed to:
Paul Cacioppo, Wastewater Superintendent 1610 S. Milwaukee Av. Libertyville, IL 60048 (847) 949-3275 [email protected]
Bidders must execute all signatures where required on their submitted proposals. Bidders need not return the entire contract proposal when proposals are submitted unless otherwise required. Portions of the proposal that must be returned include the following:
1. Business Disclosure Statement 2. Proposal/Schedule of Prices
The Village of Mundelein reserves the right to waive any irregularities and technicalities, and to accept or reject any or all bids or any part thereof.
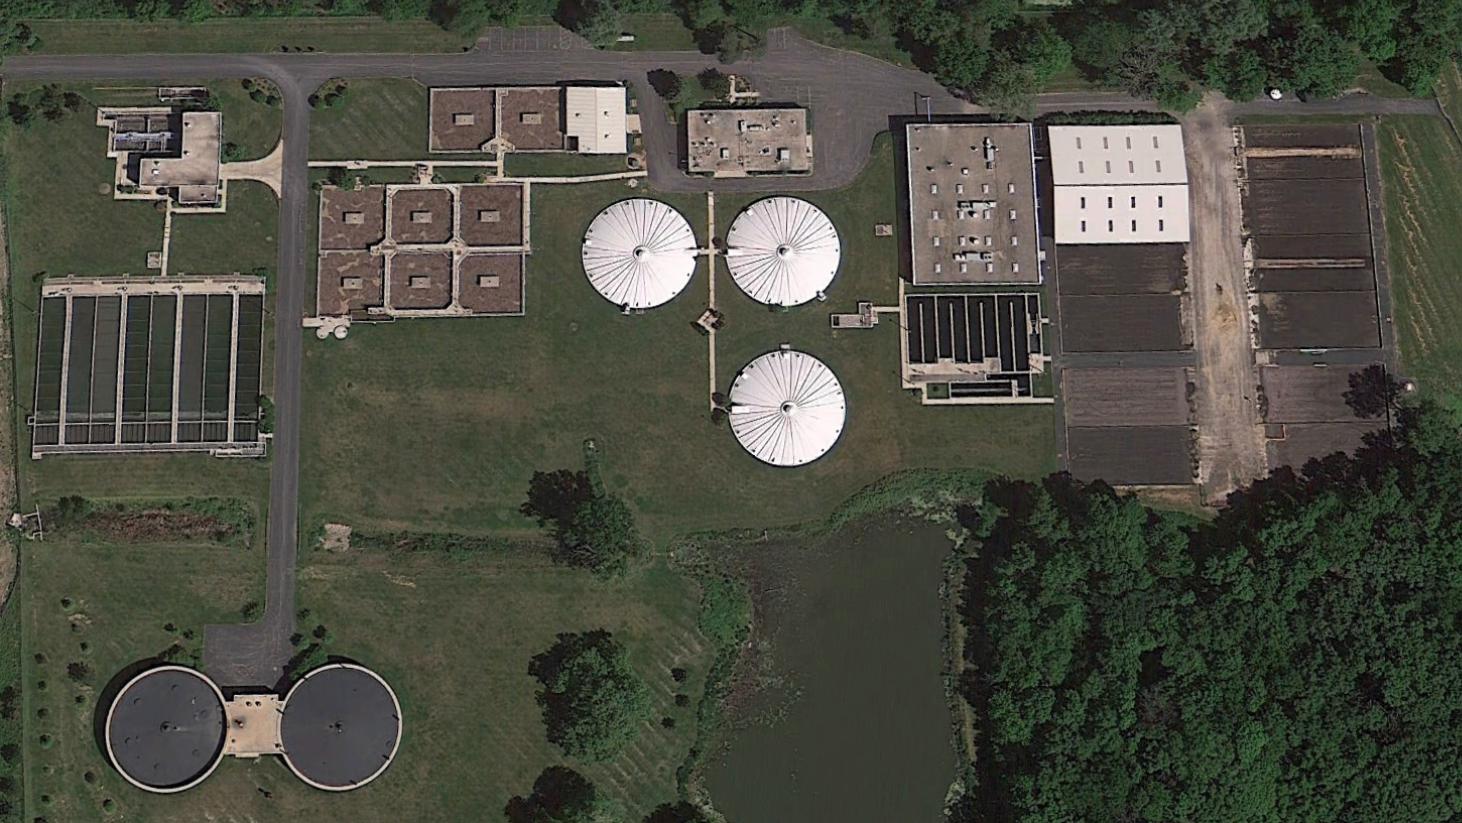
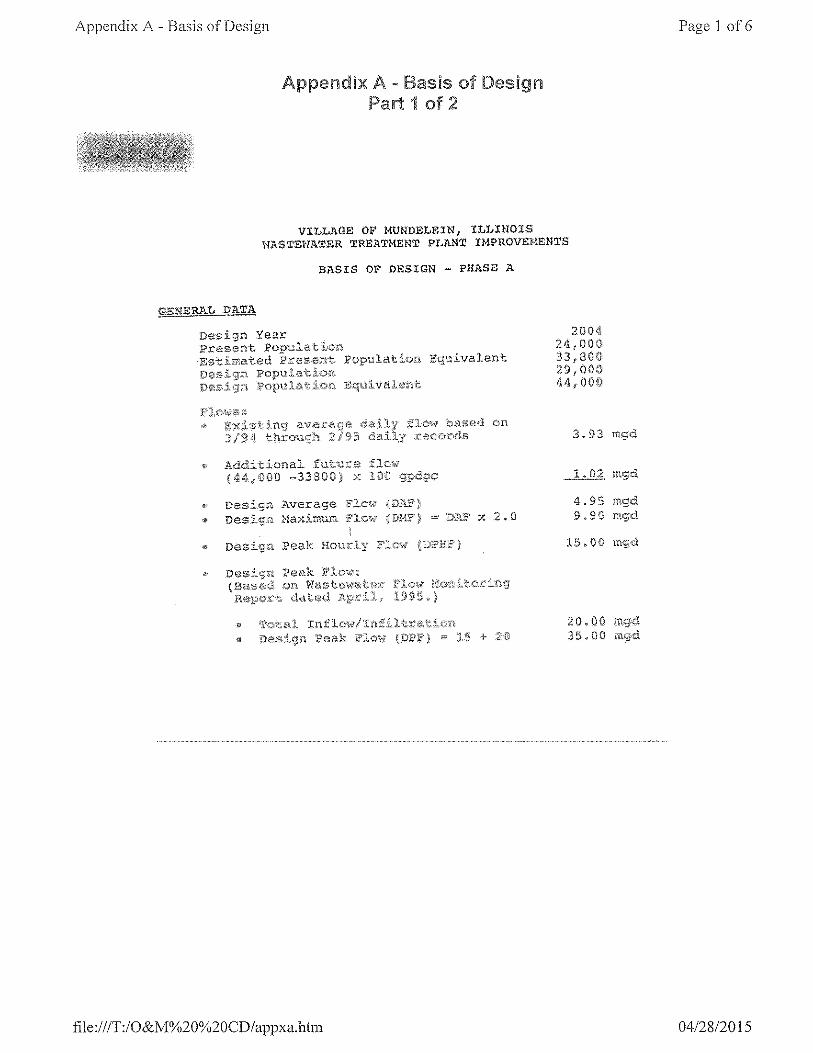
INSTRUCTIONS TO BIDDERS DESCRIPTION OF FACILITY The Village of Mundelein operates an activated sludge sewage treatment plant with tertiary treatment that discharges to the Des Plaines River. The design average flow for the facility is 4.95 million gallons per day (MGD). The facility is located on land owned by the Village surrounded by the Village of Libertyville, approximately 1.8 miles from the Village boundary. Wastewater is conveyed to the sewage treatment plant through a 36-inch sewer.
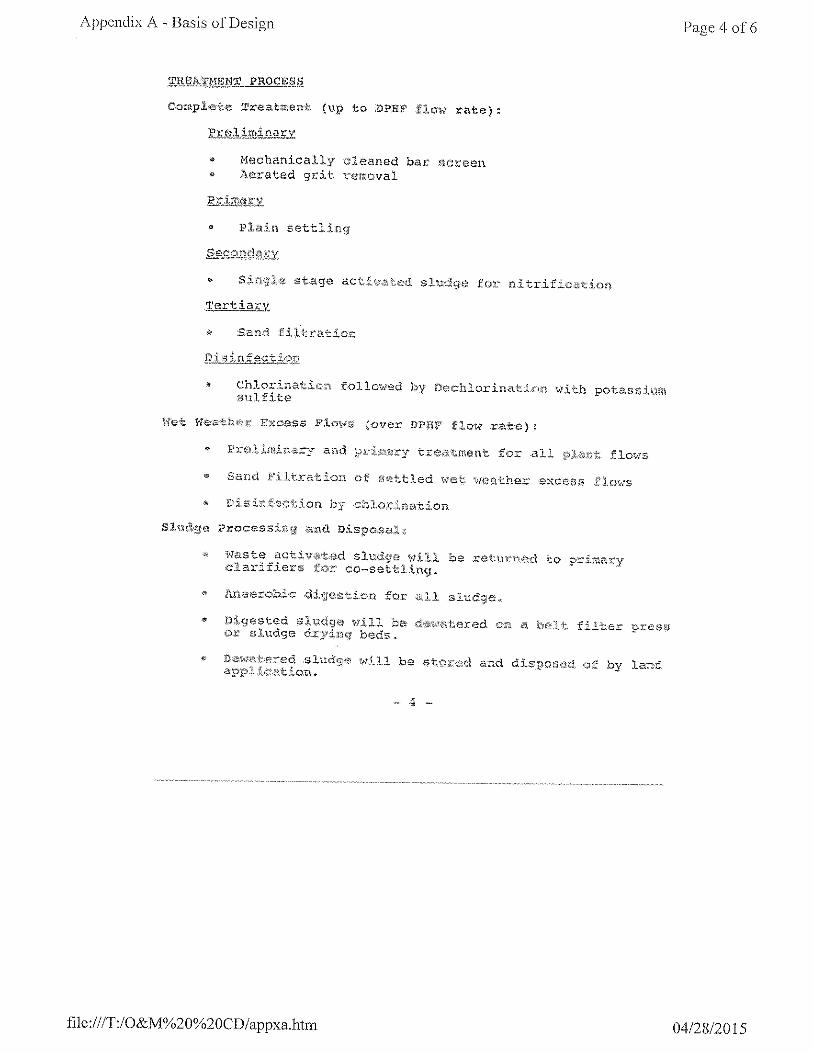
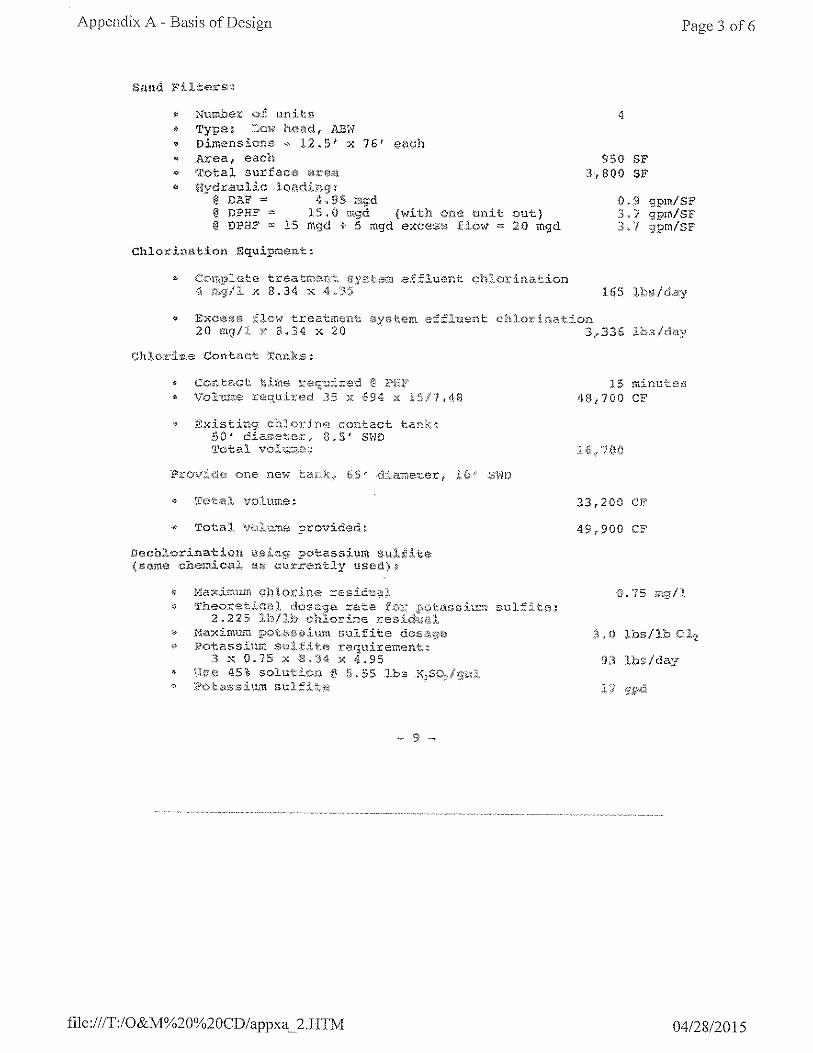
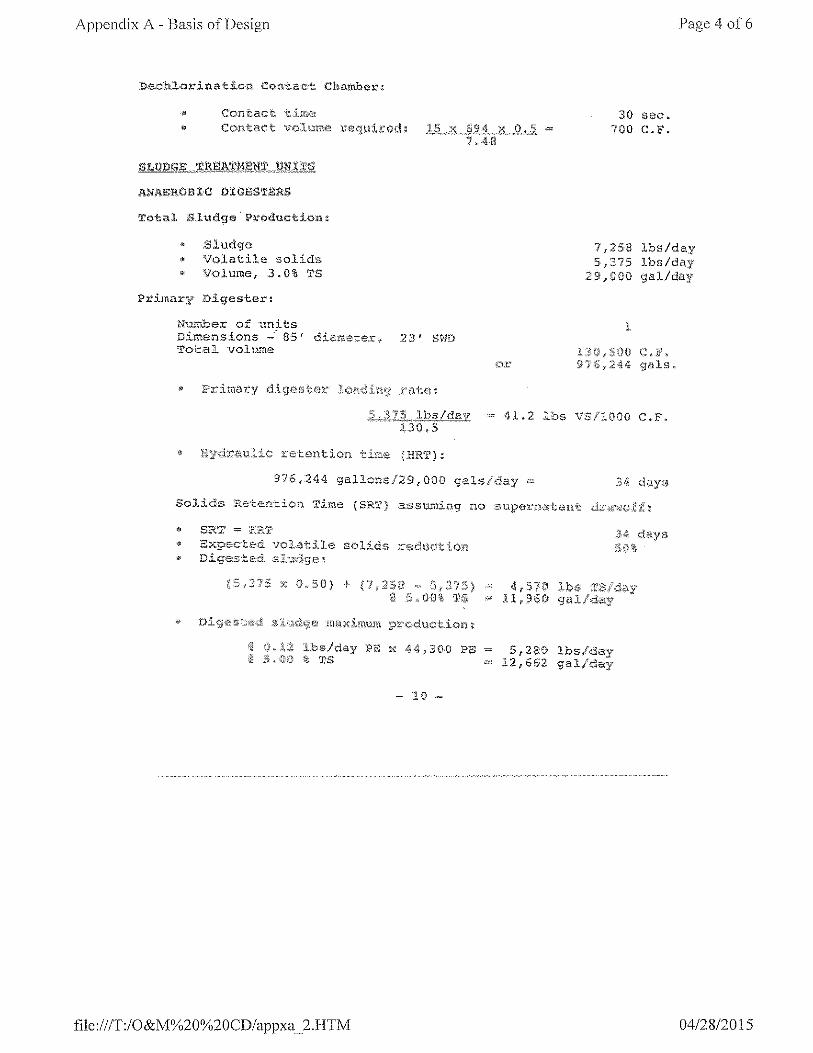
Forward flow treatment consists of mechanical fine screening, aerated grit removal, primary clarification, diffused air activated sludge, final clarification, sand filtration, chlorine disinfection, and dechlorination before discharge to the Des Plaines River. Biosolids management includes anaerobic digestion of mixed primary and waste activated sludge (WAS) and dewatering of digested sludge using sludge drying beds and a belt filter press (BFP), as needed. There is a dewatered cake storage structure on-site. Biogas generated during anaerobic digestion is used to fire a combination boiler/heat exchanger to provide heat for the digestion process.
SCOPE OF WORK The Village is seeking an experienced, responsible, capable and professional firm to provide technical consulting and design services to install chemical phosphorus removal facilities. The Consultant shall provide design and construction monitoring services to create a technical set of plans and specifications for the construction of a new chemical feed building to match existing facility buildings in exterior appearance and house chemical storage, chemical feed systems, pumps and all associated piping, electrical, and other appurtenances. The Chemical Phosphorus Removal Improvements shall produce final sewage treatment plant effluent that is able to meet a current total phosphorus limit of 1.0 mg/L limit by March 2017 and comfortably able to meet a future limit of 0.5 mg/L.��
The selected firm shall provide comprehensive consulting services for the development of plans, specifications, engineer’s opinion of probable costs, itemized bid schedule, contract documents and construction monitoring for the proposed improvements as outlined in this RFP.
The completion date for design work is September 30, 2016.
PROJECT DETAILS The Chemical Phosphorus Removal Improvements include construction of a Chemical Feed Building with approximate dimensions of 27-foot by 24-foot building. This building would be located on the east side of the grit building. The tentative site selected is not located in the floodway or floodplain. The Improvements include providing the ability to add chemical to the primary influent, immediately downstream of the primary clarifiers / prior to the secondary clarifiers, and upstream of the sand filters. The Chemical Feed Building will house two 4,500-gallon tanks, chemical metering pumps, safety equipment (including at a minimum an eyewash, emergency shower, public washroom facilities and fire suppression equipment), and associated electrical, heating and ventilating equipment. An aluminum based product shall be the preferred chemical for chemical phosphorus removal. Tank sizes were selected based on the volume of the standard delivery of approximately 4,000 gallons. The Chemical Phosphorus Removal Improvements also include furnishing and installing an online phosphorus analyzer in the sand filter building. The Chemical Feed Pumps will be controlled through use of the phosphorus analyzer to closely match chemical dose to actual real-time conditions can reduce chemical
usage. Specifically, the orthophosphate concentration of the facility effluent will set the pace of the Chemical Feed Pumps. The selected firm shall tie the analyzer and pumps into the plant Supervisory Control and Data Acquisition (SCADA) system.
PRE-BID MEETING Prospective bidders are encouraged to attend a non-mandatory Pre-Bid Meeting scheduled for May 31, 2016 at 2:00 p.m. at 1610 S. Milwaukee Av., Libertyville, IL to review the scope of the work and the project specifications.
CLARIFICATIONS The Village reserves the right to make clarifications, corrections, or changes in this Request for Proposals at any time prior to the time proposals are opened. All bidders or prospective bidders will be informed of said clarifications, corrections, or changes.
Any Bidder who is in doubt as to the true meaning of any part of the Bidding Documents, or finds a discrepancy or omission therein, may submit to the owner a written request for an interpretation or correction. The person submitting the request shall be responsible for its delivery to the owner at least two (2) days prior to the bid opening date. Any interpretation, correction or change of the Bidding Documents will be made by Addendum, which will be posted on the Village website and emailed to the attendees of the pre-bid meeting. IRREGULAR PROPOSALS Proposals that contain omissions, erasures, alterations, or additions not called for, conditional or alternate proposals, or that contain irregularities of any kind or which are not accompanied by the proper Surety, may be rejected as irregular.
DELIVERY OF PROPOSALS Each proposal shall be submitted in a sealed envelope plainly marked with the title of the contract and bidder’s full legal name and shall be addressed and delivered to the place and before the time set forth in the request for proposals. Contract proposals may be delivered by mail or in person. Contract proposals received after the time specified above will be returned unopened.
DISQUALIFICATION OF PROPOSALS 2 or more proposals from a person, firm, or corporation, under different names will not be considered. Evidence that any bidder is interested in more than one proposal for the same work will cause rejection of all proposals. Any or all proposals will be rejected if there is evidence of collusion among the bidders. WITHDRAWAL OF PROPOSALS Bidders may withdraw Bids at any time prior to the bid opening time and date. Withdrawal requests shall be made in writing and must be received by the Owner before the time and date stated for the Bid Opening. Properly withdrawn Bids will be returned unopened to the Person or firm submitting the bid. No contract proposal shall be withdrawn for a period of 45 days after the opening of any proposal.
ACCEPTANCE OF PROPOSALS Proposals submitted are offers only and the decision to accept or reject is a function of quality, reliability, capability, reputation, and expertise of the bidders. The Village may accept the proposal that is, in its judgment, the best and most favorable to the interests of the Village and to the public; reject the low price proposal; accept any item of any proposal; reject any and all proposals; or waive irregularities and informalities in any proposal submitted or in the request for proposal process. The waiver of any prior defect or informality shall not be considered a waiver of any future or similar defect or informality. Bidders should not rely on, or
anticipate, any waivers in submitting their contract proposals.
On acceptance of the successful Bidder’s contract proposal by the Village, the successful Bidder’s proposal, together with Village’s notification of acceptance, shall become the Contract for the Work. SELECTION OF BIDDERS The Village reserves the right to select a proposal in accordance with the work to be done, equipment and labor to be furnished, experience and pecuniary resources, and the lowest priced responsible bid. The Village reserves the right to waive any and or all technicalities, to reject any or all proposals, and to make an award in the best interest of the Village. EXECUTION OF CONTRACT The individual, firm or corporation to whom or to which a Contract has been awarded shall furnish an executed Contract, Contract Bond and Proof of Insurance to the Village within 15 calendar days after Notice of Award has been received by them from the Village. Failure by the Bidder to furnish the Village with an executed Contract and Proof of Insurance within the 15 calendar days specified shall be just cause for annulment of the award, or of the Contract if executed.
CANCELLATION OF CONTRACT The Village reserves the right to cancel this contract without cause at any point in the duration of the life of the contract. The Village shall provide written notification to the Contractor 10 calendar days prior to cancellation. ATTACHMENTS
1. Site layout depicting proposed building location. 2. Basis of design for water reclamation facility. 3. 2016 Phosphorus Feasibility Study 4. 2016 Nutrient Implementation Plan submitted to IEPA
PROPOSAL FOR: CHEMICAL PHOSPHORUS REMOVAL ENGINEERING DESIGN SERVICES
It is expressly understood and agreed that the Board of the Village of Mundelein reserves the right to reject any and all proposals.
IF AN INDIVIDUAL
Name of Bidder: Signature:
Address:
City: State: Zip: Tel.: ( )
IF A PARTNERSHIP
Name of Firm:
By: (Longhand Signature)
Business Address:
City: State: Zip: Tel.: ( )
NAMES AND ADDRESSES OF ALL FIRM MEMBERS
IF A CORPORATION
Corporate Name:
A corporation in the State of
Signed By:
Printed Name:
Business Address:
City: State: Zip: Tel.: ( )
NAMES OF OFFICERS: President
Secretary
Treasurer
Attest
RETURN WITH BID
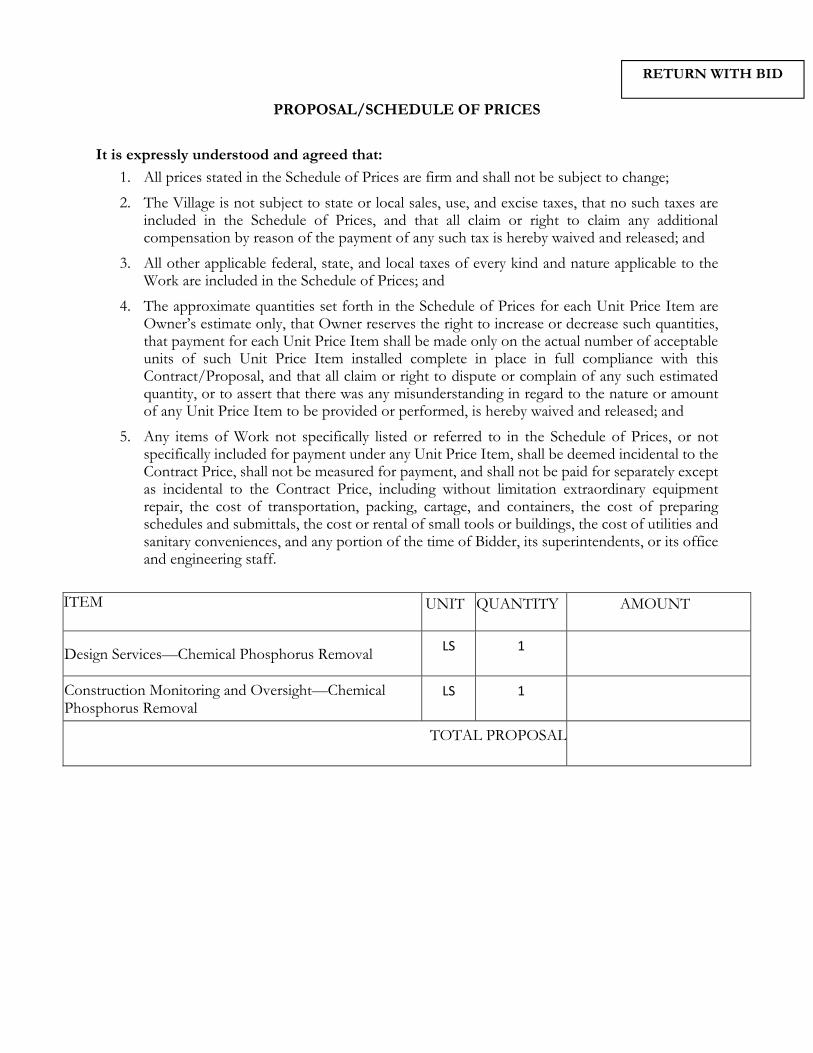
PROPOSAL/SCHEDULE OF PRICES
It is expressly understood and agreed that:
1. All prices stated in the Schedule of Prices are firm and shall not be subject to change;
2. The Village is not subject to state or local sales, use, and excise taxes, that no such taxes are included in the Schedule of Prices, and that all claim or right to claim any additional compensation by reason of the payment of any such tax is hereby waived and released; and
3. All other applicable federal, state, and local taxes of every kind and nature applicable to the Work are included in the Schedule of Prices; and
4. The approximate quantities set forth in the Schedule of Prices for each Unit Price Item are Owner’s estimate only, that Owner reserves the right to increase or decrease such quantities, that payment for each Unit Price Item shall be made only on the actual number of acceptable units of such Unit Price Item installed complete in place in full compliance with this Contract/Proposal, and that all claim or right to dispute or complain of any such estimated quantity, or to assert that there was any misunderstanding in regard to the nature or amount of any Unit Price Item to be provided or performed, is hereby waived and released; and
5. Any items of Work not specifically listed or referred to in the Schedule of Prices, or not specifically included for payment under any Unit Price Item, shall be deemed incidental to the Contract Price, shall not be measured for payment, and shall not be paid for separately except as incidental to the Contract Price, including without limitation extraordinary equipment repair, the cost of transportation, packing, cartage, and containers, the cost of preparing schedules and submittals, the cost or rental of small tools or buildings, the cost of utilities and sanitary conveniences, and any portion of the time of Bidder, its superintendents, or its office and engineering staff.
ITEM UNIT QUANTITY AMOUNT
Design Services—Chemical Phosphorus Removal LS 1
Construction Monitoring and Oversight—Chemical Phosphorus Removal
LS 1
TOTAL PROPOSAL
RETURN WITH BID
R:\MAD\Documents\Reports\Archive\2016\Mundelein, IL\PES.1669.005.vcw.oct\Report\!Front Cover (Periwinkle=Wastewater).docx
Report Village of
Mundelein, IL
March 2016
Phosphorus Feasibility Study
i
TABLE OF CONTENTS Page No.
or Following SECTION 1–INTRODUCTION
1.01 Purpose and Scope .................................................................................. 1-1 1.02 Phosphorus Discharges ........................................................................... 1-1 1.03 Phosphorus Sources ................................................................................ 1-1 1.04 Phosphorus Forms in Wastewater ............................................................ 1-2 1.05 Abbreviations and Definitions ................................................................... 1-3
SECTION 2–EXISTING WASTEWATER TREATMENT FACILITIES
2.01 Description of Existing Facilities ............................................................... 2-1 2.02 Influent Flows and Loads .......................................................................... 2-1 2.03 Projected Facility Flows and Loadings ...................................................... 2-5
SECTION 3–DESCRIPTION OF PHOSPHORUS REMOVAL ALTERNATIVES
3.01 Chemical Phosphorus Removal Alternatives ............................................ 3-1 3.02 Chemical Phosphorus Removal Jar Testing Results ................................ 3-1 3.03 Biological Phosphorus Removal Alternatives ............................................ 3-4 3.04 Tertiary Treatment Alternatives ................................................................ 3-11 3.05 Impact of Excess Flow Discharges ........................................................... 3-12 3.06 Effect of Different Limit Durations ............................................................. 3-12
SECTION 4–ALTERNATIVES ANALYSIS AND RECOMMENDATIONS
4.01 Capital and Operating Cost Development ................................................ 4-1 4.02 Nonmonetary Considerations ................................................................... 4-9 4.03 Recommendations ................................................................................... 4-9
TABLE OF CONTENTS Continued Page No.
or Following
ii
TABLES 2.02-1 Village of Mundelein WRF Influent Flows and Loadings ........................... 2-2 2.02-2 Influent and Effluent Phosphorus Concentrations ..................................... 2-4 2.02-3 Industrial Water Use ................................................................................. 2-4 2.02-4 Industrial Sampling Results ...................................................................... 2-5 2.03-1 Projected Flows and Phosphorus Loadings .............................................. 2-5 4.01-1 Opinion of Capital Cost for BPR Treatment .............................................. 4-1 4.01-2 Projected CPR Doses .............................................................................. 4-2 4.01-3 Opinion of Project Capital Costs for CPR to Meet 1.0 mg/L Limit ............. 4-3 4.01-4 Projected Annual Operating Costs for CPR to Meet 1.0 mg/L Monthly Average Limit .............................................................................. 4-4 4.01-5 Opinion of Project Capital Costs for CPR to Meet 0.5 mg/L Limit .............. 4-5 4.01-6 Projected Daily Dosages to Meet 0.5 mg/L Limit ...................................... 4-5 4.01-7 Projected Annual Operating Costs for CPR to Meet 0.5 mg/L Monthly Limit 4-6 4.01-8 Projected Annual Operating Costs for CPR to Meet 0.5 mg/L Seasonal Limit 4-6 4.01-9 Projected Annual Operating Costs for CPR to Meet 0.5 mg/L Annual Limit 4-6 4.01-10 Opinion of Projected Capital Costs to Meet 0.1 mg/L Limit with Reactive Sand Filtration ............................................. 4-7 4.01-11 Opinion of Projected Capital Costs to Meet 0.1 mg/L Limit with Ballasted Sand Clarification ....................................... 4-8 4.01-12 Projected Annual Operating Costs for CPR to Meet 0.1 mg/L Monthly Limit 4-9
FIGURES 3.02-1 Ferric Jar Test Results ............................................................................. 3-2 3.02-2 Alum Jar Test Results .............................................................................. 3-3 3.02-3 SorbX™-100 Jar Test Results .................................................................. 3-3 3.03-1 BPR Potential Test Results ...................................................................... 3-5 3.03-2 Potential A/O with RAS Nitrification BPR Arrangement............................. 3-7 3.03-3 Alternative Potential A/O with RAS Nitrification BPR Arrangement ........... 3-8 3.03-4 Potential A2/O BPR Arrangement ............................................................ 3-9 3.03-5 Potential Modified UCT BPR Arrangement ............................................... 3-10
APPENDIX APPENDIX–NPDES PERMIT NO. IL0022501

SECTION 1 INTRODUCTION
Village of Mundelein, Illinois Phosphorus Feasibility Study Section 1–Introduction
Prepared by Strand Associates, Inc. 1-1 R:\MAD\Documents\Reports\Archive\2016\Mundelein, IL\PES.1669.005.vcw.oct\Report\S1.docx\031016
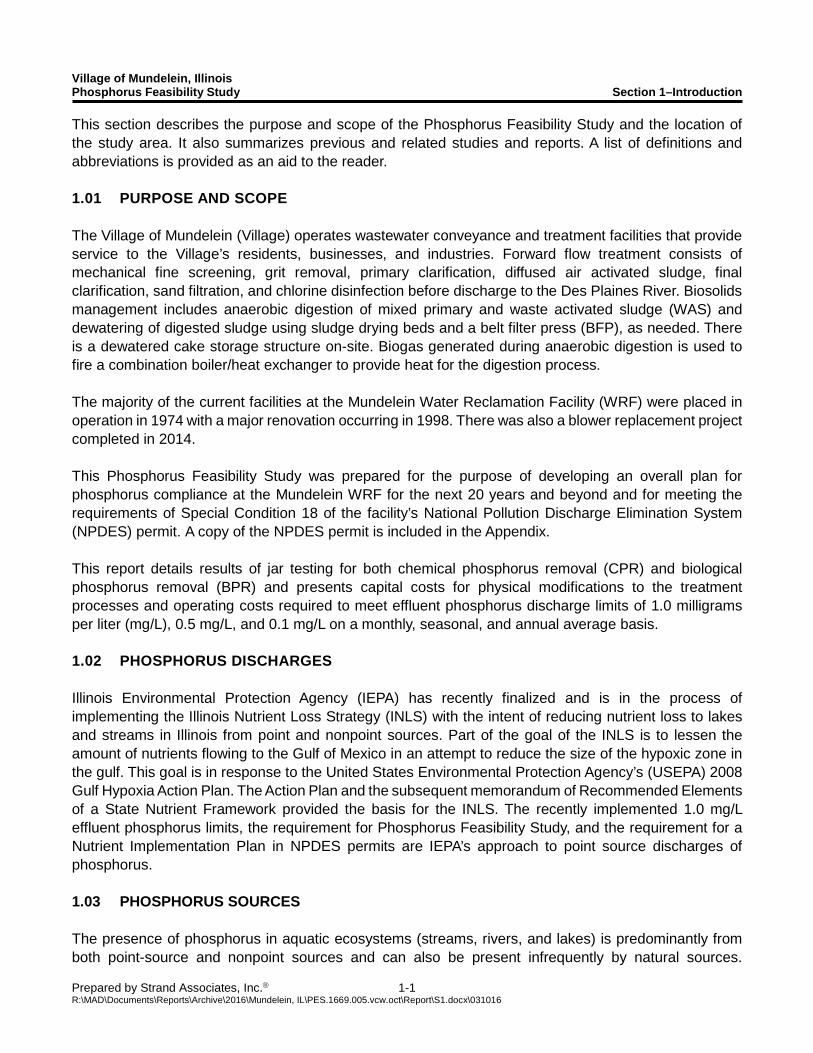
This section describes the purpose and scope of the Phosphorus Feasibility Study and the location of the study area. It also summarizes previous and related studies and reports. A list of definitions and abbreviations is provided as an aid to the reader. 1.01 PURPOSE AND SCOPE The Village of Mundelein (Village) operates wastewater conveyance and treatment facilities that provide service to the Village’s residents, businesses, and industries. Forward flow treatment consists of mechanical fine screening, grit removal, primary clarification, diffused air activated sludge, final clarification, sand filtration, and chlorine disinfection before discharge to the Des Plaines River. Biosolids management includes anaerobic digestion of mixed primary and waste activated sludge (WAS) and dewatering of digested sludge using sludge drying beds and a belt filter press (BFP), as needed. There is a dewatered cake storage structure on-site. Biogas generated during anaerobic digestion is used to fire a combination boiler/heat exchanger to provide heat for the digestion process. The majority of the current facilities at the Mundelein Water Reclamation Facility (WRF) were placed in operation in 1974 with a major renovation occurring in 1998. There was also a blower replacement project completed in 2014. This Phosphorus Feasibility Study was prepared for the purpose of developing an overall plan for phosphorus compliance at the Mundelein WRF for the next 20 years and beyond and for meeting the requirements of Special Condition 18 of the facility’s National Pollution Discharge Elimination System (NPDES) permit. A copy of the NPDES permit is included in the Appendix. This report details results of jar testing for both chemical phosphorus removal (CPR) and biological phosphorus removal (BPR) and presents capital costs for physical modifications to the treatment processes and operating costs required to meet effluent phosphorus discharge limits of 1.0 milligrams per liter (mg/L), 0.5 mg/L, and 0.1 mg/L on a monthly, seasonal, and annual average basis. 1.02 PHOSPHORUS DISCHARGES Illinois Environmental Protection Agency (IEPA) has recently finalized and is in the process of implementing the Illinois Nutrient Loss Strategy (INLS) with the intent of reducing nutrient loss to lakes and streams in Illinois from point and nonpoint sources. Part of the goal of the INLS is to lessen the amount of nutrients flowing to the Gulf of Mexico in an attempt to reduce the size of the hypoxic zone in the gulf. This goal is in response to the United States Environmental Protection Agency’s (USEPA) 2008 Gulf Hypoxia Action Plan. The Action Plan and the subsequent memorandum of Recommended Elements of a State Nutrient Framework provided the basis for the INLS. The recently implemented 1.0 mg/L effluent phosphorus limits, the requirement for Phosphorus Feasibility Study, and the requirement for a Nutrient Implementation Plan in NPDES permits are IEPA’s approach to point source discharges of phosphorus. 1.03 PHOSPHORUS SOURCES The presence of phosphorus in aquatic ecosystems (streams, rivers, and lakes) is predominantly from both point-source and nonpoint sources and can also be present infrequently by natural sources.
Village of Mundelein, Illinois Phosphorus Feasibility Study Section 1–Introduction
Prepared by Strand Associates, Inc. 1-2 R:\MAD\Documents\Reports\Archive\2016\Mundelein, IL\PES.1669.005.vcw.oct\Report\S1.docx\031016
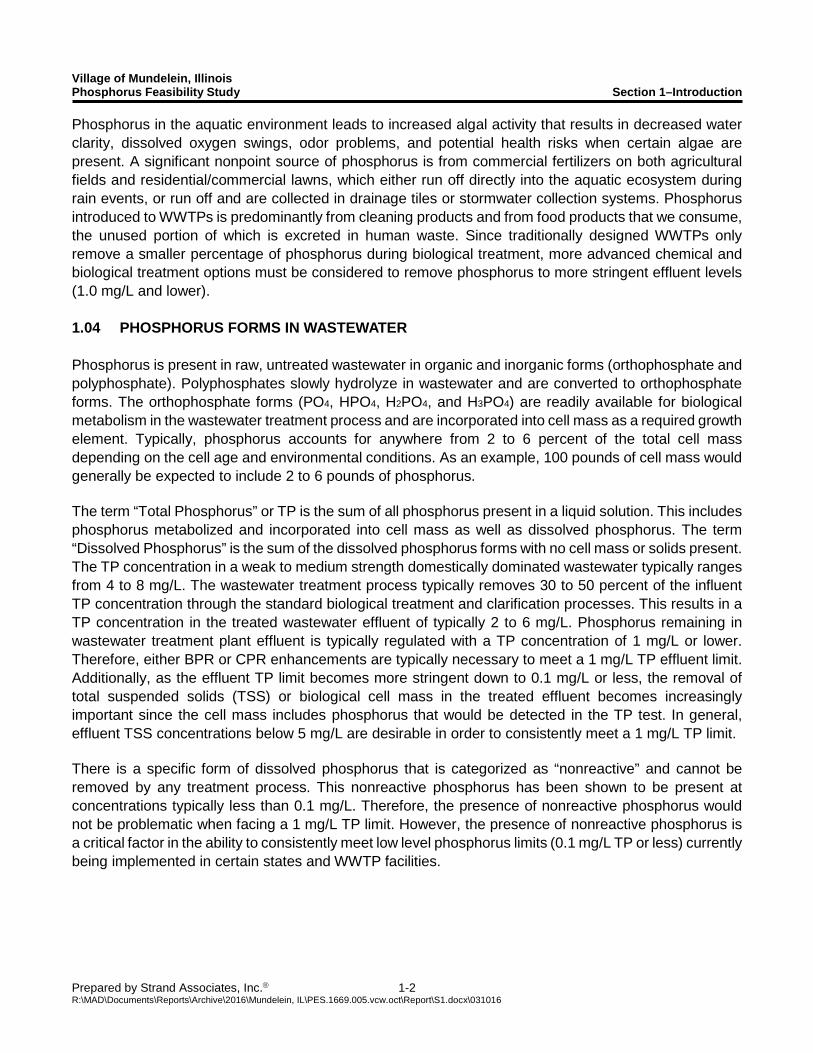
Phosphorus in the aquatic environment leads to increased algal activity that results in decreased water clarity, dissolved oxygen swings, odor problems, and potential health risks when certain algae are present. A significant nonpoint source of phosphorus is from commercial fertilizers on both agricultural fields and residential/commercial lawns, which either run off directly into the aquatic ecosystem during rain events, or run off and are collected in drainage tiles or stormwater collection systems. Phosphorus introduced to WWTPs is predominantly from cleaning products and from food products that we consume, the unused portion of which is excreted in human waste. Since traditionally designed WWTPs only remove a smaller percentage of phosphorus during biological treatment, more advanced chemical and biological treatment options must be considered to remove phosphorus to more stringent effluent levels (1.0 mg/L and lower). 1.04 PHOSPHORUS FORMS IN WASTEWATER Phosphorus is present in raw, untreated wastewater in organic and inorganic forms (orthophosphate and polyphosphate). Polyphosphates slowly hydrolyze in wastewater and are converted to orthophosphate forms. The orthophosphate forms (PO4, HPO4, H2PO4, and H3PO4) are readily available for biological metabolism in the wastewater treatment process and are incorporated into cell mass as a required growth element. Typically, phosphorus accounts for anywhere from 2 to 6 percent of the total cell mass depending on the cell age and environmental conditions. As an example, 100 pounds of cell mass would generally be expected to include 2 to 6 pounds of phosphorus. The term “Total Phosphorus” or TP is the sum of all phosphorus present in a liquid solution. This includes phosphorus metabolized and incorporated into cell mass as well as dissolved phosphorus. The term “Dissolved Phosphorus” is the sum of the dissolved phosphorus forms with no cell mass or solids present. The TP concentration in a weak to medium strength domestically dominated wastewater typically ranges from 4 to 8 mg/L. The wastewater treatment process typically removes 30 to 50 percent of the influent TP concentration through the standard biological treatment and clarification processes. This results in a TP concentration in the treated wastewater effluent of typically 2 to 6 mg/L. Phosphorus remaining in wastewater treatment plant effluent is typically regulated with a TP concentration of 1 mg/L or lower. Therefore, either BPR or CPR enhancements are typically necessary to meet a 1 mg/L TP effluent limit. Additionally, as the effluent TP limit becomes more stringent down to 0.1 mg/L or less, the removal of total suspended solids (TSS) or biological cell mass in the treated effluent becomes increasingly important since the cell mass includes phosphorus that would be detected in the TP test. In general, effluent TSS concentrations below 5 mg/L are desirable in order to consistently meet a 1 mg/L TP limit. There is a specific form of dissolved phosphorus that is categorized as “nonreactive” and cannot be removed by any treatment process. This nonreactive phosphorus has been shown to be present at concentrations typically less than 0.1 mg/L. Therefore, the presence of nonreactive phosphorus would not be problematic when facing a 1 mg/L TP limit. However, the presence of nonreactive phosphorus is a critical factor in the ability to consistently meet low level phosphorus limits (0.1 mg/L TP or less) currently being implemented in certain states and WWTP facilities.
Village of Mundelein, Illinois Phosphorus Feasibility Study Section 1–Introduction
Prepared by Strand Associates, Inc. 1-3 R:\MAD\Documents\Reports\Archive\2016\Mundelein, IL\PES.1669.005.vcw.oct\Report\S1.docx\031016
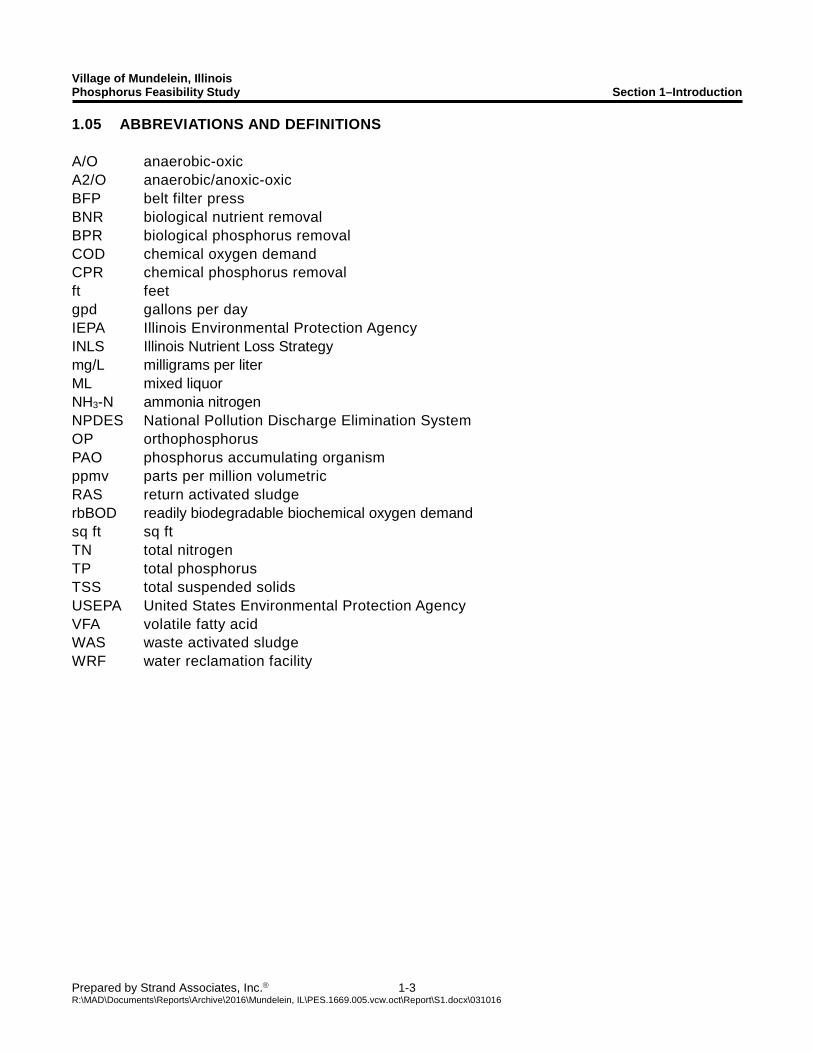
1.05 ABBREVIATIONS AND DEFINITIONS A/O anaerobic-oxic A2/O anaerobic/anoxic-oxic BFP belt filter press BNR biological nutrient removal BPR biological phosphorus removal COD chemical oxygen demand CPR chemical phosphorus removal ft feet gpd gallons per day IEPA Illinois Environmental Protection Agency INLS Illinois Nutrient Loss Strategy mg/L milligrams per liter ML mixed liquor NH3-N ammonia nitrogen NPDES National Pollution Discharge Elimination System OP orthophosphorus PAO phosphorus accumulating organism ppmv parts per million volumetric RAS return activated sludge rbBOD readily biodegradable biochemical oxygen demand sq ft sq ft TN total nitrogen TP total phosphorus TSS total suspended solids USEPA United States Environmental Protection Agency VFA volatile fatty acid WAS waste activated sludge WRF water reclamation facility

SECTION 2 EXISTING WASTEWATER TREATMENT FACILITIES
Village of Mundelein, Illinois Phosphorus Feasibility Study Section 2–Existing Wastewater Treatment Facilities
Prepared by Strand Associates, Inc. 2-1 R:\MAD\Documents\Reports\Archive\2016\Mundelein, IL\PES.1669.005.vcw.oct\Report\S2.030916.docx\031016
2.01 DESCRIPTION OF EXISTING FACILITIES
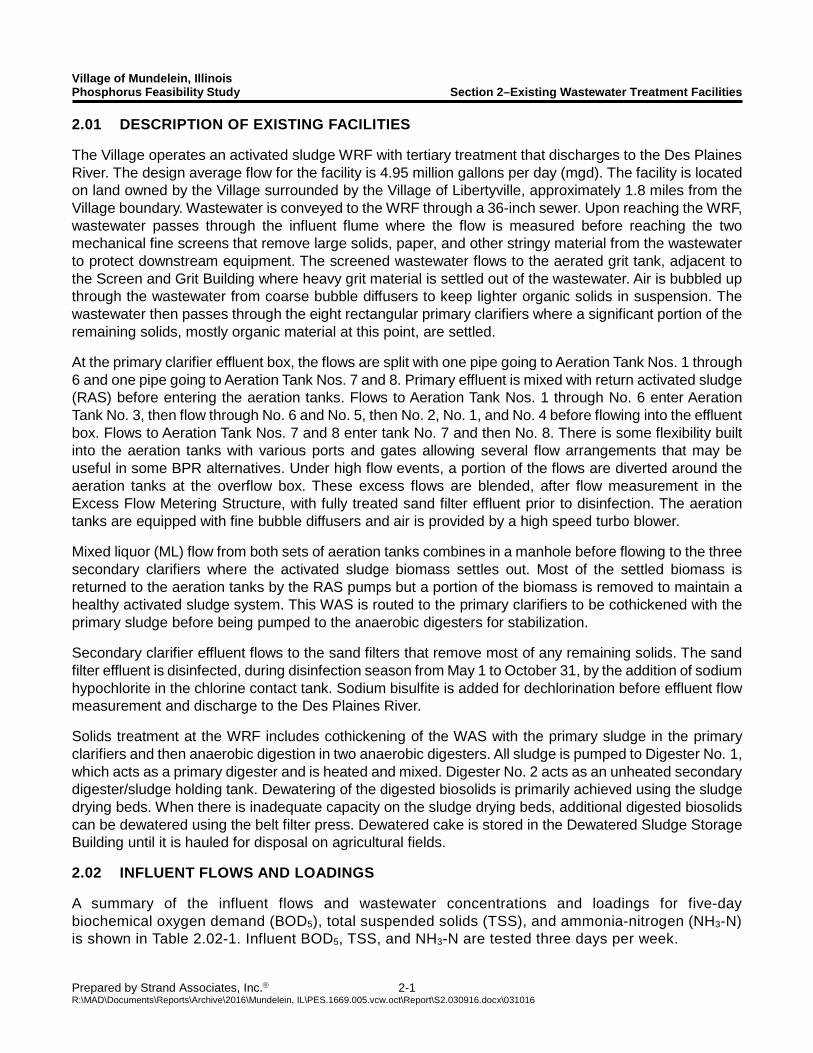
The Village operates an activated sludge WRF with tertiary treatment that discharges to the Des Plaines River. The design average flow for the facility is 4.95 million gallons per day (mgd). The facility is located on land owned by the Village surrounded by the Village of Libertyville, approximately 1.8 miles from the Village boundary. Wastewater is conveyed to the WRF through a 36-inch sewer. Upon reaching the WRF, wastewater passes through the influent flume where the flow is measured before reaching the two mechanical fine screens that remove large solids, paper, and other stringy material from the wastewater to protect downstream equipment. The screened wastewater flows to the aerated grit tank, adjacent to the Screen and Grit Building where heavy grit material is settled out of the wastewater. Air is bubbled up through the wastewater from coarse bubble diffusers to keep lighter organic solids in suspension. The wastewater then passes through the eight rectangular primary clarifiers where a significant portion of the remaining solids, mostly organic material at this point, are settled.
At the primary clarifier effluent box, the flows are split with one pipe going to Aeration Tank Nos. 1 through 6 and one pipe going to Aeration Tank Nos. 7 and 8. Primary effluent is mixed with return activated sludge (RAS) before entering the aeration tanks. Flows to Aeration Tank Nos. 1 through No. 6 enter Aeration Tank No. 3, then flow through No. 6 and No. 5, then No. 2, No. 1, and No. 4 before flowing into the effluent box. Flows to Aeration Tank Nos. 7 and 8 enter tank No. 7 and then No. 8. There is some flexibility built into the aeration tanks with various ports and gates allowing several flow arrangements that may be useful in some BPR alternatives. Under high flow events, a portion of the flows are diverted around the aeration tanks at the overflow box. These excess flows are blended, after flow measurement in the Excess Flow Metering Structure, with fully treated sand filter effluent prior to disinfection. The aeration tanks are equipped with fine bubble diffusers and air is provided by a high speed turbo blower.
Mixed liquor (ML) flow from both sets of aeration tanks combines in a manhole before flowing to the three secondary clarifiers where the activated sludge biomass settles out. Most of the settled biomass is returned to the aeration tanks by the RAS pumps but a portion of the biomass is removed to maintain a healthy activated sludge system. This WAS is routed to the primary clarifiers to be cothickened with the primary sludge before being pumped to the anaerobic digesters for stabilization.
Secondary clarifier effluent flows to the sand filters that remove most of any remaining solids. The sand filter effluent is disinfected, during disinfection season from May 1 to October 31, by the addition of sodium hypochlorite in the chlorine contact tank. Sodium bisulfite is added for dechlorination before effluent flow measurement and discharge to the Des Plaines River.
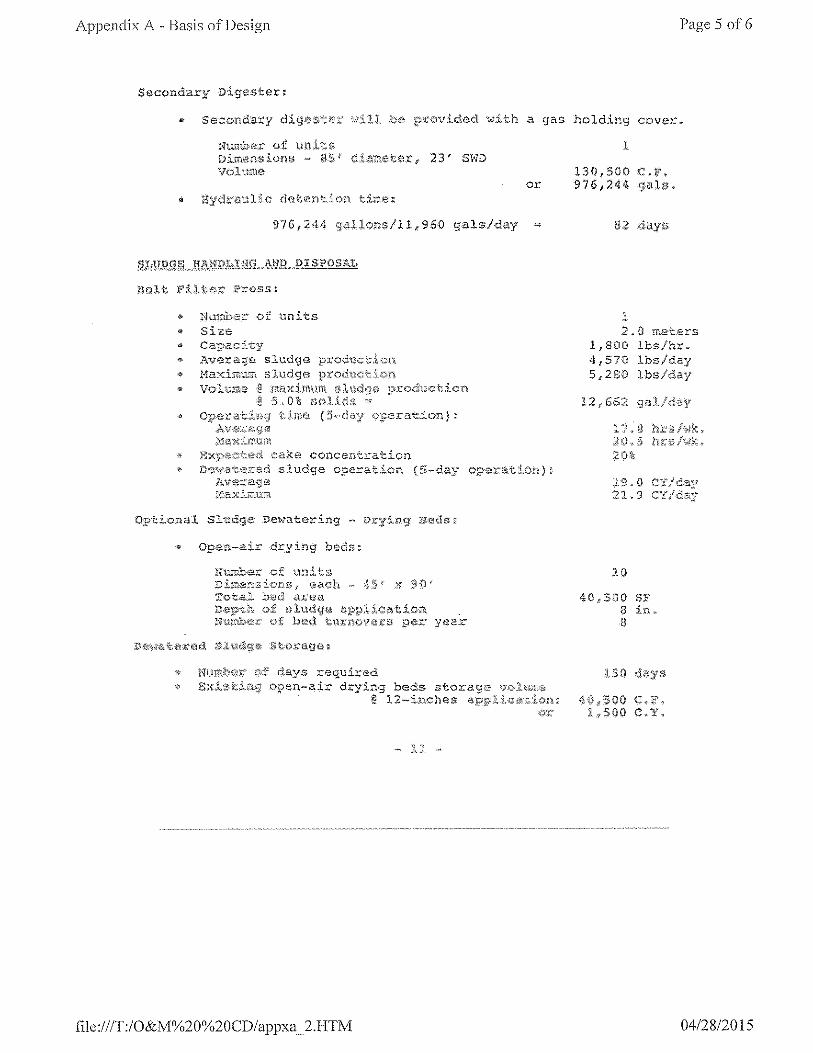
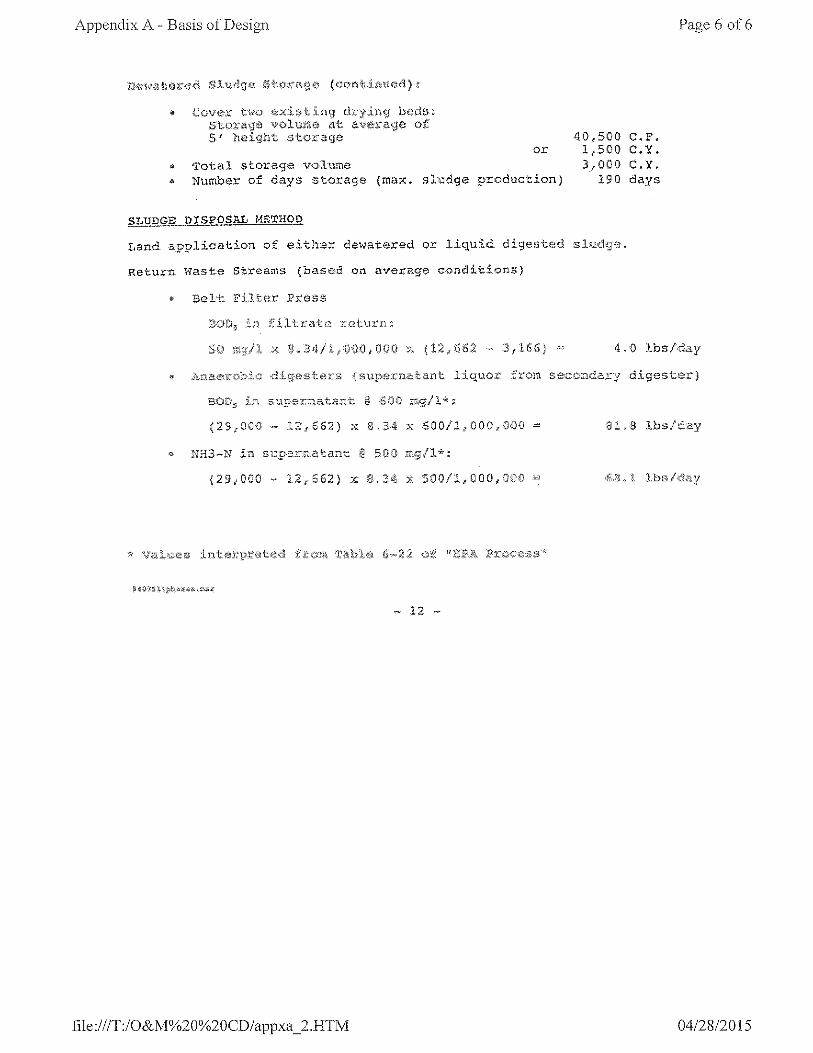
Solids treatment at the WRF includes cothickening of the WAS with the primary sludge in the primary clarifiers and then anaerobic digestion in two anaerobic digesters. All sludge is pumped to Digester No. 1, which acts as a primary digester and is heated and mixed. Digester No. 2 acts as an unheated secondary digester/sludge holding tank. Dewatering of the digested biosolids is primarily achieved using the sludge drying beds. When there is inadequate capacity on the sludge drying beds, additional digested biosolids can be dewatered using the belt filter press. Dewatered cake is stored in the Dewatered Sludge Storage Building until it is hauled for disposal on agricultural fields.
2.02 INFLUENT FLOWS AND LOADINGS
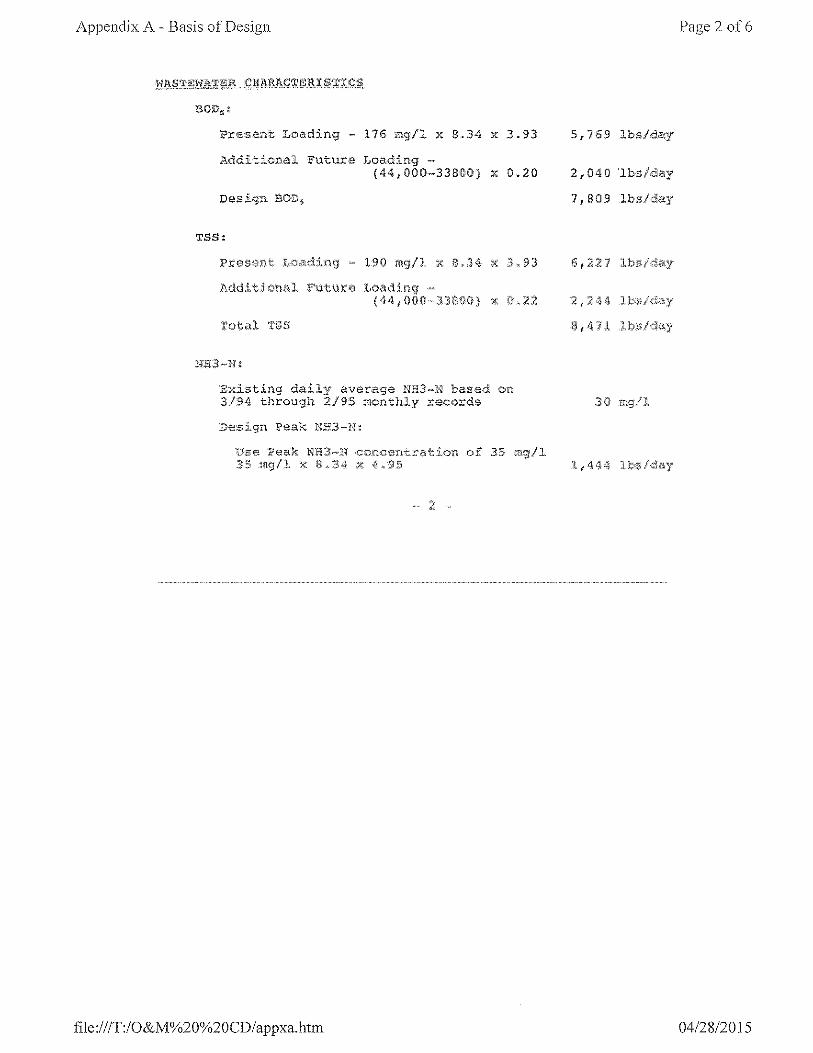
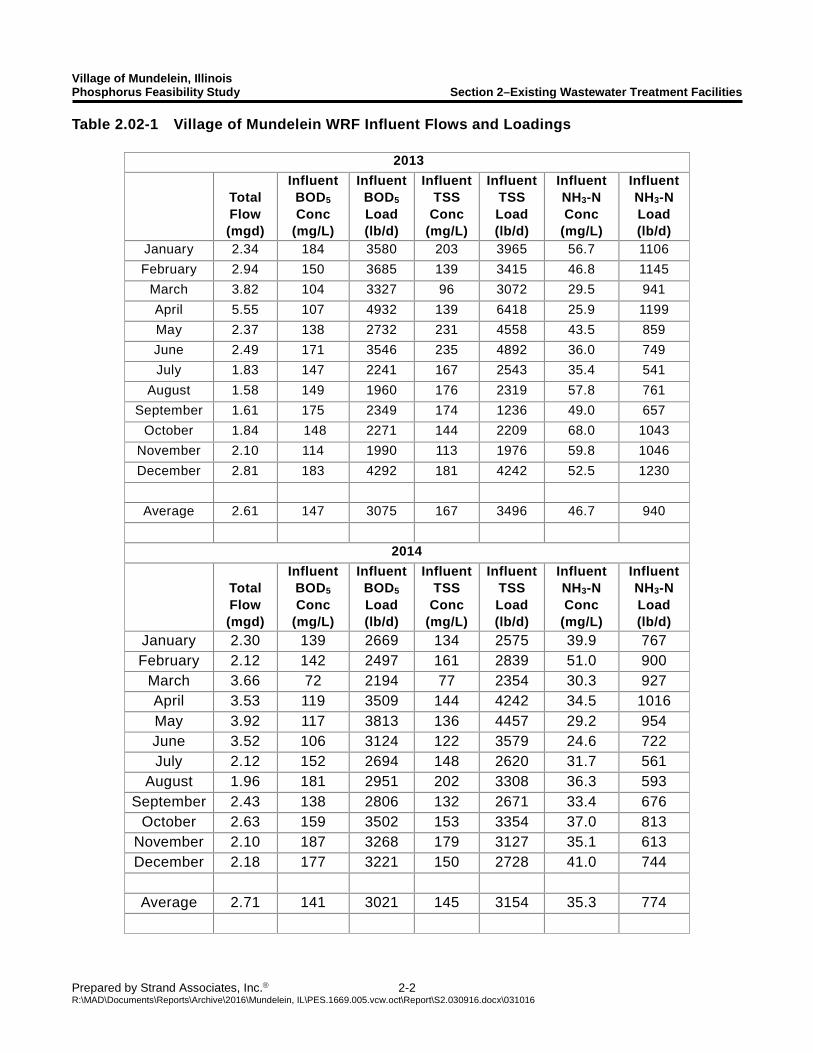
A summary of the influent flows and wastewater concentrations and loadings for five-day biochemical oxygen demand (BOD5), total suspended solids (TSS), and ammonia-nitrogen (NH3-N) is shown in Table 2.02-1. Influent BOD5, TSS, and NH3-N are tested three days per week.
Village of Mundelein, Illinois Phosphorus Feasibility Study Section 2–Existing Wastewater Treatment Facilities
Prepared by Strand Associates, Inc. 2-2 R:\MAD\Documents\Reports\Archive\2016\Mundelein, IL\PES.1669.005.vcw.oct\Report\S2.030916.docx\031016
Table 2.02-1 Village of Mundelein WRF Influent Flows and Loadings
2013
Total Flow (mgd)
Influent BOD5 Conc
(mg/L)
Influent BOD5 Load (lb/d)
Influent TSS
Conc (mg/L)
Influent TSS Load (lb/d)
Influent NH3-N Conc
(mg/L)
Influent NH3-N Load (lb/d)
January 2.34 184 3580 203 3965 56.7 1106
February 2.94 150 3685 139 3415 46.8 1145
March 3.82 104 3327 96 3072 29.5 941
April 5.55 107 4932 139 6418 25.9 1199
May 2.37 138 2732 231 4558 43.5 859
June 2.49 171 3546 235 4892 36.0 749
July 1.83 147 2241 167 2543 35.4 541
August 1.58 149 1960 176 2319 57.8 761
September 1.61 175 2349 174 1236 49.0 657
October 1.84 148 2271 144 2209 68.0 1043
November 2.10 114 1990 113 1976 59.8 1046
December 2.81 183 4292 181 4242 52.5 1230
Average 2.61 147 3075 167 3496 46.7 940
2014
Total Flow (mgd)
Influent BOD5 Conc
(mg/L)
Influent BOD5 Load (lb/d)
Influent TSS
Conc (mg/L)
Influent TSS Load (lb/d)
Influent NH3-N Conc
(mg/L)
Influent NH3-N Load (lb/d)
January 2.30 139 2669 134 2575 39.9 767 February 2.12 142 2497 161 2839 51.0 900
March 3.66 72 2194 77 2354 30.3 927 April 3.53 119 3509 144 4242 34.5 1016 May 3.92 117 3813 136 4457 29.2 954 June 3.52 106 3124 122 3579 24.6 722 July 2.12 152 2694 148 2620 31.7 561
August 1.96 181 2951 202 3308 36.3 593 September 2.43 138 2806 132 2671 33.4 676
October 2.63 159 3502 153 3354 37.0 813 November 2.10 187 3268 179 3127 35.1 613 December 2.18 177 3221 150 2728 41.0 744
Average 2.71 141 3021 145 3154 35.3 774
Village of Mundelein, Illinois Phosphorus Feasibility Study Section 2–Existing Wastewater Treatment Facilities
Prepared by Strand Associates, Inc. 2-3 R:\MAD\Documents\Reports\Archive\2016\Mundelein, IL\PES.1669.005.vcw.oct\Report\S2.030916.docx\031016
Table 2.02-1 Village of Mundelein WRF Influent Flows and Loadings (Continued)
2015
Total Flow (mgd)
Influent BOD5 Conc
(mg/L)
Influent BOD5 Load (lb/d)
Influent TSS
Conc (mg/L)
Influent TSS Load (lb/d)
Influent NH3-N Conc
(mg/L)
Influent NH3-N Load (lb/d)
January 2.31 163 2877 152 2931 40.9 778 February 2.23 173 3208 168 3121 35.4 657
March 3.11 115 2976 117 3209 29.4 739 April 3.65 131 3995 135 3947 25.7 803 May 3.22 138 3702 136 3641 28.4 762 June 2.74 151 3450 151 3434 34.7 791 July 2.82 142 3331 130 3064 31.7 747
August 2.28 183 3485 151 2866 36.4 693 September 2.76 127 2913 123 2827 35.2 810
October 2.03 181 3064 144 2433 38.4 649 November 3.21 169 4527 153 4100 30.7 822 December 3.87 119 3833 90 2901 16.0 518
Average 2.82 145 3327 143 3303 32.8 747
Overall Average 2.71 144 3141 151 3318 38.3 820
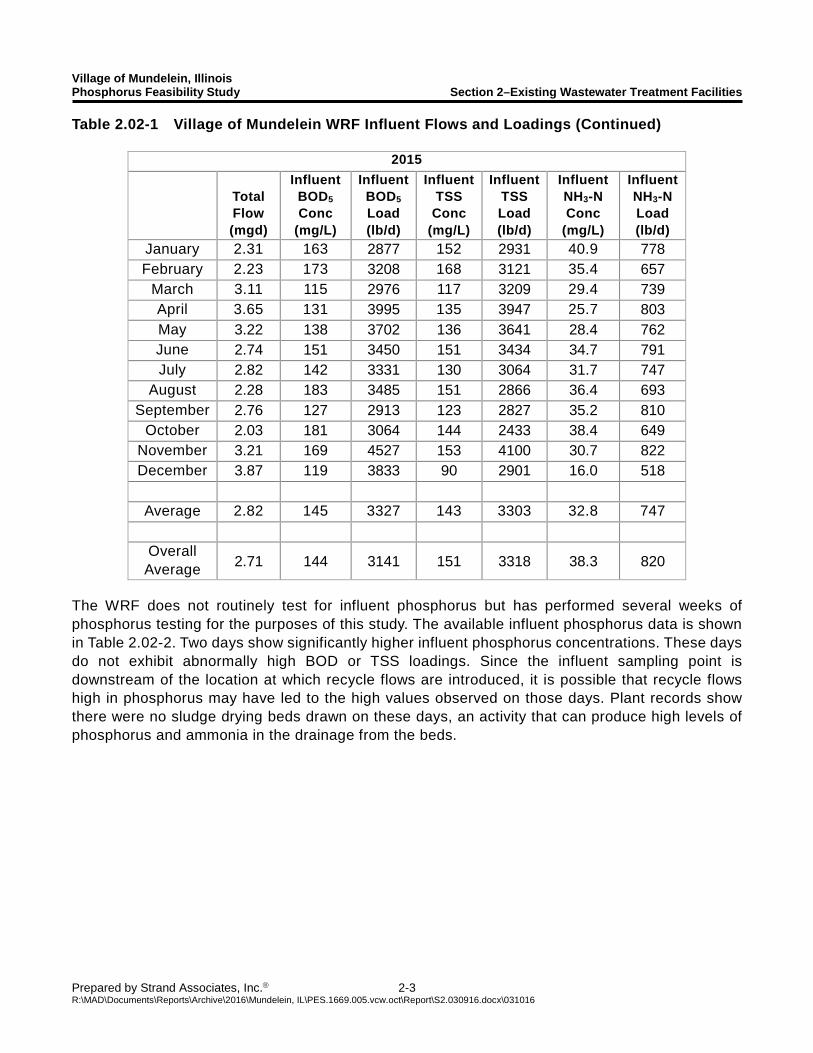
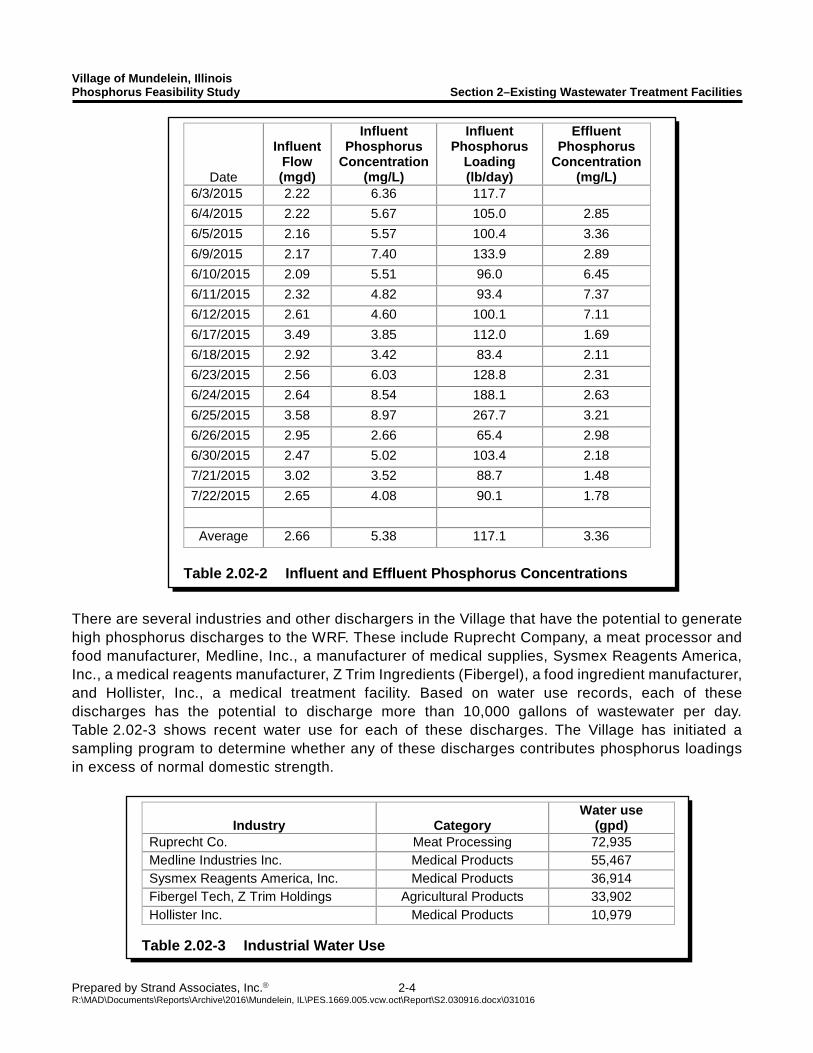
The WRF does not routinely test for influent phosphorus but has performed several weeks of phosphorus testing for the purposes of this study. The available influent phosphorus data is shown in Table 2.02-2. Two days show significantly higher influent phosphorus concentrations. These days do not exhibit abnormally high BOD or TSS loadings. Since the influent sampling point is downstream of the location at which recycle flows are introduced, it is possible that recycle flows high in phosphorus may have led to the high values observed on those days. Plant records show there were no sludge drying beds drawn on these days, an activity that can produce high levels of phosphorus and ammonia in the drainage from the beds.
Village of Mundelein, Illinois Phosphorus Feasibility Study Section 2–Existing Wastewater Treatment Facilities
Prepared by Strand Associates, Inc. 2-4 R:\MAD\Documents\Reports\Archive\2016\Mundelein, IL\PES.1669.005.vcw.oct\Report\S2.030916.docx\031016
There are several industries and other dischargers in the Village that have the potential to generate high phosphorus discharges to the WRF. These include Ruprecht Company, a meat processor and food manufacturer, Medline, Inc., a manufacturer of medical supplies, Sysmex Reagents America, Inc., a medical reagents manufacturer, Z Trim Ingredients (Fibergel), a food ingredient manufacturer, and Hollister, Inc., a medical treatment facility. Based on water use records, each of these discharges has the potential to discharge more than 10,000 gallons of wastewater per day. Table 2.02-3 shows recent water use for each of these discharges. The Village has initiated a sampling program to determine whether any of these discharges contributes phosphorus loadings in excess of normal domestic strength.
Industry Category Water use
(gpd) Ruprecht Co. Meat Processing 72,935 Medline Industries Inc. Medical Products 55,467 Sysmex Reagents America, Inc. Medical Products 36,914 Fibergel Tech, Z Trim Holdings Agricultural Products 33,902 Hollister Inc. Medical Products 10,979
Table 2.02-3 Industrial Water Use
Date
Influent Flow (mgd)
Influent Phosphorus
Concentration (mg/L)
Influent Phosphorus
Loading (lb/day)
Effluent Phosphorus
Concentration (mg/L)
6/3/2015 2.22 6.36 117.7
6/4/2015 2.22 5.67 105.0 2.85
6/5/2015 2.16 5.57 100.4 3.36
6/9/2015 2.17 7.40 133.9 2.89
6/10/2015 2.09 5.51 96.0 6.45
6/11/2015 2.32 4.82 93.4 7.37
6/12/2015 2.61 4.60 100.1 7.11
6/17/2015 3.49 3.85 112.0 1.69
6/18/2015 2.92 3.42 83.4 2.11
6/23/2015 2.56 6.03 128.8 2.31
6/24/2015 2.64 8.54 188.1 2.63
6/25/2015 3.58 8.97 267.7 3.21
6/26/2015 2.95 2.66 65.4 2.98
6/30/2015 2.47 5.02 103.4 2.18
7/21/2015 3.02 3.52 88.7 1.48
7/22/2015 2.65 4.08 90.1 1.78
Average 2.66 5.38 117.1 3.36
Table 2.02-2 Influent and Effluent Phosphorus Concentrations
Village of Mundelein, Illinois Phosphorus Feasibility Study Section 2–Existing Wastewater Treatment Facilities
Prepared by Strand Associates, Inc. 2-5 R:\MAD\Documents\Reports\Archive\2016\Mundelein, IL\PES.1669.005.vcw.oct\Report\S2.030916.docx\031016
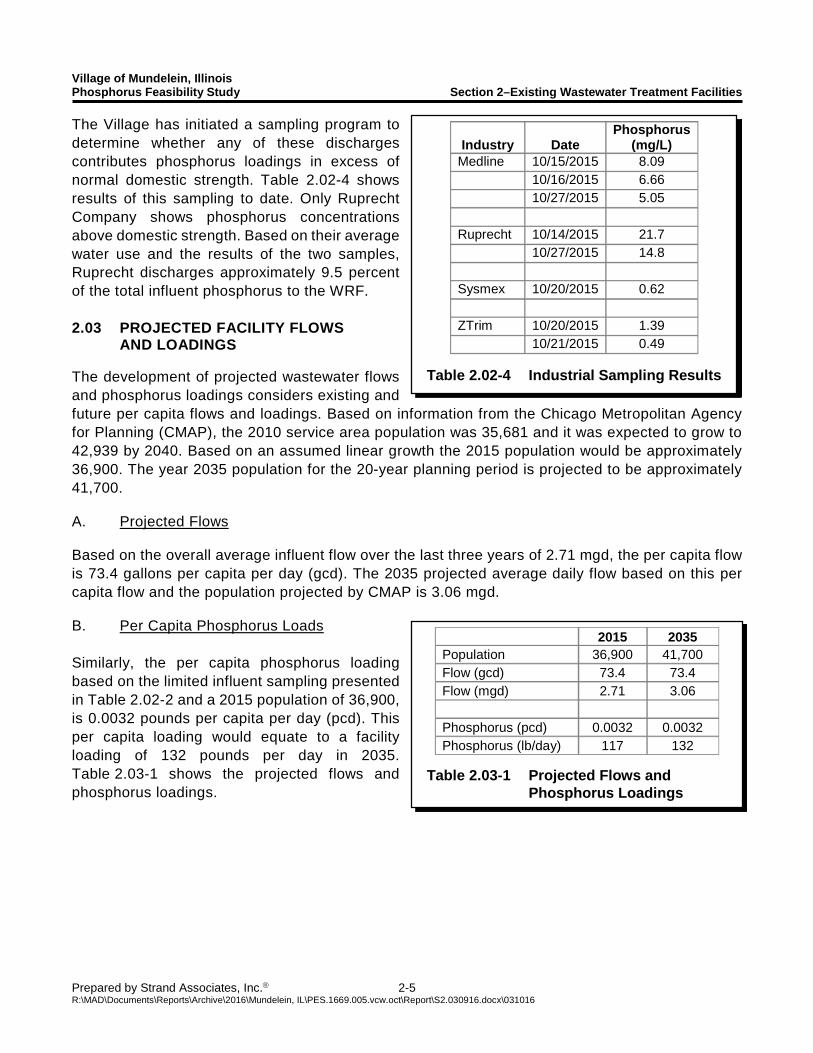
The Village has initiated a sampling program to determine whether any of these discharges contributes phosphorus loadings in excess of normal domestic strength. Table 2.02-4 shows results of this sampling to date. Only Ruprecht Company shows phosphorus concentrations above domestic strength. Based on their average water use and the results of the two samples, Ruprecht discharges approximately 9.5 percent of the total influent phosphorus to the WRF. 2.03 PROJECTED FACILITY FLOWS
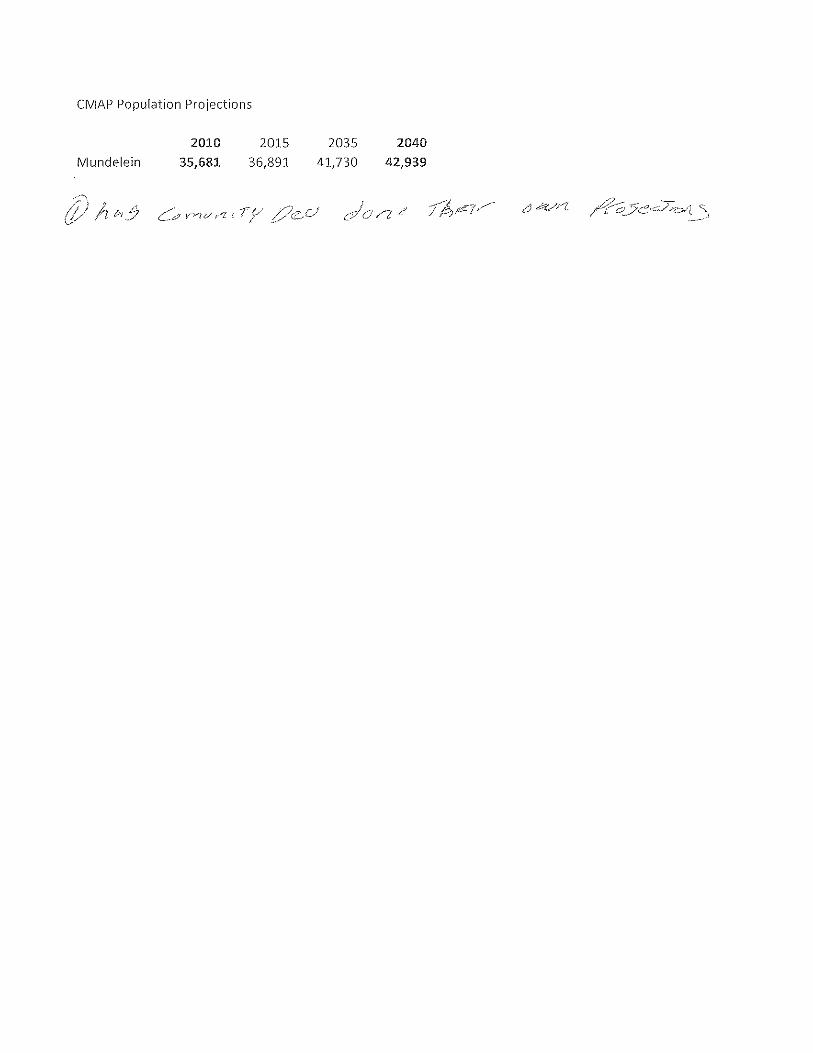
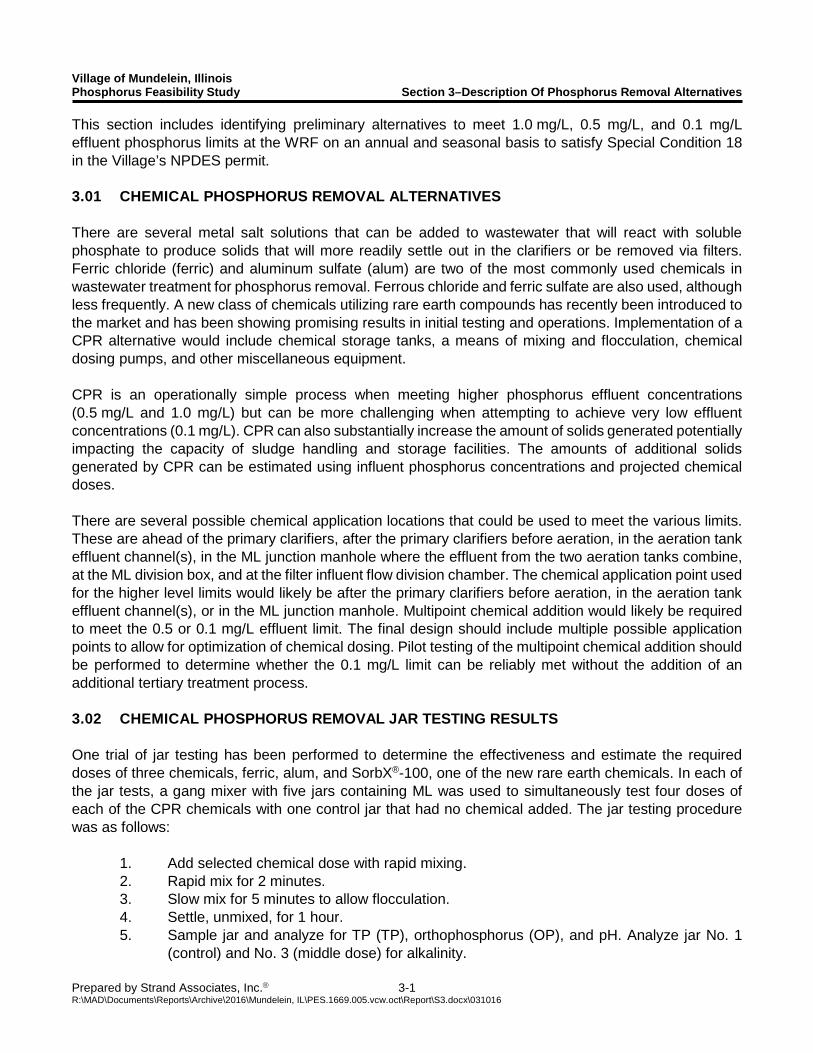
AND LOADINGS The development of projected wastewater flows and phosphorus loadings considers existing and future per capita flows and loadings. Based on information from the Chicago Metropolitan Agency for Planning (CMAP), the 2010 service area population was 35,681 and it was expected to grow to 42,939 by 2040. Based on an assumed linear growth the 2015 population would be approximately 36,900. The year 2035 population for the 20-year planning period is projected to be approximately 41,700.
A. Projected Flows
Based on the overall average influent flow over the last three years of 2.71 mgd, the per capita flow is 73.4 gallons per capita per day (gcd). The 2035 projected average daily flow based on this per capita flow and the population projected by CMAP is 3.06 mgd.
B. Per Capita Phosphorus Loads Similarly, the per capita phosphorus loading based on the limited influent sampling presented in Table 2.02-2 and a 2015 population of 36,900, is 0.0032 pounds per capita per day (pcd). This per capita loading would equate to a facility loading of 132 pounds per day in 2035. Table 2.03-1 shows the projected flows and phosphorus loadings.
Industry Date Phosphorus
(mg/L) Medline 10/15/2015 8.09 10/16/2015 6.66 10/27/2015 5.05 Ruprecht 10/14/2015 21.7 10/27/2015 14.8 Sysmex 10/20/2015 0.62 ZTrim 10/20/2015 1.39 10/21/2015 0.49
Table 2.02-4 Industrial Sampling Results
2015 2035 Population 36,900 41,700 Flow (gcd) 73.4 73.4 Flow (mgd) 2.71 3.06 Phosphorus (pcd) 0.0032 0.0032 Phosphorus (lb/day) 117 132
Table 2.03-1 Projected Flows and Phosphorus Loadings

SECTION 3 DESCRIPTION OF PHOSPHORUS REMOVAL ALTERNATIVES
Village of Mundelein, Illinois Phosphorus Feasibility Study Section 3–Description Of Phosphorus Removal Alternatives
Prepared by Strand Associates, Inc. 3-1 R:\MAD\Documents\Reports\Archive\2016\Mundelein, IL\PES.1669.005.vcw.oct\Report\S3.docx\031016
This section includes identifying preliminary alternatives to meet 1.0 mg/L, 0.5 mg/L, and 0.1 mg/L effluent phosphorus limits at the WRF on an annual and seasonal basis to satisfy Special Condition 18 in the Village’s NPDES permit. 3.01 CHEMICAL PHOSPHORUS REMOVAL ALTERNATIVES There are several metal salt solutions that can be added to wastewater that will react with soluble phosphate to produce solids that will more readily settle out in the clarifiers or be removed via filters. Ferric chloride (ferric) and aluminum sulfate (alum) are two of the most commonly used chemicals in wastewater treatment for phosphorus removal. Ferrous chloride and ferric sulfate are also used, although less frequently. A new class of chemicals utilizing rare earth compounds has recently been introduced to the market and has been showing promising results in initial testing and operations. Implementation of a CPR alternative would include chemical storage tanks, a means of mixing and flocculation, chemical dosing pumps, and other miscellaneous equipment. CPR is an operationally simple process when meeting higher phosphorus effluent concentrations (0.5 mg/L and 1.0 mg/L) but can be more challenging when attempting to achieve very low effluent concentrations (0.1 mg/L). CPR can also substantially increase the amount of solids generated potentially impacting the capacity of sludge handling and storage facilities. The amounts of additional solids generated by CPR can be estimated using influent phosphorus concentrations and projected chemical doses. There are several possible chemical application locations that could be used to meet the various limits. These are ahead of the primary clarifiers, after the primary clarifiers before aeration, in the aeration tank effluent channel(s), in the ML junction manhole where the effluent from the two aeration tanks combine, at the ML division box, and at the filter influent flow division chamber. The chemical application point used for the higher level limits would likely be after the primary clarifiers before aeration, in the aeration tank effluent channel(s), or in the ML junction manhole. Multipoint chemical addition would likely be required to meet the 0.5 or 0.1 mg/L effluent limit. The final design should include multiple possible application points to allow for optimization of chemical dosing. Pilot testing of the multipoint chemical addition should be performed to determine whether the 0.1 mg/L limit can be reliably met without the addition of an additional tertiary treatment process. 3.02 CHEMICAL PHOSPHORUS REMOVAL JAR TESTING RESULTS One trial of jar testing has been performed to determine the effectiveness and estimate the required doses of three chemicals, ferric, alum, and SorbX®-100, one of the new rare earth chemicals. In each of the jar tests, a gang mixer with five jars containing ML was used to simultaneously test four doses of each of the CPR chemicals with one control jar that had no chemical added. The jar testing procedure was as follows:
1. Add selected chemical dose with rapid mixing. 2. Rapid mix for 2 minutes. 3. Slow mix for 5 minutes to allow flocculation. 4. Settle, unmixed, for 1 hour. 5. Sample jar and analyze for TP (TP), orthophosphorus (OP), and pH. Analyze jar No. 1
(control) and No. 3 (middle dose) for alkalinity.
Village of Mundelein, Illinois Phosphorus Feasibility Study Section 3–Description Of Phosphorus Removal Alternatives
Prepared by Strand Associates, Inc. 3-2 R:\MAD\Documents\Reports\Archive\2016\Mundelein, IL\PES.1669.005.vcw.oct\Report\S3.docx\031016
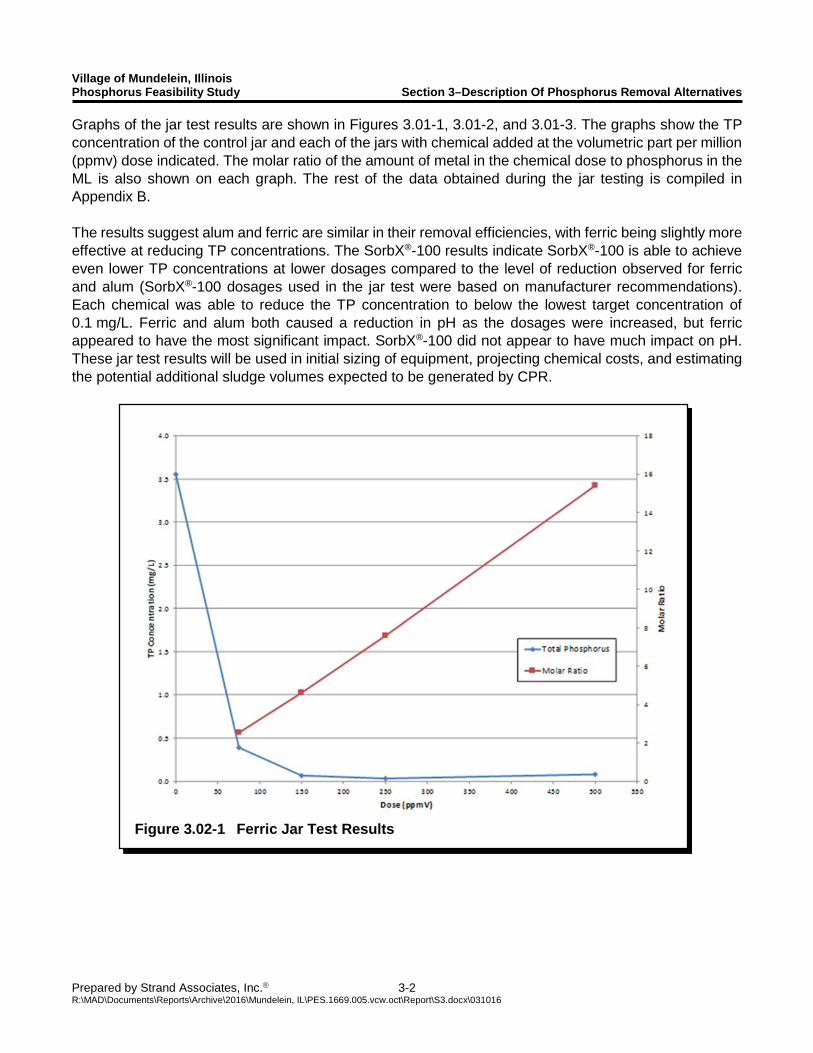
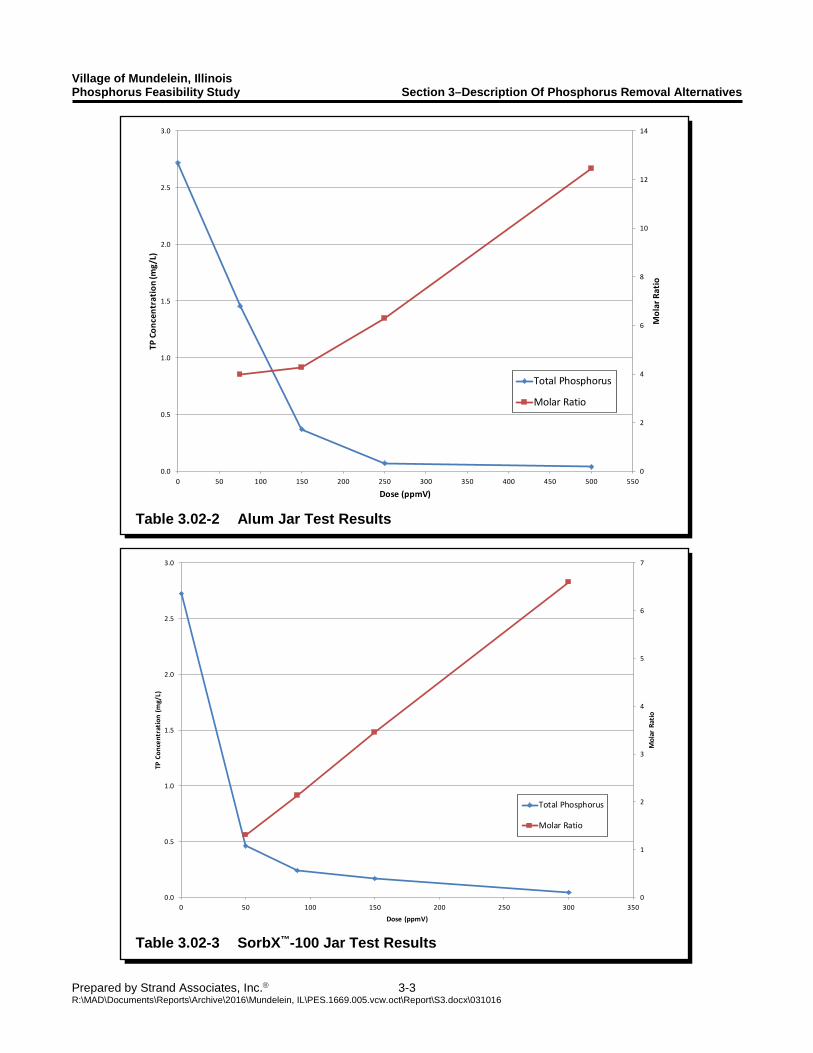
Graphs of the jar test results are shown in Figures 3.01-1, 3.01-2, and 3.01-3. The graphs show the TP concentration of the control jar and each of the jars with chemical added at the volumetric part per million (ppmv) dose indicated. The molar ratio of the amount of metal in the chemical dose to phosphorus in the ML is also shown on each graph. The rest of the data obtained during the jar testing is compiled in Appendix B. The results suggest alum and ferric are similar in their removal efficiencies, with ferric being slightly more effective at reducing TP concentrations. The SorbX®-100 results indicate SorbX®-100 is able to achieve even lower TP concentrations at lower dosages compared to the level of reduction observed for ferric and alum (SorbX®-100 dosages used in the jar test were based on manufacturer recommendations). Each chemical was able to reduce the TP concentration to below the lowest target concentration of 0.1 mg/L. Ferric and alum both caused a reduction in pH as the dosages were increased, but ferric appeared to have the most significant impact. SorbX®-100 did not appear to have much impact on pH. These jar test results will be used in initial sizing of equipment, projecting chemical costs, and estimating the potential additional sludge volumes expected to be generated by CPR.
Figure 3.02-1 Ferric Jar Test Results
Village of Mundelein, Illinois Phosphorus Feasibility Study Section 3–Description Of Phosphorus Removal Alternatives
Prepared by Strand Associates, Inc. 3-3 R:\MAD\Documents\Reports\Archive\2016\Mundelein, IL\PES.1669.005.vcw.oct\Report\S3.docx\031016
Table 3.02-3 SorbX™-100 Jar Test Results
Table 3.02-2 Alum Jar Test Results
0
1
2
3
4
5
6
7
0.0
0.5
1.0
1.5
2.0
2.5
3.0
0 50 100 150 200 250 300 350
Mol
ar R
atio
TP C
once
ntra
tion
(mg/
L)
Dose (ppmV)
Total Phosphorus
Molar Ratio
0
2
4
6
8
10
12
14
0.0
0.5
1.0
1.5
2.0
2.5
3.0
0 50 100 150 200 250 300 350 400 450 500 550
Mol
ar R
atio
TP C
once
ntra
tion
(mg/
L)
Dose (ppmV)
Total Phosphorus
Molar Ratio
Village of Mundelein, Illinois Phosphorus Feasibility Study Section 3–Description Of Phosphorus Removal Alternatives
Prepared by Strand Associates, Inc. 3-4 R:\MAD\Documents\Reports\Archive\2016\Mundelein, IL\PES.1669.005.vcw.oct\Report\S3.docx\031016
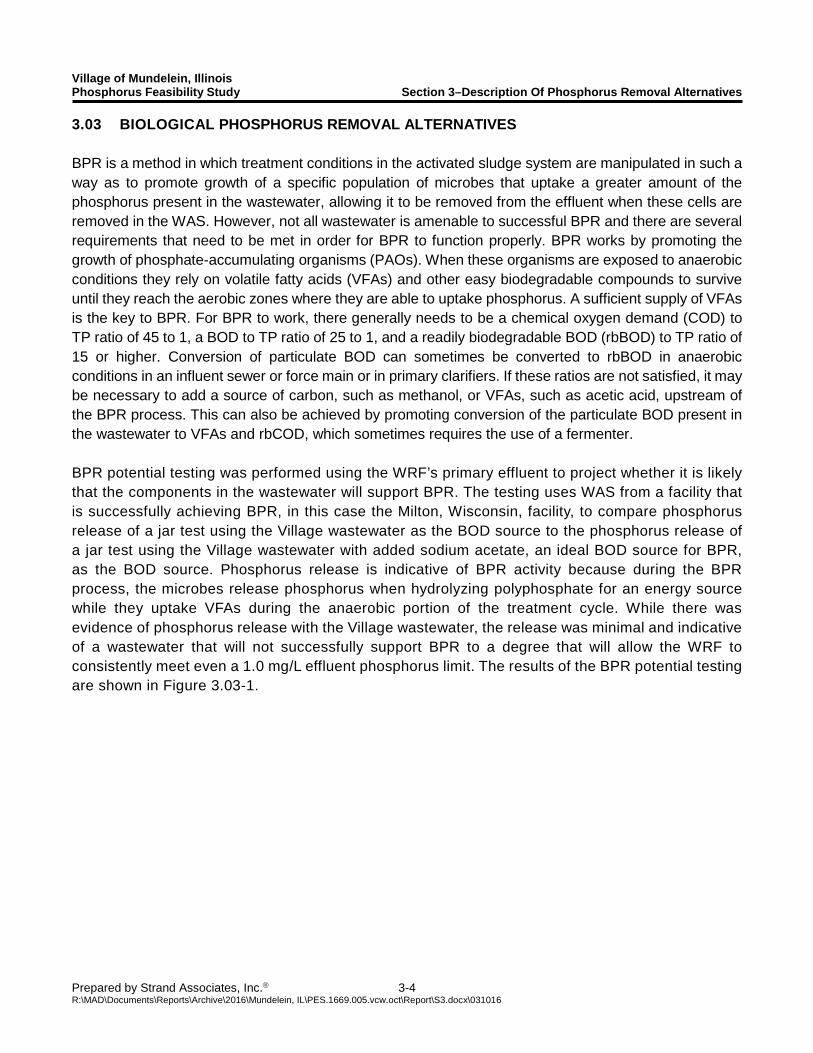
3.03 BIOLOGICAL PHOSPHORUS REMOVAL ALTERNATIVES BPR is a method in which treatment conditions in the activated sludge system are manipulated in such a way as to promote growth of a specific population of microbes that uptake a greater amount of the phosphorus present in the wastewater, allowing it to be removed from the effluent when these cells are removed in the WAS. However, not all wastewater is amenable to successful BPR and there are several requirements that need to be met in order for BPR to function properly. BPR works by promoting the growth of phosphate-accumulating organisms (PAOs). When these organisms are exposed to anaerobic conditions they rely on volatile fatty acids (VFAs) and other easy biodegradable compounds to survive until they reach the aerobic zones where they are able to uptake phosphorus. A sufficient supply of VFAs is the key to BPR. For BPR to work, there generally needs to be a chemical oxygen demand (COD) to TP ratio of 45 to 1, a BOD to TP ratio of 25 to 1, and a readily biodegradable BOD (rbBOD) to TP ratio of 15 or higher. Conversion of particulate BOD can sometimes be converted to rbBOD in anaerobic conditions in an influent sewer or force main or in primary clarifiers. If these ratios are not satisfied, it may be necessary to add a source of carbon, such as methanol, or VFAs, such as acetic acid, upstream of the BPR process. This can also be achieved by promoting conversion of the particulate BOD present in the wastewater to VFAs and rbCOD, which sometimes requires the use of a fermenter.
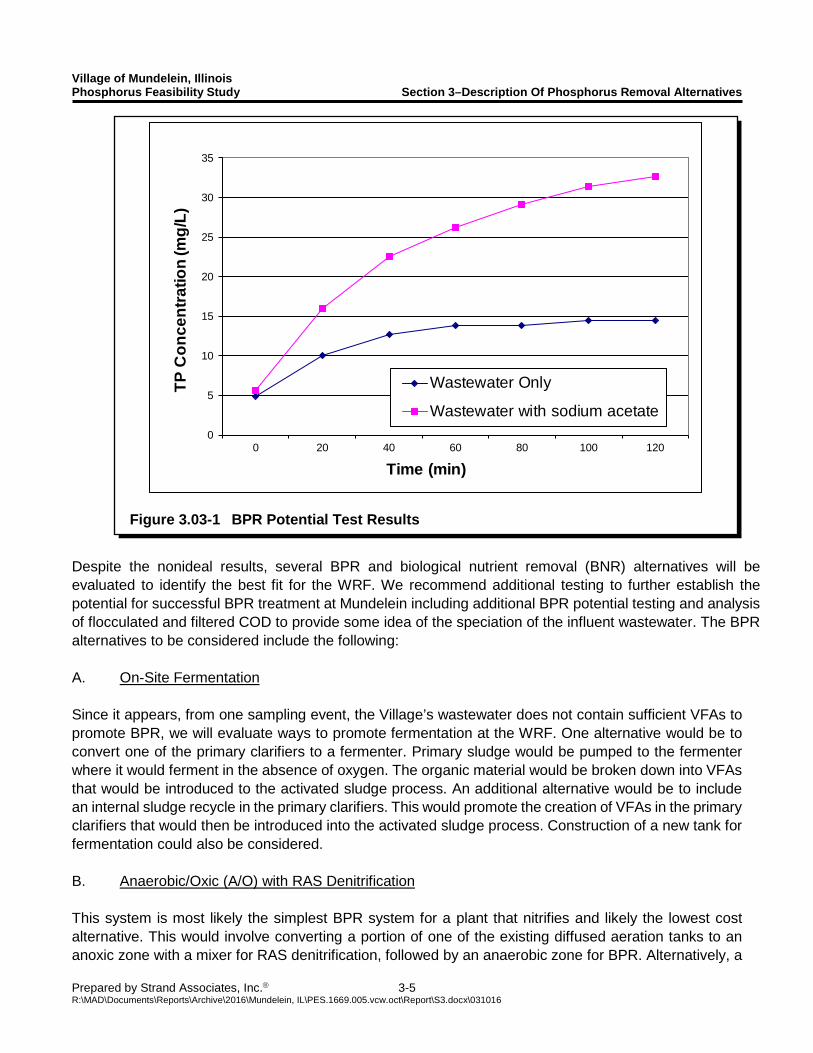
BPR potential testing was performed using the WRF’s primary effluent to project whether it is likely that the components in the wastewater will support BPR. The testing uses WAS from a facility that is successfully achieving BPR, in this case the Milton, Wisconsin, facility, to compare phosphorus release of a jar test using the Village wastewater as the BOD source to the phosphorus release of a jar test using the Village wastewater with added sodium acetate, an ideal BOD source for BPR, as the BOD source. Phosphorus release is indicative of BPR activity because during the BPR process, the microbes release phosphorus when hydrolyzing polyphosphate for an energy source while they uptake VFAs during the anaerobic portion of the treatment cycle. While there was evidence of phosphorus release with the Village wastewater, the release was minimal and indicative of a wastewater that will not successfully support BPR to a degree that will allow the WRF to consistently meet even a 1.0 mg/L effluent phosphorus limit. The results of the BPR potential testing are shown in Figure 3.03-1.
Village of Mundelein, Illinois Phosphorus Feasibility Study Section 3–Description Of Phosphorus Removal Alternatives
Prepared by Strand Associates, Inc. 3-5 R:\MAD\Documents\Reports\Archive\2016\Mundelein, IL\PES.1669.005.vcw.oct\Report\S3.docx\031016
Despite the nonideal results, several BPR and biological nutrient removal (BNR) alternatives will be evaluated to identify the best fit for the WRF. We recommend additional testing to further establish the potential for successful BPR treatment at Mundelein including additional BPR potential testing and analysis of flocculated and filtered COD to provide some idea of the speciation of the influent wastewater. The BPR alternatives to be considered include the following:
A. On-Site Fermentation
Since it appears, from one sampling event, the Village’s wastewater does not contain sufficient VFAs to promote BPR, we will evaluate ways to promote fermentation at the WRF. One alternative would be to convert one of the primary clarifiers to a fermenter. Primary sludge would be pumped to the fermenter where it would ferment in the absence of oxygen. The organic material would be broken down into VFAs that would be introduced to the activated sludge process. An additional alternative would be to include an internal sludge recycle in the primary clarifiers. This would promote the creation of VFAs in the primary clarifiers that would then be introduced into the activated sludge process. Construction of a new tank for fermentation could also be considered. B. Anaerobic/Oxic (A/O) with RAS Denitrification
This system is most likely the simplest BPR system for a plant that nitrifies and likely the lowest cost alternative. This would involve converting a portion of one of the existing diffused aeration tanks to an anoxic zone with a mixer for RAS denitrification, followed by an anaerobic zone for BPR. Alternatively, a
Figure 3.03-1 BPR Potential Test Results
0
5
10
15
20
25
30
35
0 20 40 60 80 100 120
TP C
once
ntra
tion
(mg/
L)
Time (min)
Wastewater Only
Wastewater with sodium acetate
Village of Mundelein, Illinois Phosphorus Feasibility Study Section 3–Description Of Phosphorus Removal Alternatives
Prepared by Strand Associates, Inc. 3-6 R:\MAD\Documents\Reports\Archive\2016\Mundelein, IL\PES.1669.005.vcw.oct\Report\S3.docx\031016
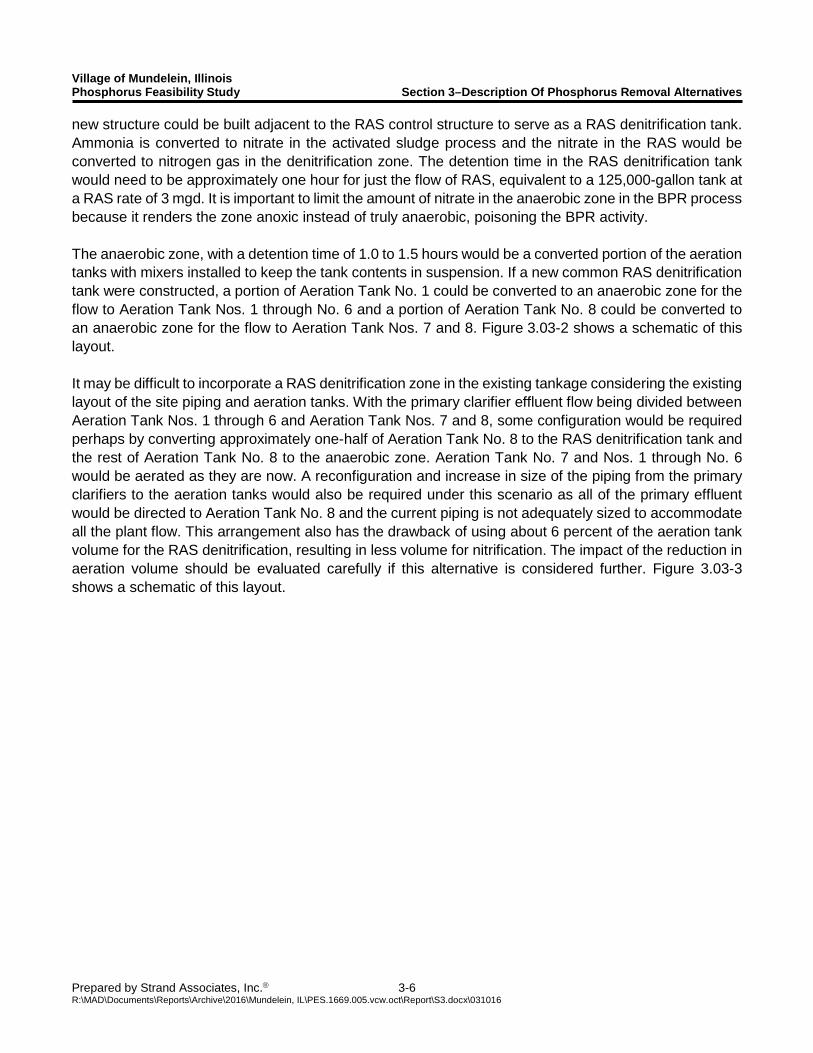
new structure could be built adjacent to the RAS control structure to serve as a RAS denitrification tank. Ammonia is converted to nitrate in the activated sludge process and the nitrate in the RAS would be converted to nitrogen gas in the denitrification zone. The detention time in the RAS denitrification tank would need to be approximately one hour for just the flow of RAS, equivalent to a 125,000-gallon tank at a RAS rate of 3 mgd. It is important to limit the amount of nitrate in the anaerobic zone in the BPR process because it renders the zone anoxic instead of truly anaerobic, poisoning the BPR activity. The anaerobic zone, with a detention time of 1.0 to 1.5 hours would be a converted portion of the aeration tanks with mixers installed to keep the tank contents in suspension. If a new common RAS denitrification tank were constructed, a portion of Aeration Tank No. 1 could be converted to an anaerobic zone for the flow to Aeration Tank Nos. 1 through No. 6 and a portion of Aeration Tank No. 8 could be converted to an anaerobic zone for the flow to Aeration Tank Nos. 7 and 8. Figure 3.03-2 shows a schematic of this layout. It may be difficult to incorporate a RAS denitrification zone in the existing tankage considering the existing layout of the site piping and aeration tanks. With the primary clarifier effluent flow being divided between Aeration Tank Nos. 1 through 6 and Aeration Tank Nos. 7 and 8, some configuration would be required perhaps by converting approximately one-half of Aeration Tank No. 8 to the RAS denitrification tank and the rest of Aeration Tank No. 8 to the anaerobic zone. Aeration Tank No. 7 and Nos. 1 through No. 6 would be aerated as they are now. A reconfiguration and increase in size of the piping from the primary clarifiers to the aeration tanks would also be required under this scenario as all of the primary effluent would be directed to Aeration Tank No. 8 and the current piping is not adequately sized to accommodate all the plant flow. This arrangement also has the drawback of using about 6 percent of the aeration tank volume for the RAS denitrification, resulting in less volume for nitrification. The impact of the reduction in aeration volume should be evaluated carefully if this alternative is considered further. Figure 3.03-3 shows a schematic of this layout.
Village of Mundelein, Illinois Phosphorus Feasibility Study Section 3–Description Of Phosphorus Removal Alternatives
Prepared by Strand Associates, Inc. 3-7 R:\MAD\Documents\Reports\Archive\2016\Mundelein, IL\PES.1669.005.vcw.oct\Report\S3.docx\031016
Figure 3.03-2 Potential A/O with RAS Nitrification BPR Arrangement
No. 8
No. 5 No. 6No. 4
No. 3No. 2No. 1
No. 7
Aeration Tanks
Aeration Tanks
Prim
ary
Clar
ifier
s
RAS
Primary ClarifierEffluent
ToFinal
ClarifiersMixed Liquor
MixedLiquor
RAS Vault
RAS Denitrification
Tank
AnaerobicZone
AnaerobicZone
Village of Mundelein, Illinois Phosphorus Feasibility Study Section 3–Description Of Phosphorus Removal Alternatives
Prepared by Strand Associates, Inc. 3-8 R:\MAD\Documents\Reports\Archive\2016\Mundelein, IL\PES.1669.005.vcw.oct\Report\S3.docx\031016
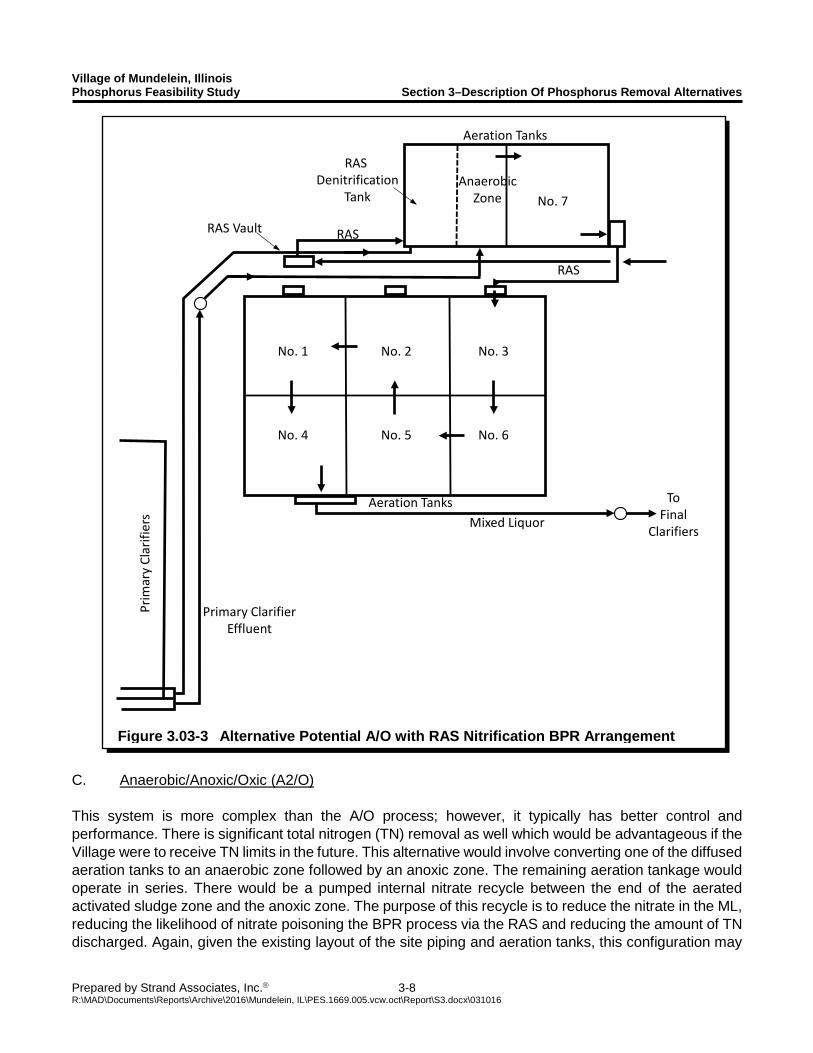
C. Anaerobic/Anoxic/Oxic (A2/O)
This system is more complex than the A/O process; however, it typically has better control and performance. There is significant total nitrogen (TN) removal as well which would be advantageous if the Village were to receive TN limits in the future. This alternative would involve converting one of the diffused aeration tanks to an anaerobic zone followed by an anoxic zone. The remaining aeration tankage would operate in series. There would be a pumped internal nitrate recycle between the end of the aerated activated sludge zone and the anoxic zone. The purpose of this recycle is to reduce the nitrate in the ML, reducing the likelihood of nitrate poisoning the BPR process via the RAS and reducing the amount of TN discharged. Again, given the existing layout of the site piping and aeration tanks, this configuration may
Figure 3.03-3 Alternative Potential A/O with RAS Nitrification BPR Arrangement
No. 5 No. 6No. 4
No. 3No. 2No. 1
No. 7
Aeration Tanks
Aeration Tanks
Prim
ary
Clar
ifier
s
RAS
Primary ClarifierEffluent
ToFinal
ClarifiersMixed Liquor
RAS Vault
RAS Denitrification
TankAnaerobic
Zone
RAS
Village of Mundelein, Illinois Phosphorus Feasibility Study Section 3–Description Of Phosphorus Removal Alternatives
Prepared by Strand Associates, Inc. 3-9 R:\MAD\Documents\Reports\Archive\2016\Mundelein, IL\PES.1669.005.vcw.oct\Report\S3.docx\031016
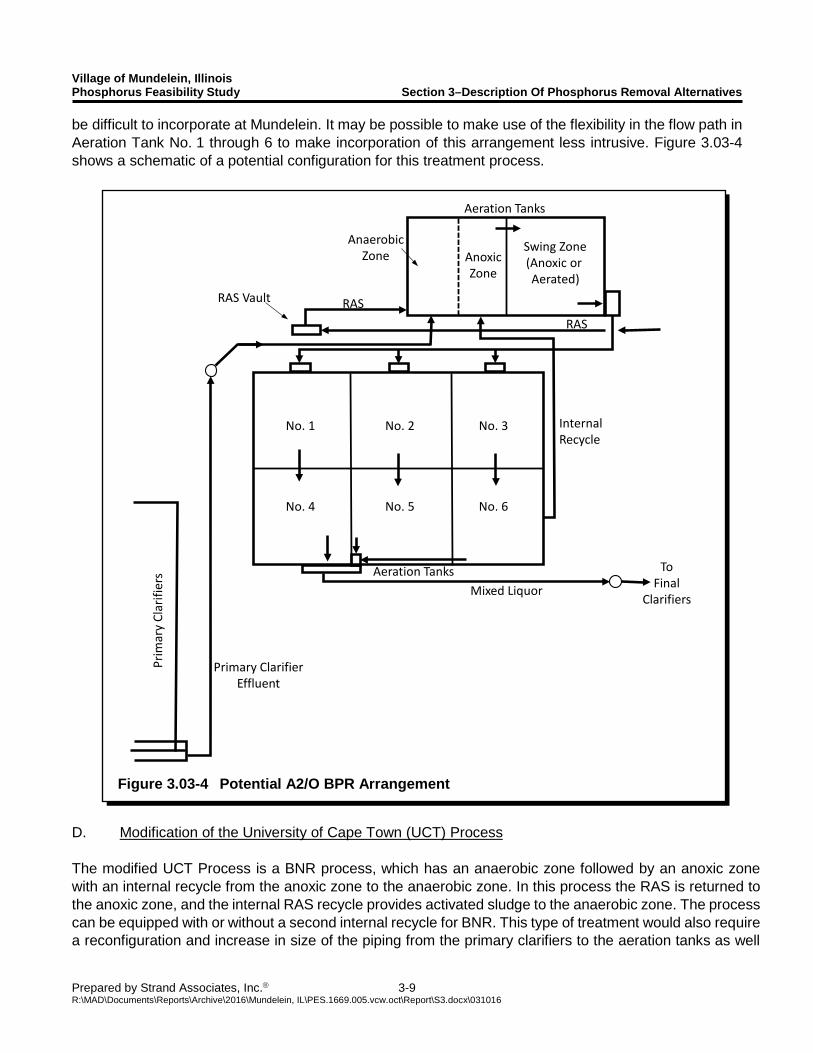
be difficult to incorporate at Mundelein. It may be possible to make use of the flexibility in the flow path in Aeration Tank No. 1 through 6 to make incorporation of this arrangement less intrusive. Figure 3.03-4 shows a schematic of a potential configuration for this treatment process.
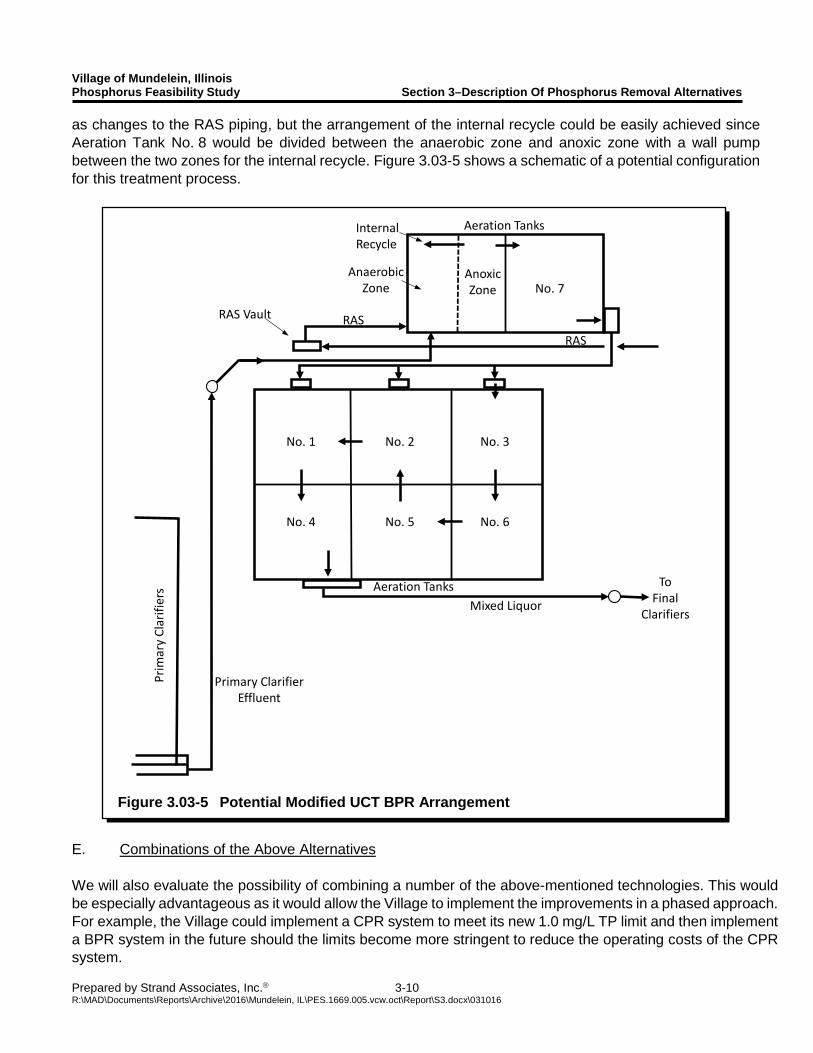
D. Modification of the University of Cape Town (UCT) Process The modified UCT Process is a BNR process, which has an anaerobic zone followed by an anoxic zone with an internal recycle from the anoxic zone to the anaerobic zone. In this process the RAS is returned to the anoxic zone, and the internal RAS recycle provides activated sludge to the anaerobic zone. The process can be equipped with or without a second internal recycle for BNR. This type of treatment would also require a reconfiguration and increase in size of the piping from the primary clarifiers to the aeration tanks as well
Figure 3.03-4 Potential A2/O BPR Arrangement
No. 5 No. 6No. 4
No. 3No. 2No. 1
Swing Zone(Anoxic or Aerated)
Aeration Tanks
Aeration Tanks
Prim
ary
Clar
ifier
s
RAS
Primary ClarifierEffluent
ToFinal
ClarifiersMixed Liquor
RAS Vault
AnaerobicZone
RAS
AnoxicZone
Internal Recycle
Village of Mundelein, Illinois Phosphorus Feasibility Study Section 3–Description Of Phosphorus Removal Alternatives
Prepared by Strand Associates, Inc. 3-10 R:\MAD\Documents\Reports\Archive\2016\Mundelein, IL\PES.1669.005.vcw.oct\Report\S3.docx\031016
as changes to the RAS piping, but the arrangement of the internal recycle could be easily achieved since Aeration Tank No. 8 would be divided between the anaerobic zone and anoxic zone with a wall pump between the two zones for the internal recycle. Figure 3.03-5 shows a schematic of a potential configuration for this treatment process.
E. Combinations of the Above Alternatives
We will also evaluate the possibility of combining a number of the above-mentioned technologies. This would be especially advantageous as it would allow the Village to implement the improvements in a phased approach. For example, the Village could implement a CPR system to meet its new 1.0 mg/L TP limit and then implement a BPR system in the future should the limits become more stringent to reduce the operating costs of the CPR system.
Figure 3.03-5 Potential Modified UCT BPR Arrangement
No. 5 No. 6No. 4
No. 3No. 2No. 1
No. 7
Aeration Tanks
Aeration Tanks
Prim
ary
Clar
ifier
s
RAS
Primary ClarifierEffluent
ToFinal
ClarifiersMixed Liquor
RAS Vault
AnaerobicZone
RAS
AnoxicZone
Internal Recycle
Village of Mundelein, Illinois Phosphorus Feasibility Study Section 3–Description Of Phosphorus Removal Alternatives
Prepared by Strand Associates, Inc. 3-11 R:\MAD\Documents\Reports\Archive\2016\Mundelein, IL\PES.1669.005.vcw.oct\Report\S3.docx\031016
3.04 TERTIARY TREATMENT ALTERNATIVES The following additional technologies will be preliminarily evaluated for the 0.1 mg/L limit, with chemical addition and flocculation facilities upstream.
1. Granular Media Filters For the purposes of this report it is assumed that the existing traveling bridge sand filters cannot be used for phosphorus removal to achieve lower limits. The ability to meet a 0.1 mg/L limit would need to be evaluated in cooperation with the original equipment manufacturer and through extensive pilot testing. Use of the existing sand filters to meet the 0.1 mg/L limit would likely be the most cost-effective alternative, if it is achievable. 2. Cloth Filters Cloth filters use disks, diamonds, or other configurations of the cloth media to remove coagulated phosphorus from the secondary clarifier effluent. A number of manufacturers have compact filter units, which can be easily installed. It is also sometimes possible to install these filters inside existing sand filter structures. 3. Reactive Filters The reactive filtration method involves continuously regenerating a reactive filter media while simultaneously filtering contaminants from fluid flowing through the filter media. Reactive filters are able to remove phosphorus by providing reactive surface sites within the media bed, which results in forced contact of chemical species with high adsorptive capacity. As wastewater flows through the reactive filter, waste chemicals, phosphorus, and solids are removed from the media bed through a backwash/reject stream. The reject stream is then recycled to the head of the plant and removed with primary sludge. 4. Ballasted Sedimentation Ballasted sedimentation is a coagulation/sedimentation treatment process that uses a ballast material and the addition of a coagulant and polymer to improve the settling properties of suspended solids. The ballast material provides surface area that enhances flocculation and acts as a weight to increase settling rates. The goal of a ballasted settling system is to form microfloc particles with a specific gravity of greater than two. This high density floc enables settling rates 10 to 60 times greater than conventional clarification. The increased settling rates allow for more compact clarifier designs with high overflow rates and short detention times, which may result in smaller overall system footprints. Example ballasted sedimentation technologies include CoMag and Actiflo. As with the cloth disks, it may be possible to install this type of treatment in the existing effluent filtration tanks. Given the lack of available open space on-site that is not in the floodplain, this may be the only practical way to incorporate this technology at Mundelein. This technology also has the benefit of being able to accommodate high peak flows, potentially increasing the peak flow capacity of the forward flow treatment at the facility, reducing the occurrence of partially treated peak flows discharges.
Village of Mundelein, Illinois Phosphorus Feasibility Study Section 3–Description Of Phosphorus Removal Alternatives
Prepared by Strand Associates, Inc. 3-12 R:\MAD\Documents\Reports\Archive\2016\Mundelein, IL\PES.1669.005.vcw.oct\Report\S3.docx\031016
5. Membrane filtration Membrane filtration provides a physical separation of the wastewater (permeate) and the solids. In today’s market, there are primarily three types of membranes, flat plate, hollow fiber, and spiral wound. Flat plate membranes typically have a larger pore size (0.08 to 0.4 microns) and use the combination of microfiltration or ultrafiltration and biofilm to remove solids. The biofilm that forms on the membrane surface creates a secondary membrane than can provide enhanced phosphorus removal. Hollow fiber membranes have a smaller pore size (around 0.04 microns) and rely on ultrafiltration to separate the solids. For both types of membranes, air is provided to scour the outer surface of the membranes. This technology can achieve very low effluent phosphorus concentrations but typically has high capital costs and high operational costs for power and chemicals.
3.05 IMPACT OF EXCESS FLOW DISCHARGES Because the WRF has facilities in place to allow a portion of flows to be discharged with only primary treatment and disinfection, it is important to consider the impact of excess flow events on average phosphorus discharges, especially at the lower effluent limits. Below are two scenarios showing the sensitivity of the lower limits to excess flow discharges. In the first scenario, the WRF has a seasonal (three month) effluent phosphorus limit of 0.5 mg/L and achieves an average effluent phosphorus concentration of 0.35 mg/L and has an average flow of 2.8 mgd. If the WRF experiences two excess flow events during the three-month period during which 5.5 mgd of partially treated flows are discharged with a phosphorus concentration of 4 mg/L, the average effluent phosphorus concentration would be 0.51 mg/L, violating the seasonal average. In a similar scenario with a six-month average effluent limit of 0.1 mg/L, which the WRF meets with an average discharge of 0.08 mg/L, it would only take one excess flow event of 2 mgd with an excess flow phosphorus concentration of 3 mg/L for the WRF to miss its six-month average limit. Given the potential impact of excess flow discharges on the average effluent concentrations, the ability to add phosphorus removal chemical to the primary clarifiers, before the division of excess flow and forward flow, is essential. 3.06 EFFECT OF DIFFERENT LIMIT DURATIONS The length of time over which the effluent limit is averaged can have an effect on the target concentration that the facility would attempt to achieve. For a monthly limit, there is less time for a high effluent concentration value to be “averaged out” for the facility to still be able to meet the limit. Conversely, for an annual average limit, one or even several high effluent samples can easily be negated by the sheer number of other values that will be included in the average calculation. USEPA provides some guidance on a statistical method for determination of limits of varying durations. Based on this guidance and typical operating experience, the target concentration used for dosing projections will be 90 percent of the annual limit, 82 percent of the seasonal limit, and 70 percent of the monthly limit.

SECTION 4 ALTERNATIVES ANALYSIS AND RECOMMENDATIONS
Village of Mundelein, Illinois Phosphorus Feasibility Study Section 4-Alternatives Analysis and Recommendations
Prepared by Strand Associates, Inc. 4-1 R:\MAD\Documents\Reports\Archive\2016\Mundelein, IL\PES.1669.005.vcw.oct\Report\S4.docx\031016
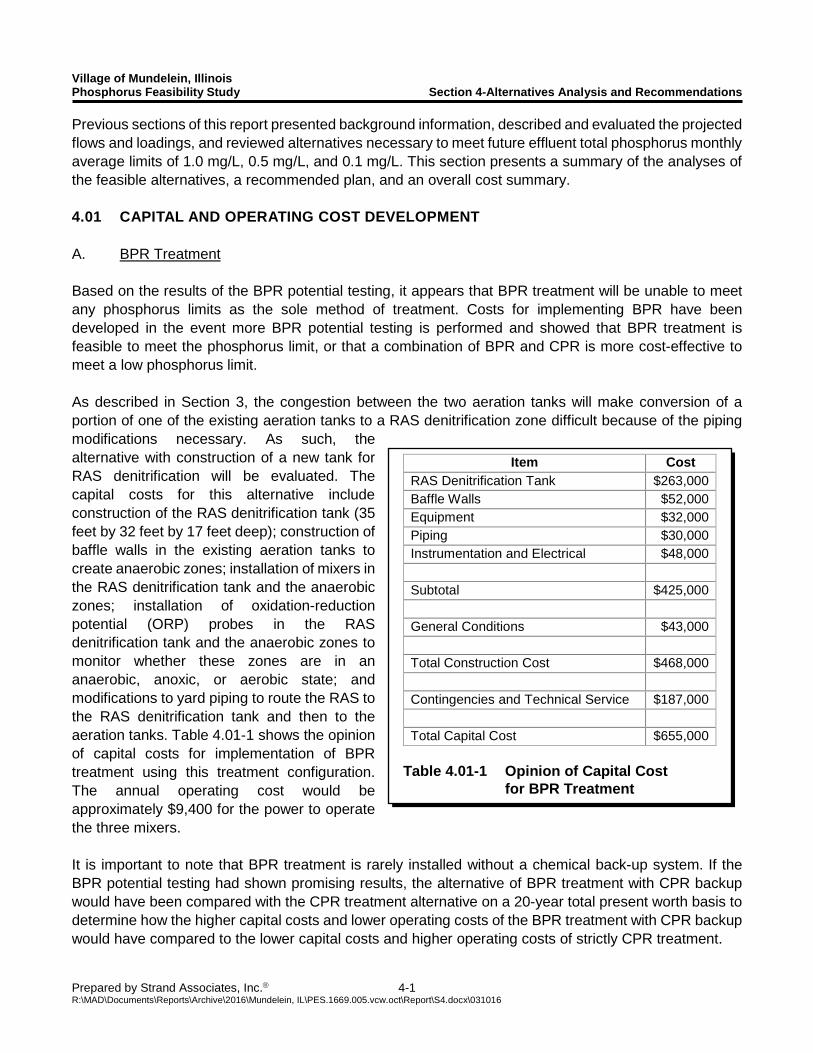
Previous sections of this report presented background information, described and evaluated the projected flows and loadings, and reviewed alternatives necessary to meet future effluent total phosphorus monthly average limits of 1.0 mg/L, 0.5 mg/L, and 0.1 mg/L. This section presents a summary of the analyses of the feasible alternatives, a recommended plan, and an overall cost summary. 4.01 CAPITAL AND OPERATING COST DEVELOPMENT A. BPR Treatment Based on the results of the BPR potential testing, it appears that BPR treatment will be unable to meet any phosphorus limits as the sole method of treatment. Costs for implementing BPR have been developed in the event more BPR potential testing is performed and showed that BPR treatment is feasible to meet the phosphorus limit, or that a combination of BPR and CPR is more cost-effective to meet a low phosphorus limit. As described in Section 3, the congestion between the two aeration tanks will make conversion of a portion of one of the existing aeration tanks to a RAS denitrification zone difficult because of the piping modifications necessary. As such, the alternative with construction of a new tank for RAS denitrification will be evaluated. The capital costs for this alternative include construction of the RAS denitrification tank (35 feet by 32 feet by 17 feet deep); construction of baffle walls in the existing aeration tanks to create anaerobic zones; installation of mixers in the RAS denitrification tank and the anaerobic zones; installation of oxidation-reduction potential (ORP) probes in the RAS denitrification tank and the anaerobic zones to monitor whether these zones are in an anaerobic, anoxic, or aerobic state; and modifications to yard piping to route the RAS to the RAS denitrification tank and then to the aeration tanks. Table 4.01-1 shows the opinion of capital costs for implementation of BPR treatment using this treatment configuration. The annual operating cost would be approximately $9,400 for the power to operate the three mixers. It is important to note that BPR treatment is rarely installed without a chemical back-up system. If the BPR potential testing had shown promising results, the alternative of BPR treatment with CPR backup would have been compared with the CPR treatment alternative on a 20-year total present worth basis to determine how the higher capital costs and lower operating costs of the BPR treatment with CPR backup would have compared to the lower capital costs and higher operating costs of strictly CPR treatment.
Item Cost RAS Denitrification Tank $263,000 Baffle Walls $52,000 Equipment $32,000 Piping $30,000 Instrumentation and Electrical $48,000 Subtotal $425,000 General Conditions $43,000 Total Construction Cost $468,000 Contingencies and Technical Service $187,000 Total Capital Cost $655,000
Table 4.01-1 Opinion of Capital Cost for BPR Treatment
Village of Mundelein, Illinois Phosphorus Feasibility Study Section 4-Alternatives Analysis and Recommendations
Prepared by Strand Associates, Inc. 4-2 R:\MAD\Documents\Reports\Archive\2016\Mundelein, IL\PES.1669.005.vcw.oct\Report\S4.docx\031016
B. CPR to Meet 1.0 mg/L Limit
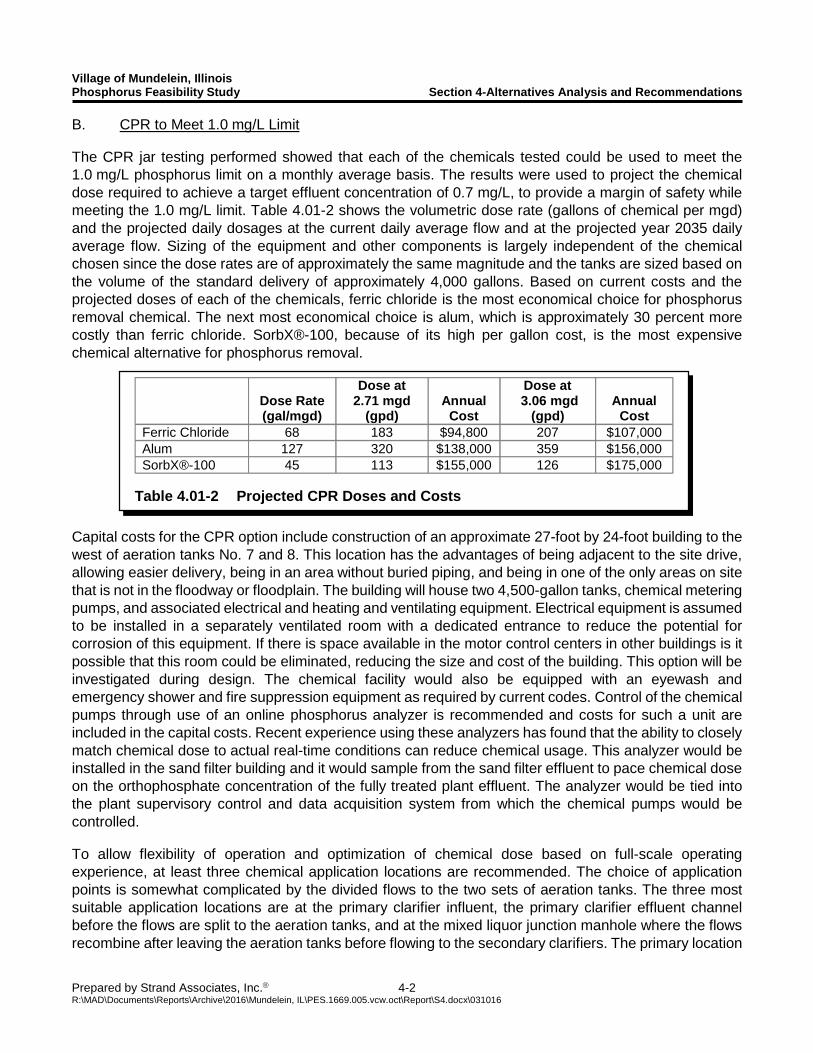
The CPR jar testing performed showed that each of the chemicals tested could be used to meet the 1.0 mg/L phosphorus limit on a monthly average basis. The results were used to project the chemical dose required to achieve a target effluent concentration of 0.7 mg/L, to provide a margin of safety while meeting the 1.0 mg/L limit. Table 4.01-2 shows the volumetric dose rate (gallons of chemical per mgd) and the projected daily dosages at the current daily average flow and at the projected year 2035 daily average flow. Sizing of the equipment and other components is largely independent of the chemical chosen since the dose rates are of approximately the same magnitude and the tanks are sized based on the volume of the standard delivery of approximately 4,000 gallons. Based on current costs and the projected doses of each of the chemicals, ferric chloride is the most economical choice for phosphorus removal chemical. The next most economical choice is alum, which is approximately 30 percent more costly than ferric chloride. SorbX®-100, because of its high per gallon cost, is the most expensive chemical alternative for phosphorus removal.
Capital costs for the CPR option include construction of an approximate 27-foot by 24-foot building to the west of aeration tanks No. 7 and 8. This location has the advantages of being adjacent to the site drive, allowing easier delivery, being in an area without buried piping, and being in one of the only areas on site that is not in the floodway or floodplain. The building will house two 4,500-gallon tanks, chemical metering pumps, and associated electrical and heating and ventilating equipment. Electrical equipment is assumed to be installed in a separately ventilated room with a dedicated entrance to reduce the potential for corrosion of this equipment. If there is space available in the motor control centers in other buildings is it possible that this room could be eliminated, reducing the size and cost of the building. This option will be investigated during design. The chemical facility would also be equipped with an eyewash and emergency shower and fire suppression equipment as required by current codes. Control of the chemical pumps through use of an online phosphorus analyzer is recommended and costs for such a unit are included in the capital costs. Recent experience using these analyzers has found that the ability to closely match chemical dose to actual real-time conditions can reduce chemical usage. This analyzer would be installed in the sand filter building and it would sample from the sand filter effluent to pace chemical dose on the orthophosphate concentration of the fully treated plant effluent. The analyzer would be tied into the plant supervisory control and data acquisition system from which the chemical pumps would be controlled.
To allow flexibility of operation and optimization of chemical dose based on full-scale operating experience, at least three chemical application locations are recommended. The choice of application points is somewhat complicated by the divided flows to the two sets of aeration tanks. The three most suitable application locations are at the primary clarifier influent, the primary clarifier effluent channel before the flows are split to the aeration tanks, and at the mixed liquor junction manhole where the flows recombine after leaving the aeration tanks before flowing to the secondary clarifiers. The primary location
Dose Rate (gal/mgd)
Dose at 2.71 mgd
(gpd) Annual
Cost
Dose at 3.06 mgd
(gpd) Annual
Cost Ferric Chloride 68 183 $94,800 207 $107,000 Alum 127 320 $138,000 359 $156,000 SorbX®-100 45 113 $155,000 126 $175,000
Table 4.01-2 Projected CPR Doses and Costs
Village of Mundelein, Illinois Phosphorus Feasibility Study Section 4-Alternatives Analysis and Recommendations
Prepared by Strand Associates, Inc. 4-3 R:\MAD\Documents\Reports\Archive\2016\Mundelein, IL\PES.1669.005.vcw.oct\Report\S4.docx\031016
can, in addition to phosphorus can be beneficial to downstream processes, especially digestion. Flocculation chemical addition in the primary can enhance primary solids removal, leading to an increase in biogas production in the digesters. Addition of iron to the primary sludge can also reduce hydrogen sulfide production in the digesters. Both of the secondary locations appears to provide both thorough mixing and residence time in a pipe for flocculation.
As described in Section 3, the impact of excess flows that are diverted around secondary and tertiary treatment on the phosphorus discharges must be considered when developing a phosphorus removal strategy. Since the only opportunity to remove phosphorus from these flows is in the primary clarifiers, the chemical application point ahead of the primary clarifiers becomes particularly important. Two potential locations are the grit tank effluent channel and the manhole between the grit tanks and the primary influent division box. The primary influent division box could also be used but it may not provide sufficient mixing to ensure complete distribution of the chemical in the wastewater leading to less effective chemical use.
There are two options for application of chemical at this location. A chemical feed pipe could be installed from the new chemical building that would be supplied by a dedicated pump or, if the dosing was only used during infrequent excess flow events (between one and three events each year), a portable chemical dosing system could be provided using a portable pump with the phosphorus removal chemical being supplied in a 330 gallon tote. Given that the screening building, the closest available space to the excess flow application point, is an explosion-rated space, addition of a pipe from the chemical building is recommended.
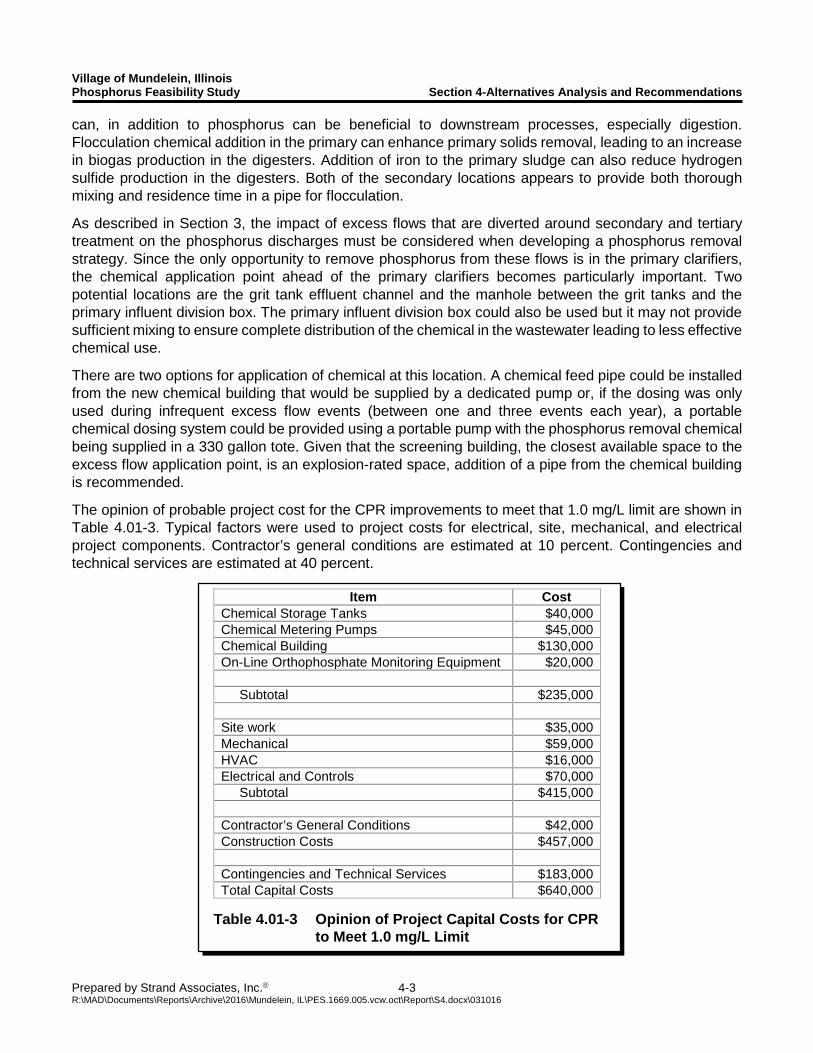
The opinion of probable project cost for the CPR improvements to meet that 1.0 mg/L limit are shown in Table 4.01-3. Typical factors were used to project costs for electrical, site, mechanical, and electrical project components. Contractor’s general conditions are estimated at 10 percent. Contingencies and technical services are estimated at 40 percent.
Item Cost Chemical Storage Tanks $40,000 Chemical Metering Pumps $45,000 Chemical Building $130,000 On-Line Orthophosphate Monitoring Equipment $20,000 Subtotal $235,000 Site work $35,000 Mechanical $59,000 HVAC $16,000 Electrical and Controls $70,000 Subtotal $415,000 Contractor’s General Conditions $42,000 Construction Costs $457,000 Contingencies and Technical Services $183,000 Total Capital Costs $640,000
Table 4.01-3 Opinion of Project Capital Costs for CPR to Meet 1.0 mg/L Limit
Village of Mundelein, Illinois Phosphorus Feasibility Study Section 4-Alternatives Analysis and Recommendations
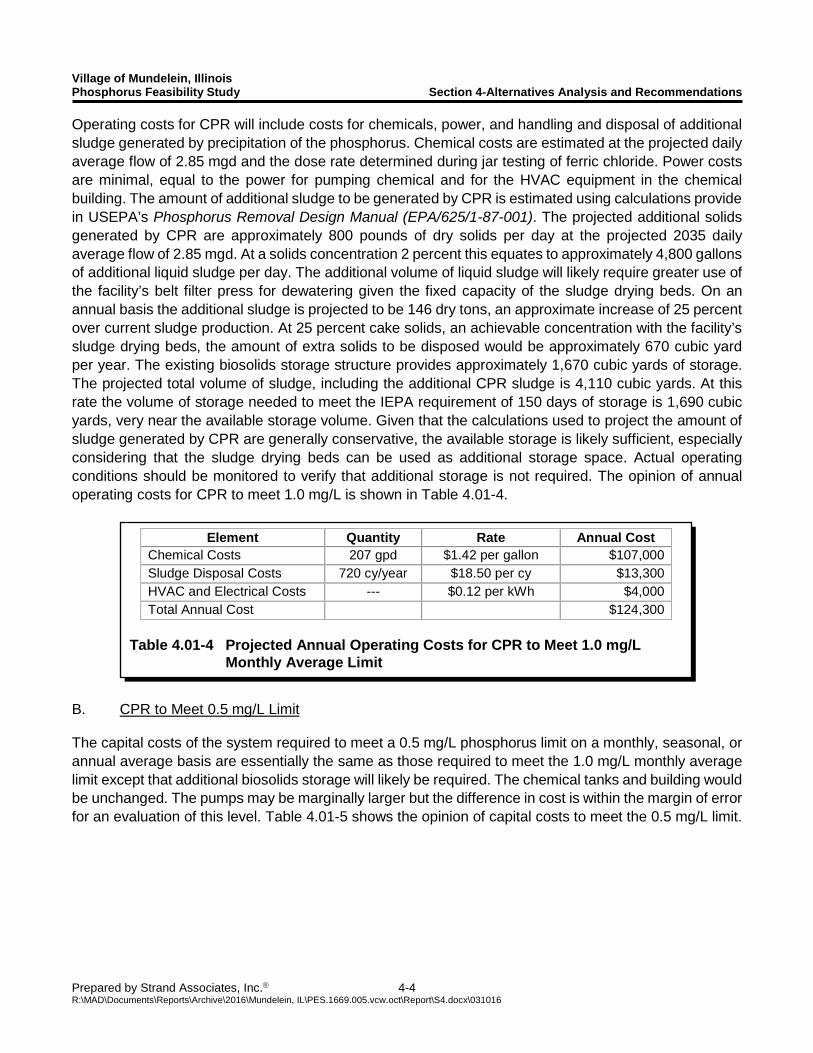
Prepared by Strand Associates, Inc. 4-4 R:\MAD\Documents\Reports\Archive\2016\Mundelein, IL\PES.1669.005.vcw.oct\Report\S4.docx\031016
Operating costs for CPR will include costs for chemicals, power, and handling and disposal of additional sludge generated by precipitation of the phosphorus. Chemical costs are estimated at the projected daily average flow of 2.85 mgd and the dose rate determined during jar testing of ferric chloride. Power costs are minimal, equal to the power for pumping chemical and for the HVAC equipment in the chemical building. The amount of additional sludge to be generated by CPR is estimated using calculations provide in USEPA’s Phosphorus Removal Design Manual (EPA/625/1-87-001). The projected additional solids generated by CPR are approximately 800 pounds of dry solids per day at the projected 2035 daily average flow of 2.85 mgd. At a solids concentration 2 percent this equates to approximately 4,800 gallons of additional liquid sludge per day. The additional volume of liquid sludge will likely require greater use of the facility’s belt filter press for dewatering given the fixed capacity of the sludge drying beds. On an annual basis the additional sludge is projected to be 146 dry tons, an approximate increase of 25 percent over current sludge production. At 25 percent cake solids, an achievable concentration with the facility’s sludge drying beds, the amount of extra solids to be disposed would be approximately 670 cubic yard per year. The existing biosolids storage structure provides approximately 1,670 cubic yards of storage. The projected total volume of sludge, including the additional CPR sludge is 4,110 cubic yards. At this rate the volume of storage needed to meet the IEPA requirement of 150 days of storage is 1,690 cubic yards, very near the available storage volume. Given that the calculations used to project the amount of sludge generated by CPR are generally conservative, the available storage is likely sufficient, especially considering that the sludge drying beds can be used as additional storage space. Actual operating conditions should be monitored to verify that additional storage is not required. The opinion of annual operating costs for CPR to meet 1.0 mg/L is shown in Table 4.01-4.
B. CPR to Meet 0.5 mg/L Limit The capital costs of the system required to meet a 0.5 mg/L phosphorus limit on a monthly, seasonal, or annual average basis are essentially the same as those required to meet the 1.0 mg/L monthly average limit except that additional biosolids storage will likely be required. The chemical tanks and building would be unchanged. The pumps may be marginally larger but the difference in cost is within the margin of error for an evaluation of this level. Table 4.01-5 shows the opinion of capital costs to meet the 0.5 mg/L limit.
Element Quantity Rate Annual Cost Chemical Costs 207 gpd $1.42 per gallon $107,000 Sludge Disposal Costs 720 cy/year $18.50 per cy $13,300 HVAC and Electrical Costs --- $0.12 per kWh $4,000 Total Annual Cost $124,300
Table 4.01-4 Projected Annual Operating Costs for CPR to Meet 1.0 mg/L
Monthly Average Limit
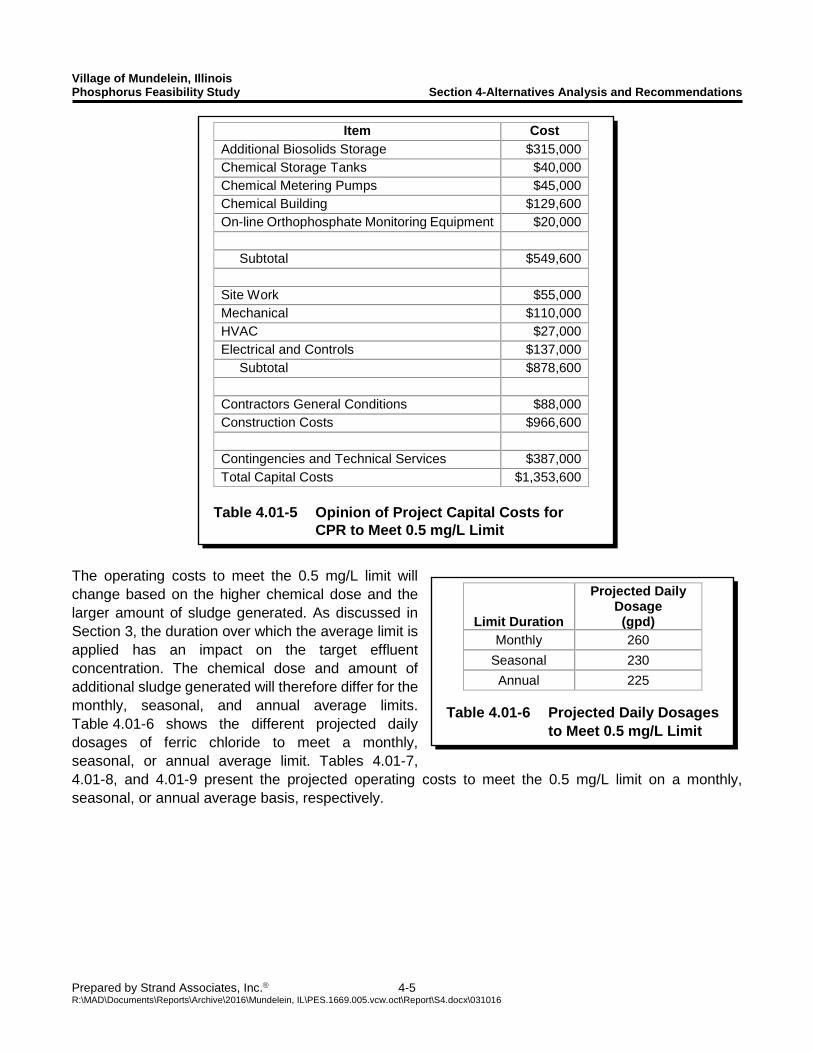
Village of Mundelein, Illinois Phosphorus Feasibility Study Section 4-Alternatives Analysis and Recommendations
Prepared by Strand Associates, Inc. 4-5 R:\MAD\Documents\Reports\Archive\2016\Mundelein, IL\PES.1669.005.vcw.oct\Report\S4.docx\031016
The operating costs to meet the 0.5 mg/L limit will change based on the higher chemical dose and the larger amount of sludge generated. As discussed in Section 3, the duration over which the average limit is applied has an impact on the target effluent concentration. The chemical dose and amount of additional sludge generated will therefore differ for the monthly, seasonal, and annual average limits. Table 4.01-6 shows the different projected daily dosages of ferric chloride to meet a monthly, seasonal, or annual average limit. Tables 4.01-7, 4.01-8, and 4.01-9 present the projected operating costs to meet the 0.5 mg/L limit on a monthly, seasonal, or annual average basis, respectively.
Item Cost Additional Biosolids Storage $315,000 Chemical Storage Tanks $40,000 Chemical Metering Pumps $45,000 Chemical Building $129,600 On-line Orthophosphate Monitoring Equipment $20,000 Subtotal $549,600 Site Work $55,000 Mechanical $110,000 HVAC $27,000 Electrical and Controls $137,000 Subtotal $878,600 Contractors General Conditions $88,000 Construction Costs $966,600 Contingencies and Technical Services $387,000 Total Capital Costs $1,353,600
Table 4.01-5 Opinion of Project Capital Costs for CPR to Meet 0.5 mg/L Limit
Limit Duration
Projected Daily Dosage (gpd)
Monthly 260
Seasonal 230
Annual 225 Table 4.01-6 Projected Daily Dosages to Meet 0.5 mg/L Limit
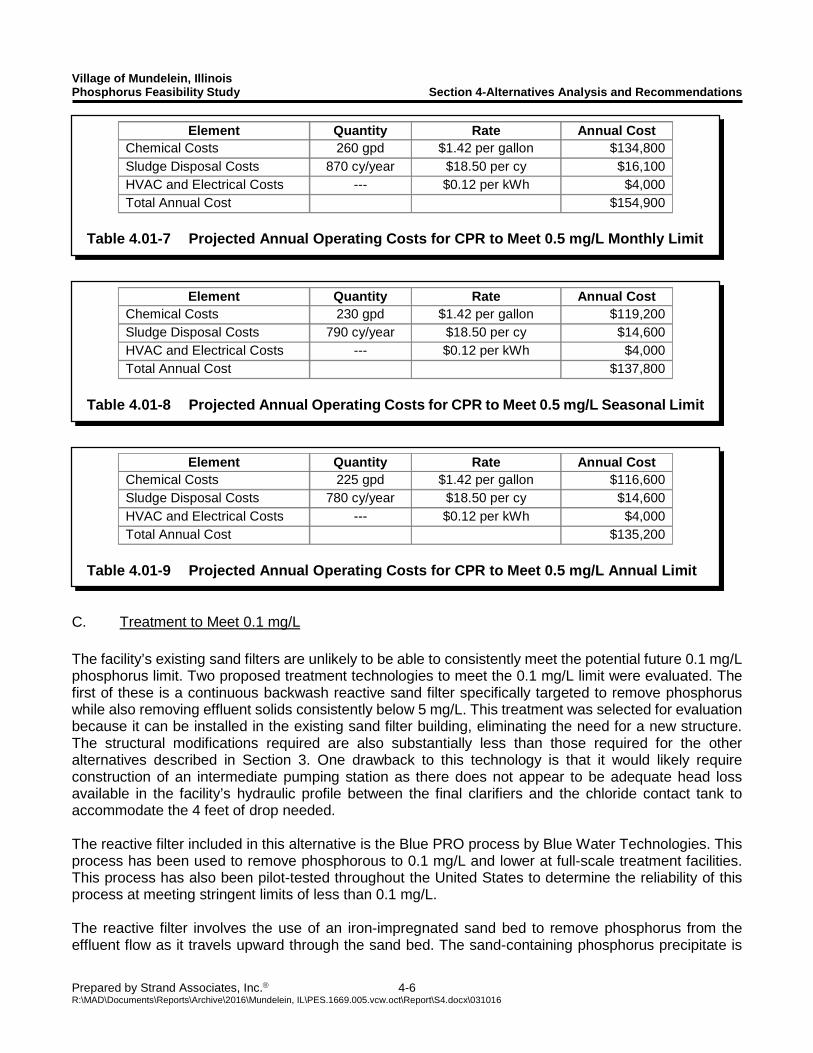
Village of Mundelein, Illinois Phosphorus Feasibility Study Section 4-Alternatives Analysis and Recommendations
Prepared by Strand Associates, Inc. 4-6 R:\MAD\Documents\Reports\Archive\2016\Mundelein, IL\PES.1669.005.vcw.oct\Report\S4.docx\031016
C. Treatment to Meet 0.1 mg/L The facility’s existing sand filters are unlikely to be able to consistently meet the potential future 0.1 mg/L phosphorus limit. Two proposed treatment technologies to meet the 0.1 mg/L limit were evaluated. The first of these is a continuous backwash reactive sand filter specifically targeted to remove phosphorus while also removing effluent solids consistently below 5 mg/L. This treatment was selected for evaluation because it can be installed in the existing sand filter building, eliminating the need for a new structure. The structural modifications required are also substantially less than those required for the other alternatives described in Section 3. One drawback to this technology is that it would likely require construction of an intermediate pumping station as there does not appear to be adequate head loss available in the facility’s hydraulic profile between the final clarifiers and the chloride contact tank to accommodate the 4 feet of drop needed. The reactive filter included in this alternative is the Blue PRO process by Blue Water Technologies. This process has been used to remove phosphorous to 0.1 mg/L and lower at full-scale treatment facilities. This process has also been pilot-tested throughout the United States to determine the reliability of this process at meeting stringent limits of less than 0.1 mg/L. The reactive filter involves the use of an iron-impregnated sand bed to remove phosphorus from the effluent flow as it travels upward through the sand bed. The sand-containing phosphorus precipitate is
Element Quantity Rate Annual Cost Chemical Costs 260 gpd $1.42 per gallon $134,800 Sludge Disposal Costs 870 cy/year $18.50 per cy $16,100 HVAC and Electrical Costs --- $0.12 per kWh $4,000 Total Annual Cost $154,900
Table 4.01-7 Projected Annual Operating Costs for CPR to Meet 0.5 mg/L Monthly Limit
Element Quantity Rate Annual Cost Chemical Costs 230 gpd $1.42 per gallon $119,200 Sludge Disposal Costs 790 cy/year $18.50 per cy $14,600 HVAC and Electrical Costs --- $0.12 per kWh $4,000 Total Annual Cost $137,800
Table 4.01-8 Projected Annual Operating Costs for CPR to Meet 0.5 mg/L Seasonal Limit
Element Quantity Rate Annual Cost Chemical Costs 225 gpd $1.42 per gallon $116,600 Sludge Disposal Costs 780 cy/year $18.50 per cy $14,600 HVAC and Electrical Costs --- $0.12 per kWh $4,000 Total Annual Cost $135,200
Table 4.01-9 Projected Annual Operating Costs for CPR to Meet 0.5 mg/L Annual Limit
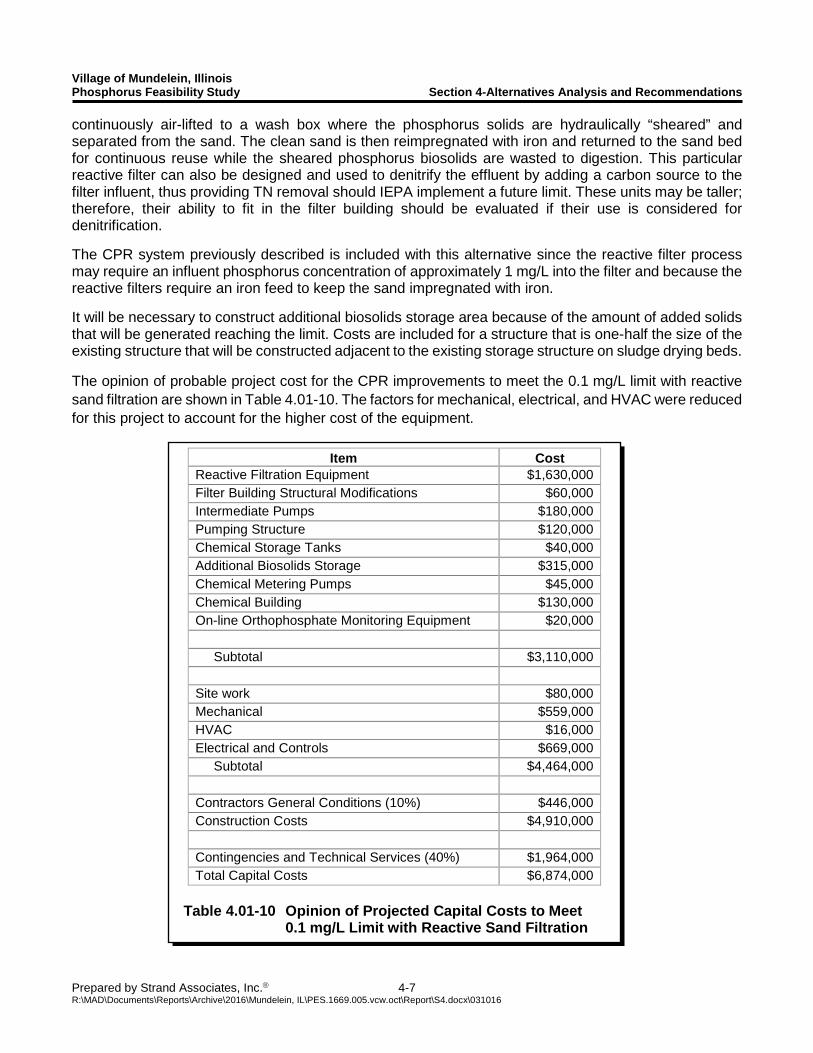
Village of Mundelein, Illinois Phosphorus Feasibility Study Section 4-Alternatives Analysis and Recommendations
Prepared by Strand Associates, Inc. 4-7 R:\MAD\Documents\Reports\Archive\2016\Mundelein, IL\PES.1669.005.vcw.oct\Report\S4.docx\031016
continuously air-lifted to a wash box where the phosphorus solids are hydraulically “sheared” and separated from the sand. The clean sand is then reimpregnated with iron and returned to the sand bed for continuous reuse while the sheared phosphorus biosolids are wasted to digestion. This particular reactive filter can also be designed and used to denitrify the effluent by adding a carbon source to the filter influent, thus providing TN removal should IEPA implement a future limit. These units may be taller; therefore, their ability to fit in the filter building should be evaluated if their use is considered for denitrification.
The CPR system previously described is included with this alternative since the reactive filter process may require an influent phosphorus concentration of approximately 1 mg/L into the filter and because the reactive filters require an iron feed to keep the sand impregnated with iron.
It will be necessary to construct additional biosolids storage area because of the amount of added solids that will be generated reaching the limit. Costs are included for a structure that is one-half the size of the existing structure that will be constructed adjacent to the existing storage structure on sludge drying beds.
The opinion of probable project cost for the CPR improvements to meet the 0.1 mg/L limit with reactive sand filtration are shown in Table 4.01-10. The factors for mechanical, electrical, and HVAC were reduced for this project to account for the higher cost of the equipment.
Item Cost Reactive Filtration Equipment $1,630,000 Filter Building Structural Modifications $60,000 Intermediate Pumps $180,000 Pumping Structure $120,000 Chemical Storage Tanks $40,000 Additional Biosolids Storage $315,000 Chemical Metering Pumps $45,000 Chemical Building $130,000 On-line Orthophosphate Monitoring Equipment $20,000 Subtotal $3,110,000 Site work $80,000 Mechanical $559,000 HVAC $16,000 Electrical and Controls $669,000 Subtotal $4,464,000 Contractors General Conditions (10%) $446,000 Construction Costs $4,910,000 Contingencies and Technical Services (40%) $1,964,000 Total Capital Costs $6,874,000
Table 4.01-10 Opinion of Projected Capital Costs to Meet 0.1 mg/L Limit with Reactive Sand Filtration
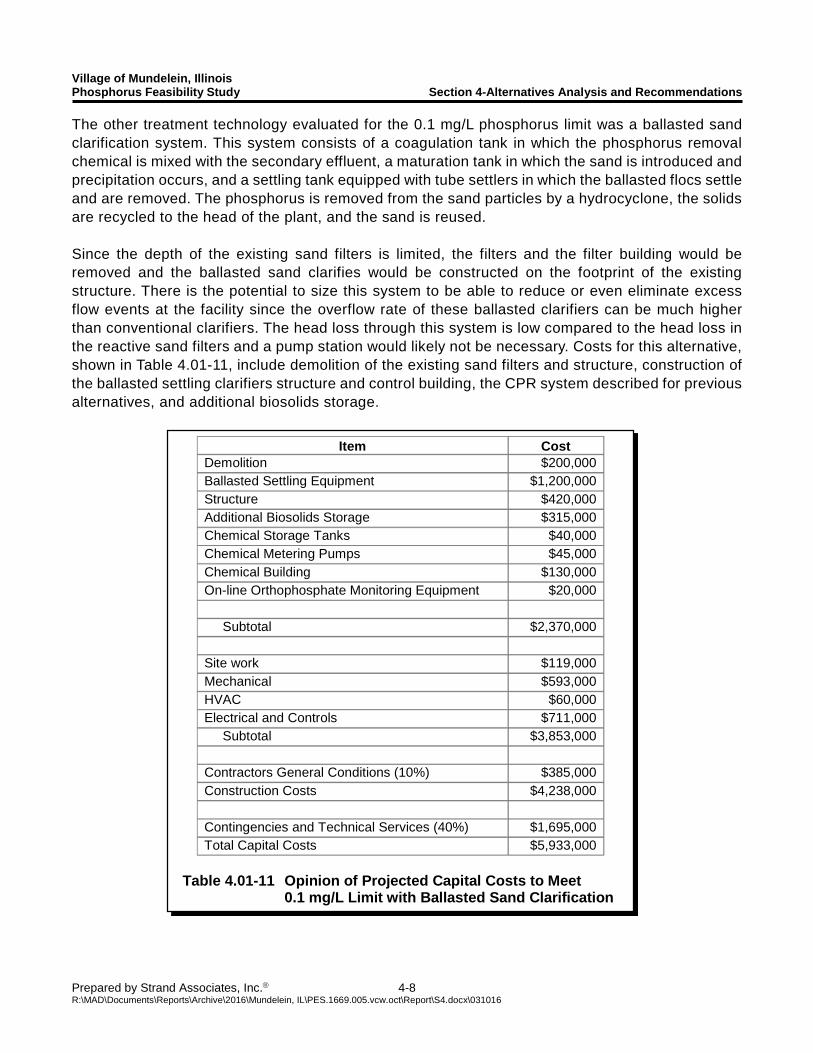
Village of Mundelein, Illinois Phosphorus Feasibility Study Section 4-Alternatives Analysis and Recommendations
Prepared by Strand Associates, Inc. 4-8 R:\MAD\Documents\Reports\Archive\2016\Mundelein, IL\PES.1669.005.vcw.oct\Report\S4.docx\031016
The other treatment technology evaluated for the 0.1 mg/L phosphorus limit was a ballasted sand clarification system. This system consists of a coagulation tank in which the phosphorus removal chemical is mixed with the secondary effluent, a maturation tank in which the sand is introduced and precipitation occurs, and a settling tank equipped with tube settlers in which the ballasted flocs settle and are removed. The phosphorus is removed from the sand particles by a hydrocyclone, the solids are recycled to the head of the plant, and the sand is reused. Since the depth of the existing sand filters is limited, the filters and the filter building would be removed and the ballasted sand clarifies would be constructed on the footprint of the existing structure. There is the potential to size this system to be able to reduce or even eliminate excess flow events at the facility since the overflow rate of these ballasted clarifiers can be much higher than conventional clarifiers. The head loss through this system is low compared to the head loss in the reactive sand filters and a pump station would likely not be necessary. Costs for this alternative, shown in Table 4.01-11, include demolition of the existing sand filters and structure, construction of the ballasted settling clarifiers structure and control building, the CPR system described for previous alternatives, and additional biosolids storage.
Item Cost Demolition $200,000 Ballasted Settling Equipment $1,200,000 Structure $420,000 Additional Biosolids Storage $315,000 Chemical Storage Tanks $40,000 Chemical Metering Pumps $45,000 Chemical Building $130,000 On-line Orthophosphate Monitoring Equipment $20,000 Subtotal $2,370,000 Site work $119,000 Mechanical $593,000 HVAC $60,000 Electrical and Controls $711,000 Subtotal $3,853,000 Contractors General Conditions (10%) $385,000 Construction Costs $4,238,000 Contingencies and Technical Services (40%) $1,695,000 Total Capital Costs $5,933,000
Table 4.01-11 Opinion of Projected Capital Costs to Meet 0.1 mg/L Limit with Ballasted Sand Clarification
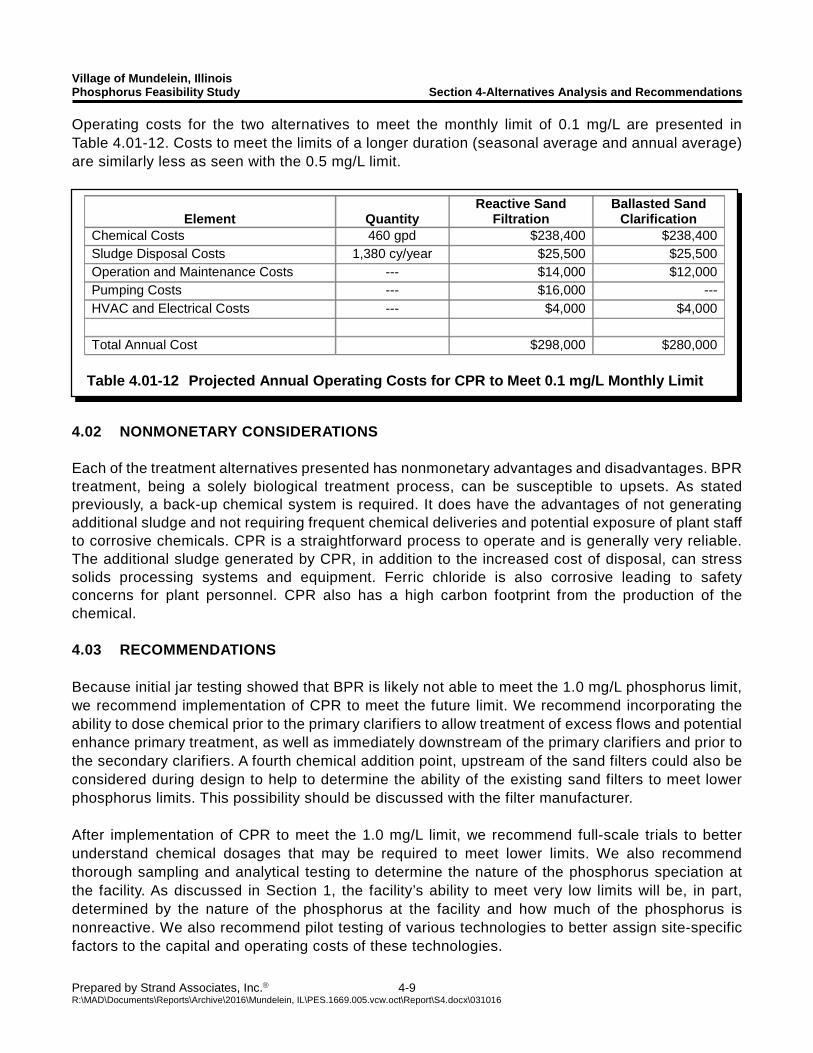
Village of Mundelein, Illinois Phosphorus Feasibility Study Section 4-Alternatives Analysis and Recommendations
Prepared by Strand Associates, Inc. 4-9 R:\MAD\Documents\Reports\Archive\2016\Mundelein, IL\PES.1669.005.vcw.oct\Report\S4.docx\031016
Operating costs for the two alternatives to meet the monthly limit of 0.1 mg/L are presented in Table 4.01-12. Costs to meet the limits of a longer duration (seasonal average and annual average) are similarly less as seen with the 0.5 mg/L limit.
4.02 NONMONETARY CONSIDERATIONS Each of the treatment alternatives presented has nonmonetary advantages and disadvantages. BPR treatment, being a solely biological treatment process, can be susceptible to upsets. As stated previously, a back-up chemical system is required. It does have the advantages of not generating additional sludge and not requiring frequent chemical deliveries and potential exposure of plant staff to corrosive chemicals. CPR is a straightforward process to operate and is generally very reliable. The additional sludge generated by CPR, in addition to the increased cost of disposal, can stress solids processing systems and equipment. Ferric chloride is also corrosive leading to safety concerns for plant personnel. CPR also has a high carbon footprint from the production of the chemical. 4.03 RECOMMENDATIONS Because initial jar testing showed that BPR is likely not able to meet the 1.0 mg/L phosphorus limit, we recommend implementation of CPR to meet the future limit. We recommend incorporating the ability to dose chemical prior to the primary clarifiers to allow treatment of excess flows and potential enhance primary treatment, as well as immediately downstream of the primary clarifiers and prior to the secondary clarifiers. A fourth chemical addition point, upstream of the sand filters could also be considered during design to help to determine the ability of the existing sand filters to meet lower phosphorus limits. This possibility should be discussed with the filter manufacturer. After implementation of CPR to meet the 1.0 mg/L limit, we recommend full-scale trials to better understand chemical dosages that may be required to meet lower limits. We also recommend thorough sampling and analytical testing to determine the nature of the phosphorus speciation at the facility. As discussed in Section 1, the facility’s ability to meet very low limits will be, in part, determined by the nature of the phosphorus at the facility and how much of the phosphorus is nonreactive. We also recommend pilot testing of various technologies to better assign site-specific factors to the capital and operating costs of these technologies.
Element Quantity Reactive Sand
Filtration Ballasted Sand
Clarification Chemical Costs 460 gpd $238,400 $238,400 Sludge Disposal Costs 1,380 cy/year $25,500 $25,500 Operation and Maintenance Costs --- $14,000 $12,000 Pumping Costs --- $16,000 --- HVAC and Electrical Costs --- $4,000 $4,000 Total Annual Cost $298,000 $280,000
Table 4.01-12 Projected Annual Operating Costs for CPR to Meet 0.1 mg/L Monthly Limit

APPENDIX NPDES PERMIT NO. IL0022501
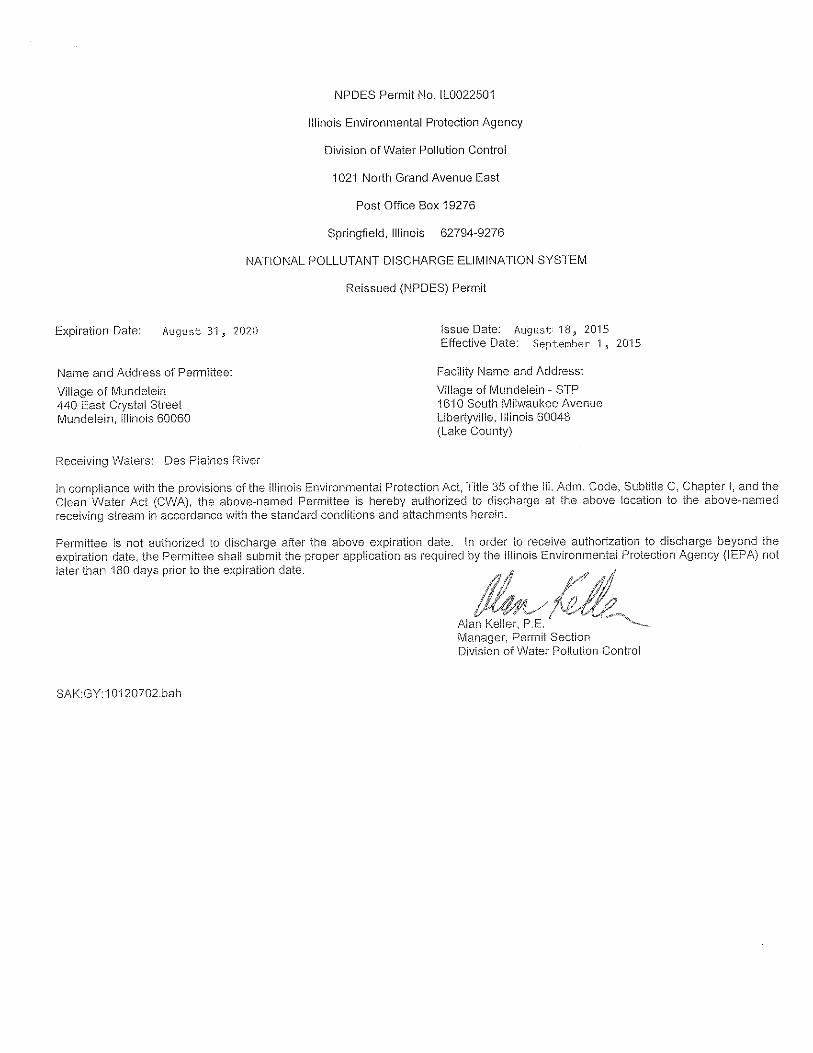
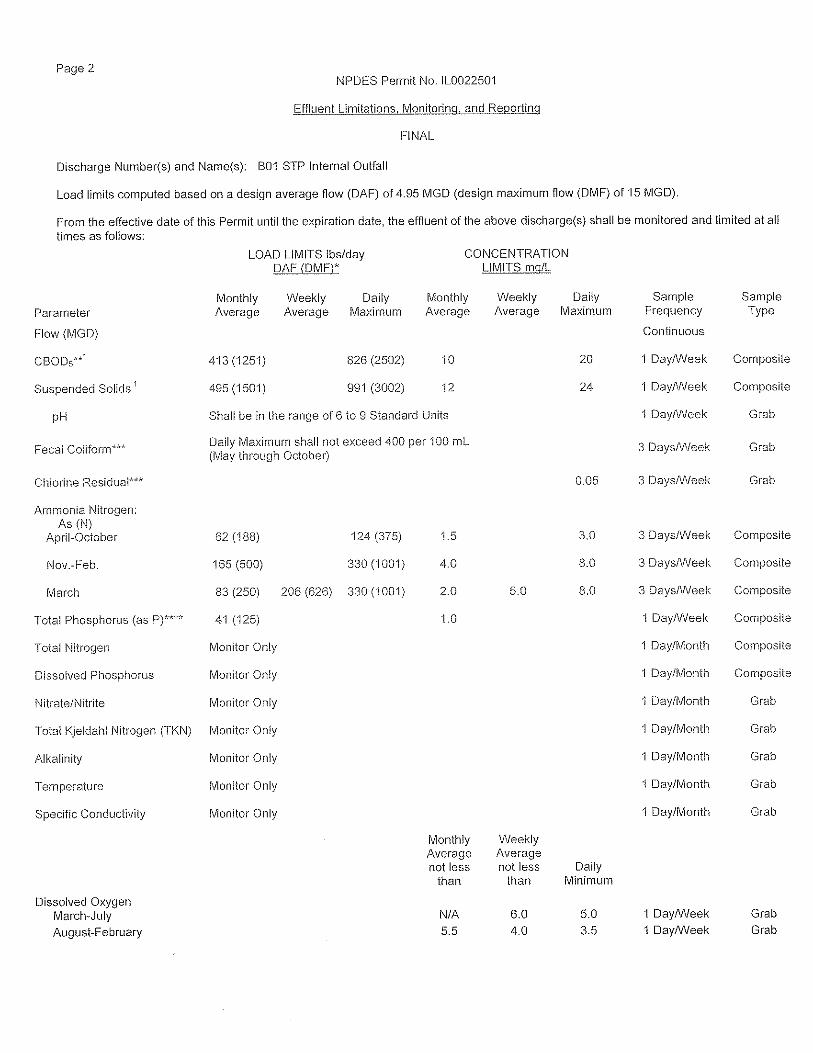
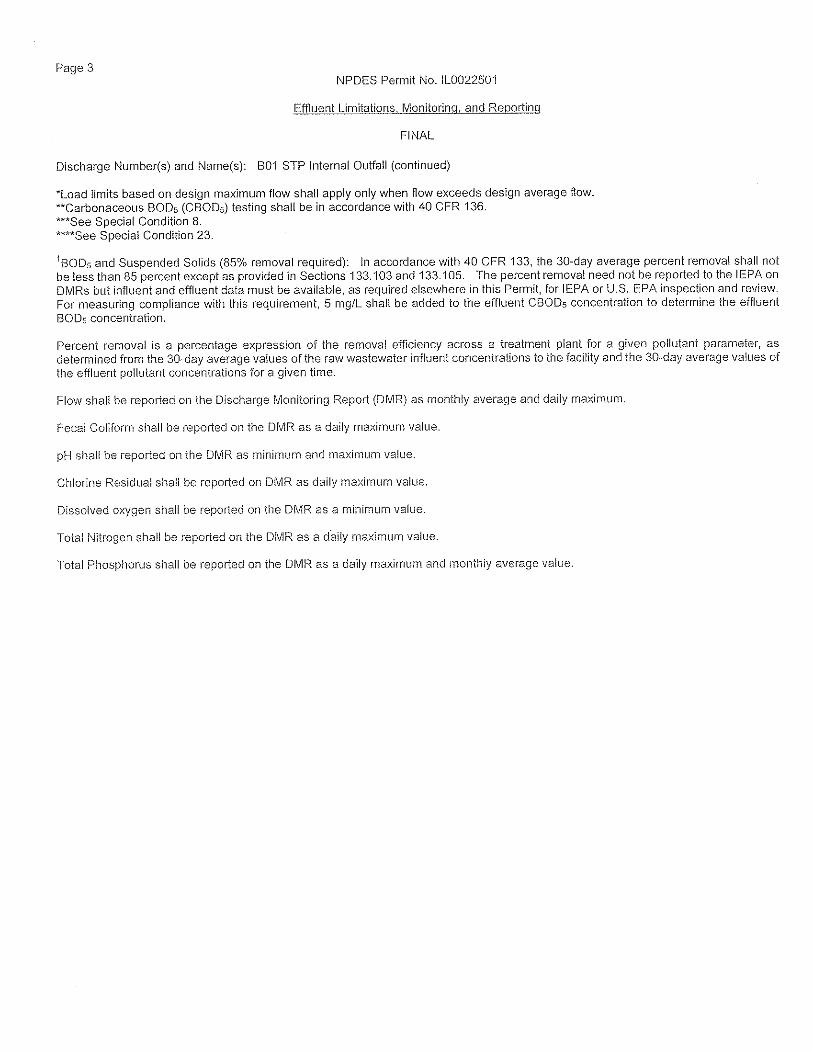
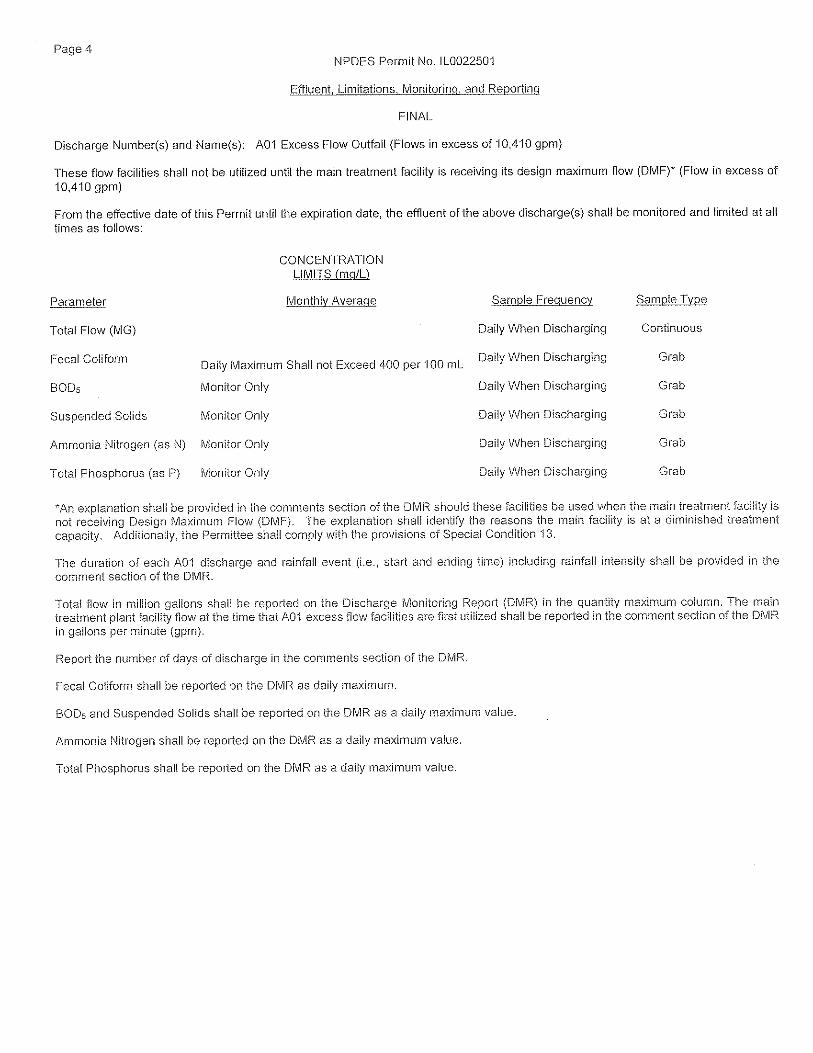
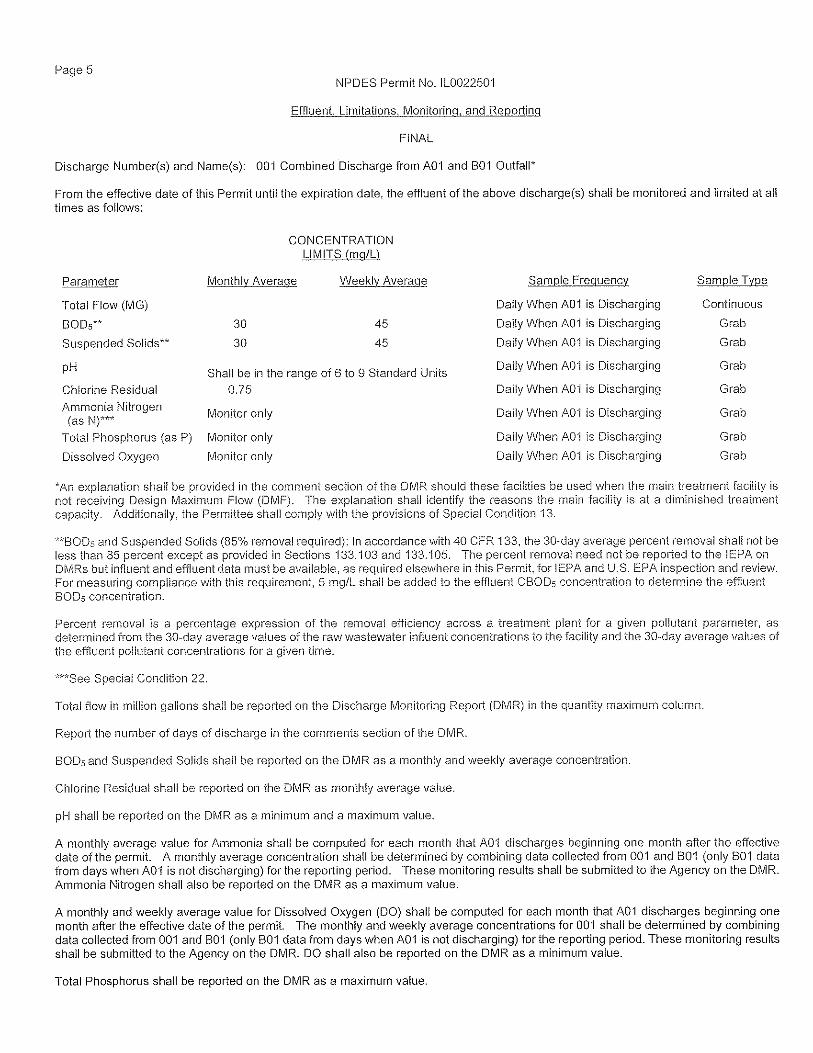
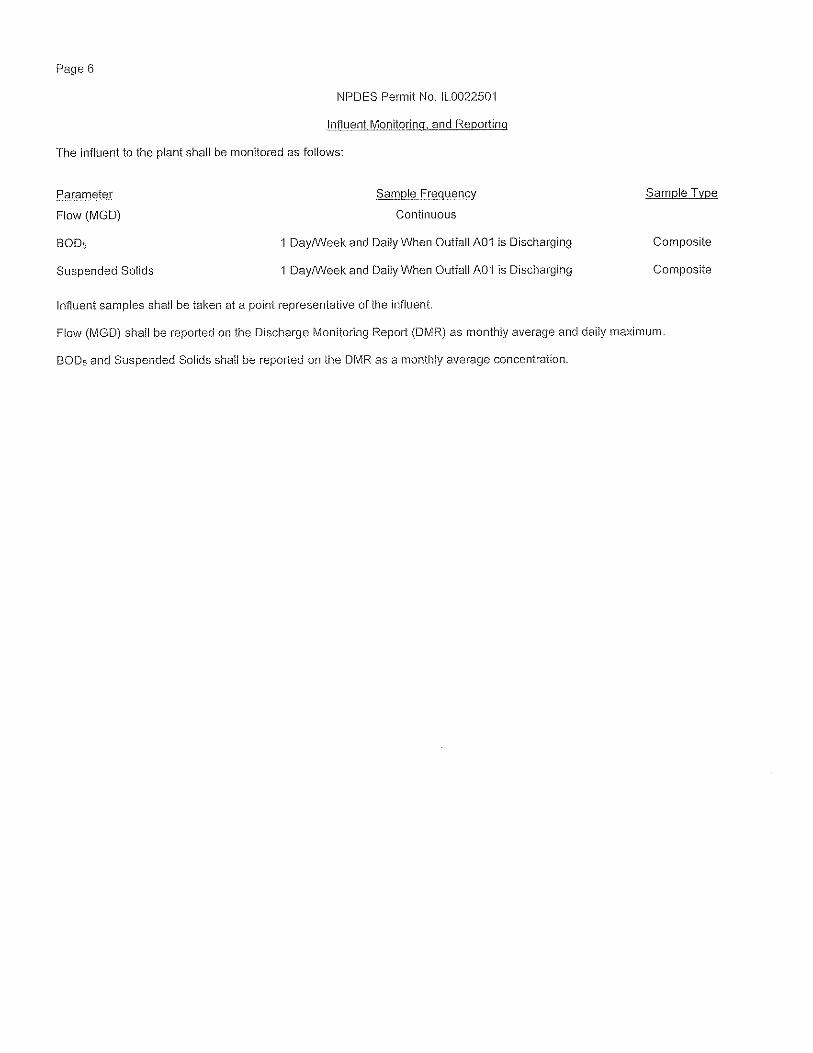
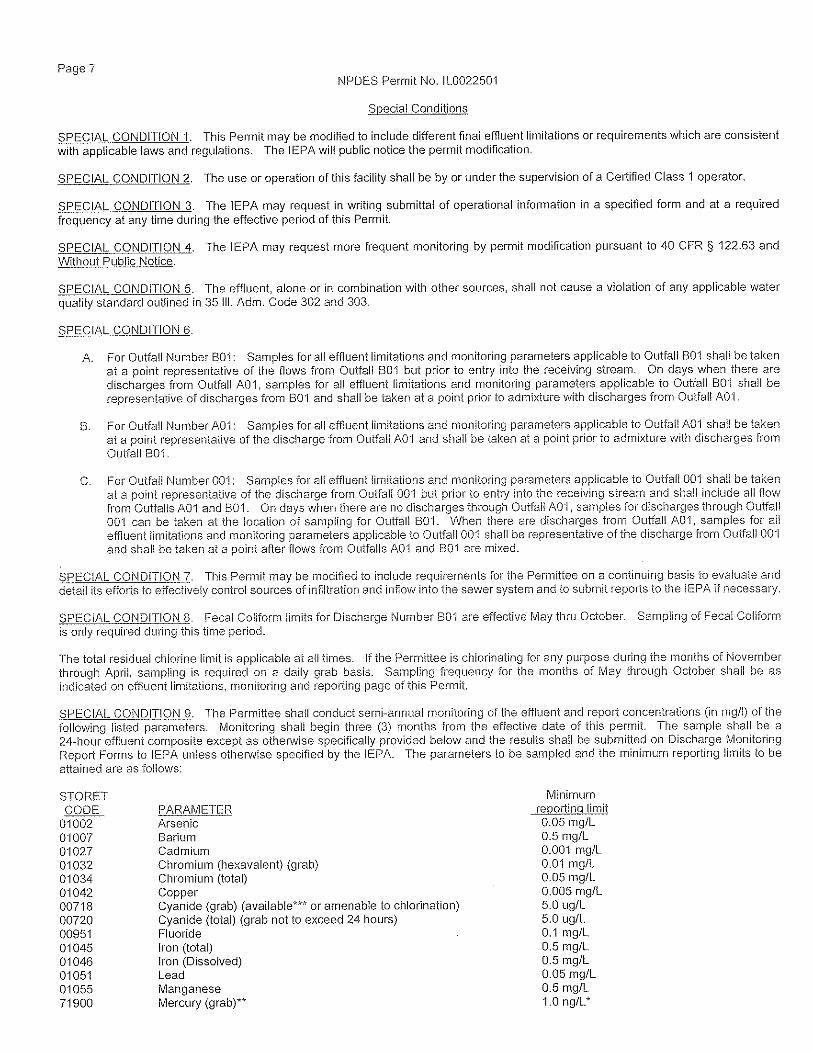
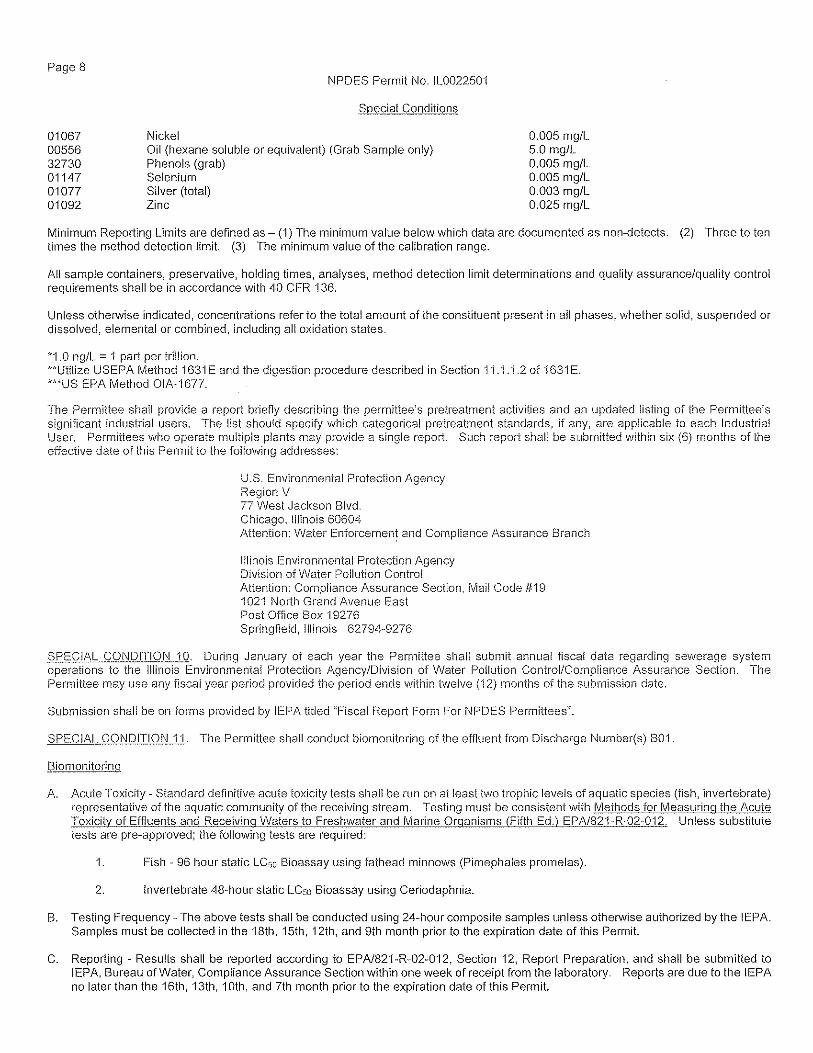
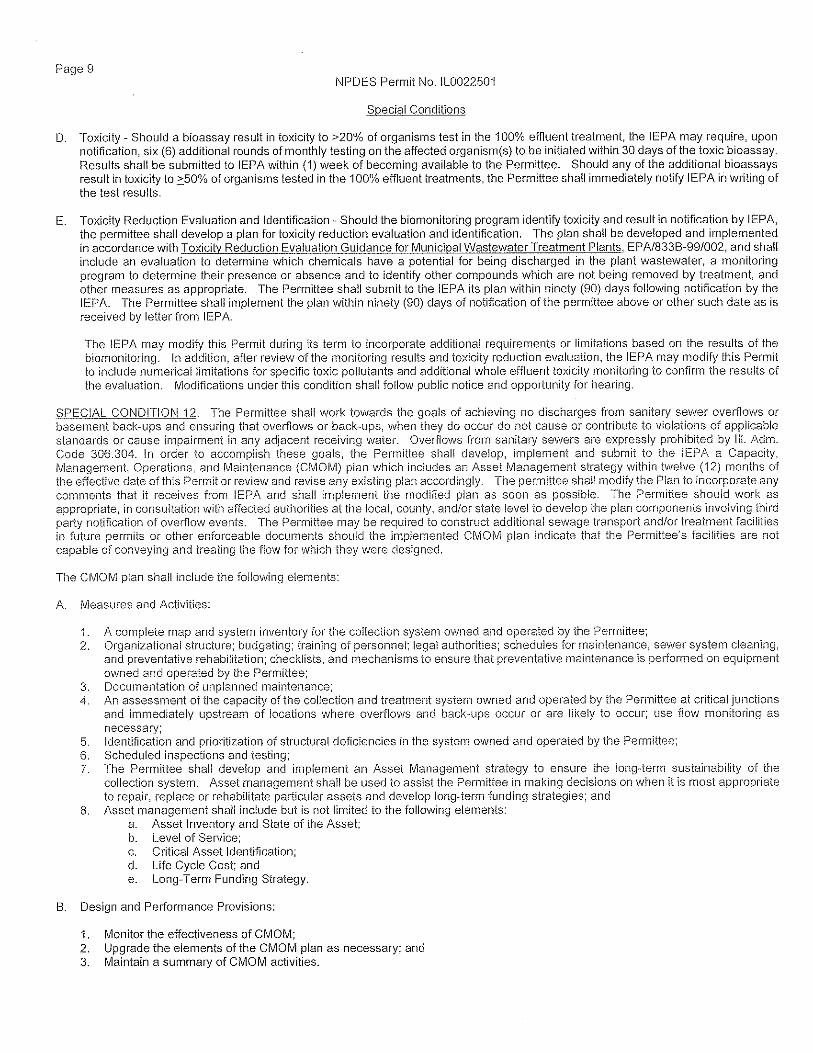
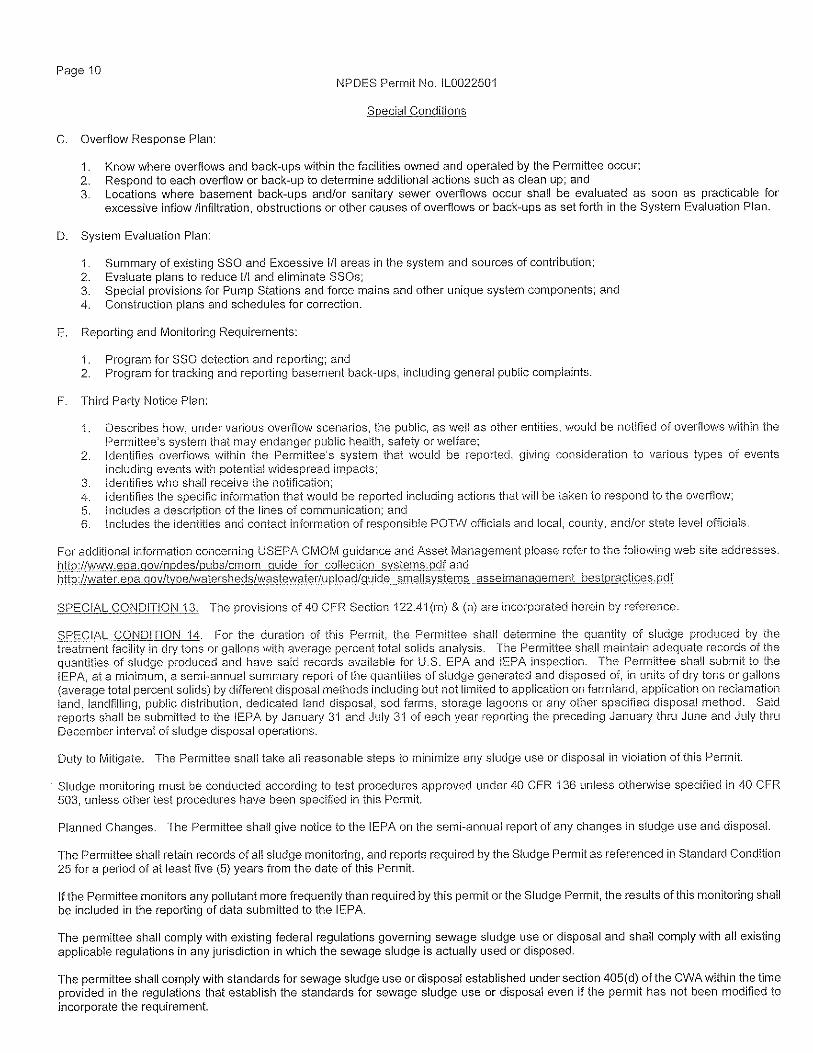
Office Locations
For more location information please visit www.strand.com
Brenham, TX | 979.836.7937
Cincinnati, Ohio | 513.861.5600
Columbus, Indiana | 812.372.9911
Columbus, Ohio | 614.835.0460
Indianapolis, Indiana | 317.423.0935
Joliet, Illinois | 815.744.4200
Lexington, Kentucky | 859.225.8500
Louisville, Kentucky | 502.583.7020
Madison, Wisconsin* | 608.251.4843
Milwaukee, Wisconsin | 414.271.0771
Phoenix, Arizona | 602.437.3733
*Corporate Headquarters
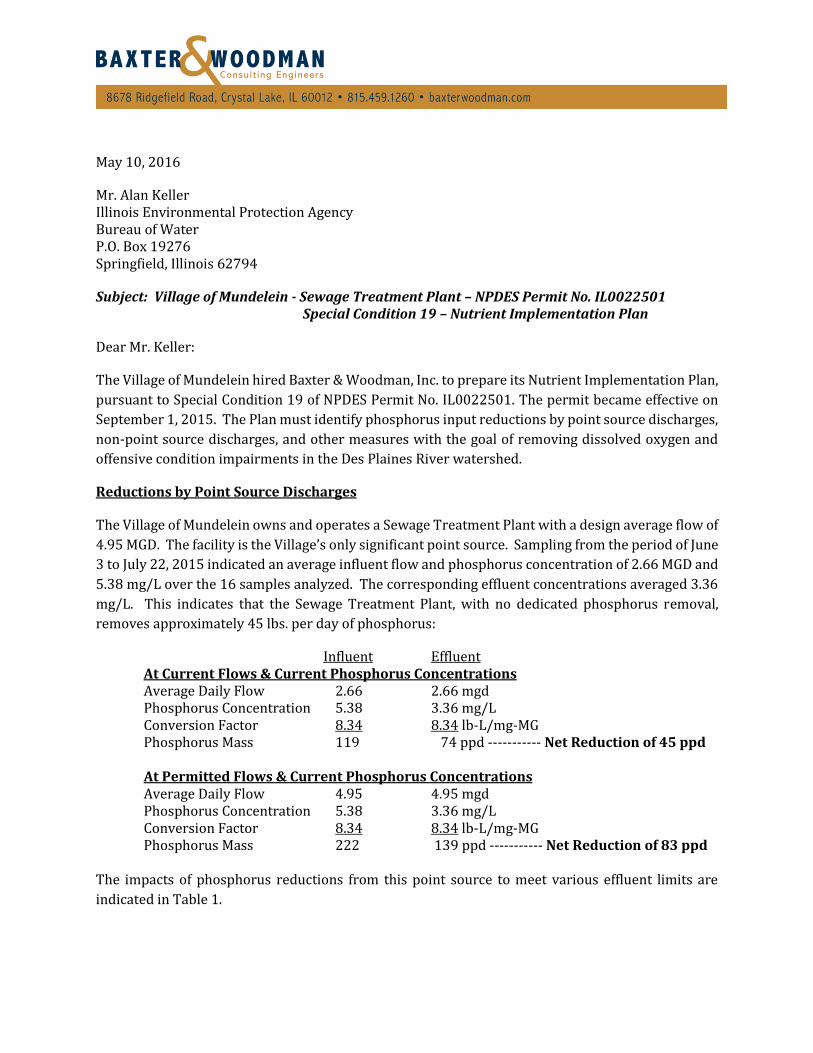
May 10, 2016
Mr. Alan Keller Illinois Environmental Protection Agency Bureau of Water P.O. Box 19276 Springfield, Illinois 62794
Subject: Village of Mundelein - Sewage Treatment Plant – NPDES Permit No. IL0022501 Special Condition 19 – Nutrient Implementation Plan
Dear Mr. Keller:
The Village of Mundelein hired Baxter & Woodman, Inc. to prepare its Nutrient Implementation Plan,
pursuant to Special Condition 19 of NPDES Permit No. IL0022501. The permit became effective on
September 1, 2015. The Plan must identify phosphorus input reductions by point source discharges,
non-point source discharges, and other measures with the goal of removing dissolved oxygen and
offensive condition impairments in the Des Plaines River watershed.
Reductions by Point Source Discharges
The Village of Mundelein owns and operates a Sewage Treatment Plant with a design average flow of
4.95 MGD. The facility is the Village’s only significant point source. Sampling from the period of June
3 to July 22, 2015 indicated an average influent flow and phosphorus concentration of 2.66 MGD and
5.38 mg/L over the 16 samples analyzed. The corresponding effluent concentrations averaged 3.36
mg/L. This indicates that the Sewage Treatment Plant, with no dedicated phosphorus removal,
removes approximately 45 lbs. per day of phosphorus:
Influent Effluent At Current Flows & Current Phosphorus Concentrations Average Daily Flow 2.66 2.66 mgd Phosphorus Concentration 5.38 3.36 mg/L Conversion Factor 8.34 8.34 lb-L/mg-MG Phosphorus Mass 119 74 ppd ----------- Net Reduction of 45 ppd At Permitted Flows & Current Phosphorus Concentrations Average Daily Flow 4.95 4.95 mgd Phosphorus Concentration 5.38 3.36 mg/L Conversion Factor 8.34 8.34 lb-L/mg-MG Phosphorus Mass 222 139 ppd ----------- Net Reduction of 83 ppd
The impacts of phosphorus reductions from this point source to meet various effluent limits are
indicated in Table 1.
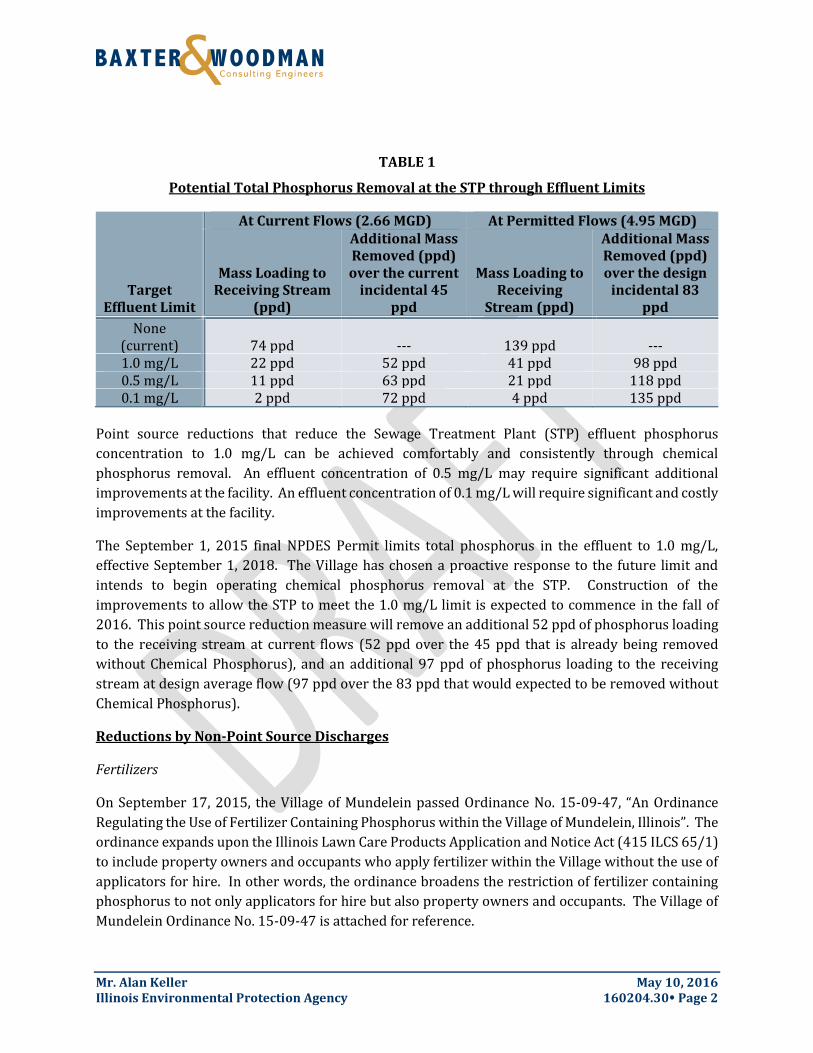
Mr. Alan Keller May 10, 2016 Illinois Environmental Protection Agency 160204.30 Page 2
TABLE 1
Potential Total Phosphorus Removal at the STP through Effluent Limits
Target Effluent Limit
At Current Flows (2.66 MGD) At Permitted Flows (4.95 MGD)
Mass Loading to Receiving Stream
(ppd)
Additional Mass Removed (ppd) over the current
incidental 45 ppd
Mass Loading to Receiving
Stream (ppd)
Additional Mass Removed (ppd) over the design
incidental 83 ppd
None (current) 74 ppd --- 139 ppd --- 1.0 mg/L 22 ppd 52 ppd 41 ppd 98 ppd 0.5 mg/L 11 ppd 63 ppd 21 ppd 118 ppd 0.1 mg/L 2 ppd 72 ppd 4 ppd 135 ppd
Point source reductions that reduce the Sewage Treatment Plant (STP) effluent phosphorus
concentration to 1.0 mg/L can be achieved comfortably and consistently through chemical
phosphorus removal. An effluent concentration of 0.5 mg/L may require significant additional
improvements at the facility. An effluent concentration of 0.1 mg/L will require significant and costly
improvements at the facility.
The September 1, 2015 final NPDES Permit limits total phosphorus in the effluent to 1.0 mg/L,
effective September 1, 2018. The Village has chosen a proactive response to the future limit and
intends to begin operating chemical phosphorus removal at the STP. Construction of the
improvements to allow the STP to meet the 1.0 mg/L limit is expected to commence in the fall of
2016. This point source reduction measure will remove an additional 52 ppd of phosphorus loading
to the receiving stream at current flows (52 ppd over the 45 ppd that is already being removed
without Chemical Phosphorus), and an additional 97 ppd of phosphorus loading to the receiving
stream at design average flow (97 ppd over the 83 ppd that would expected to be removed without
Chemical Phosphorus).
Reductions by Non-Point Source Discharges
Fertilizers
On September 17, 2015, the Village of Mundelein passed Ordinance No. 15-09-47, “An Ordinance
Regulating the Use of Fertilizer Containing Phosphorus within the Village of Mundelein, Illinois”. The
ordinance expands upon the Illinois Lawn Care Products Application and Notice Act (415 ILCS 65/1)
to include property owners and occupants who apply fertilizer within the Village without the use of
applicators for hire. In other words, the ordinance broadens the restriction of fertilizer containing
phosphorus to not only applicators for hire but also property owners and occupants. The Village of
Mundelein Ordinance No. 15-09-47 is attached for reference.
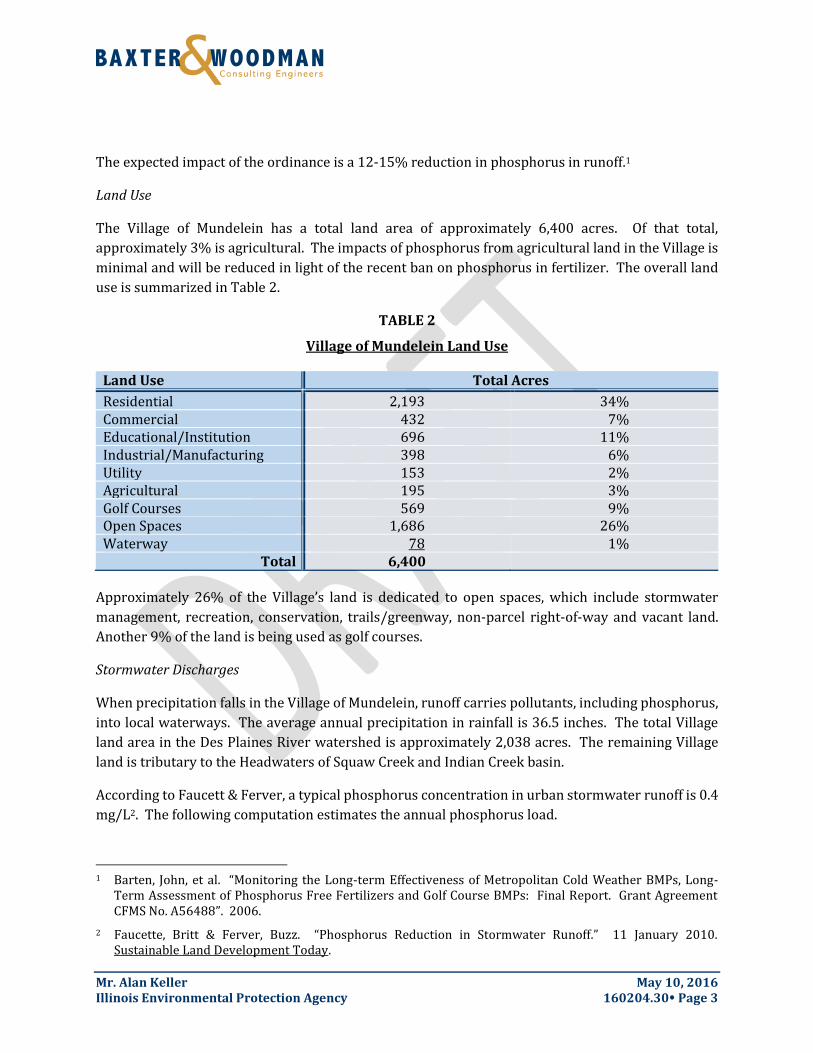
Mr. Alan Keller May 10, 2016 Illinois Environmental Protection Agency 160204.30 Page 3
The expected impact of the ordinance is a 12-15% reduction in phosphorus in runoff.1
Land Use
The Village of Mundelein has a total land area of approximately 6,400 acres. Of that total,
approximately 3% is agricultural. The impacts of phosphorus from agricultural land in the Village is
minimal and will be reduced in light of the recent ban on phosphorus in fertilizer. The overall land
use is summarized in Table 2.
TABLE 2
Village of Mundelein Land Use
Land Use Total Acres
Residential 2,193 34% Commercial 0,432 07% Educational/Institution 0,696 11% Industrial/Manufacturing 0,398 06% Utility 0,153 02% Agricultural 0,195 03% Golf Courses 0,569 09% Open Spaces 1,686 26% Waterway 0,078 01%
Total 6,400
Approximately 26% of the Village’s land is dedicated to open spaces, which include stormwater
management, recreation, conservation, trails/greenway, non-parcel right-of-way and vacant land.
Another 9% of the land is being used as golf courses.
Stormwater Discharges
When precipitation falls in the Village of Mundelein, runoff carries pollutants, including phosphorus,
into local waterways. The average annual precipitation in rainfall is 36.5 inches. The total Village
land area in the Des Plaines River watershed is approximately 2,038 acres. The remaining Village
land is tributary to the Headwaters of Squaw Creek and Indian Creek basin.
According to Faucett & Ferver, a typical phosphorus concentration in urban stormwater runoff is 0.4
mg/L2. The following computation estimates the annual phosphorus load.
1 Barten, John, et al. “Monitoring the Long-term Effectiveness of Metropolitan Cold Weather BMPs, Long-
Term Assessment of Phosphorus Free Fertilizers and Golf Course BMPs: Final Report. Grant Agreement CFMS No. A56488”. 2006.
2 Faucette, Britt & Ferver, Buzz. “Phosphorus Reduction in Stormwater Runoff.” 11 January 2010. Sustainable Land Development Today.
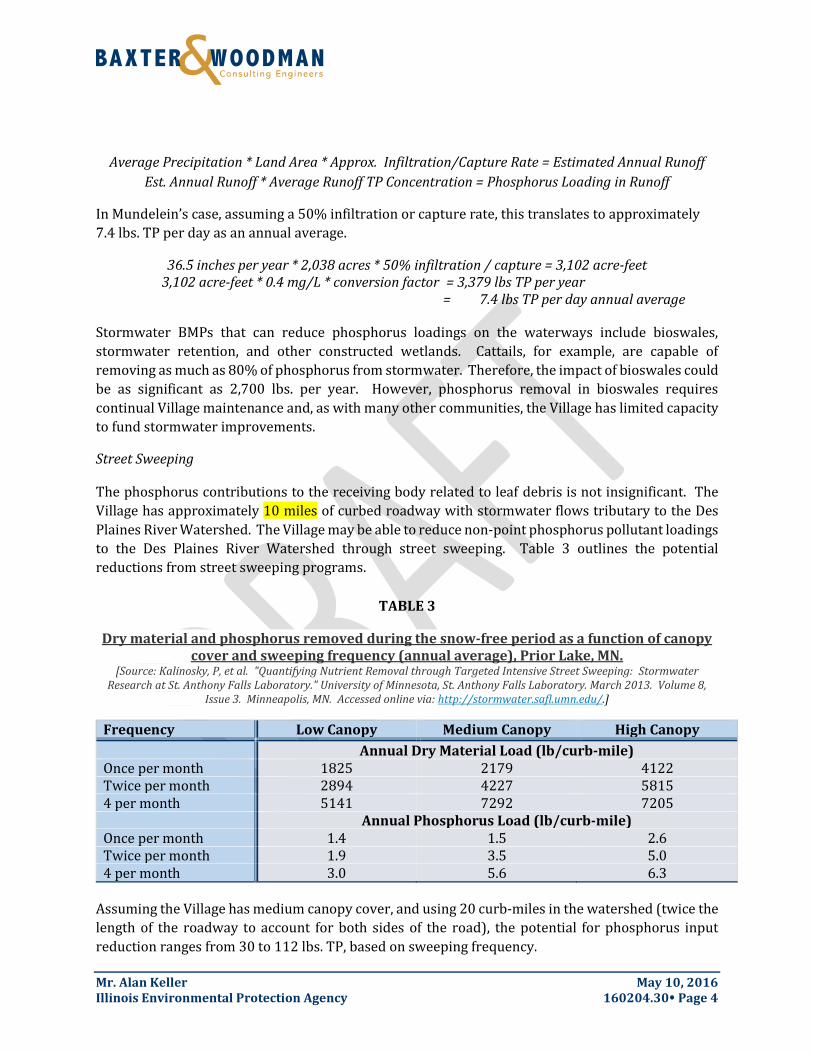
Mr. Alan Keller May 10, 2016 Illinois Environmental Protection Agency 160204.30 Page 4
Average Precipitation * Land Area * Approx. Infiltration/Capture Rate = Estimated Annual Runoff
Est. Annual Runoff * Average Runoff TP Concentration = Phosphorus Loading in Runoff
In Mundelein’s case, assuming a 50% infiltration or capture rate, this translates to approximately
7.4 lbs. TP per day as an annual average.
36.5 inches per year * 2,038 acres * 50% infiltration / capture = 3,102 acre-feet 3,102 acre-feet * 0.4 mg/L * conversion factor = 3,379 lbs TP per year = 7.4 lbs TP per day annual average
Stormwater BMPs that can reduce phosphorus loadings on the waterways include bioswales,
stormwater retention, and other constructed wetlands. Cattails, for example, are capable of
removing as much as 80% of phosphorus from stormwater. Therefore, the impact of bioswales could
be as significant as 2,700 lbs. per year. However, phosphorus removal in bioswales requires
continual Village maintenance and, as with many other communities, the Village has limited capacity
to fund stormwater improvements.
Street Sweeping
The phosphorus contributions to the receiving body related to leaf debris is not insignificant. The
Village has approximately 10 miles of curbed roadway with stormwater flows tributary to the Des
Plaines River Watershed. The Village may be able to reduce non-point phosphorus pollutant loadings
to the Des Plaines River Watershed through street sweeping. Table 3 outlines the potential
reductions from street sweeping programs.
TABLE 3
Dry material and phosphorus removed during the snow-free period as a function of canopy cover and sweeping frequency (annual average), Prior Lake, MN.
[Source: Kalinosky, P, et al. "Quantifying Nutrient Removal through Targeted Intensive Street Sweeping: Stormwater Research at St. Anthony Falls Laboratory." University of Minnesota, St. Anthony Falls Laboratory. March 2013. Volume 8,
Issue 3. Minneapolis, MN. Accessed online via: http://stormwater.safl.umn.edu/.]
Frequency Low Canopy Medium Canopy High Canopy
Annual Dry Material Load (lb/curb-mile) Once per month 1825 2179 4122 Twice per month 2894 4227 5815 4 per month 5141 7292 7205 Annual Phosphorus Load (lb/curb-mile) Once per month 1.4 1.5 2.6 Twice per month 1.9 3.5 5.0 4 per month 3.0 5.6 6.3
Assuming the Village has medium canopy cover, and using 20 curb-miles in the watershed (twice the
length of the roadway to account for both sides of the road), the potential for phosphorus input
reduction ranges from 30 to 112 lbs. TP, based on sweeping frequency.
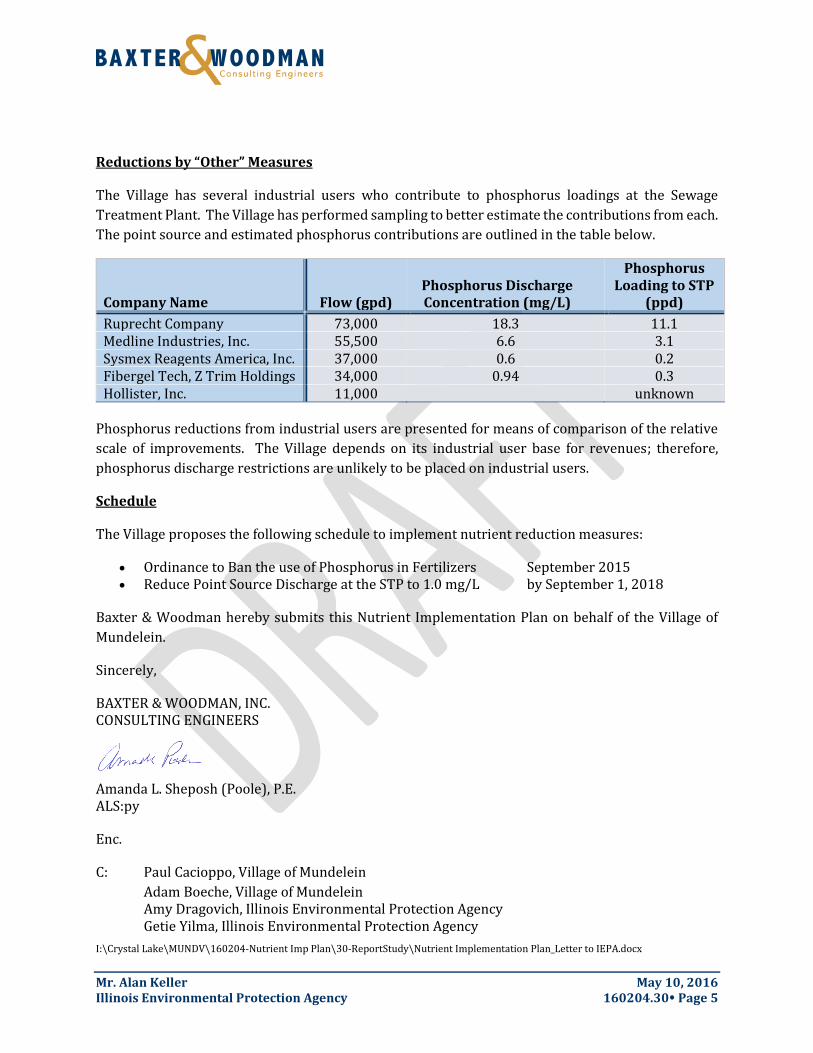
Mr. Alan Keller May 10, 2016 Illinois Environmental Protection Agency 160204.30 Page 5
Reductions by “Other” Measures
The Village has several industrial users who contribute to phosphorus loadings at the Sewage
Treatment Plant. The Village has performed sampling to better estimate the contributions from each.
The point source and estimated phosphorus contributions are outlined in the table below.
Company Name Flow (gpd) Phosphorus Discharge Concentration (mg/L)
Phosphorus Loading to STP
(ppd)
Ruprecht Company 73,000 18.3 11.1 Medline Industries, Inc. 55,500 6.6 3.1 Sysmex Reagents America, Inc. 37,000 0.6 0.2 Fibergel Tech, Z Trim Holdings 34,000 0.94 0.3 Hollister, Inc. 11,000 unknown
Phosphorus reductions from industrial users are presented for means of comparison of the relative
scale of improvements. The Village depends on its industrial user base for revenues; therefore,
phosphorus discharge restrictions are unlikely to be placed on industrial users.
Schedule
The Village proposes the following schedule to implement nutrient reduction measures:
Ordinance to Ban the use of Phosphorus in Fertilizers September 2015 Reduce Point Source Discharge at the STP to 1.0 mg/L by September 1, 2018
Baxter & Woodman hereby submits this Nutrient Implementation Plan on behalf of the Village of
Mundelein.
Sincerely,
BAXTER & WOODMAN, INC. CONSULTING ENGINEERS Amanda L. Sheposh (Poole), P.E. ALS:py
Enc.
C: Paul Cacioppo, Village of Mundelein
Adam Boeche, Village of Mundelein Amy Dragovich, Illinois Environmental Protection Agency Getie Yilma, Illinois Environmental Protection Agency
I:\Crystal Lake\MUNDV\160204-Nutrient Imp Plan\30-ReportStudy\Nutrient Implementation Plan_Letter to IEPA.docx