view point performance ranking stability rating - pacra · mutual funds | view point performance...
TRANSCRIPT
Mutual Funds | View Point
Performance Ranking
Stability Rating
Sep 2016
StockMarket
Performance
MoneyMarket Review
AUMs No. of funds SMAMarketshare
FlowAnalysis

Outline
• Stock Market Performance
• Money Market Review
• AUMs
• No. of funds
• SMA
• Market Share
• Flow Analysis
StockMarket
Performance
MoneyMarket Review
AUMs No. of funds SMAMarketshare
FlowAnalysis

Pakistan –Asset
Management Industry
StockMarket
Performance
MoneyMarket Review
AUMs No. of funds SMAMarketshare
FlowAnalysis

KSE-100 Performance
StockMarket
Performance
MoneyMarket Review
AUMs No. of funds SMAMarketshare
FlowAnalysis
Sep-15 Oct-15 Nov-15 Dec-15 Jan-16 Feb-16 Mar-16 Apr-16 May-16 Jun-16 Jul-16 Aug-16 Sep-16
Avg monthly volume (mn) 97 98 90 89 83 85 87 127 147 120 116 119 174
Avg monthly Index 33,316 33,742 33,865 32,733 31,739 31,592 32,716 33,840 36,139 37,633 39,098 39,718 40,078
0
50
100
150
200
250
300
-
5,000
10,000
15,000
20,000
25,000
30,000
35,000
40,000
45,000
Mill
ion
s
Volume Index
• The market stayed resilient even in the
uncertain situation at LOC and political
concerns, this clearly highlight the
investors confidence
• Decision regarding adoption of supply
cuts at OPEC’s meeting led an uptick in
oil prices
• Brent price increased by 4.29% and WTI
price by 8%
• PSX invited interest from potential
investors in order to divest up to 40%of
the exchange’s ownership stake.
• Foreign investors showing interest ( this
would translate foreign investment
inflows
KSE-100 Index appreciated by 1.84% during Sept-16.

Top 10 scrips (KSE 100- Index)
StockMarket
Performance
MoneyMarket Review
AUMs No. of funds SMAMarketshare
FlowAnalysis
Top 10 stocks
Absolute
returns
BOP Bank of Punjab 51%
HCAR Honda Atlas Cars 33%
INDU Indus Motor Co 30%
TRG TRG Pak Ltd 28%
SHEL Shell Pakistan 25%
ICI ICI Pakistan 22%
MTL Millat Tractors 22%
ISL International Steels Limited 20%
THALL Thall Limited 20%
PSMC Pak Suzuki Motor 18%
Positive contributors
Auto sector: on back of improving earnings outlook
driven by robust volumetric growth and healthy profit
margins
Banking sector: SBP decision to keep policy rate
unchanged drew investors towards the sector
Oil and gas Marketing sector was also positive
contributor during the month
Negative contributors
Cement sector: breather due to investor apprehensions
on future profitability driven by fears of a potential price
war in the wake of large capacity expansion
announcements
Textile composite sector and pharmaceuticals sectors
lagged behind

Top 10 scrips (KSE 100- Index)
StockMarket
Performance
MoneyMarket Review
AUMs No. of funds SMAMarketshare
FlowAnalysis
Top 10 stocks (Volume basis)
Symbol Name Average 3 month VolumeContribution towards total
average volume
BOP Bank Of Punjab Limited. 26,589,180 17%
KEL K-Electric Ltd 22,991,926 15%
PACE Pace (Pak) Ltd. 17,295,197 11%
TRG TRG Pakistan 16,749,361 11%
WTL WorldCall Telecom Limited 14,341,566 9%
DCL Dewan Cement Limited 14,043,328 9%
DSFL Dewan Salman Fibre Limit 12,641,705 8%
SNGP Sui Northern Gas Pipelin 9,719,861 6%
BYCO BYCO Petroleum Pakistan. 8,921,066 6%
ANL Azgard Nine Ltd. 8,188,697 5%
Total 154,476,000

Sector-Wise Portfolio Investments
StockMarket
Performance
MoneyMarket Review
AUMs No. of funds SMAMarketshare
FlowAnalysis
Sep-15 Aug-16 Sep-16 YTD (CY Basis)
PKR mln Gross Buy Gross SellNet Buy /
(sell)Gross Buy Gross Sell
Net Buy /
(sell)
Gross
BuyGross Sell
Net Buy /
(sell)Gross Buy Gross Sell
Net Buy /
(sell)
Individuals 133,162 (131,607) 1,554 209,501 (208,919) 581 227,165 (229,635) (2,019) 1,511,217 (1,509,595) 1,621
Companies 9,108 (10,857) (1,748) 13,504 (12,914) 590 16,176 (14,465) 1,711 98,754 (111,739) (12,984)
Banks / DFIs 9,250 (8,259) 991 14,101 (14,611) (510) 13,461 (12,647) 814 101,564 (108,063) (6,498)
NBFC 2,044 (1,313) 730 4,473 (3,675) 789 6,079 (4,118) 1,961 40,942 (24,089) 16,853
Mutual Funds 7,245 (9,120) (1,874) 20,191 (18,776) 1,415 20,945 (20,127) 818 155,910 (148,253) 7,656
3% 4% -82% 6% 6% 66% 6% 6% 19% 7% 6% 92%
Other Organisations 3,713 (1,635) 2,077 3,811 (4,286) (474) 3,490 (3,105) 385 31,195 (28,433) 2,762
Broker Proprietary
Trading 56,387 (55,831) 556 45,254 (45,513) (258) 46,904 (46,234) 669 380,000 (381,106) (1,106)
Total Local Portfolio
Investments220,909 (218,622) 2,287 310,838 (308,696) 2,141 334,673 (330,333) 4,340 2,319,585
(2,311,281)8,304
Foreign corporates23,169 (25,584) (2,414) 18,507 (23,160) (4,653) 185,061
(192,700)(7,639)
Total Foreign Portfolio
Investments11,320 (13,607) (2,287) 30,078 32,220 (2,141) 26,242 (30,583) (4,340) 230,932
(239,236)(8,304)
Total (Local + Foreign) 232,229 (232,229) - 340,916 (276,476) - 360,915 (360,916) - 2,550,517 (2,550,517) -
Mainly in cement and fertilizer
sector

Global Indexes
StockMarket
Performance
MoneyMarket Review
AUMs No. of funds SMAMarketshare
FlowAnalysis
Top 5 Indexes
Market Index Monthly Return YTD
Aug-16 Sep-16 (FY17)
Venezula IBVC -7.74% 8.35% 1.50%
Russia RTSI 2.45% 4.28% 6.39%
USA Nasdaq 0.99% 1.89% 9.48%
Pakistan KSE100 0.71% 1.84% 7.17%
UK FTSE 0.85% 1.74% 5.97%
Bottom 5 Indexes
Market Index Monthly Return YTD
Aug-16 Sep-16 (FY17)
Saudi Arabia TASI -3.53% -7.50% -14.07%
Egypt EGX-30 2.19% -3.39% 13.79%
China SSEC 3.56% -2.62% 2.64%
Japan N225 1.92% -2.59% 5.71%
India BSE30 1.43% -2.06% 3.27%

Money Market Review (Sept 16)
StockMarket
Performance
MoneyMarket Review
AUMs No. of funds SMAMarketshare
FlowAnalysis
09-Sep-16
Maturity PeriodBids Received
(PKR bln)
Total Realized Amount
(PKR bln)
Cut - Off
Yield (%)
Change in Yield from
last Auction (%)
03-Month 43.5 14.9 5.8571 5.8571
06-Month 45.0 31.5 6.946 6.9460
12-Month 37.0 31.2 5.9148 5.9148
Total 125.5 77.6
22-Sep-16 Last Auction
Maturity PeriodBids Received (PKR
bln)
Total Realized Amount
(PKR bln)
Cut - Off Yield
(%)
Change in Yield from
last Auction (%)
Cut-off Yield
(%)
Realized
Amount (PKR
bln)
3 year 168.2 176.3 6.2 0.00 6.2 100.7
5 year 88.9 95.4 6.7 0.00 6.7 64.2
10 year 21.9 24.0 7.8 0.00 7.8 50.4
Total 279.03 295.8 215.3
Maturing Amount
49.1
Maturing Amount
81.3

Money Market Review
StockMarket
Performance
MoneyMarket Review
AUMs No. of funds SMAMarketshare
FlowAnalysis
22.5
33.5
44.5
55.5
66.5
77.5
88.5
9
6M T-Bills cut off yeild 6M T-Bills Markey yeild
5 Year PIBs cut off yeild 5 Year PIBs Market yeild
22.5
33.5
44.5
55.5
66.5
77.5
88.5
9
%
Interest Rate
6M Tbills 6M Kibor 5Yrs PIBs yield Policy Rate
Date Sep-15 Oct-15 Nov-15 Dec-15 Jan-16 Feb-16 Mar-16 Apr-16 May-16 Jun-16 Jul-16 Aug-16 Sep-16 Sep-16
6M Tbills 6.95 6.30 6.38 6.36 6.17 6.22 6.19 6.18 6.00 5.96 5.89 5.90 5.90 5.90
6M Kibor 6.81 6.58 6.46 6.52 6.42 6.36 6.36 6.13 6.13 6.02 6.02 6.06 6.06 6.06
5Yrs PIBs
yield 8.24 8.16 7.93 7.99 7.46 6.97 6.98 7 7 6.88 6.64 6.69 6.69 6.69
Policy Rate 6 6 6 6 6 6 6 6 5.75 5.75 5.75 5.75 5.75 5.75

Category wise AUMs
StockMarket
Performance
MoneyMarket Review
AUMs No. of funds SMAMarketshare
FlowAnalysis
13% 11% 11% 11% 11%
21%18% 19% 19% 19%
11%
11% 11% 11% 10%
38%42% 42% 42% 42%
2%2% 2% 2% 2%
3% 4% 4% 4% 4%2% 3% 3% 3% 3%6% 5% 5% 5% 5%3% 4% 4% 4% 4%
0%
10%
20%
30%
40%
50%
60%
70%
80%
90%
100%
495Dec-15
501Jun-16
542Jul-16
558Aug-16
565Sep-16
Money Market Income Government Bond Equity Balanced Asset Allocation Active Allocation Capital Protected Pension
Dec-15 Jun-16 Jul-16 Aug-16 Sep-16
AUMs (PKR bln) 495 501 542 558 565
Money Market 13% 11% 11% 11% 11%
Income 21% 18% 19% 19% 19%
Government Bond 11% 11% 11% 11% 10%
Equity 38% 42% 42% 42% 42%
Balanced 2% 2% 2% 2% 2%
Asset Allocation 3% 4% 4% 4% 4%
Active Allocation 2% 3% 3% 3% 3%
Capital Protected 6% 5% 5% 5% 5%
Pension 3% 4% 4% 4% 4%

Asset Allocation
StockMarket
Performance
MoneyMarket Review
AUMs No. of funds SMAMarketshare
FlowAnalysis
18% 20% 23%15%
3% 4%3%
4%
41%47% 45%
46%
30%22% 20%
27%
8% 8% 8% 9%
0%
10%
20%
30%
40%
50%
60%
70%
80%
90%
100%
Dec-15 Jul-16 Aug-16 Sep-16
Government securities Debt securities Equity Bank balances others
Dec-15 Jul-16 Aug-16 Sep-16
Government securities 18% 20% 23% 15%
Debt securities 3% 4% 3% 4%
Equity 41% 47% 45% 46%
Bank balances 30% 22% 20% 27%
others 8% 8% 8% 9%

Islamic v/s Conventional
StockMarket
Performance
MoneyMarket Review
AUMs No. of funds SMAMarketshare
FlowAnalysis
28%33% 32% 33% 33%
72%67% 68% 67% 68%
0%
20%
40%
60%
80%
100%
Dec-15 Jun-16 Jul-16 Aug-16 Sep-16
%a
ge
Shariah Compliant Conventional
(PKRbln) Dec-15 Jun-16 Jul-16 Aug-16 Sep-16
Shariah Compliant 139 162 170 180 182
Conventional 357 328 361 370 374

No. of Funds
StockMarket
Performance
MoneyMarket Review
AUMs No. of funds SMAMarketshare
FlowAnalysis
No. of Funds
Dec-15 Jun-16 Jul-16 Aug-16 Sep-16
Money Market 24 25 25 25 25
Income 40 41 42 42 43
Government Bond 11 11 11 11 11
Equity 41 43 43 43 43
Commodity 3 3 3 3 3
Balanced 9 8 8 8 9
Asset Allocation 17 20 20 20 21
Active Allocation 6 11 11 12 12
Capital Protected 26 27 27 27 28
Pension 54 54 54 55 55
Total 231 243 244 246 250
New Funds Launched Category Date
1 ABL Islamic Financial Planning fund (Strategic Allocation Plan II) Shariah Compliant Fund of Fund 09-Sep-16

Separately Managed Accounts
StockMarket
Performance
MoneyMarket Review
AUMs No. of funds SMAMarketshare
FlowAnalysis
Dec-15 Jun-16 Jul-16 Aug-16 Sep-16
Discretionary Portfolios 62,972 89,318 91,803 97,388 98,575
Non Discretionary Portfolios 45,789 49,911 51,273 54,203 53,002
62,972
89,318 91,803 97,388 98,575
45,789
49,911 51,273
54,203
53,002
-
17,000
34,000
51,000
68,000
85,000
102,000
119,000
136,000
153,000
Dec-15 Jun-16 Jul-16 Aug-16 Sep-16
PK
R m
ln
Discretionary Portfolios Non Discretionary Portfolios
Market Share
StockMarket
Performance
MoneyMarket Review
AUMs No. of funds SMAMarketshare
FlowAnalysis
Dec-15 Jul-16 Aug-16 Sep-16
AMC RatingTotal
(PKRmln)Mkt.sh Total (PKRmln) Mkt.sh Total (PKRmln) Mkt.sh Total (PKRmln) Mkt.sh
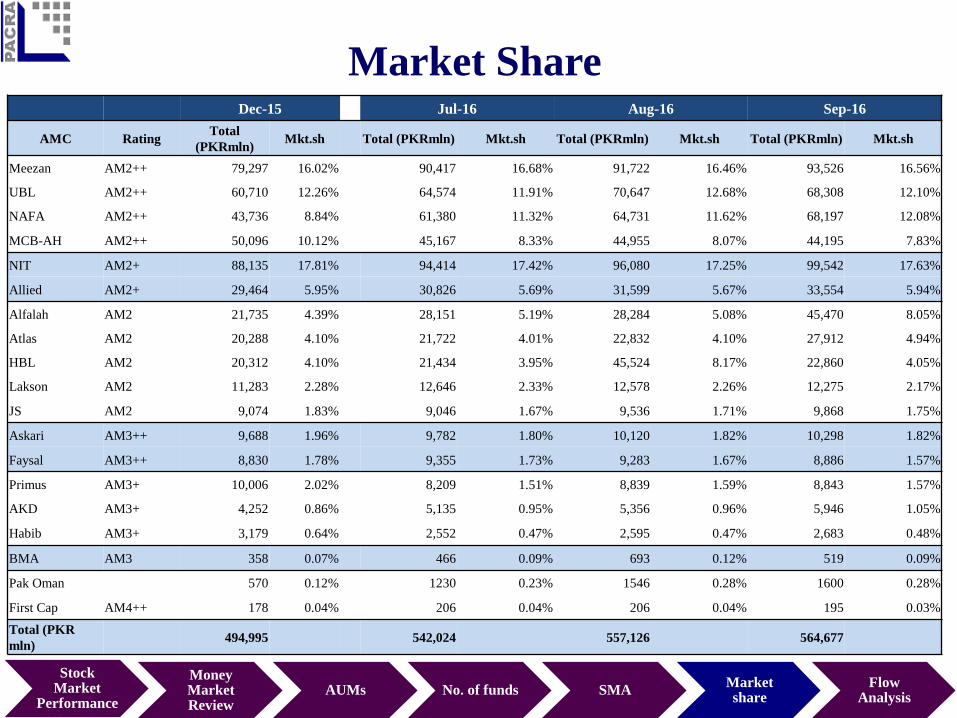
Meezan AM2++ 79,297 16.02% 90,417 16.68% 91,722 16.46% 93,526 16.56%
UBL AM2++ 60,710 12.26% 64,574 11.91% 70,647 12.68% 68,308 12.10%
NAFA AM2++ 43,736 8.84% 61,380 11.32% 64,731 11.62% 68,197 12.08%
MCB-AH AM2++ 50,096 10.12% 45,167 8.33% 44,955 8.07% 44,195 7.83%
NIT AM2+ 88,135 17.81% 94,414 17.42% 96,080 17.25% 99,542 17.63%
Allied AM2+ 29,464 5.95% 30,826 5.69% 31,599 5.67% 33,554 5.94%
Alfalah AM2 21,735 4.39% 28,151 5.19% 28,284 5.08% 45,470 8.05%
Atlas AM2 20,288 4.10% 21,722 4.01% 22,832 4.10% 27,912 4.94%
HBL AM2 20,312 4.10% 21,434 3.95% 45,524 8.17% 22,860 4.05%
Lakson AM2 11,283 2.28% 12,646 2.33% 12,578 2.26% 12,275 2.17%
JS AM2 9,074 1.83% 9,046 1.67% 9,536 1.71% 9,868 1.75%
Askari AM3++ 9,688 1.96% 9,782 1.80% 10,120 1.82% 10,298 1.82%
Faysal AM3++ 8,830 1.78% 9,355 1.73% 9,283 1.67% 8,886 1.57%
Primus AM3+ 10,006 2.02% 8,209 1.51% 8,839 1.59% 8,843 1.57%
AKD AM3+ 4,252 0.86% 5,135 0.95% 5,356 0.96% 5,946 1.05%
Habib AM3+ 3,179 0.64% 2,552 0.47% 2,595 0.47% 2,683 0.48%
BMA AM3 358 0.07% 466 0.09% 693 0.12% 519 0.09%
Pak Oman 570 0.12% 1230 0.23% 1546 0.28% 1600 0.28%
First Cap AM4++ 178 0.04% 206 0.04% 206 0.04% 195 0.03%
Total (PKR
mln)494,995 542,024 557,126 564,677

Adjusted FoF | Market Share
StockMarket
Performance
MoneyMarket Review
AUMs No. of funds SMAMarketshare
FlowAnalysis
Dec-15 Jul-16 Aug-16 Sep-16
AMC RatingTotal
(PKRmln)Mkt.sh
Total
(PKRmln)Mkt.sh
Total
(PKRmln)Mkt.sh
Total
(PKRmln)Mkt.sh
Meezan AM2++ 69,607 14.87% 76,905 16.07% 74,911 14.59% 79,988 15.25%
UBL AM2++ 49,816 10.64% 54,110 11.30% 58,376 11.37% 57,606 10.98%
NAFA AM2++ 42,058 8.99% 56,953 11.90% 60,509 11.78% 63,896 12.18%
MCB-AH AM2++ 50,096 10.70% 45,167 9.44% 44,955 8.75% 44,195 8.43%
NIT AM2+ 88,135 18.83% 94,414 19.72% 96,080 18.71% 99,542 18.98%
Allied AM2+ 27,560 5.89% 27,290 5.70% 27,976 5.45% 28,697 5.47%
Alfalah AM2 19,210 4.10% 22,471 4.69% 22,157 4.31% 39,326 7.50%
HBL AM2 20,312 4.34% 21,722 4.54% 47,575 9.26% 27,912 5.32%
Atlas AM2 20,288 4.33% 21,434 4.48% 20,781 4.05% 22,860 4.36%
Lakson AM2 11,283 2.41% 12,646 2.64% 12,578 2.45% 12,275 2.34%
JS AM2 8,836 1.89% 8,638 1.80% 9,031 1.76% 9,289 1.77%
Askari AM3++ 9,688 2.07% 9,782 2.04% 10,120 1.97% 10,298 1.96%
Faysal AM3++ 8,830 1.89% 9,355 1.95% 9,283 1.81% 8,886 1.69%
Primus AM3+ 10,006 2.14% 8,209 1.71% 8,839 1.72% 8,843 1.69%
AKD AM3+ 4,252 0.91% 5,135 1.07% 5,356 1.04% 5,946 1.13%
Habib AM3+ 3,179 0.68% 2,552 0.53% 2,595 0.51% 2,683 0.51%
BMA AM3 358 0.08% 466 0.10% 693 0.13% 519 0.10%
Pak Oman 570 0.12% 1230 0.26% 1546 0.30% 1600 0.31%
First Cap AM4++ 178 0.04% 206 0.04% 206 0.04% 195 0.04%
Total (PKR
mln)468,066 478,685 513,567 524,556

AMC Industry | Flow Analysis (CY15)
StockMarket
Performance
MoneyMarket Review
AUMs No. of funds SMAMarketshare
FlowAnalysis
PKR mln
Money Market 113,047 110,760 (2,286) 2,303 (4,590)
Income 79,143 91,822 12,679 2,667 10,012
Equity 174,142 160,225 (13,971) (15,266) 1,348
Government Bond 51,132 67,021 15,888 1,720 14,167
Capital Protected 17,415 21,630 9,215 (499) 4,715
Others 26,104 29,239 3,135 (646) 3,599
Total 460,983 480,697 24,660 (9,721) 29,251
Mar-15
Flow Analysis
MobilisationDec-14 Mar-15 Difference Return
PKR mln
Money Market 79,844 80,562 718 1,218 (500)
Income 72,827 91,907 19,079 1,873 17,206
Equity 189,599 176,507 (13,091) (12,076) (1,015)
Government Bond 42,632 51,936 9,304 1,014 8,290
Capital Protected 24,675 27,778 3,102 (318) 3,421
Others 35,416 39,347 3,930 (488) 4,419
Total 444,993 468,037 23,042 (8,777) 31,821
Sep-15
Flow Analysis
Jun-15 Sep-15 Difference Return Mobilisation
PKR mln
Money Market 110,760 79,844 (30,916) 2,140 (33,057)
Income 91,822 72,827 (18,994) 1,640 (20,634)
Equity 160,225 189,599 29,374 18,464 10,909
Government Bond 67,021 42,632 (24,389) 1,259 (25,648)
Capital Protected 21,630 24,675 3,046 1,235 1,809
Others 29,239 35,416 6,176 2,179 3,997
Total 480,697 444,993 (35,703) 26,917 (62,624)
Jun-15
Flow Analysis
Mar-15 Jun-15 Difference Return Mobilisation
PKR mln
Money Market 80,562 64,209 (16,353) 991 (17,344)
Income 91,907 105,229 13,322 1,482 11,840
Equity 176,507 187,200 10,693 10,606 2,086
Government Bond 51,936 56,472 4,535 771 3,763
Capital Protected 27,778 32,413 4,635 817 3,818
Others 39,347 42,486 3,138 1,359 1,779
Total 468,037 488,009 19,970 16,026 5,942
Dec-15
Flow Analysis
Sep-15 Dec-15 Difference Return Mobilisation

AMC Industry | Flow Analysis (9MCY16)
StockMarket
Performance
MoneyMarket Review
AUMs No. of funds SMAMarketshare
FlowAnalysis
PKR mln
Money Market 64,209 60,607 (3,601) 768 (4,369)
Income 105,229 111,920 6,690 1,836 4,854
Equity 189,200 190,464 1,264 (3,587) 4,851
Government Bond 56,472 64,507 8,035 1,025 7,009
Capital Protected 32,413 38,625 6,213 9,295 6,203
Others 42,486 44,361 1,876 (138) 2,014
Total 490,009 510,484 20,477 9,199 20,562
Mar-16
Flow Analysis
Dec-15 Mar-16 Difference Return Mobilisation
PKR mln
Money Market 55,578 60,736 5,158 720 4,438
Income 91,888 109,973 18,084 1,438 16,645
Equity 209,427 237,268 27,841 18,172 9,668
Government Bond 53,476 56,452 2,976 707 2,268
Capital Protected 43,457 48,816 5,358 1,799 3,559
Others 50,734 55,547 4,812 8,597 (3,785)
Total 504,560 568,792 64,229 31,433 32,793
Sep-16
Flow Analysis
Jun-16 Sep-16 Difference Return Mobilisation
PKR mln
Money Market 60,607 55,578 (5,029) 786 (5,815)
Income 111,920 91,888 (20,031) 1,534 (21,566)
Equity 190,464 209,427 18,632 15,289 3,672
Government Bond 64,507 53,476 (11,031) 951 (11,982)
Capital Protected 38,626 43,457 4,830 1,201 3,629
Others 44,362 50,734 6,372 2,149 4,222
Total 510,486 504,560 (6,257) 21,910 (27,840)
Jun-16
Flow Analysis
Mar-16 Jun-16 Difference Return Mobilisation

Bibliography
http://www.secp.gov.pk/
http://www.mufap.com.pk/
https://www.psx.com.pk/