vietnam tea industry: an analysis from value chain approach
DESCRIPTION
Over the past two decades, there has been an increasing trend in analyzing international trade from the perspective of “value chains”, particularly in agro industry. For many countries, particularly developingcountries including Vietnam, agriculture is the backbone of economic development and the main source ofincome. Together with rice production, Vietnam is also known as one of the most ancient home of tea. Teaindustry in Vietnam has a history of up to three thousand years and tea plays a vital role in income improvement and poverty alleviation in rural areas, especially in the Northern Uplands and North East South. In addition, tea is a high-value product that Viet Nam is already exporting to many other countries and territories worldwide. Having all these importance, there are still challenges facing the Vietnam tea industry including high fragmentation, small-scale operation and weak linkage among participants in the tea manufacturing process. This paper, hence, seeks to investigate the roles and benefits of participants in this single crop through value chain analysis to help them upgrade their position in the tea chain.TRANSCRIPT
International Journal of Managing Value and Supply Chains (IJMVSC) Vol. 6, No. 3, September 2015
DOI: 10.5121/ijmvsc.2015.6301 1
VIETNAM TEA INDUSTRY: AN ANALYSIS FROM
VALUE CHAIN APPROACH
Nguyen Viet Khoi1- Chu Huong Lan2- To Linh Huong3
1Dept. of Int’l Economics and Business, VNU University of Economics and Business
2IAE NICE Graduate School of Management-Université Nice Sophia Antipolis 3Dept. of Int’l Economics and Business, VNU University of Economics and Business
ABSTRACT
Over the past two decades, there has been an increasing trend in analyzing international trade from the
perspective of “value chains”, particularly in agro industry. For many countries, particularly developing
countries including Vietnam, agriculture is the backbone of economic development and the main source of
income. Together with rice production, Vietnam is also known as one of the most ancient home of tea. Tea
industry in Vietnam has a history of up to three thousand years and tea plays a vital role in income
improvement and poverty alleviation in rural areas, especially in the Northern Uplands and North East
South. In addition, tea is a high-value product that Viet Nam is already exporting to many other countries
and territories worldwide. Having all these importance, there are still challenges facing the Vietnam tea
industry including high fragmentation, small-scale operation and weak linkage among participants in the
tea manufacturing process. This paper, hence, seeks to investigate the roles and benefits of participants in
this single crop through value chain analysis to help them upgrade their position in the tea chain.
KEYWORDS:
Upgrading Value Chain, Tea Value Chain, Vietnam Tea Industry, Vietnam Value Chain.
JEL: M10, M11 1. INTRODUCTION
The cultivation of tea in Vietnam has a long history up to three thousand years and teaplant has brought many economics benefits to the country, especiallyto farmers and locals in rural areas. Enjoying tea is considered a meaningful traditional custom of Vietnamese people since its appearance. Tea sector in Vietnam is export oriented with about 80 percent of its annual total output supplying foreign markets. Up to now, tea products have made their presence in more than 100 countries and territories worldwide with annual export value of 200 millionU.S. dollars. Despite such big achievements, Vietnamese tea sector are still confronting even bigger challenges. Among these issues, unequal distribution of power and allocation of costs and margins in tea value chain are big matters of concern. There is a need to foster the integration and participation of the poor in the tea chain in order to better distribute the gains from improvements. This report looks for investigating this issue through a detailed study of the tea value chain in Viet Nam, in the hope of obtaining a clear picture in the structure of the value chain, the positions of the different actors, the overheads and benefits shared to each with the focus on producers. The information collected will be used to identify and address some recommendations for improving the position of the most disadvantaged.
International Journal of Managing Value and Supply Chains (IJMVSC) Vol. 6, No. 3, September 2015
2
2. METHODOLOGY
A comprehensive survey was undertaken in Moc Chau, Son La with 65 selected samples. Questionnaires are designed to interview worker farmers here. The report applies both qualitative and quantitative approach to touch value chain analysis. The principal methodology is to develop a comprehensive map of value chain to understand the characteristics of the chain actors and the relationships among them, of the flow of tea through the chain. This information is obtained by conducting surveys and interviews as well as by collecting secondary data from various sources. After the value chain has been mapped, the next step is to identify the distribution of costs and margins of each. This step use quantitative tool to explore how overheads and margins are distributed over the chain actors. (Van den Berg, Michael, 2004) .In this study, multiple linear regressions are used to analyze factors affecting tea productivity of farmer. Data is collected from survey and analyzed by using SPSS 20.
3. LITERATURE REVIEW A number of studies about Vietnam tea industry have been carried out(Khải, N. H., 2005) in “Vietnam tea plants: Competitiveness in export and development”, introduced the origins and development process of tea industry in Vietnam; and gave an overview about the world tea market to draw lessons and experiences for Vietnam. The study also addressedrecommendations to enhance the competitiveness of tea products for export markets (Hao, 2011)explored factors affecting tea yield of farmers and mentioned the solutions to enhance economic efficiency of tea production in period of economic integration for the households (Nguyễn, 2010) focused on analyzing the status, achievements and challenges of tea industry in Thai Nguyen and ability to develop tea production for export in this province. The research also suggestedsolutions for socio-economic development of tea yield.(Nguyễn Thị, 2007) systematized development trends of world tea market and marketing strategies for tea export from some tea exporting countries and lessons for Vietnam. Nguyen Trung Dong (2011)mentioned the risk of losing markets of Vietnam tea products and suggested long-term and feasible strategies to set foot in world market of Vietnam tea products. Tran Cong Thang (2004), with the project: The Value Chain for Tea in Viet Nam: Prospects for Participation of the Poor, deeply investigated the tea value chain in Vietnam and potential opportunities for participation of the poor in such value chain. The report, however, carried out in 2004 and based on the traditional value chain structure. Up to now, there has been a change in the structure of tea value chain and the integration among actors in the tea chain. This implies a need for further research on updated tea value chains. In the light of these facts, we can say that there is a school of studies on tea industry in Vietnam. Nevertheless value chain approach remains limited. This study uses value chain approach aiming at examining thedistribution of roles and benefits of participants in the chain.
4. OVERVIEW OF THE TEA SECTOR IN VIETNAM Vietnam is known as one of the most ancient cradle of tea with tea plant dates back 3,000 years. The first tea plantation in Vietnam was established in 1890 in Phu Tho by The French (Zeiss, M., & den Braber, K., 2001). Since the inception of Renovation (Doi Moi) and the government’s focus on tea as a strategic commodity for economic development, tea production has grown significantly.
International Journal of Managing Value and Supply Chains (IJMVSC) Vol. 6, No. 3, September 2015
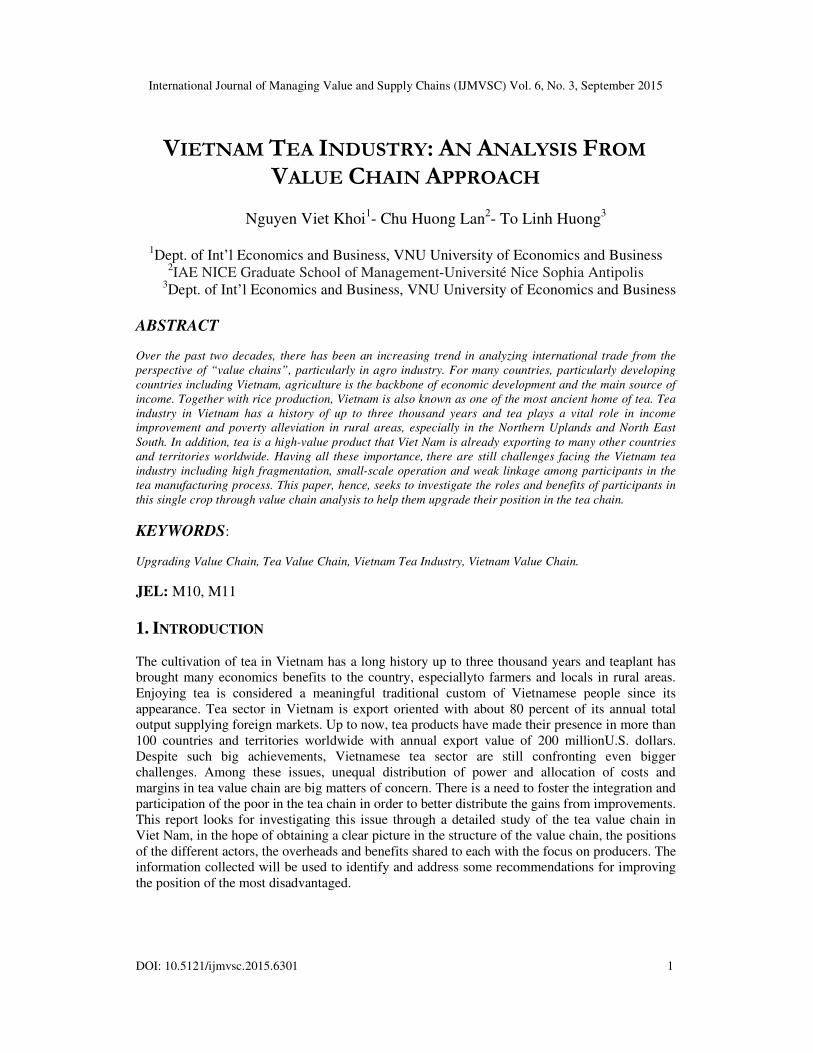
4.1 Production Vietnam is given a favor to grow tea spreading in the whole country. cities nationwide spend 125,000 ha of their cultivation area for growing tea, an increase of 63.8 percent with that in 1999.
Figure 1: Production and Tea Area in
Tea production in Viet Nam grew stea production increased an average of 8.5 percent yearly, while area and yield grew 2.5 and 3.1 percent respectively. The year 2012, meanwhile, saw an exponential growth in planted tea area.Tea yield, nevertheless, is still at low lequestion. In particular, yields are typically above thmore conducive to tea production. capacity of 4 tons per ha while the figure reaches 11 to 12 tons in Northern provinces.
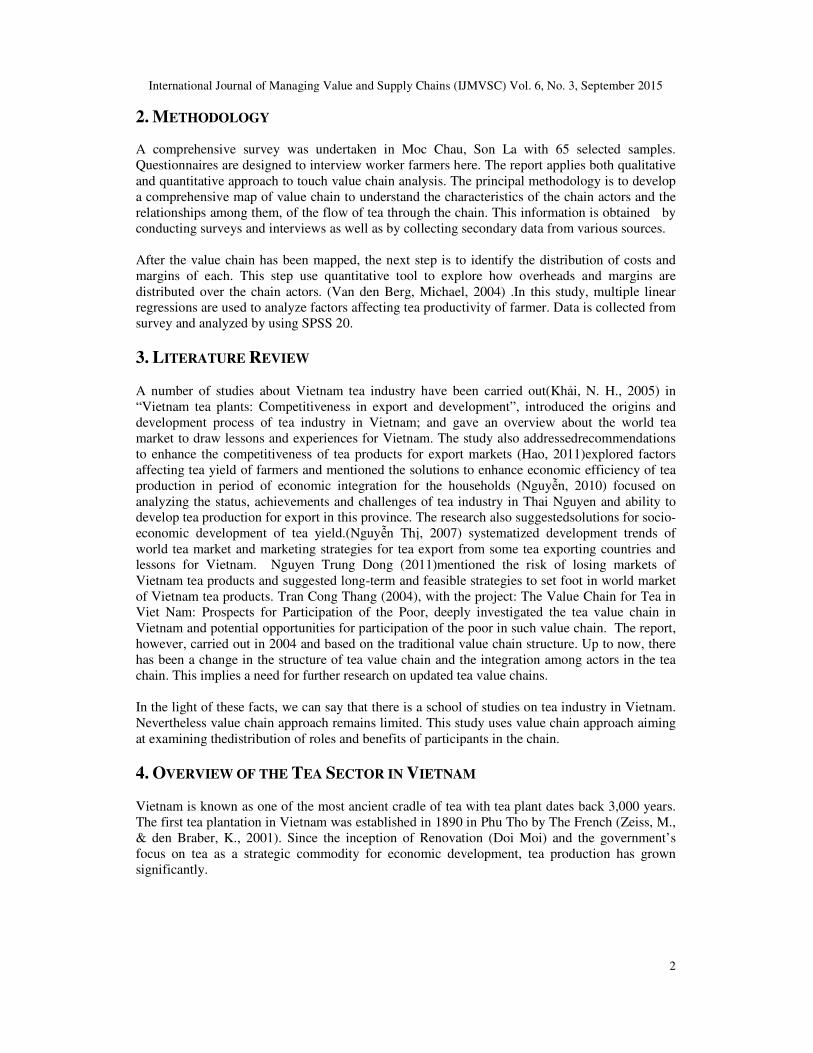
Figure 2: Tea Yield in
4.2 Export Situation
Export Volumes Viet Nam tea products have made their presence in more than 100 countries and territories worldwide; with average annual export valueexport oriented with nearly 80 percent of production destined for foreign markets. The country’s main export is low-quality black tea processed using orthodox technology. Mostwholesale, without labels, branding or packaging.
0
50
100
150
200
250
0
5
10
15
20
International Journal of Managing Value and Supply Chains (IJMVSC) Vol. 6, No. 3, September 2015
Vietnam is given a favor to grow tea spreading in the whole country. At present, 34 provinces and 125,000 ha of their cultivation area for growing tea, an increase of 63.8
Figure 1: Production and Tea Area in Vietnam (2005-2012)
Tea production in Viet Nam grew strikingly over the past decades. During the periodtea production increased an average of 8.5 percent yearly, while area and yield grew 2.5 and 3.1 percent respectively. The year 2012, meanwhile, saw an exponential growth in planted tea
is still at low level, only reaches 3.1% in average during question. In particular, yields are typically above the average level in the Northernmore conducive to tea production. Normally, traditional tea varieties in the midland only have
er ha while the figure reaches 11 to 12 tons in Northern provinces.
Figure 2: Tea Yield in Vietnam (2005-2012)
tea products have made their presence in more than 100 countries and territories h average annual export value up to USD 200mil. The tea sector in Viet Nam is
export oriented with nearly 80 percent of production destined for foreign markets. The country’s quality black tea processed using orthodox technology. Most of this tea is sold
wholesale, without labels, branding or packaging.
0
20
40
60
80
100
120
140
160
180
Planted Area
of Tea( 1000
ha)
Average tea yield (100kg/ha)
International Journal of Managing Value and Supply Chains (IJMVSC) Vol. 6, No. 3, September 2015
3
At present, 34 provinces and 125,000 ha of their cultivation area for growing tea, an increase of 63.8
the period 2005-2011, tea production increased an average of 8.5 percent yearly, while area and yield grew 2.5 and 3.1 percent respectively. The year 2012, meanwhile, saw an exponential growth in planted tea
during the time in e average level in the Northern, which are
, traditional tea varieties in the midland only have er ha while the figure reaches 11 to 12 tons in Northern provinces.
tea products have made their presence in more than 100 countries and territories . The tea sector in Viet Nam is
export oriented with nearly 80 percent of production destined for foreign markets. The country’s of this tea is sold
Planted Area
of Tea( 1000
Average tea yield (100kg/ha)
International Journal of Managing Value and Supply Chains (IJMVSC) Vol. 6, No. 3, September 2015
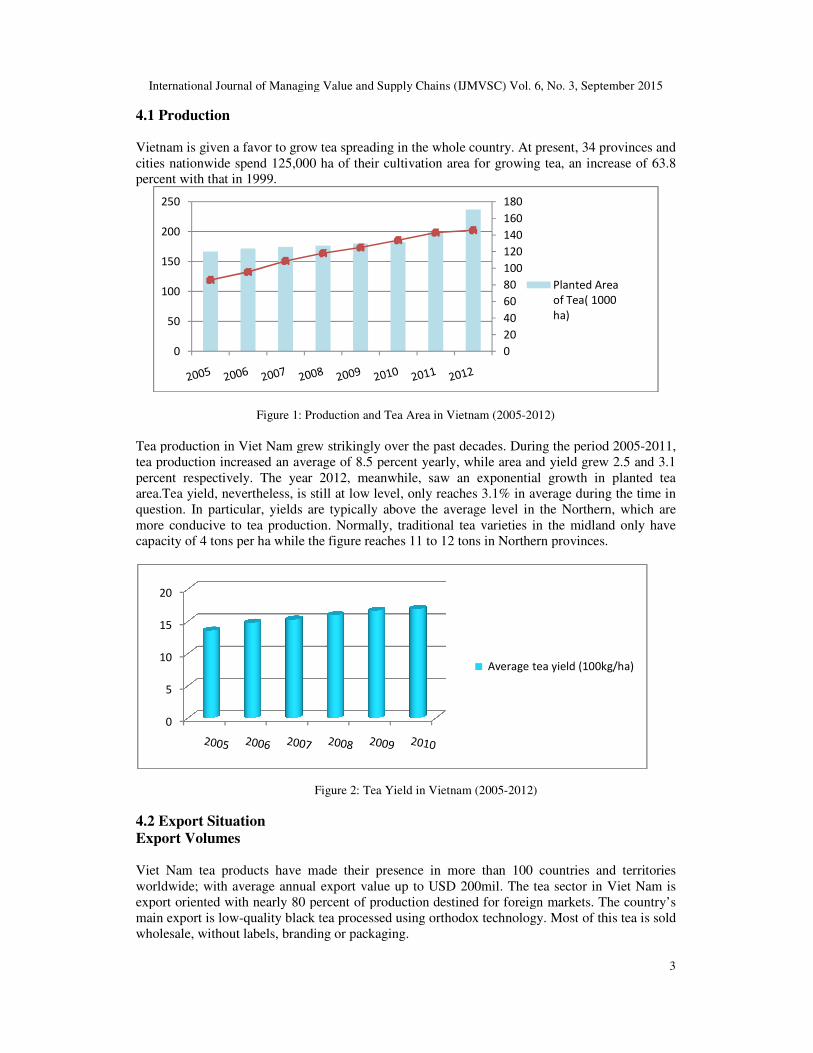
Figure 3: Tea Export versus Tea Production, selected years
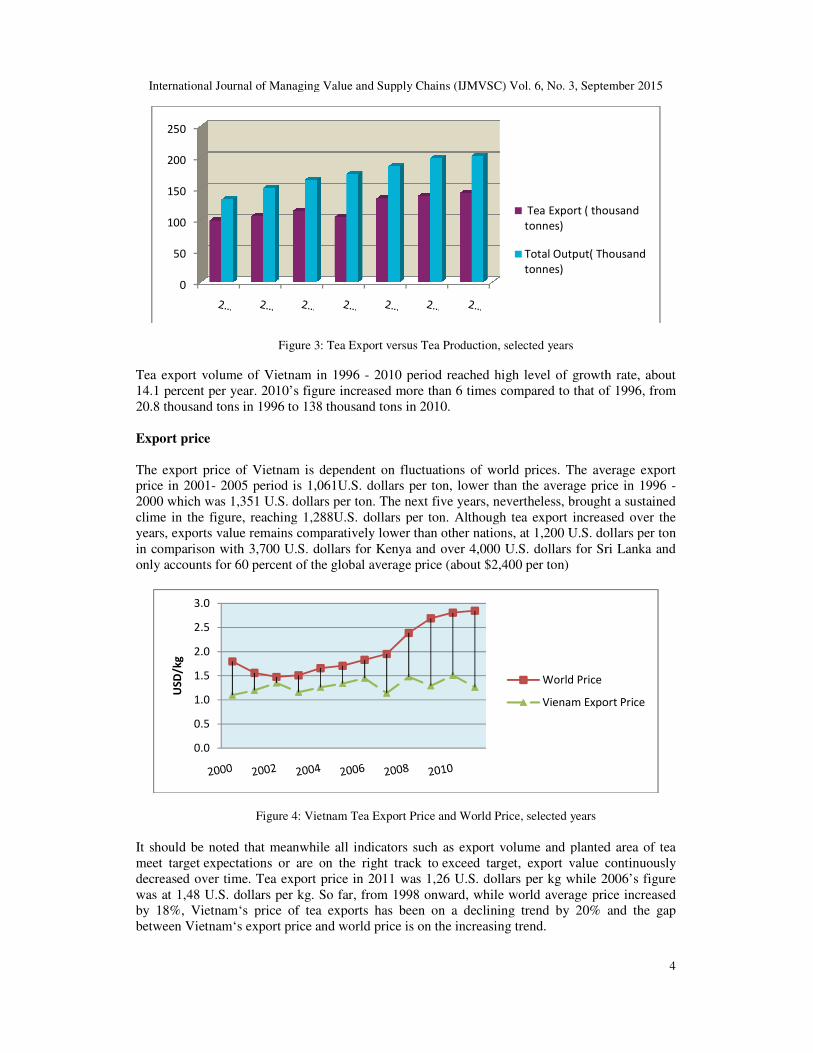
Tea export volume of Vietnam in 1996 14.1 percent per year. 2010’s figure increased more than 6 times compared to that of 1996, from 20.8 thousand tons in 1996 to 138 thousand tons in 2010. Export price The export price of Vietnam is dependent on fluctuations ofprice in 2001- 2005 period is 1,0612000 which was 1,351 U.S. dollars clime in the figure, reaching 1,288years, exports value remains comparatively lower than other nations, at 1,200 U.S. dollars per ton in comparison with 3,700 U.S. dollars for Kenya and over 4,000 U.S. dollars for Sri Lanka and only accounts for 60 percent of the global average
Figure 4: Vietnam Tea Export Price and World Price, selected years
It should be noted that meanwhile all inmeet target expectations or are on the right track todecreased over time. Tea export price in was at 1,48 U.S. dollars per kg. So far, from 1998 onward, while world average price increased by 18%, Vietnam‘s price of tea exports has been on a declining trend by 20% and the gap between Vietnam‘s export price and world pri
0
50
100
150
200
250
0.0
0.5
1.0
1.5
2.0
2.5
3.0
USD/kg
International Journal of Managing Value and Supply Chains (IJMVSC) Vol. 6, No. 3, September 2015
Figure 3: Tea Export versus Tea Production, selected years
Tea export volume of Vietnam in 1996 - 2010 period reached high level of growth rate, about
figure increased more than 6 times compared to that of 1996, from 20.8 thousand tons in 1996 to 138 thousand tons in 2010.
is dependent on fluctuations of world prices. The average export 061U.S. dollars per ton, lower than the average price in 1996
U.S. dollars per ton. The next five years, nevertheless, brought a sustained 1,288U.S. dollars per ton. Although tea export increased o
alue remains comparatively lower than other nations, at 1,200 U.S. dollars per ton in comparison with 3,700 U.S. dollars for Kenya and over 4,000 U.S. dollars for Sri Lanka and only accounts for 60 percent of the global average price (about $2,400 per ton)
Figure 4: Vietnam Tea Export Price and World Price, selected years
It should be noted that meanwhile all indicators such as export volume and planted area of tea
expectations or are on the right track to exceed target, export value continuously decreased over time. Tea export price in 2011 was 1,26 U.S. dollars per kg while 2006’s figure
per kg. So far, from 1998 onward, while world average price increased f tea exports has been on a declining trend by 20% and the gap
and world price is on the increasing trend.
Tea Export ( thousand
tonnes)
Total Output( Thousand
tonnes)
World Price
Vienam Export Price
International Journal of Managing Value and Supply Chains (IJMVSC) Vol. 6, No. 3, September 2015
4
2010 period reached high level of growth rate, about figure increased more than 6 times compared to that of 1996, from
The average export per ton, lower than the average price in 1996 -
, nevertheless, brought a sustained sed over the
alue remains comparatively lower than other nations, at 1,200 U.S. dollars per ton in comparison with 3,700 U.S. dollars for Kenya and over 4,000 U.S. dollars for Sri Lanka and
planted area of tea , export value continuously
g while 2006’s figure per kg. So far, from 1998 onward, while world average price increased
f tea exports has been on a declining trend by 20% and the gap
Tea Export ( thousand
Total Output( Thousand
Vienam Export Price
International Journal of Managing Value and Supply Chains (IJMVSC) Vol. 6, No. 3, September 2015
5. TEAVALUE CHAIN IN VIETNAM
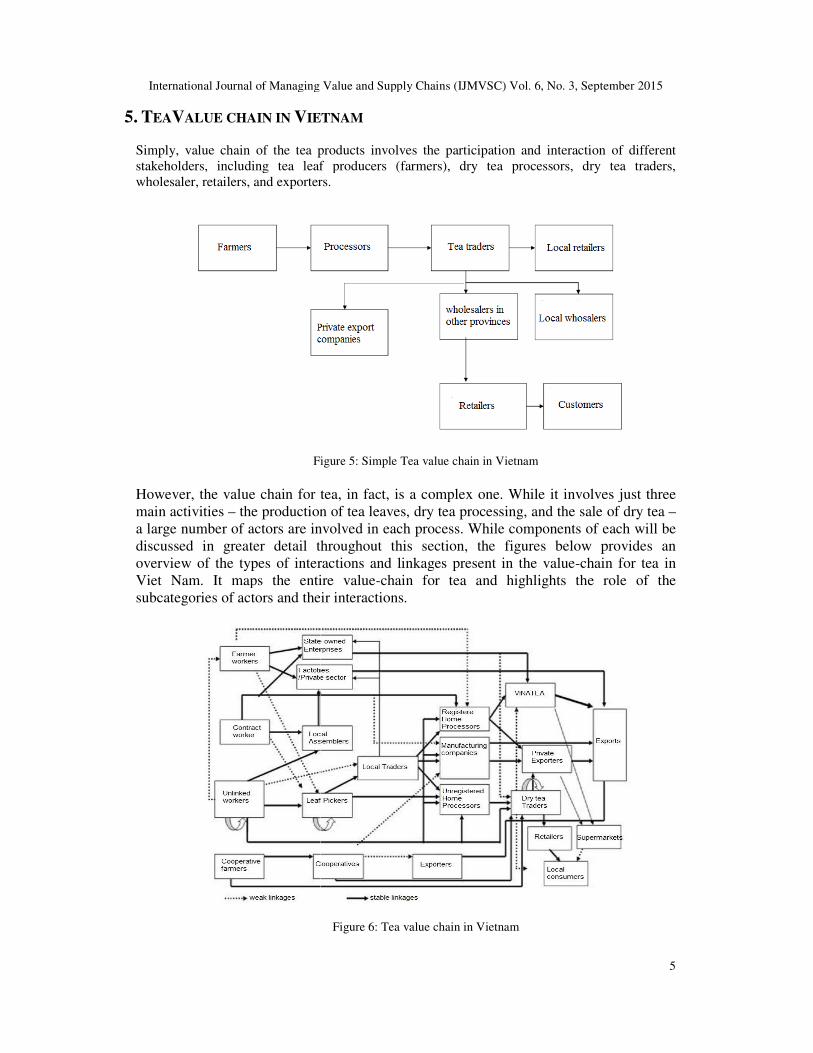
Simply, value chain of the tea productsstakeholders, including tea leaf producerswholesaler, retailers, and exporters.
Figure 5: Simple Tea value chain in Vietnam However, the value chain for tea, in fact, is a complex one. While it involves just three main activities – the production of tea leaves, a large number of actors are involved in each process. While components discussed in greater detail throughout this section, the figures below provides an overview of the types of interactions and linkages present in the valueViet Nam. It maps the entire valuesubcategories of actors and their interactions.
International Journal of Managing Value and Supply Chains (IJMVSC) Vol. 6, No. 3, September 2015
IETNAM
of the tea products involves the participation and interaction of different stakeholders, including tea leaf producers (farmers), dry tea processors, dry wholesaler, retailers, and exporters.
Figure 5: Simple Tea value chain in Vietnam
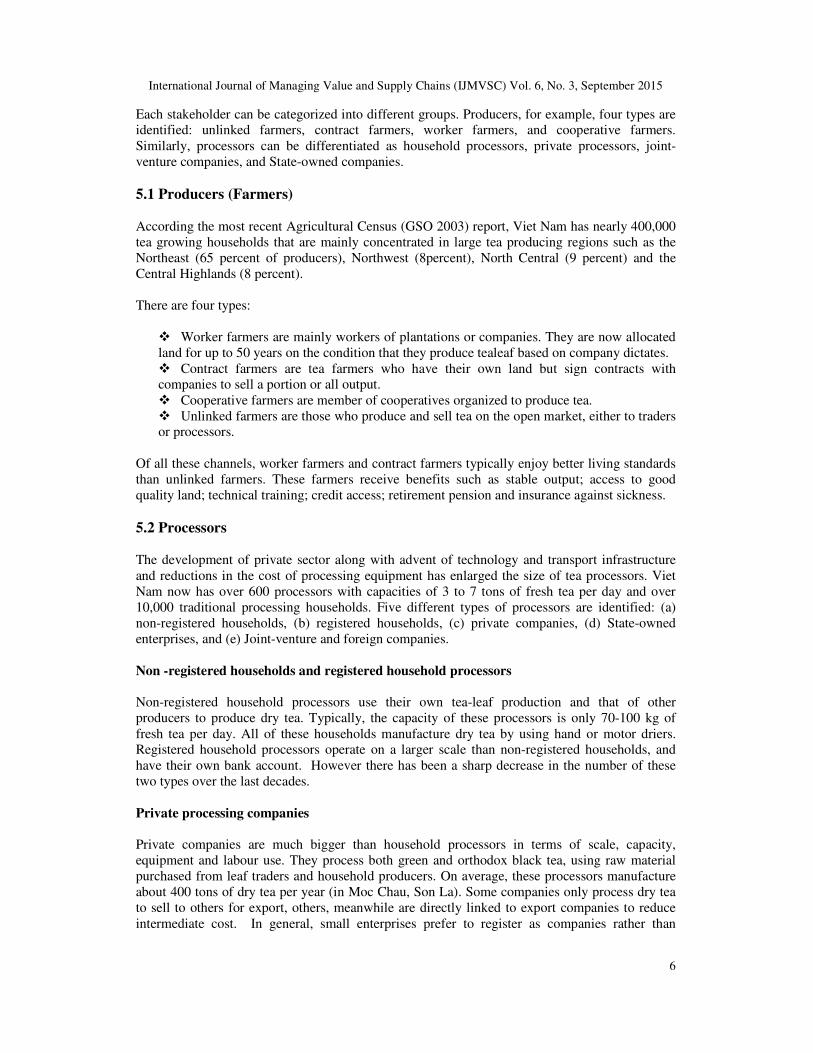
However, the value chain for tea, in fact, is a complex one. While it involves just three the production of tea leaves, dry tea processing, and the sale of
a large number of actors are involved in each process. While components of each will be discussed in greater detail throughout this section, the figures below provides an overview of the types of interactions and linkages present in the value-chain for tea in Viet Nam. It maps the entire value-chain for tea and highlights the role of the subcategories of actors and their interactions.
Figure 6: Tea value chain in Vietnam
International Journal of Managing Value and Supply Chains (IJMVSC) Vol. 6, No. 3, September 2015
5
involves the participation and interaction of different tea traders,
However, the value chain for tea, in fact, is a complex one. While it involves just three tea processing, and the sale of dry tea –
of each will be discussed in greater detail throughout this section, the figures below provides an
chain for tea in role of the
International Journal of Managing Value and Supply Chains (IJMVSC) Vol. 6, No. 3, September 2015
6
Each stakeholder can be categorized into different groups. Producers, for example, four types are identified: unlinked farmers, contract farmers, worker farmers, and cooperative farmers. Similarly, processors can be differentiated as household processors, private processors, joint-venture companies, and State-owned companies.
5.1 Producers (Farmers) According the most recent Agricultural Census (GSO 2003) report, Viet Nam has nearly 400,000 tea growing households that are mainly concentrated in large tea producing regions such as the Northeast (65 percent of producers), Northwest (8percent), North Central (9 percent) and the Central Highlands (8 percent). There are four types:
� Worker farmers are mainly workers of plantations or companies. They are now allocated land for up to 50 years on the condition that they produce tealeaf based on company dictates. � Contract farmers are tea farmers who have their own land but sign contracts with companies to sell a portion or all output. � Cooperative farmers are member of cooperatives organized to produce tea. � Unlinked farmers are those who produce and sell tea on the open market, either to traders or processors.
Of all these channels, worker farmers and contract farmers typically enjoy better living standards than unlinked farmers. These farmers receive benefits such as stable output; access to good quality land; technical training; credit access; retirement pension and insurance against sickness. 5.2 Processors The development of private sector along with advent of technology and transport infrastructure and reductions in the cost of processing equipment has enlarged the size of tea processors. Viet Nam now has over 600 processors with capacities of 3 to 7 tons of fresh tea per day and over 10,000 traditional processing households. Five different types of processors are identified: (a) non-registered households, (b) registered households, (c) private companies, (d) State-owned enterprises, and (e) Joint-venture and foreign companies. Non -registered households and registered household processors
Non-registered household processors use their own tea-leaf production and that of other producers to produce dry tea. Typically, the capacity of these processors is only 70-100 kg of fresh tea per day. All of these households manufacture dry tea by using hand or motor driers. Registered household processors operate on a larger scale than non-registered households, and have their own bank account. However there has been a sharp decrease in the number of these two types over the last decades. Private processing companies Private companies are much bigger than household processors in terms of scale, capacity, equipment and labour use. They process both green and orthodox black tea, using raw material purchased from leaf traders and household producers. On average, these processors manufacture about 400 tons of dry tea per year (in Moc Chau, Son La). Some companies only process dry tea to sell to others for export, others, meanwhile are directly linked to export companies to reduce intermediate cost. In general, small enterprises prefer to register as companies rather than
International Journal of Managing Value and Supply Chains (IJMVSC) Vol. 6, No. 3, September 2015
7
households due to many privileges. First, such enterprises are typically involved in other activities besides tea and as such, formal registration as a company makes it easier to do business. Second, it enabled them to avoid local government intervention. 5.3 Traders
There are two types of tea traders: tealeaf assemblers and dry tea traders. Tealeaf assembler
Local tealeaf assemblers collect fresh tea from individual households using bicycles and motorbikes. Tealeaf assemblers buy tealeaf from household growers in the region, then sell to processors in the commune or to tealeaf traders. The fact that tealeaf begins to deteriorate after 4-6 hours means it must be mobilized immediately for processing. Dry tea traders
Dry tea traders are those purchasing dry tea from processors and then packaging and labelling the products before sale to wholesalers or retailers. Typically they use cars or trucks to transport products and possess more marketing experience. In addition, large scale of operations made trading network of traders wide. They largely sell dry tea to other districts and deliver to other provinces for both wholesalers and retailers or companies for export. Nonetheless, today tea leaf assemblers almost disappear. Tea processors often directly contact with farmers (tea producers) in the regions and purchase tealeaf to reduce intermediate cost. 5.4 Domestic wholesale and retailers
As part of the value chain, the wholesales purchasedry tea, which are packaged and labelled from tea traders and then distribute to retailers. With regard to retailers, currently in the city, there are four main paths for tea retail: small tea houses, tea bars, traditional tea retailers and supermarkets. In large city, the increase in the number of tea bars has resulted in a fall in the number of traditional tea retailers and small tea houses. Inrecent years, supermarkets or large agents have become destinations for large number of consumers due to its safeness and diversity in products. This kind of consumption is gradually replacing purchases of green tea from traditional retailers because supermarket price is transparent, products are safe, and it is convenient for consumers. The company rather than the supermarket sets the price of tea in supermarkets. And supermarkets pay tea companies after making sales. 5.5 Exporters
At present, about 80 percent of Viet Nam’s tea output is destined for export. In 2006, according to VITAS,approximately 180 companies in Vietnam exported tea. In comparison withthe number of rice exporters or coffee exporters, the school of tea exporters is much higher. Tea can be exported through three channels:
� State-owned enterprises (mostly through VINATEA) � Joint-venture and foreign companies � Private companies (including limited and joint stock companies).
International Journal of Managing Value and Supply Chains (IJMVSC) Vol. 6, No. 3, September 2015
8
The role of the state has dropped markedly in recent year. The private sector in export is becoming increasingly important. In 2007, private companies accounted for 12 of the 19 largest exporters.
6. PROFITS AND MARGINS
This part examines the production costs, profits, and margins accruing to key participants in value chains with an emphasis on returns to producers.
6.1 Cost and Profit of actors in tea value chain
It is due to limited time and expense, the study is supposed to provide thorough description about production cost of specific tea varieties: LDP1 Cost and Profit of tealeaf producer
A research survey carried out in Moc Chau, Son La examines the production cost of producers in Moc Chau tea farm as followed.
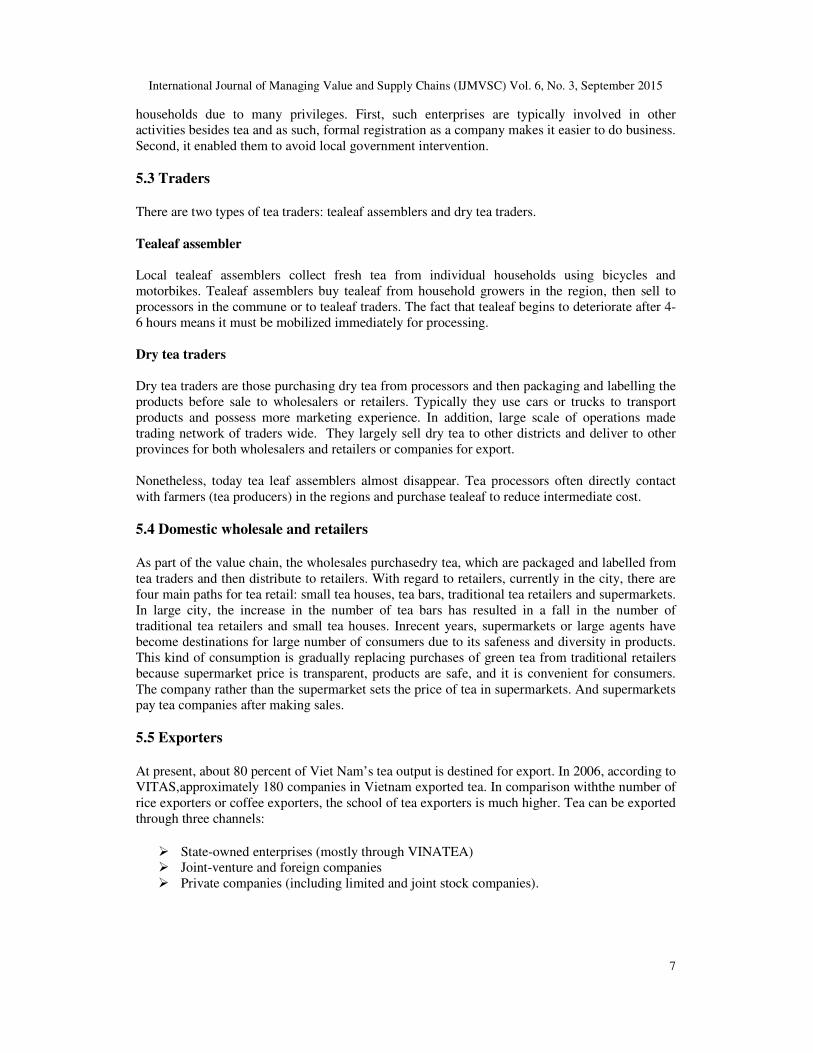
Table 1: Tea production cost of worker farmers in Moc Chau, Son La in 2014 (10.000m2)
Items Unit Total Cost (VND) A Cost Labor cost ------ 0 Materials Cost Kg 26,025,000
Other Cost 1,000,000
B Total Cost VND/ha 27,025,000
C Total Unit Cost VND/kg 2,460
D Sale Price VND/kg 6,000
E Revenue VND/ha 66,000,000
F Profit VND/ha 39,075,000
G Unit Profit VND/kg 3,540
Tealeaf farmers normally do not take into account the labour cost because they use the family labour. The typical sale price of tealeaf is 6,000 VND per kg .In such a way, total cost per unit is at 2,460 VND per kg and the farmers gain a net profit of 3,540 VND per kg. Accordingly, they may think they are doing well while in fact, the total production cost of their tealeaf exceeds its value. Costs and Profit of Private processing companies With a large scale of production, private companies typically produce about 11,000 kg of dry tea per month on the planted area of 10ha (100.000 m2). Normally, private processing companies put on production in 10 months per year, meaning that annual dry tea output will be 110,000 tons. The table below will display production cost to produce 22,000 tons dry tea from 110,000 tons fresh tealeaf.
International Journal of Managing Value and Supply Chains (IJMVSC) Vol. 6, No. 3, September 2015
9
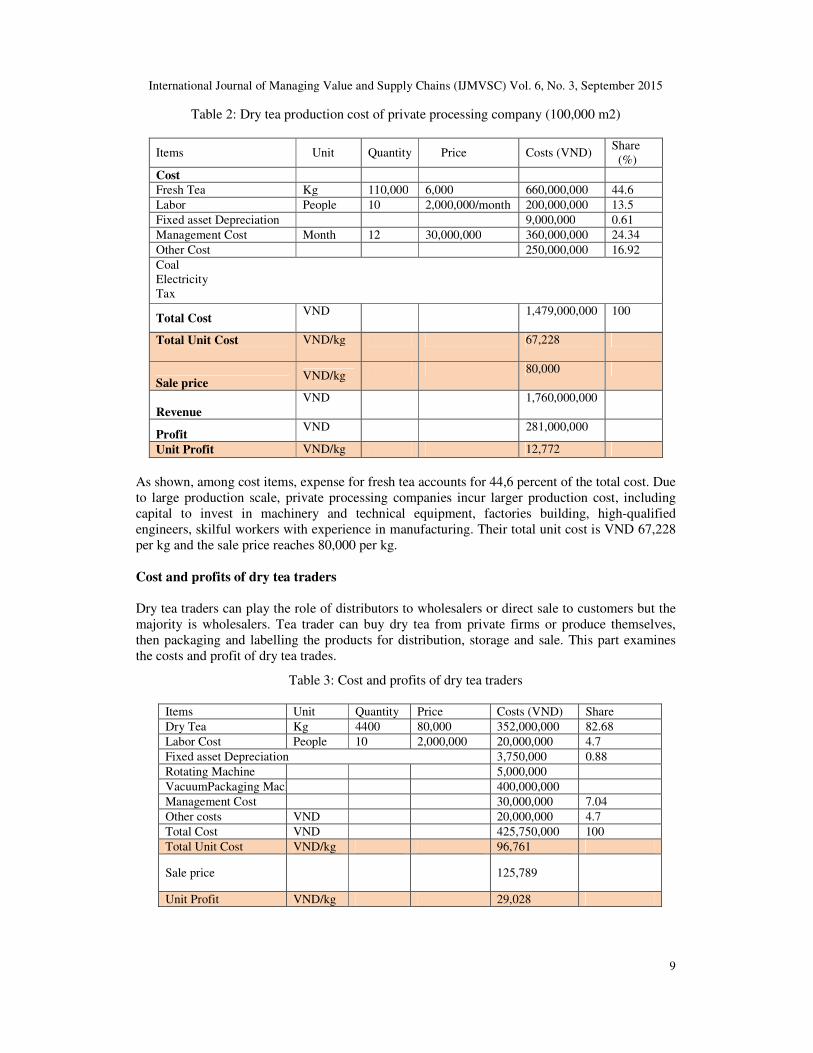
Table 2: Dry tea production cost of private processing company (100,000 m2)
Items Unit Quantity Price Costs (VND) Share (%)
Cost Fresh Tea Kg 110,000 6,000 660,000,000 44.6 Labor People 10 2,000,000/month 200,000,000 13.5 Fixed asset Depreciation 9,000,000 0.61 Management Cost Month 12 30,000,000 360,000,000 24.34 Other Cost 250,000,000 16.92 Coal Electricity Tax
Total Cost VND 1,479,000,000 100
Total Unit Cost VND/kg 67,228
Sale price VND/kg 80,000
Revenue
VND 1,760,000,000
Profit VND 281,000,000
Unit Profit VND/kg 12,772
As shown, among cost items, expense for fresh tea accounts for 44,6 percent of the total cost. Due to large production scale, private processing companies incur larger production cost, including capital to invest in machinery and technical equipment, factories building, high-qualified engineers, skilful workers with experience in manufacturing. Their total unit cost is VND 67,228 per kg and the sale price reaches 80,000 per kg. Cost and profits of dry tea traders
Dry tea traders can play the role of distributors to wholesalers or direct sale to customers but the majority is wholesalers. Tea trader can buy dry tea from private firms or produce themselves, then packaging and labelling the products for distribution, storage and sale. This part examines the costs and profit of dry tea trades.
Table 3: Cost and profits of dry tea traders
Items Unit Quantity Price Costs (VND) Share Dry Tea Kg 4400 80,000 352,000,000 82.68 Labor Cost People 10 2,000,000 20,000,000 4.7 Fixed asset Depreciation 3,750,000 0.88 Rotating Machine 5,000,000 VacuumPackaging Machines 400,000,000 Management Cost 30,000,000 7.04 Other costs VND 20,000,000 4.7 Total Cost VND 425,750,000 100 Total Unit Cost VND/kg 96,761
Sale price 125,789
Unit Profit VND/kg 29,028
International Journal of Managing Value and Supply Chains (IJMVSC) Vol. 6, No. 3, September 2015
10
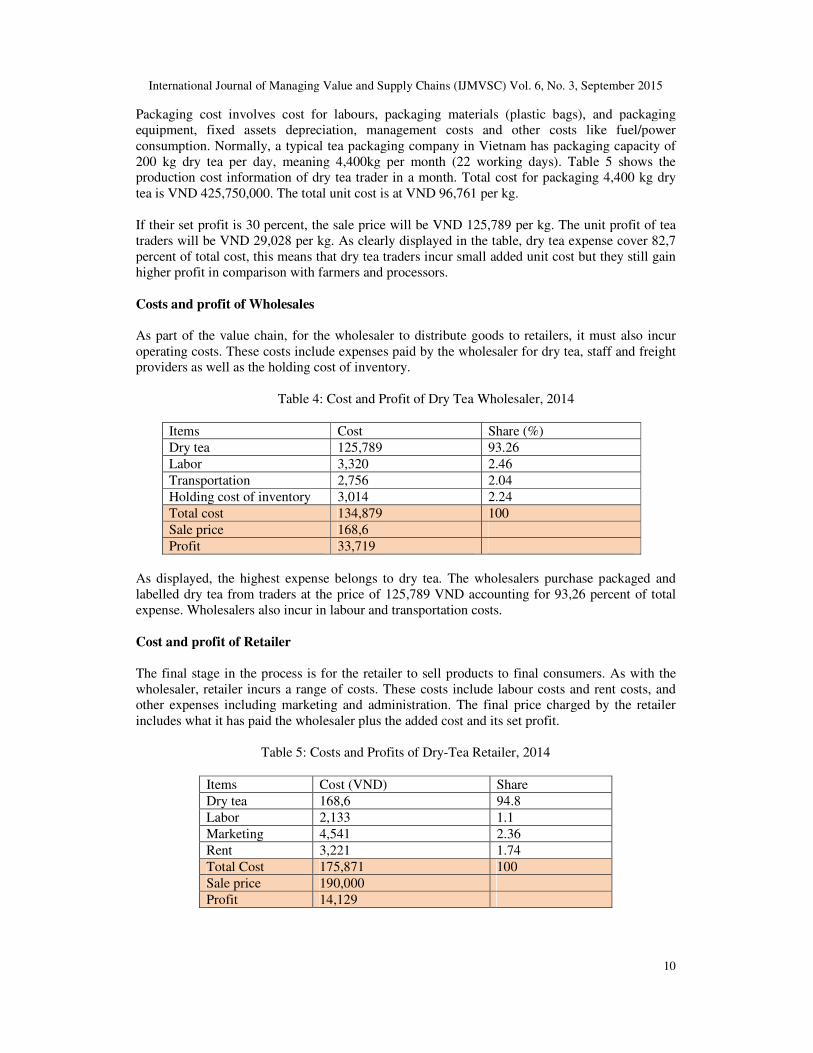
Packaging cost involves cost for labours, packaging materials (plastic bags), and packaging equipment, fixed assets depreciation, management costs and other costs like fuel/power consumption. Normally, a typical tea packaging company in Vietnam has packaging capacity of 200 kg dry tea per day, meaning 4,400kg per month (22 working days). Table 5 shows the production cost information of dry tea trader in a month. Total cost for packaging 4,400 kg dry tea is VND 425,750,000. The total unit cost is at VND 96,761 per kg. If their set profit is 30 percent, the sale price will be VND 125,789 per kg. The unit profit of tea traders will be VND 29,028 per kg. As clearly displayed in the table, dry tea expense cover 82,7 percent of total cost, this means that dry tea traders incur small added unit cost but they still gain higher profit in comparison with farmers and processors. Costs and profit of Wholesales As part of the value chain, for the wholesaler to distribute goods to retailers, it must also incur operating costs. These costs include expenses paid by the wholesaler for dry tea, staff and freight providers as well as the holding cost of inventory.
Table 4: Cost and Profit of Dry Tea Wholesaler, 2014
Items Cost Share (%) Dry tea 125,789 93.26 Labor 3,320 2.46 Transportation 2,756 2.04 Holding cost of inventory 3,014 2.24 Total cost 134,879 100 Sale price 168,6 Profit 33,719
As displayed, the highest expense belongs to dry tea. The wholesalers purchase packaged and labelled dry tea from traders at the price of 125,789 VND accounting for 93,26 percent of total expense. Wholesalers also incur in labour and transportation costs. Cost and profit of Retailer
The final stage in the process is for the retailer to sell products to final consumers. As with the wholesaler, retailer incurs a range of costs. These costs include labour costs and rent costs, and other expenses including marketing and administration. The final price charged by the retailer includes what it has paid the wholesaler plus the added cost and its set profit.
Table 5: Costs and Profits of Dry-Tea Retailer, 2014
Items Cost (VND) Share Dry tea 168,6 94.8 Labor 2,133 1.1 Marketing 4,541 2.36 Rent 3,221 1.74 Total Cost 175,871 100 Sale price 190,000 Profit 14,129
International Journal of Managing Value and Supply Chains (IJMVSC) Vol. 6, No. 3, September 2015
11
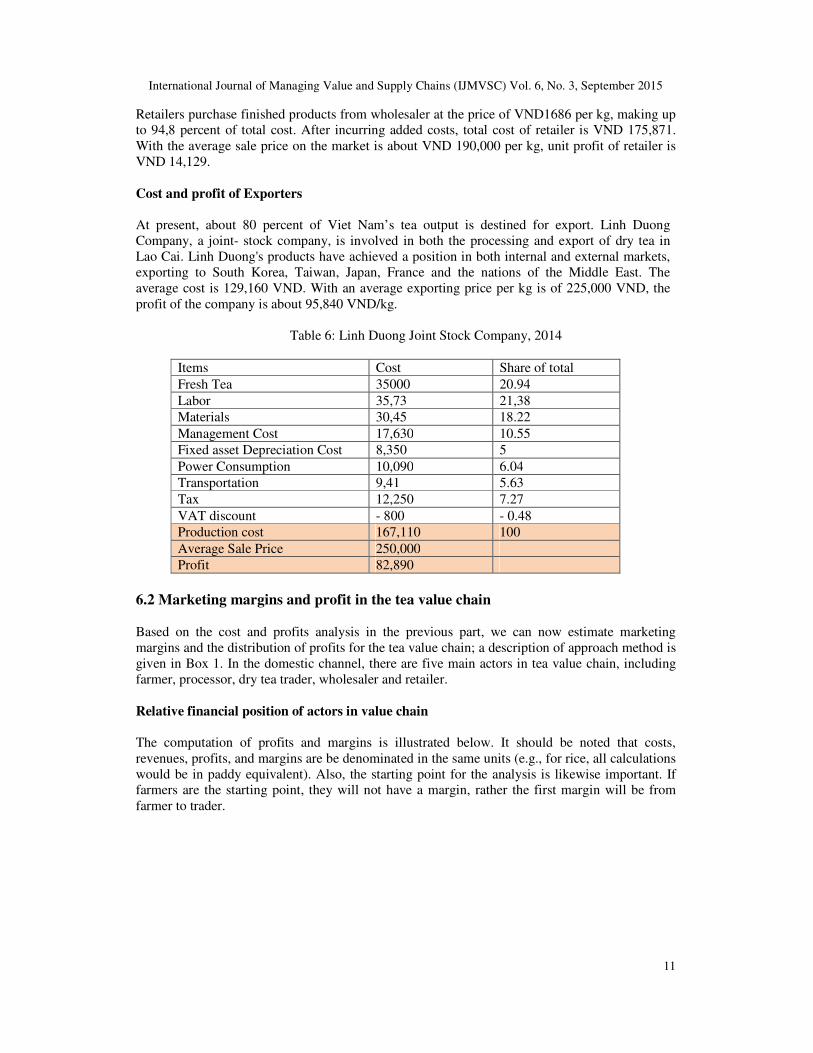
Retailers purchase finished products from wholesaler at the price of VND1686 per kg, making up to 94,8 percent of total cost. After incurring added costs, total cost of retailer is VND 175,871. With the average sale price on the market is about VND 190,000 per kg, unit profit of retailer is VND 14,129. Cost and profit of Exporters At present, about 80 percent of Viet Nam’s tea output is destined for export. Linh Duong Company, a joint- stock company, is involved in both the processing and export of dry tea in Lao Cai. Linh Duong's products have achieved a position in both internal and external markets, exporting to South Korea, Taiwan, Japan, France and the nations of the Middle East. The average cost is 129,160 VND. With an average exporting price per kg is of 225,000 VND, the profit of the company is about 95,840 VND/kg.
Table 6: Linh Duong Joint Stock Company, 2014
Items Cost Share of total Fresh Tea 35000 20.94 Labor 35,73 21,38 Materials 30,45 18.22 Management Cost 17,630 10.55 Fixed asset Depreciation Cost 8,350 5 Power Consumption 10,090 6.04 Transportation 9,41 5.63 Tax 12,250 7.27 VAT discount - 800 - 0.48 Production cost 167,110 100 Average Sale Price 250,000 Profit 82,890
6.2 Marketing margins and profit in the tea value chain Based on the cost and profits analysis in the previous part, we can now estimate marketing margins and the distribution of profits for the tea value chain; a description of approach method is given in Box 1. In the domestic channel, there are five main actors in tea value chain, including farmer, processor, dry tea trader, wholesaler and retailer. Relative financial position of actors in value chain
The computation of profits and margins is illustrated below. It should be noted that costs, revenues, profits, and margins are be denominated in the same units (e.g., for rice, all calculations would be in paddy equivalent). Also, the starting point for the analysis is likewise important. If farmers are the starting point, they will not have a margin, rather the first margin will be from farmer to trader.
International Journal of Managing Value and Supply Chains (IJMVSC) Vol. 6, No. 3, September 2015
12
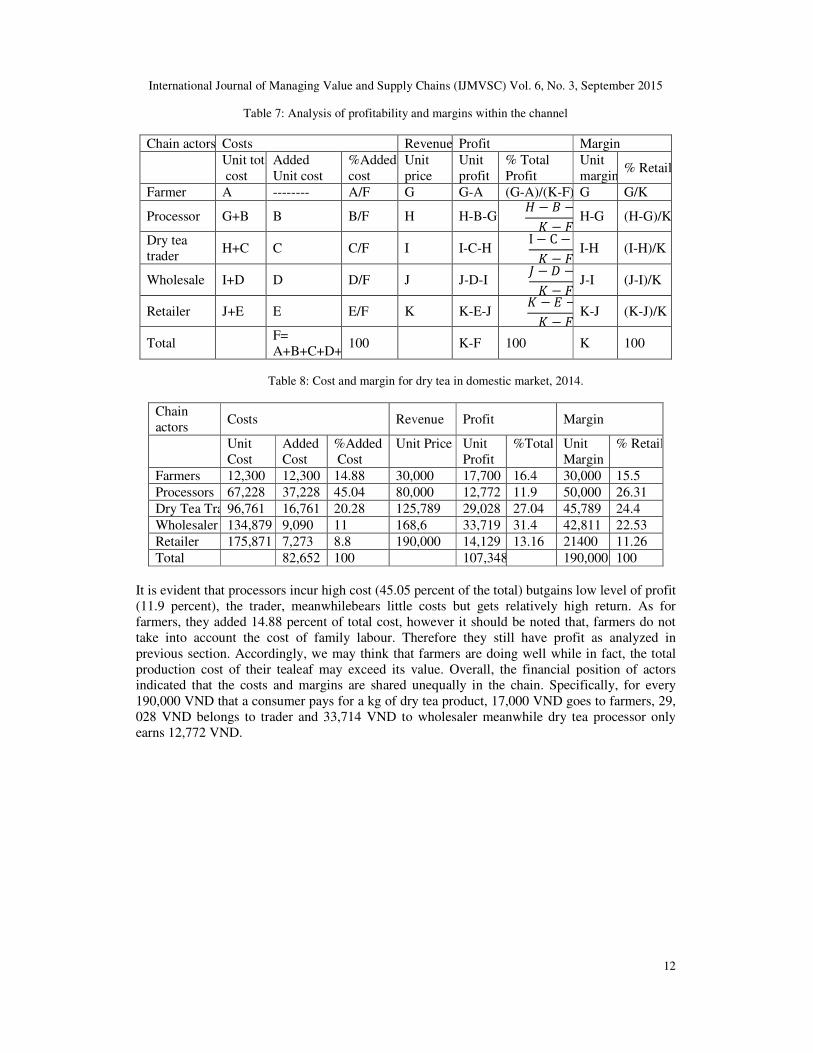
Table 7: Analysis of profitability and margins within the channel
Chain actors Costs Revenue Profit Margin
Unit total cost
Added Unit cost
%Added cost
Unit price
Unit profit
% Total Profit
Unit margin
% Retail price
Farmer A -------- A/F G G-A (G-A)/(K-F) G G/K
Processor G+B B B/F H H-B-G � − � −
� − �H-G (H-G)/K
Dry tea trader
H+C C C/F I I-C-H I − C −
� − �I-H (I-H)/K
Wholesale I+D D D/F J J-D-I � − −
� − �J-I (J-I)/K
Retailer J+E E E/F K K-E-J � − −
� − �K-J (K-J)/K
Total F= A+B+C+D+E
100 K-F 100 K 100
Table 8: Cost and margin for dry tea in domestic market, 2014.
Chain actors
Costs Revenue Profit Margin
Unit Total Cost
Added Cost
%Added Cost
Unit Price Unit Profit
%Total Profit Unit Margin
% Retail price
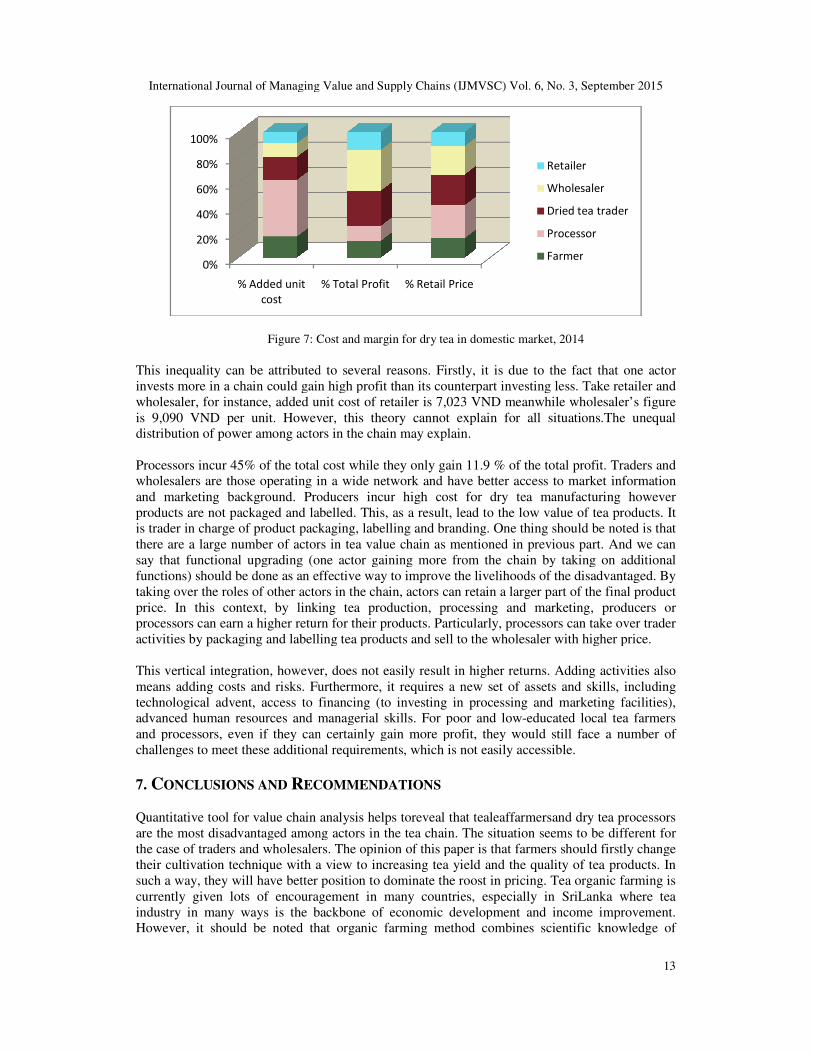
Farmers 12,300 12,300 14.88 30,000 17,700 16.4 30,000 15.5 Processors 67,228 37,228 45.04 80,000 12,772 11.9 50,000 26.31 Dry Tea Trader96,761 16,761 20.28 125,789 29,028 27.04 45,789 24.4 Wholesaler 134,879 9,090 11 168,6 33,719 31.4 42,811 22.53 Retailer 175,871 7,273 8.8 190,000 14,129 13.16 21400 11.26 Total 82,652 100 107,348 190,000 100
It is evident that processors incur high cost (45.05 percent of the total) butgains low level of profit (11.9 percent), the trader, meanwhilebears little costs but gets relatively high return. As for farmers, they added 14.88 percent of total cost, however it should be noted that, farmers do not take into account the cost of family labour. Therefore they still have profit as analyzed in previous section. Accordingly, we may think that farmers are doing well while in fact, the total production cost of their tealeaf may exceed its value. Overall, the financial position of actors indicated that the costs and margins are shared unequally in the chain. Specifically, for every 190,000 VND that a consumer pays for a kg of dry tea product, 17,000 VND goes to farmers, 29, 028 VND belongs to trader and 33,714 VND to wholesaler meanwhile dry tea processor only earns 12,772 VND.
International Journal of Managing Value and Supply Chains (IJMVSC) Vol. 6, No. 3, September 2015
Figure 7: Cost and margin for dry tea in domestic market, 2014
This inequality can be attributed to several reasons. Firstly, it is due to the fact that one actor invests more in a chain could gain high profit than its counterpart investing less. Take retailer and wholesaler, for instance, added unit cost of retailer is 9,090 VND per unit. However, this theory cadistribution of power among actors in the chain Processors incur 45% of the total cost while they only gain wholesalers are those operating in a wide network and have better access to market information and marketing background. Producers incur high coproducts are not packaged and labelis trader in charge of product packaging, there are a large number of actors in tea value chain as mensay that functional upgrading (one actor gaining more from the chain by taking on additional functions) should be done as an effective way to improve the livelihoods of the disadvantaged. By taking over the roles of other actors in the chain, actors price. In this context, by linking tea production, processing and marketing, producers or processors can earn a higher return for their products. Particularly, processors can take over trader activities by packaging and labelling tea products and sell to the wholesaler with higher price. This vertical integration, however, does not easily result in higher returns. Adding activities also means adding costs and risks. Furthermore, it requires a new set of technological advent, access to financing (to investing in procesadvanced human resources and managerial skills. For poor and lowand processors, even if they can certainly gchallenges to meet these additional requirements, which is not easily accessible.
7. CONCLUSIONS AND RECOMMENDATIONS
Quantitative tool for value chain analysis helpsare the most disadvantaged among actors in the tea chain. The situation seems to be different for the case of traders and wholesalertheir cultivation technique with a view tsuch a way, they will have better position to dominate the roost in pricing. Tea organic farming is currently given lots of encouragement in many countries, especially in SriLanka where tea industry in many ways is the backbone of economic development and income improvement. However, it should be noted that
0%
20%
40%
60%
80%
100%
% Added unit
cost
International Journal of Managing Value and Supply Chains (IJMVSC) Vol. 6, No. 3, September 2015
Figure 7: Cost and margin for dry tea in domestic market, 2014
This inequality can be attributed to several reasons. Firstly, it is due to the fact that one actor invests more in a chain could gain high profit than its counterpart investing less. Take retailer and wholesaler, for instance, added unit cost of retailer is 7,023 VND meanwhile wholesaler’s figure is 9,090 VND per unit. However, this theory cannot explain for all situations.Tdistribution of power among actors in the chain may explain.
incur 45% of the total cost while they only gain 11.9 % of the total profit. Traders and wholesalers are those operating in a wide network and have better access to market information and marketing background. Producers incur high cost for dry tea manufacturing however
are not packaged and labelled. This, as a result, lead to the low value of tea products. It ader in charge of product packaging, labelling and branding. One thing should be noted is that
there are a large number of actors in tea value chain as mentioned in previous part. And wsay that functional upgrading (one actor gaining more from the chain by taking on additional functions) should be done as an effective way to improve the livelihoods of the disadvantaged. By taking over the roles of other actors in the chain, actors can retain a larger part of the final product price. In this context, by linking tea production, processing and marketing, producers or processors can earn a higher return for their products. Particularly, processors can take over trader
ing tea products and sell to the wholesaler with higher price.
This vertical integration, however, does not easily result in higher returns. Adding activities also means adding costs and risks. Furthermore, it requires a new set of assets and skills, includingtechnological advent, access to financing (to investing in processing and marketing facilities),advanced human resources and managerial skills. For poor and low-educated local tea and processors, even if they can certainly gain more profit, they would still face a number of challenges to meet these additional requirements, which is not easily accessible.
ECOMMENDATIONS
Quantitative tool for value chain analysis helps toreveal that tealeaffarmersand dry tea processors are the most disadvantaged among actors in the tea chain. The situation seems to be different for
and wholesalers. The opinion of this paper is that farmers should firstly change their cultivation technique with a view to increasing tea yield and the quality of tea products. In such a way, they will have better position to dominate the roost in pricing. Tea organic farming is currently given lots of encouragement in many countries, especially in SriLanka where tea
y in many ways is the backbone of economic development and income improvement. However, it should be noted that organic farming method combines scientific knowledge of
% Total Profit % Retail Price
Retailer
Wholesaler
Dried tea trader
Processor
Farmer
International Journal of Managing Value and Supply Chains (IJMVSC) Vol. 6, No. 3, September 2015
13
This inequality can be attributed to several reasons. Firstly, it is due to the fact that one actor invests more in a chain could gain high profit than its counterpart investing less. Take retailer and
meanwhile wholesaler’s figure nnot explain for all situations.The unequal
11.9 % of the total profit. Traders and wholesalers are those operating in a wide network and have better access to market information
tea manufacturing however This, as a result, lead to the low value of tea products. It
. One thing should be noted is that tioned in previous part. And we can
say that functional upgrading (one actor gaining more from the chain by taking on additional functions) should be done as an effective way to improve the livelihoods of the disadvantaged. By
can retain a larger part of the final product price. In this context, by linking tea production, processing and marketing, producers or processors can earn a higher return for their products. Particularly, processors can take over trader
ing tea products and sell to the wholesaler with higher price.
This vertical integration, however, does not easily result in higher returns. Adding activities also and skills, including
sing and marketing facilities), educated local tea farmers
ain more profit, they would still face a number of
tea processors are the most disadvantaged among actors in the tea chain. The situation seems to be different for
. The opinion of this paper is that farmers should firstly change o increasing tea yield and the quality of tea products. In
such a way, they will have better position to dominate the roost in pricing. Tea organic farming is currently given lots of encouragement in many countries, especially in SriLanka where tea
y in many ways is the backbone of economic development and income improvement. organic farming method combines scientific knowledge of
Dried tea trader
International Journal of Managing Value and Supply Chains (IJMVSC) Vol. 6, No. 3, September 2015
14
modern technology with traditional farming methods based on naturally occurring biological processes. Therefore, support from governmental agencies and NGOs in the form of technical training and on-farm monitoring is vital.
In addition, creating and strengthening linkages between poor farmers and the rest of the tea value chain as well as supporting actors will make a contribution to improve the situation. Private companies and scientific researchers need to support tea farmers improve and update farming technique.Furthermore, farmer’s position in the chain is positively and significantly affected by access to market information. Poorly integrated markets may convey inaccurateinformation, leading to inaccurate cultivation method and resulting inefficient product movement. Access to market information, therefore, could help farmers to update new farming methods, improve tea quality, get the latest information about tea price and, therefore, strengthen their bargaining power. All these factors must be seriously considered in future intervention in order to upgrade farmer’s position in the chain. REFERENCES
[1] Anandajayasekeram, P., & Gebremedhin, B. (2009). Integrating innovation systems perspective and value chain analysis in agricultural research for development: Implications and challenges (No. 16). ILRI (aka ILCA and ILRAD).
[2] Da Silva, C. A. (2009). Agro-industries for development. CABI. [3] Gereffi, G., Humphrey, J., & Kaplinsky, R. (2001). Introduction: Globalisation, value chains and
development. IDS bulletin, 32(3), 1-8. [4] Gereffi, G., Humphrey, J., & Sturgeon, T. (2005). The governance of global value chains. Review
of international political economy, 12(1), 78-104. [5] Hao, N. T. (2011). TẮT, T. NÂNG CAO HIỆU QUẢ TRONG SẢN XUẤT CHÈ CỦA NÔNG
HỘ VỚI HƯỚNG ĐI SẢN XUẤT CHÈ AN TOÀN Ở TỈNH THÁI NGUYÊN. THE LE GTII BAI, 69.Tran,
[6] Kaplinsky, R., & Morris, M . (2001). A handbook for value chain research (Vol. 113). Ottawa: IDRC.
[7] Khải, N. H. (2005). Tea Industry in Vietnam: Export competitiveness and development. [8] Khoi, Nguyen Viet. "Wicked problems: a value chain approach from Vietnam’s dairy product."
SpringerPlus 2.1 (2013): 1-6. [9] Khoi, N. V., & Van Dung, T. (2014). The dairy industry in Viet Nam-A value chain approach,
International Journal of Managing Value and Supply Chains IJMVSC Vol.5, No. 3. [10] Nguyễn Thị, N. ( 2007). Nghiên cứu thị trường-Marketing trong xuất khẩu chè. [11] Nguyễn, T. H. ( 2010). Phát triển ngành chè ở tỉnh Thái Nguyên (Doctoral dissertation, H.: Trung
tâm đào tạo, bồi dưỡng giảng viên lý luận chính trị). [12] Paull, J. (2011). Nanomaterials in food and agriculture: The big issue of small matter for organic
food and farming. In Proceedings of the Third Scientific Conference of ISOFAR (Vol. 2, pp. 96-99). ISOFAR.
[13] Porter, M. E. (1985). Competitive advantage: creating and sustaining superior performance. [14] Raikes, P., Friis Jensen, M., & Ponte, S. (2000). Global commodity chain analysis and the French
filière approach: comparison and critique. Economy and society, 29(3), 390-417. [15] Schmitz, H. (2005). Value chain analysis for policy-makers and practitioners. International Labour
Organization. [16] N. D. (2009). Transition to organic tea production in the Thai Nguyen Province, Vietnam:
economic and environmental impacts. EEPSEA Research Report, (2008-RR8). [17] Van den Berg, Michael. (2004). Making value chains work better for the poor: a toolbook for
practitioners of value chain analysis. Asian Development Bank,[Vietnam Resident Mission]. [16] Womack, J. P., & Jones, D. T. . (2000). Lean thinking, 1996. [18] Zeiss, M., & den Braber, K. (2001). Growth and physiology of the tea plant. Tea, IPM ecological
guide. [19] aven, A., van Eerdewijk, A., Senders, A., van Wees, C., & Snelder, R. ( 2009). Gender in Value
Chains. Emerging Lessons and Questions. Arnhem: Agri-ProFocus.

International Journal of Managing Value and Supply Chains (IJMVSC) Vol. 6, No. 3, September 2015
15
Authors
Nguyen Viet Khoi (Vietnam) Professor, University of Economics and Business, Vietnam National University, HanoiDr. Khoi joined Vietnam National University in 2000. His research interests are global value chains, supply chains and the global strategies of multinational corporations. Dr. Khoi has been teaching and doing research at institutions such as University of Wisconsin, University of Southern New Hampshire, Columbia University. Dr. Khoi has published books such as Global Value Chains of Transnational Corporations: A practical Approach from China’s current situation (VNU Publishing House 2013), International Economics (co-author; VNU Publishing House, 2010), and Transnational corporations: Theories and Practices (co-author; VNU Publishing House, 2007). Chu Huong Lan (France)
Lan completed her BA at Faculty of International Business and Economics, University of Economics and Business, Vietnam National University,Hanoi (VNU). She hasconsistently performed well in her academics research during her academic years at VNU and has been especially interested in the field of global value chain, prompting her to continue further research in this field. She has currently beenpursuing her MA at IAE NICE Graduate School of Management, Université Nice Sophia Antipolis.
To Linh Huong (Vietnam)
Huong joined Vietnam National University (VNU) as a PhD student since 2013 and has been doing research in the global value chain of tea sector. She graduated from University of Birmingham (UK) in 2011 with a distinction master degree on International Business. Her research interests are global value chains, supply chains and the global strategies of MNCs.