version 1.0 october 2016 - income tax department tax data/income... · income tax return statistics...
TRANSCRIPT
Income Tax Department
Income Tax Return Statistics
Assessment Year 2014-15
Version 1.0
October 2016
Income Tax Return Statistics Assessment Year 2014-15 Version 1.0
1
Document Version Control
Version Month Remarks
1.0 Oct 2016 The statistics were generated from e-filed returns (digitally signed or
where ITRV has been received) and paper returns captured in system
up to 30th September 2016.
Income Tax Return Statistics Assessment Year 2014-15 Version 1.0
2
Table of Contents
Overview ............................................................................................................................. 5
Objective ..................................................................................................................................... 5
Methodology Adopted ............................................................................................................. 5
Consistency Rules ................................................................................................................... 5
Status wise distribution of returns and key values ......................................................... 6
Limitations .................................................................................................................................. 7
Disclaimer ................................................................................................................................... 7
1. Income Tax Returns - All Taxpayers....................................................................... 8
1.1 All Taxpayers – Gross Total Income (AY 2014-15) .............................................. 9
1.2 All Taxpayers - Range of Salary Income (AY 2014-15)..................................... 10
1.3 All Taxpayers - Range of House Property Income (AY 2014-15) ................... 11
1.4 All Taxpayers - Range of Business Income (AY 2014-15) ............................... 12
1.5 All Taxpayers - Range of Long Term Capital Gains (AY 2014-15) ................ 13
1.6 All Taxpayers - Range of Short Term Capital Gains (AY 2014-15) ................ 14
1.7 All Taxpayers - Range of Other Sources Income (AY 2014-15) ..................... 15
1.8 All Taxpayers - Range of Interest Income (AY 2014-15) .................................. 16
1.9 All Taxpayers-Range of Brought Forward Loss Set off (AY 2014-15).......... 17
1.10 All Taxpayers - Range of Returned Income (AY 2014-15) ............................... 18
1.11 All Taxpayers - Range of Tax Payable (AY 2014-15) ........................................ 19
2. Income Tax Returns – Individuals ......................................................................... 20
2.1 Individual– Gross Total Income (AY 2014-15) .................................................... 21
2.2 Individual- Range of Salary Income (AY 2014-15) ............................................. 22
2.3 Individual- Range of House Property Income (AY 2014-15) ........................... 23
2.4 Individual- Range of Business Income (AY 2014-15) ....................................... 24
2.5 Individual- Range of Long Term Capital Gains (AY 2014-15) ......................... 25
2.6 Individual- Range of Short Term Capital Gains (AY 2014-15) ........................ 26
2.7 Individual- Range of Other Sources Income (AY 2014-15) ............................. 27
2.8 Individual- Range of Interest Income (AY 2014-15)........................................... 28
2.9 Individual- Range of Brought Forward Loss Set off (AY 2014-15) ................ 29
2.10 Individual- Range of Returned Income (AY 2014-15) ....................................... 30
2.11 Individual- Range of Tax Payable (AY 2014-15) ................................................. 31

Income Tax Return Statistics Assessment Year 2014-15 Version 1.0
3
3. Income Tax Returns - HUF ...................................................................................... 32
3.1 HUF– Gross Total Income (AY 2014-15) .............................................................. 33
3.2 HUF- Range of House Property Income (AY 2014-15) ...................................... 34
3.3 HUF- Range of Business Income (AY 2014-15) .................................................. 35
3.4 HUF- Range of Long Term Capital Gains (AY 2014-15) ................................... 36
3.5 HUF- Range of Short Term Capital Gains (AY 2014-15)................................... 37
3.6 HUF- Range of Other Sources Income (AY 2014-15) ........................................ 38
3.7 HUF- Range of Interest Income (AY 2014-15) ..................................................... 39
3.8 HUF- Range of Brought Forward Loss Set off (AY 2014-15) .......................... 40
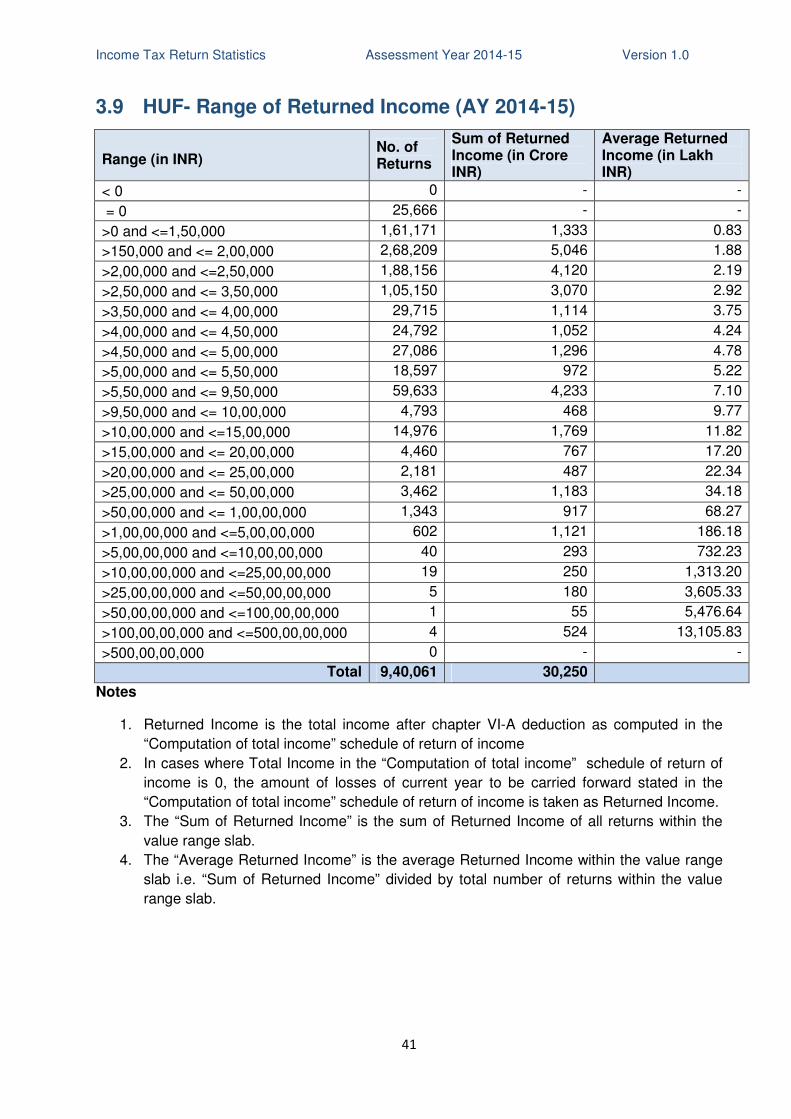
3.9 HUF- Range of Returned Income (AY 2014-15) .................................................. 41
3.10 HUF- Range of Tax Payable (AY 2014-15) ........................................................... 42
4. Income Tax Returns - Firms .................................................................................... 43
4.1 Firm – Gross Total Income (AY 2014-15) ............................................................. 44
4.2 Firm- Range of House Property Income (AY 2014-15) ..................................... 45
4.3 Firm- Range of Business Income (AY 2014-15) ................................................. 46
4.4 Firm- Range of Long Term Capital Gains (AY 2014-15) ................................... 47
4.5 Firm- Range of Short Term Capital Gains (AY 2014-15) .................................. 48
4.6 Firm- Range of Other Sources Income (AY 2014-15) ....................................... 49
4.7 Firm- Range of Interest Income (AY 2014-15) .................................................... 50
4.8 Firm- Range of Brought Forward Loss Set off (AY 2014-15) .......................... 51
4.9 Firm- Range of Returned Income (AY 2014-15) ................................................. 52
4.10 Firm- Range of Tax Payable (AY 2014-15) ........................................................... 53
5. Income Tax Returns - AOP/BOI .............................................................................. 54
5.1 AOP/BOI – Gross Total Income (AY 2014-15) ..................................................... 55
5.2 AOP/BOI- Range of House Property Income (AY 2014-15) ............................. 56
5.3 AOP/BOI- Range of Business Income (AY 2014-15) ......................................... 57
5.4 AOP/BOI- Range of Long Term Capital Gains (AY 2014-15) ........................... 58
5.5 AOP/BOI- Range of Short Term Capital Gains (AY 2014-15) .......................... 59
5.6 AOP/BOI- Range of Other Sources Income (AY 2014-15) ............................... 60
5.7 AOP/BOI- Range of Interest Income (AY 2014-15) ............................................ 61
5.8 AOP/BOI- Range of Brought Forward Loss Set off (AY 2014-15) ................. 62
5.9 AOP/BOI- Range of Returned Income (AY 2014-15) ......................................... 63
5.10 AOP/BOI- Range of Tax Payable (AY 2014-15) ................................................... 64
Income Tax Return Statistics Assessment Year 2014-15 Version 1.0
4
6. Income Tax Returns - Company ............................................................................ 65
6.1 Company – Gross Total Income (AY 2014-15) ................................................... 66
6.2 Company- Range of House Property Income (AY 2014-15) ............................ 67
6.3 Company- Range of Business Income (AY 2014-15) ........................................ 68
6.4 Company- Range of Long Term Capital Gains (AY 2014-15) ......................... 69
6.5 Company- Range of Short Term Capital Gains (AY 2014-15) ......................... 70
6.6 Company- Range of Other Sources Income (AY 2014-15) .............................. 71
6.7 Company- Range of Interest Income (AY 2014-15) ........................................... 72
6.8 Company- Range of Brought Forward Loss Set off (AY 2014-15) ................ 73
6.9 Company- Range of Returned Income (AY 2014-15) ........................................ 74
6.10 Company- Range of Tax Payable (AY 2014-15) ................................................. 75
7. Type of Business ....................................................................................................... 76
7.1 Type of Business –Corporate and Non- corporate Taxpayers (AY 2014-15)
77
Income Tax Return Statistics Assessment Year 2014-15 Version 1.0
5
Overview
Objective
The objective of publishing this statistics is to encourage wider use and analysis of Income-tax
data by Departmental personnel and academicians.
Methodology Adopted
The methodology adopted is as under:
i. The template for statistics was prepared on the basis of previous statistics published by
the Department and assessment of information available in various databases of the
Income Tax Department.
ii. The statistics have been generated from e-filed returns (digitally signed or where ITRV
has been received) and paper returns captured in system.
iii. In cases where more than one return is submitted, the values in the latest return have
been considered.
iv. Consistency Rules were defined (given below) to eliminate returns with inconsistent data.
3,96,88,804 returns were checked against consistency rules and 3,91,28,247 returns
meeting the consistency rules were used for statistical analysis
v. Certain statistics have been mentioned in lakh (100 thousand) and crore (10 million).
vi. Various terms used in the statistics have been defined below respective tables.
Consistency Rules
i. Rule 1: Total Capital Gains in Part B TI = STCG (including negative) + LTCG (zero and
positive only)
ii. Rule 2: Income from Other Sources (Part B TI)>=Gross Interest Income (Schedule OS)
iii. Rule 3: Salary income is shown by Individual category of assesses.
iv. Rule 4: Gross Total Income(GTI)>=0
v. Rule 5: Gross Total Income (GTI) = salary + income from house property + non-negative
total income (or calculated) from business/profession + non-negative total capital gain +
non-negative income from other sources + brought forward/current year loss setoff
vi. Rule 6 : Return Income = Gross Total Income (GTI) - Deduction u/s Chapter VIA
vii. Rule 7: Aggregate Tax Liability >=0
viii. Rule 8: Aggregate Tax Liability <= Return-Income
Income Tax Return Statistics Assessment Year 2014-15 Version 1.0
6
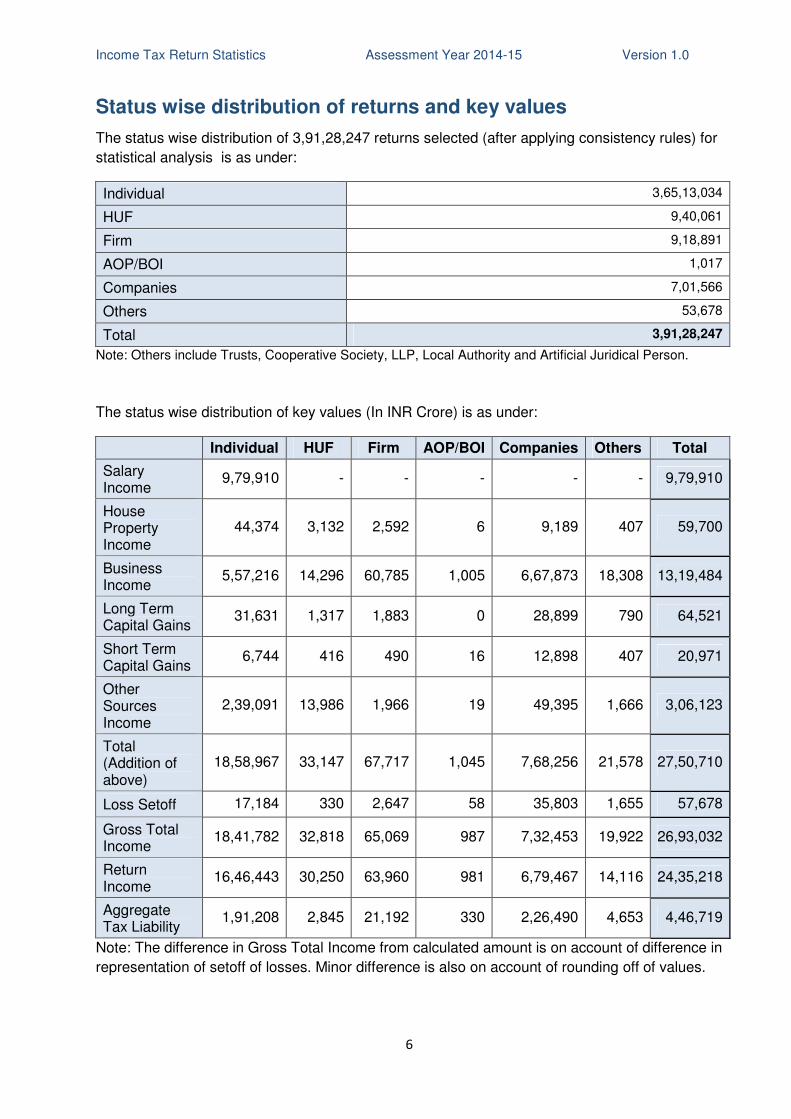
Status wise distribution of returns and key values
The status wise distribution of 3,91,28,247 returns selected (after applying consistency rules) for
statistical analysis is as under:
Individual 3,65,13,034
HUF 9,40,061
Firm 9,18,891
AOP/BOI 1,017
Companies 7,01,566
Others 53,678
Total 3,91,28,247
Note: Others include Trusts, Cooperative Society, LLP, Local Authority and Artificial Juridical Person.
The status wise distribution of key values (In INR Crore) is as under:
Individual HUF Firm AOP/BOI Companies Others Total
Salary Income
9,79,910 - - - - - 9,79,910
House Property Income
44,374 3,132 2,592 6 9,189 407 59,700
Business Income
5,57,216 14,296 60,785 1,005 6,67,873 18,308 13,19,484
Long Term Capital Gains
31,631 1,317 1,883 0 28,899 790 64,521
Short Term Capital Gains
6,744 416 490 16 12,898 407 20,971
Other Sources Income
2,39,091 13,986 1,966 19 49,395 1,666 3,06,123
Total (Addition of above)
18,58,967 33,147 67,717 1,045 7,68,256 21,578 27,50,710
Loss Setoff 17,184 330 2,647 58 35,803 1,655 57,678
Gross Total Income
18,41,782 32,818 65,069 987 7,32,453 19,922 26,93,032
Return Income
16,46,443 30,250 63,960 981 6,79,467 14,116 24,35,218
Aggregate Tax Liability
1,91,208 2,845 21,192 330 2,26,490 4,653 4,46,719
Note: The difference in Gross Total Income from calculated amount is on account of difference in
representation of setoff of losses. Minor difference is also on account of rounding off of values.
Income Tax Return Statistics Assessment Year 2014-15 Version 1.0
7
Limitations
The statistics relating to sources of income have been prepared on the basis of values
mentioned in e-filed returns and values captured from paper returns and the same may contain
data entry errors on the part of the taxpayers/ return filers. Therefore, the accuracy of the
statistics is limited by the accuracy of returns.
Disclaimer
Whilst the Income Tax Statistics have been prepared in good faith, it is not and does not purport
to be comprehensive. Neither Income Tax Department, nor any of its officers or employees
accept any liability or responsibility for the accuracy, reasonableness or completeness of, or for
any errors, omissions or misstatements, negligent or otherwise, relating to the data or any
representation or warranty, express or implied, with respect to the information contained in this
Income Tax Statistics or on the data on which this Statistics is based and liability therefore is
hereby expressly disclaimed.
Income Tax Return Statistics Assessment Year 2014-15 Version 1.0
8
1. Income Tax Returns - All Taxpayers
Income Tax Return Statistics Assessment Year 2014-15 Version 1.0
9
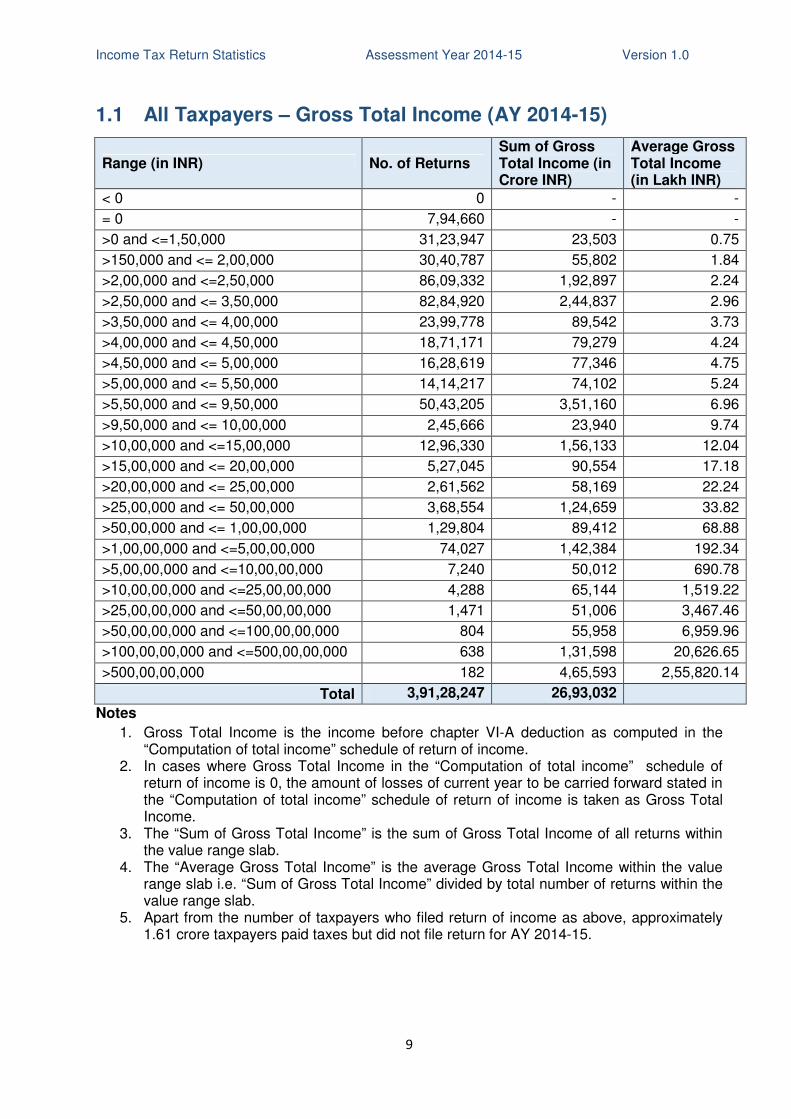
1.1 All Taxpayers – Gross Total Income (AY 2014-15)
Range (in INR) No. of Returns Sum of Gross Total Income (in Crore INR)
Average Gross Total Income (in Lakh INR)
< 0 0 - -
= 0 7,94,660 - -
>0 and <=1,50,000 31,23,947 23,503 0.75
>150,000 and <= 2,00,000 30,40,787 55,802 1.84
>2,00,000 and <=2,50,000 86,09,332 1,92,897 2.24
>2,50,000 and <= 3,50,000 82,84,920 2,44,837 2.96
>3,50,000 and <= 4,00,000 23,99,778 89,542 3.73
>4,00,000 and <= 4,50,000 18,71,171 79,279 4.24
>4,50,000 and <= 5,00,000 16,28,619 77,346 4.75
>5,00,000 and <= 5,50,000 14,14,217 74,102 5.24
>5,50,000 and <= 9,50,000 50,43,205 3,51,160 6.96
>9,50,000 and <= 10,00,000 2,45,666 23,940 9.74
>10,00,000 and <=15,00,000 12,96,330 1,56,133 12.04
>15,00,000 and <= 20,00,000 5,27,045 90,554 17.18
>20,00,000 and <= 25,00,000 2,61,562 58,169 22.24
>25,00,000 and <= 50,00,000 3,68,554 1,24,659 33.82
>50,00,000 and <= 1,00,00,000 1,29,804 89,412 68.88
>1,00,00,000 and <=5,00,00,000 74,027 1,42,384 192.34
>5,00,00,000 and <=10,00,00,000 7,240 50,012 690.78
>10,00,00,000 and <=25,00,00,000 4,288 65,144 1,519.22
>25,00,00,000 and <=50,00,00,000 1,471 51,006 3,467.46
>50,00,00,000 and <=100,00,00,000 804 55,958 6,959.96
>100,00,00,000 and <=500,00,00,000 638 1,31,598 20,626.65
>500,00,00,000 182 4,65,593 2,55,820.14
Total 3,91,28,247 26,93,032
Notes
1. Gross Total Income is the income before chapter VI-A deduction as computed in the “Computation of total income” schedule of return of income.
2. In cases where Gross Total Income in the “Computation of total income” schedule of return of income is 0, the amount of losses of current year to be carried forward stated in the “Computation of total income” schedule of return of income is taken as Gross Total Income.
3. The “Sum of Gross Total Income” is the sum of Gross Total Income of all returns within the value range slab.
4. The “Average Gross Total Income” is the average Gross Total Income within the value range slab i.e. “Sum of Gross Total Income” divided by total number of returns within the value range slab.
5. Apart from the number of taxpayers who filed return of income as above, approximately 1.61 crore taxpayers paid taxes but did not file return for AY 2014-15.
Income Tax Return Statistics Assessment Year 2014-15 Version 1.0
10
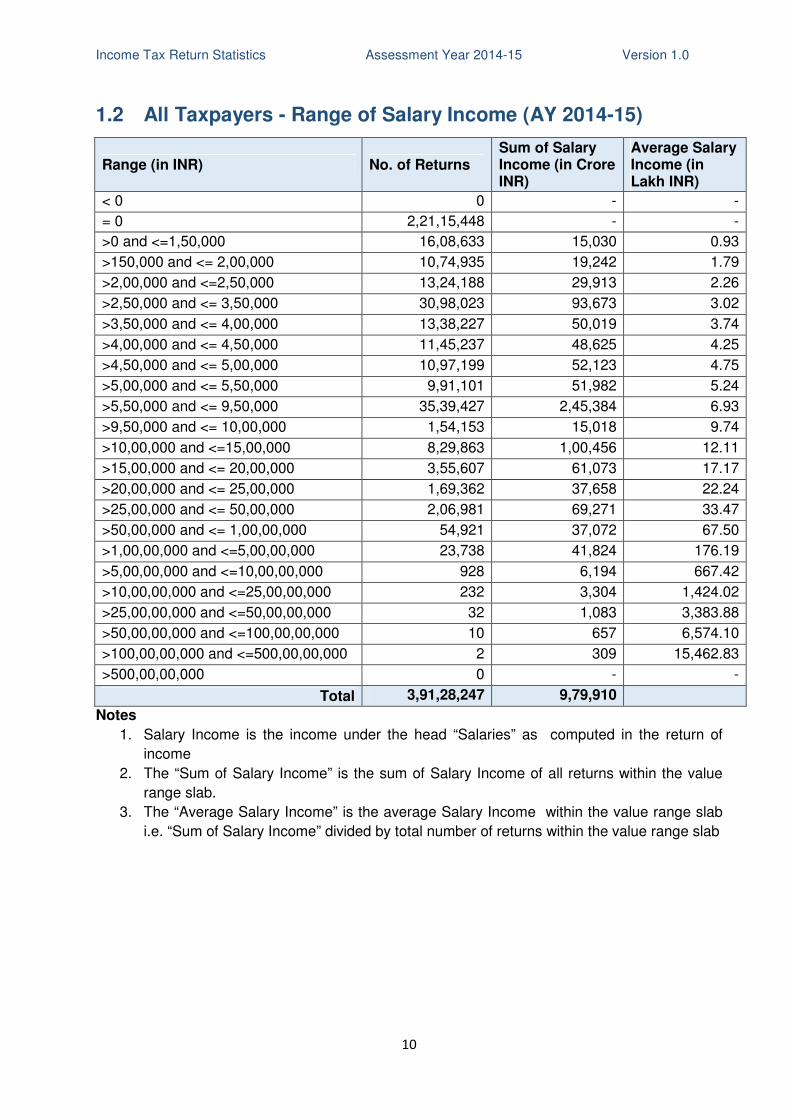
1.2 All Taxpayers - Range of Salary Income (AY 2014-15)
Range (in INR) No. of Returns Sum of Salary Income (in Crore INR)
Average Salary Income (in Lakh INR)
< 0 0 - -
= 0 2,21,15,448 - -
>0 and <=1,50,000 16,08,633 15,030 0.93
>150,000 and <= 2,00,000 10,74,935 19,242 1.79
>2,00,000 and <=2,50,000 13,24,188 29,913 2.26
>2,50,000 and <= 3,50,000 30,98,023 93,673 3.02
>3,50,000 and <= 4,00,000 13,38,227 50,019 3.74
>4,00,000 and <= 4,50,000 11,45,237 48,625 4.25
>4,50,000 and <= 5,00,000 10,97,199 52,123 4.75
>5,00,000 and <= 5,50,000 9,91,101 51,982 5.24
>5,50,000 and <= 9,50,000 35,39,427 2,45,384 6.93
>9,50,000 and <= 10,00,000 1,54,153 15,018 9.74
>10,00,000 and <=15,00,000 8,29,863 1,00,456 12.11
>15,00,000 and <= 20,00,000 3,55,607 61,073 17.17
>20,00,000 and <= 25,00,000 1,69,362 37,658 22.24
>25,00,000 and <= 50,00,000 2,06,981 69,271 33.47
>50,00,000 and <= 1,00,00,000 54,921 37,072 67.50
>1,00,00,000 and <=5,00,00,000 23,738 41,824 176.19
>5,00,00,000 and <=10,00,00,000 928 6,194 667.42
>10,00,00,000 and <=25,00,00,000 232 3,304 1,424.02
>25,00,00,000 and <=50,00,00,000 32 1,083 3,383.88
>50,00,00,000 and <=100,00,00,000 10 657 6,574.10
>100,00,00,000 and <=500,00,00,000 2 309 15,462.83
>500,00,00,000 0 - -
Total 3,91,28,247 9,79,910
Notes
1. Salary Income is the income under the head “Salaries” as computed in the return of
income
2. The “Sum of Salary Income” is the sum of Salary Income of all returns within the value
range slab.
3. The “Average Salary Income” is the average Salary Income within the value range slab
i.e. “Sum of Salary Income” divided by total number of returns within the value range slab
Income Tax Return Statistics Assessment Year 2014-15 Version 1.0
11
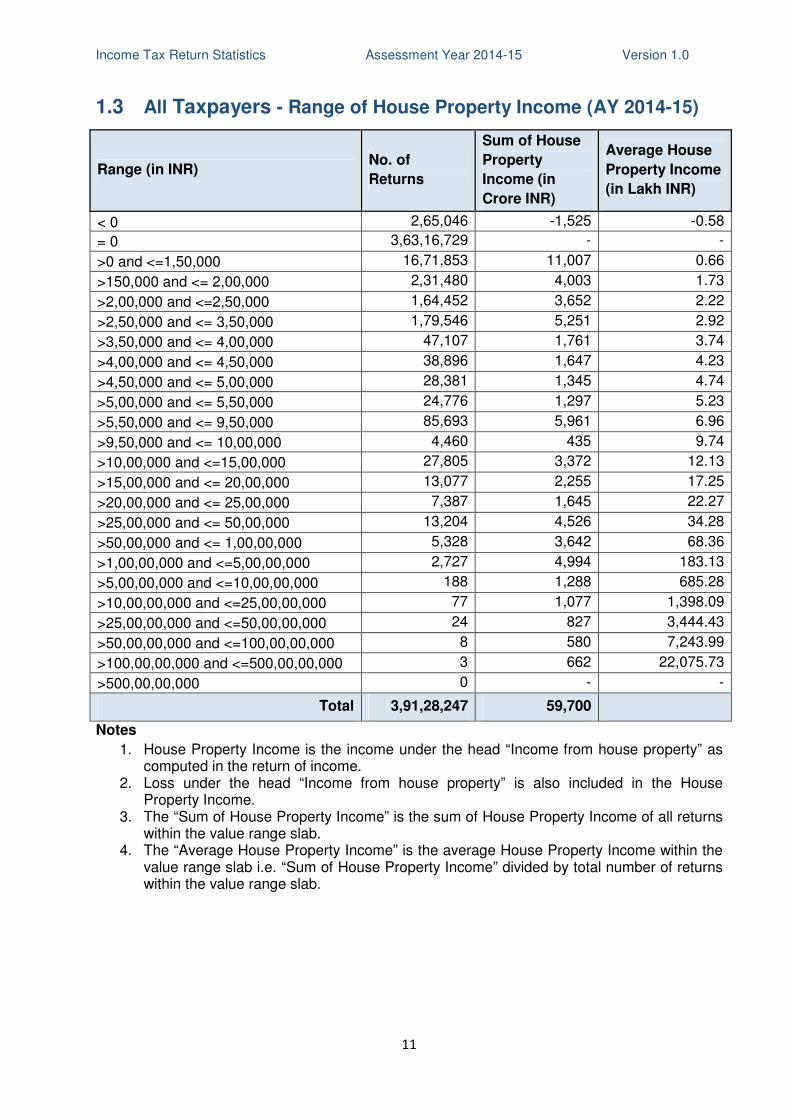
1.3 All Taxpayers - Range of House Property Income (AY 2014-15)
Range (in INR) No. of
Returns
Sum of House
Property
Income (in
Crore INR)
Average House
Property Income
(in Lakh INR)
< 0 2,65,046 -1,525 -0.58
= 0 3,63,16,729 - -
>0 and <=1,50,000 16,71,853 11,007 0.66
>150,000 and <= 2,00,000 2,31,480 4,003 1.73
>2,00,000 and <=2,50,000 1,64,452 3,652 2.22
>2,50,000 and <= 3,50,000 1,79,546 5,251 2.92
>3,50,000 and <= 4,00,000 47,107 1,761 3.74
>4,00,000 and <= 4,50,000 38,896 1,647 4.23
>4,50,000 and <= 5,00,000 28,381 1,345 4.74
>5,00,000 and <= 5,50,000 24,776 1,297 5.23
>5,50,000 and <= 9,50,000 85,693 5,961 6.96
>9,50,000 and <= 10,00,000 4,460 435 9.74
>10,00,000 and <=15,00,000 27,805 3,372 12.13
>15,00,000 and <= 20,00,000 13,077 2,255 17.25
>20,00,000 and <= 25,00,000 7,387 1,645 22.27
>25,00,000 and <= 50,00,000 13,204 4,526 34.28
>50,00,000 and <= 1,00,00,000 5,328 3,642 68.36
>1,00,00,000 and <=5,00,00,000 2,727 4,994 183.13
>5,00,00,000 and <=10,00,00,000 188 1,288 685.28
>10,00,00,000 and <=25,00,00,000 77 1,077 1,398.09
>25,00,00,000 and <=50,00,00,000 24 827 3,444.43
>50,00,00,000 and <=100,00,00,000 8 580 7,243.99
>100,00,00,000 and <=500,00,00,000 3 662 22,075.73
>500,00,00,000 0 - -
Total 3,91,28,247 59,700
Notes
1. House Property Income is the income under the head “Income from house property” as computed in the return of income.
2. Loss under the head “Income from house property” is also included in the House Property Income.
3. The “Sum of House Property Income” is the sum of House Property Income of all returns within the value range slab.
4. The “Average House Property Income” is the average House Property Income within the value range slab i.e. “Sum of House Property Income” divided by total number of returns within the value range slab.

Income Tax Return Statistics Assessment Year 2014-15 Version 1.0
12
1.4 All Taxpayers - Range of Business Income (AY 2014-15)
Range (in INR) No. of
Returns
Sum of
Business
Income (in
Crore INR)
Average
Business
Income (in Lakh
INR)
< 0 0 0 -
= 0 2,02,59,505 0 -
>0 and <=1,50,000 37,08,534 28,947 0.78
>150,000 and <= 2,00,000 25,59,099 46,375 1.81
>2,00,000 and <=2,50,000 55,10,171 1,23,051 2.23
>2,50,000 and <= 3,50,000 36,63,144 1,06,349 2.90
>3,50,000 and <= 4,00,000 7,18,025 26,728 3.72
>4,00,000 and <= 4,50,000 4,95,311 20,917 4.22
>4,50,000 and <= 5,00,000 3,80,566 18,071 4.75
>5,00,000 and <= 5,50,000 2,80,928 14,692 5.23
>5,50,000 and <= 9,50,000 9,15,210 63,843 6.98
>9,50,000 and <= 10,00,000 51,043 4,978 9.75
>10,00,000 and <=15,00,000 2,47,241 29,754 12.03
>15,00,000 and <= 20,00,000 97,428 16,760 17.20
>20,00,000 and <= 25,00,000 52,854 11,787 22.30
>25,00,000 and <= 50,00,000 95,934 33,127 34.53
>50,00,000 and <= 1,00,00,000 47,835 33,578 70.20
>1,00,00,000 and <=5,00,00,000 34,439 70,740 205.41
>5,00,00,000 and <=10,00,00,000 4,959 34,571 697.13
>10,00,00,000 and <=25,00,00,000 3,354 51,280 1,528.93
>25,00,00,000 and <=50,00,00,000 1,241 43,011 3,465.82
>50,00,00,000 and <=100,00,00,000 689 48,330 7,014.57
>100,00,00,000 and <=500,00,00,000 587 1,22,093 20,799.54
>500,00,00,000 150 3,70,500 2,47,000.01
Total 3,91,28,247 13,19,484
Notes
1. Business Income is the income under the head “Profits and gains of business or
profession” as computed in the return of income
2. Loss under the head “Profits and gains of business or profession” is also included in the
Business Income
3. The “Sum of Business Income” is the sum of Business Income of all returns within the
value range slab.
4. The “Average Business Income” is the average Business Income within the value range
slab i.e. “Sum of Business Income” divided by total number of returns within the value
range slab
Income Tax Return Statistics Assessment Year 2014-15 Version 1.0
13
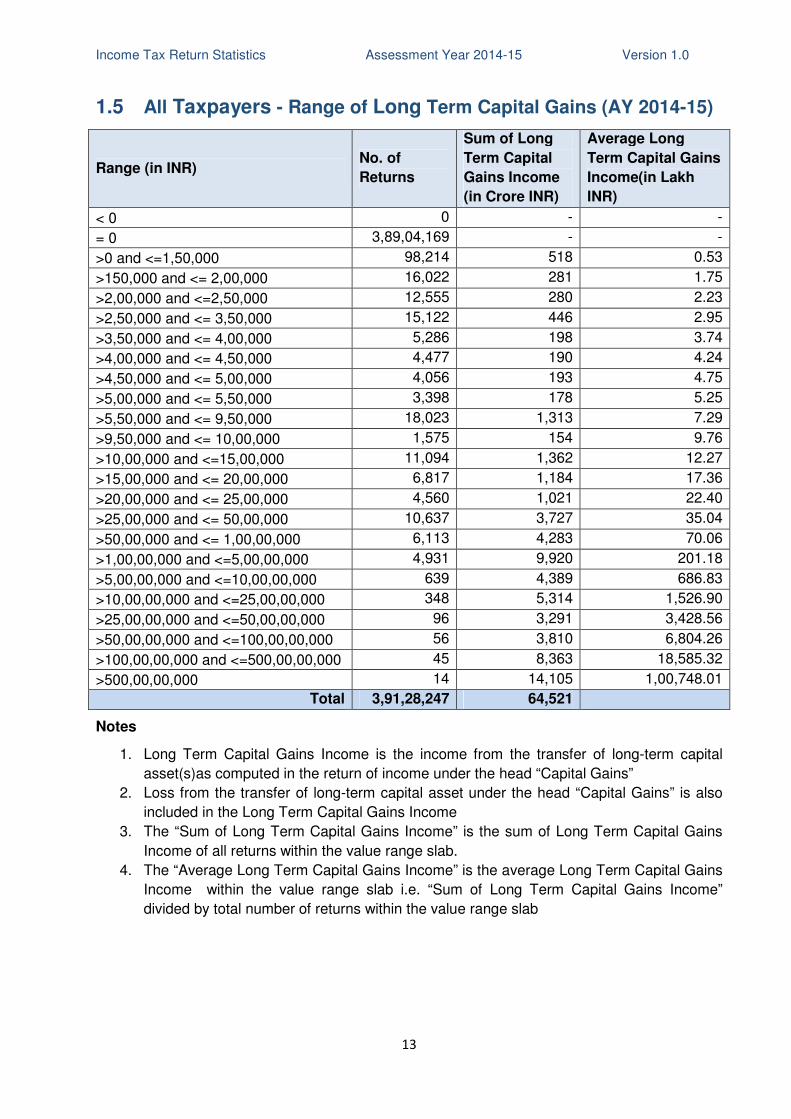
1.5 All Taxpayers - Range of Long Term Capital Gains (AY 2014-15)
Range (in INR) No. of
Returns
Sum of Long
Term Capital
Gains Income
(in Crore INR)
Average Long
Term Capital Gains
Income(in Lakh
INR)
< 0 0 - -
= 0 3,89,04,169 - -
>0 and <=1,50,000 98,214 518 0.53
>150,000 and <= 2,00,000 16,022 281 1.75
>2,00,000 and <=2,50,000 12,555 280 2.23
>2,50,000 and <= 3,50,000 15,122 446 2.95
>3,50,000 and <= 4,00,000 5,286 198 3.74
>4,00,000 and <= 4,50,000 4,477 190 4.24
>4,50,000 and <= 5,00,000 4,056 193 4.75
>5,00,000 and <= 5,50,000 3,398 178 5.25
>5,50,000 and <= 9,50,000 18,023 1,313 7.29
>9,50,000 and <= 10,00,000 1,575 154 9.76
>10,00,000 and <=15,00,000 11,094 1,362 12.27
>15,00,000 and <= 20,00,000 6,817 1,184 17.36
>20,00,000 and <= 25,00,000 4,560 1,021 22.40
>25,00,000 and <= 50,00,000 10,637 3,727 35.04
>50,00,000 and <= 1,00,00,000 6,113 4,283 70.06
>1,00,00,000 and <=5,00,00,000 4,931 9,920 201.18
>5,00,00,000 and <=10,00,00,000 639 4,389 686.83
>10,00,00,000 and <=25,00,00,000 348 5,314 1,526.90
>25,00,00,000 and <=50,00,00,000 96 3,291 3,428.56
>50,00,00,000 and <=100,00,00,000 56 3,810 6,804.26
>100,00,00,000 and <=500,00,00,000 45 8,363 18,585.32
>500,00,00,000 14 14,105 1,00,748.01
Total 3,91,28,247 64,521
Notes
1. Long Term Capital Gains Income is the income from the transfer of long-term capital
asset(s)as computed in the return of income under the head “Capital Gains”
2. Loss from the transfer of long-term capital asset under the head “Capital Gains” is also
included in the Long Term Capital Gains Income
3. The “Sum of Long Term Capital Gains Income” is the sum of Long Term Capital Gains
Income of all returns within the value range slab.
4. The “Average Long Term Capital Gains Income” is the average Long Term Capital Gains
Income within the value range slab i.e. “Sum of Long Term Capital Gains Income”
divided by total number of returns within the value range slab
Income Tax Return Statistics Assessment Year 2014-15 Version 1.0
14
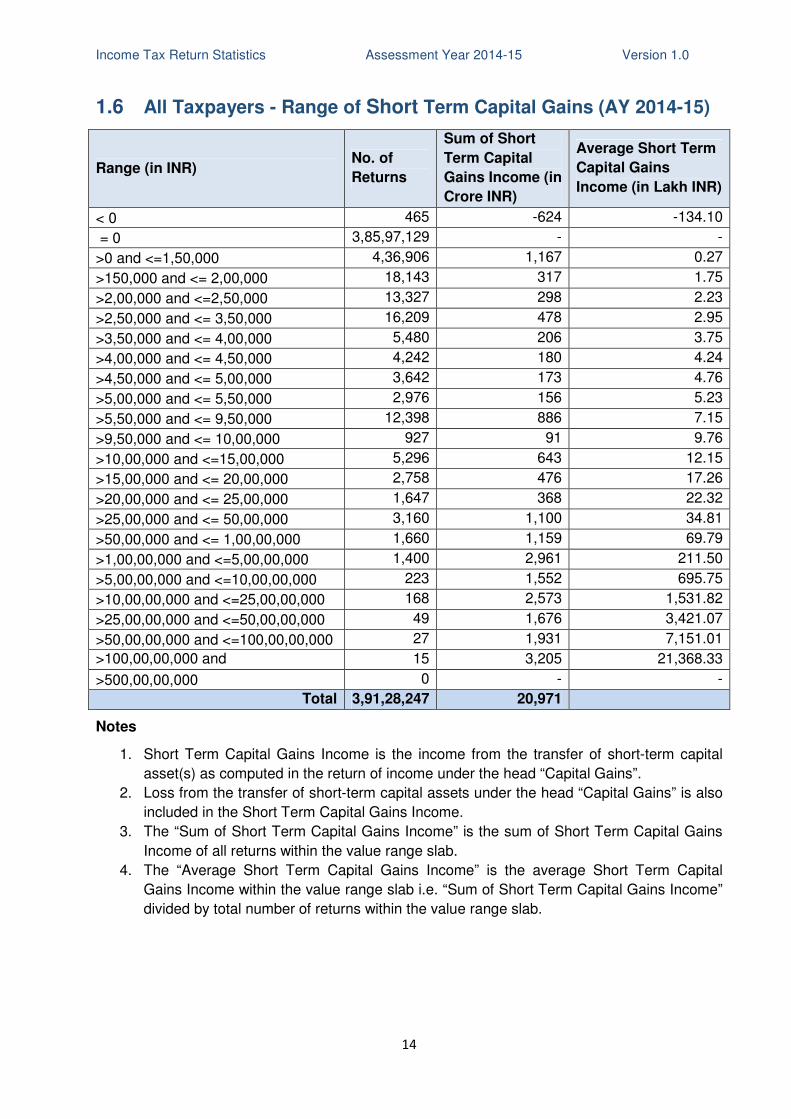
1.6 All Taxpayers - Range of Short Term Capital Gains (AY 2014-15)
Range (in INR) No. of
Returns
Sum of Short
Term Capital
Gains Income (in
Crore INR)
Average Short Term
Capital Gains
Income (in Lakh INR)
< 0 465 -624 -134.10
= 0 3,85,97,129 - -
>0 and <=1,50,000 4,36,906 1,167 0.27
>150,000 and <= 2,00,000 18,143 317 1.75
>2,00,000 and <=2,50,000 13,327 298 2.23
>2,50,000 and <= 3,50,000 16,209 478 2.95
>3,50,000 and <= 4,00,000 5,480 206 3.75
>4,00,000 and <= 4,50,000 4,242 180 4.24
>4,50,000 and <= 5,00,000 3,642 173 4.76
>5,00,000 and <= 5,50,000 2,976 156 5.23
>5,50,000 and <= 9,50,000 12,398 886 7.15
>9,50,000 and <= 10,00,000 927 91 9.76
>10,00,000 and <=15,00,000 5,296 643 12.15
>15,00,000 and <= 20,00,000 2,758 476 17.26
>20,00,000 and <= 25,00,000 1,647 368 22.32
>25,00,000 and <= 50,00,000 3,160 1,100 34.81
>50,00,000 and <= 1,00,00,000 1,660 1,159 69.79
>1,00,00,000 and <=5,00,00,000 1,400 2,961 211.50
>5,00,00,000 and <=10,00,00,000 223 1,552 695.75
>10,00,00,000 and <=25,00,00,000 168 2,573 1,531.82
>25,00,00,000 and <=50,00,00,000 49 1,676 3,421.07
>50,00,00,000 and <=100,00,00,000 27 1,931 7,151.01
>100,00,00,000 and <=500,00,00,000
15 3,205 21,368.33
>500,00,00,000 0 - -
Total 3,91,28,247 20,971
Notes
1. Short Term Capital Gains Income is the income from the transfer of short-term capital
asset(s) as computed in the return of income under the head “Capital Gains”.
2. Loss from the transfer of short-term capital assets under the head “Capital Gains” is also
included in the Short Term Capital Gains Income.
3. The “Sum of Short Term Capital Gains Income” is the sum of Short Term Capital Gains
Income of all returns within the value range slab.
4. The “Average Short Term Capital Gains Income” is the average Short Term Capital
Gains Income within the value range slab i.e. “Sum of Short Term Capital Gains Income”
divided by total number of returns within the value range slab.
Income Tax Return Statistics Assessment Year 2014-15 Version 1.0
15
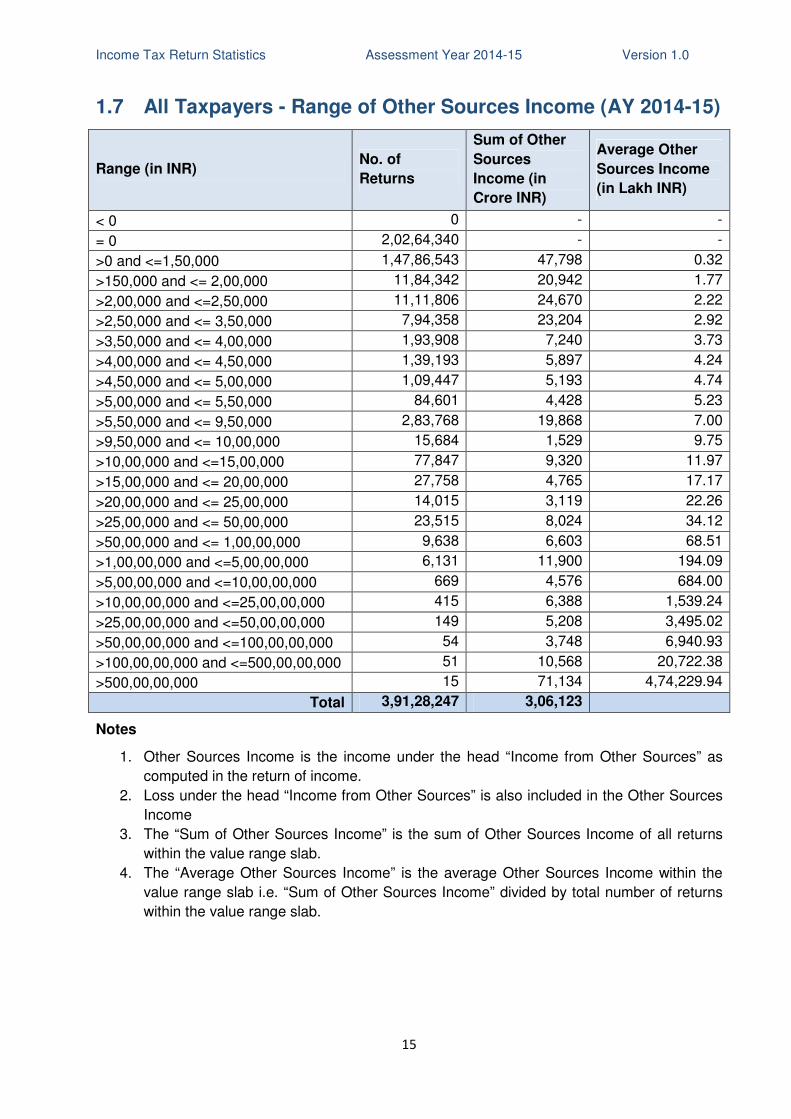
1.7 All Taxpayers - Range of Other Sources Income (AY 2014-15)
Range (in INR) No. of
Returns
Sum of Other
Sources
Income (in
Crore INR)
Average Other
Sources Income
(in Lakh INR)
< 0 0 - -
= 0 2,02,64,340 - -
>0 and <=1,50,000 1,47,86,543 47,798 0.32
>150,000 and <= 2,00,000 11,84,342 20,942 1.77
>2,00,000 and <=2,50,000 11,11,806 24,670 2.22
>2,50,000 and <= 3,50,000 7,94,358 23,204 2.92
>3,50,000 and <= 4,00,000 1,93,908 7,240 3.73
>4,00,000 and <= 4,50,000 1,39,193 5,897 4.24
>4,50,000 and <= 5,00,000 1,09,447 5,193 4.74
>5,00,000 and <= 5,50,000 84,601 4,428 5.23
>5,50,000 and <= 9,50,000 2,83,768 19,868 7.00
>9,50,000 and <= 10,00,000 15,684 1,529 9.75
>10,00,000 and <=15,00,000 77,847 9,320 11.97
>15,00,000 and <= 20,00,000 27,758 4,765 17.17
>20,00,000 and <= 25,00,000 14,015 3,119 22.26
>25,00,000 and <= 50,00,000 23,515 8,024 34.12
>50,00,000 and <= 1,00,00,000 9,638 6,603 68.51
>1,00,00,000 and <=5,00,00,000 6,131 11,900 194.09
>5,00,00,000 and <=10,00,00,000 669 4,576 684.00
>10,00,00,000 and <=25,00,00,000 415 6,388 1,539.24
>25,00,00,000 and <=50,00,00,000 149 5,208 3,495.02
>50,00,00,000 and <=100,00,00,000 54 3,748 6,940.93
>100,00,00,000 and <=500,00,00,000 51 10,568 20,722.38
>500,00,00,000 15 71,134 4,74,229.94
Total 3,91,28,247 3,06,123
Notes
1. Other Sources Income is the income under the head “Income from Other Sources” as
computed in the return of income.
2. Loss under the head “Income from Other Sources” is also included in the Other Sources
Income
3. The “Sum of Other Sources Income” is the sum of Other Sources Income of all returns
within the value range slab.
4. The “Average Other Sources Income” is the average Other Sources Income within the
value range slab i.e. “Sum of Other Sources Income” divided by total number of returns
within the value range slab.
Income Tax Return Statistics Assessment Year 2014-15 Version 1.0
16
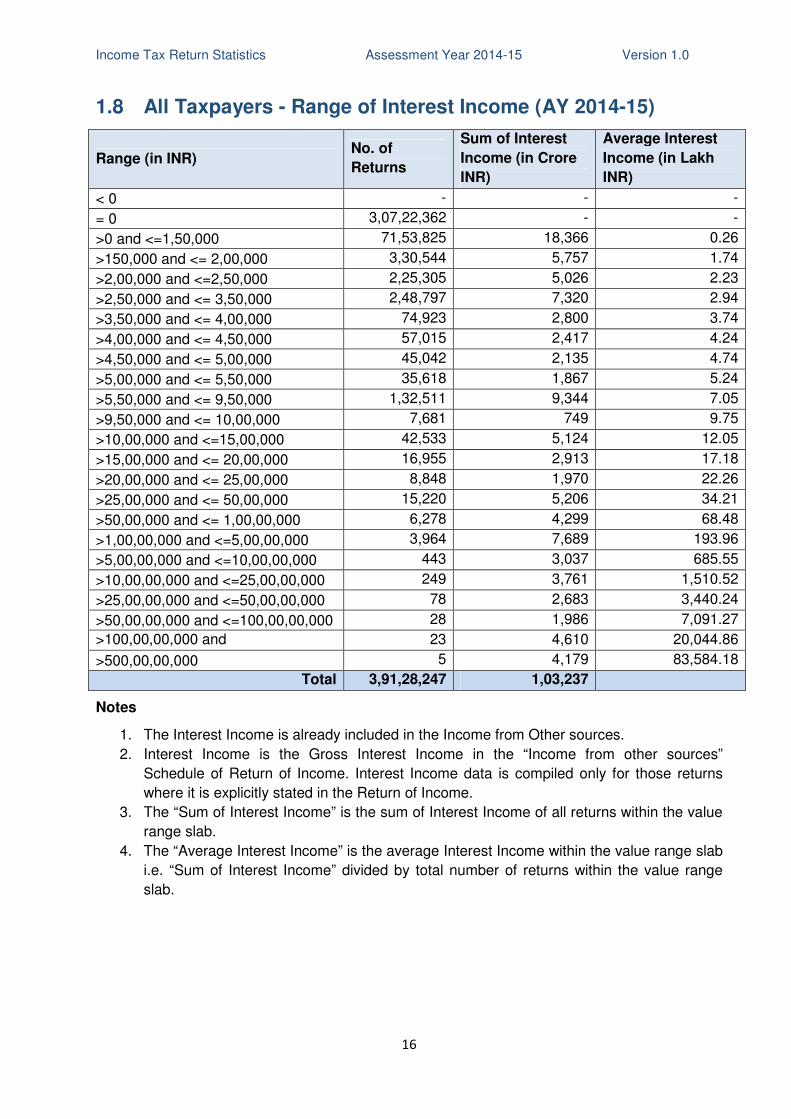
1.8 All Taxpayers - Range of Interest Income (AY 2014-15)
Range (in INR) No. of
Returns
Sum of Interest
Income (in Crore
INR)
Average Interest
Income (in Lakh
INR)
< 0 - - -
= 0 3,07,22,362 - -
>0 and <=1,50,000 71,53,825 18,366 0.26
>150,000 and <= 2,00,000 3,30,544 5,757 1.74
>2,00,000 and <=2,50,000 2,25,305 5,026 2.23
>2,50,000 and <= 3,50,000 2,48,797 7,320 2.94
>3,50,000 and <= 4,00,000 74,923 2,800 3.74
>4,00,000 and <= 4,50,000 57,015 2,417 4.24
>4,50,000 and <= 5,00,000 45,042 2,135 4.74
>5,00,000 and <= 5,50,000 35,618 1,867 5.24
>5,50,000 and <= 9,50,000 1,32,511 9,344 7.05
>9,50,000 and <= 10,00,000 7,681 749 9.75
>10,00,000 and <=15,00,000 42,533 5,124 12.05
>15,00,000 and <= 20,00,000 16,955 2,913 17.18
>20,00,000 and <= 25,00,000 8,848 1,970 22.26
>25,00,000 and <= 50,00,000 15,220 5,206 34.21
>50,00,000 and <= 1,00,00,000 6,278 4,299 68.48
>1,00,00,000 and <=5,00,00,000 3,964 7,689 193.96
>5,00,00,000 and <=10,00,00,000 443 3,037 685.55
>10,00,00,000 and <=25,00,00,000 249 3,761 1,510.52
>25,00,00,000 and <=50,00,00,000 78 2,683 3,440.24
>50,00,00,000 and <=100,00,00,000 28 1,986 7,091.27
>100,00,00,000 and <=500,00,00,000
23 4,610 20,044.86
>500,00,00,000 5 4,179 83,584.18
Total 3,91,28,247 1,03,237
Notes
1. The Interest Income is already included in the Income from Other sources.
2. Interest Income is the Gross Interest Income in the “Income from other sources”
Schedule of Return of Income. Interest Income data is compiled only for those returns
where it is explicitly stated in the Return of Income.
3. The “Sum of Interest Income” is the sum of Interest Income of all returns within the value
range slab.
4. The “Average Interest Income” is the average Interest Income within the value range slab
i.e. “Sum of Interest Income” divided by total number of returns within the value range
slab.
Income Tax Return Statistics Assessment Year 2014-15 Version 1.0
17
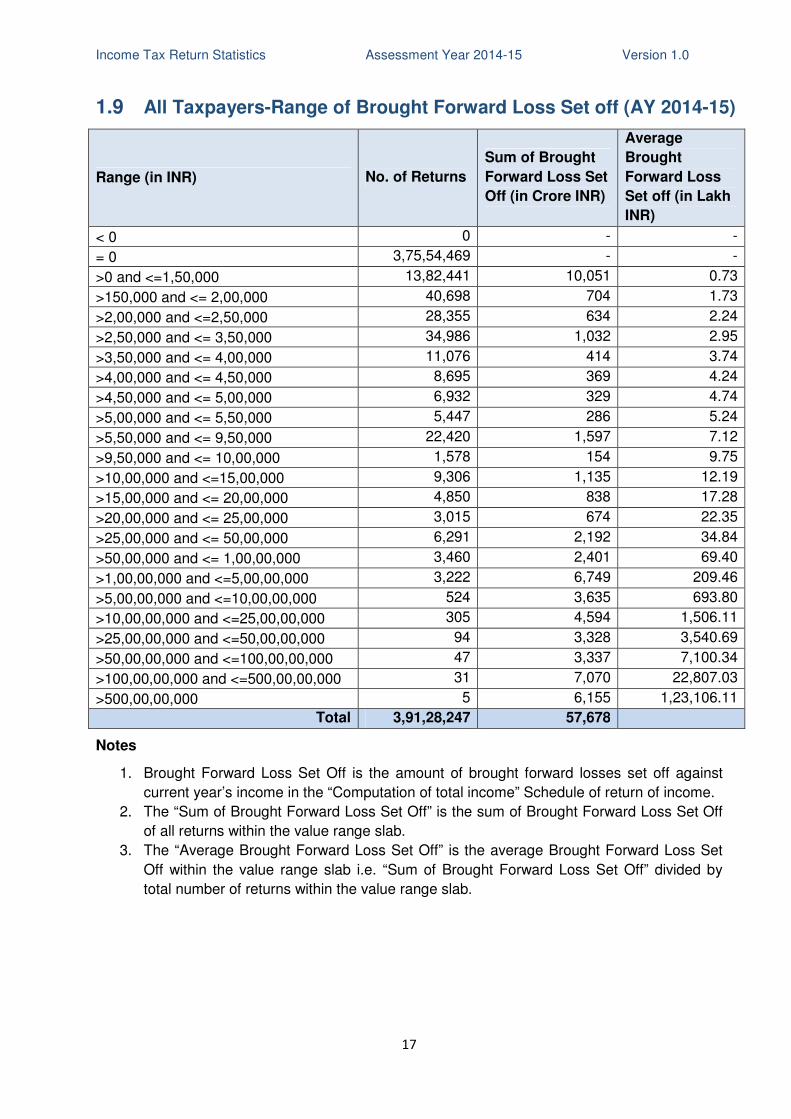
1.9 All Taxpayers-Range of Brought Forward Loss Set off (AY 2014-15)
Range (in INR) No. of Returns
Sum of Brought
Forward Loss Set
Off (in Crore INR)
Average
Brought
Forward Loss
Set off (in Lakh
INR)
< 0 0 - -
= 0 3,75,54,469 - -
>0 and <=1,50,000 13,82,441 10,051 0.73
>150,000 and <= 2,00,000 40,698 704 1.73
>2,00,000 and <=2,50,000 28,355 634 2.24
>2,50,000 and <= 3,50,000 34,986 1,032 2.95
>3,50,000 and <= 4,00,000 11,076 414 3.74
>4,00,000 and <= 4,50,000 8,695 369 4.24
>4,50,000 and <= 5,00,000 6,932 329 4.74
>5,00,000 and <= 5,50,000 5,447 286 5.24
>5,50,000 and <= 9,50,000 22,420 1,597 7.12
>9,50,000 and <= 10,00,000 1,578 154 9.75
>10,00,000 and <=15,00,000 9,306 1,135 12.19
>15,00,000 and <= 20,00,000 4,850 838 17.28
>20,00,000 and <= 25,00,000 3,015 674 22.35
>25,00,000 and <= 50,00,000 6,291 2,192 34.84
>50,00,000 and <= 1,00,00,000 3,460 2,401 69.40
>1,00,00,000 and <=5,00,00,000 3,222 6,749 209.46
>5,00,00,000 and <=10,00,00,000 524 3,635 693.80
>10,00,00,000 and <=25,00,00,000 305 4,594 1,506.11
>25,00,00,000 and <=50,00,00,000 94 3,328 3,540.69
>50,00,00,000 and <=100,00,00,000 47 3,337 7,100.34
>100,00,00,000 and <=500,00,00,000 31 7,070 22,807.03
>500,00,00,000 5 6,155 1,23,106.11
Total 3,91,28,247 57,678
Notes
1. Brought Forward Loss Set Off is the amount of brought forward losses set off against
current year’s income in the “Computation of total income” Schedule of return of income.
2. The “Sum of Brought Forward Loss Set Off” is the sum of Brought Forward Loss Set Off
of all returns within the value range slab.
3. The “Average Brought Forward Loss Set Off” is the average Brought Forward Loss Set
Off within the value range slab i.e. “Sum of Brought Forward Loss Set Off” divided by
total number of returns within the value range slab.
Income Tax Return Statistics Assessment Year 2014-15 Version 1.0
18
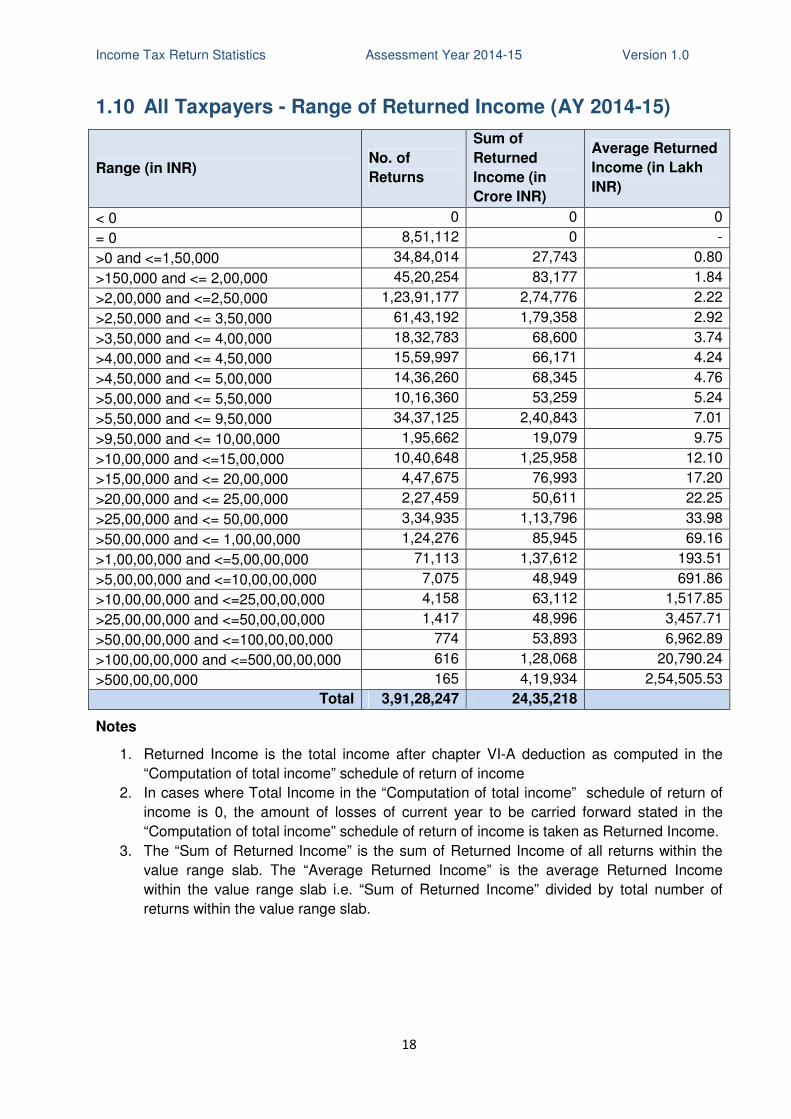
1.10 All Taxpayers - Range of Returned Income (AY 2014-15)
Range (in INR) No. of
Returns
Sum of
Returned
Income (in
Crore INR)
Average Returned
Income (in Lakh
INR)
< 0 0 0 0
= 0 8,51,112 0 -
>0 and <=1,50,000 34,84,014 27,743 0.80
>150,000 and <= 2,00,000 45,20,254 83,177 1.84
>2,00,000 and <=2,50,000 1,23,91,177 2,74,776 2.22
>2,50,000 and <= 3,50,000 61,43,192 1,79,358 2.92
>3,50,000 and <= 4,00,000 18,32,783 68,600 3.74
>4,00,000 and <= 4,50,000 15,59,997 66,171 4.24
>4,50,000 and <= 5,00,000 14,36,260 68,345 4.76
>5,00,000 and <= 5,50,000 10,16,360 53,259 5.24
>5,50,000 and <= 9,50,000 34,37,125 2,40,843 7.01
>9,50,000 and <= 10,00,000 1,95,662 19,079 9.75
>10,00,000 and <=15,00,000 10,40,648 1,25,958 12.10
>15,00,000 and <= 20,00,000 4,47,675 76,993 17.20
>20,00,000 and <= 25,00,000 2,27,459 50,611 22.25
>25,00,000 and <= 50,00,000 3,34,935 1,13,796 33.98
>50,00,000 and <= 1,00,00,000 1,24,276 85,945 69.16
>1,00,00,000 and <=5,00,00,000 71,113 1,37,612 193.51
>5,00,00,000 and <=10,00,00,000 7,075 48,949 691.86
>10,00,00,000 and <=25,00,00,000 4,158 63,112 1,517.85
>25,00,00,000 and <=50,00,00,000 1,417 48,996 3,457.71
>50,00,00,000 and <=100,00,00,000 774 53,893 6,962.89
>100,00,00,000 and <=500,00,00,000 616 1,28,068 20,790.24
>500,00,00,000 165 4,19,934 2,54,505.53
Total 3,91,28,247 24,35,218
Notes
1. Returned Income is the total income after chapter VI-A deduction as computed in the
“Computation of total income” schedule of return of income
2. In cases where Total Income in the “Computation of total income” schedule of return of
income is 0, the amount of losses of current year to be carried forward stated in the
“Computation of total income” schedule of return of income is taken as Returned Income.
3. The “Sum of Returned Income” is the sum of Returned Income of all returns within the
value range slab. The “Average Returned Income” is the average Returned Income
within the value range slab i.e. “Sum of Returned Income” divided by total number of
returns within the value range slab.
Income Tax Return Statistics Assessment Year 2014-15 Version 1.0
19
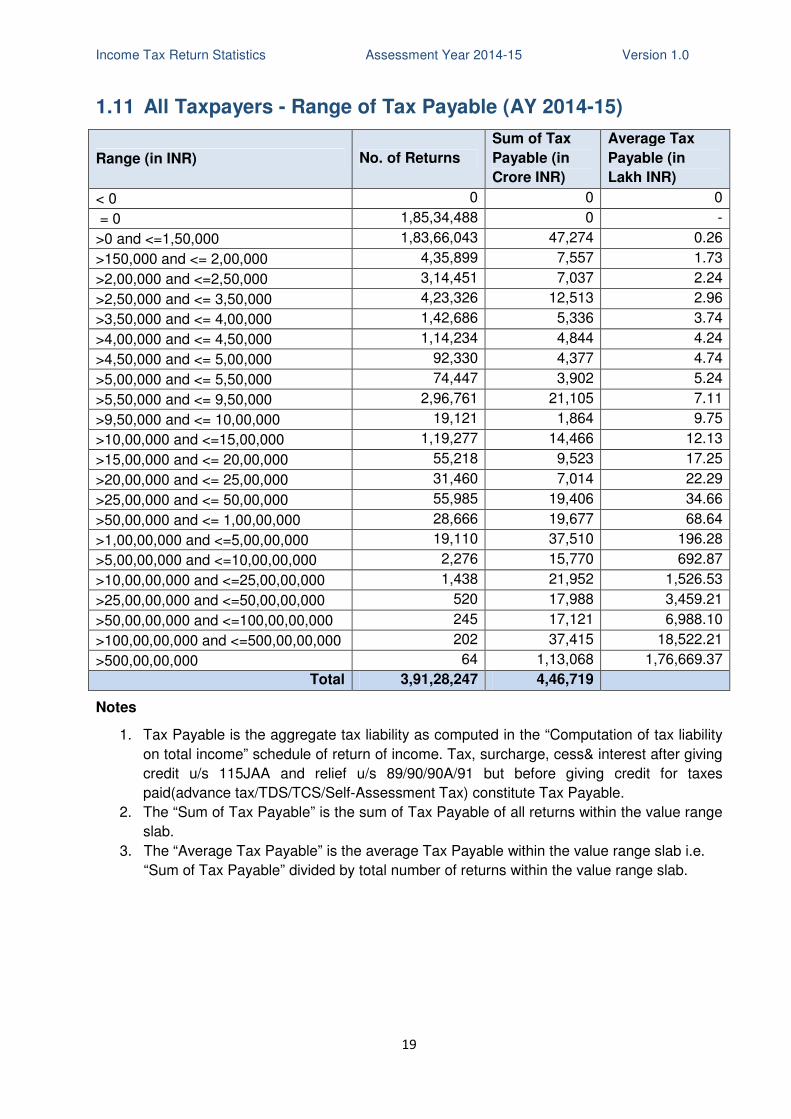
1.11 All Taxpayers - Range of Tax Payable (AY 2014-15)
Range (in INR) No. of Returns
Sum of Tax
Payable (in
Crore INR)
Average Tax
Payable (in
Lakh INR)
< 0 0 0 0
= 0 1,85,34,488 0 -
>0 and <=1,50,000 1,83,66,043 47,274 0.26
>150,000 and <= 2,00,000 4,35,899 7,557 1.73
>2,00,000 and <=2,50,000 3,14,451 7,037 2.24
>2,50,000 and <= 3,50,000 4,23,326 12,513 2.96
>3,50,000 and <= 4,00,000 1,42,686 5,336 3.74
>4,00,000 and <= 4,50,000 1,14,234 4,844 4.24
>4,50,000 and <= 5,00,000 92,330 4,377 4.74
>5,00,000 and <= 5,50,000 74,447 3,902 5.24
>5,50,000 and <= 9,50,000 2,96,761 21,105 7.11
>9,50,000 and <= 10,00,000 19,121 1,864 9.75
>10,00,000 and <=15,00,000 1,19,277 14,466 12.13
>15,00,000 and <= 20,00,000 55,218 9,523 17.25
>20,00,000 and <= 25,00,000 31,460 7,014 22.29
>25,00,000 and <= 50,00,000 55,985 19,406 34.66
>50,00,000 and <= 1,00,00,000 28,666 19,677 68.64
>1,00,00,000 and <=5,00,00,000 19,110 37,510 196.28
>5,00,00,000 and <=10,00,00,000 2,276 15,770 692.87
>10,00,00,000 and <=25,00,00,000 1,438 21,952 1,526.53
>25,00,00,000 and <=50,00,00,000 520 17,988 3,459.21
>50,00,00,000 and <=100,00,00,000 245 17,121 6,988.10
>100,00,00,000 and <=500,00,00,000 202 37,415 18,522.21
>500,00,00,000 64 1,13,068 1,76,669.37
Total 3,91,28,247 4,46,719
Notes
1. Tax Payable is the aggregate tax liability as computed in the “Computation of tax liability
on total income” schedule of return of income. Tax, surcharge, cess& interest after giving
credit u/s 115JAA and relief u/s 89/90/90A/91 but before giving credit for taxes
paid(advance tax/TDS/TCS/Self-Assessment Tax) constitute Tax Payable.
2. The “Sum of Tax Payable” is the sum of Tax Payable of all returns within the value range
slab.
3. The “Average Tax Payable” is the average Tax Payable within the value range slab i.e.
“Sum of Tax Payable” divided by total number of returns within the value range slab.
Income Tax Return Statistics Assessment Year 2014-15 Version 1.0
20
2. Income Tax Returns – Individuals
Income Tax Return Statistics Assessment Year 2014-15 Version 1.0
21
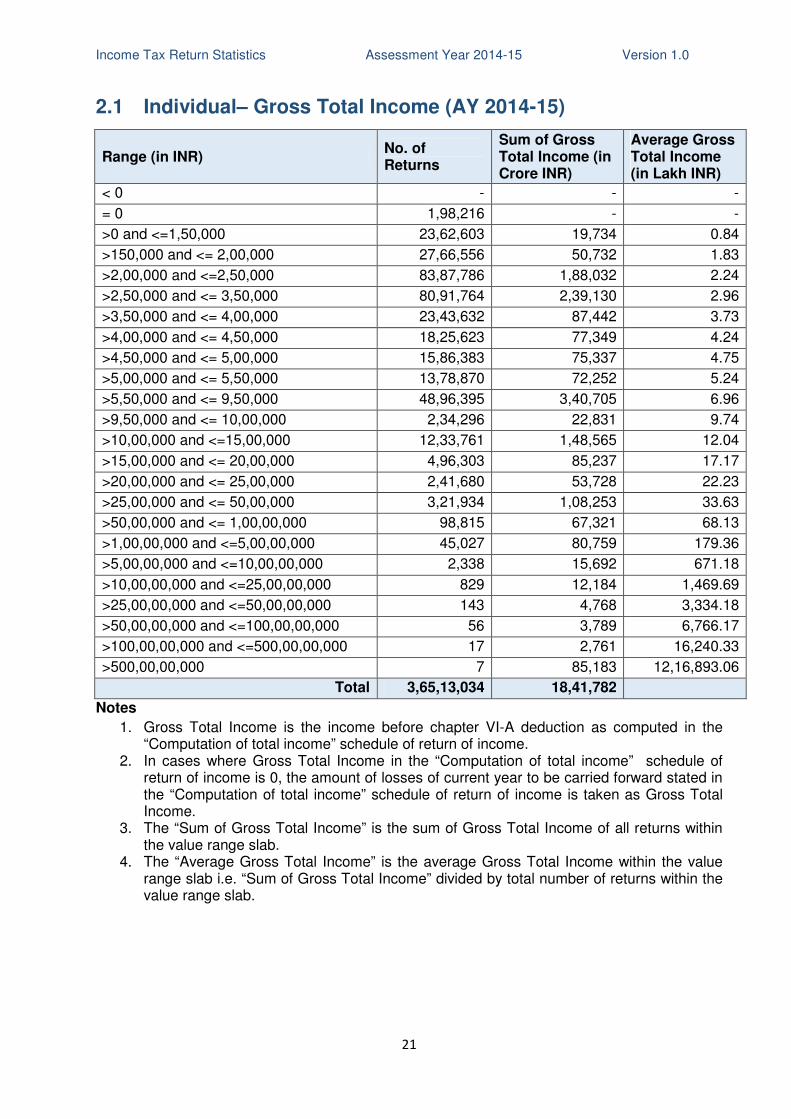
2.1 Individual– Gross Total Income (AY 2014-15)
Range (in INR) No. of Returns
Sum of Gross Total Income (in Crore INR)
Average Gross Total Income (in Lakh INR)
< 0 - - -
= 0 1,98,216 - -
>0 and <=1,50,000 23,62,603 19,734 0.84
>150,000 and <= 2,00,000 27,66,556 50,732 1.83
>2,00,000 and <=2,50,000 83,87,786 1,88,032 2.24
>2,50,000 and <= 3,50,000 80,91,764 2,39,130 2.96
>3,50,000 and <= 4,00,000 23,43,632 87,442 3.73
>4,00,000 and <= 4,50,000 18,25,623 77,349 4.24
>4,50,000 and <= 5,00,000 15,86,383 75,337 4.75
>5,00,000 and <= 5,50,000 13,78,870 72,252 5.24
>5,50,000 and <= 9,50,000 48,96,395 3,40,705 6.96
>9,50,000 and <= 10,00,000 2,34,296 22,831 9.74
>10,00,000 and <=15,00,000 12,33,761 1,48,565 12.04
>15,00,000 and <= 20,00,000 4,96,303 85,237 17.17
>20,00,000 and <= 25,00,000 2,41,680 53,728 22.23
>25,00,000 and <= 50,00,000 3,21,934 1,08,253 33.63
>50,00,000 and <= 1,00,00,000 98,815 67,321 68.13
>1,00,00,000 and <=5,00,00,000 45,027 80,759 179.36
>5,00,00,000 and <=10,00,00,000 2,338 15,692 671.18
>10,00,00,000 and <=25,00,00,000 829 12,184 1,469.69
>25,00,00,000 and <=50,00,00,000 143 4,768 3,334.18
>50,00,00,000 and <=100,00,00,000 56 3,789 6,766.17
>100,00,00,000 and <=500,00,00,000 17 2,761 16,240.33
>500,00,00,000 7 85,183 12,16,893.06
Total 3,65,13,034 18,41,782
Notes
1. Gross Total Income is the income before chapter VI-A deduction as computed in the “Computation of total income” schedule of return of income.
2. In cases where Gross Total Income in the “Computation of total income” schedule of return of income is 0, the amount of losses of current year to be carried forward stated in the “Computation of total income” schedule of return of income is taken as Gross Total Income.
3. The “Sum of Gross Total Income” is the sum of Gross Total Income of all returns within the value range slab.
4. The “Average Gross Total Income” is the average Gross Total Income within the value range slab i.e. “Sum of Gross Total Income” divided by total number of returns within the value range slab.
Income Tax Return Statistics Assessment Year 2014-15 Version 1.0
22
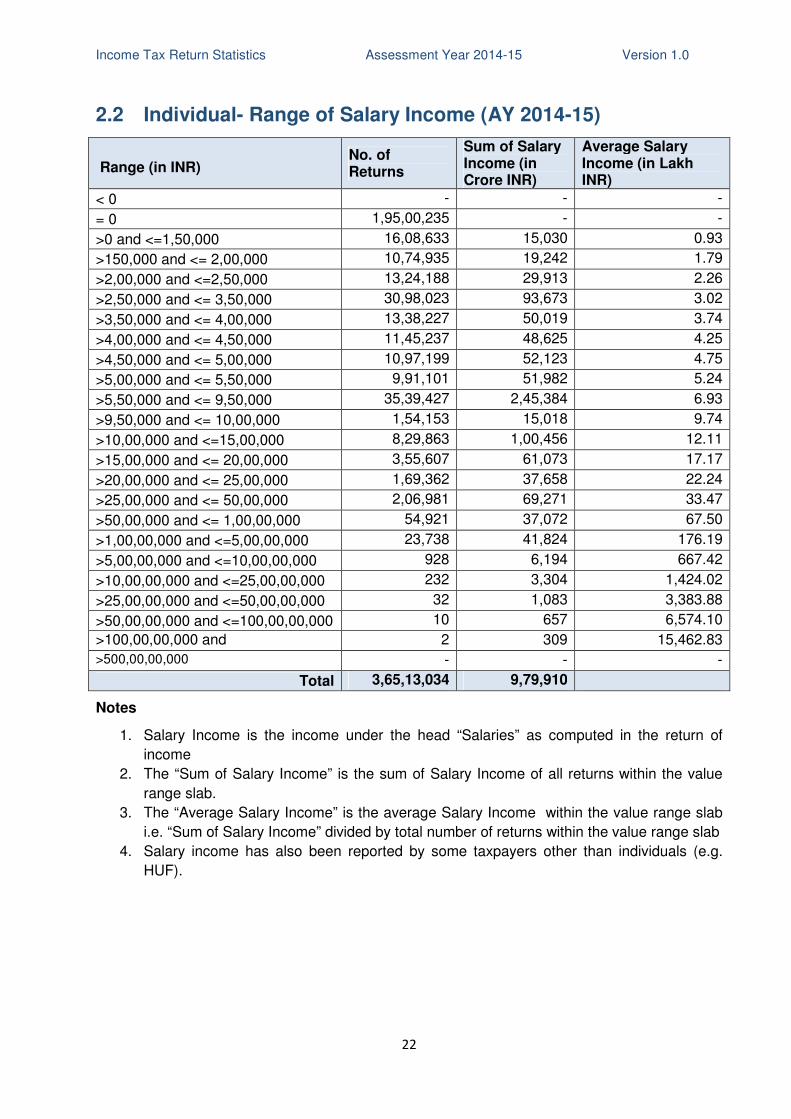
2.2 Individual- Range of Salary Income (AY 2014-15)
Range (in INR) No. of Returns
Sum of Salary Income (in Crore INR)
Average Salary Income (in Lakh INR)
< 0 - - -
= 0 1,95,00,235 - -
>0 and <=1,50,000 16,08,633 15,030 0.93
>150,000 and <= 2,00,000 10,74,935 19,242 1.79
>2,00,000 and <=2,50,000 13,24,188 29,913 2.26
>2,50,000 and <= 3,50,000 30,98,023 93,673 3.02
>3,50,000 and <= 4,00,000 13,38,227 50,019 3.74
>4,00,000 and <= 4,50,000 11,45,237 48,625 4.25
>4,50,000 and <= 5,00,000 10,97,199 52,123 4.75
>5,00,000 and <= 5,50,000 9,91,101 51,982 5.24
>5,50,000 and <= 9,50,000 35,39,427 2,45,384 6.93
>9,50,000 and <= 10,00,000 1,54,153 15,018 9.74
>10,00,000 and <=15,00,000 8,29,863 1,00,456 12.11
>15,00,000 and <= 20,00,000 3,55,607 61,073 17.17
>20,00,000 and <= 25,00,000 1,69,362 37,658 22.24
>25,00,000 and <= 50,00,000 2,06,981 69,271 33.47
>50,00,000 and <= 1,00,00,000 54,921 37,072 67.50
>1,00,00,000 and <=5,00,00,000 23,738 41,824 176.19
>5,00,00,000 and <=10,00,00,000 928 6,194 667.42
>10,00,00,000 and <=25,00,00,000 232 3,304 1,424.02
>25,00,00,000 and <=50,00,00,000 32 1,083 3,383.88
>50,00,00,000 and <=100,00,00,000 10 657 6,574.10
>100,00,00,000 and <=500,00,00,000
2 309 15,462.83
>500,00,00,000 - - -
Total 3,65,13,034 9,79,910
Notes
1. Salary Income is the income under the head “Salaries” as computed in the return of
income
2. The “Sum of Salary Income” is the sum of Salary Income of all returns within the value
range slab.
3. The “Average Salary Income” is the average Salary Income within the value range slab
i.e. “Sum of Salary Income” divided by total number of returns within the value range slab
4. Salary income has also been reported by some taxpayers other than individuals (e.g.
HUF).
Income Tax Return Statistics Assessment Year 2014-15 Version 1.0
23
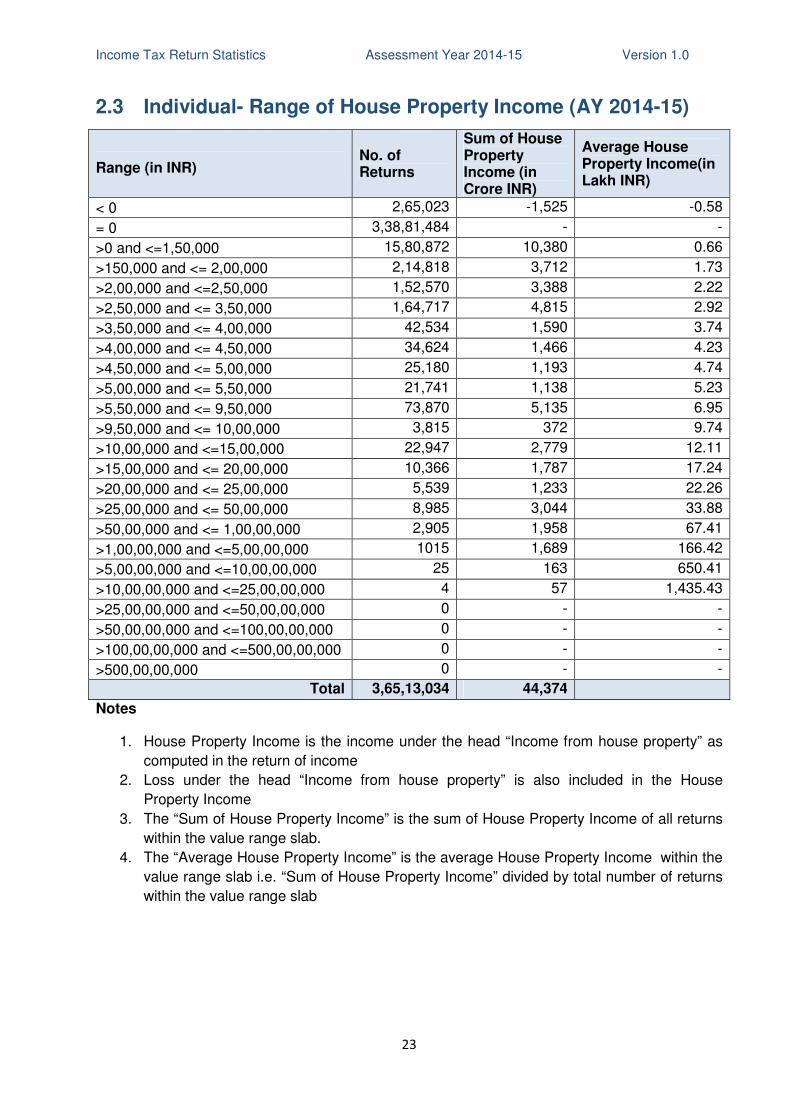
2.3 Individual- Range of House Property Income (AY 2014-15)
Range (in INR) No. of Returns
Sum of House Property Income (in Crore INR)
Average House Property Income(in Lakh INR)
< 0 2,65,023 -1,525 -0.58
= 0 3,38,81,484 - -
>0 and <=1,50,000 15,80,872 10,380 0.66
>150,000 and <= 2,00,000 2,14,818 3,712 1.73
>2,00,000 and <=2,50,000 1,52,570 3,388 2.22
>2,50,000 and <= 3,50,000 1,64,717 4,815 2.92
>3,50,000 and <= 4,00,000 42,534 1,590 3.74
>4,00,000 and <= 4,50,000 34,624 1,466 4.23
>4,50,000 and <= 5,00,000 25,180 1,193 4.74
>5,00,000 and <= 5,50,000 21,741 1,138 5.23
>5,50,000 and <= 9,50,000 73,870 5,135 6.95
>9,50,000 and <= 10,00,000 3,815 372 9.74
>10,00,000 and <=15,00,000 22,947 2,779 12.11
>15,00,000 and <= 20,00,000 10,366 1,787 17.24
>20,00,000 and <= 25,00,000 5,539 1,233 22.26
>25,00,000 and <= 50,00,000 8,985 3,044 33.88
>50,00,000 and <= 1,00,00,000 2,905 1,958 67.41
>1,00,00,000 and <=5,00,00,000 1015 1,689 166.42
>5,00,00,000 and <=10,00,00,000 25 163 650.41
>10,00,00,000 and <=25,00,00,000 4 57 1,435.43
>25,00,00,000 and <=50,00,00,000 0 - -
>50,00,00,000 and <=100,00,00,000 0 - -
>100,00,00,000 and <=500,00,00,000 0 - -
>500,00,00,000 0 - -
Total 3,65,13,034 44,374
Notes
1. House Property Income is the income under the head “Income from house property” as
computed in the return of income
2. Loss under the head “Income from house property” is also included in the House
Property Income
3. The “Sum of House Property Income” is the sum of House Property Income of all returns
within the value range slab.
4. The “Average House Property Income” is the average House Property Income within the
value range slab i.e. “Sum of House Property Income” divided by total number of returns
within the value range slab
Income Tax Return Statistics Assessment Year 2014-15 Version 1.0
24
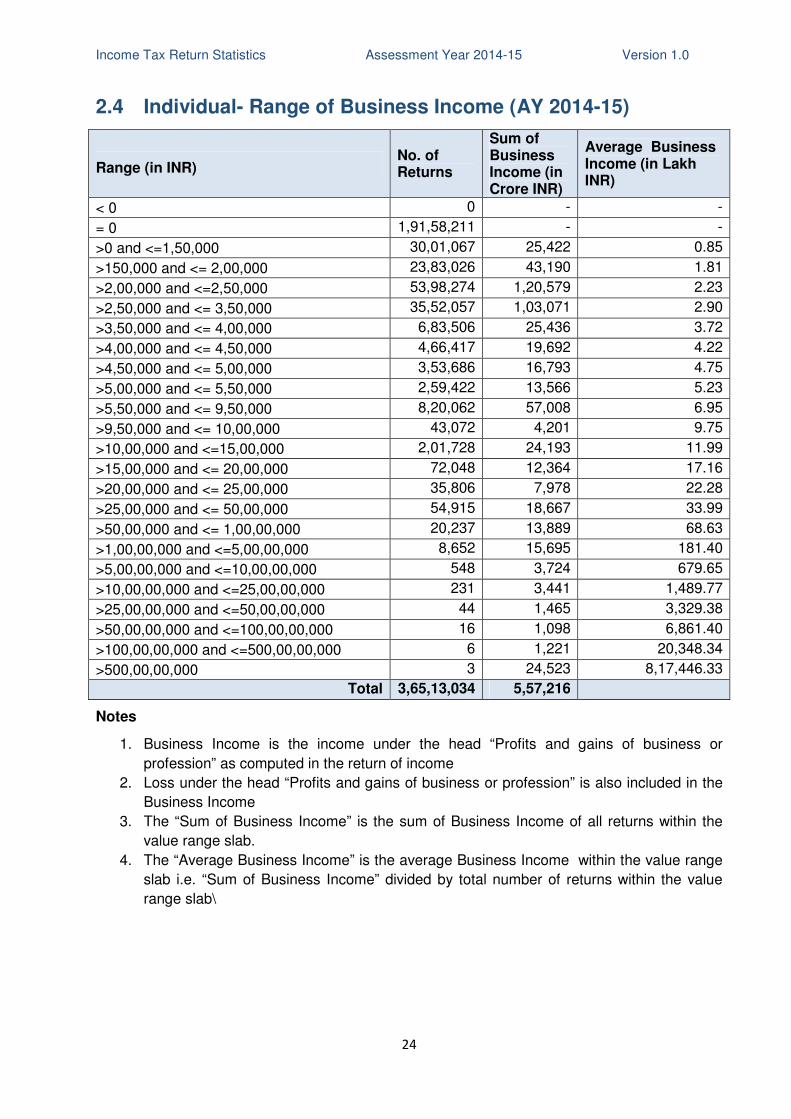
2.4 Individual- Range of Business Income (AY 2014-15)
Range (in INR) No. of Returns
Sum of Business Income (in Crore INR)
Average Business Income (in Lakh INR)
< 0 0 - -
= 0 1,91,58,211 - -
>0 and <=1,50,000 30,01,067 25,422 0.85
>150,000 and <= 2,00,000 23,83,026 43,190 1.81
>2,00,000 and <=2,50,000 53,98,274 1,20,579 2.23
>2,50,000 and <= 3,50,000 35,52,057 1,03,071 2.90
>3,50,000 and <= 4,00,000 6,83,506 25,436 3.72
>4,00,000 and <= 4,50,000 4,66,417 19,692 4.22
>4,50,000 and <= 5,00,000 3,53,686 16,793 4.75
>5,00,000 and <= 5,50,000 2,59,422 13,566 5.23
>5,50,000 and <= 9,50,000 8,20,062 57,008 6.95
>9,50,000 and <= 10,00,000 43,072 4,201 9.75
>10,00,000 and <=15,00,000 2,01,728 24,193 11.99
>15,00,000 and <= 20,00,000 72,048 12,364 17.16
>20,00,000 and <= 25,00,000 35,806 7,978 22.28
>25,00,000 and <= 50,00,000 54,915 18,667 33.99
>50,00,000 and <= 1,00,00,000 20,237 13,889 68.63
>1,00,00,000 and <=5,00,00,000 8,652 15,695 181.40
>5,00,00,000 and <=10,00,00,000 548 3,724 679.65
>10,00,00,000 and <=25,00,00,000 231 3,441 1,489.77
>25,00,00,000 and <=50,00,00,000 44 1,465 3,329.38
>50,00,00,000 and <=100,00,00,000 16 1,098 6,861.40
>100,00,00,000 and <=500,00,00,000 6 1,221 20,348.34
>500,00,00,000 3 24,523 8,17,446.33
Total 3,65,13,034 5,57,216
Notes
1. Business Income is the income under the head “Profits and gains of business or
profession” as computed in the return of income
2. Loss under the head “Profits and gains of business or profession” is also included in the
Business Income
3. The “Sum of Business Income” is the sum of Business Income of all returns within the
value range slab.
4. The “Average Business Income” is the average Business Income within the value range
slab i.e. “Sum of Business Income” divided by total number of returns within the value
range slab\

Income Tax Return Statistics Assessment Year 2014-15 Version 1.0
25
2.5 Individual- Range of Long Term Capital Gains (AY 2014-15)
Range (in INR) No. of Returns
Sum of Long Term Capital Gains Income (in Crore INR)
Average Long Term Capital Gains Income (in Lakh INR)
< 0 0 - -
= 0 3,63,07,894 - -
>0 and <=1,50,000 91,072 481 0.53
>150,000 and <= 2,00,000 14,817 260 1.75
>2,00,000 and <=2,50,000 11,736 262 2.23
>2,50,000 and <= 3,50,000 14,177 418 2.95
>3,50,000 and <= 4,00,000 4,932 185 3.74
>4,00,000 and <= 4,50,000 4,179 177 4.25
>4,50,000 and <= 5,00,000 3,748 178 4.75
>5,00,000 and <= 5,50,000 3,187 167 5.25
>5,50,000 and <= 9,50,000 16,651 1,213 7.28
>9,50,000 and <= 10,00,000 1,462 143 9.76
>10,00,000 and <=15,00,000 10,197 1,251 12.27
>15,00,000 and <= 20,00,000 6,154 1,068 17.36
>20,00,000 and <= 25,00,000 4,094 917 22.39
>25,00,000 and <= 50,00,000 9,303 3,253 34.96
>50,00,000 and <= 1,00,00,000 5,097 3,562 69.89
>1,00,00,000 and <=5,00,00,000 3,683 7,223 196.13
>5,00,00,000 and <=10,00,00,000 393 2,675 680.63
>10,00,00,000 and <=25,00,00,000 187 2,876 1,537.97
>25,00,00,000 and <=50,00,00,000 41 1,351 3,295.53
>50,00,00,000 and <=100,00,00,000 21 1,481 7,053.51
>100,00,00,000 and <=500,00,00,000 7 1,102 15,738.71
>500,00,00,000 2 1,387 69,369.24
Total 3,65,13,034 31,631
Notes
1. Long Term Capital Gains Income is the income from the transfer of long-term capital
asset(s) as computed in the return of income under the head “Capital Gains”
2. Loss from the transfer of long-term capital asset(s) under the head “Capital Gains” is also
included in the Long Term Capital Gains Income
3. The “Sum of Long Term Capital Gains Income” is the sum of Long Term Capital Gains
Income of all returns within the value range slab.
4. The “Average Long Term Capital Gains Income” is the average Long Term Capital Gains
Income within the value range slab i.e. “Sum of Long Term Capital Gains Income”
divided by total number of returns within the value range slab
Income Tax Return Statistics Assessment Year 2014-15 Version 1.0
26
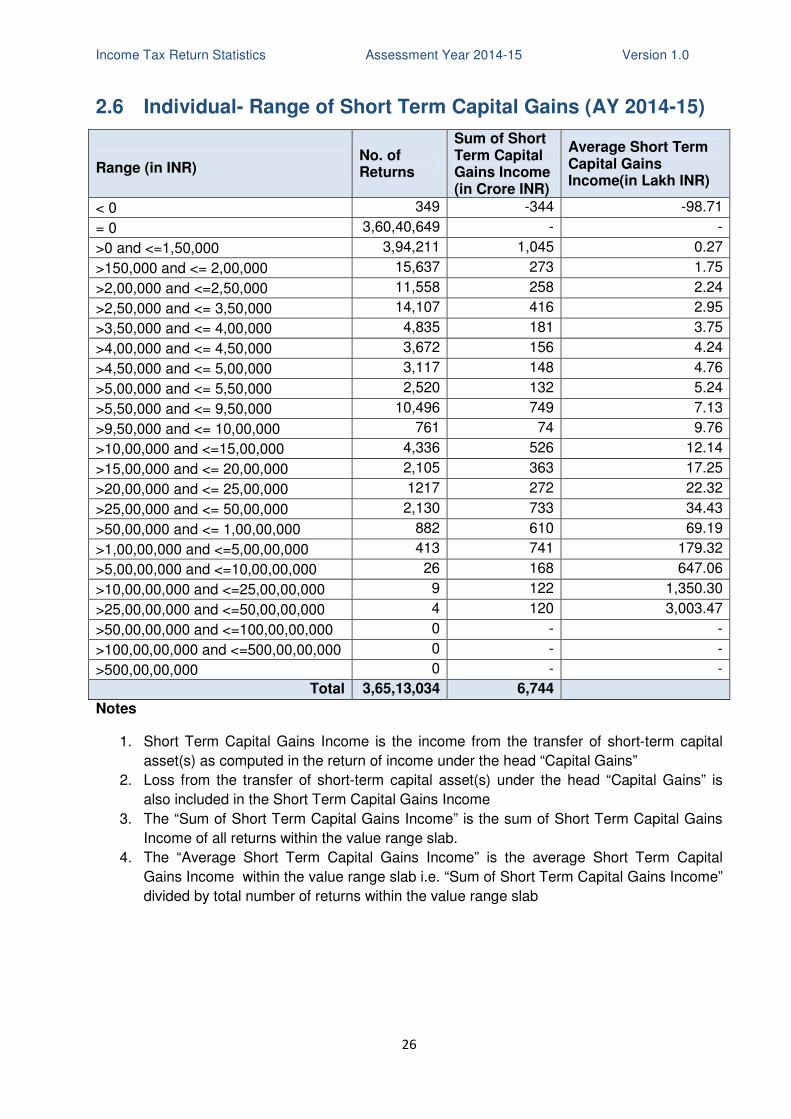
2.6 Individual- Range of Short Term Capital Gains (AY 2014-15)
Range (in INR) No. of Returns
Sum of Short Term Capital Gains Income (in Crore INR)
Average Short Term Capital Gains Income(in Lakh INR)
< 0 349 -344 -98.71
= 0 3,60,40,649 - -
>0 and <=1,50,000 3,94,211 1,045 0.27
>150,000 and <= 2,00,000 15,637 273 1.75
>2,00,000 and <=2,50,000 11,558 258 2.24
>2,50,000 and <= 3,50,000 14,107 416 2.95
>3,50,000 and <= 4,00,000 4,835 181 3.75
>4,00,000 and <= 4,50,000 3,672 156 4.24
>4,50,000 and <= 5,00,000 3,117 148 4.76
>5,00,000 and <= 5,50,000 2,520 132 5.24
>5,50,000 and <= 9,50,000 10,496 749 7.13
>9,50,000 and <= 10,00,000 761 74 9.76
>10,00,000 and <=15,00,000 4,336 526 12.14
>15,00,000 and <= 20,00,000 2,105 363 17.25
>20,00,000 and <= 25,00,000 1217 272 22.32
>25,00,000 and <= 50,00,000 2,130 733 34.43
>50,00,000 and <= 1,00,00,000 882 610 69.19
>1,00,00,000 and <=5,00,00,000 413 741 179.32
>5,00,00,000 and <=10,00,00,000 26 168 647.06
>10,00,00,000 and <=25,00,00,000 9 122 1,350.30
>25,00,00,000 and <=50,00,00,000 4 120 3,003.47
>50,00,00,000 and <=100,00,00,000 0 - -
>100,00,00,000 and <=500,00,00,000 0 - -
>500,00,00,000 0 - -
Total 3,65,13,034 6,744
Notes
1. Short Term Capital Gains Income is the income from the transfer of short-term capital
asset(s) as computed in the return of income under the head “Capital Gains”
2. Loss from the transfer of short-term capital asset(s) under the head “Capital Gains” is
also included in the Short Term Capital Gains Income
3. The “Sum of Short Term Capital Gains Income” is the sum of Short Term Capital Gains
Income of all returns within the value range slab.
4. The “Average Short Term Capital Gains Income” is the average Short Term Capital
Gains Income within the value range slab i.e. “Sum of Short Term Capital Gains Income”
divided by total number of returns within the value range slab
Income Tax Return Statistics Assessment Year 2014-15 Version 1.0
27
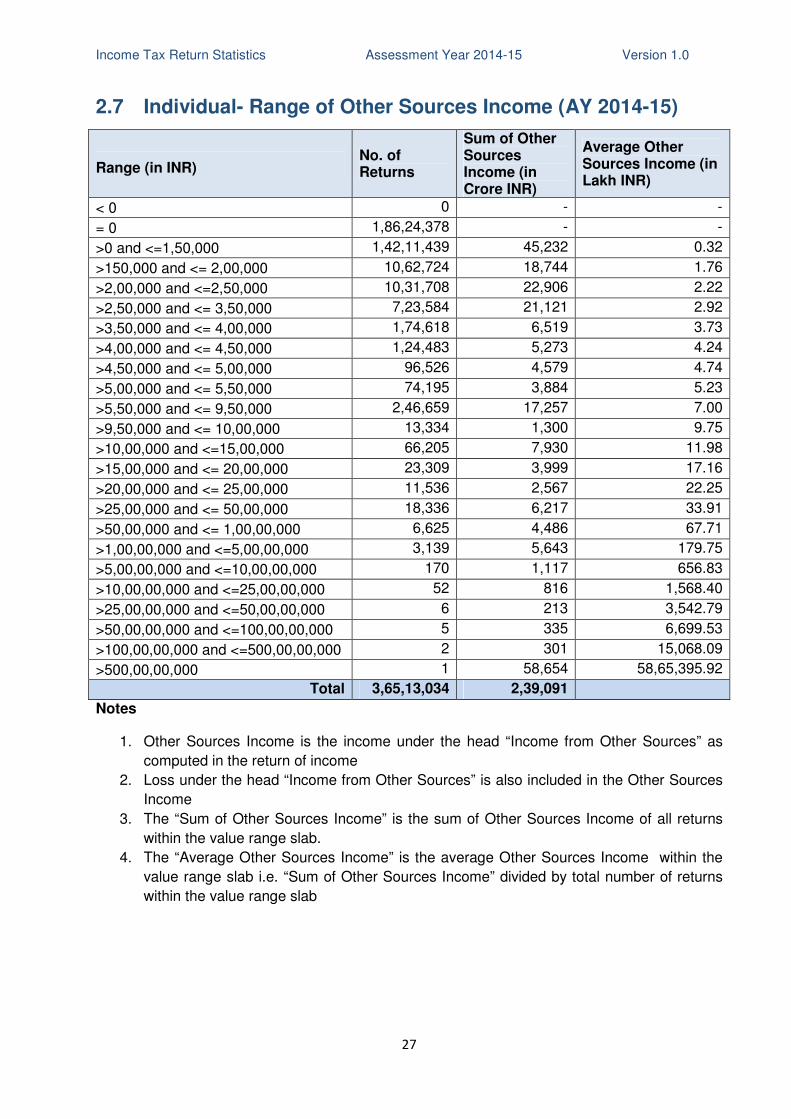
2.7 Individual- Range of Other Sources Income (AY 2014-15)
Range (in INR) No. of Returns
Sum of Other Sources Income (in Crore INR)
Average Other Sources Income (in Lakh INR)
< 0 0 - -
= 0 1,86,24,378 - -
>0 and <=1,50,000 1,42,11,439 45,232 0.32
>150,000 and <= 2,00,000 10,62,724 18,744 1.76
>2,00,000 and <=2,50,000 10,31,708 22,906 2.22
>2,50,000 and <= 3,50,000 7,23,584 21,121 2.92
>3,50,000 and <= 4,00,000 1,74,618 6,519 3.73
>4,00,000 and <= 4,50,000 1,24,483 5,273 4.24
>4,50,000 and <= 5,00,000 96,526 4,579 4.74
>5,00,000 and <= 5,50,000 74,195 3,884 5.23
>5,50,000 and <= 9,50,000 2,46,659 17,257 7.00
>9,50,000 and <= 10,00,000 13,334 1,300 9.75
>10,00,000 and <=15,00,000 66,205 7,930 11.98
>15,00,000 and <= 20,00,000 23,309 3,999 17.16
>20,00,000 and <= 25,00,000 11,536 2,567 22.25
>25,00,000 and <= 50,00,000 18,336 6,217 33.91
>50,00,000 and <= 1,00,00,000 6,625 4,486 67.71
>1,00,00,000 and <=5,00,00,000 3,139 5,643 179.75
>5,00,00,000 and <=10,00,00,000 170 1,117 656.83
>10,00,00,000 and <=25,00,00,000 52 816 1,568.40
>25,00,00,000 and <=50,00,00,000 6 213 3,542.79
>50,00,00,000 and <=100,00,00,000 5 335 6,699.53
>100,00,00,000 and <=500,00,00,000 2 301 15,068.09
>500,00,00,000 1 58,654 58,65,395.92
Total 3,65,13,034 2,39,091
Notes
1. Other Sources Income is the income under the head “Income from Other Sources” as
computed in the return of income
2. Loss under the head “Income from Other Sources” is also included in the Other Sources
Income
3. The “Sum of Other Sources Income” is the sum of Other Sources Income of all returns
within the value range slab.
4. The “Average Other Sources Income” is the average Other Sources Income within the
value range slab i.e. “Sum of Other Sources Income” divided by total number of returns
within the value range slab
Income Tax Return Statistics Assessment Year 2014-15 Version 1.0
28
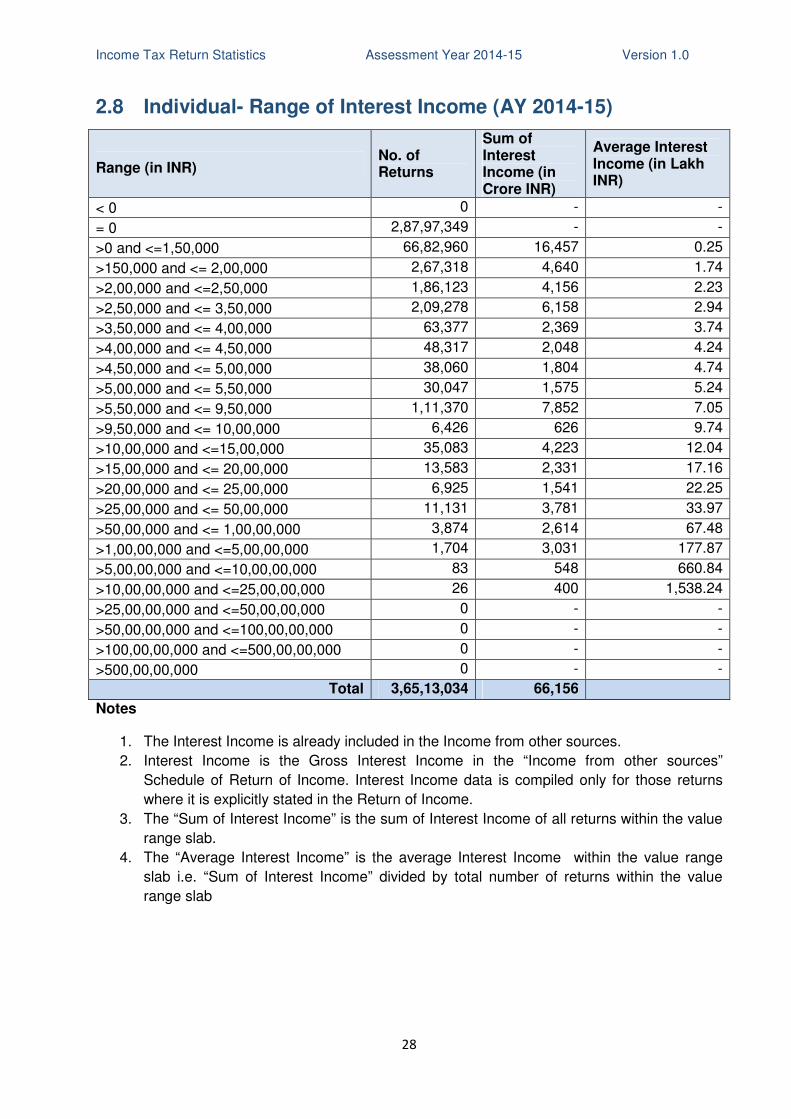
2.8 Individual- Range of Interest Income (AY 2014-15)
Range (in INR) No. of Returns
Sum of Interest Income (in Crore INR)
Average Interest Income (in Lakh INR)
< 0 0 - -
= 0 2,87,97,349 - -
>0 and <=1,50,000 66,82,960 16,457 0.25
>150,000 and <= 2,00,000 2,67,318 4,640 1.74
>2,00,000 and <=2,50,000 1,86,123 4,156 2.23
>2,50,000 and <= 3,50,000 2,09,278 6,158 2.94
>3,50,000 and <= 4,00,000 63,377 2,369 3.74
>4,00,000 and <= 4,50,000 48,317 2,048 4.24
>4,50,000 and <= 5,00,000 38,060 1,804 4.74
>5,00,000 and <= 5,50,000 30,047 1,575 5.24
>5,50,000 and <= 9,50,000 1,11,370 7,852 7.05
>9,50,000 and <= 10,00,000 6,426 626 9.74
>10,00,000 and <=15,00,000 35,083 4,223 12.04
>15,00,000 and <= 20,00,000 13,583 2,331 17.16
>20,00,000 and <= 25,00,000 6,925 1,541 22.25
>25,00,000 and <= 50,00,000 11,131 3,781 33.97
>50,00,000 and <= 1,00,00,000 3,874 2,614 67.48
>1,00,00,000 and <=5,00,00,000 1,704 3,031 177.87
>5,00,00,000 and <=10,00,00,000 83 548 660.84
>10,00,00,000 and <=25,00,00,000 26 400 1,538.24
>25,00,00,000 and <=50,00,00,000 0 - -
>50,00,00,000 and <=100,00,00,000 0 - -
>100,00,00,000 and <=500,00,00,000 0 - -
>500,00,00,000 0 - -
Total 3,65,13,034 66,156
Notes
1. The Interest Income is already included in the Income from other sources.
2. Interest Income is the Gross Interest Income in the “Income from other sources”
Schedule of Return of Income. Interest Income data is compiled only for those returns
where it is explicitly stated in the Return of Income.
3. The “Sum of Interest Income” is the sum of Interest Income of all returns within the value
range slab.
4. The “Average Interest Income” is the average Interest Income within the value range
slab i.e. “Sum of Interest Income” divided by total number of returns within the value
range slab
Income Tax Return Statistics Assessment Year 2014-15 Version 1.0
29
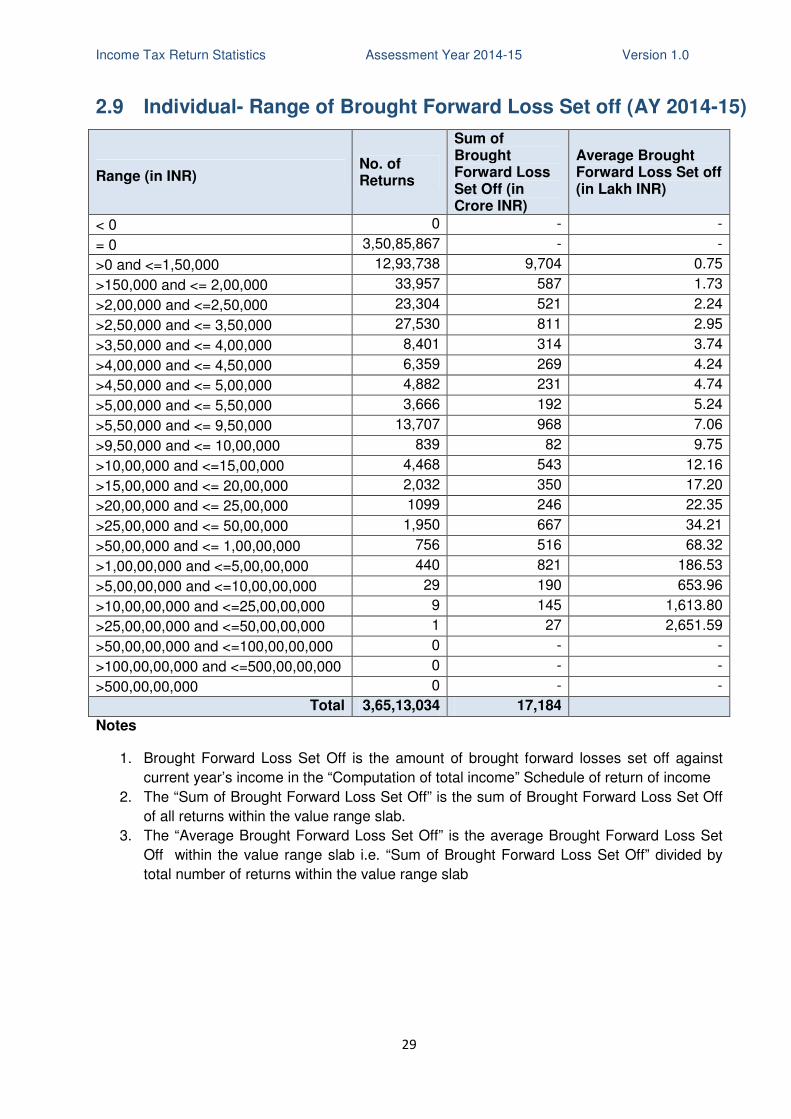
2.9 Individual- Range of Brought Forward Loss Set off (AY 2014-15)
Range (in INR) No. of Returns
Sum of Brought Forward Loss Set Off (in Crore INR)
Average Brought Forward Loss Set off (in Lakh INR)
< 0 0 - -
= 0 3,50,85,867 - -
>0 and <=1,50,000 12,93,738 9,704 0.75
>150,000 and <= 2,00,000 33,957 587 1.73
>2,00,000 and <=2,50,000 23,304 521 2.24
>2,50,000 and <= 3,50,000 27,530 811 2.95
>3,50,000 and <= 4,00,000 8,401 314 3.74
>4,00,000 and <= 4,50,000 6,359 269 4.24
>4,50,000 and <= 5,00,000 4,882 231 4.74
>5,00,000 and <= 5,50,000 3,666 192 5.24
>5,50,000 and <= 9,50,000 13,707 968 7.06
>9,50,000 and <= 10,00,000 839 82 9.75
>10,00,000 and <=15,00,000 4,468 543 12.16
>15,00,000 and <= 20,00,000 2,032 350 17.20
>20,00,000 and <= 25,00,000 1099 246 22.35
>25,00,000 and <= 50,00,000 1,950 667 34.21
>50,00,000 and <= 1,00,00,000 756 516 68.32
>1,00,00,000 and <=5,00,00,000 440 821 186.53
>5,00,00,000 and <=10,00,00,000 29 190 653.96
>10,00,00,000 and <=25,00,00,000 9 145 1,613.80
>25,00,00,000 and <=50,00,00,000 1 27 2,651.59
>50,00,00,000 and <=100,00,00,000 0 - -
>100,00,00,000 and <=500,00,00,000 0 - -
>500,00,00,000 0 - -
Total 3,65,13,034 17,184
Notes
1. Brought Forward Loss Set Off is the amount of brought forward losses set off against
current year’s income in the “Computation of total income” Schedule of return of income
2. The “Sum of Brought Forward Loss Set Off” is the sum of Brought Forward Loss Set Off
of all returns within the value range slab.
3. The “Average Brought Forward Loss Set Off” is the average Brought Forward Loss Set
Off within the value range slab i.e. “Sum of Brought Forward Loss Set Off” divided by
total number of returns within the value range slab

Income Tax Return Statistics Assessment Year 2014-15 Version 1.0
30
2.10 Individual- Range of Returned Income (AY 2014-15)
Range (in INR) No. of Returns
Sum of Returned Income (in Crore INR)
Average Returned Income (in Lakh INR)
< 0 0 0 0
= 0 2,14,801 0 -
>0 and <=1,50,000 27,30,440 23,904 0.88
>150,000 and <= 2,00,000 41,98,615 77,200 1.84
>2,00,000 and <=2,50,000 1,21,64,871 2,69,804 2.22
>2,50,000 and <= 3,50,000 59,84,946 1,74,712 2.92
>3,50,000 and <= 4,00,000 17,83,771 66,764 3.74
>4,00,000 and <= 4,50,000 15,18,377 64,405 4.24
>4,50,000 and <= 5,00,000 13,94,071 66,332 4.76
>5,00,000 and <= 5,50,000 9,84,448 51,590 5.24
>5,50,000 and <= 9,50,000 33,10,195 2,31,723 7.00
>9,50,000 and <= 10,00,000 1,84,654 18,005 9.75
>10,00,000 and <=15,00,000 9,85,422 1,19,244 12.10
>15,00,000 and <= 20,00,000 4,18,775 71,989 17.19
>20,00,000 and <= 25,00,000 2,08,496 46,373 22.24
>25,00,000 and <= 50,00,000 2,90,314 98,076 33.78
>50,00,000 and <= 1,00,00,000 94,344 64,584 68.46
>1,00,00,000 and <=5,00,00,000 43,164 78,042 180.80
>5,00,00,000 and <=10,00,00,000 2,300 15,437 671.18
>10,00,00,000 and <=25,00,00,000 810 11,879 1,466.49
>25,00,00,000 and <=50,00,00,000 140 4,666 3,332.58
>50,00,00,000 and <=100,00,00,000 56 3,783 6,755.76
>100,00,00,000 and <=500,00,00,000 17 2,751 16,182.77
>500,00,00,000 7 85,180 12,16,854.18
Total 3,65,13,034 16,46,443
Notes
1. Returned Income is the total income after chapter VI-A deduction as computed in the
“Computation of total income” schedule of return of income
2. In cases where Total Income in the “Computation of total income” schedule of return of
income is 0, the amount of losses of current year to be carried forward stated in the
“Computation of total income” schedule of return of income is taken as Returned Income.
3. The “Sum of Returned Income” is the sum of Returned Income of all returns within the
value range slab.
4. The “Average Returned Income” is the average Returned Income within the value range
slab i.e. “Sum of Returned Income” divided by total number of returns within the value
range slab.
Income Tax Return Statistics Assessment Year 2014-15 Version 1.0
31
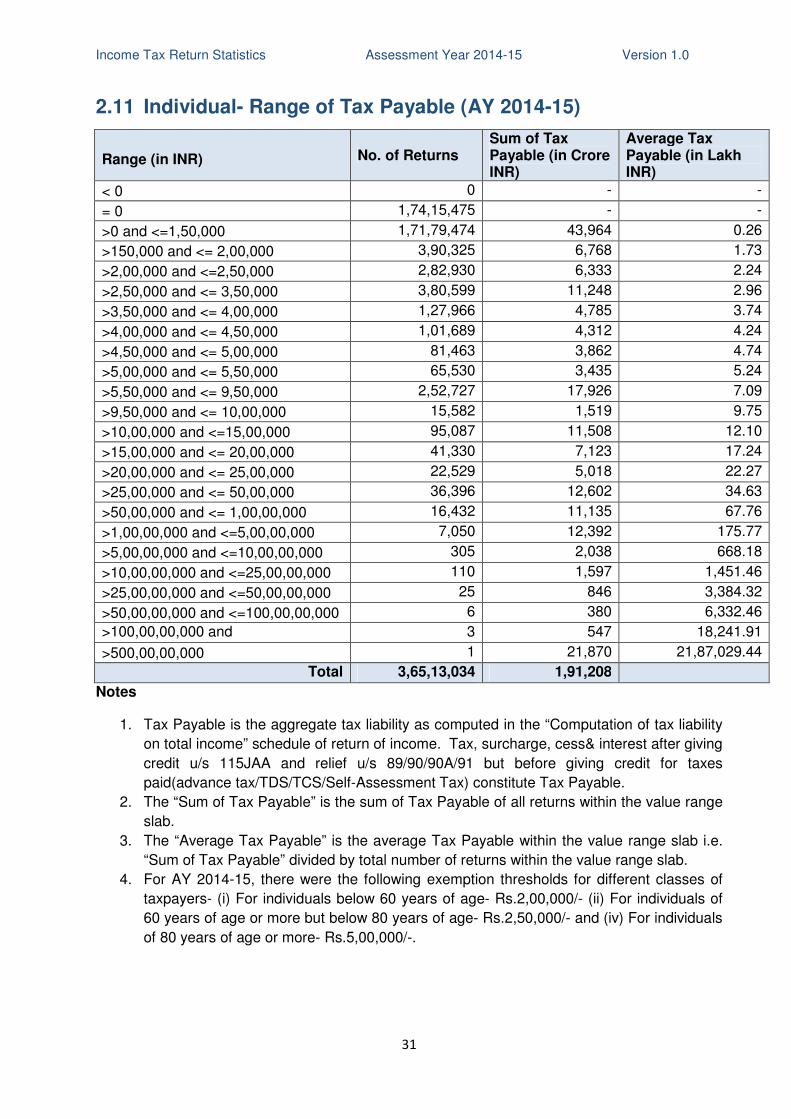
2.11 Individual- Range of Tax Payable (AY 2014-15)
Range (in INR) No. of Returns Sum of Tax Payable (in Crore INR)
Average Tax Payable (in Lakh INR)
< 0 0 - -
= 0 1,74,15,475 - -
>0 and <=1,50,000 1,71,79,474 43,964 0.26
>150,000 and <= 2,00,000 3,90,325 6,768 1.73
>2,00,000 and <=2,50,000 2,82,930 6,333 2.24
>2,50,000 and <= 3,50,000 3,80,599 11,248 2.96
>3,50,000 and <= 4,00,000 1,27,966 4,785 3.74
>4,00,000 and <= 4,50,000 1,01,689 4,312 4.24
>4,50,000 and <= 5,00,000 81,463 3,862 4.74
>5,00,000 and <= 5,50,000 65,530 3,435 5.24
>5,50,000 and <= 9,50,000 2,52,727 17,926 7.09
>9,50,000 and <= 10,00,000 15,582 1,519 9.75
>10,00,000 and <=15,00,000 95,087 11,508 12.10
>15,00,000 and <= 20,00,000 41,330 7,123 17.24
>20,00,000 and <= 25,00,000 22,529 5,018 22.27
>25,00,000 and <= 50,00,000 36,396 12,602 34.63
>50,00,000 and <= 1,00,00,000 16,432 11,135 67.76
>1,00,00,000 and <=5,00,00,000 7,050 12,392 175.77
>5,00,00,000 and <=10,00,00,000 305 2,038 668.18
>10,00,00,000 and <=25,00,00,000 110 1,597 1,451.46
>25,00,00,000 and <=50,00,00,000 25 846 3,384.32
>50,00,00,000 and <=100,00,00,000 6 380 6,332.46
>100,00,00,000 and <=500,00,00,000
3 547 18,241.91
>500,00,00,000 1 21,870 21,87,029.44
Total 3,65,13,034 1,91,208
Notes
1. Tax Payable is the aggregate tax liability as computed in the “Computation of tax liability
on total income” schedule of return of income. Tax, surcharge, cess& interest after giving
credit u/s 115JAA and relief u/s 89/90/90A/91 but before giving credit for taxes
paid(advance tax/TDS/TCS/Self-Assessment Tax) constitute Tax Payable.
2. The “Sum of Tax Payable” is the sum of Tax Payable of all returns within the value range
slab.
3. The “Average Tax Payable” is the average Tax Payable within the value range slab i.e.
“Sum of Tax Payable” divided by total number of returns within the value range slab.
4. For AY 2014-15, there were the following exemption thresholds for different classes of
taxpayers- (i) For individuals below 60 years of age- Rs.2,00,000/- (ii) For individuals of
60 years of age or more but below 80 years of age- Rs.2,50,000/- and (iv) For individuals
of 80 years of age or more- Rs.5,00,000/-.
Income Tax Return Statistics Assessment Year 2014-15 Version 1.0
32
3. Income Tax Returns - HUF
Income Tax Return Statistics Assessment Year 2014-15 Version 1.0
33
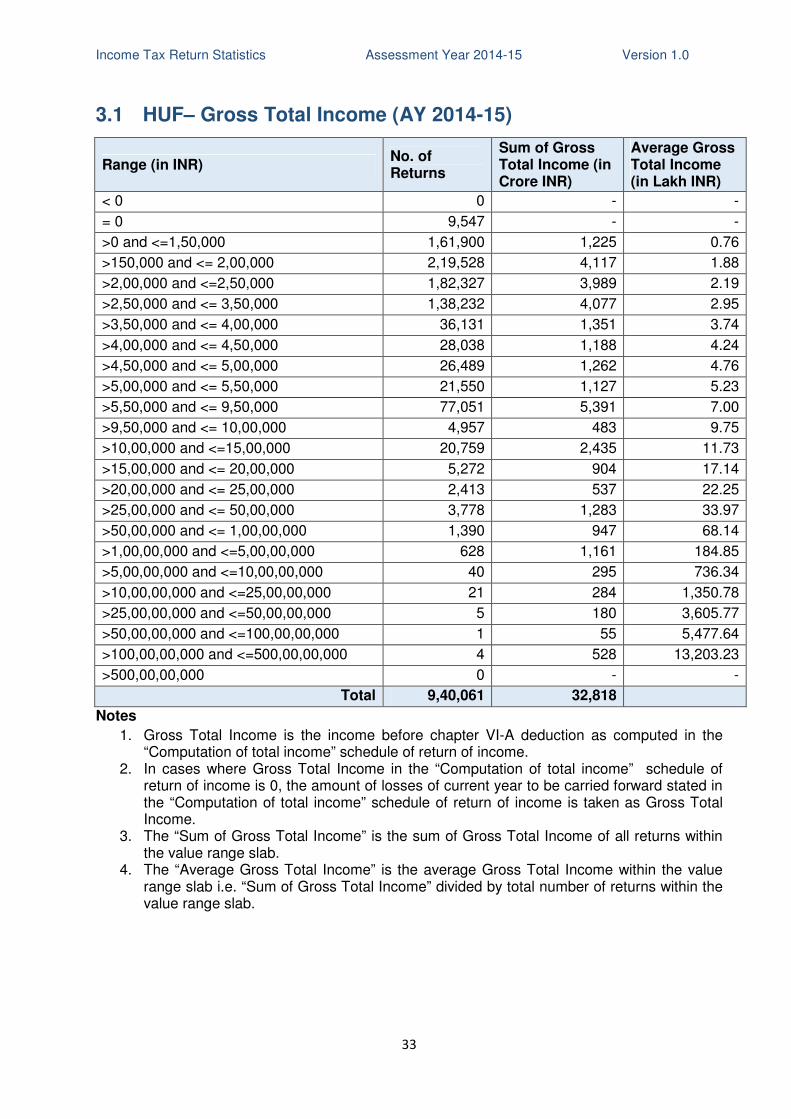
3.1 HUF– Gross Total Income (AY 2014-15)
Range (in INR) No. of Returns
Sum of Gross Total Income (in Crore INR)
Average Gross Total Income (in Lakh INR)
< 0 0 - -
= 0 9,547 - -
>0 and <=1,50,000 1,61,900 1,225 0.76
>150,000 and <= 2,00,000 2,19,528 4,117 1.88
>2,00,000 and <=2,50,000 1,82,327 3,989 2.19
>2,50,000 and <= 3,50,000 1,38,232 4,077 2.95
>3,50,000 and <= 4,00,000 36,131 1,351 3.74
>4,00,000 and <= 4,50,000 28,038 1,188 4.24
>4,50,000 and <= 5,00,000 26,489 1,262 4.76
>5,00,000 and <= 5,50,000 21,550 1,127 5.23
>5,50,000 and <= 9,50,000 77,051 5,391 7.00
>9,50,000 and <= 10,00,000 4,957 483 9.75
>10,00,000 and <=15,00,000 20,759 2,435 11.73
>15,00,000 and <= 20,00,000 5,272 904 17.14
>20,00,000 and <= 25,00,000 2,413 537 22.25
>25,00,000 and <= 50,00,000 3,778 1,283 33.97
>50,00,000 and <= 1,00,00,000 1,390 947 68.14
>1,00,00,000 and <=5,00,00,000 628 1,161 184.85
>5,00,00,000 and <=10,00,00,000 40 295 736.34
>10,00,00,000 and <=25,00,00,000 21 284 1,350.78
>25,00,00,000 and <=50,00,00,000 5 180 3,605.77
>50,00,00,000 and <=100,00,00,000 1 55 5,477.64
>100,00,00,000 and <=500,00,00,000 4 528 13,203.23
>500,00,00,000 0 - -
Total 9,40,061 32,818
Notes
1. Gross Total Income is the income before chapter VI-A deduction as computed in the “Computation of total income” schedule of return of income.
2. In cases where Gross Total Income in the “Computation of total income” schedule of return of income is 0, the amount of losses of current year to be carried forward stated in the “Computation of total income” schedule of return of income is taken as Gross Total Income.
3. The “Sum of Gross Total Income” is the sum of Gross Total Income of all returns within the value range slab.
4. The “Average Gross Total Income” is the average Gross Total Income within the value range slab i.e. “Sum of Gross Total Income” divided by total number of returns within the value range slab.
Income Tax Return Statistics Assessment Year 2014-15 Version 1.0
34
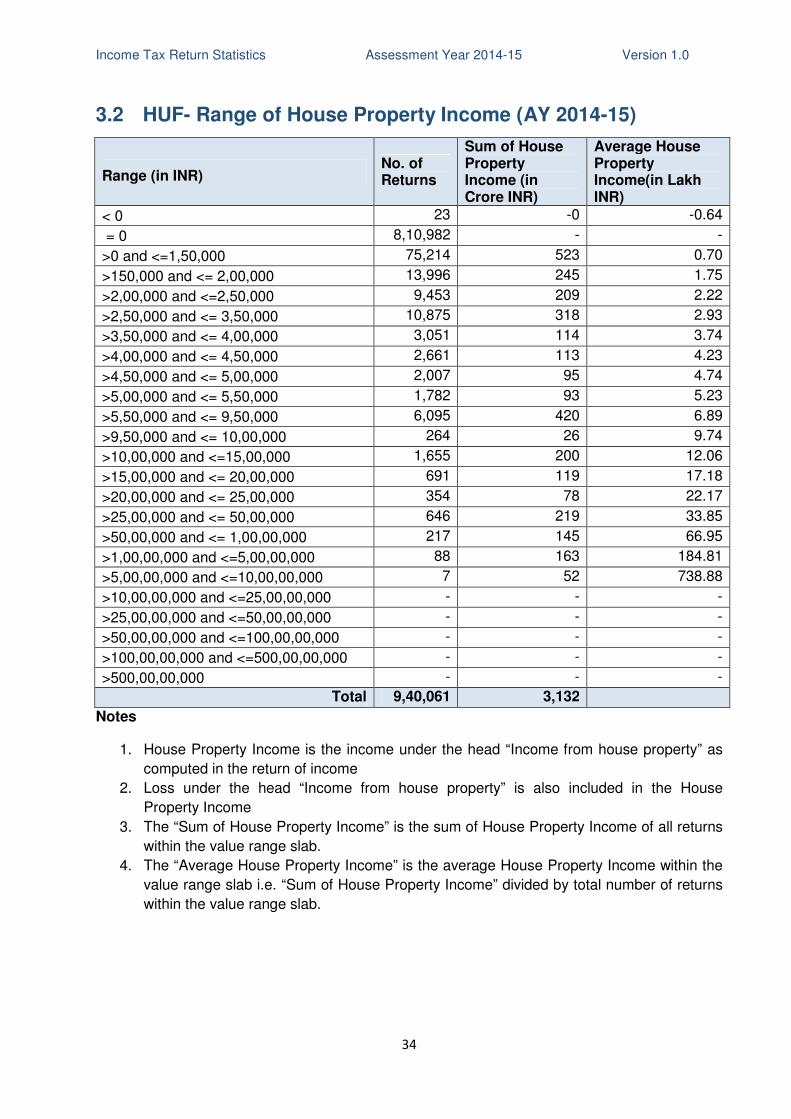
3.2 HUF- Range of House Property Income (AY 2014-15)
Range (in INR) No. of Returns
Sum of House Property Income (in Crore INR)
Average House Property Income(in Lakh INR)
< 0 23 -0 -0.64
= 0 8,10,982 - -
>0 and <=1,50,000 75,214 523 0.70
>150,000 and <= 2,00,000 13,996 245 1.75
>2,00,000 and <=2,50,000 9,453 209 2.22
>2,50,000 and <= 3,50,000 10,875 318 2.93
>3,50,000 and <= 4,00,000 3,051 114 3.74
>4,00,000 and <= 4,50,000 2,661 113 4.23
>4,50,000 and <= 5,00,000 2,007 95 4.74
>5,00,000 and <= 5,50,000 1,782 93 5.23
>5,50,000 and <= 9,50,000 6,095 420 6.89
>9,50,000 and <= 10,00,000 264 26 9.74
>10,00,000 and <=15,00,000 1,655 200 12.06
>15,00,000 and <= 20,00,000 691 119 17.18
>20,00,000 and <= 25,00,000 354 78 22.17
>25,00,000 and <= 50,00,000 646 219 33.85
>50,00,000 and <= 1,00,00,000 217 145 66.95
>1,00,00,000 and <=5,00,00,000 88 163 184.81
>5,00,00,000 and <=10,00,00,000 7 52 738.88
>10,00,00,000 and <=25,00,00,000 - - -
>25,00,00,000 and <=50,00,00,000 - - -
>50,00,00,000 and <=100,00,00,000 - - -
>100,00,00,000 and <=500,00,00,000 - - -
>500,00,00,000 - - -
Total 9,40,061 3,132
Notes
1. House Property Income is the income under the head “Income from house property” as
computed in the return of income
2. Loss under the head “Income from house property” is also included in the House
Property Income
3. The “Sum of House Property Income” is the sum of House Property Income of all returns
within the value range slab.
4. The “Average House Property Income” is the average House Property Income within the
value range slab i.e. “Sum of House Property Income” divided by total number of returns
within the value range slab.
Income Tax Return Statistics Assessment Year 2014-15 Version 1.0
35
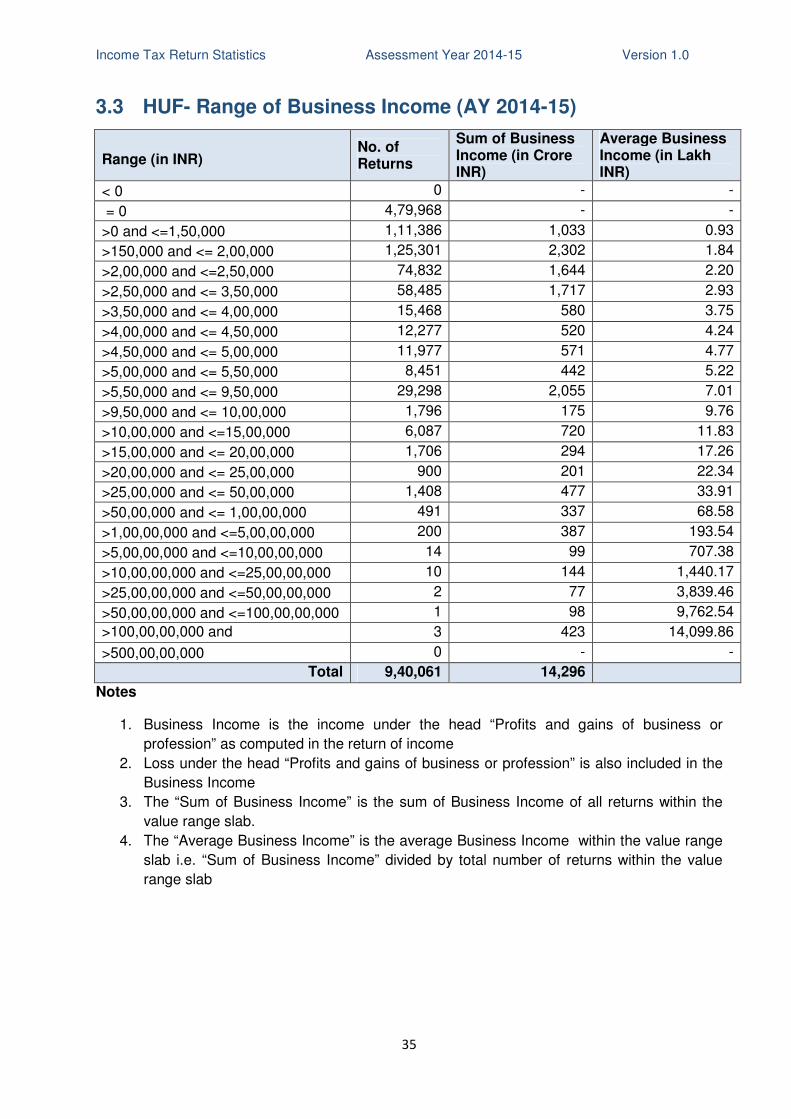
3.3 HUF- Range of Business Income (AY 2014-15)
Range (in INR) No. of Returns
Sum of Business Income (in Crore INR)
Average Business Income (in Lakh INR)
< 0 0 - -
= 0 4,79,968 - -
>0 and <=1,50,000 1,11,386 1,033 0.93
>150,000 and <= 2,00,000 1,25,301 2,302 1.84
>2,00,000 and <=2,50,000 74,832 1,644 2.20
>2,50,000 and <= 3,50,000 58,485 1,717 2.93
>3,50,000 and <= 4,00,000 15,468 580 3.75
>4,00,000 and <= 4,50,000 12,277 520 4.24
>4,50,000 and <= 5,00,000 11,977 571 4.77
>5,00,000 and <= 5,50,000 8,451 442 5.22
>5,50,000 and <= 9,50,000 29,298 2,055 7.01
>9,50,000 and <= 10,00,000 1,796 175 9.76
>10,00,000 and <=15,00,000 6,087 720 11.83
>15,00,000 and <= 20,00,000 1,706 294 17.26
>20,00,000 and <= 25,00,000 900 201 22.34
>25,00,000 and <= 50,00,000 1,408 477 33.91
>50,00,000 and <= 1,00,00,000 491 337 68.58
>1,00,00,000 and <=5,00,00,000 200 387 193.54
>5,00,00,000 and <=10,00,00,000 14 99 707.38
>10,00,00,000 and <=25,00,00,000 10 144 1,440.17
>25,00,00,000 and <=50,00,00,000 2 77 3,839.46
>50,00,00,000 and <=100,00,00,000 1 98 9,762.54
>100,00,00,000 and <=500,00,00,000
3 423 14,099.86
>500,00,00,000 0 - -
Total 9,40,061 14,296
Notes
1. Business Income is the income under the head “Profits and gains of business or
profession” as computed in the return of income
2. Loss under the head “Profits and gains of business or profession” is also included in the
Business Income
3. The “Sum of Business Income” is the sum of Business Income of all returns within the
value range slab.
4. The “Average Business Income” is the average Business Income within the value range
slab i.e. “Sum of Business Income” divided by total number of returns within the value
range slab
Income Tax Return Statistics Assessment Year 2014-15 Version 1.0
36
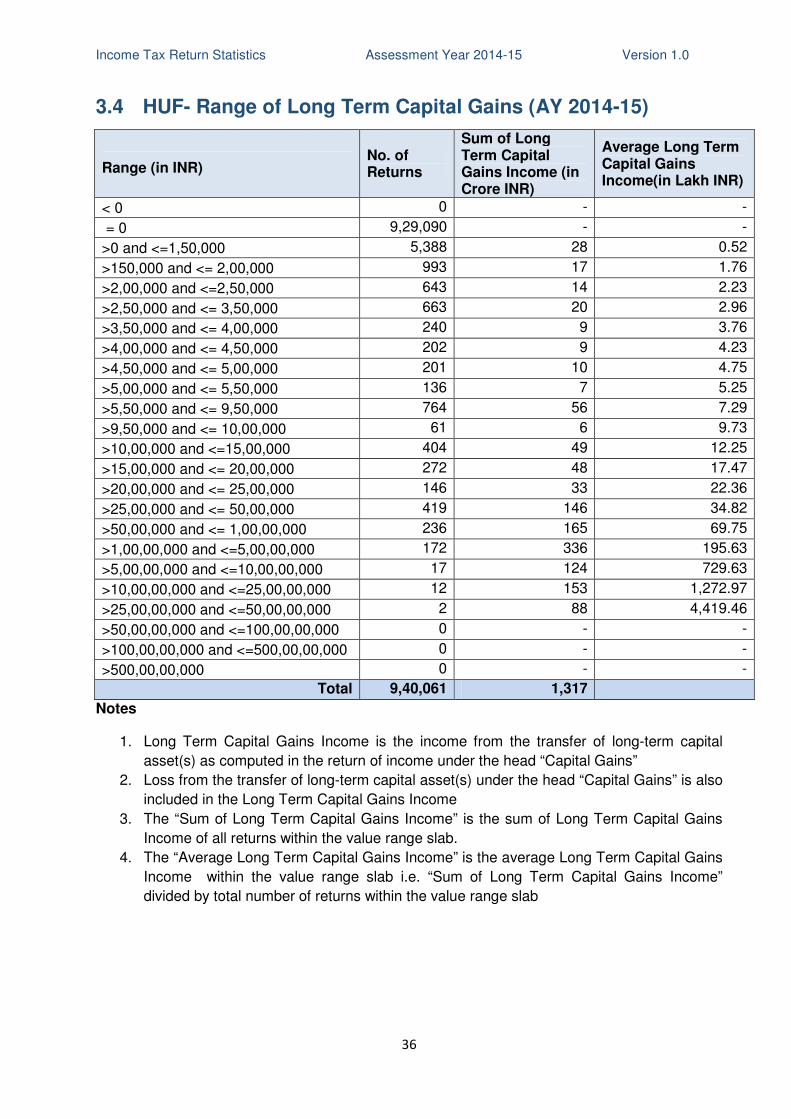
3.4 HUF- Range of Long Term Capital Gains (AY 2014-15)
Range (in INR) No. of Returns
Sum of Long Term Capital Gains Income (in Crore INR)
Average Long Term Capital Gains Income(in Lakh INR)
< 0 0 - -
= 0 9,29,090 - -
>0 and <=1,50,000 5,388 28 0.52
>150,000 and <= 2,00,000 993 17 1.76
>2,00,000 and <=2,50,000 643 14 2.23
>2,50,000 and <= 3,50,000 663 20 2.96
>3,50,000 and <= 4,00,000 240 9 3.76
>4,00,000 and <= 4,50,000 202 9 4.23
>4,50,000 and <= 5,00,000 201 10 4.75
>5,00,000 and <= 5,50,000 136 7 5.25
>5,50,000 and <= 9,50,000 764 56 7.29
>9,50,000 and <= 10,00,000 61 6 9.73
>10,00,000 and <=15,00,000 404 49 12.25
>15,00,000 and <= 20,00,000 272 48 17.47
>20,00,000 and <= 25,00,000 146 33 22.36
>25,00,000 and <= 50,00,000 419 146 34.82
>50,00,000 and <= 1,00,00,000 236 165 69.75
>1,00,00,000 and <=5,00,00,000 172 336 195.63
>5,00,00,000 and <=10,00,00,000 17 124 729.63
>10,00,00,000 and <=25,00,00,000 12 153 1,272.97
>25,00,00,000 and <=50,00,00,000 2 88 4,419.46
>50,00,00,000 and <=100,00,00,000 0 - -
>100,00,00,000 and <=500,00,00,000 0 - -
>500,00,00,000 0 - -
Total 9,40,061 1,317
Notes
1. Long Term Capital Gains Income is the income from the transfer of long-term capital
asset(s) as computed in the return of income under the head “Capital Gains”
2. Loss from the transfer of long-term capital asset(s) under the head “Capital Gains” is also
included in the Long Term Capital Gains Income
3. The “Sum of Long Term Capital Gains Income” is the sum of Long Term Capital Gains
Income of all returns within the value range slab.
4. The “Average Long Term Capital Gains Income” is the average Long Term Capital Gains
Income within the value range slab i.e. “Sum of Long Term Capital Gains Income”
divided by total number of returns within the value range slab

Income Tax Return Statistics Assessment Year 2014-15 Version 1.0
37
3.5 HUF- Range of Short Term Capital Gains (AY 2014-15)
Range (in INR) No. of Returns
Sum of Short Term Capital Gains Income (in Crore INR)
Average Short Term Capital Gains Income (in Lakh INR)
< 0 11 -3 -28.10
= 0 9,00,746 - -
>0 and <=1,50,000 33,007 85 0.26
>150,000 and <= 2,00,000 1,705 30 1.77
>2,00,000 and <=2,50,000 1,148 25 2.21
>2,50,000 and <= 3,50,000 1,162 34 2.93
>3,50,000 and <= 4,00,000 306 11 3.75
>4,00,000 and <= 4,50,000 286 12 4.22
>4,50,000 and <= 5,00,000 264 13 4.78
>5,00,000 and <= 5,50,000 214 11 5.18
>5,50,000 and <= 9,50,000 632 45 7.16
>9,50,000 and <= 10,00,000 49 5 9.80
>10,00,000 and <=15,00,000 217 26 11.91
>15,00,000 and <= 20,00,000 102 17 17.00
>20,00,000 and <= 25,00,000 66 15 22.08
>25,00,000 and <= 50,00,000 84 30 35.15
>50,00,000 and <= 1,00,00,000 50 31 62.67
>1,00,00,000 and <=5,00,00,000 11 24 219.94
>5,00,00,000 and <=10,00,00,000 1 5 502.00
>10,00,00,000 and <=25,00,00,000 0 - -
>25,00,00,000 and <=50,00,00,000 0 - -
>50,00,00,000 and <=100,00,00,000 0 - -
>100,00,00,000 and <=500,00,00,000 0 - -
>500,00,00,000 0 - -
Total 9,40,061 416
Notes
1. Short Term Capital Gains Income is the income from the transfer of short-term capital
asset(s) as computed in the return of income under the head “Capital Gains”
2. Loss from the transfer of short-term capital asset(s) under the head “Capital Gains” is
also included in the Short Term Capital Gains Income
3. The “Sum of Short Term Capital Gains Income” is the sum of Short Term Capital Gains
Income of all returns within the value range slab.
4. The “Average Short Term Capital Gains Income” is the average Short Term Capital
Gains Income within the value range slab i.e. “Sum of Short Term Capital Gains Income”
divided by total number of returns within the value range slab
Income Tax Return Statistics Assessment Year 2014-15 Version 1.0
38
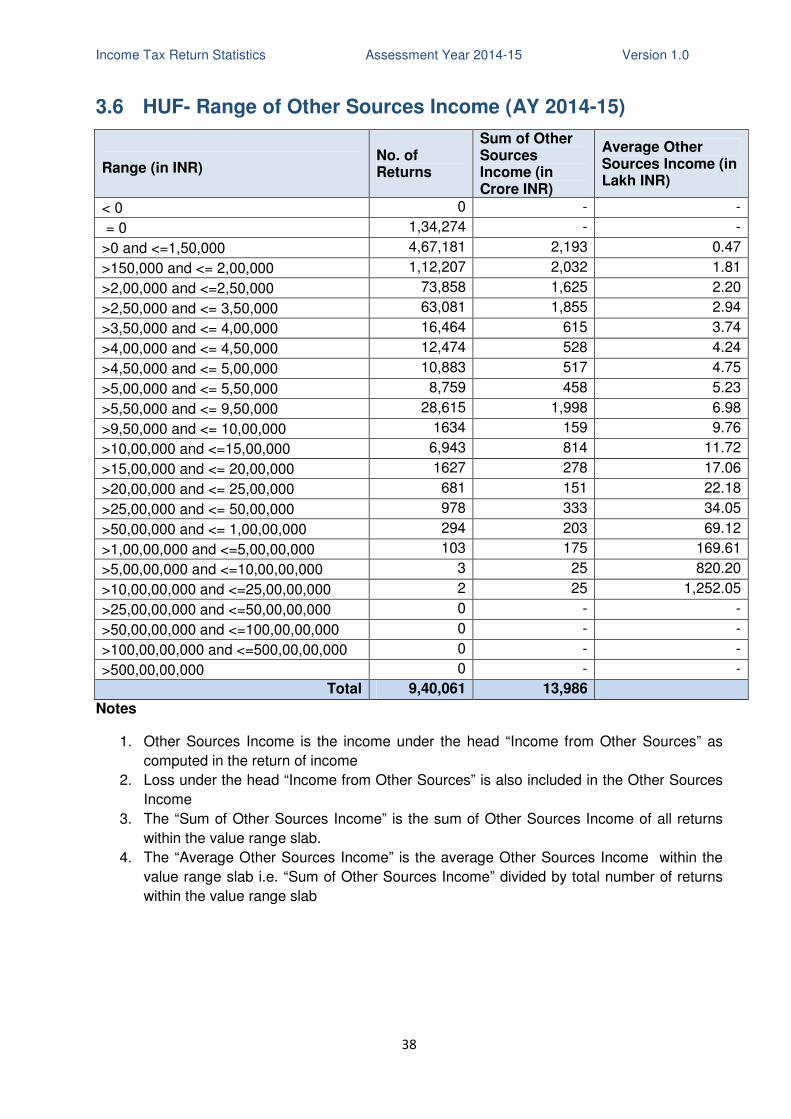
3.6 HUF- Range of Other Sources Income (AY 2014-15)
Range (in INR) No. of Returns
Sum of Other Sources Income (in Crore INR)
Average Other Sources Income (in Lakh INR)
< 0 0 - -
= 0 1,34,274 - -
>0 and <=1,50,000 4,67,181 2,193 0.47
>150,000 and <= 2,00,000 1,12,207 2,032 1.81
>2,00,000 and <=2,50,000 73,858 1,625 2.20
>2,50,000 and <= 3,50,000 63,081 1,855 2.94
>3,50,000 and <= 4,00,000 16,464 615 3.74
>4,00,000 and <= 4,50,000 12,474 528 4.24
>4,50,000 and <= 5,00,000 10,883 517 4.75
>5,00,000 and <= 5,50,000 8,759 458 5.23
>5,50,000 and <= 9,50,000 28,615 1,998 6.98
>9,50,000 and <= 10,00,000 1634 159 9.76
>10,00,000 and <=15,00,000 6,943 814 11.72
>15,00,000 and <= 20,00,000 1627 278 17.06
>20,00,000 and <= 25,00,000 681 151 22.18
>25,00,000 and <= 50,00,000 978 333 34.05
>50,00,000 and <= 1,00,00,000 294 203 69.12
>1,00,00,000 and <=5,00,00,000 103 175 169.61
>5,00,00,000 and <=10,00,00,000 3 25 820.20
>10,00,00,000 and <=25,00,00,000 2 25 1,252.05
>25,00,00,000 and <=50,00,00,000 0 - -
>50,00,00,000 and <=100,00,00,000 0 - -
>100,00,00,000 and <=500,00,00,000 0 - -
>500,00,00,000 0 - -
Total 9,40,061 13,986
Notes
1. Other Sources Income is the income under the head “Income from Other Sources” as
computed in the return of income
2. Loss under the head “Income from Other Sources” is also included in the Other Sources
Income
3. The “Sum of Other Sources Income” is the sum of Other Sources Income of all returns
within the value range slab.
4. The “Average Other Sources Income” is the average Other Sources Income within the
value range slab i.e. “Sum of Other Sources Income” divided by total number of returns
within the value range slab
Income Tax Return Statistics Assessment Year 2014-15 Version 1.0
39
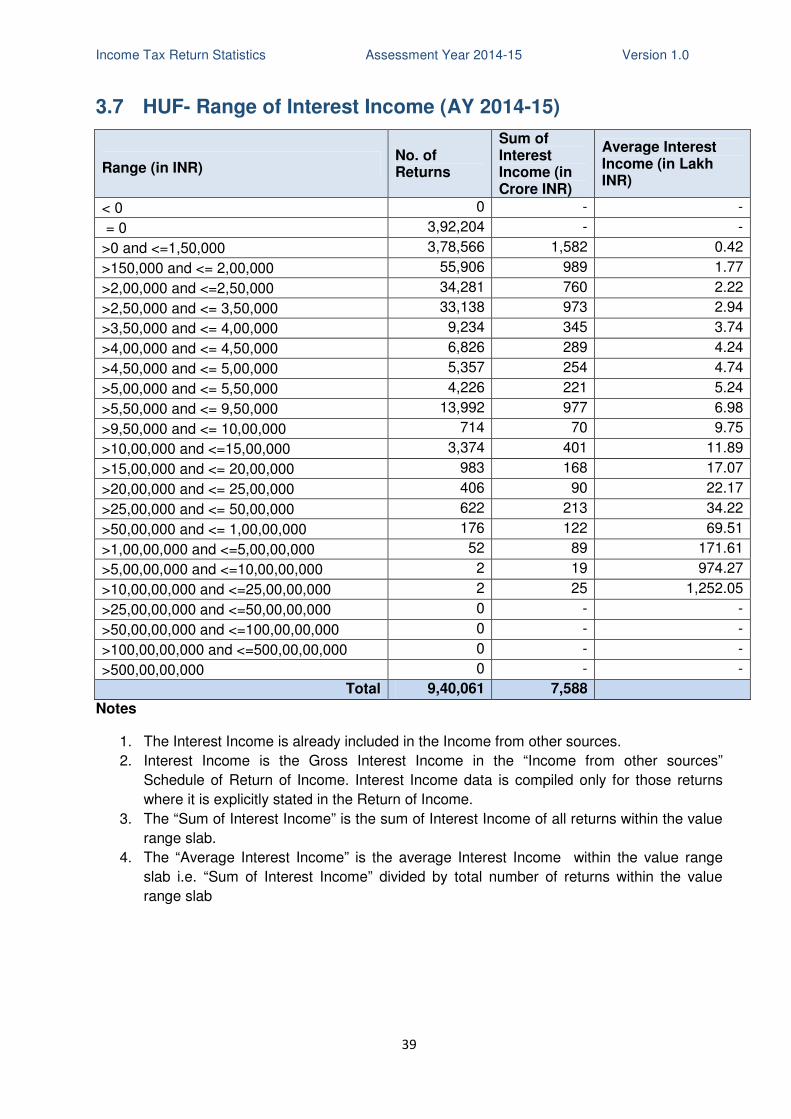
3.7 HUF- Range of Interest Income (AY 2014-15)
Range (in INR) No. of Returns
Sum of Interest Income (in Crore INR)
Average Interest Income (in Lakh INR)
< 0 0 - -
= 0 3,92,204 - -
>0 and <=1,50,000 3,78,566 1,582 0.42
>150,000 and <= 2,00,000 55,906 989 1.77
>2,00,000 and <=2,50,000 34,281 760 2.22
>2,50,000 and <= 3,50,000 33,138 973 2.94
>3,50,000 and <= 4,00,000 9,234 345 3.74
>4,00,000 and <= 4,50,000 6,826 289 4.24
>4,50,000 and <= 5,00,000 5,357 254 4.74
>5,00,000 and <= 5,50,000 4,226 221 5.24
>5,50,000 and <= 9,50,000 13,992 977 6.98
>9,50,000 and <= 10,00,000 714 70 9.75
>10,00,000 and <=15,00,000 3,374 401 11.89
>15,00,000 and <= 20,00,000 983 168 17.07
>20,00,000 and <= 25,00,000 406 90 22.17
>25,00,000 and <= 50,00,000 622 213 34.22
>50,00,000 and <= 1,00,00,000 176 122 69.51
>1,00,00,000 and <=5,00,00,000 52 89 171.61
>5,00,00,000 and <=10,00,00,000 2 19 974.27
>10,00,00,000 and <=25,00,00,000 2 25 1,252.05
>25,00,00,000 and <=50,00,00,000 0 - -
>50,00,00,000 and <=100,00,00,000 0 - -
>100,00,00,000 and <=500,00,00,000 0 - -
>500,00,00,000 0 - -
Total 9,40,061 7,588
Notes
1. The Interest Income is already included in the Income from other sources.
2. Interest Income is the Gross Interest Income in the “Income from other sources”
Schedule of Return of Income. Interest Income data is compiled only for those returns
where it is explicitly stated in the Return of Income.
3. The “Sum of Interest Income” is the sum of Interest Income of all returns within the value
range slab.
4. The “Average Interest Income” is the average Interest Income within the value range
slab i.e. “Sum of Interest Income” divided by total number of returns within the value
range slab
Income Tax Return Statistics Assessment Year 2014-15 Version 1.0
40
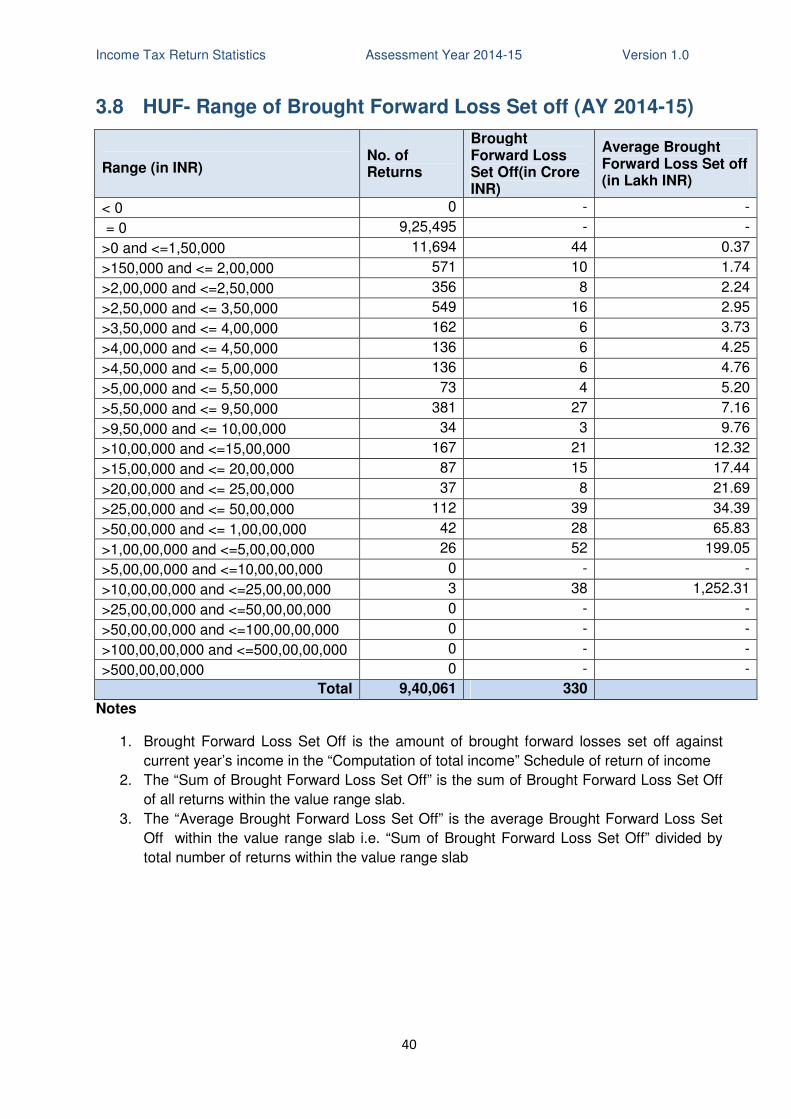
3.8 HUF- Range of Brought Forward Loss Set off (AY 2014-15)
Range (in INR) No. of Returns
Brought Forward Loss Set Off(in Crore INR)
Average Brought Forward Loss Set off (in Lakh INR)
< 0 0 - -
= 0 9,25,495 - -
>0 and <=1,50,000 11,694 44 0.37
>150,000 and <= 2,00,000 571 10 1.74
>2,00,000 and <=2,50,000 356 8 2.24
>2,50,000 and <= 3,50,000 549 16 2.95
>3,50,000 and <= 4,00,000 162 6 3.73
>4,00,000 and <= 4,50,000 136 6 4.25
>4,50,000 and <= 5,00,000 136 6 4.76
>5,00,000 and <= 5,50,000 73 4 5.20
>5,50,000 and <= 9,50,000 381 27 7.16
>9,50,000 and <= 10,00,000 34 3 9.76
>10,00,000 and <=15,00,000 167 21 12.32
>15,00,000 and <= 20,00,000 87 15 17.44
>20,00,000 and <= 25,00,000 37 8 21.69
>25,00,000 and <= 50,00,000 112 39 34.39
>50,00,000 and <= 1,00,00,000 42 28 65.83
>1,00,00,000 and <=5,00,00,000 26 52 199.05
>5,00,00,000 and <=10,00,00,000 0 - -
>10,00,00,000 and <=25,00,00,000 3 38 1,252.31
>25,00,00,000 and <=50,00,00,000 0 - -
>50,00,00,000 and <=100,00,00,000 0 - -
>100,00,00,000 and <=500,00,00,000 0 - -
>500,00,00,000 0 - -
Total 9,40,061 330
Notes
1. Brought Forward Loss Set Off is the amount of brought forward losses set off against
current year’s income in the “Computation of total income” Schedule of return of income
2. The “Sum of Brought Forward Loss Set Off” is the sum of Brought Forward Loss Set Off
of all returns within the value range slab.
3. The “Average Brought Forward Loss Set Off” is the average Brought Forward Loss Set
Off within the value range slab i.e. “Sum of Brought Forward Loss Set Off” divided by
total number of returns within the value range slab
Income Tax Return Statistics Assessment Year 2014-15 Version 1.0
41
3.9 HUF- Range of Returned Income (AY 2014-15)
Range (in INR) No. of Returns
Sum of Returned Income (in Crore INR)
Average Returned Income (in Lakh INR)
< 0 0 - -
= 0 25,666 - -
>0 and <=1,50,000 1,61,171 1,333 0.83
>150,000 and <= 2,00,000 2,68,209 5,046 1.88
>2,00,000 and <=2,50,000 1,88,156 4,120 2.19
>2,50,000 and <= 3,50,000 1,05,150 3,070 2.92
>3,50,000 and <= 4,00,000 29,715 1,114 3.75
>4,00,000 and <= 4,50,000 24,792 1,052 4.24
>4,50,000 and <= 5,00,000 27,086 1,296 4.78
>5,00,000 and <= 5,50,000 18,597 972 5.22
>5,50,000 and <= 9,50,000 59,633 4,233 7.10
>9,50,000 and <= 10,00,000 4,793 468 9.77
>10,00,000 and <=15,00,000 14,976 1,769 11.82
>15,00,000 and <= 20,00,000 4,460 767 17.20
>20,00,000 and <= 25,00,000 2,181 487 22.34
>25,00,000 and <= 50,00,000 3,462 1,183 34.18
>50,00,000 and <= 1,00,00,000 1,343 917 68.27
>1,00,00,000 and <=5,00,00,000 602 1,121 186.18
>5,00,00,000 and <=10,00,00,000 40 293 732.23
>10,00,00,000 and <=25,00,00,000 19 250 1,313.20
>25,00,00,000 and <=50,00,00,000 5 180 3,605.33
>50,00,00,000 and <=100,00,00,000 1 55 5,476.64
>100,00,00,000 and <=500,00,00,000 4 524 13,105.83
>500,00,00,000 0 - -
Total 9,40,061 30,250
Notes
1. Returned Income is the total income after chapter VI-A deduction as computed in the
“Computation of total income” schedule of return of income
2. In cases where Total Income in the “Computation of total income” schedule of return of
income is 0, the amount of losses of current year to be carried forward stated in the
“Computation of total income” schedule of return of income is taken as Returned Income.
3. The “Sum of Returned Income” is the sum of Returned Income of all returns within the
value range slab.
4. The “Average Returned Income” is the average Returned Income within the value range
slab i.e. “Sum of Returned Income” divided by total number of returns within the value
range slab.
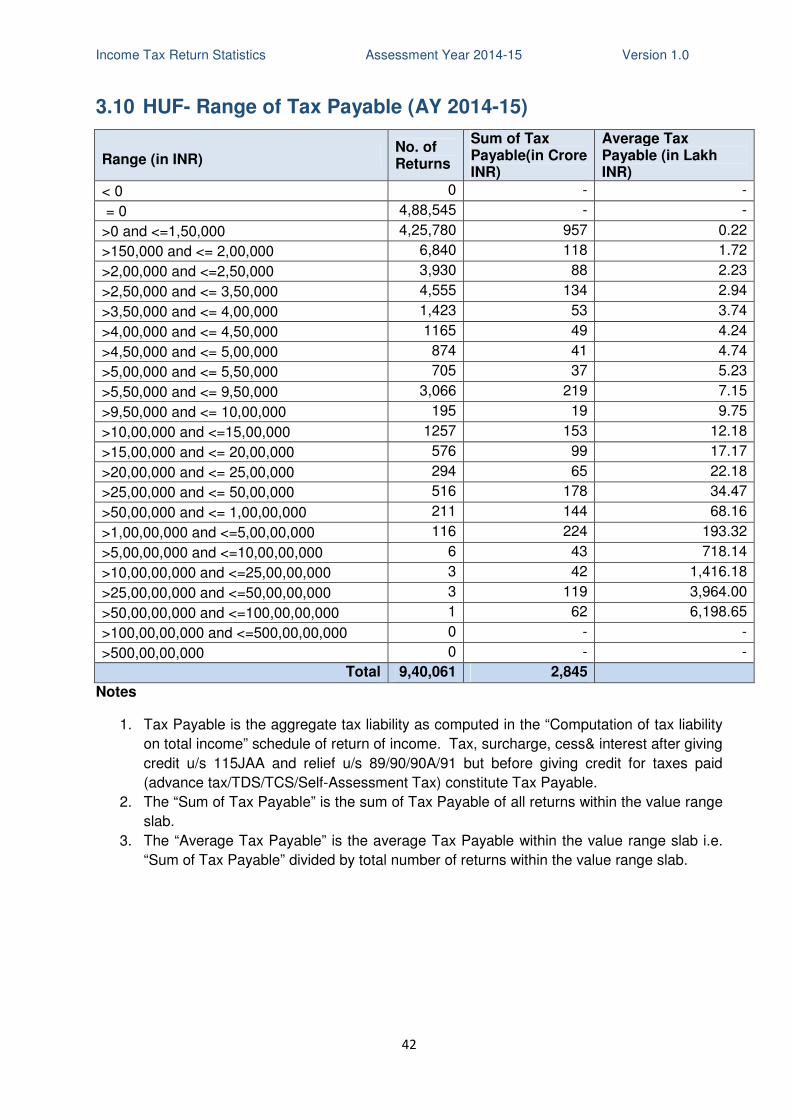
Income Tax Return Statistics Assessment Year 2014-15 Version 1.0
42
3.10 HUF- Range of Tax Payable (AY 2014-15)
Range (in INR) No. of Returns
Sum of Tax Payable(in Crore INR)
Average Tax Payable (in Lakh INR)
< 0 0 - -
= 0 4,88,545 - -
>0 and <=1,50,000 4,25,780 957 0.22
>150,000 and <= 2,00,000 6,840 118 1.72
>2,00,000 and <=2,50,000 3,930 88 2.23
>2,50,000 and <= 3,50,000 4,555 134 2.94
>3,50,000 and <= 4,00,000 1,423 53 3.74
>4,00,000 and <= 4,50,000 1165 49 4.24
>4,50,000 and <= 5,00,000 874 41 4.74
>5,00,000 and <= 5,50,000 705 37 5.23
>5,50,000 and <= 9,50,000 3,066 219 7.15
>9,50,000 and <= 10,00,000 195 19 9.75
>10,00,000 and <=15,00,000 1257 153 12.18
>15,00,000 and <= 20,00,000 576 99 17.17
>20,00,000 and <= 25,00,000 294 65 22.18
>25,00,000 and <= 50,00,000 516 178 34.47
>50,00,000 and <= 1,00,00,000 211 144 68.16
>1,00,00,000 and <=5,00,00,000 116 224 193.32
>5,00,00,000 and <=10,00,00,000 6 43 718.14
>10,00,00,000 and <=25,00,00,000 3 42 1,416.18
>25,00,00,000 and <=50,00,00,000 3 119 3,964.00
>50,00,00,000 and <=100,00,00,000 1 62 6,198.65
>100,00,00,000 and <=500,00,00,000 0 - -
>500,00,00,000 0 - -
Total 9,40,061 2,845
Notes
1. Tax Payable is the aggregate tax liability as computed in the “Computation of tax liability
on total income” schedule of return of income. Tax, surcharge, cess& interest after giving
credit u/s 115JAA and relief u/s 89/90/90A/91 but before giving credit for taxes paid
(advance tax/TDS/TCS/Self-Assessment Tax) constitute Tax Payable.
2. The “Sum of Tax Payable” is the sum of Tax Payable of all returns within the value range
slab.
3. The “Average Tax Payable” is the average Tax Payable within the value range slab i.e.
“Sum of Tax Payable” divided by total number of returns within the value range slab.

Income Tax Return Statistics Assessment Year 2014-15 Version 1.0
43
4. Income Tax Returns - Firms
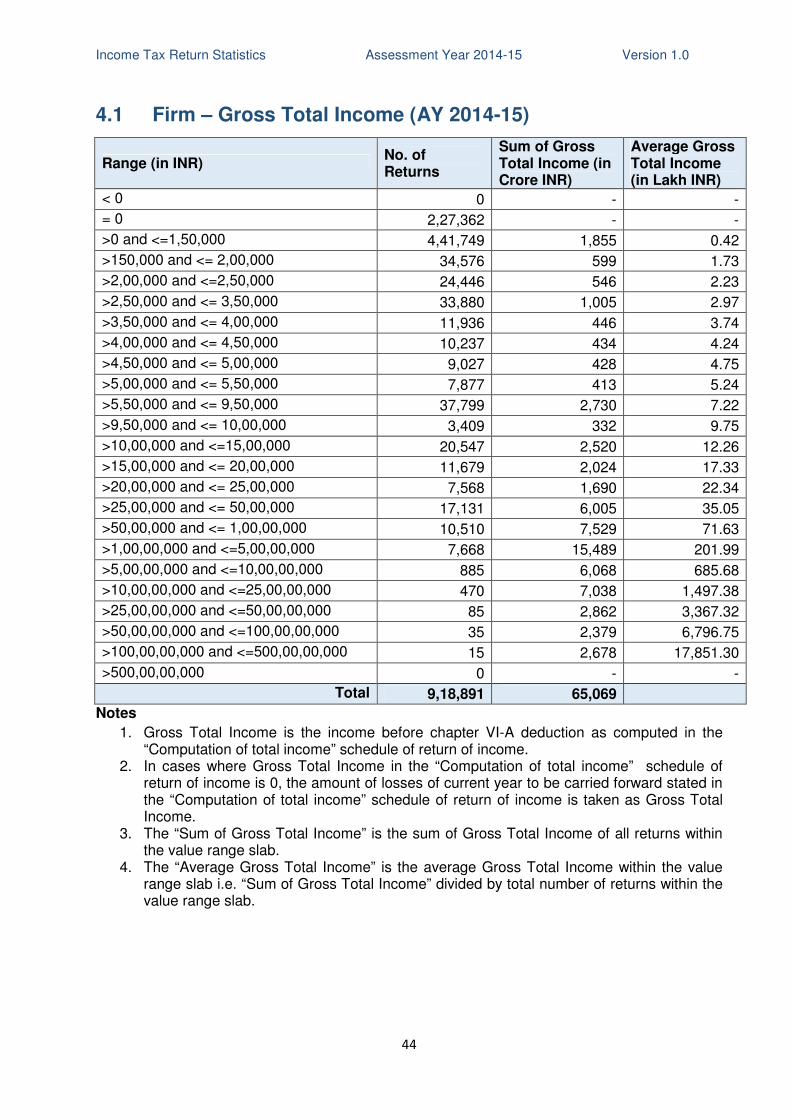
Income Tax Return Statistics Assessment Year 2014-15 Version 1.0
44
4.1 Firm – Gross Total Income (AY 2014-15)
Range (in INR) No. of Returns
Sum of Gross Total Income (in Crore INR)
Average Gross Total Income (in Lakh INR)
< 0 0 - -
= 0 2,27,362 - -
>0 and <=1,50,000 4,41,749 1,855 0.42
>150,000 and <= 2,00,000 34,576 599 1.73
>2,00,000 and <=2,50,000 24,446 546 2.23
>2,50,000 and <= 3,50,000 33,880 1,005 2.97
>3,50,000 and <= 4,00,000 11,936 446 3.74
>4,00,000 and <= 4,50,000 10,237 434 4.24
>4,50,000 and <= 5,00,000 9,027 428 4.75
>5,00,000 and <= 5,50,000 7,877 413 5.24
>5,50,000 and <= 9,50,000 37,799 2,730 7.22
>9,50,000 and <= 10,00,000 3,409 332 9.75
>10,00,000 and <=15,00,000 20,547 2,520 12.26
>15,00,000 and <= 20,00,000 11,679 2,024 17.33
>20,00,000 and <= 25,00,000 7,568 1,690 22.34
>25,00,000 and <= 50,00,000 17,131 6,005 35.05
>50,00,000 and <= 1,00,00,000 10,510 7,529 71.63
>1,00,00,000 and <=5,00,00,000 7,668 15,489 201.99
>5,00,00,000 and <=10,00,00,000 885 6,068 685.68
>10,00,00,000 and <=25,00,00,000 470 7,038 1,497.38
>25,00,00,000 and <=50,00,00,000 85 2,862 3,367.32
>50,00,00,000 and <=100,00,00,000 35 2,379 6,796.75
>100,00,00,000 and <=500,00,00,000 15 2,678 17,851.30
>500,00,00,000 0 - -
Total 9,18,891 65,069
Notes
1. Gross Total Income is the income before chapter VI-A deduction as computed in the “Computation of total income” schedule of return of income.
2. In cases where Gross Total Income in the “Computation of total income” schedule of return of income is 0, the amount of losses of current year to be carried forward stated in the “Computation of total income” schedule of return of income is taken as Gross Total Income.
3. The “Sum of Gross Total Income” is the sum of Gross Total Income of all returns within the value range slab.
4. The “Average Gross Total Income” is the average Gross Total Income within the value range slab i.e. “Sum of Gross Total Income” divided by total number of returns within the value range slab.
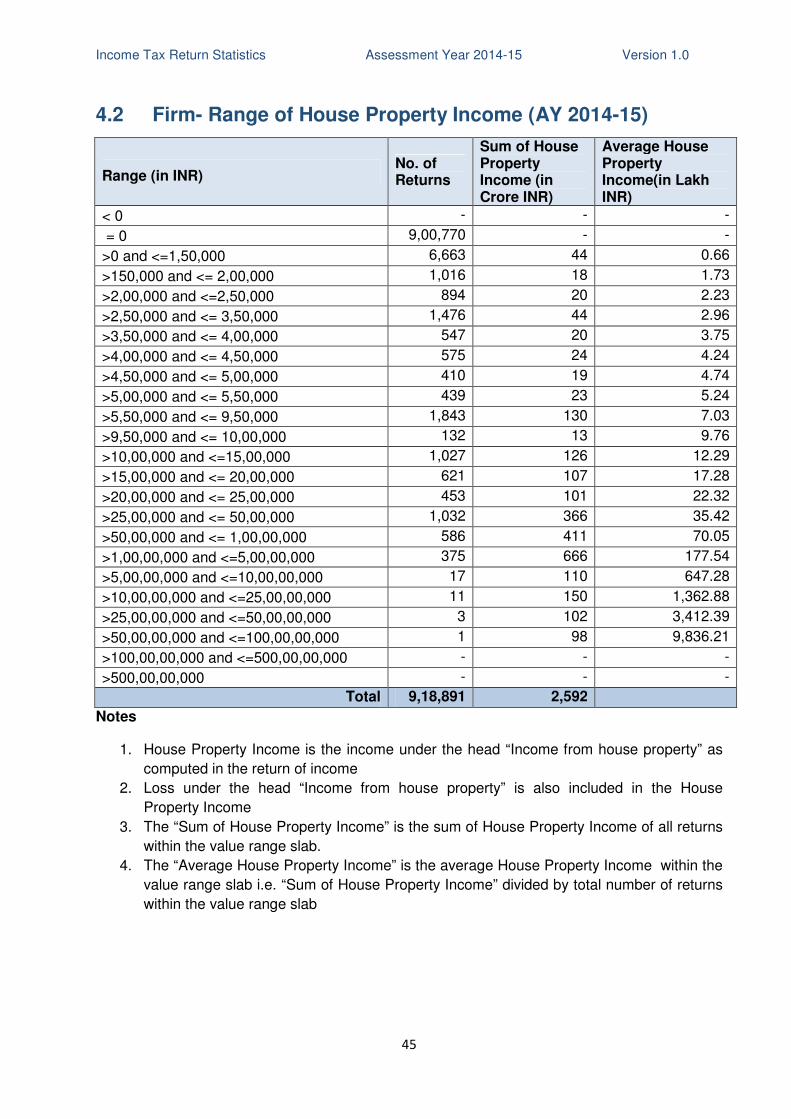
Income Tax Return Statistics Assessment Year 2014-15 Version 1.0
45
4.2 Firm- Range of House Property Income (AY 2014-15)
Range (in INR) No. of Returns
Sum of House Property Income (in Crore INR)
Average House Property Income(in Lakh INR)
< 0 - - -
= 0 9,00,770 - -
>0 and <=1,50,000 6,663 44 0.66
>150,000 and <= 2,00,000 1,016 18 1.73
>2,00,000 and <=2,50,000 894 20 2.23
>2,50,000 and <= 3,50,000 1,476 44 2.96
>3,50,000 and <= 4,00,000 547 20 3.75
>4,00,000 and <= 4,50,000 575 24 4.24
>4,50,000 and <= 5,00,000 410 19 4.74
>5,00,000 and <= 5,50,000 439 23 5.24
>5,50,000 and <= 9,50,000 1,843 130 7.03
>9,50,000 and <= 10,00,000 132 13 9.76
>10,00,000 and <=15,00,000 1,027 126 12.29
>15,00,000 and <= 20,00,000 621 107 17.28
>20,00,000 and <= 25,00,000 453 101 22.32
>25,00,000 and <= 50,00,000 1,032 366 35.42
>50,00,000 and <= 1,00,00,000 586 411 70.05
>1,00,00,000 and <=5,00,00,000 375 666 177.54
>5,00,00,000 and <=10,00,00,000 17 110 647.28
>10,00,00,000 and <=25,00,00,000 11 150 1,362.88
>25,00,00,000 and <=50,00,00,000 3 102 3,412.39
>50,00,00,000 and <=100,00,00,000 1 98 9,836.21
>100,00,00,000 and <=500,00,00,000 - - -
>500,00,00,000 - - -
Total 9,18,891 2,592
Notes
1. House Property Income is the income under the head “Income from house property” as
computed in the return of income
2. Loss under the head “Income from house property” is also included in the House
Property Income
3. The “Sum of House Property Income” is the sum of House Property Income of all returns
within the value range slab.
4. The “Average House Property Income” is the average House Property Income within the
value range slab i.e. “Sum of House Property Income” divided by total number of returns
within the value range slab

Income Tax Return Statistics Assessment Year 2014-15 Version 1.0
46
4.3 Firm- Range of Business Income (AY 2014-15)
Range (in INR) No. of Returns
Sum of Business Income (in Crore INR)
Average Business Income (in Lakh INR)
< 0 0 - -
= 0 2,21,139 - -
>0 and <=1,50,000 4,51,089 1,881 0.42
>150,000 and <= 2,00,000 34,929 605 1.73
>2,00,000 and <=2,50,000 24,742 553 2.23
>2,50,000 and <= 3,50,000 34,129 1,012 2.97
>3,50,000 and <= 4,00,000 11,972 448 3.74
>4,00,000 and <= 4,50,000 10,250 435 4.24
>4,50,000 and <= 5,00,000 9,024 428 4.75
>5,00,000 and <= 5,50,000 7,830 410 5.24
>5,50,000 and <= 9,50,000 37,475 2,707 7.22
>9,50,000 and <= 10,00,000 3,399 332 9.75
>10,00,000 and <=15,00,000 20,127 2,468 12.26
>15,00,000 and <= 20,00,000 11,275 1,952 17.31
>20,00,000 and <= 25,00,000 7,199 1,608 22.34
>25,00,000 and <= 50,00,000 16,224 5,682 35.02
>50,00,000 and <= 1,00,00,000 9,759 6,978 71.51
>1,00,00,000 and <=5,00,00,000 6,980 14,133 202.48
>5,00,00,000 and <=10,00,00,000 807 5,542 686.69
>10,00,00,000 and <=25,00,00,000 420 6,267 1,492.17
>25,00,00,000 and <=50,00,00,000 77 2,619 3,400.72
>50,00,00,000 and <=100,00,00,000 29 1,962 6,764.05
>100,00,00,000 and <=500,00,00,000 16 2,765 17,278.97
>500,00,00,000 0 - -
Total 9,18,891 60,785
Notes
1. Business Income is the income under the head “Profits and gains of business or
profession” as computed in the return of income
2. Loss under the head “Profits and gains of business or profession” is also included in the
Business Income
3. The “Sum of Business Income” is the sum of Business Income of all returns within the
value range slab.
4. The “Average Business Income” is the average Business Income within the value range
slab i.e. “Sum of Business Income” divided by total number of returns within the value
range slab

Income Tax Return Statistics Assessment Year 2014-15 Version 1.0
47
4.4 Firm- Range of Long Term Capital Gains (AY 2014-15)
Range (in INR) No. of Returns
Sum of Long Term Capital Gains Income (in Crore INR)
Average Long Term Capital Gains Income (in Lakh INR)
< 0 0 - -
= 0 9,16,812 - -
>0 and <=1,50,000 341 2 0.53
>150,000 and <= 2,00,000 56 1 1.78
>2,00,000 and <=2,50,000 47 1 2.24
>2,50,000 and <= 3,50,000 68 2 2.98
>3,50,000 and <= 4,00,000 35 1 3.72
>4,00,000 and <= 4,50,000 19 1 4.23
>4,50,000 and <= 5,00,000 38 2 4.76
>5,00,000 and <= 5,50,000 18 1 5.25
>5,50,000 and <= 9,50,000 176 13 7.40
>9,50,000 and <= 10,00,000 20 2 9.76
>10,00,000 and <=15,00,000 152 19 12.31
>15,00,000 and <= 20,00,000 114 20 17.31
>20,00,000 and <= 25,00,000 107 24 22.57
>25,00,000 and <= 50,00,000 290 104 35.79
>50,00,000 and <= 1,00,00,000 236 167 70.93
>1,00,00,000 and <=5,00,00,000 286 578 202.15
>5,00,00,000 and <=10,00,00,000 47 339 720.58
>10,00,00,000 and <=25,00,00,000 23 364 1,580.82
>25,00,00,000 and <=50,00,00,000 5 159 3,189.90
>50,00,00,000 and <=100,00,00,000 1 84 8,392.36
>100,00,00,000 and <=500,00,00,000 0 - -
>500,00,00,000 0 - -
Total 9,18,891 1,883
Notes
1. Long Term Capital Gains Income is the income from the transfer of long-term capital
asset(s) as computed in the return of income under the head “Capital Gains”
2. Loss from the transfer of long-term capital asset(s) under the head “Capital Gains” is also
included in the Long Term Capital Gains Income
3. The “Sum of Long Term Capital Gains Income” is the sum of Long Term Capital Gains
Income of all returns within the value range slab.
4. The “Average Long Term Capital Gains Income” is the average Long Term Capital Gains
Income within the value range slab i.e. “Sum of Long Term Capital Gains Income”
divided by total number of returns within the value range slab
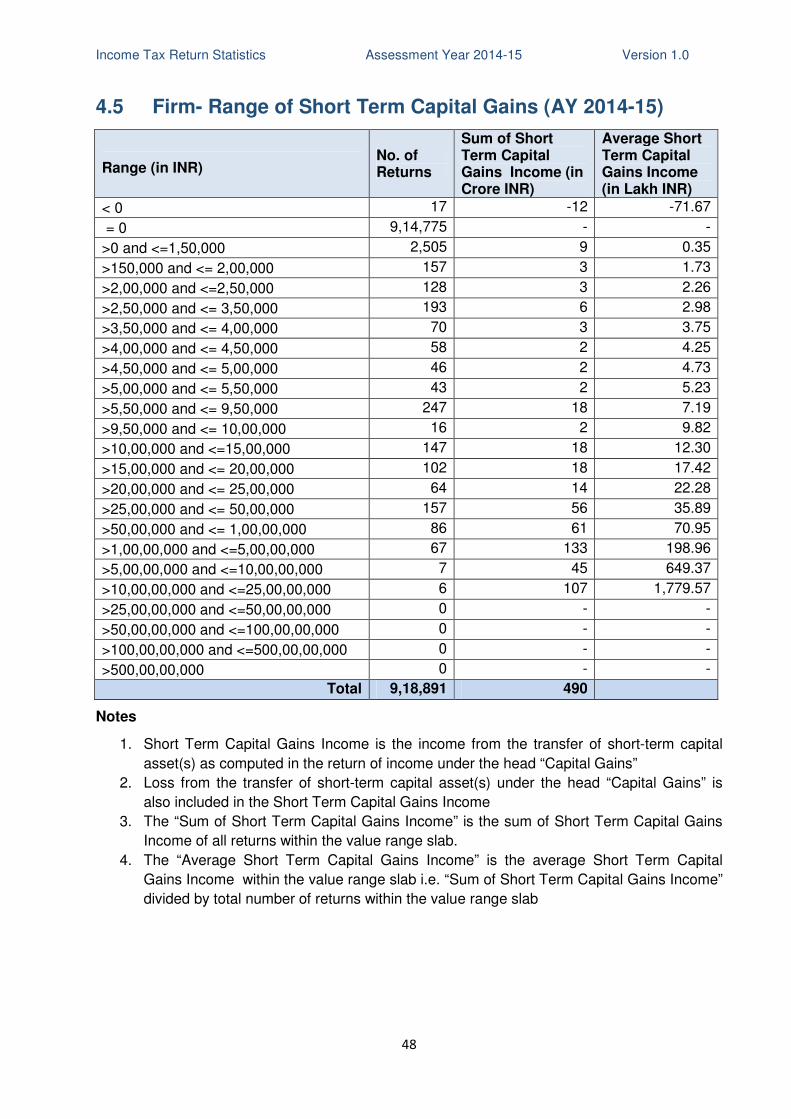
Income Tax Return Statistics Assessment Year 2014-15 Version 1.0
48
4.5 Firm- Range of Short Term Capital Gains (AY 2014-15)
Range (in INR) No. of Returns
Sum of Short Term Capital Gains Income (in Crore INR)
Average Short Term Capital Gains Income (in Lakh INR)
< 0 17 -12 -71.67
= 0 9,14,775 - -
>0 and <=1,50,000 2,505 9 0.35
>150,000 and <= 2,00,000 157 3 1.73
>2,00,000 and <=2,50,000 128 3 2.26
>2,50,000 and <= 3,50,000 193 6 2.98
>3,50,000 and <= 4,00,000 70 3 3.75
>4,00,000 and <= 4,50,000 58 2 4.25
>4,50,000 and <= 5,00,000 46 2 4.73
>5,00,000 and <= 5,50,000 43 2 5.23
>5,50,000 and <= 9,50,000 247 18 7.19
>9,50,000 and <= 10,00,000 16 2 9.82
>10,00,000 and <=15,00,000 147 18 12.30
>15,00,000 and <= 20,00,000 102 18 17.42
>20,00,000 and <= 25,00,000 64 14 22.28
>25,00,000 and <= 50,00,000 157 56 35.89
>50,00,000 and <= 1,00,00,000 86 61 70.95
>1,00,00,000 and <=5,00,00,000 67 133 198.96
>5,00,00,000 and <=10,00,00,000 7 45 649.37
>10,00,00,000 and <=25,00,00,000 6 107 1,779.57
>25,00,00,000 and <=50,00,00,000 0 - -
>50,00,00,000 and <=100,00,00,000 0 - -
>100,00,00,000 and <=500,00,00,000 0 - -
>500,00,00,000 0 - -
Total 9,18,891 490
Notes
1. Short Term Capital Gains Income is the income from the transfer of short-term capital
asset(s) as computed in the return of income under the head “Capital Gains”
2. Loss from the transfer of short-term capital asset(s) under the head “Capital Gains” is
also included in the Short Term Capital Gains Income
3. The “Sum of Short Term Capital Gains Income” is the sum of Short Term Capital Gains
Income of all returns within the value range slab.
4. The “Average Short Term Capital Gains Income” is the average Short Term Capital
Gains Income within the value range slab i.e. “Sum of Short Term Capital Gains Income”
divided by total number of returns within the value range slab
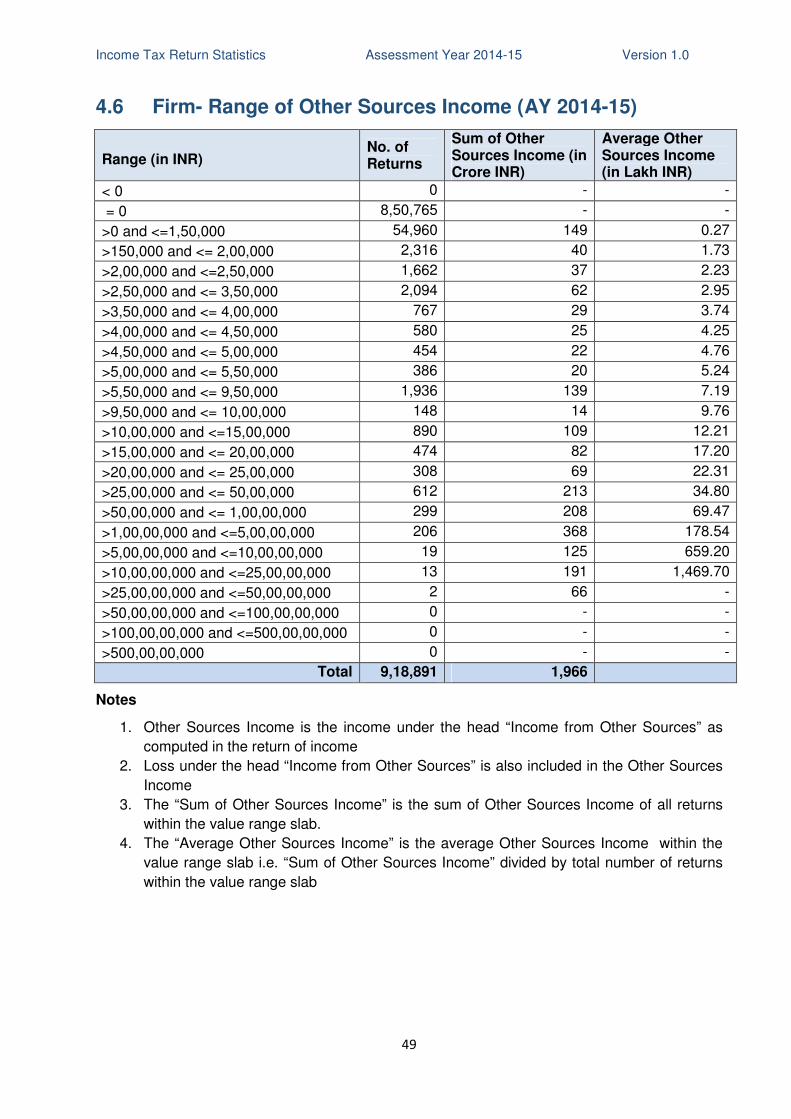
Income Tax Return Statistics Assessment Year 2014-15 Version 1.0
49
4.6 Firm- Range of Other Sources Income (AY 2014-15)
Range (in INR) No. of Returns
Sum of Other Sources Income (in Crore INR)
Average Other Sources Income (in Lakh INR)
< 0 0 - -
= 0 8,50,765 - -
>0 and <=1,50,000 54,960 149 0.27
>150,000 and <= 2,00,000 2,316 40 1.73
>2,00,000 and <=2,50,000 1,662 37 2.23
>2,50,000 and <= 3,50,000 2,094 62 2.95
>3,50,000 and <= 4,00,000 767 29 3.74
>4,00,000 and <= 4,50,000 580 25 4.25
>4,50,000 and <= 5,00,000 454 22 4.76
>5,00,000 and <= 5,50,000 386 20 5.24
>5,50,000 and <= 9,50,000 1,936 139 7.19
>9,50,000 and <= 10,00,000 148 14 9.76
>10,00,000 and <=15,00,000 890 109 12.21
>15,00,000 and <= 20,00,000 474 82 17.20
>20,00,000 and <= 25,00,000 308 69 22.31
>25,00,000 and <= 50,00,000 612 213 34.80
>50,00,000 and <= 1,00,00,000 299 208 69.47
>1,00,00,000 and <=5,00,00,000 206 368 178.54
>5,00,00,000 and <=10,00,00,000 19 125 659.20
>10,00,00,000 and <=25,00,00,000 13 191 1,469.70
>25,00,00,000 and <=50,00,00,000 2 66 -
>50,00,00,000 and <=100,00,00,000 0 - -
>100,00,00,000 and <=500,00,00,000 0 - -
>500,00,00,000 0 - -
Total 9,18,891 1,966
Notes
1. Other Sources Income is the income under the head “Income from Other Sources” as
computed in the return of income
2. Loss under the head “Income from Other Sources” is also included in the Other Sources
Income
3. The “Sum of Other Sources Income” is the sum of Other Sources Income of all returns
within the value range slab.
4. The “Average Other Sources Income” is the average Other Sources Income within the
value range slab i.e. “Sum of Other Sources Income” divided by total number of returns
within the value range slab
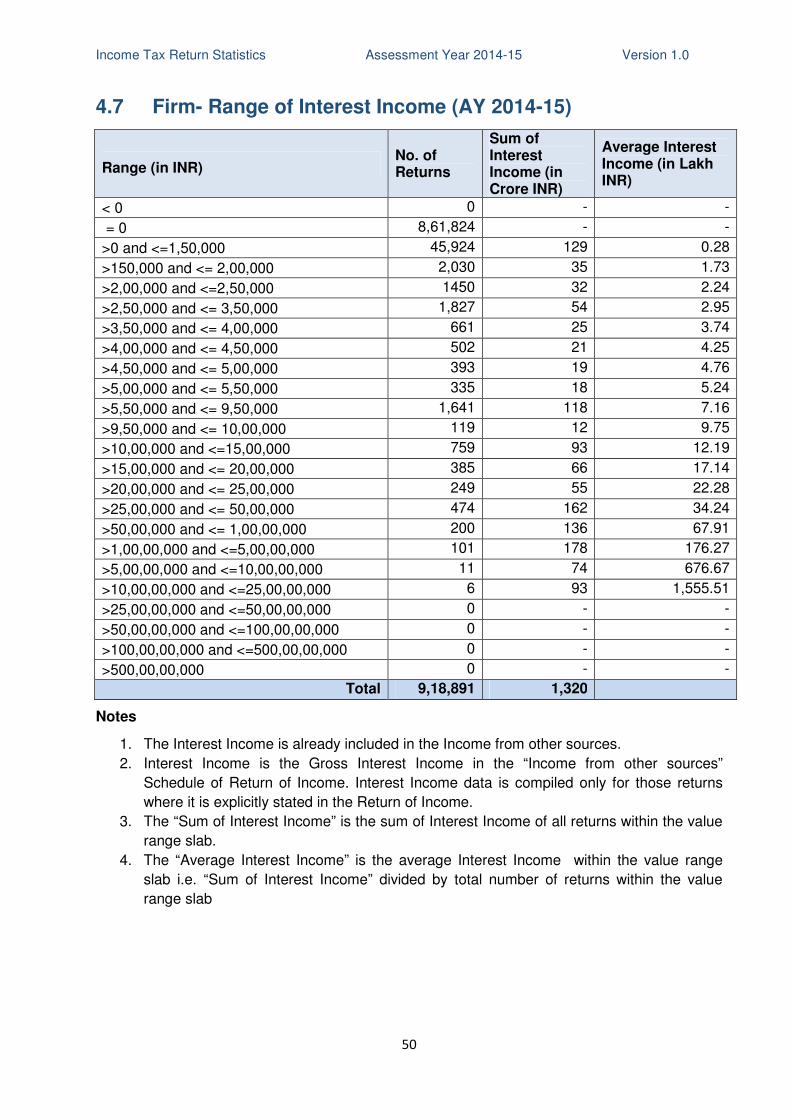
Income Tax Return Statistics Assessment Year 2014-15 Version 1.0
50
4.7 Firm- Range of Interest Income (AY 2014-15)
Range (in INR) No. of Returns
Sum of Interest Income (in Crore INR)
Average Interest Income (in Lakh INR)
< 0 0 - -
= 0 8,61,824 - -
>0 and <=1,50,000 45,924 129 0.28
>150,000 and <= 2,00,000 2,030 35 1.73
>2,00,000 and <=2,50,000 1450 32 2.24
>2,50,000 and <= 3,50,000 1,827 54 2.95
>3,50,000 and <= 4,00,000 661 25 3.74
>4,00,000 and <= 4,50,000 502 21 4.25
>4,50,000 and <= 5,00,000 393 19 4.76
>5,00,000 and <= 5,50,000 335 18 5.24
>5,50,000 and <= 9,50,000 1,641 118 7.16
>9,50,000 and <= 10,00,000 119 12 9.75
>10,00,000 and <=15,00,000 759 93 12.19
>15,00,000 and <= 20,00,000 385 66 17.14
>20,00,000 and <= 25,00,000 249 55 22.28
>25,00,000 and <= 50,00,000 474 162 34.24
>50,00,000 and <= 1,00,00,000 200 136 67.91
>1,00,00,000 and <=5,00,00,000 101 178 176.27
>5,00,00,000 and <=10,00,00,000 11 74 676.67
>10,00,00,000 and <=25,00,00,000 6 93 1,555.51
>25,00,00,000 and <=50,00,00,000 0 - -
>50,00,00,000 and <=100,00,00,000 0 - -
>100,00,00,000 and <=500,00,00,000 0 - -
>500,00,00,000 0 - -
Total 9,18,891 1,320
Notes
1. The Interest Income is already included in the Income from other sources.
2. Interest Income is the Gross Interest Income in the “Income from other sources”
Schedule of Return of Income. Interest Income data is compiled only for those returns
where it is explicitly stated in the Return of Income.
3. The “Sum of Interest Income” is the sum of Interest Income of all returns within the value
range slab.
4. The “Average Interest Income” is the average Interest Income within the value range
slab i.e. “Sum of Interest Income” divided by total number of returns within the value
range slab
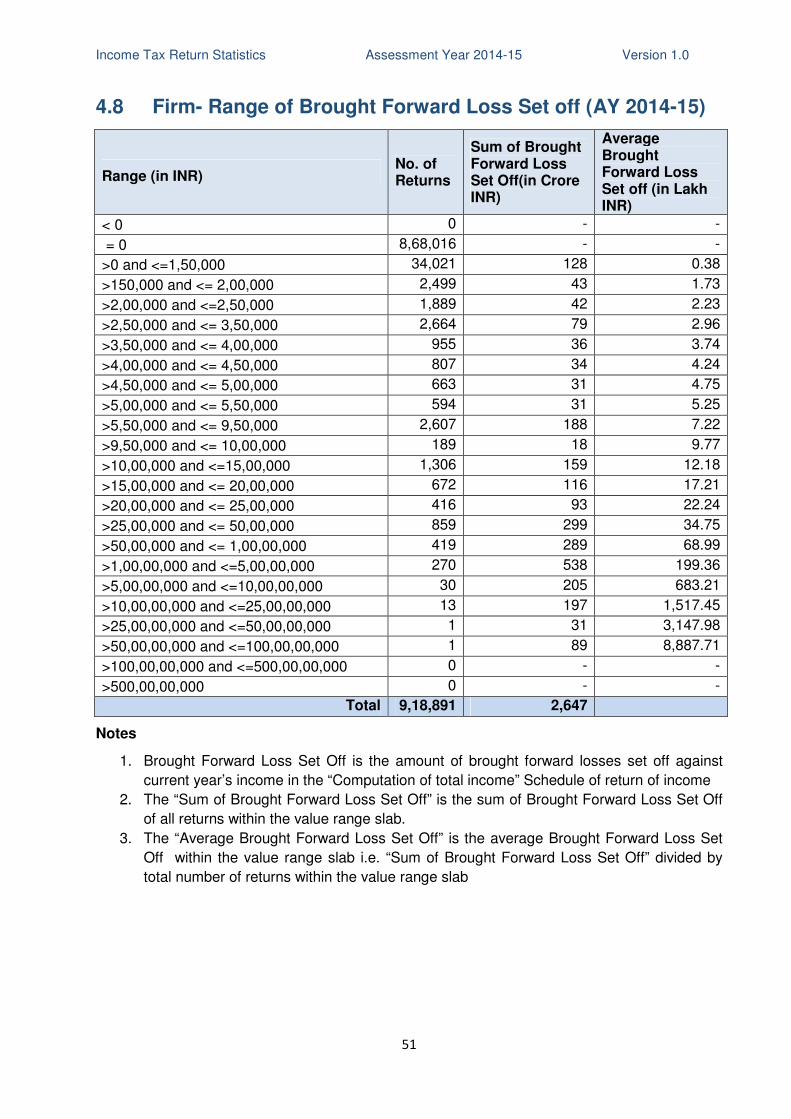
Income Tax Return Statistics Assessment Year 2014-15 Version 1.0
51
4.8 Firm- Range of Brought Forward Loss Set off (AY 2014-15)
Range (in INR) No. of Returns
Sum of Brought Forward Loss Set Off(in Crore INR)
Average Brought Forward Loss Set off (in Lakh INR)
< 0 0 - -
= 0 8,68,016 - -
>0 and <=1,50,000 34,021 128 0.38
>150,000 and <= 2,00,000 2,499 43 1.73
>2,00,000 and <=2,50,000 1,889 42 2.23
>2,50,000 and <= 3,50,000 2,664 79 2.96
>3,50,000 and <= 4,00,000 955 36 3.74
>4,00,000 and <= 4,50,000 807 34 4.24
>4,50,000 and <= 5,00,000 663 31 4.75
>5,00,000 and <= 5,50,000 594 31 5.25
>5,50,000 and <= 9,50,000 2,607 188 7.22
>9,50,000 and <= 10,00,000 189 18 9.77
>10,00,000 and <=15,00,000 1,306 159 12.18
>15,00,000 and <= 20,00,000 672 116 17.21
>20,00,000 and <= 25,00,000 416 93 22.24
>25,00,000 and <= 50,00,000 859 299 34.75
>50,00,000 and <= 1,00,00,000 419 289 68.99
>1,00,00,000 and <=5,00,00,000 270 538 199.36
>5,00,00,000 and <=10,00,00,000 30 205 683.21
>10,00,00,000 and <=25,00,00,000 13 197 1,517.45
>25,00,00,000 and <=50,00,00,000 1 31 3,147.98
>50,00,00,000 and <=100,00,00,000 1 89 8,887.71
>100,00,00,000 and <=500,00,00,000 0 - -
>500,00,00,000 0 - -
Total 9,18,891 2,647
Notes
1. Brought Forward Loss Set Off is the amount of brought forward losses set off against
current year’s income in the “Computation of total income” Schedule of return of income
2. The “Sum of Brought Forward Loss Set Off” is the sum of Brought Forward Loss Set Off
of all returns within the value range slab.
3. The “Average Brought Forward Loss Set Off” is the average Brought Forward Loss Set
Off within the value range slab i.e. “Sum of Brought Forward Loss Set Off” divided by
total number of returns within the value range slab
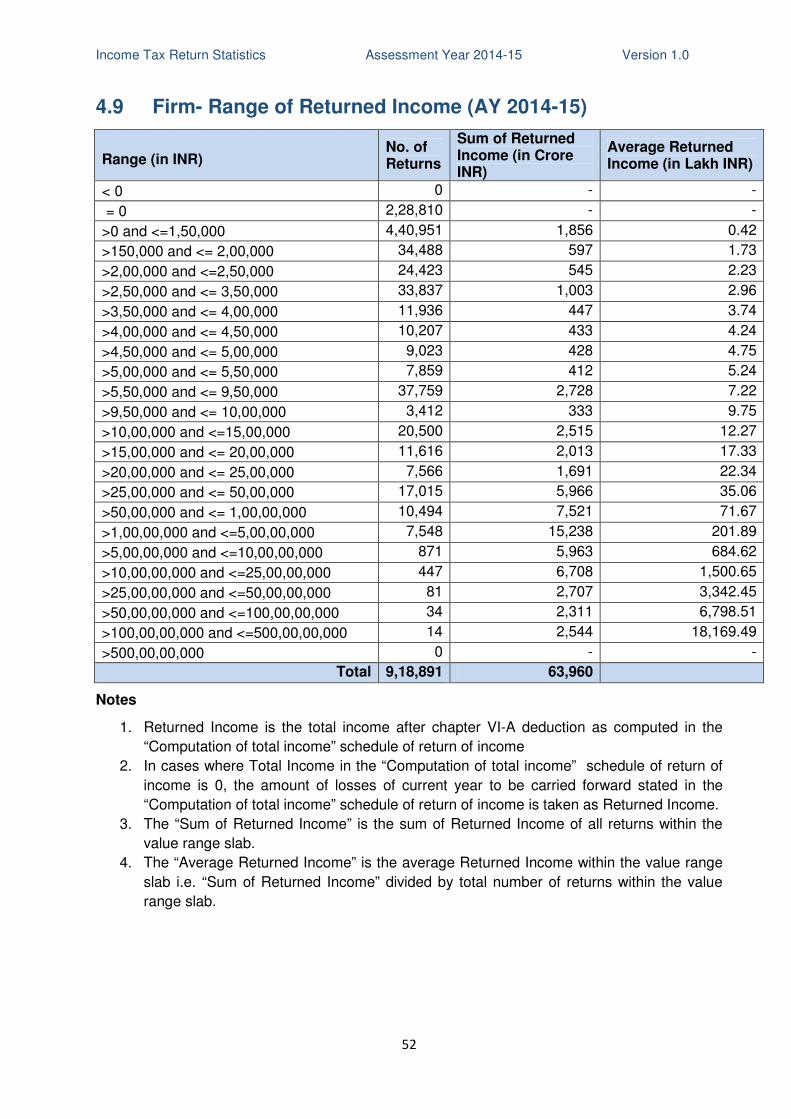
Income Tax Return Statistics Assessment Year 2014-15 Version 1.0
52
4.9 Firm- Range of Returned Income (AY 2014-15)
Range (in INR) No. of Returns
Sum of Returned Income (in Crore INR)
Average Returned Income (in Lakh INR)
< 0 0 - -
= 0 2,28,810 - -
>0 and <=1,50,000 4,40,951 1,856 0.42
>150,000 and <= 2,00,000 34,488 597 1.73
>2,00,000 and <=2,50,000 24,423 545 2.23
>2,50,000 and <= 3,50,000 33,837 1,003 2.96
>3,50,000 and <= 4,00,000 11,936 447 3.74
>4,00,000 and <= 4,50,000 10,207 433 4.24
>4,50,000 and <= 5,00,000 9,023 428 4.75
>5,00,000 and <= 5,50,000 7,859 412 5.24
>5,50,000 and <= 9,50,000 37,759 2,728 7.22
>9,50,000 and <= 10,00,000 3,412 333 9.75
>10,00,000 and <=15,00,000 20,500 2,515 12.27
>15,00,000 and <= 20,00,000 11,616 2,013 17.33
>20,00,000 and <= 25,00,000 7,566 1,691 22.34
>25,00,000 and <= 50,00,000 17,015 5,966 35.06
>50,00,000 and <= 1,00,00,000 10,494 7,521 71.67
>1,00,00,000 and <=5,00,00,000 7,548 15,238 201.89
>5,00,00,000 and <=10,00,00,000 871 5,963 684.62
>10,00,00,000 and <=25,00,00,000 447 6,708 1,500.65
>25,00,00,000 and <=50,00,00,000 81 2,707 3,342.45
>50,00,00,000 and <=100,00,00,000 34 2,311 6,798.51
>100,00,00,000 and <=500,00,00,000 14 2,544 18,169.49
>500,00,00,000 0 - -
Total 9,18,891 63,960
Notes
1. Returned Income is the total income after chapter VI-A deduction as computed in the
“Computation of total income” schedule of return of income
2. In cases where Total Income in the “Computation of total income” schedule of return of
income is 0, the amount of losses of current year to be carried forward stated in the
“Computation of total income” schedule of return of income is taken as Returned Income.
3. The “Sum of Returned Income” is the sum of Returned Income of all returns within the
value range slab.
4. The “Average Returned Income” is the average Returned Income within the value range
slab i.e. “Sum of Returned Income” divided by total number of returns within the value
range slab.

Income Tax Return Statistics Assessment Year 2014-15 Version 1.0
53
4.10 Firm- Range of Tax Payable (AY 2014-15)
Range (in INR) No. of Returns
Sum of Tax Payable(in Crore INR)
Average Tax Payable (in Lakh INR)
< 0 0 - -
= 0 2,29,521 - -
>0 and <=1,50,000 5,58,515 1,626 0.29
>150,000 and <= 2,00,000 23,232 402 1.73
>2,00,000 and <=2,50,000 15,918 355 2.23
>2,50,000 and <= 3,50,000 20,532 607 2.96
>3,50,000 and <= 4,00,000 6,838 256 3.74
>4,00,000 and <= 4,50,000 5,714 243 4.24
>4,50,000 and <= 5,00,000 4,906 233 4.74
>5,00,000 and <= 5,50,000 3,921 205 5.24
>5,50,000 and <= 9,50,000 18,497 1,329 7.18
>9,50,000 and <= 10,00,000 1,431 140 9.75
>10,00,000 and <=15,00,000 9,275 1,131 12.20
>15,00,000 and <= 20,00,000 5,038 869 17.24
>20,00,000 and <= 25,00,000 3,059 683 22.34
>25,00,000 and <= 50,00,000 6,237 2,126 34.09
>50,00,000 and <= 1,00,00,000 3,449 2,390 69.28
>1,00,00,000 and <=5,00,00,000 2,485 4,839 194.73
>5,00,00,000 and <=10,00,00,000 224 1,544 689.38
>10,00,00,000 and <=25,00,00,000 74 1,095 1,479.42
>25,00,00,000 and <=50,00,00,000 18 609 3,381.79
>50,00,00,000 and <=100,00,00,000 7 511 7,304.32
>100,00,00,000 and <=500,00,00,000 0 - -
>500,00,00,000 0 - -
Total 9,18,891 21,192
Notes
1. Tax Payable is the aggregate tax liability as computed in the “Computation of tax liability
on total income” schedule of return of income. Tax, surcharge, cess& interest after giving
credit u/s 115JAA and relief u/s 89/90/90A/91 but before giving credit for taxes
paid(advance tax/TDS/TCS/Self-Assessment Tax) constitute Tax Payable.
2. The “Sum of Tax Payable” is the sum of Tax Payable of all returns within the value range
slab.
3. The “Average Tax Payable” is the average Tax Payable within the value range slab i.e.
“Sum of Tax Payable” divided by total number of returns within the value range slab.
Income Tax Return Statistics Assessment Year 2014-15 Version 1.0
54
5. Income Tax Returns - AOP/BOI
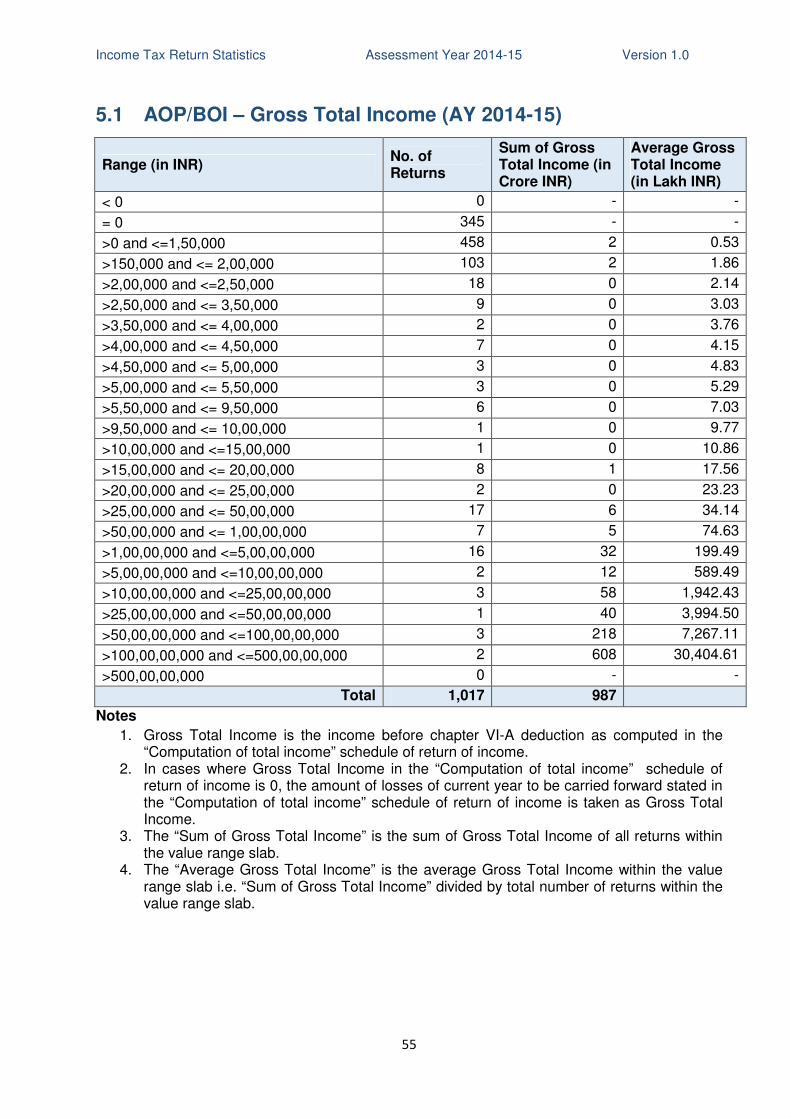
Income Tax Return Statistics Assessment Year 2014-15 Version 1.0
55
5.1 AOP/BOI – Gross Total Income (AY 2014-15)
Range (in INR) No. of Returns
Sum of Gross Total Income (in Crore INR)
Average Gross Total Income (in Lakh INR)
< 0 0 - -
= 0 345 - -
>0 and <=1,50,000 458 2 0.53
>150,000 and <= 2,00,000 103 2 1.86
>2,00,000 and <=2,50,000 18 0 2.14
>2,50,000 and <= 3,50,000 9 0 3.03
>3,50,000 and <= 4,00,000 2 0 3.76
>4,00,000 and <= 4,50,000 7 0 4.15
>4,50,000 and <= 5,00,000 3 0 4.83
>5,00,000 and <= 5,50,000 3 0 5.29
>5,50,000 and <= 9,50,000 6 0 7.03
>9,50,000 and <= 10,00,000 1 0 9.77
>10,00,000 and <=15,00,000 1 0 10.86
>15,00,000 and <= 20,00,000 8 1 17.56
>20,00,000 and <= 25,00,000 2 0 23.23
>25,00,000 and <= 50,00,000 17 6 34.14
>50,00,000 and <= 1,00,00,000 7 5 74.63
>1,00,00,000 and <=5,00,00,000 16 32 199.49
>5,00,00,000 and <=10,00,00,000 2 12 589.49
>10,00,00,000 and <=25,00,00,000 3 58 1,942.43
>25,00,00,000 and <=50,00,00,000 1 40 3,994.50
>50,00,00,000 and <=100,00,00,000 3 218 7,267.11
>100,00,00,000 and <=500,00,00,000 2 608 30,404.61
>500,00,00,000 0 - -
Total 1,017 987
Notes
1. Gross Total Income is the income before chapter VI-A deduction as computed in the “Computation of total income” schedule of return of income.
2. In cases where Gross Total Income in the “Computation of total income” schedule of return of income is 0, the amount of losses of current year to be carried forward stated in the “Computation of total income” schedule of return of income is taken as Gross Total Income.
3. The “Sum of Gross Total Income” is the sum of Gross Total Income of all returns within the value range slab.
4. The “Average Gross Total Income” is the average Gross Total Income within the value range slab i.e. “Sum of Gross Total Income” divided by total number of returns within the value range slab.
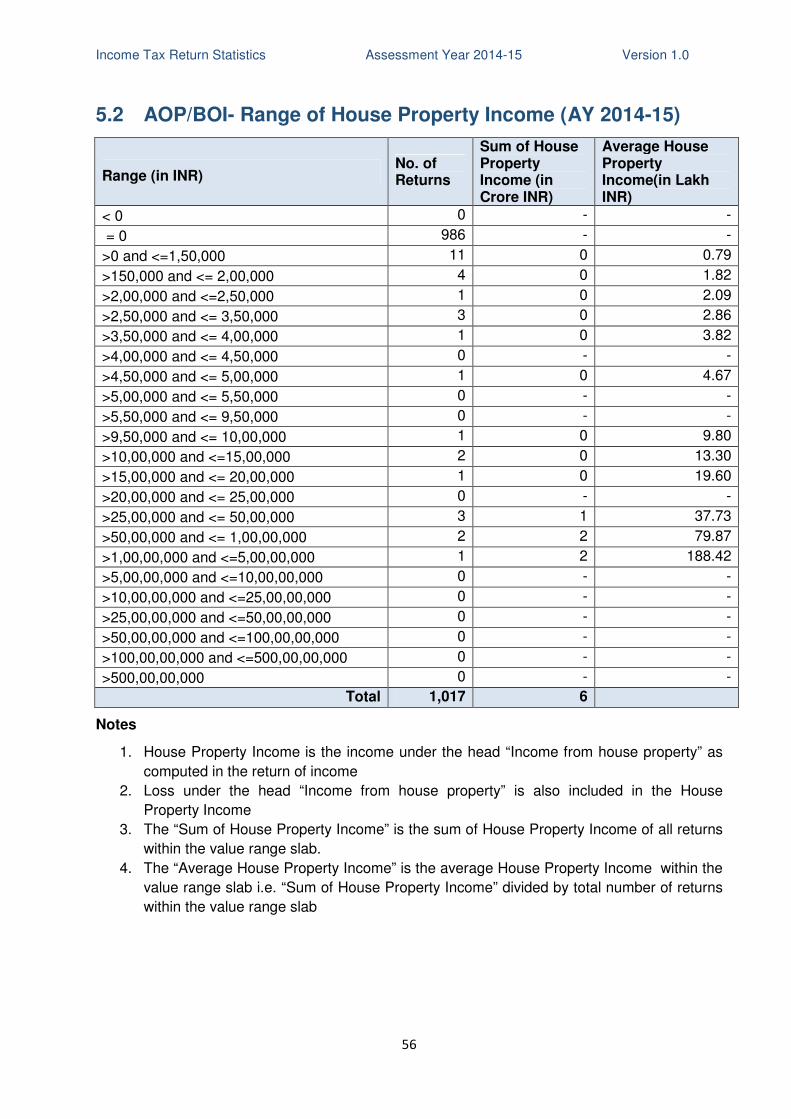
Income Tax Return Statistics Assessment Year 2014-15 Version 1.0
56
5.2 AOP/BOI- Range of House Property Income (AY 2014-15)
Range (in INR) No. of Returns
Sum of House Property Income (in Crore INR)
Average House Property Income(in Lakh INR)
< 0 0 - -
= 0 986 - -
>0 and <=1,50,000 11 0 0.79
>150,000 and <= 2,00,000 4 0 1.82
>2,00,000 and <=2,50,000 1 0 2.09
>2,50,000 and <= 3,50,000 3 0 2.86
>3,50,000 and <= 4,00,000 1 0 3.82
>4,00,000 and <= 4,50,000 0 - -
>4,50,000 and <= 5,00,000 1 0 4.67
>5,00,000 and <= 5,50,000 0 - -
>5,50,000 and <= 9,50,000 0 - -
>9,50,000 and <= 10,00,000 1 0 9.80
>10,00,000 and <=15,00,000 2 0 13.30
>15,00,000 and <= 20,00,000 1 0 19.60
>20,00,000 and <= 25,00,000 0 - -
>25,00,000 and <= 50,00,000 3 1 37.73
>50,00,000 and <= 1,00,00,000 2 2 79.87
>1,00,00,000 and <=5,00,00,000 1 2 188.42
>5,00,00,000 and <=10,00,00,000 0 - -
>10,00,00,000 and <=25,00,00,000 0 - -
>25,00,00,000 and <=50,00,00,000 0 - -
>50,00,00,000 and <=100,00,00,000 0 - -
>100,00,00,000 and <=500,00,00,000 0 - -
>500,00,00,000 0 - -
Total 1,017 6
Notes
1. House Property Income is the income under the head “Income from house property” as
computed in the return of income
2. Loss under the head “Income from house property” is also included in the House
Property Income
3. The “Sum of House Property Income” is the sum of House Property Income of all returns
within the value range slab.
4. The “Average House Property Income” is the average House Property Income within the
value range slab i.e. “Sum of House Property Income” divided by total number of returns
within the value range slab
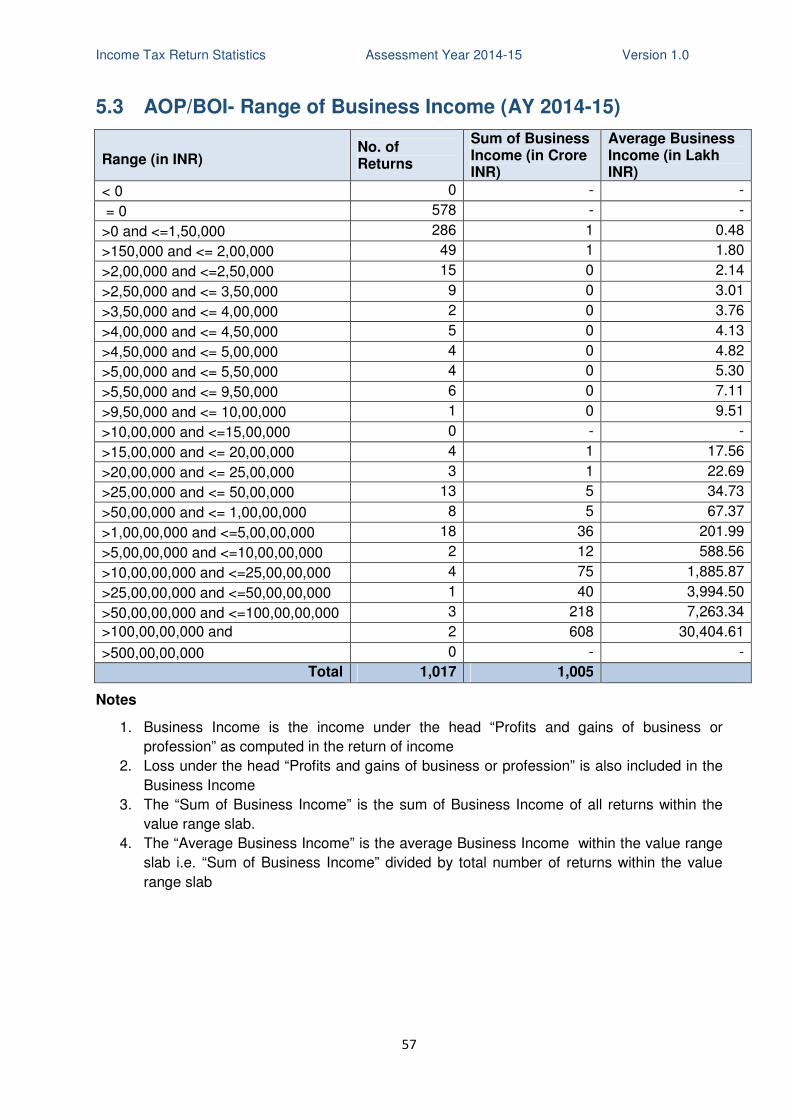
Income Tax Return Statistics Assessment Year 2014-15 Version 1.0
57
5.3 AOP/BOI- Range of Business Income (AY 2014-15)
Range (in INR) No. of Returns
Sum of Business Income (in Crore INR)
Average Business Income (in Lakh INR)
< 0 0 - -
= 0 578 - -
>0 and <=1,50,000 286 1 0.48
>150,000 and <= 2,00,000 49 1 1.80
>2,00,000 and <=2,50,000 15 0 2.14
>2,50,000 and <= 3,50,000 9 0 3.01
>3,50,000 and <= 4,00,000 2 0 3.76
>4,00,000 and <= 4,50,000 5 0 4.13
>4,50,000 and <= 5,00,000 4 0 4.82
>5,00,000 and <= 5,50,000 4 0 5.30
>5,50,000 and <= 9,50,000 6 0 7.11
>9,50,000 and <= 10,00,000 1 0 9.51
>10,00,000 and <=15,00,000 0 - -
>15,00,000 and <= 20,00,000 4 1 17.56
>20,00,000 and <= 25,00,000 3 1 22.69
>25,00,000 and <= 50,00,000 13 5 34.73
>50,00,000 and <= 1,00,00,000 8 5 67.37
>1,00,00,000 and <=5,00,00,000 18 36 201.99
>5,00,00,000 and <=10,00,00,000 2 12 588.56
>10,00,00,000 and <=25,00,00,000 4 75 1,885.87
>25,00,00,000 and <=50,00,00,000 1 40 3,994.50
>50,00,00,000 and <=100,00,00,000 3 218 7,263.34
>100,00,00,000 and <=500,00,00,000
2 608 30,404.61
>500,00,00,000 0 - -
Total 1,017 1,005
Notes
1. Business Income is the income under the head “Profits and gains of business or
profession” as computed in the return of income
2. Loss under the head “Profits and gains of business or profession” is also included in the
Business Income
3. The “Sum of Business Income” is the sum of Business Income of all returns within the
value range slab.
4. The “Average Business Income” is the average Business Income within the value range
slab i.e. “Sum of Business Income” divided by total number of returns within the value
range slab
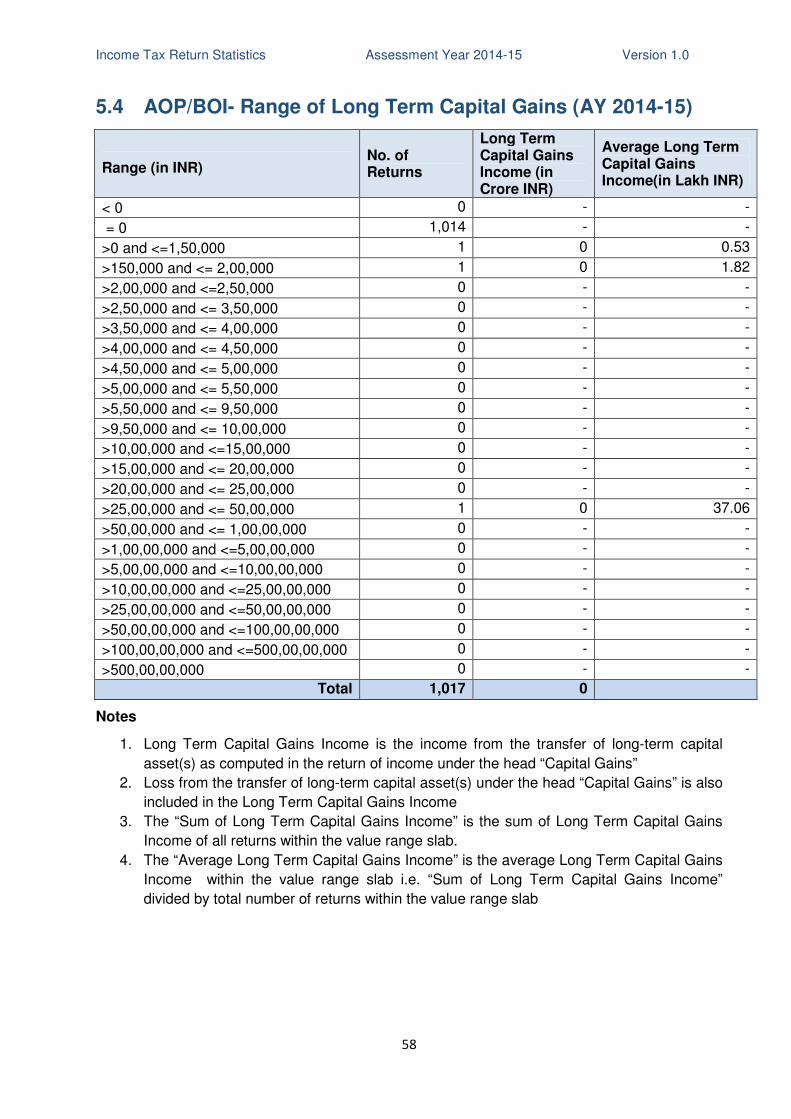
Income Tax Return Statistics Assessment Year 2014-15 Version 1.0
58
5.4 AOP/BOI- Range of Long Term Capital Gains (AY 2014-15)
Range (in INR) No. of Returns
Long Term Capital Gains Income (in Crore INR)
Average Long Term Capital Gains Income(in Lakh INR)
< 0 0 - -
= 0 1,014 - -
>0 and <=1,50,000 1 0 0.53
>150,000 and <= 2,00,000 1 0 1.82
>2,00,000 and <=2,50,000 0 - -
>2,50,000 and <= 3,50,000 0 - -
>3,50,000 and <= 4,00,000 0 - -
>4,00,000 and <= 4,50,000 0 - -
>4,50,000 and <= 5,00,000 0 - -
>5,00,000 and <= 5,50,000 0 - -
>5,50,000 and <= 9,50,000 0 - -
>9,50,000 and <= 10,00,000 0 - -
>10,00,000 and <=15,00,000 0 - -
>15,00,000 and <= 20,00,000 0 - -
>20,00,000 and <= 25,00,000 0 - -
>25,00,000 and <= 50,00,000 1 0 37.06
>50,00,000 and <= 1,00,00,000 0 - -
>1,00,00,000 and <=5,00,00,000 0 - -
>5,00,00,000 and <=10,00,00,000 0 - -
>10,00,00,000 and <=25,00,00,000 0 - -
>25,00,00,000 and <=50,00,00,000 0 - -
>50,00,00,000 and <=100,00,00,000 0 - -
>100,00,00,000 and <=500,00,00,000 0 - -
>500,00,00,000 0 - -
Total 1,017 0
Notes
1. Long Term Capital Gains Income is the income from the transfer of long-term capital
asset(s) as computed in the return of income under the head “Capital Gains”
2. Loss from the transfer of long-term capital asset(s) under the head “Capital Gains” is also
included in the Long Term Capital Gains Income
3. The “Sum of Long Term Capital Gains Income” is the sum of Long Term Capital Gains
Income of all returns within the value range slab.
4. The “Average Long Term Capital Gains Income” is the average Long Term Capital Gains
Income within the value range slab i.e. “Sum of Long Term Capital Gains Income”
divided by total number of returns within the value range slab
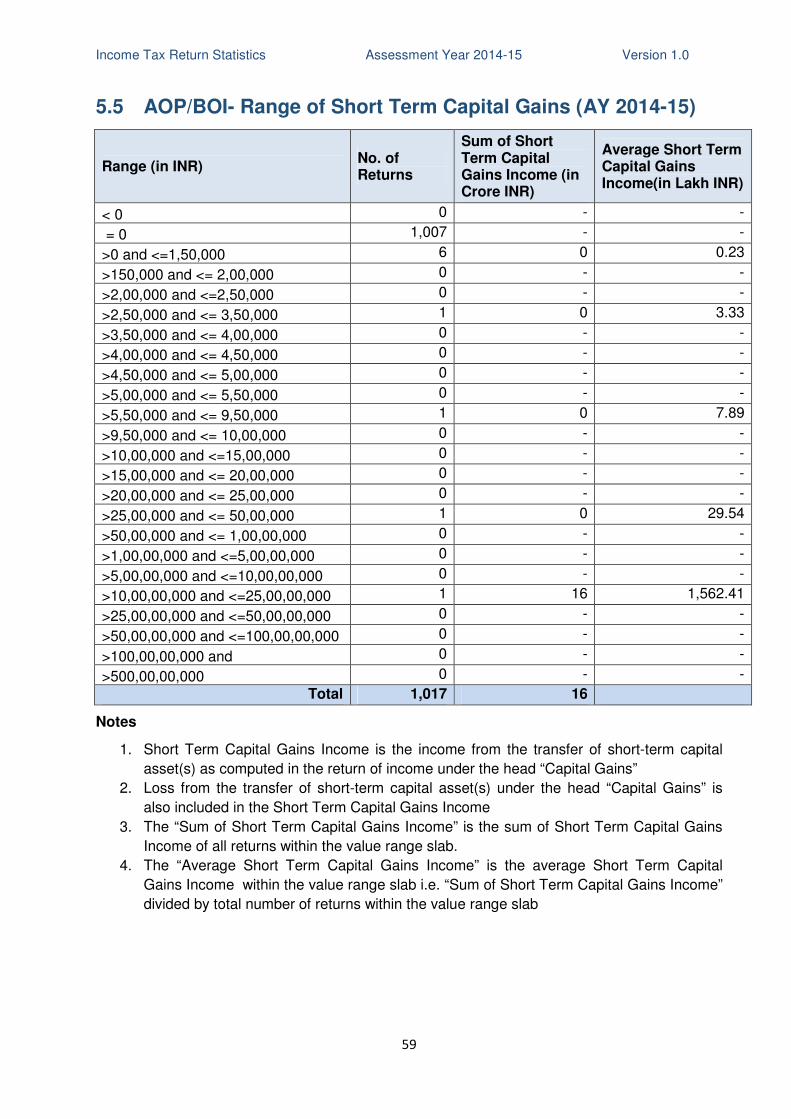
Income Tax Return Statistics Assessment Year 2014-15 Version 1.0
59
5.5 AOP/BOI- Range of Short Term Capital Gains (AY 2014-15)
Range (in INR) No. of Returns
Sum of Short Term Capital Gains Income (in Crore INR)
Average Short Term Capital Gains Income(in Lakh INR)
< 0 0 - -
= 0 1,007 - -
>0 and <=1,50,000 6 0 0.23
>150,000 and <= 2,00,000 0 - -
>2,00,000 and <=2,50,000 0 - -
>2,50,000 and <= 3,50,000 1 0 3.33
>3,50,000 and <= 4,00,000 0 - -
>4,00,000 and <= 4,50,000 0 - -
>4,50,000 and <= 5,00,000 0 - -
>5,00,000 and <= 5,50,000 0 - -
>5,50,000 and <= 9,50,000 1 0 7.89
>9,50,000 and <= 10,00,000 0 - -
>10,00,000 and <=15,00,000 0 - -
>15,00,000 and <= 20,00,000 0 - -
>20,00,000 and <= 25,00,000 0 - -
>25,00,000 and <= 50,00,000 1 0 29.54
>50,00,000 and <= 1,00,00,000 0 - -
>1,00,00,000 and <=5,00,00,000 0 - -
>5,00,00,000 and <=10,00,00,000 0 - -
>10,00,00,000 and <=25,00,00,000 1 16 1,562.41
>25,00,00,000 and <=50,00,00,000 0 - -
>50,00,00,000 and <=100,00,00,000 0 - -
>100,00,00,000 and 0 - -
>500,00,00,000 0 - -
Total 1,017 16
Notes
1. Short Term Capital Gains Income is the income from the transfer of short-term capital
asset(s) as computed in the return of income under the head “Capital Gains”
2. Loss from the transfer of short-term capital asset(s) under the head “Capital Gains” is
also included in the Short Term Capital Gains Income
3. The “Sum of Short Term Capital Gains Income” is the sum of Short Term Capital Gains
Income of all returns within the value range slab.
4. The “Average Short Term Capital Gains Income” is the average Short Term Capital
Gains Income within the value range slab i.e. “Sum of Short Term Capital Gains Income”
divided by total number of returns within the value range slab
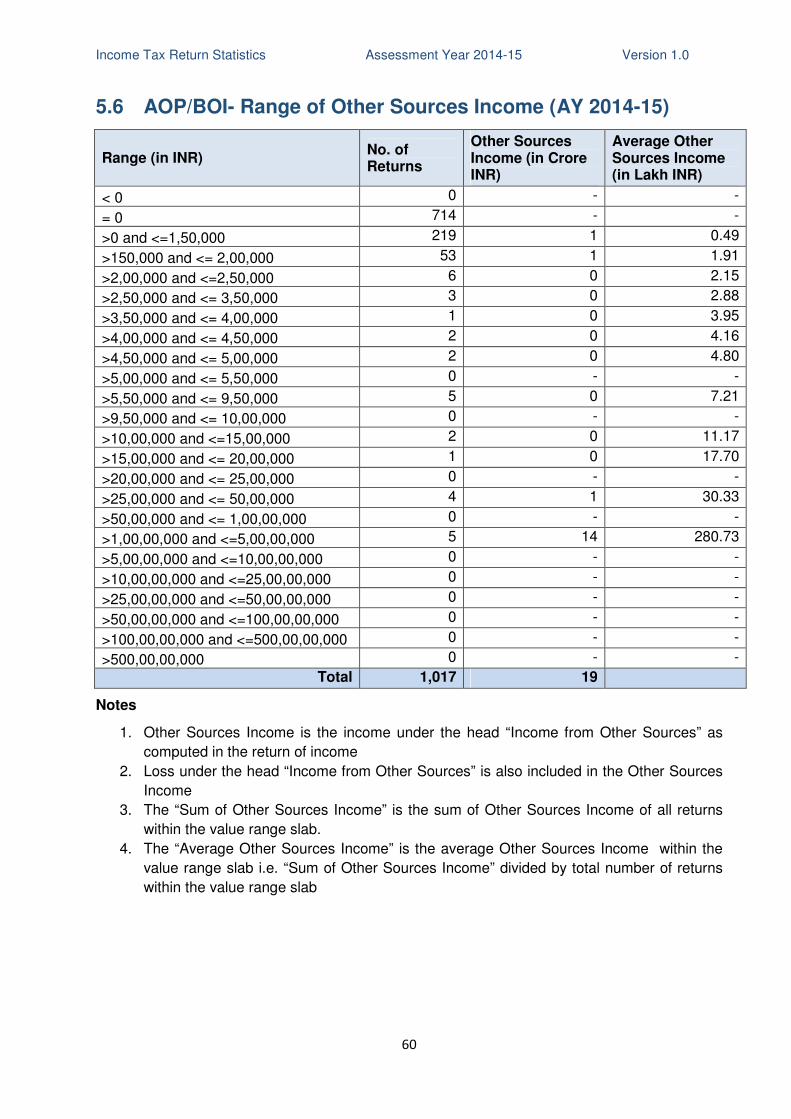
Income Tax Return Statistics Assessment Year 2014-15 Version 1.0
60
5.6 AOP/BOI- Range of Other Sources Income (AY 2014-15)
Range (in INR) No. of Returns
Other Sources Income (in Crore INR)
Average Other Sources Income (in Lakh INR)
< 0 0 - -
= 0 714 - -
>0 and <=1,50,000 219 1 0.49
>150,000 and <= 2,00,000 53 1 1.91
>2,00,000 and <=2,50,000 6 0 2.15
>2,50,000 and <= 3,50,000 3 0 2.88
>3,50,000 and <= 4,00,000 1 0 3.95
>4,00,000 and <= 4,50,000 2 0 4.16
>4,50,000 and <= 5,00,000 2 0 4.80
>5,00,000 and <= 5,50,000 0 - -
>5,50,000 and <= 9,50,000 5 0 7.21
>9,50,000 and <= 10,00,000 0 - -
>10,00,000 and <=15,00,000 2 0 11.17
>15,00,000 and <= 20,00,000 1 0 17.70
>20,00,000 and <= 25,00,000 0 - -
>25,00,000 and <= 50,00,000 4 1 30.33
>50,00,000 and <= 1,00,00,000 0 - -
>1,00,00,000 and <=5,00,00,000 5 14 280.73
>5,00,00,000 and <=10,00,00,000 0 - -
>10,00,00,000 and <=25,00,00,000 0 - -
>25,00,00,000 and <=50,00,00,000 0 - -
>50,00,00,000 and <=100,00,00,000 0 - -
>100,00,00,000 and <=500,00,00,000 0 - -
>500,00,00,000 0 - -
Total 1,017 19
Notes
1. Other Sources Income is the income under the head “Income from Other Sources” as
computed in the return of income
2. Loss under the head “Income from Other Sources” is also included in the Other Sources
Income
3. The “Sum of Other Sources Income” is the sum of Other Sources Income of all returns
within the value range slab.
4. The “Average Other Sources Income” is the average Other Sources Income within the
value range slab i.e. “Sum of Other Sources Income” divided by total number of returns
within the value range slab
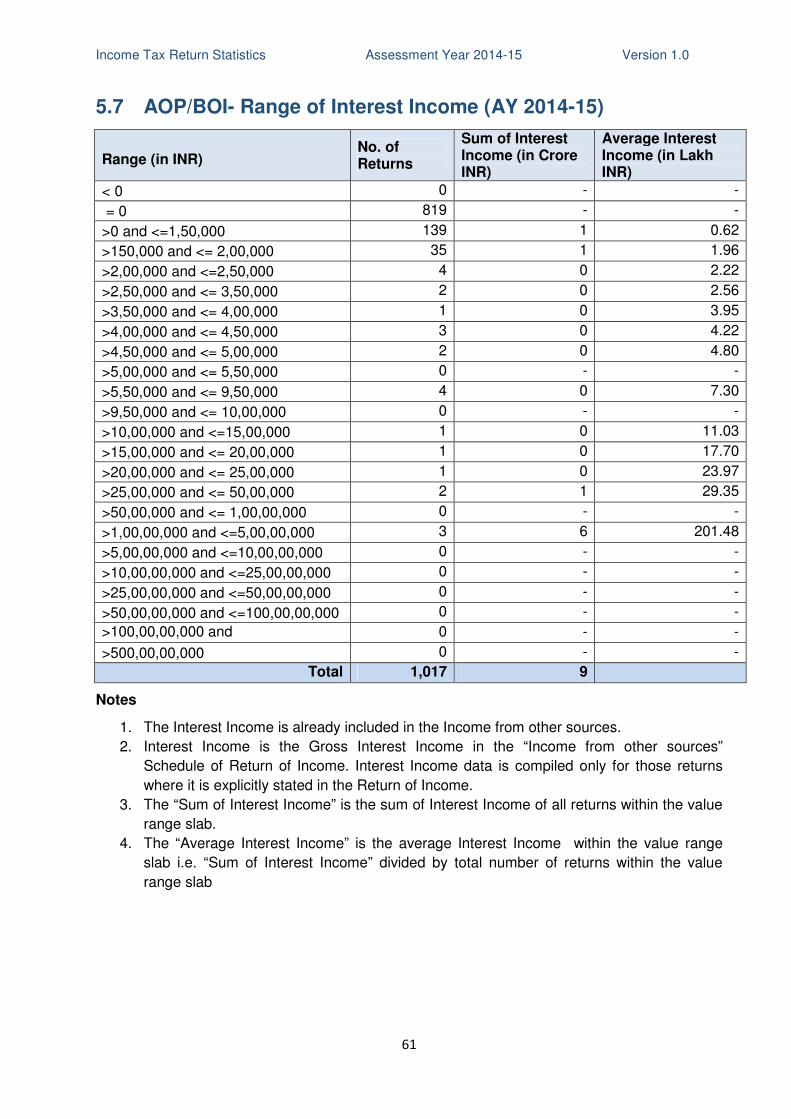
Income Tax Return Statistics Assessment Year 2014-15 Version 1.0
61
5.7 AOP/BOI- Range of Interest Income (AY 2014-15)
Range (in INR) No. of Returns
Sum of Interest Income (in Crore INR)
Average Interest Income (in Lakh INR)
< 0 0 - -
= 0 819 - -
>0 and <=1,50,000 139 1 0.62
>150,000 and <= 2,00,000 35 1 1.96
>2,00,000 and <=2,50,000 4 0 2.22
>2,50,000 and <= 3,50,000 2 0 2.56
>3,50,000 and <= 4,00,000 1 0 3.95
>4,00,000 and <= 4,50,000 3 0 4.22
>4,50,000 and <= 5,00,000 2 0 4.80
>5,00,000 and <= 5,50,000 0 - -
>5,50,000 and <= 9,50,000 4 0 7.30
>9,50,000 and <= 10,00,000 0 - -
>10,00,000 and <=15,00,000 1 0 11.03
>15,00,000 and <= 20,00,000 1 0 17.70
>20,00,000 and <= 25,00,000 1 0 23.97
>25,00,000 and <= 50,00,000 2 1 29.35
>50,00,000 and <= 1,00,00,000 0 - -
>1,00,00,000 and <=5,00,00,000 3 6 201.48
>5,00,00,000 and <=10,00,00,000 0 - -
>10,00,00,000 and <=25,00,00,000 0 - -
>25,00,00,000 and <=50,00,00,000 0 - -
>50,00,00,000 and <=100,00,00,000 0 - -
>100,00,00,000 and <=500,00,00,000
0 - -
>500,00,00,000 0 - -
Total 1,017 9
Notes
1. The Interest Income is already included in the Income from other sources.
2. Interest Income is the Gross Interest Income in the “Income from other sources”
Schedule of Return of Income. Interest Income data is compiled only for those returns
where it is explicitly stated in the Return of Income.
3. The “Sum of Interest Income” is the sum of Interest Income of all returns within the value
range slab.
4. The “Average Interest Income” is the average Interest Income within the value range
slab i.e. “Sum of Interest Income” divided by total number of returns within the value
range slab
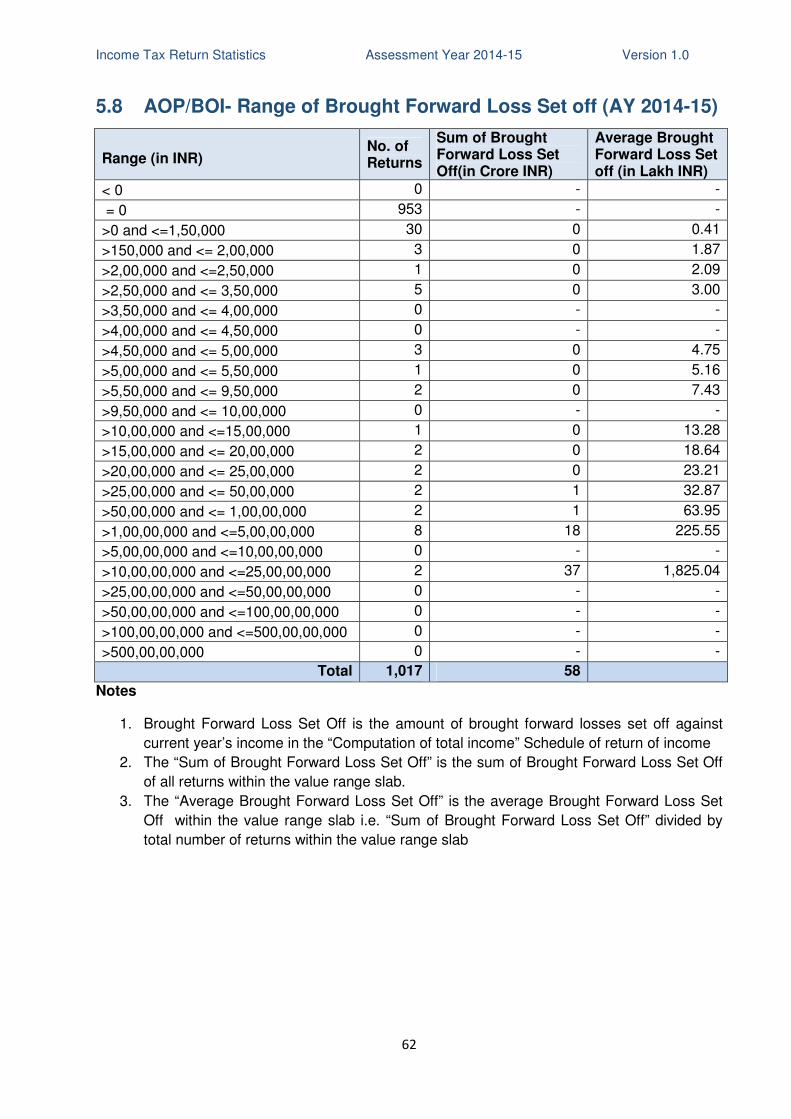
Income Tax Return Statistics Assessment Year 2014-15 Version 1.0
62
5.8 AOP/BOI- Range of Brought Forward Loss Set off (AY 2014-15)
Range (in INR) No. of Returns
Sum of Brought Forward Loss Set Off(in Crore INR)
Average Brought Forward Loss Set off (in Lakh INR)
< 0 0 - -
= 0 953 - -
>0 and <=1,50,000 30 0 0.41
>150,000 and <= 2,00,000 3 0 1.87
>2,00,000 and <=2,50,000 1 0 2.09
>2,50,000 and <= 3,50,000 5 0 3.00
>3,50,000 and <= 4,00,000 0 - -
>4,00,000 and <= 4,50,000 0 - -
>4,50,000 and <= 5,00,000 3 0 4.75
>5,00,000 and <= 5,50,000 1 0 5.16
>5,50,000 and <= 9,50,000 2 0 7.43
>9,50,000 and <= 10,00,000 0 - -
>10,00,000 and <=15,00,000 1 0 13.28
>15,00,000 and <= 20,00,000 2 0 18.64
>20,00,000 and <= 25,00,000 2 0 23.21
>25,00,000 and <= 50,00,000 2 1 32.87
>50,00,000 and <= 1,00,00,000 2 1 63.95
>1,00,00,000 and <=5,00,00,000 8 18 225.55
>5,00,00,000 and <=10,00,00,000 0 - -
>10,00,00,000 and <=25,00,00,000 2 37 1,825.04
>25,00,00,000 and <=50,00,00,000 0 - -
>50,00,00,000 and <=100,00,00,000 0 - -
>100,00,00,000 and <=500,00,00,000 0 - -
>500,00,00,000 0 - -
Total 1,017 58
Notes
1. Brought Forward Loss Set Off is the amount of brought forward losses set off against
current year’s income in the “Computation of total income” Schedule of return of income
2. The “Sum of Brought Forward Loss Set Off” is the sum of Brought Forward Loss Set Off
of all returns within the value range slab.
3. The “Average Brought Forward Loss Set Off” is the average Brought Forward Loss Set
Off within the value range slab i.e. “Sum of Brought Forward Loss Set Off” divided by
total number of returns within the value range slab
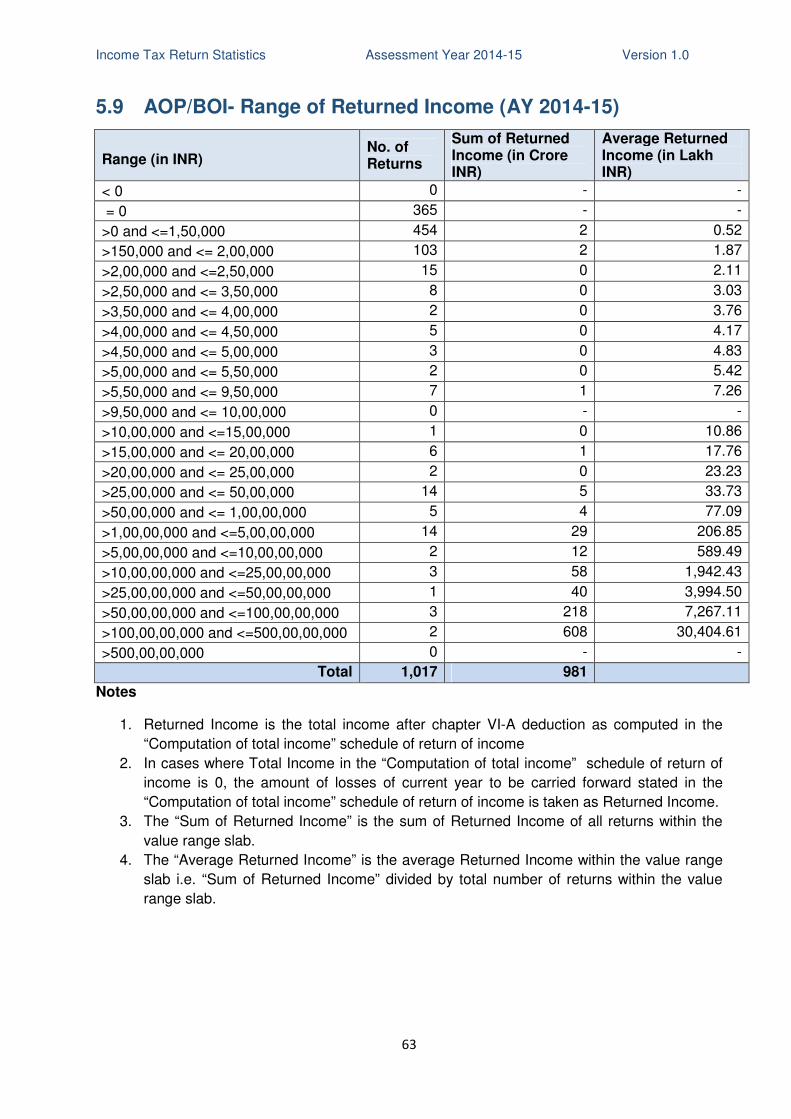
Income Tax Return Statistics Assessment Year 2014-15 Version 1.0
63
5.9 AOP/BOI- Range of Returned Income (AY 2014-15)
Range (in INR) No. of Returns
Sum of Returned Income (in Crore INR)
Average Returned Income (in Lakh INR)
< 0 0 - -
= 0 365 - -
>0 and <=1,50,000 454 2 0.52
>150,000 and <= 2,00,000 103 2 1.87
>2,00,000 and <=2,50,000 15 0 2.11
>2,50,000 and <= 3,50,000 8 0 3.03
>3,50,000 and <= 4,00,000 2 0 3.76
>4,00,000 and <= 4,50,000 5 0 4.17
>4,50,000 and <= 5,00,000 3 0 4.83
>5,00,000 and <= 5,50,000 2 0 5.42
>5,50,000 and <= 9,50,000 7 1 7.26
>9,50,000 and <= 10,00,000 0 - -
>10,00,000 and <=15,00,000 1 0 10.86
>15,00,000 and <= 20,00,000 6 1 17.76
>20,00,000 and <= 25,00,000 2 0 23.23
>25,00,000 and <= 50,00,000 14 5 33.73
>50,00,000 and <= 1,00,00,000 5 4 77.09
>1,00,00,000 and <=5,00,00,000 14 29 206.85
>5,00,00,000 and <=10,00,00,000 2 12 589.49
>10,00,00,000 and <=25,00,00,000 3 58 1,942.43
>25,00,00,000 and <=50,00,00,000 1 40 3,994.50
>50,00,00,000 and <=100,00,00,000 3 218 7,267.11
>100,00,00,000 and <=500,00,00,000 2 608 30,404.61
>500,00,00,000 0 - -
Total 1,017 981
Notes
1. Returned Income is the total income after chapter VI-A deduction as computed in the
“Computation of total income” schedule of return of income
2. In cases where Total Income in the “Computation of total income” schedule of return of
income is 0, the amount of losses of current year to be carried forward stated in the
“Computation of total income” schedule of return of income is taken as Returned Income.
3. The “Sum of Returned Income” is the sum of Returned Income of all returns within the
value range slab.
4. The “Average Returned Income” is the average Returned Income within the value range
slab i.e. “Sum of Returned Income” divided by total number of returns within the value
range slab.
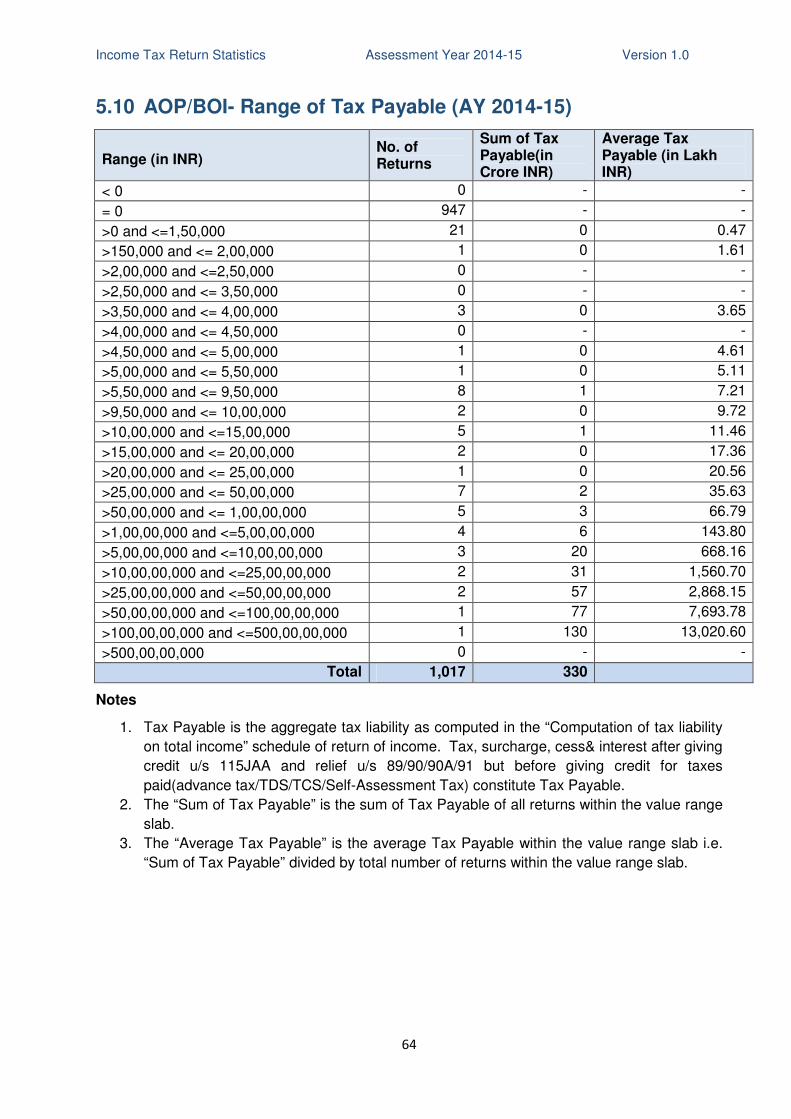
Income Tax Return Statistics Assessment Year 2014-15 Version 1.0
64
5.10 AOP/BOI- Range of Tax Payable (AY 2014-15)
Range (in INR) No. of Returns
Sum of Tax Payable(in Crore INR)
Average Tax Payable (in Lakh INR)
< 0 0 - -
= 0 947 - -
>0 and <=1,50,000 21 0 0.47
>150,000 and <= 2,00,000 1 0 1.61
>2,00,000 and <=2,50,000 0 - -
>2,50,000 and <= 3,50,000 0 - -
>3,50,000 and <= 4,00,000 3 0 3.65
>4,00,000 and <= 4,50,000 0 - -
>4,50,000 and <= 5,00,000 1 0 4.61
>5,00,000 and <= 5,50,000 1 0 5.11
>5,50,000 and <= 9,50,000 8 1 7.21
>9,50,000 and <= 10,00,000 2 0 9.72
>10,00,000 and <=15,00,000 5 1 11.46
>15,00,000 and <= 20,00,000 2 0 17.36
>20,00,000 and <= 25,00,000 1 0 20.56
>25,00,000 and <= 50,00,000 7 2 35.63
>50,00,000 and <= 1,00,00,000 5 3 66.79
>1,00,00,000 and <=5,00,00,000 4 6 143.80
>5,00,00,000 and <=10,00,00,000 3 20 668.16
>10,00,00,000 and <=25,00,00,000 2 31 1,560.70
>25,00,00,000 and <=50,00,00,000 2 57 2,868.15
>50,00,00,000 and <=100,00,00,000 1 77 7,693.78
>100,00,00,000 and <=500,00,00,000 1 130 13,020.60
>500,00,00,000 0 - -
Total 1,017 330
Notes
1. Tax Payable is the aggregate tax liability as computed in the “Computation of tax liability
on total income” schedule of return of income. Tax, surcharge, cess& interest after giving
credit u/s 115JAA and relief u/s 89/90/90A/91 but before giving credit for taxes
paid(advance tax/TDS/TCS/Self-Assessment Tax) constitute Tax Payable.
2. The “Sum of Tax Payable” is the sum of Tax Payable of all returns within the value range
slab.
3. The “Average Tax Payable” is the average Tax Payable within the value range slab i.e.
“Sum of Tax Payable” divided by total number of returns within the value range slab.
Income Tax Return Statistics Assessment Year 2014-15 Version 1.0
65
6. Income Tax Returns - Company
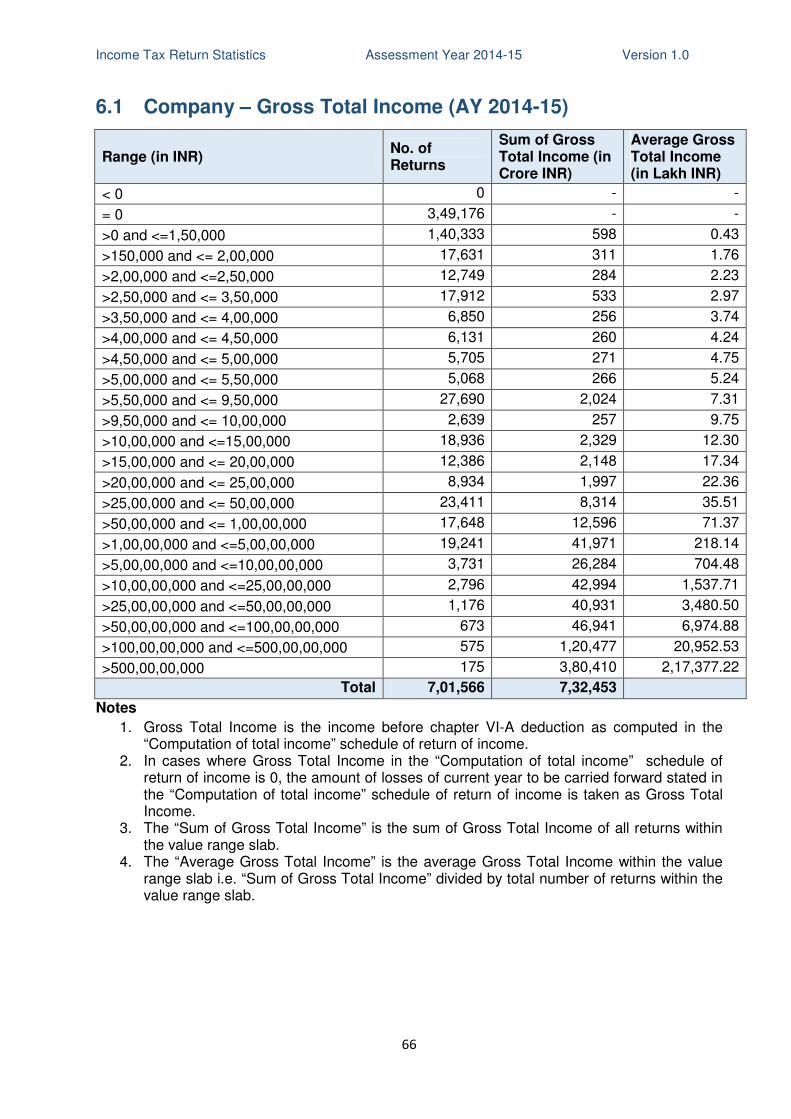
Income Tax Return Statistics Assessment Year 2014-15 Version 1.0
66
6.1 Company – Gross Total Income (AY 2014-15)
Range (in INR) No. of Returns
Sum of Gross Total Income (in Crore INR)
Average Gross Total Income (in Lakh INR)
< 0 0 - -
= 0 3,49,176 - -
>0 and <=1,50,000 1,40,333 598 0.43
>150,000 and <= 2,00,000 17,631 311 1.76
>2,00,000 and <=2,50,000 12,749 284 2.23
>2,50,000 and <= 3,50,000 17,912 533 2.97
>3,50,000 and <= 4,00,000 6,850 256 3.74
>4,00,000 and <= 4,50,000 6,131 260 4.24
>4,50,000 and <= 5,00,000 5,705 271 4.75
>5,00,000 and <= 5,50,000 5,068 266 5.24
>5,50,000 and <= 9,50,000 27,690 2,024 7.31
>9,50,000 and <= 10,00,000 2,639 257 9.75
>10,00,000 and <=15,00,000 18,936 2,329 12.30
>15,00,000 and <= 20,00,000 12,386 2,148 17.34
>20,00,000 and <= 25,00,000 8,934 1,997 22.36
>25,00,000 and <= 50,00,000 23,411 8,314 35.51
>50,00,000 and <= 1,00,00,000 17,648 12,596 71.37
>1,00,00,000 and <=5,00,00,000 19,241 41,971 218.14
>5,00,00,000 and <=10,00,00,000 3,731 26,284 704.48
>10,00,00,000 and <=25,00,00,000 2,796 42,994 1,537.71
>25,00,00,000 and <=50,00,00,000 1,176 40,931 3,480.50
>50,00,00,000 and <=100,00,00,000 673 46,941 6,974.88
>100,00,00,000 and <=500,00,00,000 575 1,20,477 20,952.53
>500,00,00,000 175 3,80,410 2,17,377.22
Total 7,01,566 7,32,453
Notes
1. Gross Total Income is the income before chapter VI-A deduction as computed in the “Computation of total income” schedule of return of income.
2. In cases where Gross Total Income in the “Computation of total income” schedule of return of income is 0, the amount of losses of current year to be carried forward stated in the “Computation of total income” schedule of return of income is taken as Gross Total Income.
3. The “Sum of Gross Total Income” is the sum of Gross Total Income of all returns within the value range slab.
4. The “Average Gross Total Income” is the average Gross Total Income within the value range slab i.e. “Sum of Gross Total Income” divided by total number of returns within the value range slab.
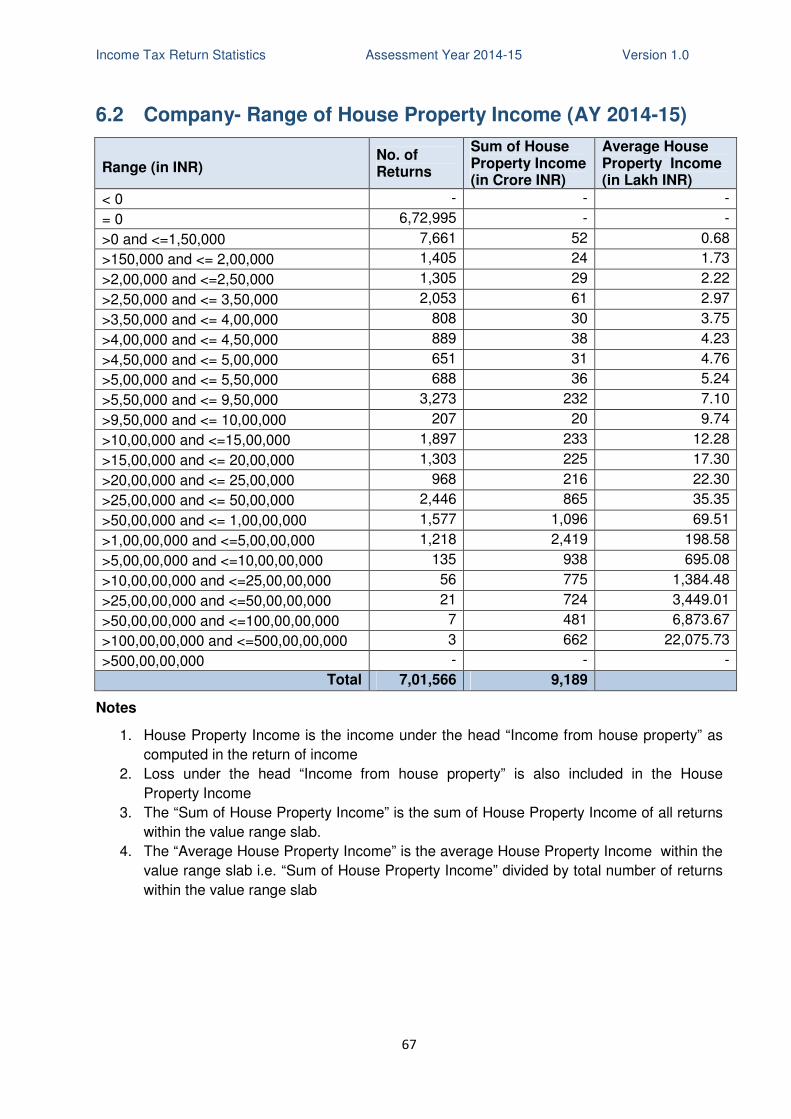
Income Tax Return Statistics Assessment Year 2014-15 Version 1.0
67
6.2 Company- Range of House Property Income (AY 2014-15)
Range (in INR) No. of Returns
Sum of House Property Income (in Crore INR)
Average House Property Income (in Lakh INR)
< 0 - - -
= 0 6,72,995 - -
>0 and <=1,50,000 7,661 52 0.68
>150,000 and <= 2,00,000 1,405 24 1.73
>2,00,000 and <=2,50,000 1,305 29 2.22
>2,50,000 and <= 3,50,000 2,053 61 2.97
>3,50,000 and <= 4,00,000 808 30 3.75
>4,00,000 and <= 4,50,000 889 38 4.23
>4,50,000 and <= 5,00,000 651 31 4.76
>5,00,000 and <= 5,50,000 688 36 5.24
>5,50,000 and <= 9,50,000 3,273 232 7.10
>9,50,000 and <= 10,00,000 207 20 9.74
>10,00,000 and <=15,00,000 1,897 233 12.28
>15,00,000 and <= 20,00,000 1,303 225 17.30
>20,00,000 and <= 25,00,000 968 216 22.30
>25,00,000 and <= 50,00,000 2,446 865 35.35
>50,00,000 and <= 1,00,00,000 1,577 1,096 69.51
>1,00,00,000 and <=5,00,00,000 1,218 2,419 198.58
>5,00,00,000 and <=10,00,00,000 135 938 695.08
>10,00,00,000 and <=25,00,00,000 56 775 1,384.48
>25,00,00,000 and <=50,00,00,000 21 724 3,449.01
>50,00,00,000 and <=100,00,00,000 7 481 6,873.67
>100,00,00,000 and <=500,00,00,000 3 662 22,075.73
>500,00,00,000 - - -
Total 7,01,566 9,189
Notes
1. House Property Income is the income under the head “Income from house property” as
computed in the return of income
2. Loss under the head “Income from house property” is also included in the House
Property Income
3. The “Sum of House Property Income” is the sum of House Property Income of all returns
within the value range slab.
4. The “Average House Property Income” is the average House Property Income within the
value range slab i.e. “Sum of House Property Income” divided by total number of returns
within the value range slab
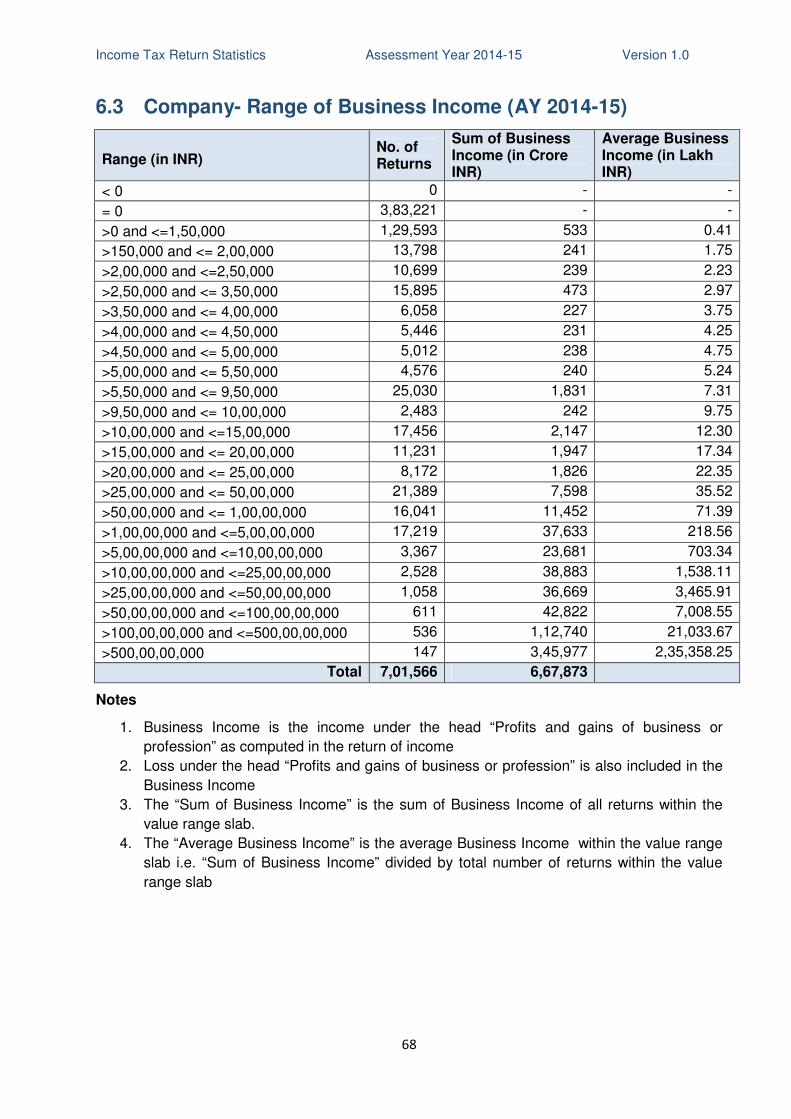
Income Tax Return Statistics Assessment Year 2014-15 Version 1.0
68
6.3 Company- Range of Business Income (AY 2014-15)
Range (in INR) No. of Returns
Sum of Business Income (in Crore INR)
Average Business Income (in Lakh INR)
< 0 0 - -
= 0 3,83,221 - -
>0 and <=1,50,000 1,29,593 533 0.41
>150,000 and <= 2,00,000 13,798 241 1.75
>2,00,000 and <=2,50,000 10,699 239 2.23
>2,50,000 and <= 3,50,000 15,895 473 2.97
>3,50,000 and <= 4,00,000 6,058 227 3.75
>4,00,000 and <= 4,50,000 5,446 231 4.25
>4,50,000 and <= 5,00,000 5,012 238 4.75
>5,00,000 and <= 5,50,000 4,576 240 5.24
>5,50,000 and <= 9,50,000 25,030 1,831 7.31
>9,50,000 and <= 10,00,000 2,483 242 9.75
>10,00,000 and <=15,00,000 17,456 2,147 12.30
>15,00,000 and <= 20,00,000 11,231 1,947 17.34
>20,00,000 and <= 25,00,000 8,172 1,826 22.35
>25,00,000 and <= 50,00,000 21,389 7,598 35.52
>50,00,000 and <= 1,00,00,000 16,041 11,452 71.39
>1,00,00,000 and <=5,00,00,000 17,219 37,633 218.56
>5,00,00,000 and <=10,00,00,000 3,367 23,681 703.34
>10,00,00,000 and <=25,00,00,000 2,528 38,883 1,538.11
>25,00,00,000 and <=50,00,00,000 1,058 36,669 3,465.91
>50,00,00,000 and <=100,00,00,000 611 42,822 7,008.55
>100,00,00,000 and <=500,00,00,000 536 1,12,740 21,033.67
>500,00,00,000 147 3,45,977 2,35,358.25
Total 7,01,566 6,67,873
Notes
1. Business Income is the income under the head “Profits and gains of business or
profession” as computed in the return of income
2. Loss under the head “Profits and gains of business or profession” is also included in the
Business Income
3. The “Sum of Business Income” is the sum of Business Income of all returns within the
value range slab.
4. The “Average Business Income” is the average Business Income within the value range
slab i.e. “Sum of Business Income” divided by total number of returns within the value
range slab
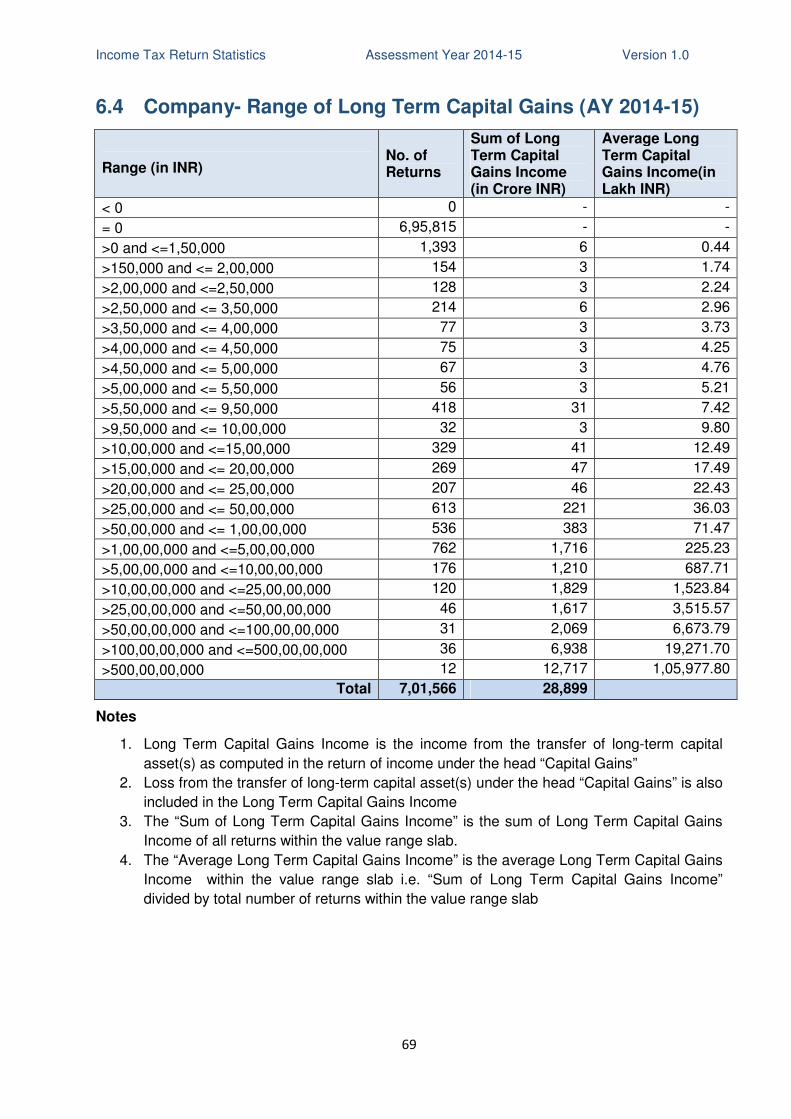
Income Tax Return Statistics Assessment Year 2014-15 Version 1.0
69
6.4 Company- Range of Long Term Capital Gains (AY 2014-15)
Range (in INR) No. of Returns
Sum of Long Term Capital Gains Income (in Crore INR)
Average Long Term Capital Gains Income(in Lakh INR)
< 0 0 - -
= 0 6,95,815 - -
>0 and <=1,50,000 1,393 6 0.44
>150,000 and <= 2,00,000 154 3 1.74
>2,00,000 and <=2,50,000 128 3 2.24
>2,50,000 and <= 3,50,000 214 6 2.96
>3,50,000 and <= 4,00,000 77 3 3.73
>4,00,000 and <= 4,50,000 75 3 4.25
>4,50,000 and <= 5,00,000 67 3 4.76
>5,00,000 and <= 5,50,000 56 3 5.21
>5,50,000 and <= 9,50,000 418 31 7.42
>9,50,000 and <= 10,00,000 32 3 9.80
>10,00,000 and <=15,00,000 329 41 12.49
>15,00,000 and <= 20,00,000 269 47 17.49
>20,00,000 and <= 25,00,000 207 46 22.43
>25,00,000 and <= 50,00,000 613 221 36.03
>50,00,000 and <= 1,00,00,000 536 383 71.47
>1,00,00,000 and <=5,00,00,000 762 1,716 225.23
>5,00,00,000 and <=10,00,00,000 176 1,210 687.71
>10,00,00,000 and <=25,00,00,000 120 1,829 1,523.84
>25,00,00,000 and <=50,00,00,000 46 1,617 3,515.57
>50,00,00,000 and <=100,00,00,000 31 2,069 6,673.79
>100,00,00,000 and <=500,00,00,000 36 6,938 19,271.70
>500,00,00,000 12 12,717 1,05,977.80
Total 7,01,566 28,899
Notes
1. Long Term Capital Gains Income is the income from the transfer of long-term capital
asset(s) as computed in the return of income under the head “Capital Gains”
2. Loss from the transfer of long-term capital asset(s) under the head “Capital Gains” is also
included in the Long Term Capital Gains Income
3. The “Sum of Long Term Capital Gains Income” is the sum of Long Term Capital Gains
Income of all returns within the value range slab.
4. The “Average Long Term Capital Gains Income” is the average Long Term Capital Gains
Income within the value range slab i.e. “Sum of Long Term Capital Gains Income”
divided by total number of returns within the value range slab
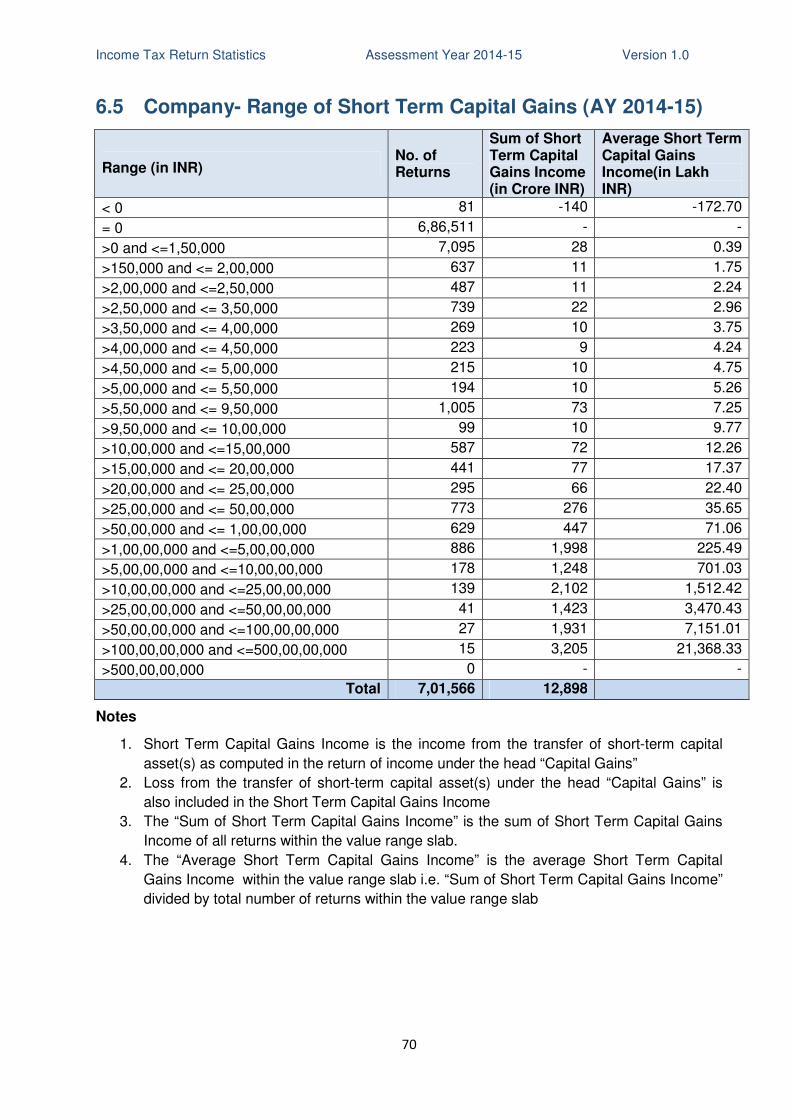
Income Tax Return Statistics Assessment Year 2014-15 Version 1.0
70
6.5 Company- Range of Short Term Capital Gains (AY 2014-15)
Range (in INR) No. of Returns
Sum of Short Term Capital Gains Income (in Crore INR)
Average Short Term Capital Gains Income(in Lakh INR)
< 0 81 -140 -172.70
= 0 6,86,511 - -
>0 and <=1,50,000 7,095 28 0.39
>150,000 and <= 2,00,000 637 11 1.75
>2,00,000 and <=2,50,000 487 11 2.24
>2,50,000 and <= 3,50,000 739 22 2.96
>3,50,000 and <= 4,00,000 269 10 3.75
>4,00,000 and <= 4,50,000 223 9 4.24
>4,50,000 and <= 5,00,000 215 10 4.75
>5,00,000 and <= 5,50,000 194 10 5.26
>5,50,000 and <= 9,50,000 1,005 73 7.25
>9,50,000 and <= 10,00,000 99 10 9.77
>10,00,000 and <=15,00,000 587 72 12.26
>15,00,000 and <= 20,00,000 441 77 17.37
>20,00,000 and <= 25,00,000 295 66 22.40
>25,00,000 and <= 50,00,000 773 276 35.65
>50,00,000 and <= 1,00,00,000 629 447 71.06
>1,00,00,000 and <=5,00,00,000 886 1,998 225.49
>5,00,00,000 and <=10,00,00,000 178 1,248 701.03
>10,00,00,000 and <=25,00,00,000 139 2,102 1,512.42
>25,00,00,000 and <=50,00,00,000 41 1,423 3,470.43
>50,00,00,000 and <=100,00,00,000 27 1,931 7,151.01
>100,00,00,000 and <=500,00,00,000 15 3,205 21,368.33
>500,00,00,000 0 - -
Total 7,01,566 12,898
Notes
1. Short Term Capital Gains Income is the income from the transfer of short-term capital
asset(s) as computed in the return of income under the head “Capital Gains”
2. Loss from the transfer of short-term capital asset(s) under the head “Capital Gains” is
also included in the Short Term Capital Gains Income
3. The “Sum of Short Term Capital Gains Income” is the sum of Short Term Capital Gains
Income of all returns within the value range slab.
4. The “Average Short Term Capital Gains Income” is the average Short Term Capital
Gains Income within the value range slab i.e. “Sum of Short Term Capital Gains Income”
divided by total number of returns within the value range slab
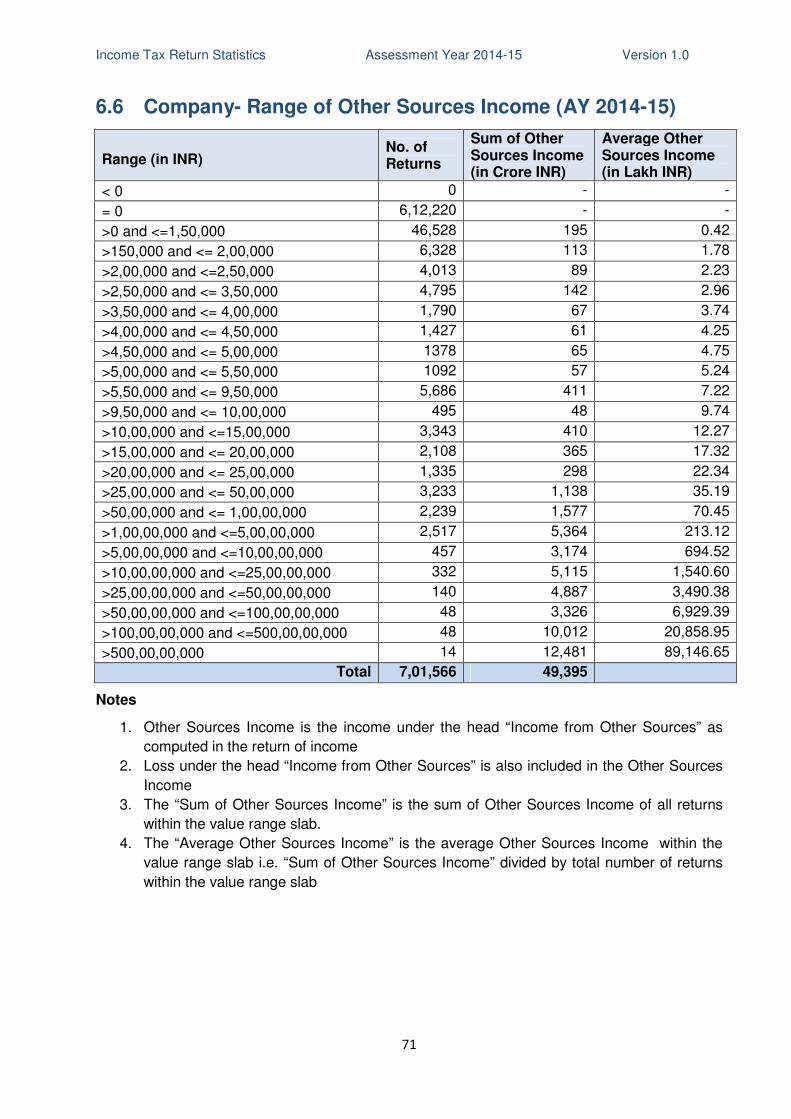
Income Tax Return Statistics Assessment Year 2014-15 Version 1.0
71
6.6 Company- Range of Other Sources Income (AY 2014-15)
Range (in INR) No. of Returns
Sum of Other Sources Income (in Crore INR)
Average Other Sources Income (in Lakh INR)
< 0 0 - -
= 0 6,12,220 - -
>0 and <=1,50,000 46,528 195 0.42
>150,000 and <= 2,00,000 6,328 113 1.78
>2,00,000 and <=2,50,000 4,013 89 2.23
>2,50,000 and <= 3,50,000 4,795 142 2.96
>3,50,000 and <= 4,00,000 1,790 67 3.74
>4,00,000 and <= 4,50,000 1,427 61 4.25
>4,50,000 and <= 5,00,000 1378 65 4.75
>5,00,000 and <= 5,50,000 1092 57 5.24
>5,50,000 and <= 9,50,000 5,686 411 7.22
>9,50,000 and <= 10,00,000 495 48 9.74
>10,00,000 and <=15,00,000 3,343 410 12.27
>15,00,000 and <= 20,00,000 2,108 365 17.32
>20,00,000 and <= 25,00,000 1,335 298 22.34
>25,00,000 and <= 50,00,000 3,233 1,138 35.19
>50,00,000 and <= 1,00,00,000 2,239 1,577 70.45
>1,00,00,000 and <=5,00,00,000 2,517 5,364 213.12
>5,00,00,000 and <=10,00,00,000 457 3,174 694.52
>10,00,00,000 and <=25,00,00,000 332 5,115 1,540.60
>25,00,00,000 and <=50,00,00,000 140 4,887 3,490.38
>50,00,00,000 and <=100,00,00,000 48 3,326 6,929.39
>100,00,00,000 and <=500,00,00,000 48 10,012 20,858.95
>500,00,00,000 14 12,481 89,146.65
Total 7,01,566 49,395
Notes
1. Other Sources Income is the income under the head “Income from Other Sources” as
computed in the return of income
2. Loss under the head “Income from Other Sources” is also included in the Other Sources
Income
3. The “Sum of Other Sources Income” is the sum of Other Sources Income of all returns
within the value range slab.
4. The “Average Other Sources Income” is the average Other Sources Income within the
value range slab i.e. “Sum of Other Sources Income” divided by total number of returns
within the value range slab
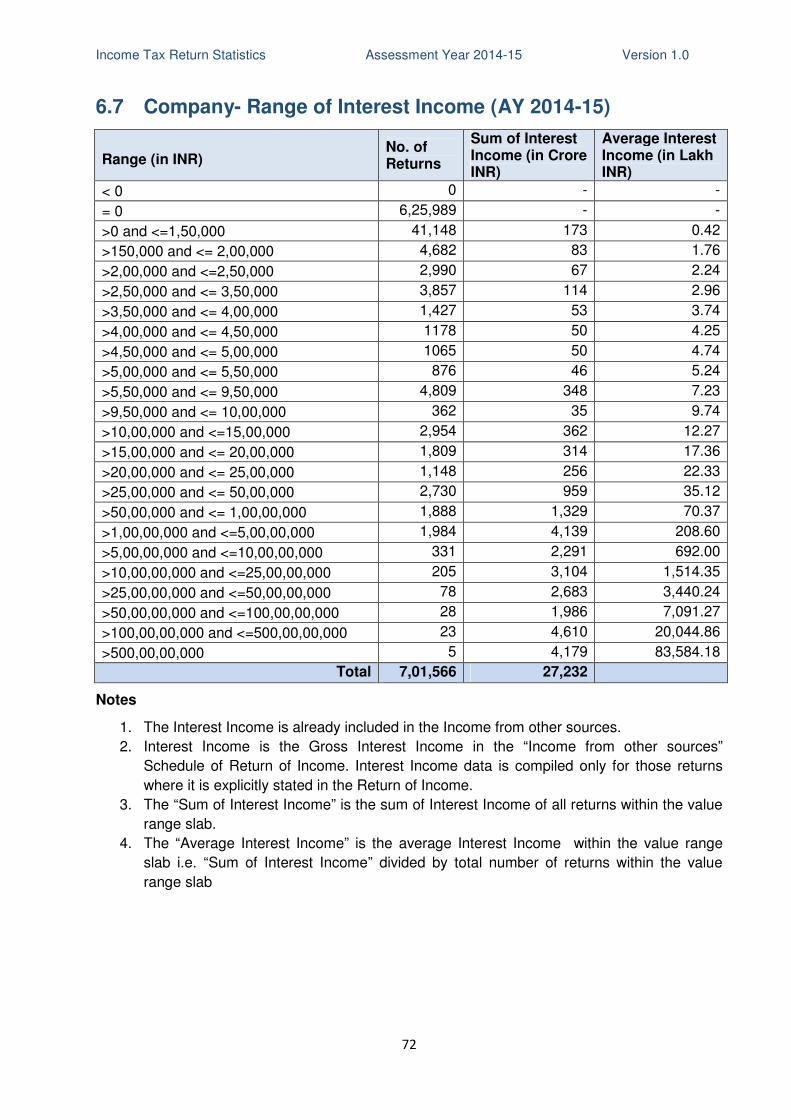
Income Tax Return Statistics Assessment Year 2014-15 Version 1.0
72
6.7 Company- Range of Interest Income (AY 2014-15)
Range (in INR) No. of Returns
Sum of Interest Income (in Crore INR)
Average Interest Income (in Lakh INR)
< 0 0 - -
= 0 6,25,989 - -
>0 and <=1,50,000 41,148 173 0.42
>150,000 and <= 2,00,000 4,682 83 1.76
>2,00,000 and <=2,50,000 2,990 67 2.24
>2,50,000 and <= 3,50,000 3,857 114 2.96
>3,50,000 and <= 4,00,000 1,427 53 3.74
>4,00,000 and <= 4,50,000 1178 50 4.25
>4,50,000 and <= 5,00,000 1065 50 4.74
>5,00,000 and <= 5,50,000 876 46 5.24
>5,50,000 and <= 9,50,000 4,809 348 7.23
>9,50,000 and <= 10,00,000 362 35 9.74
>10,00,000 and <=15,00,000 2,954 362 12.27
>15,00,000 and <= 20,00,000 1,809 314 17.36
>20,00,000 and <= 25,00,000 1,148 256 22.33
>25,00,000 and <= 50,00,000 2,730 959 35.12
>50,00,000 and <= 1,00,00,000 1,888 1,329 70.37
>1,00,00,000 and <=5,00,00,000 1,984 4,139 208.60
>5,00,00,000 and <=10,00,00,000 331 2,291 692.00
>10,00,00,000 and <=25,00,00,000 205 3,104 1,514.35
>25,00,00,000 and <=50,00,00,000 78 2,683 3,440.24
>50,00,00,000 and <=100,00,00,000 28 1,986 7,091.27
>100,00,00,000 and <=500,00,00,000 23 4,610 20,044.86
>500,00,00,000 5 4,179 83,584.18
Total 7,01,566 27,232
Notes
1. The Interest Income is already included in the Income from other sources.
2. Interest Income is the Gross Interest Income in the “Income from other sources”
Schedule of Return of Income. Interest Income data is compiled only for those returns
where it is explicitly stated in the Return of Income.
3. The “Sum of Interest Income” is the sum of Interest Income of all returns within the value
range slab.
4. The “Average Interest Income” is the average Interest Income within the value range
slab i.e. “Sum of Interest Income” divided by total number of returns within the value
range slab
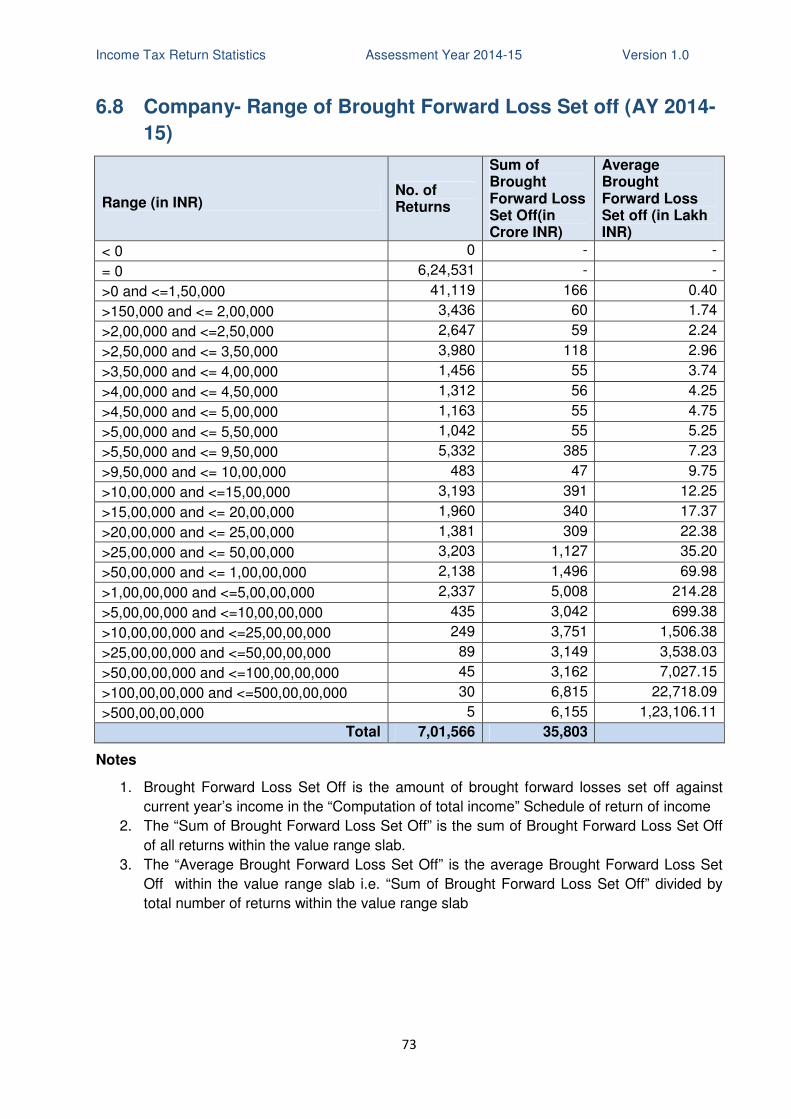
Income Tax Return Statistics Assessment Year 2014-15 Version 1.0
73
6.8 Company- Range of Brought Forward Loss Set off (AY 2014-
15)
Range (in INR) No. of Returns
Sum of Brought Forward Loss Set Off(in Crore INR)
Average Brought Forward Loss Set off (in Lakh INR)
< 0 0 - -
= 0 6,24,531 - -
>0 and <=1,50,000 41,119 166 0.40
>150,000 and <= 2,00,000 3,436 60 1.74
>2,00,000 and <=2,50,000 2,647 59 2.24
>2,50,000 and <= 3,50,000 3,980 118 2.96
>3,50,000 and <= 4,00,000 1,456 55 3.74
>4,00,000 and <= 4,50,000 1,312 56 4.25
>4,50,000 and <= 5,00,000 1,163 55 4.75
>5,00,000 and <= 5,50,000 1,042 55 5.25
>5,50,000 and <= 9,50,000 5,332 385 7.23
>9,50,000 and <= 10,00,000 483 47 9.75
>10,00,000 and <=15,00,000 3,193 391 12.25
>15,00,000 and <= 20,00,000 1,960 340 17.37
>20,00,000 and <= 25,00,000 1,381 309 22.38
>25,00,000 and <= 50,00,000 3,203 1,127 35.20
>50,00,000 and <= 1,00,00,000 2,138 1,496 69.98
>1,00,00,000 and <=5,00,00,000 2,337 5,008 214.28
>5,00,00,000 and <=10,00,00,000 435 3,042 699.38
>10,00,00,000 and <=25,00,00,000 249 3,751 1,506.38
>25,00,00,000 and <=50,00,00,000 89 3,149 3,538.03
>50,00,00,000 and <=100,00,00,000 45 3,162 7,027.15
>100,00,00,000 and <=500,00,00,000 30 6,815 22,718.09
>500,00,00,000 5 6,155 1,23,106.11
Total 7,01,566 35,803
Notes
1. Brought Forward Loss Set Off is the amount of brought forward losses set off against
current year’s income in the “Computation of total income” Schedule of return of income
2. The “Sum of Brought Forward Loss Set Off” is the sum of Brought Forward Loss Set Off
of all returns within the value range slab.
3. The “Average Brought Forward Loss Set Off” is the average Brought Forward Loss Set
Off within the value range slab i.e. “Sum of Brought Forward Loss Set Off” divided by
total number of returns within the value range slab
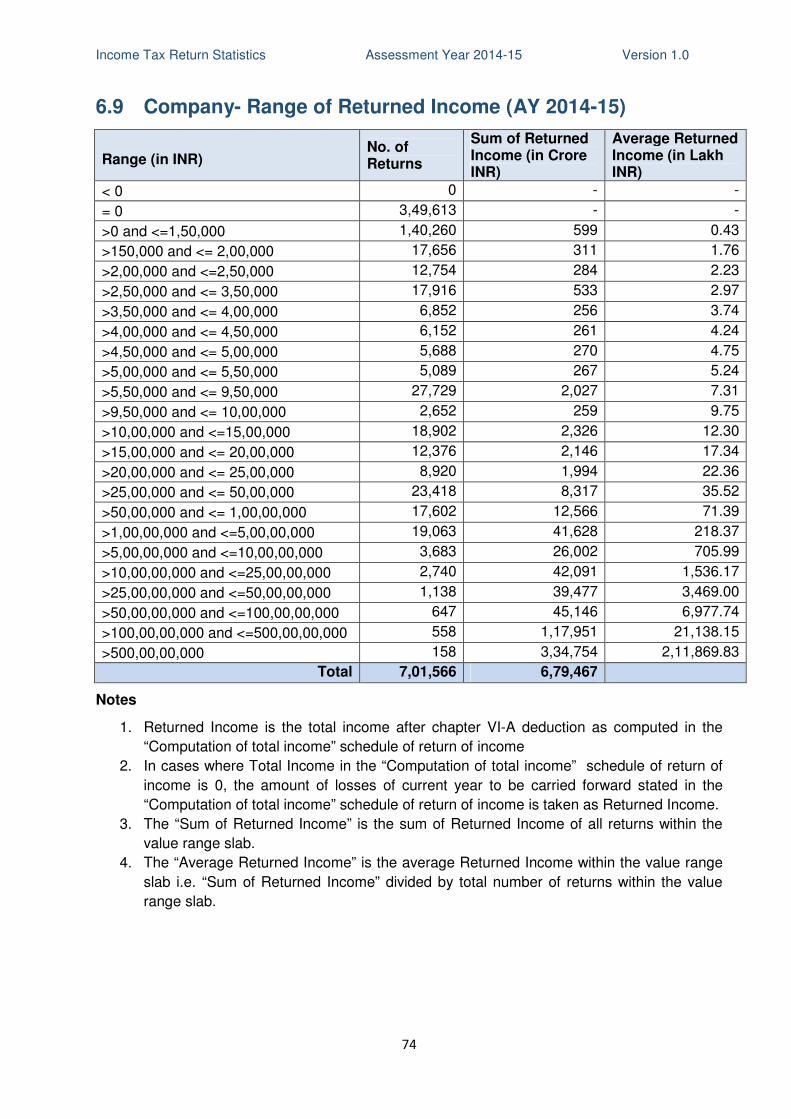
Income Tax Return Statistics Assessment Year 2014-15 Version 1.0
74
6.9 Company- Range of Returned Income (AY 2014-15)
Range (in INR) No. of Returns
Sum of Returned Income (in Crore INR)
Average Returned Income (in Lakh INR)
< 0 0 - -
= 0 3,49,613 - -
>0 and <=1,50,000 1,40,260 599 0.43
>150,000 and <= 2,00,000 17,656 311 1.76
>2,00,000 and <=2,50,000 12,754 284 2.23
>2,50,000 and <= 3,50,000 17,916 533 2.97
>3,50,000 and <= 4,00,000 6,852 256 3.74
>4,00,000 and <= 4,50,000 6,152 261 4.24
>4,50,000 and <= 5,00,000 5,688 270 4.75
>5,00,000 and <= 5,50,000 5,089 267 5.24
>5,50,000 and <= 9,50,000 27,729 2,027 7.31
>9,50,000 and <= 10,00,000 2,652 259 9.75
>10,00,000 and <=15,00,000 18,902 2,326 12.30
>15,00,000 and <= 20,00,000 12,376 2,146 17.34
>20,00,000 and <= 25,00,000 8,920 1,994 22.36
>25,00,000 and <= 50,00,000 23,418 8,317 35.52
>50,00,000 and <= 1,00,00,000 17,602 12,566 71.39
>1,00,00,000 and <=5,00,00,000 19,063 41,628 218.37
>5,00,00,000 and <=10,00,00,000 3,683 26,002 705.99
>10,00,00,000 and <=25,00,00,000 2,740 42,091 1,536.17
>25,00,00,000 and <=50,00,00,000 1,138 39,477 3,469.00
>50,00,00,000 and <=100,00,00,000 647 45,146 6,977.74
>100,00,00,000 and <=500,00,00,000 558 1,17,951 21,138.15
>500,00,00,000 158 3,34,754 2,11,869.83
Total 7,01,566 6,79,467
Notes
1. Returned Income is the total income after chapter VI-A deduction as computed in the
“Computation of total income” schedule of return of income
2. In cases where Total Income in the “Computation of total income” schedule of return of
income is 0, the amount of losses of current year to be carried forward stated in the
“Computation of total income” schedule of return of income is taken as Returned Income.
3. The “Sum of Returned Income” is the sum of Returned Income of all returns within the
value range slab.
4. The “Average Returned Income” is the average Returned Income within the value range
slab i.e. “Sum of Returned Income” divided by total number of returns within the value
range slab.
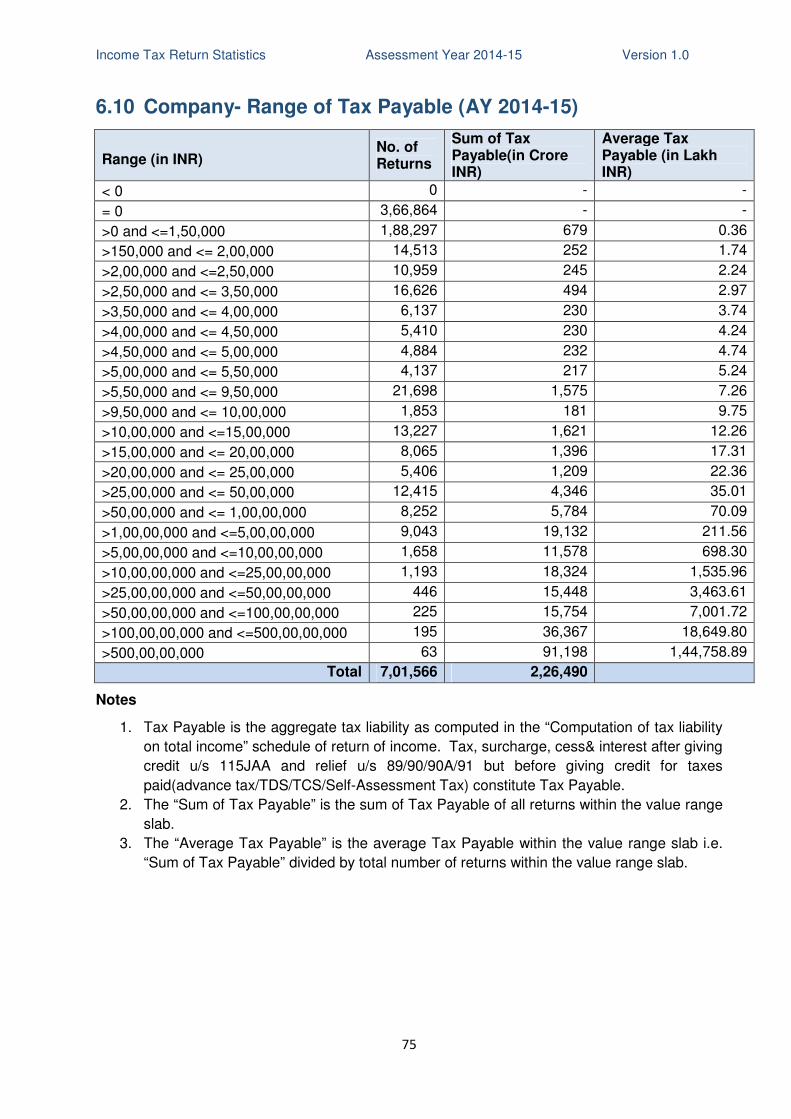
Income Tax Return Statistics Assessment Year 2014-15 Version 1.0
75
6.10 Company- Range of Tax Payable (AY 2014-15)
Range (in INR) No. of Returns
Sum of Tax Payable(in Crore INR)
Average Tax Payable (in Lakh INR)
< 0 0 - -
= 0 3,66,864 - -
>0 and <=1,50,000 1,88,297 679 0.36
>150,000 and <= 2,00,000 14,513 252 1.74
>2,00,000 and <=2,50,000 10,959 245 2.24
>2,50,000 and <= 3,50,000 16,626 494 2.97
>3,50,000 and <= 4,00,000 6,137 230 3.74
>4,00,000 and <= 4,50,000 5,410 230 4.24
>4,50,000 and <= 5,00,000 4,884 232 4.74
>5,00,000 and <= 5,50,000 4,137 217 5.24
>5,50,000 and <= 9,50,000 21,698 1,575 7.26
>9,50,000 and <= 10,00,000 1,853 181 9.75
>10,00,000 and <=15,00,000 13,227 1,621 12.26
>15,00,000 and <= 20,00,000 8,065 1,396 17.31
>20,00,000 and <= 25,00,000 5,406 1,209 22.36
>25,00,000 and <= 50,00,000 12,415 4,346 35.01
>50,00,000 and <= 1,00,00,000 8,252 5,784 70.09
>1,00,00,000 and <=5,00,00,000 9,043 19,132 211.56
>5,00,00,000 and <=10,00,00,000 1,658 11,578 698.30
>10,00,00,000 and <=25,00,00,000 1,193 18,324 1,535.96
>25,00,00,000 and <=50,00,00,000 446 15,448 3,463.61
>50,00,00,000 and <=100,00,00,000 225 15,754 7,001.72
>100,00,00,000 and <=500,00,00,000 195 36,367 18,649.80
>500,00,00,000 63 91,198 1,44,758.89
Total 7,01,566 2,26,490
Notes
1. Tax Payable is the aggregate tax liability as computed in the “Computation of tax liability
on total income” schedule of return of income. Tax, surcharge, cess& interest after giving
credit u/s 115JAA and relief u/s 89/90/90A/91 but before giving credit for taxes
paid(advance tax/TDS/TCS/Self-Assessment Tax) constitute Tax Payable.
2. The “Sum of Tax Payable” is the sum of Tax Payable of all returns within the value range
slab.
3. The “Average Tax Payable” is the average Tax Payable within the value range slab i.e.
“Sum of Tax Payable” divided by total number of returns within the value range slab.
Income Tax Return Statistics Assessment Year 2014-15 Version 1.0
76
7. Type of Business
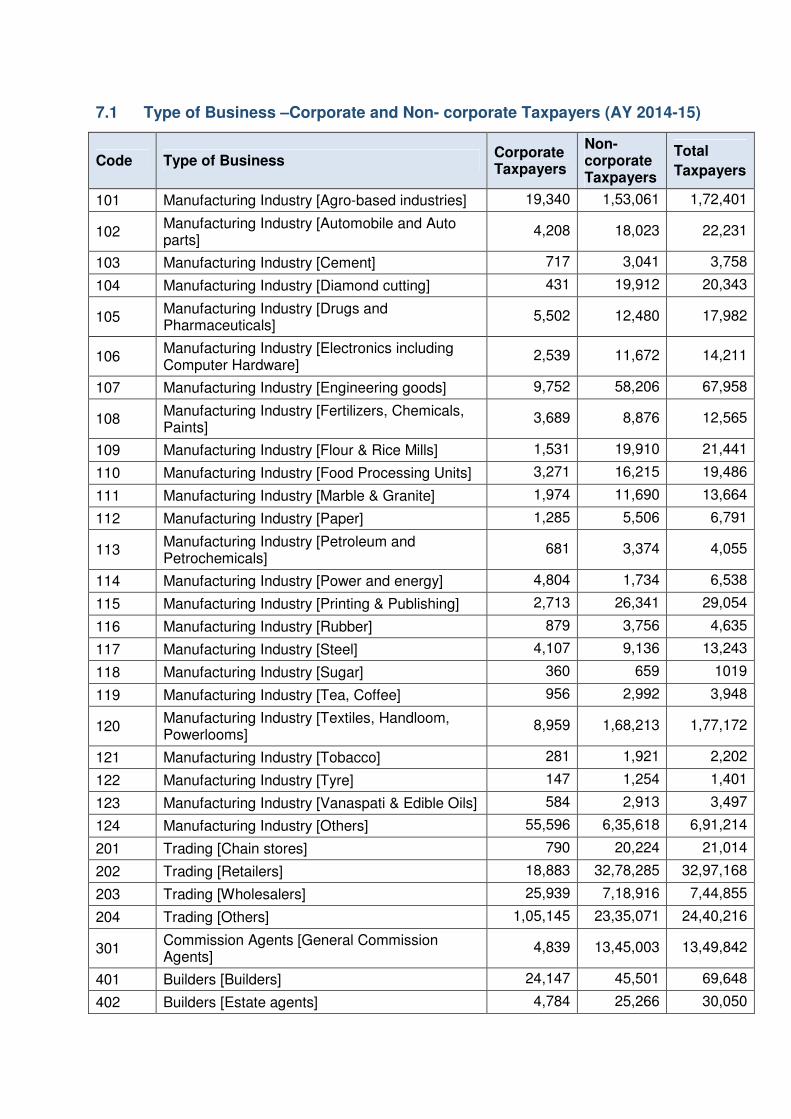
7.1 Type of Business –Corporate and Non- corporate Taxpayers (AY 2014-15)
Code Type of Business Corporate Taxpayers
Non- corporate Taxpayers
Total
Taxpayers
101 Manufacturing Industry [Agro-based industries] 19,340 1,53,061 1,72,401
102 Manufacturing Industry [Automobile and Auto parts]
4,208 18,023 22,231
103 Manufacturing Industry [Cement] 717 3,041 3,758
104 Manufacturing Industry [Diamond cutting] 431 19,912 20,343
105 Manufacturing Industry [Drugs and Pharmaceuticals]
5,502 12,480 17,982
106 Manufacturing Industry [Electronics including Computer Hardware]
2,539 11,672 14,211
107 Manufacturing Industry [Engineering goods] 9,752 58,206 67,958
108 Manufacturing Industry [Fertilizers, Chemicals, Paints]
3,689 8,876 12,565
109 Manufacturing Industry [Flour & Rice Mills] 1,531 19,910 21,441
110 Manufacturing Industry [Food Processing Units] 3,271 16,215 19,486
111 Manufacturing Industry [Marble & Granite] 1,974 11,690 13,664
112 Manufacturing Industry [Paper] 1,285 5,506 6,791
113 Manufacturing Industry [Petroleum and Petrochemicals]
681 3,374 4,055
114 Manufacturing Industry [Power and energy] 4,804 1,734 6,538
115 Manufacturing Industry [Printing & Publishing] 2,713 26,341 29,054
116 Manufacturing Industry [Rubber] 879 3,756 4,635
117 Manufacturing Industry [Steel] 4,107 9,136 13,243
118 Manufacturing Industry [Sugar] 360 659 1019
119 Manufacturing Industry [Tea, Coffee] 956 2,992 3,948
120 Manufacturing Industry [Textiles, Handloom, Powerlooms]
8,959 1,68,213 1,77,172
121 Manufacturing Industry [Tobacco] 281 1,921 2,202
122 Manufacturing Industry [Tyre] 147 1,254 1,401
123 Manufacturing Industry [Vanaspati & Edible Oils] 584 2,913 3,497
124 Manufacturing Industry [Others] 55,596 6,35,618 6,91,214
201 Trading [Chain stores] 790 20,224 21,014
202 Trading [Retailers] 18,883 32,78,285 32,97,168
203 Trading [Wholesalers] 25,939 7,18,916 7,44,855
204 Trading [Others] 1,05,145 23,35,071 24,40,216
301 Commission Agents [General Commission Agents]
4,839 13,45,003 13,49,842
401 Builders [Builders] 24,147 45,501 69,648
402 Builders [Estate agents] 4,784 25,266 30,050
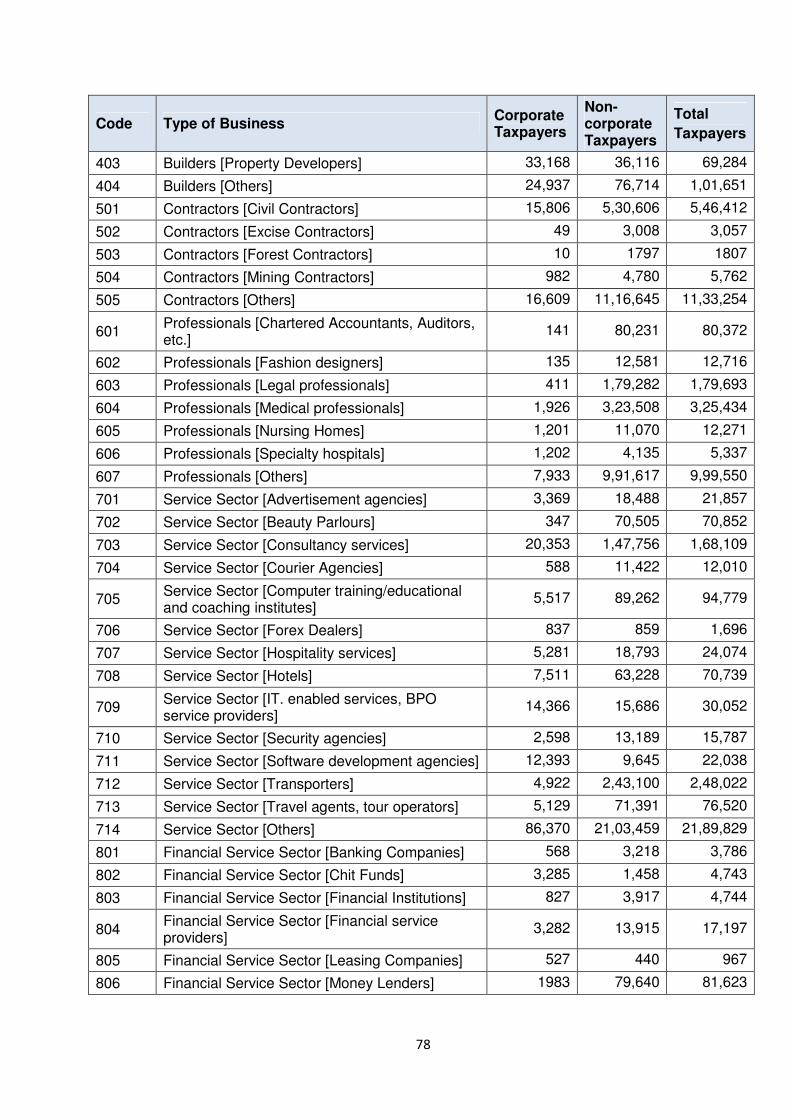
78
Code Type of Business Corporate Taxpayers
Non- corporate Taxpayers
Total
Taxpayers
403 Builders [Property Developers] 33,168 36,116 69,284
404 Builders [Others] 24,937 76,714 1,01,651
501 Contractors [Civil Contractors] 15,806 5,30,606 5,46,412
502 Contractors [Excise Contractors] 49 3,008 3,057
503 Contractors [Forest Contractors] 10 1797 1807
504 Contractors [Mining Contractors] 982 4,780 5,762
505 Contractors [Others] 16,609 11,16,645 11,33,254
601 Professionals [Chartered Accountants, Auditors, etc.]
141 80,231 80,372
602 Professionals [Fashion designers] 135 12,581 12,716
603 Professionals [Legal professionals] 411 1,79,282 1,79,693
604 Professionals [Medical professionals] 1,926 3,23,508 3,25,434
605 Professionals [Nursing Homes] 1,201 11,070 12,271
606 Professionals [Specialty hospitals] 1,202 4,135 5,337
607 Professionals [Others] 7,933 9,91,617 9,99,550
701 Service Sector [Advertisement agencies] 3,369 18,488 21,857
702 Service Sector [Beauty Parlours] 347 70,505 70,852
703 Service Sector [Consultancy services] 20,353 1,47,756 1,68,109
704 Service Sector [Courier Agencies] 588 11,422 12,010
705 Service Sector [Computer training/educational and coaching institutes]
5,517 89,262 94,779
706 Service Sector [Forex Dealers] 837 859 1,696
707 Service Sector [Hospitality services] 5,281 18,793 24,074
708 Service Sector [Hotels] 7,511 63,228 70,739
709 Service Sector [IT. enabled services, BPO service providers]
14,366 15,686 30,052
710 Service Sector [Security agencies] 2,598 13,189 15,787
711 Service Sector [Software development agencies] 12,393 9,645 22,038
712 Service Sector [Transporters] 4,922 2,43,100 2,48,022
713 Service Sector [Travel agents, tour operators] 5,129 71,391 76,520
714 Service Sector [Others] 86,370 21,03,459 21,89,829
801 Financial Service Sector [Banking Companies] 568 3,218 3,786
802 Financial Service Sector [Chit Funds] 3,285 1,458 4,743
803 Financial Service Sector [Financial Institutions] 827 3,917 4,744
804 Financial Service Sector [Financial service providers]
3,282 13,915 17,197
805 Financial Service Sector [Leasing Companies] 527 440 967
806 Financial Service Sector [Money Lenders] 1983 79,640 81,623
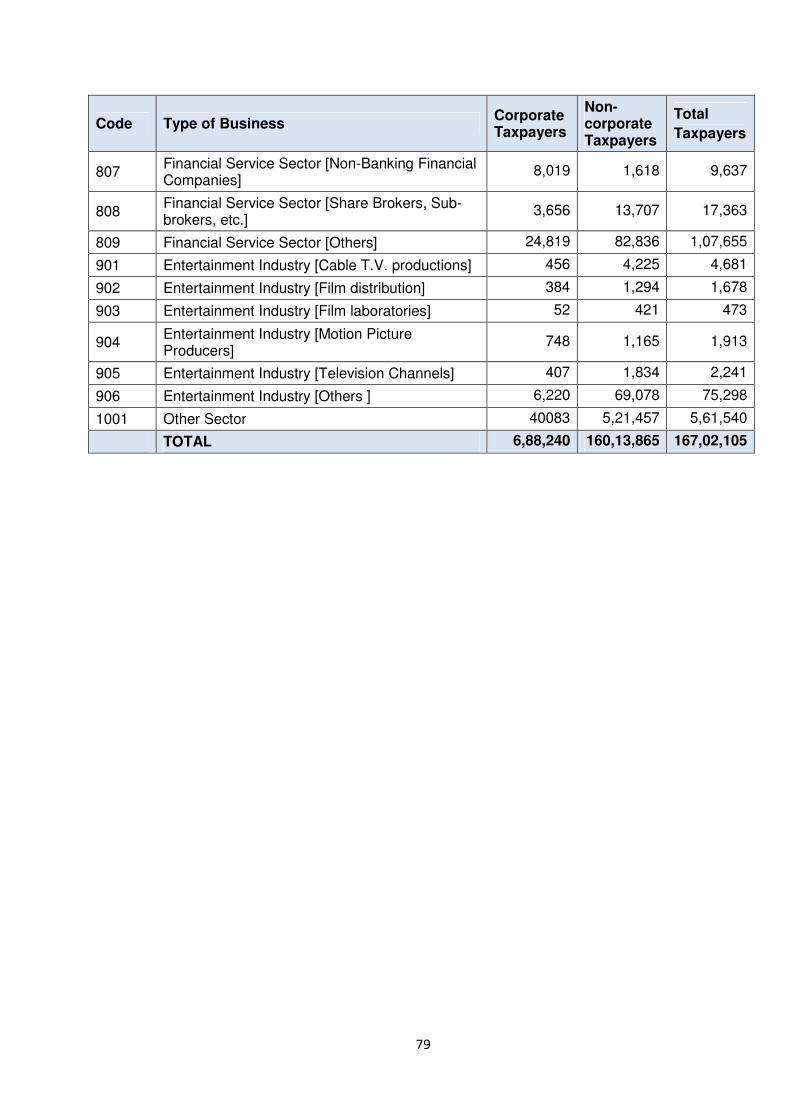
79
Code Type of Business Corporate Taxpayers
Non- corporate Taxpayers
Total
Taxpayers
807 Financial Service Sector [Non-Banking Financial Companies]
8,019 1,618 9,637
808 Financial Service Sector [Share Brokers, Sub-brokers, etc.]
3,656 13,707 17,363
809 Financial Service Sector [Others] 24,819 82,836 1,07,655
901 Entertainment Industry [Cable T.V. productions] 456 4,225 4,681
902 Entertainment Industry [Film distribution] 384 1,294 1,678
903 Entertainment Industry [Film laboratories] 52 421 473
904 Entertainment Industry [Motion Picture Producers]
748 1,165 1,913
905 Entertainment Industry [Television Channels] 407 1,834 2,241
906 Entertainment Industry [Others ] 6,220 69,078 75,298
1001 Other Sector 40083 5,21,457 5,61,540
TOTAL 6,88,240 160,13,865 167,02,105