verification of the uncertainty principle in neutron interferometry
TRANSCRIPT
Volume 108A, number 2 PHYSICS LETTERS 18 March 1985
VERIFICATION OF THE UNCERTAINTY PRINCIPLE IN NEUTRON INTERFEROMETRY
J.B.M. UFFINK
Institute for Theoretical Physics, Valckenierstraai 65, 1018 XE Amsterdam, The Netherlands
Received 14 December 1984
A recent neutron interferometry experiment has been interpreted as an explicit verification of the uncertainty principle. Here
the question is discussed which mathematical expression of the uncertainty principle is relevant to this experiment. It is shown
that the experiment does not measure the standard deviation cq in position independently of ad hoc assumptions on the shape
of the wavefunction. Rather, it is the “mean peak width” that is measured directly. Therefore, the natural interpretation of this
experiment is not as a verification of the Heisenberg relation 0~0~ >/ l/2; but rather of a relation between mean peak width in
position and the overall spread in momentum.
A recent publication [l] has shown that the shape of a wavefunction can be measured by means of a neutron interferometer. The results of this beautiful experiment have been interpreted as an explicit veri- fication of the uncertainty principle between position and momentum. The question I want to discuss in this letter is: exactly which mathematical form of the uncertainty principle is verified in this experiment?
In previous work [2-51 we have studied the math- ematical expression of the uncertainty principle. It was found that the well-known relation
upu4 2 l/2 (fi = 1) (1)
is not adequate for this purpose. Here, up and u4 de- note the standard deviations in momentum and po- sition,
(up)2 = (p2> - <p>2 ) (Q = (q2) - (qP . (2)
We proposed a new formulation of the uncertainty principle in terms of the “mean peak width” w and the “overall width” W of a wavefunction. For a nor- malized position wavefunction $(q), the quantities wJ, and IV* are defined as the smallest positive num- bers satisfying
(3)
0.3759601/85/$03.30 0 Elsevier Science Publishers B.V. (North-Holland Physics Publishing Division)
qo+WP
s lW12 dq = iv, for some q. E R . (4) qo-WI2
Here N and M are arbitrarily chosen fured numbers between (say) l/2 and 1. Roughly speaking, for a wavefunction J, containing a number of peaks, ws is of the order of the average peak width, while I%‘$ is of the order of the distance between the outermost peaks. For the normalized momentum wavefunction cp(p), w,,, and W+, are defined similarly. The uncertain- ty principle is then expressed by the relation:
wGIVw,>2 arccos(M-Nt 1)/N for M62N-1,
(5)
the same relation holding with $ and cp interchanged. Let us briefly review the way the neutron experi-
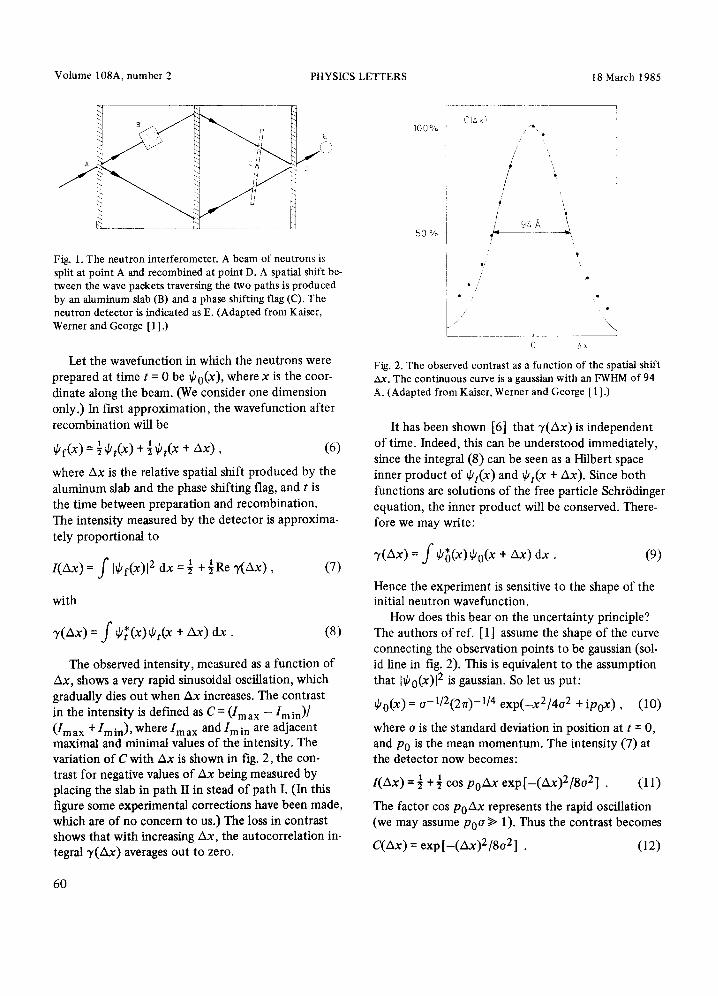
ment is performed. A beam of neutrons is split co- herently at point A and recombined at point D. (See fig. 1.) In path I a slab of aluminum is placed, which causes the wave packet traversing this path to be de- layed relative to the wave packet traversing path II. An additional small shift between the two packets can be produced by rotating a phase shifting flag about an axis perpendicular to the plane of the inter- ferometer.
59
Volume 108A, number 2 PHYSICS LETTERS 18 March 1985
Fig. 1. The neutron interferometer. A beam of neutrons is split at point A and recombined at point D. A spatial shift be- tween the wave packets traversing the two paths is produced by an aluminum slab (B) and a phase shifting flag (C). The neutron detector is indicated as E. (Adapted from Kaiser, Werner and George [ 1 ] .)
Let the wavefunction in which the neutrons were prepared at time t = 0 be Qo(x), where x is the coor- dinate along the beam. (We consider one dimension only.) In first approximation, the wavefunction after
recombination will be
~f(x)=;~,(x)+&‘& + Ax) > (6)
where Ax is the relative spatial shift produced by the aluminum slab and the phase shifting flag, and t is the time between preparation and recombination. The intensity measured by the detector is approxima-
tely proportional to
I(Ax) = s Wf(x)12 dx = $ t $Re r(Ax) ,
with
(7)
r(Ax) = s G;(x)tit(x + Ax) dx . (8)
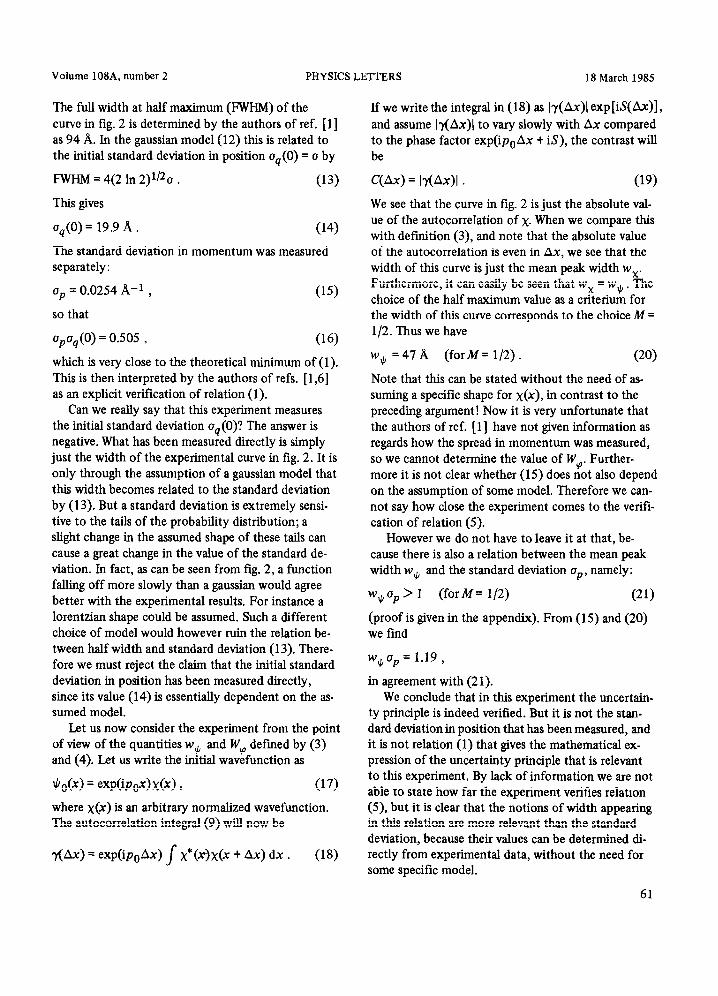
The observed intensity, measured as a function of Ax, shows a very rapid sinusoidal oscillation, which gradually dies out when Ax increases. The contrast in the intensity is defined as C = (I,,, - Imin)/ (I,,, + Imln), where Imax and Imln are adjacent maximal and minimal values of the intensity. The variation of C with Ax is shown in fig. 2, the con- trast for negative values of Ax being measured by placing the slab in path II in stead of path I. (In this figure some experimental corrections have been made, which are of no concern to us.) The loss in contrast shows that with increasing Ax, the autocorrelation in- tegral r(Ax) averages out to zero.
60
50 %
t l ,’
,* .
. . ~
1 / ,’
,-.--ii
c ?Ik
Fig. 2. The observed contrast as a function of the spatial shift AX. The continuous curve is a gaussian with an FWHM of 94 .&. (Adapted from Kaiser, Werner and George [ 11.)
It has been shown [6] that I is independent of time. Indeed, this can be understood immediately, since the integral (8) can be seen as a Hilbert space inner product of G&x) and $,(x t Ax). Since both functions are solutions of the free particle Schrodinger equation, the inner product will be conserved. There- fore we may write:
r(Ax) = 1 G;(x) tio(x + Ax) dx . (9)
Hence the experiment is sensitive to the shape of the initial neutron wavefunction.
How does this bear on the uncertainty principle? The authors of ref. [l] assume the shape of the curve connecting the observation points to be gaussian (sol- id line in fig. 2). This is equivalent to the assumption that l$o(x)12 is gaussian. So let us put:
$0(x) = .-1/2(2.rr)-l/4 exp(-x2/4a2 t&.x) , (10)
where u is the standard deviation in position at t = 0, and p. is the mean momentum. The intensity (7) at the detector now becomes:
[(Ax) = i + 4 cos pOAx exp[-(Ax)2/802] . (11)
The factor cos poAx represents the rapid oscillation (we may assume pea % 1). Thus the contrast becomes
C(Ax) = exp[-(Ax)2/8u2] . (12)
Volume 108A, number 2 PHYSICS LETTERS 18 March 1985
The full width at half maximum (FWHM) of the curve in fig. 2 is determined by the authors of ref. [ 1] as 94 A. In the gaussian model (12) this is related to the initial standard deviation in position ~~(0) = u by
FWHM = 4(2 ln 2)li20 . (13)
This gives
u&O) = 19.9 a . (14)
The standard deviation in momentum was measured separately:
up = 0.0254 A-l , 05)
so that
UPU4(0) = 0.505 ) (16)
which is very close to the theoretical minimum of (1). This is then interpreted by the authors of refs. [ 1,6] as an explicit verification of relation (1).
Can we really say that this experiment measures the initial standard deviation uJO)? The answer is negative. What has been measured directly is simply just the width of the experimental curve in fig. 2. It is only through the assumption of a gaussian model that this width becomes related to the standard deviation by (13). But a standard deviation is extremely sensi- tive to the tails of the probability distribution; a slight change in the assumed shape of these tails can cause a great change in the value of the standard de- viation. In fact, as can be seen from fig. 2, a function falling off more slowly than a gaussian would agree better with the experimental results. For instance a lorentzian shape could be assumed. Such a different choice of model would however ruin the relation be- tween half width and standard deviation (13). There- fore we must reject the claim that the initial standard deviation in position has been measured directly, since its value (14) is essentially dependent on the as- sumed model.
Let us now consider the experiment from the point of view of the quantities wIL and WV defined by (3) and (4). Let us write the initial wavefunction as
rclo(x) = exp(ipgx)x(x) , (17)
where x(x) is an arbitrary normalized wavefunction. The autocorrelation integral (9) wilI now be
dAx) = exp(ipo Ax) 1 x*(x)x(x + Ax) dx . (18)
If we write the integral in (18) as Ir(Ax>l exp[iS(Ax)l, and assume l+y(Ax)l to vary slowly with Ax compared to the phase factor exp(ipoAx t is), the contrast will be
C(Ax) = lr(Ax)l . (1%
We see that the curve in fig. 2 is just the absolute vaI- ue of the autocorrelation of x. When we compare this with definition (3), and note that the absolute value of the autocorrelation is even in Ax, we see that the width of this curve is just the mean peak width wx. Furthermore, it can easily be seen that wx = wlcl . The choice of the half maximum value as a criterium for the width of this curve corresponds to the choice M = l/2. Thus we have
wJ, =47A (forM= l/2). (20)
Note that this can be stated without the need of as- suming a specific shape for x(x), in contrast to the preceding argument! Now it is very unfortunate that the authors of ref. [ 1] have not given information as regards how the spread in momentum was measured, so we cannot determine the value of IV,. Further- more it is not clear whether (15) does not also depend on the assumption of some model. Therefore we can- not say how close the experiment comes to the verifi- cation of relation (5).
However we do not have to leave it at that, be- cause there is also a relation between the mean peak width w+ and the standard deviation up, namely:
wJIuP > 1 (forM= l/2) (21)
(proof is given in the appendix). From (15) and (20) we find
W$UP = 1.19 )
in agreement with (2 1). We conclude that in this experiment the uncertain-
ty principle is indeed verified. But it is not the stan- dard deviation in position that has been measured, and it is not relation (1) that gives the mathematical ex- pression of the uncertainty principle that is relevant to this experiment. By lack of information we are not able to state how far the experiment verifies relation (5) but it is clear that the notions of width appearing in this relation are more relevant than the standard deviation, because their values can be determined di- rectly from experimental data, without the need for some specific model.
61
Volume 108A, number 2 PHYSICS LETTERS 18 March 1985
I want to thank Jan Hilgevoord for his stimulus provided to this work.
Appendix. First note
~S*(x)lL(x -u) dx = s ldp)12 eiPY dp .
Then, if w = w$, it follows from (3):
M= 1 s ldp)12 eiPw dp 1
= js I& + poll2 eiPw dp
2 Re J- Idp +po)12 &Pow dp
= 1 ldp + po)12 cos PW dp
Hence wJ, up > [2( 1 - M)] U2. If we choose M = l/2, (2 1) is obtained.
References
[l] H. Kaiser, S.A. Werner and EA. George, Phys. Rev. Lett. 50 (1983) 560.
[2] J. Hilgevoord and J.B.M. Uffink, Phys. Lett. 95A (1983) 474.
[3] J.B.M. Uffink and J. Hilgevoord, Phys. Lett. 105A (1984) 176.
[4] J.B.M. Uffink and J. Hilgevoord, Uncertainty principle and uncertainty relations, preprint (1984).
[S] J. Hilgevoord and J.B.M. Uffink, Eur. J. Phys., to be pub- lished.
[6] A.G. Klein, G.I. Opat and W.A. Hamilton, Phys. Rev. Lett. 50 (1983) 563.
> $ MP +po)12(l - ip2w2) dp
= 1 -;w2(uP)2 .
62