venture capital principles in the european ict...
TRANSCRIPT
Garry A Gabison
How can they help ICT
innovation?
Venture Capital Principles in the European ICT Ecosystem
2015
EUR 27651 EN

This publication is a Science for Policy report by the Joint Research Centre, the European Commission’s in-house
science service. It aims to provide evidence-based scientific support to the European policy-making process.
The scientific output expressed does not imply a policy position of the European Commission. Neither the
European Commission nor any person acting on behalf of the Commission is responsible for the use which might
be made of this publication.
JRC Science Hub
https://ec.europa.eu/jrc
JRC98783
EUR 27651 EN
PDF ISBN 978-92-79-54183-4 ISSN 1831-9424 doi:10.2791/6709 LF-NA-27651-EN-N
© European Union, 2015
Reproduction is authorised provided the source is acknowledged.
How to cite: Garry A Gabison (2015) Venture Capital Principles in the European ICT Ecosystem; EUR 27651 EN;
doi:10.2791/6709
All images © European Union 2015
Abstract
This report looks at venture capital (VC) funds, their characteristics, and functioning. It specifically focuses on
the relationship between VCs and innovation, investigating whether VC funds encourage innovative companies to
innovate or whether they successfully predict which companies will innovate more.
The report also focuses on the selection process at micro-level. VC funds invest in young and innovative
companies and decide where to invest based on imperfect information and signals. The ICT industry has a
number of young innovative companies and unsurprisingly VC funds have concentrated their efforts on the ICT
industry. In 2013, about 25% of invested funds went into ICT companies even though ICT companies represent
less than 6% of all companies.
The report then steps back to look at the macro-level. Once they have invested, VC funds use stage financing,
monitoring, and exit incentives to re-align their incentives with those of the company receiving the funds. Since
they rely on monitoring, VC funds usually prefer to invest in local companies that they can visit regularly. This
issue of local investment is seen as a hindrance and EU policymakers have tried to remedy it passing a regulation
to facilitate the cross-border funding. The EU has also partly funded the European Investment Fund to further
encourage investment and cross-border investment.
1
Table of Contents
Foreword.............................................................................................................. 2
Acknowledgements ................................................................................................ 3
Executive Summary ............................................................................................... 4
1. Introduction ............................................................................................ 5
2. Venture Capital Principles ....................................................................... 6
2.1 Funds are a limited partnership in which fund managers are general partners
and investors are limited partners...................................................................... 7
2.2 Creating the right incentives between funds and fund-seeking companies ... 13
2.2.1 Business model of different funds .................................................... 13
2.2.2 Monitoring, the key to creating incentives ......................................... 21
3. VC Funds, ICT, Fast Growing and Innovative Companies ...................... 24
3.1 ICT and innovative companies ............................................................... 24
3.2 ICT and fast growing companies ............................................................ 26
4. European VC Ecosystem ........................................................................ 29
4.1 A VC EU market? Venture capital funds prefer to invest in their home markets
29
4.2 European Policies and the European Investment Fund .............................. 33
5. Conclusion ............................................................................................ 39
List of Figures ..................................................................................................... 46
2
Foreword
This report was prepared in the context of the three-year research project on European
Innovation Policies for the Digital Shift (EURIPIDIS) jointly launched in 2013 by JRC-IPTS
and DG CONNECT of the European Commission in order to improve understanding of
innovation in the ICT sector and of ICT-enabled innovation in the rest of the economy.1
The purpose of the EURIPIDIS project is to provide evidence-based support to the
policies, instruments and measurement needs of DG CONNECT for enhancing ICT
Innovation in Europe, in the context of the Digital Agenda for Europe and of the ICT
priority of Horizon 2020. It focuses on the improvement of the transfer of best research
ideas to the market.
EURIPIDIS aims are:
1. to better understand how ICT innovation works, at the level of actors such as
firms, and also of the ICT “innovation system” in the EU;
2. to assess the EU's current ICT innovation performance, by attempting to measure
ICT innovation in Europe and measuring the impact of existing policies and
instruments (such as FP7 and Horizon 2020); and
3. to explore and suggest how policy makers could make ICT innovation in the EU
work better.
The present report contributes to the first point. This report looks at one of the main
barriers and drivers of innovation: financing. It investigates an institutional financier of
firms and innovation: venture capital companies.
1 For more information, see the project web site: http://is.jrc.ec.europa.eu/pages/ISG/EURIPIDIS/EURIPIDIS.index.html

3
Acknowledgements
This analysis was produced in the context of the European Innovation Policies for the
Digital Shift (EURIPIDIS) project, which is jointly funded by DG CONNECT and JRC-IPTS
of the European Commission.2
I would like to thank my colleagues for their valuable input and comments during our
seminars. I would like to thank Patricia Farrer for her editorial suggestions. I would like
to thank the participants of our June workshop for their feedback. I would like to thank
Pierre Marro, Christine Simon, and Viorel Peca for their comments. I would also like to
acknowledge the valuable support provided by Federico Biagi and Paul Desruelle.
2 IPTS is one of the seven research institutes of the European Commission’s Joint Research Centre (JRC).
4
Executive Summary
The European Innovation Policies for the Digital Shift (Euripidis) project, run jointly by
the Institute for Prospective Technological Studies (IPTS) and the Directorate-General for
Communications Networks, Content and Technology (DG CNECT), is investigating the
barriers to information and communication technology (ICT) innovation. In previous
surveys, entrepreneurs and innovators have complained that access to finance was one
of the most pressing issues for small and medium-sized enterprises (SMEs) and start-
ups.
This report looks at a traditional investment method - venture capital - and its
characteristics: How do venture capital funds finance companies? How do they select
start-ups? How do they affect ICT companies and innovation? This report takes the
investors' point of view to answer these questions.
Since venture capital funds invest in young, small, and innovative companies, their fund
managers must defeat information asymmetries to invest profitably. They rely on
signals about the entrepreneur (education, past experience, etc.) and about the
companies (patent filed, turnover, etc.) to invest.
This report focuses on the funds and their decisions. Once they invest, fund managers
must face up to two problems. First, there is a moral hazard problem: when
entrepreneurs receive an investment, they gain control of the funds and may not use
them as agreed. Second, fund managers face an agency problem: when they invest,
they separate capital from management and this separation means that the
entrepreneur's and fund manager's incentives become misaligned. Therefore, fund
managers resort to stage financing, monitoring, and exit incentives to ensure that
entrepreneurs spend the invested money as agreed and remain motivated to perform.
Funds invest in innovative companies because they generally generate higher returns
upon exit. Venture capital funds often affect innovations in very complicated ways: they
tend to select innovative companies and make them even more innovative. Patents and
patent portfolios have been used by investors to measure the innovation potential of
companies and subsequently invest. Patents, though they are not a perfect measure of
innovation, allow entrepreneurs to signal to venture capital fund managers how ripe
their companies are for investment.
Because venture capital funds must monitor their investment, the venture capital
markets usually remain local. Even within Europe, venture capital funds tend to invest
within their national boarders: venture capital funds of a given country highly correlates
(0.92) to the fund received by companies of a given country. According to 2013 data,
the Czech Republic, the Netherlands, and the United Kingdom were the main
beneficiaries of the little cross-border investment occurring in Europe.
The European Union has passed regulations to facilitate cross-border investment. The
European Investment Fund has invested in many funds to help catalyse additional funds.
The financial returns may seem low at 4.2% in 2013 as compared to the private sector
but the global social impact may be greater than this number would imply.
5
1. Introduction
The European Innovation Policies for the Digital Shift (Euripidis) project, run jointly by
the Institute for Prospective Technological Studies (IPTS) and the Directorate-General for
Communications Networks, Content and Technology (DG CNECT), is investigating the
barriers to information and communication technology (ICT) innovation. Special
attention will be paid to the financial barriers that have a negative impact on innovative
companies and also ICT innovation.
Entrepreneurs cite ‘access to finance’ as the second most pressing problem for small and
medium-sized enterprises (SMEs) (Ipsos Mori, 2013). Start-ups face similar financing
problems and the financial crisis has made this fund shortage even more problematic
(Moncada-Paternò-Castello, Vezzani, Hervás, & Montresor, 2014). This report looks at a
traditional financing source for start-ups: venture capital (VC).
In order to understand how VC finances and affects the innovative ecosystem, its
idiosyncrasies must be understood. In VC funds, multiple entities pool their money in
order to invest in ventures. "Venture capital provides finance to undertakings that are
generally very small, that are in the initial stages of their corporate existence and that
have a strong potential for growth and expansion." (European Parliament and Council,
2013). The European Union sees facilitating venture capital as a way "to enhance the
growth and innovation of small and medium-sized enterprises (SMEs) in the Union."
(European Parliament and Council, 2013). Consequently, this report looks more closely
at the VC mechanisms and industry in Europe.
In the ICT industry, VCs are a central part of the ecosystem. In the past, most VC
funding went into ICT start-ups and companies (Gompers & Lerner, The Venture Capital
Revolution, 2001). Over the years, this trend has changed but ICT companies remain an
important VC fund destination. In Europe, over a third of the amount provided by VC
funds from 2007 to 2013 went into high-tech companies.
Figure 1 shows the amount of VC funds invested by sector, according to European
Private Equity & Venture Capital Association data, which "covers cover 90% of the €555
billion's worth of capital under management on the European market" (European Private
Equity and Venture Capital Association, 2014). At least 35% of VC funds went into the
computer and consumer electronics and communication sectors over the 2007-2013
period.
This report explores the characteristics of VC funds and the importance of the ICT
industry to these funds. The report is divided into three sections. First, it looks at the
main characteristics of venture capital. VC funds are encumbered by information
asymmetries in all the main stages: at the initial stage, when fund managers decide
where to invest; at the managing stage, due to moral hazard and agency problems; at
the exit stage, when VC investments need to be sold. To address these issues, VC fund
managers rely upon different tools: they use patents to defeat information asymmetries
and they monitor and control entrepreneurs to diminish moral hazard3 and agency costs.
Second, this report looks at how VC funds interact with innovation and more specifically
ICT innovation. VC funds rely on innovation to profit upon exit because innovative
companies can use innovation to either differentiate their products from incumbents or
they can supply the same products at a lower cost. Some scholars hypothesise that VC
funds astutely select innovative companies and provide them with funds to follow a path
that has already been set. Other scholars hypothesise that VC funds can encourage the
companies they back to innovate further than they would otherwise have. This report
presents both side of the debate.
3 Moral hazard occurs when entrepreneurs takes more risks with the VC fund's money than they would have if they were only managing their own. For instance, since entrepreneurs do not bear the full financial burden of the risks they take, they may take business decisions that advance their own goals instead of the goals of the VC funds.

6
Figure 1: Venture Capital Funds Invested by Sectors in Europe (in billion €)
Source: EVCA/PEREP_Analytics
Europe includes: Austria, the Baltic countries, Belgium, Bulgaria, the Czech Republic, Denmark, Ex-Yugoslavia, Finland, France, Germany, Greece, Hungary, Ireland, Italy, Luxembourg, the Netherlands, Norway, Poland, Portugal, Romania, Slovakia, Spain, Sweden, Switzerland, Ukraine, and the United Kingdom.
Finally, this report looks at the current state of the VC industry in Europe. VC markets
are traditionally local markets because investors need to monitor closely their
investments. The need to monitor and other factors (e.g. regulations) makes cross-
border investment unusual. This section explains how the European Union has attempted
to address these issues through regulation and by creating the European Investment
Fund, which invests in local funds.
2. Venture Capital Principles
Venture capital funds act as intermediaries: they collect funds from multiple investors
and invest in promising companies. They pool investors' capital together and then
invest it according to different principles specified within the portfolio or investment
agreement. Once invested, the fund managers foster the investment to maximize its
value.
Venture capital (VC) funds are a specific type of investment funds or investment pool.
The main characteristics of VC funds are (Metrick & Yasuda, 2011):
1. A VC fund invests only in private companies (not publicly-traded companies).
2. A VC fund monitors and helps the companies in its portfolio.
3. A VC fund maximizes its financial return by exiting investments through a sale or
an initial public offering (IPO).
0
1
2
3
4
5
6
7
2007 2008 2009 2010 2011 2012 2013
Am
ount
(Billion €
) In
vest
ed b
y S
ect
ors
Communications Comp. & cons. electronics Life sciences Energy & environment
Cons. goods & retail Cons. services Financial services Bus. & industrial services
Bus. & industrial products Chemicals & materials Agriculture Real estate
Construction Transportation Unclassified
7
4. A VC fund invests to fund the internal growth of companies.
This section discusses in more detail the legal form of these funds and how this form
impacts the relationship between investors and fund managers. This section also
discusses how fund managers select the companies in which they invest and how they
encourage these companies to give them a return on investment.
2.1 Funds are a limited partnership in which fund managers are
general partners and investors are limited partners
Venture Capital funds come in variety of legal forms. These legal forms or structures
warrant further investigation because they dictate how the funds invest, profit, and they
relate to innovation. This section investigates first the most common form for VC funds:
the limited partnership. It then discusses how limited partnerships are traditionally run
and, finally, alternative types of VC funds.
Limited partnership is the VC fund's most common legal form
Fund managers start by raising money from investors. They pursue a limited number of
potential investors – imposing a minimum per-investor fund threshold in order to benefit
from economies of scale (Gompers & Lerner, The Venture Capital Revolution, 2001).
Generally, VC firms create new funds every two to three years; hence, they must attract
investor capital on a regular basis. Investors invest in a fund based upon a private
placement memorandum or information memorandum, which is akin to a business plan
(Pearce & Barnes, 2006). Once they raise enough money to invest, the fund managers
or firms create a legal structure around these funds: the venture capital fund. The
process of fund raising can take six months to a year (Pearce & Barnes, 2006).
In the United States, VC funds are usually set up as limited partnerships: 84% of new
VC funds between 2002 and 2004 were limited partnerships in the US (Cumming,
Fleming, & Schwienbacher, The Structure of Venture Capital Funds, 2007). In Europe,
"in some Member States a limited partnership structure is the most used one, but
alternative corporate or similar vehicles can also be available" (European Commission,
2007).
The Member States of the European Union, however, do not have a common legal form
nor do they have a common definition of limited partnership (European Private Equity
and Venture Capital Association Tax and Legal Committee, 2010). An expert group
analysing the issue for the European Commission grouped countries according to the
vehicle they employ. In 2007, this expert group separated the countries into three
groups:
1. "Countries with specific structures to accommodate national and foreign VC
investors on a tax-transparent or tax-neutral basis;" (e.g. France, Italy,
Luxembourg, Portugal, Spain).
2. "Countries with specific VC structures, including some structures that are tax-
exempt, but these structures are too complex and restrictive and are thus in
practice virtually useless;" (e.g. Finland).
3. "Countries without any rules or regulation and no structure defined in local
legislation. In some cases, investment vehicles are using existing corporate
structures; and in other cases, investments are possible only by using an off-
shore or intermediary investment vehicle." (e.g. Austria, Denmark, Germany,
Ireland, the Netherlands, Sweden, and the United Kingdom).
(European Commission, 2007)
In 2013, the European Union passed the Regulation (EU) No 345/2013 of the European
Parliament and of the Council of 17 April 2013 on European venture capital funds. This
regulation aims to facilitate fundraising for VC fund managers across borders by granting
8
them a passport. The regulation does not address the vehicle, 4 which affects the
functioning of VCs; nor does it address the tax treatment, which affects fundraising. The
regulation came into play in 2014 and its impact has yet to be assessed.
The following discussion focuses on VC funds organized as limited partnerships;
however, this discussion applies to other legal forms describe above. Under common
law, a limited partnership has at least one limited partner and at least one general
partner.
General partners manage the daily activities of the investment pool. They are liable for
the debts of the partnership; hence, general partners can only be natural persons or
partnerships – and not corporations. General partners also invest in the fund. The
funds invested by general partners are usually small (usually a nominal amount of 1% of
the pool) in comparison with the investment of limited partners.
Limited partners are passive investors and as such, they are not liable for the debts of
the business and can lose their initial investment if the fund fails. They do not
participate in the daily management of the fund or decide in which companies to invest.
If they decide to participate in the daily fund management, they will qualify as a general
partner and become fully liable for the business's debts.
Limited partnerships offer multiple advantages. First, investors (limited or general
partners) avoid the double taxation that would be imposed on capital gains if the VC
fund was set up as a corporation.5 Second, limited partnerships offer flexibility to the
partners. In limited partnerships, partners can negotiate the investment terms including
covenants, which can take the form of duties, rights, and obligations of each partner
(Cumming, Fleming, & Schwienbacher, 2007, p. 163). For instance, in a limited liability,
partners can negotiate remunerations, investment size and timing, borrowing strategies,
divestment timing and strategy, reinvestment of funds, and co-investment with other
funds (Klausner & Litvak, 2002). In other words, partners can use the investment
agreements to solve some of the information asymmetries between the limited partners
and the general partners (Triantis, 1999). In a corporation, a number of these
obligations are imposed through statutes and offer less flexibility.
Limited partnerships have one major downside: limited partnership investors cannot
withdraw or sell their investment without breaking the partnership – unlike in a
corporation.6 Hence, when investors pool their funds, these funds are locked in for a
specific duration set in the partnership agreement. Funds usually have a lifespan of ten
years, extendable by one to two years (Sahlman, 1990; Gompers & Lerner, 2001). This
characteristic affects how VC funds recoup their investment: VC funds profit by reselling
their investment instead of waiting for their investment to bear fruit (e.g. dividends).
Relationship between VC funds and investors and their remunerations
Limited partners commit to invest capital but only release it to the general partner once
he/she has selected where to invest. The timing issue and limited partner rights and
obligations are set in the limited partnership agreement. For instance, the agreement
can describe the fund distribution, the right to appoint an investment manager and
remove the general partner, etc. (for more information see e.g. BVCA (2002), which
4 The vehicle is the VC fund. Each country has different regulations that have affected how VC fund have decided to form and integrate.
5 Generally, a corporation, as an independent entity, files an income tax and pays taxes on their profits. If
the profits are later dispensed to shareholders in the form of dividends, then the shareholder will pay taxes on income (or even capital gain if the corporation is dissolved). The profit is thus taxed twice: at the corporation level and later at the shareholder level. Generally, limited partnerships are not an independent entity from the partners; partners file taxes and declare their share of the profits as income; hence, they pay taxes only once.
6 Under certain circumstances, they may be able to transfer their interest. It often requires the Limited Partner to obtain consent of the other partners. (BVCA, 2002).

9
discusses the clauses that are most often included in a limited partnership agreement in
the UK).
The limited partnership agreement also restricts the VC fund manager. For instance, the
manager may not be able to create a new VC fund until the initial VC funds have been
fully invested (BVCA, 2002). As a contract, the content of the agreement is very
malleable and each agreement is unique. However, all VC funds attempt to address the
shortcomings of their relationship with investors through the contract.
Two of these shortcomings are particularly important: firstly, adverse selection problem7
associated with investing in a product of unknown quality and secondly, agency
problems8 associated with separating capital from management.
The adverse selection problem is linked to the information asymmetries about the VC
fund quality. Individual investors need to select a VC fund very carefully, as they do not
know with certainty in which companies fund managers will invest (Klausner & Litvak,
2002). The vetting for investor funds suffers from Arrow's information paradox: fund
managers may know where they wish to invest but cannot disclose this information
during the investment negotiation because this would destroy the value of their services.
These information asymmetries affect investment decisions and specifically how
investors separate good VC funds from bad. To defeat these information asymmetries,
investors separate bad and good VC funds by rely looking at the General Partner's
reputation and experience. Older VC funds have a track record and reputation that allow
them to raise more funds faster (Gompers & Lerner, 1998).
Investors can also defeat these information asymmetries by offering different
compensation packages during the negotiation and letting the general partner select the
package: good VC fund managers would prefer performance-based compensation
because they believe they may maximize their revenues this way – and hence VC fund
managers reveal how good they are. The compensation package can also be used to
defeat the agency problem (Metrick & Yasuda, 2011).
Second, the agency problem arises out the limited partnership structure that separates
ownership from management of funds, and misaligns limited and general partners'
incentives. Limited partners receive compensation for their investment when the fund
comes to fruition, whereas general partners receive compensation for their work (and
investment) in the form of management fees and carried interest. Management fees are
a set percentage of the committed capital that is paid every year to the general partner.
They help to pay – but not always fully – for daily expenses without having to wait ten to
fifteen years for the full divestment (Metrick & Yasuda, 2011). These fees are usually
2% of the committed capital per year. The carried interest is a set percentage of the
profits (at the time of sale), which the general partner keeps. This interest is usually
around 20% of the profits (Metrick & Yasuda, 2011). The carried interest helps
realigned general and limited partners incentive to maximize the limited partners'
returns – alleviating some agency problems without entirely erasing them.
Finally, since VC firms create new funds every few years, the relationship between
limited and general partners is often repeated. The reputational impact of failure helps
mitigate some of the misalignments (Gompers & Lerner, 1998).
7 Adverse selection problem arise in market where quality information about a product cannot be directly observed; as such, all product providers have incentives to inflate their product quality, which makes it difficult (if not impossible) for the costumer to separate products of high quality from the products of low quality.
8 Agency problem arise when an individual is hired to act on someone else's behalf and this employee (also called agent) may have incentives and self-interest that differ from his employers.
10
Different types of investors and funds
VC fund investors are traditionally institutional investors. This is due mainly to two
factors. First, invested funds are locked in for a long time period and second, VC funds
prefer to raise capital from large investors in order to benefit from economies of scale.
In the United States, the VC industry boomed following a loosening of the "prudent
investor" rule which pension fund managers had to respect (Gompers & Lerner, 1998).
The "prudent investor" rule prevented pension managers from investing in risky assets –
and VC funds were considered risky assets. Hence, following the change, more
institutional investors were willing to invest in VC funds. In the US, pension funds,
endowments, and foundations constituted the large majority of committed capital to VC
funds between 1980 and 2001 (Metrick & Yasuda, 2011).
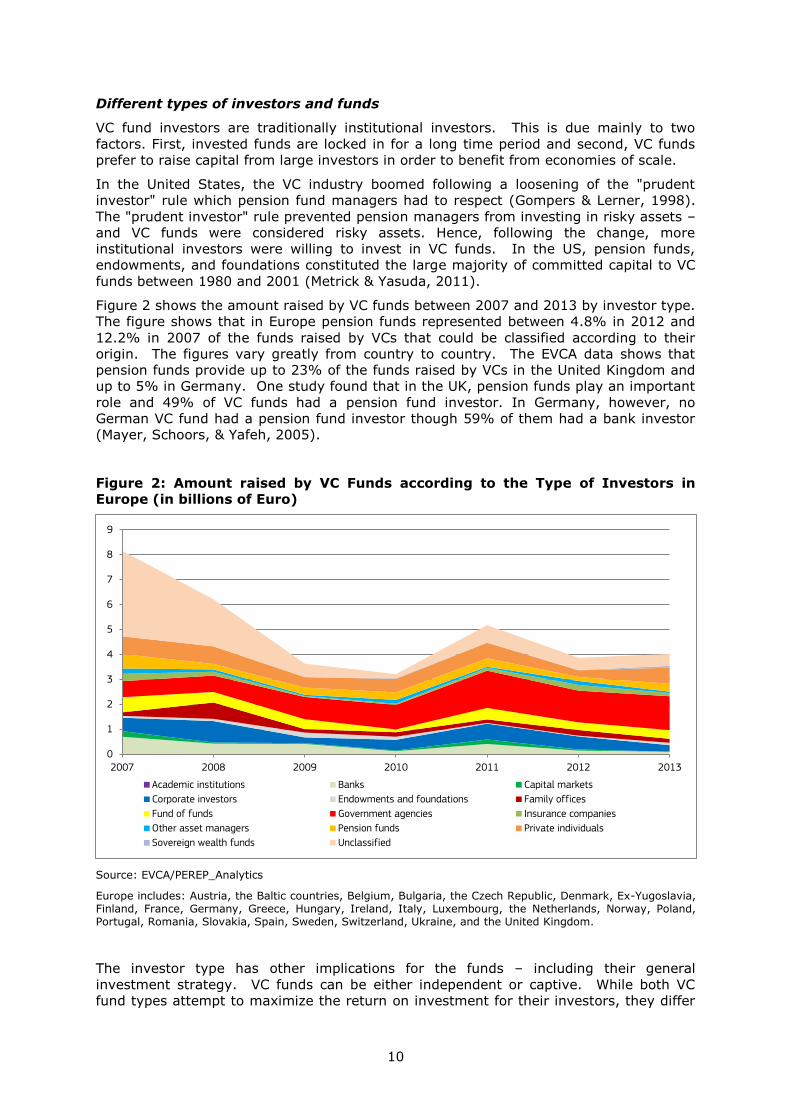
Figure 2 shows the amount raised by VC funds between 2007 and 2013 by investor type.
The figure shows that in Europe pension funds represented between 4.8% in 2012 and
12.2% in 2007 of the funds raised by VCs that could be classified according to their
origin. The figures vary greatly from country to country. The EVCA data shows that
pension funds provide up to 23% of the funds raised by VCs in the United Kingdom and
up to 5% in Germany. One study found that in the UK, pension funds play an important
role and 49% of VC funds had a pension fund investor. In Germany, however, no
German VC fund had a pension fund investor though 59% of them had a bank investor
(Mayer, Schoors, & Yafeh, 2005).
Figure 2: Amount raised by VC Funds according to the Type of Investors in
Europe (in billions of Euro)
Source: EVCA/PEREP_Analytics
Europe includes: Austria, the Baltic countries, Belgium, Bulgaria, the Czech Republic, Denmark, Ex-Yugoslavia, Finland, France, Germany, Greece, Hungary, Ireland, Italy, Luxembourg, the Netherlands, Norway, Poland, Portugal, Romania, Slovakia, Spain, Sweden, Switzerland, Ukraine, and the United Kingdom.
The investor type has other implications for the funds – including their general
investment strategy. VC funds can be either independent or captive. While both VC
fund types attempt to maximize the return on investment for their investors, they differ
0
1
2
3
4
5
6
7
8
9
2007 2008 2009 2010 2011 2012 2013
Academic institutions Banks Capital markets
Corporate investors Endowments and foundations Family offices
Fund of funds Government agencies Insurance companies
Other asset managers Pension funds Private individuals
Sovereign wealth funds Unclassified
11
in their approach. Independent funds are independent from their investors. These VC
funds invest into companies based on their profit potential upon exit. Captive VC funds
are subsidiaries and subordinates of a larger company or a financial institution (fully-
captive). They can also have a larger corporation or a financial institution as a majority
investor whose funds are complemented by independent investors (semi-captive)
(Mason & Harrison, 2002). Captive funds can benefit their investor through strategic
investing into complementary companies.
In Europe, VC funds are usually independent (66.7% in Europe between 2002 and 2004)
and the minority are captive VC funds (16.5%) (Cumming, Fleming, & Schwienbacher,
The Structure of Venture Capital Funds, 2007). The EVCA dataset offers limited
information on VC fund types, though it offers information about fund types for all
private equity investment. Figure 3 shows a broad picture of the private equity market
in Europe between 2007 and 2013.
Private equity is equity capital provided to enterprises not quoted on a stock market.
Private equity includes the following investment stages: venture capital, growth capital,
replacement capital, rescue/turnaround and buyouts. Venture capital is a subset of
private equity and refers to equity investments made for launch (seed), early
development (start-up), or expansion (later stage venture) of business. (European
Private Equity and Venture Capital Association, 2014).
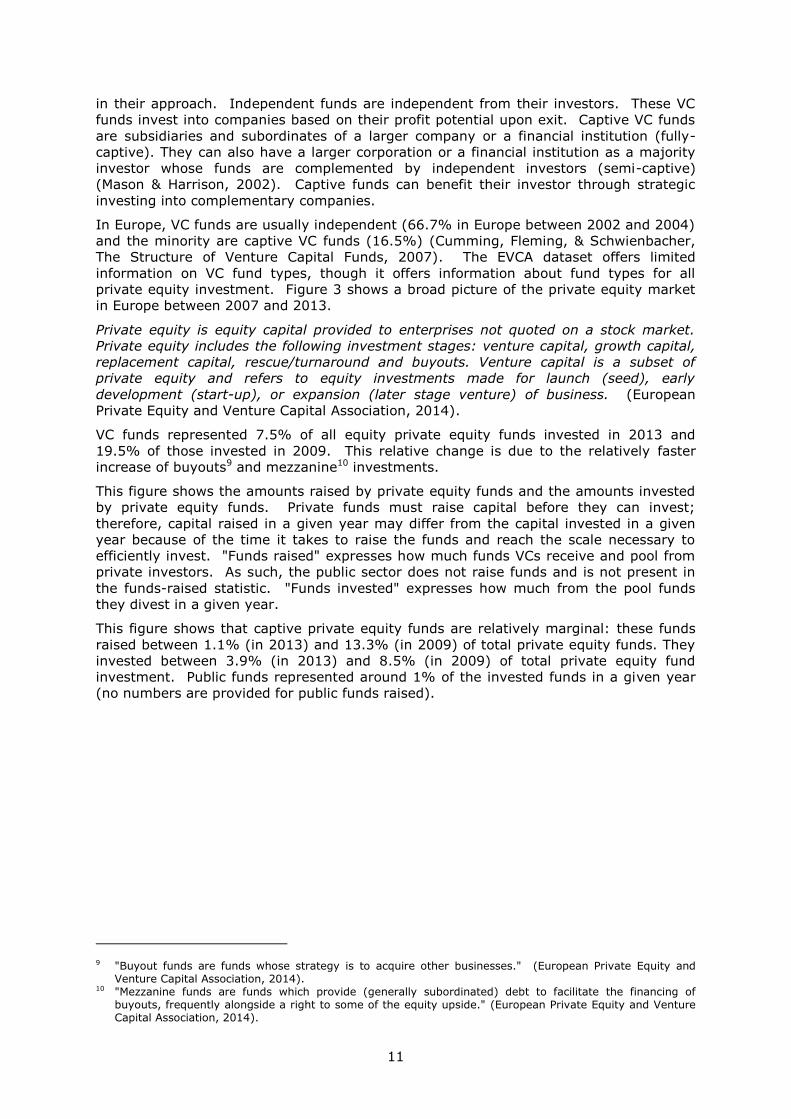
VC funds represented 7.5% of all equity private equity funds invested in 2013 and
19.5% of those invested in 2009. This relative change is due to the relatively faster
increase of buyouts9 and mezzanine10 investments.
This figure shows the amounts raised by private equity funds and the amounts invested
by private equity funds. Private funds must raise capital before they can invest;
therefore, capital raised in a given year may differ from the capital invested in a given
year because of the time it takes to raise the funds and reach the scale necessary to
efficiently invest. "Funds raised" expresses how much funds VCs receive and pool from
private investors. As such, the public sector does not raise funds and is not present in
the funds-raised statistic. "Funds invested" expresses how much from the pool funds
they divest in a given year.
This figure shows that captive private equity funds are relatively marginal: these funds
raised between 1.1% (in 2013) and 13.3% (in 2009) of total private equity funds. They
invested between 3.9% (in 2013) and 8.5% (in 2009) of total private equity fund
investment. Public funds represented around 1% of the invested funds in a given year
(no numbers are provided for public funds raised).
9 "Buyout funds are funds whose strategy is to acquire other businesses." (European Private Equity and Venture Capital Association, 2014).
10 "Mezzanine funds are funds which provide (generally subordinated) debt to facilitate the financing of buyouts, frequently alongside a right to some of the equity upside." (European Private Equity and Venture Capital Association, 2014).
12
Figure 3: Funds Raised and Invested by All Private Equity Funds (2007-13) in
Europe (billions of Euro) 11
Note: VC funds represented 7.5% of all equity private equity funds in 2013 (down from 19.5% in 2009)
Source: EVCA/PEREP_Analytics
Europe includes: Austria, the Baltic countries, Belgium, Bulgaria, the Czech Republic, Denmark, Ex-Yugoslavia, Finland, France, Germany, Greece, Hungary, Ireland, Italy, Luxembourg, the Netherlands, Norway, Poland, Portugal, Romania, Slovakia, Spain, Sweden, Switzerland, Ukraine, and the United Kingdom.
Captive (and governmental) funds often behave differently to independent funds
because they are part of a larger system. Captive funds which are owned by a private
company may want to support the parent company's strategy. For instance, a captive
fund can invest in a company upstream from the VC fund owner in order to help provide
a vital input. Governmental funds may want to support governmental directives and
interests.
Captive (and governmental) funds usually require a lower rate of return than
independent funds because they have added strategic interest and require lower costs to
function (Manigart, et al., 2002). Since the entity that owns or governs the funds can
extract benefits beyond its return on investment (e.g. upstream supplier synergies),
they require lower rates of return. Captive fund managers may tolerate more failures
because their remuneration is usually also linked to the parent company's performance
and not only the fund's performance. Empirically, captive funds have been found to
invest in younger, riskier, less profitable companies than independent VC funds and in
more innovative companies as measured by patent counts (Chemmanur, Loutskina, &
Tian, 2015). For public funds, 86% of governmental funds are funds of funds, which are
VC funds that invest in other VC funds (Brander, Du, & Hellmann, 2014). The example
of the European Investment Fund is discussed in more details in Section 4.2.
Furthermore, captive and governmental funds incur lower transaction costs because they
do not need to expend resources in raising funds. A fully captive fund may also extract
11 “Captive funds” refers to funds that are 100% owned by the parent organisation, while “independent funds” relates to semi-captive funds (those in which the parent owns less than 100%) as well as wholly independent funds. A fund that is 100% owned by capital markets or individuals is considered independent, so only 100% ownership by an institution qualifies the fund as captive. (European Private Equity and Venture Capital Association, 2014).
0.00
10.00
20.00
30.00
40.00
50.00
60.00
70.00
80.00
90.00
Funds
Rais
ed
Funds
Inve
sted
Funds
Rais
ed
Funds
Inve
sted
Funds
Rais
ed
Funds
Inve
sted
Funds
Rais
ed
Funds
Inve
sted
Funds
Rais
ed
Funds
Inve
sted
Funds
Rais
ed
Funds
Inve
sted
Funds
Rais
ed
Funds
Inve
sted
2007 2008 2009 2010 2011 2012 2013
Am
ounts
(in
Billion €
) Rais
ed a
nd I
nvest
ed
Public sector
Captives
Independent
13
more benefit from being organized as a corporation – since it may not have a finite life
like traditional VC funds.
An example of a captive fund is Intel Capital, a subsidiary of Intel, Inc. In 2014, Intel
Capital made 125 investments (59 new investments and 66 follow-ons) for a total of
$359 million, 16% of which went into Western Europe and Israel. Intel Capital completed
26 exits (4 IPOs and 22 acquisitions or mergers). Recent successful Intel Capital IPOs
include AVG Technology, a Czech software company on February 2012; recent
acquisitions include Movea a French software company acquired by InvenSense or BASIS
Science a US wearable technology provider acquired by Intel (Intel Capital, 2014).
Section 4.2 investigates the European Investment Fund, an example of a governmental
fund, in more detail. In general, since captive and governmental funds represent a small
portion of invested funds (Figure 3), the following sections focus on the methods
deployed by independent funds.
Once the general partners have convinced investors to provide capital and signed
investment contracts and once they have raised enough funds, they must invest them.
The next section discusses how and where fund managers decide to invest.
2.2 Creating the right incentives between funds and fund-
seeking companies
The fund managers must successfully invest the funds and profitably exit in order to
receive any carried interest. Their investment decisions have come under heavy scrutiny
in the literature. Section 2.2.1 discusses first this investment decision. Section 2.2.2
discusses the relationship between the funds and the companies in which they invest
and explains how funds encourage internal growth.
2.2.1 Business model of different funds
To survive and thrive, VC funds and their managers must invest strategically. This
section looks at how fund managers select the companies in which they invest in three
steps: screening; developing in stages; and encouraging growth.
Selecting candidate companies and signalling potential
VC funds invest in private companies by definition. VC funds invest in private companies
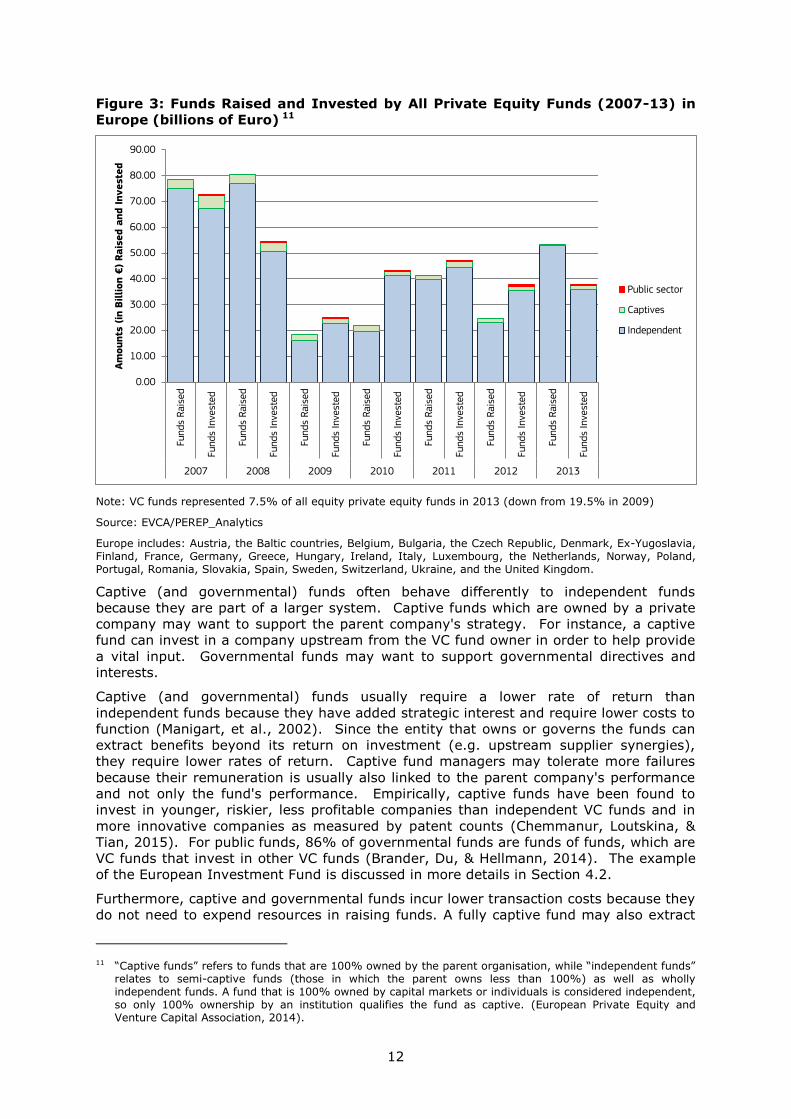
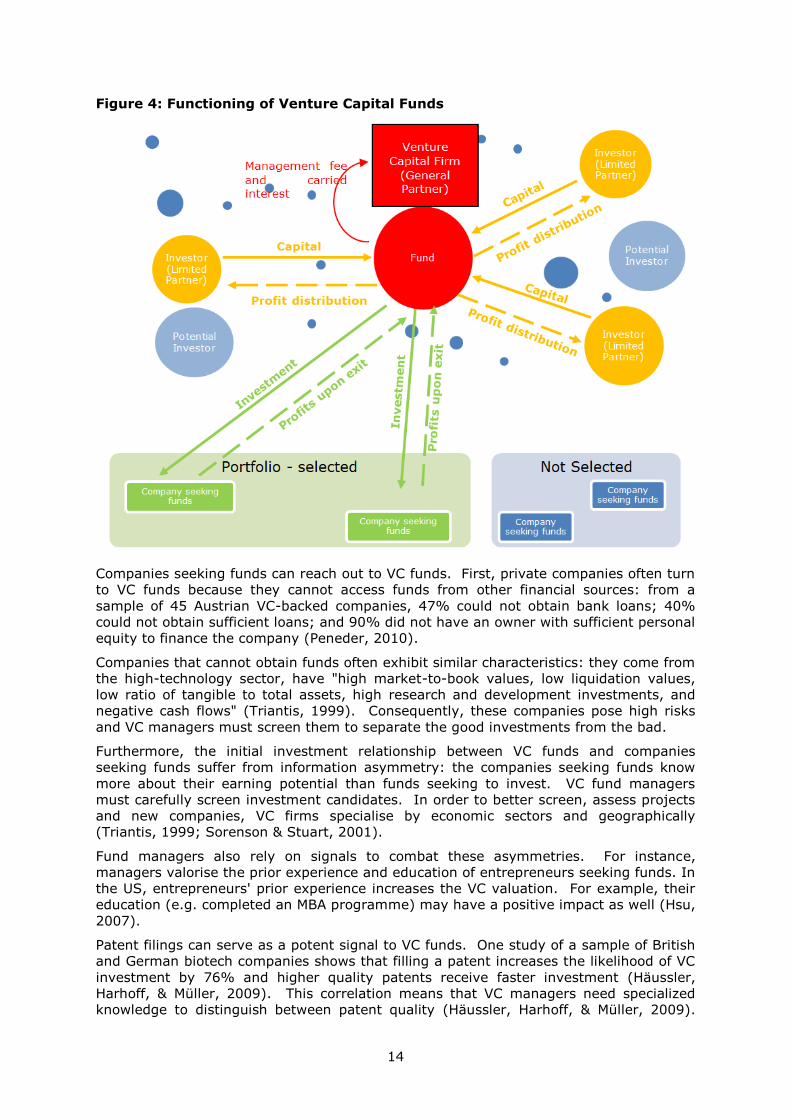
by definition. Figure 4 summarizes the relationships involved in the VC system.
14
Figure 4: Functioning of Venture Capital Funds
Companies seeking funds can reach out to VC funds. First, private companies often turn
to VC funds because they cannot access funds from other financial sources: from a
sample of 45 Austrian VC-backed companies, 47% could not obtain bank loans; 40%
could not obtain sufficient loans; and 90% did not have an owner with sufficient personal
equity to finance the company (Peneder, 2010).
Companies that cannot obtain funds often exhibit similar characteristics: they come from
the high-technology sector, have "high market-to-book values, low liquidation values,
low ratio of tangible to total assets, high research and development investments, and
negative cash flows" (Triantis, 1999). Consequently, these companies pose high risks
and VC managers must screen them to separate the good investments from the bad.
Furthermore, the initial investment relationship between VC funds and companies
seeking funds suffer from information asymmetry: the companies seeking funds know
more about their earning potential than funds seeking to invest. VC fund managers
must carefully screen investment candidates. In order to better screen, assess projects
and new companies, VC firms specialise by economic sectors and geographically
(Triantis, 1999; Sorenson & Stuart, 2001).
Fund managers also rely on signals to combat these asymmetries. For instance,
managers valorise the prior experience and education of entrepreneurs seeking funds. In
the US, entrepreneurs' prior experience increases the VC valuation. For example, their
education (e.g. completed an MBA programme) may have a positive impact as well (Hsu,
2007).
Patent filings can serve as a potent signal to VC funds. One study of a sample of British
and German biotech companies shows that filling a patent increases the likelihood of VC
investment by 76% and higher quality patents receive faster investment (Häussler,
Harhoff, & Müller, 2009). This correlation means that VC managers need specialized
knowledge to distinguish between patent quality (Häussler, Harhoff, & Müller, 2009).
15
The relationship between patents and VC is further discussed in Section 3 when looking
at innovation.
Beyond observable characteristics and signals, VC funds rely on entrepreneurs to reveal
information about their projects through their actions. More precisely, VC funds may
offer different terms to entrepreneurs to get them to reveal their project's quality. For
instance, VC managers may offer an entrepreneur staged financing, which requires the
entrepreneurs to reach certain stages (e.g. prototype, mass production,
commercialization, etc.) before funds are released. Staged financing also helps to
separate bad entrepreneurs from the good, since only those who believe they can reach
these stages will usually accept these conditions (Gompers P. A., 1997; Gilson, 2003;
Gompers & Lerner, 2004).
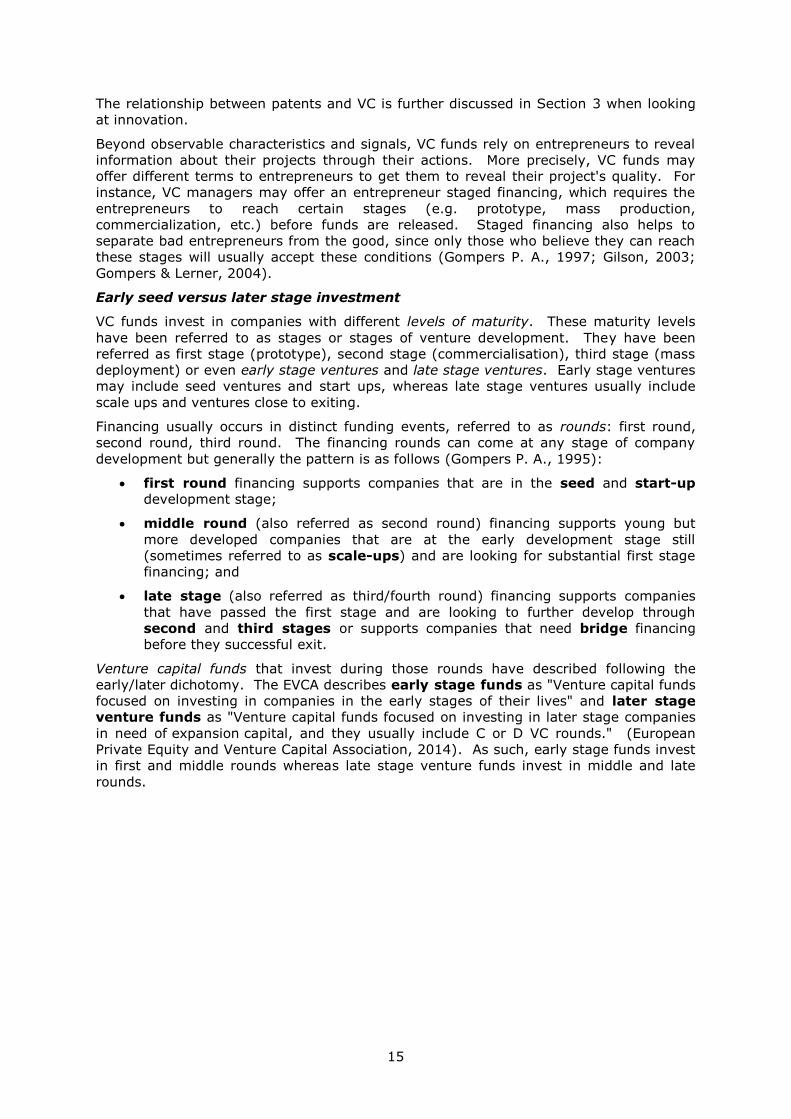
Early seed versus later stage investment
VC funds invest in companies with different levels of maturity. These maturity levels
have been referred to as stages or stages of venture development. They have been
referred as first stage (prototype), second stage (commercialisation), third stage (mass
deployment) or even early stage ventures and late stage ventures. Early stage ventures
may include seed ventures and start ups, whereas late stage ventures usually include
scale ups and ventures close to exiting.
Financing usually occurs in distinct funding events, referred to as rounds: first round,
second round, third round. The financing rounds can come at any stage of company
development but generally the pattern is as follows (Gompers P. A., 1995):
first round financing supports companies that are in the seed and start-up
development stage;
middle round (also referred as second round) financing supports young but
more developed companies that are at the early development stage still
(sometimes referred to as scale-ups) and are looking for substantial first stage
financing; and
late stage (also referred as third/fourth round) financing supports companies
that have passed the first stage and are looking to further develop through
second and third stages or supports companies that need bridge financing
before they successful exit.
Venture capital funds that invest during those rounds have described following the
early/later dichotomy. The EVCA describes early stage funds as "Venture capital funds
focused on investing in companies in the early stages of their lives" and later stage
venture funds as "Venture capital funds focused on investing in later stage companies
in need of expansion capital, and they usually include C or D VC rounds." (European
Private Equity and Venture Capital Association, 2014). As such, early stage funds invest
in first and middle rounds whereas late stage venture funds invest in middle and late
rounds.
16
Figure 5 matches company stages with VC fund involvement:
Figure 5: Companies Development Stage and VC Fund Involvement
Investment in the early stages proves more risky because younger companies have no
track record. Riskier investments usually require a higher return to convince investors.
One study of VCs from the US, the UK, France, Belgium, and the Netherlands finds that
VC funds that specialized in early-stage financing demand higher returns (Manigart, et
al., 2002).
In the later stages, VC funds tend to gather around a few successful projects. Fund
managers can observe how other VC funds have invested and performed (Klausner &
Litvak, 2002) and invest accordingly. One study shows that, on average in each round,
2.2 VC funds invest together in the first investment round, 3.3 in the second round, and
4.2 in the later rounds (Gompers & Lerner, 2004). Funds that invest in later stages
guide their investments by following the behaviour and capital/human investments of
funds that invest in earlier stages.
VC funds invest together because it allows them to diversify their risk (they can invest
small amounts in more companies instead of large amounts in one company) (Tian,
2011). VCs often fall in two categories: lead VCs and follow-on VCs. A lead VC usually
makes the largest investment and performs the added value associated with VCs (e.g.
mentoring, easier hiring of employees, etc.). A follow-on VC relies on the lead VC to
perform the value adding. In other words, follow-on VCs free ride on the lead VC's
work. One study finds that the identity of the lead VC (as measured by investment size)
affects the IPO valuation (Lee & Waha, 2004). Lead VCs have more at stake; hence,
they have more incentive to enhance the valuation.
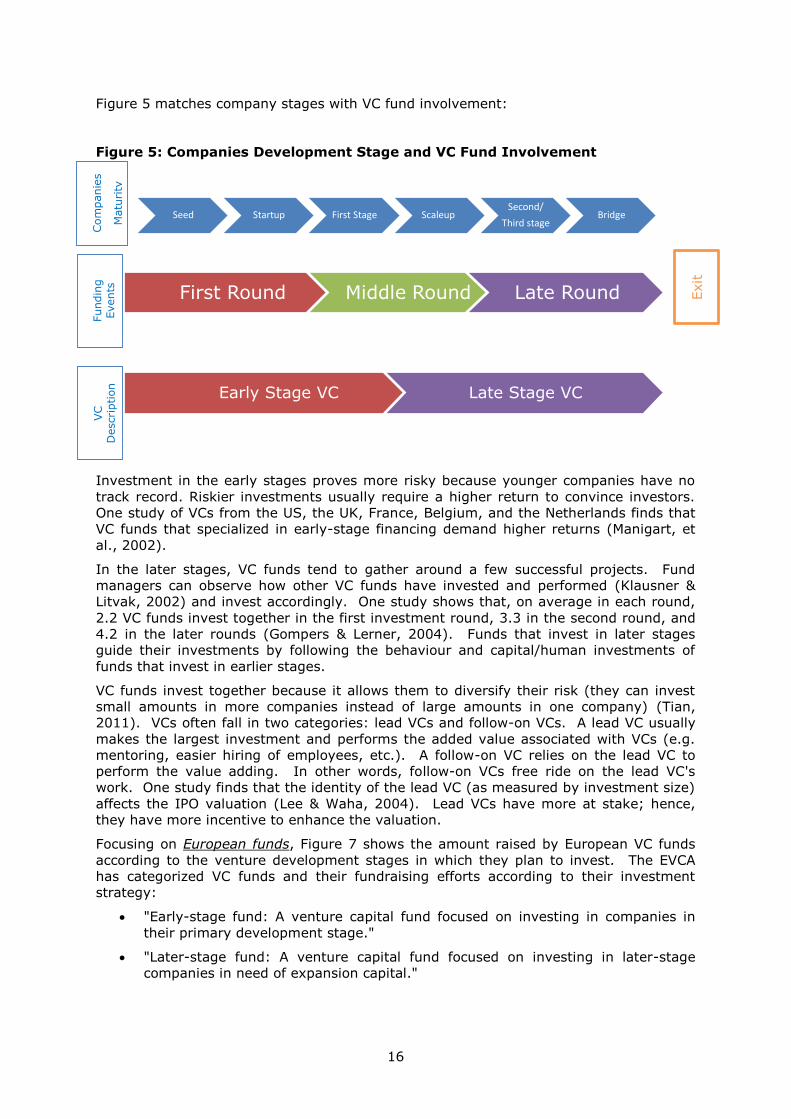
Focusing on European funds, Figure 7 shows the amount raised by European VC funds
according to the venture development stages in which they plan to invest. The EVCA
has categorized VC funds and their fundraising efforts according to their investment
strategy:
"Early-stage fund: A venture capital fund focused on investing in companies in
their primary development stage."
"Later-stage fund: A venture capital fund focused on investing in later-stage
companies in need of expansion capital."
Seed Startup First Stage Scaleup Second/
Third stage Bridge
First Round Middle Round Late Round
Early Stage VC Late Stage VC
Exit
Com
panie
s
Matu
rity
Fundin
g
Events
VC
Description
17
"Balanced fund: A venture capital fund focused on both early-stage and
development, with no particular concentration on either." (European Private
Equity and Venture Capital Association, 2014).
Figure 6: Amount raised by European VC funds by Types of Companies Targeted
Source: EVCA/PEREP_Analytics
Europe includes: Austria, the Baltic countries, Belgium, Bulgaria, the Czech Republic, Denmark, Ex-Yugoslavia, Finland, France, Germany, Greece, Hungary, Ireland, Italy, Luxembourg, the Netherlands, Norway, Poland, Portugal, Romania, Slovakia, Spain, Sweden, Switzerland, Ukraine, and the United Kingdom.
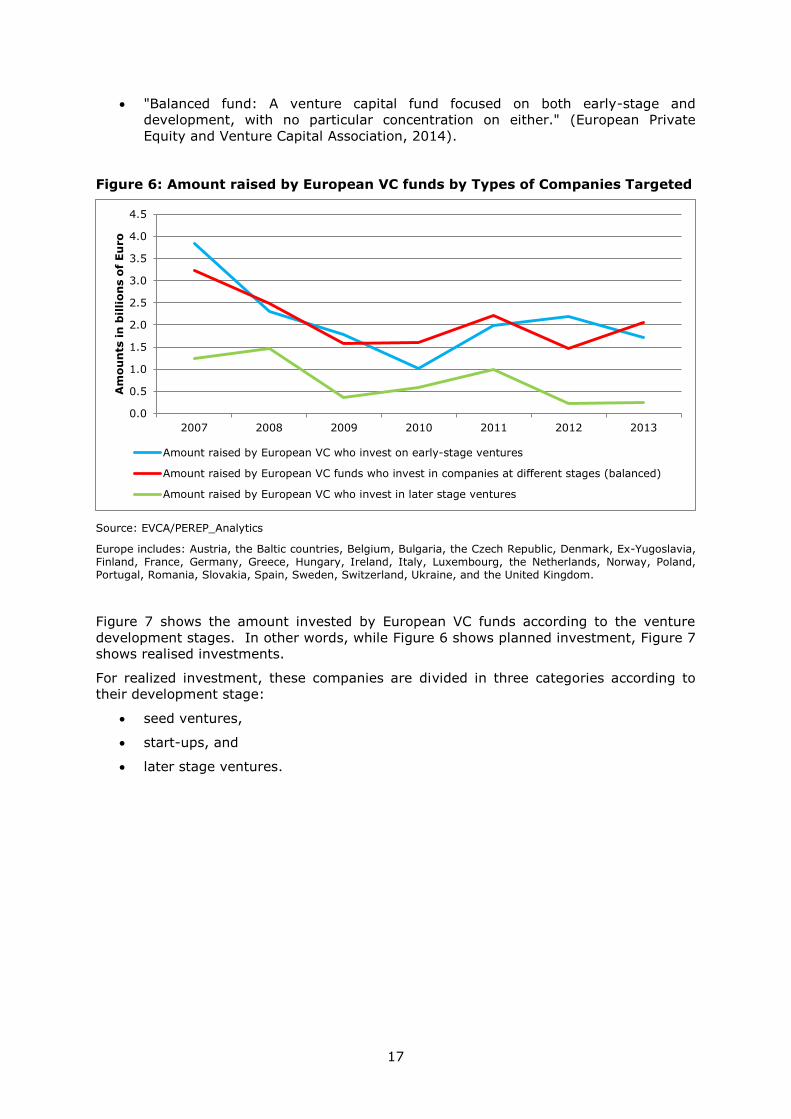
Figure 7 shows the amount invested by European VC funds according to the venture
development stages. In other words, while Figure 6 shows planned investment, Figure 7
shows realised investments.
For realized investment, these companies are divided in three categories according to
their development stage:
seed ventures,
start-ups, and
later stage ventures.
0.0
0.5
1.0
1.5
2.0
2.5
3.0
3.5
4.0
4.5
2007 2008 2009 2010 2011 2012 2013
Am
ou
nts
in
bil
lio
ns o
f E
uro
Amount raised by European VC who invest on early-stage ventures
Amount raised by European VC funds who invest in companies at different stages (balanced)
Amount raised by European VC who invest in later stage ventures
18
Figure 7: Amount Invested by European VC Funds into Companies according to
their Development Stage
Source: EVCA/PEREP_Analytics
Europe includes: Austria, the Baltic countries, Belgium, Bulgaria, the Czech Republic, Denmark, Ex-Yugoslavia, Finland, France, Germany, Greece, Hungary, Ireland, Italy, Luxembourg, the Netherlands, Norway, Poland, Portugal, Romania, Slovakia, Spain, Sweden, Switzerland, Ukraine, and the United Kingdom.
Since the funds raised are planned investment whereas the funds invested are realised
investment, the figures can differ: as described in Figure 5, early stage financing may go
to either seed or start-up ventures; balance funds, by definition, can go to either.
Furthermore, the amount raised cannot be compared to amount invested in a yearly
basis because of the delay between fund raising and investing: VC funds invest their
money after they raise the whole fund, which may take up to a year. One study reports
that the investment duration period, i.e. the time between the first investment and the
last investment, lasts between one to two years (Cumming D. J., 2006). VC funds do
not invest all their funds the same year as the funds are raised.
Over the period 2007 to 2013, the total amount raised decreased faster than the amount
invested and then increased faster. European VC funds of all types have been affected
by the financial crisis. In 2013, the amounts raised did not reach the pre-2009 levels.
The initial decrease from 2007 to 2010 was followed by an increase in 2011 only to
decrease again afterwards. Over the period 2007 to 2013, the amount raised by later
stage funds have, however, decreased more than early stage and balanced funds.
Seed ventures receive less funds than start-ups and later stage ventures (between 5%
and 10% of the amount received by the two other types of companies). Later stage
ventures receive more funds than start-ups at the beginning of the period but less funds
at the end. Over the period, the amount received by start-ups and later stage ventures
is comparable. The financial crisis has probably had an effect on VC investment
strategies.
Figure 8 shows the number of European companies receiving VC funding from VC funds
located anywhere in the world according to the same development stage used in Figure
7.
0.0
0.5
1.0
1.5
2.0
2.5
3.0
3.5
4.0
2007 2008 2009 2010 2011 2012 2013
Am
ou
nts
in
bil
lio
ns o
f E
uro
Amount invested by European VC in companies at the seed stage
Amount invested by European VC in companies at the start-up stage
Amount invested by European VC in companies that reached the later development stages
19
Figure 8: Number of European12 Companies receiving VC funding (by types of
companies)
Source: EVCA/PEREP_Analytics
Europe includes: Austria, the Baltic countries, Belgium, Bulgaria, the Czech Republic, Denmark, Ex-Yugoslavia, Finland, France, Germany, Greece, Hungary, Ireland, Italy, Luxembourg, the Netherlands, Norway, Poland, Portugal, Romania, Slovakia, Spain, Sweden, Switzerland, Ukraine, and the United Kingdom.
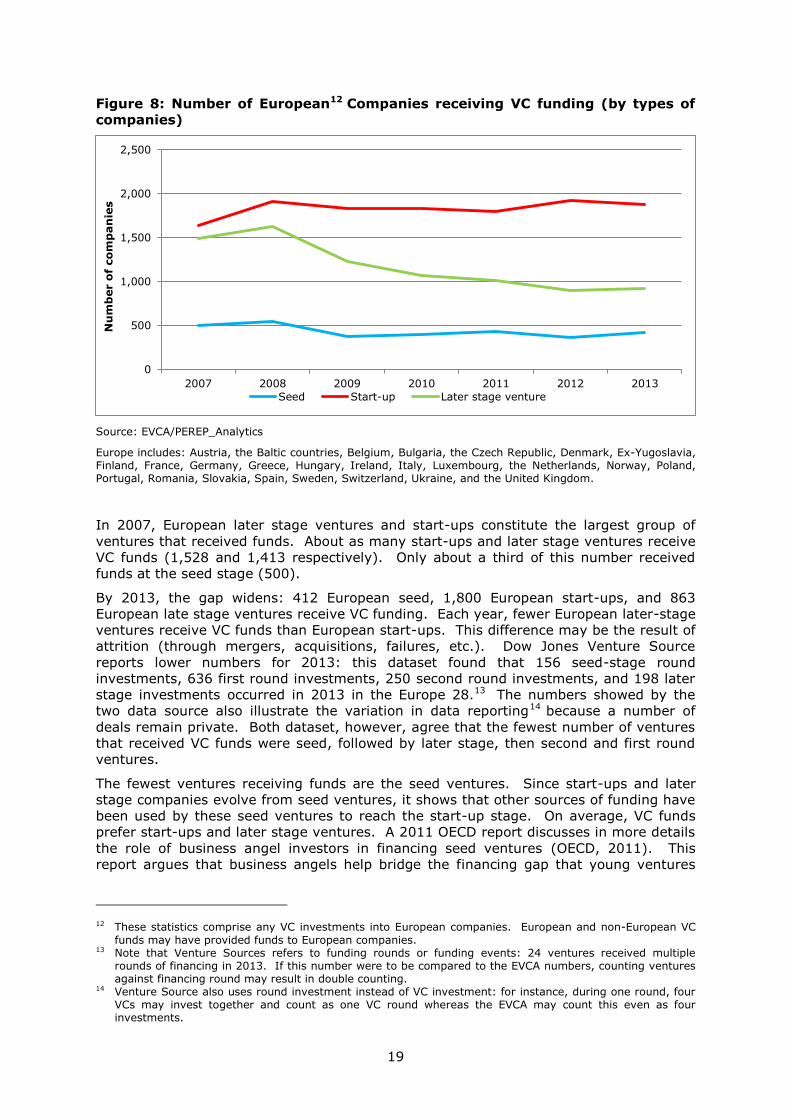
In 2007, European later stage ventures and start-ups constitute the largest group of
ventures that received funds. About as many start-ups and later stage ventures receive
VC funds (1,528 and 1,413 respectively). Only about a third of this number received
funds at the seed stage (500).
By 2013, the gap widens: 412 European seed, 1,800 European start-ups, and 863
European late stage ventures receive VC funding. Each year, fewer European later-stage
ventures receive VC funds than European start-ups. This difference may be the result of
attrition (through mergers, acquisitions, failures, etc.). Dow Jones Venture Source
reports lower numbers for 2013: this dataset found that 156 seed-stage round
investments, 636 first round investments, 250 second round investments, and 198 later
stage investments occurred in 2013 in the Europe 28.13 The numbers showed by the
two data source also illustrate the variation in data reporting14 because a number of
deals remain private. Both dataset, however, agree that the fewest number of ventures
that received VC funds were seed, followed by later stage, then second and first round
ventures.
The fewest ventures receiving funds are the seed ventures. Since start-ups and later
stage companies evolve from seed ventures, it shows that other sources of funding have
been used by these seed ventures to reach the start-up stage. On average, VC funds
prefer start-ups and later stage ventures. A 2011 OECD report discusses in more details
the role of business angel investors in financing seed ventures (OECD, 2011). This
report argues that business angels help bridge the financing gap that young ventures
12 These statistics comprise any VC investments into European companies. European and non-European VC
funds may have provided funds to European companies. 13 Note that Venture Sources refers to funding rounds or funding events: 24 ventures received multiple
rounds of financing in 2013. If this number were to be compared to the EVCA numbers, counting ventures against financing round may result in double counting.
14 Venture Source also uses round investment instead of VC investment: for instance, during one round, four VCs may invest together and count as one VC round whereas the EVCA may count this even as four investments.
0
500
1,000
1,500
2,000
2,500
2007 2008 2009 2010 2011 2012 2013
Nu
mb
er o
f co
mp
an
ies
Seed Start-up Later stage venture
20
experience in order to move from a seed venture to a start-up and to go on to become
more mature venture. This report argues that the movement may not be linear where
the traditional linear approach involves 5 steps: (1) entrepreneur using their own equity,
(2) asking funds from friends and family, (3) getting debt financing, (4) obtaining
business angel investment, and (5) receiving VC funds.
The number of European ventures receiving VC backing generally decreased between
2007 and 2013. The numbers of seed and late stage ventures decreased by 18% and by
39% respectively, whereas the number of start-ups increased by 18%. Since European
start-ups receiving VC funds constantly outnumber the total number of comparable seed
ventures, European ventures must find funding beyond VC funds to reach the start-up
stage.
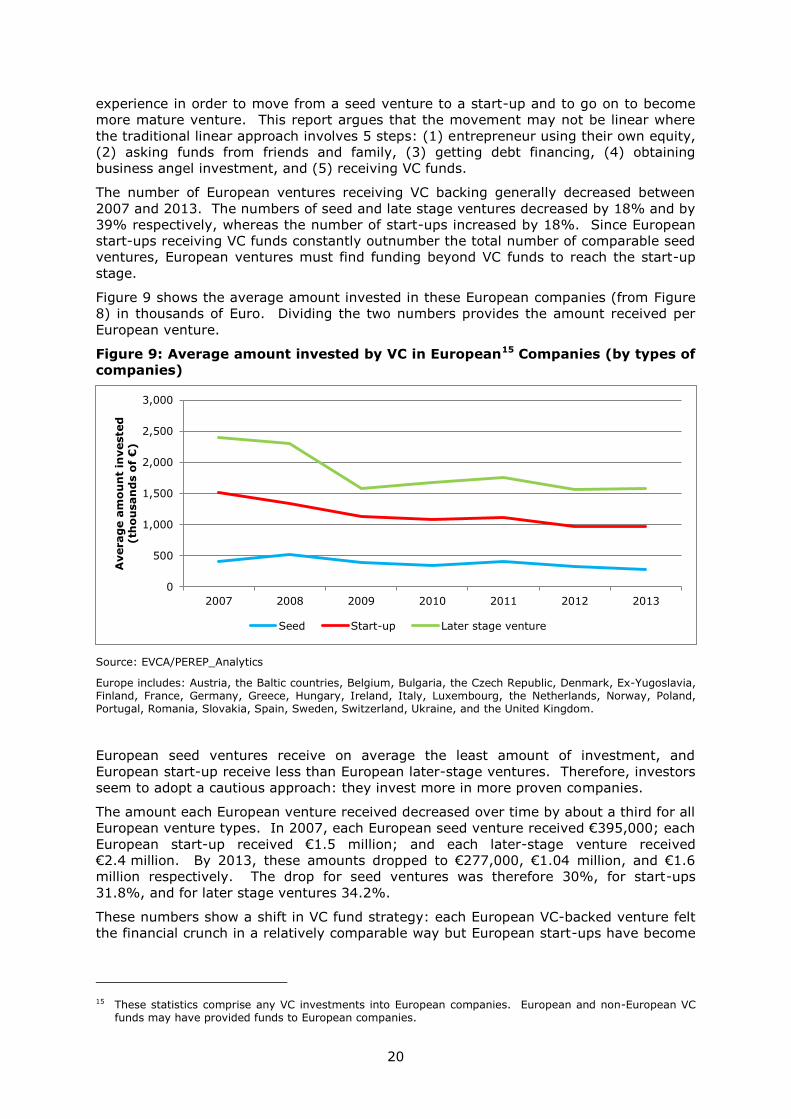
Figure 9 shows the average amount invested in these European companies (from Figure
8) in thousands of Euro. Dividing the two numbers provides the amount received per
European venture.
Figure 9: Average amount invested by VC in European15 Companies (by types of
companies)
Source: EVCA/PEREP_Analytics
Europe includes: Austria, the Baltic countries, Belgium, Bulgaria, the Czech Republic, Denmark, Ex-Yugoslavia, Finland, France, Germany, Greece, Hungary, Ireland, Italy, Luxembourg, the Netherlands, Norway, Poland, Portugal, Romania, Slovakia, Spain, Sweden, Switzerland, Ukraine, and the United Kingdom.
European seed ventures receive on average the least amount of investment, and
European start-up receive less than European later-stage ventures. Therefore, investors
seem to adopt a cautious approach: they invest more in more proven companies.
The amount each European venture received decreased over time by about a third for all
European venture types. In 2007, each European seed venture received €395,000; each
European start-up received €1.5 million; and each later-stage venture received
€2.4 million. By 2013, these amounts dropped to €277,000, €1.04 million, and €1.6
million respectively. The drop for seed ventures was therefore 30%, for start-ups
31.8%, and for later stage ventures 34.2%.
These numbers show a shift in VC fund strategy: each European VC-backed venture felt
the financial crunch in a relatively comparable way but European start-ups have become
15 These statistics comprise any VC investments into European companies. European and non-European VC funds may have provided funds to European companies.
0
500
1,000
1,500
2,000
2,500
3,000
2007 2008 2009 2010 2011 2012 2013
Averag
e a
mo
un
t in
veste
d
(th
ou
san
ds o
f €
)
Seed Start-up Later stage venture
21
the focus of VC backing and more European start-ups are receiving VC funds than
European seed and later stage ventures in absolute and relative terms.
While more econometric analysis is required to assess why this shift occurred, it is
probable that the financial crisis lead to these changes. Since VC funds require outside
investors to purchase their stake in a company to profit, they may have perceived an
imminent exit as unprofitable in that financial climate. Therefore, VC funds may have
shifted their investment strategy to longer-term investment in start-ups, instead of late-
stage ventures. These same VC funds may also have perceived that in a bad financial
climate, seed investments constitute too much of a risk. In fact, focusing on the last
year of the data shows that the amount received by each European start-up and later
stage venture has slightly increased (7.3% and 3.8% increase from 2012) whereas each
European seed venture receives less funds (15% decrease from 2012).
Comparing the amount invested by European VC from Figure 7 to the amount invested
in European ventures (from used to get the average in Figure 9) shows that the amount
invested by European VC funds is always greater than the amount invested in European
companies. This remains true for all type of companies – except for 2013 European
start-ups. In general, more VC funds leave Europe than enter Europe. This issue and
more on cross-border investments are revisited in more detail in Section 4.1.
2.2.2 Monitoring, the key to creating incentives
Venture capital endeavours suffer from two agency problems. The earlier discussion
addressed how carried interest attempts to circumvent the agency problem between
investors and fund managers. The discussion in this section focuses on the second
agency problem between fund managers and fund-receiving companies.
Monitoring
Being backed by a VC fund adds intangibles to a company through mentoring and
reputational effect. "[V]enture capital funds provide undertakings with valuable
expertise and knowledge, business contacts, brand equity and strategic advice."
(European Parliament and Council, 2013). The knowhow that VC transfers to
entrepreneurs and their companies survives within VC-backed companies even after the
VC divests (a phenomenon called 'imprint'). One study finds that VC-backed companies
have a higher total factor productivity growth rate during the backing period and even
after the VC exit (Croce, Martí, & Murtinu, 2013). On top of their knowhow, VCs lend
their reputation to the venture and also make hiring employees easier for new ventures
(Metrick & Yasuda, 2011).
However, VC backing creates an important agency problem: a VC investment separates
control from capital and misaligns the incentives of the fund from those of the fund-
recipient. To address this problem, VCs usually monitor and control their investment.16
VCs can for example monitor their investment by negotiating places on the backed-
company's board of directors. Through the board of directors, VCs can monitor, advise,
and mentor the company. VCs are more involved in both strategy formation and
evaluation than comparable investors in publicly-traded companies (Fried, Bruton, &
Hisrich, 1998).
In return for their higher involvement as compared to traditional investors, VCs expect
higher compensation because monitoring is time consuming and involves more costs.
One study of VCs from the US, the UK, France, Belgium, and the Netherlands finds that
VC funds that monitor more closely/frequently require higher returns (Manigart, et al.,
2002). European VCs, however, monitor less than US VCs (Schwienbacher, 2005).
16 More monitoring might also be linked to the lack of diversification. VC funds usually specialise in an sectoral industry; hence, these funds are more sensitive to systemic shocks; monitoring may help assure that it avoids these shocks (Fried, Bruton, & Hisrich, 1998). As explained above, VC funds who invest large amounts – e.g., lead VCs – have more incentive to monitor.
22
Contractual incentives
Monitoring is costly. Continuous monitoring may be impossible. Even if a VC has seats
on the board, the board does not manage a company on a daily basis. Therefore, to
address the agency problem, VCs may deploy other techniques to realign their incentives
with those of the entrepreneurs. They may gain rights to allocate cash flow rights,
board rights, voting rights, liquidation rights among other control rights that may be
triggered under different circumstances (Kaplan & Strömberg, 2003).
One common way to realign incentives is through incentive-based compensation where
the VC makes the entrepreneur's salary contingent on any verifiable signal of
performance (according to the investment agreement). However, the efficiency of
performance-sensitive payments depends on the entrepreneur's risk preference and
ability (Kaplan & Strömberg, 2003). Holding ability constant, performance sensitive
contracts are less attractive to risk adverse entrepreneurs; holding risk preference
constant, performance sensitive contracts are more attractive to more able
entrepreneurs. The combination of these effects may make distinguishing an
entrepreneur's ability difficult.
Another common way to realign incentives is through stage financing. Stage financing is
"a stepwise disbursement of capital from VC investors to entrepreneurial firms" when the
entrepreneur reaches contracted milestones (Tian, 2011, p. 132). Stage financing is a
form of periodical monitoring: when VC funds decide to use more stage financing, they
monitor the entrepreneurs less (Tian, 2011).
Stage financing also circumvents some moral hazard issues involved with providing
funds to entrepreneurs. For instance, once entrepreneurs receive their funds, they may
decide to give themselves a pay raise and decrease their effort level. Stage financing
assures that they do not abuse the VC system and keep on the innovative track
(Bergemann & Hege, 1998).
Creating stage financing, however, involves some transaction costs. First, entrepreneurs
and VCs must negotiate more often; thus, entrepreneurs may focus on short-term goals
instead of long-term growth. Second, entrepreneurs may not gain access to enough
capital to successfully perform in the long run. Third, stage financing may also
encourage entrepreneurs to window-dress their accomplishments. Stage financing may
also affect the company's valuation upon exit: fewer rounds of financing positively affect
the IPO firm's operating performance and the likelihood of delisting within three years
(Tian, 2011).
Even though VC funds have found different ways to realign all the participants'
incentives, this realignment may prove difficult and costly. VC funds expend these costs
to assure they profit upon exit. The importance of a successful exit is discussed next.
Exiting
VC funds are often structured as 10 year (extendable) partnerships. This limited lifespan
dictates how VC funds profit. They invest in young unproven companies which, in 10
years, have not usually developed substantially enough to give dividends to justify the
investment. VCs, hence, rely on exit to profit. VCs traditionally exit through one of the
following five vehicles:
1. An initial public offering (IPO), which is when a company becomes publically-
listed on a stock exchange and its shares are sold to the wider public;
2. Acquisitions (or ‘trade sales’), which is when a larger firm purchases both the
venture capitalist and entrepreneurs interest in the company;
3. Secondary sales, which is when another company or VC acquires the initial VC's
interest, but the entrepreneurs retain his or hers;
4. Buybacks, which is when the entrepreneur repurchase the VC's interest (VC
contracts often have a buyback clause); and
23
5. Write-offs (or ‘liquidation’), which is when the VC sells his interest at a loss.
(Cumming, Fleming, & Schwienbacher, 2006)
Both IPOs and acquisitions are considered successful exit strategies (See e.g. Gompers &
Lerner, 2000; Brau, Francis, & Kohers, 2003; Nahata, 2008) whereas write-offs are
unsuccessful exits. VC funds may prefer IPOs because this form of exit often offers
higher returns (Black & Gilson, 1999; Brau, Francis, & Kohers, 2003) whereas innovator
entrepreneurs may prefer IPOs if they wish to maintain control of their company. This
may not be possible after an acquisition; but if they wish to receive more liquidity, they
may prefer acquisition (Brau, Francis, & Kohers, The Choice of IPO versus Takover:
Empirical Evidence, 2003).
In Europe, different studies have suggested that, depending on the country and year,
VCs have favoured different exit strategies. One study looking at VC exits in Austria,
Belgium, the Czech Republic, Denmark, France, Germany, Italy, The Netherlands,
Poland, Portugal, and Switzerland found that when these VCs exercise more control,
they tend to exit more frequently through an acquisition (Cumming D., 2008). In other
words, when VC funds can "control" the exit strategy, they have elected to exit through
acquisition. One study, however, finds that European IPO exits yield similar results to
the US IPO exits for the same year as measured by the Internal Rate of Return.
Acquisitions, however, are less profitable in Europe (Hege, Palomino, & Schwienbacher,
2009). In other words, VC funds find IPOs more profitable in Europe; hence, they prefer
IPO exit strategies, other things being equal. 17 The combination of these factors
highlights how the European VC market is quite diverse and continuously changing, see
Section 4.1 for more detail.
In addition to their own exit, VC funds may also build in incentives in the relationship
with entrepreneurs that are triggered by certain situations: e.g. the entrepreneur's
unilateral exit, company failure and success. First, the investment contract between the
VC and the entrepreneur can plan for the case where the entrepreneur wishes to exit the
company. VCs often insist upon a non-compete clause in the investment contract, which
limits how the entrepreneur can be employed if s/he decides to leave (Kaplan &
Strömberg, 2003). VCs also insist upon a vesting provision (Kaplan & Strömberg,
2003), which requires that entrepreneurs vest their interest to the VC if they wish to
unilaterally exit (instead of selling on the open market). These clauses in the agreement
make it more costly (and less profitable) for entrepreneurs to exit without the VCs'
consent and they avoid VCs being held up by entrepreneurs if they disagree on
important decisions.
Second, the VC-entrepreneur can negotiate to include in the contract a clause that
triggers convertible derivatives upon the occurrence of certain conditions. These
derivatives grant control depending on the company's state: an entrepreneur gets
control if the company performs; a VC gets control if the company does not. Gaining
control through good performance lets entrepreneurs decide how they would prefer to
exit. When investing, VCs often request preferred stocks (first to be compensated in
case of failure) that convert into common stock upon acquisition or IPO.
In general, VC investment contracts attempt to plan for most contingencies. The next
section moves away from the functioning of VC funds. It focuses on the relationship
between VC funds, ICT, and innovation; and debates whether the correlation is causal.
17 Acquisition and IPO differ in more ways than profit. For instance, IPO require a lengthy regulatory approval and to overcome other hurdles that can influence the VC exit strategy.
24
3. VC Funds, ICT, Fast Growing and Innovative Companies
Since VC funds exit within ten years, they need to invest in companies where the
interest can be sold at a profit at the end of that period. This is because they do not hold
their interest in a venture long enough to profit from dividends.
VC funds can increase their probability of profiting upon exit by investing in innovative
companies. According to Schumpeterian principles (Schumpeter, 1939), innovations
either help entrepreneurs differentiate their products or to produce existing products
more cheaply. Product differentiation helps a young company compete when entering
the market by capturing part of the demand. Cheaper production helps a young
company produce a competitive product and sell it at a lower cost. Therefore,
innovation helps young companies compete, capture demand, and profit when they
enter a market. Following these principles, VC funds finance companies that innovate
because innovations lead to higher profits.
VC funds can also increase their probability of profiting upon exit by investing in high
growth companies. Much like innovativeness, company growth can be used by external
investors to estimate the profit potential and decide whether to invest.
This section investigates whether VC funds can cause a company to become more
innovative or higher growth that it would have become without the VC's presence, or
whether VC funds select companies for their innovative or high growth potential.
3.1 ICT and innovative companies
This section investigates whether VC funds impact the innovative behaviour of ICT
companies. A number of studies have observed that VC backing is correlated with more
patenting, which can be taken as a proxy for innovation18 (Graham, Merges, Samuelson,
& Sichelman, 2009). Observers have, subsequently, attempted to assess the causality:
Do VC funds encourage companies to innovate and enhance their innovative potential?
Or do VC funds identify innovative companies and provide them with the funds they
need? Reality may involve both effects: VC funds select companies with innovative
tendencies and make them more innovative.
While the two hypotheses are not mutually exclusive, scholars have attempted to test
whether the selection or the enhancement hypothesis dominates and assess the impact
of VC on innovation.
On the one hand, using patents as a proxy for innovative potential, a few studies have
found evidence that VC funds select companies that have patented more often in the
past (see e.g. Graham, Merges, Samuelson, & Sichelman, 2009; Häussler, Harhoff, &
Müller, 2009; Hirukawa & Ueda, 2011). Therefore, VC funds may select companies based
on their innovative potential and provide them with funds to fulfil that potential.
On the other hand, other scholars have found evidence that once VC funds have
invested in companies, they tend to patent more than comparable non-VC backed
companies (See e.g. Kortum & Lerner, 2000; Beacham & Datta, 2013). Therefore, VC
funds may encourage companies to innovate and patent. VC funds provide the
mentoring needed to help companies surpass their pre-investment innovative potential
and reach new levels of innovation.
These studies, however, have to address many biases. First, companies seeking funds
have an incentive to patent when they might not have, had they had enough funds.
18 For simplicity, a "product innovation is the introduction of a good or service that is new or significantly improved with respect to its characteristics or intended uses." This includes significant improvements in technical specifications, components and materials, incorporated software, user friendliness or other functional characteristics." (OECD & Eurostat, 2005, p. 48). Beside product innovation, The OECD and Eurostat identify three types of innovation: process innovations, marketing innovations and organizational innovations.
25
Companies seeking funds want to signal their innovative potential and VC funds use
patents to filter companies and defeat some of the information asymmetries (Long,
2002). VC funds may prefer companies with large patent portfolios because they can
sell these in cases of bankruptcy or failure (Dubiansky, 2006). One study found that
German venture-capital-backed start-ups filed more patents than comparable non-
venture-capital-backed start-ups. However, they had already filed more applications
before the engagement of venture capital funds (Engel & Keilbach, 2007).19
Second, companies which have received VC funds have a continued incentive to patent
whereas companies which have not received VC funds (even if they sought funds) do
not. VC funds mentor and encourage patenting because they need an eventual exit. VC
funds in turn use patents as a signal of the company's potential to acquiring companies
or the public. In order to achieve a successful exit (specifically via an IPO), VC funds
believe that the companies they back must patent in order to obtain the best valuation
possible (Brau & Fawcett, 2006).20
As regards screening companies, salvaging a failed investment, or maximizing its
investments, patenting has become an integral part of the VC business model. Indeed,
VC funds may have encouraged over-patenting and patenting of useless improvements.
To address this issue, some scholars have focused on patent quality. Since not all
patents are equal, they tested to see whether VC funds encouraged patents that were
cited often and found that "venture backed firms are more likely to patent, have
previous patents cited, and engage in frequent and protracted litigation of both patents
and trade secrets" (Kortum & Lerner, 2000). Therefore, they argue that VC-backed
companies produce more patents and also more valuable patents. They fail, however, to
address the patenting incentive bias.
A VC system creates strong incentives to patent innovation, which may not always lead
to efficient patenting. Companies that do not seek VC funding do not have the same
incentive to disclose information and to patent. Companies can protect their innovations
through other means such as trade secrets. Patents and patent portfolios would
constitute an imperfect measure of innovation because not all innovations are patentable
(newness and subject matter issues) or are patented (strategic reasons to keep trade
secrets) (Griliches, 1998).
In many cases, patenting behaviour is more dependent on the desire to signal than on
the desire to acquire a temporary monopoly through patent protection. A survey of
companies showed that companies are more motivated to gain first mover advantage
and keep trade secrets than they are to obtain patent protection (Graham, Merges,
Samuelson, & Sichelman, 2009). These companies obtained a patent because first of
all, they wanted to prevent copying and second, they wanted to improve their chances of
securing investment.
The relationship between VC funds and innovation remains complicated and may require
new tools to assess the impact of VC backing on innovation. In the search for the next
big innovation and big lottery ticket, VC funds may have over invested (Solomon, 2014;
Alden, 2015); yet, VC funds perform better in terms of their internal rate of return than
other forms of investments though this has not always been the case (Preqin, 2014).
The relationship between innovation and ICT has triggered a lot of interest (Biagi, 2013).
In general, ICT companies and ICT-using companies have been found to innovate more
than their non-ICT-using counterparts (Polder, van Leeuwen, Mohnen, & Raymond,
19 The econometric bias, however, might arise because studies can only compare companies who receive
funds to companies who did not receive funds while it ought to compare companies who sought funds and received them to companies who sought funds but did not receive them.
20 The econometric bias, however, might arise because studies can only compare VC backed companies who exited through an IPO to non-VC backed companies who exited through an IPO while it ought to compare VC backed companies who wanted to exit through an IPO to non-VC backed companies who sought VC funds and who wanted to exit through an IPO. The results are usually biased toward companies, who successfully exited through an IPO.
26
2010; Lantz, Sahut, & Teulon, 2011). Similarly, ICT use is also generally correlated with
more innovative behaviour in manufacturing and services companies (Spiezia, 2011).
This correlation between ICT and Innovation may explain the correlation between VC
funding and ICT discussed in more detail in Section 3.2.
However, the relationship between ICT and innovative behaviour may also require new
tools because relying on patents adds another layer of problems in the ICT context.
First, previous studies have mainly used patents as an innovation proxy, which can make
the comparison between ICT and non-ICT difficult because some ICT elements may not
be patentable. For instance, software patents are not a category for the European
Patent Office.21
Even if patenting was possible, the difference may come down to patenting preferences
instead of innovation preferences. For instance in the US, a lower ratio of IT hardware
and software companies holds patents than biotechnological or medical device
companies, regardless of VC backing (Graham, Merges, Samuelson, & Sichelman, 2009).
On the face of this evidence, it could be argued that biotechnological or medical device
companies are more innovative; but the same 2009 survey shows that the patenting
preferences differ between industries (Graham, Merges, Samuelson, & Sichelman,
2009).
Second, the ICT sector encompasses numerous subsectors (e.g. computer
manufacturing, software, etc.) and each subsector has distinct innovative and patenting
preferences. Comparing VC-backed software and hardware companies show that a
higher ratio of IT hardware companies hold patents than software companies (91% to
67% respectively) and they also hold more patents on average (27.4 patents per
hardware company to 5.9 per software companies).
More interestingly, this same 2009 survey reveals that VC backing is correlated with a
higher level of patenting: 67% of VC-backed software companies or 24% of non-VC-
backed software companies hold a patent. While the causation requires more analysis,
the correlation remains obvious. The next section discusses the relationship between
ICT, VC funding, and fast growing companies.
In other words, VC funds are correlated with high levels of patenting in the ICT industry.
VC funds create a strong incentive to patent, which makes it hard to assess the
innovative impact when focusing on patenting. VC funds probably select innovative
ventures. They also provide ventures with the funds, mentoring, guidance, and the
general clout to fulfil their potential. They may even help ventures go beyond this
potential and become more innovative than would otherwise have been possible without
these advantages. The next section looks at the relationship between VC funds, fast
growing companies, and ICT companies.
3.2 ICT and fast growing companies
Since VC funds exit within ten years, they need to invest in companies that grow fast
enough to provide a profit upon exit. Much like the relationship between innovation and
VC funding, the relationship between fast growing companies and VC funding is hard to
define. VC funds may either select companies that are already fast growing or they may
turn a company into a fast growing company.
21 Yet, one study looks at the impact of patent portfolios on the amount collected by a software companies
through IPOs and compares the US with Europe (Useche, 2012). The underlying assumption is that since software are technically not patentable under the European Patent Convention but instead an innovation needs to be a computer implemented invention, software patents are more rare in Europe than in the US where this restriction does not exist; hence, since they are more rare, they are assumed to be more valuable. Consequently, when exiting through an IPO, an additional patent has a greater relative impact upon the amount collected in Europe than in the United States when controlling for certain company characteristics such as performance.
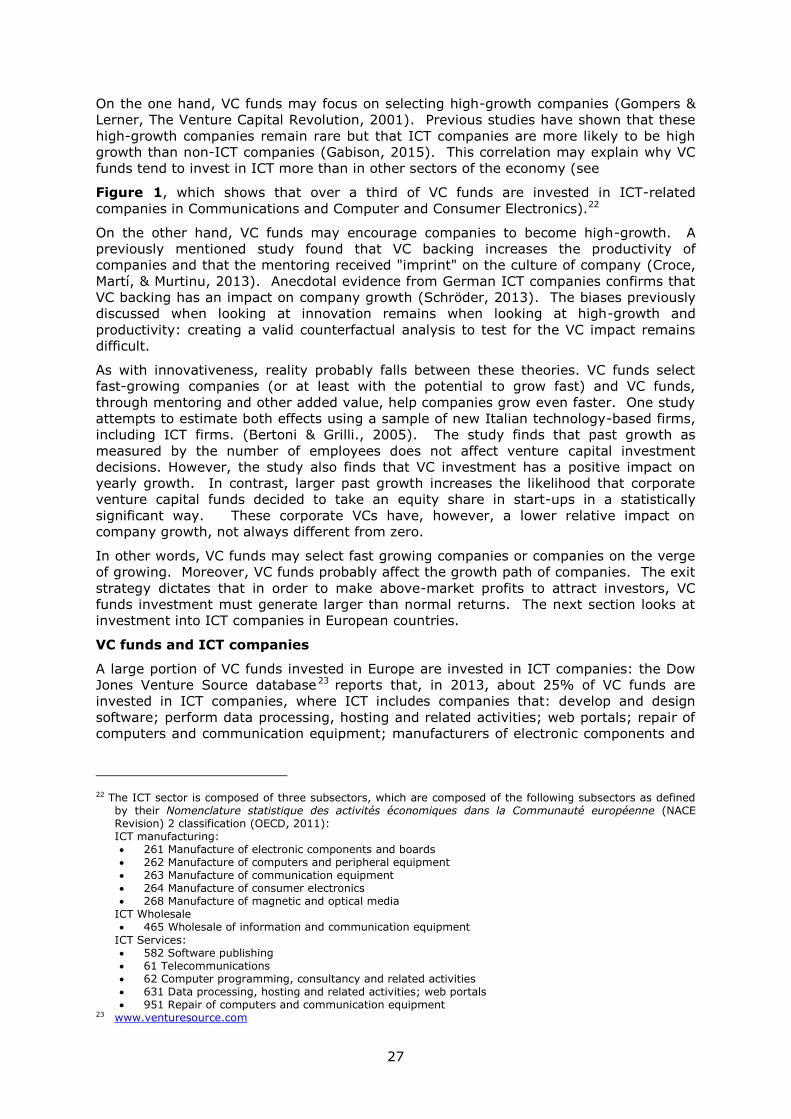
27
On the one hand, VC funds may focus on selecting high-growth companies (Gompers &
Lerner, The Venture Capital Revolution, 2001). Previous studies have shown that these
high-growth companies remain rare but that ICT companies are more likely to be high
growth than non-ICT companies (Gabison, 2015). This correlation may explain why VC
funds tend to invest in ICT more than in other sectors of the economy (see
Figure 1, which shows that over a third of VC funds are invested in ICT-related
companies in Communications and Computer and Consumer Electronics).22
On the other hand, VC funds may encourage companies to become high-growth. A
previously mentioned study found that VC backing increases the productivity of
companies and that the mentoring received "imprint" on the culture of company (Croce,
Martí, & Murtinu, 2013). Anecdotal evidence from German ICT companies confirms that
VC backing has an impact on company growth (Schröder, 2013). The biases previously
discussed when looking at innovation remains when looking at high-growth and
productivity: creating a valid counterfactual analysis to test for the VC impact remains
difficult.
As with innovativeness, reality probably falls between these theories. VC funds select
fast-growing companies (or at least with the potential to grow fast) and VC funds,
through mentoring and other added value, help companies grow even faster. One study
attempts to estimate both effects using a sample of new Italian technology-based firms,
including ICT firms. (Bertoni & Grilli., 2005). The study finds that past growth as
measured by the number of employees does not affect venture capital investment
decisions. However, the study also finds that VC investment has a positive impact on
yearly growth. In contrast, larger past growth increases the likelihood that corporate
venture capital funds decided to take an equity share in start-ups in a statistically
significant way. These corporate VCs have, however, a lower relative impact on
company growth, not always different from zero.
In other words, VC funds may select fast growing companies or companies on the verge
of growing. Moreover, VC funds probably affect the growth path of companies. The exit
strategy dictates that in order to make above-market profits to attract investors, VC
funds investment must generate larger than normal returns. The next section looks at
investment into ICT companies in European countries.
VC funds and ICT companies
A large portion of VC funds invested in Europe are invested in ICT companies: the Dow
Jones Venture Source database23 reports that, in 2013, about 25% of VC funds are
invested in ICT companies, where ICT includes companies that: develop and design
software; perform data processing, hosting and related activities; web portals; repair of
computers and communication equipment; manufacturers of electronic components and
22 The ICT sector is composed of three subsectors, which are composed of the following subsectors as defined by their Nomenclature statistique des activités économiques dans la Communauté européenne (NACE Revision) 2 classification (OECD, 2011): ICT manufacturing: 261 Manufacture of electronic components and boards 262 Manufacture of computers and peripheral equipment 263 Manufacture of communication equipment 264 Manufacture of consumer electronics 268 Manufacture of magnetic and optical media
ICT Wholesale 465 Wholesale of information and communication equipment
ICT Services: 582 Software publishing 61 Telecommunications 62 Computer programming, consultancy and related activities 631 Data processing, hosting and related activities; web portals 951 Repair of computers and communication equipment
23 www.venturesource.com
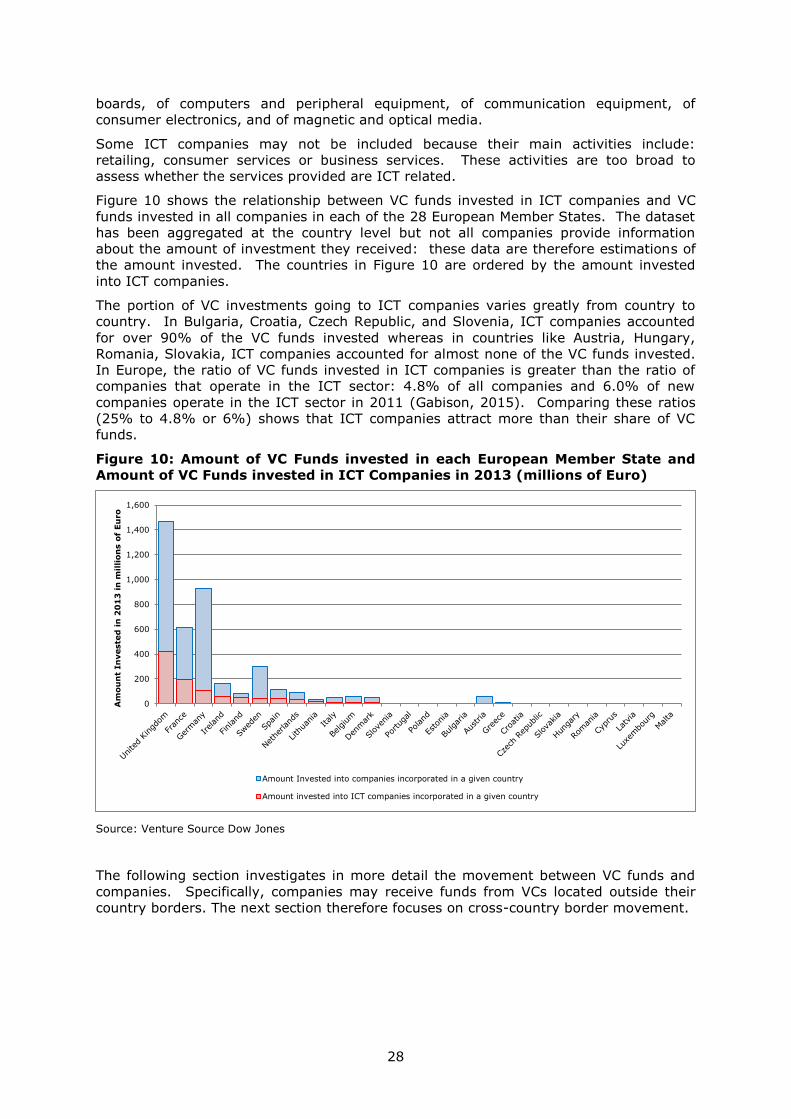
28
boards, of computers and peripheral equipment, of communication equipment, of
consumer electronics, and of magnetic and optical media.
Some ICT companies may not be included because their main activities include:
retailing, consumer services or business services. These activities are too broad to
assess whether the services provided are ICT related.
Figure 10 shows the relationship between VC funds invested in ICT companies and VC
funds invested in all companies in each of the 28 European Member States. The dataset
has been aggregated at the country level but not all companies provide information
about the amount of investment they received: these data are therefore estimations of
the amount invested. The countries in Figure 10 are ordered by the amount invested
into ICT companies.
The portion of VC investments going to ICT companies varies greatly from country to
country. In Bulgaria, Croatia, Czech Republic, and Slovenia, ICT companies accounted
for over 90% of the VC funds invested whereas in countries like Austria, Hungary,
Romania, Slovakia, ICT companies accounted for almost none of the VC funds invested.
In Europe, the ratio of VC funds invested in ICT companies is greater than the ratio of
companies that operate in the ICT sector: 4.8% of all companies and 6.0% of new
companies operate in the ICT sector in 2011 (Gabison, 2015). Comparing these ratios
(25% to 4.8% or 6%) shows that ICT companies attract more than their share of VC
funds.
Figure 10: Amount of VC Funds invested in each European Member State and
Amount of VC Funds invested in ICT Companies in 2013 (millions of Euro)
Source: Venture Source Dow Jones
The following section investigates in more detail the movement between VC funds and
companies. Specifically, companies may receive funds from VCs located outside their
country borders. The next section therefore focuses on cross-country border movement.
0
200
400
600
800
1,000
1,200
1,400
1,600
Am
ou
nt
In
veste
d in
20
13
in
mil
lion
s o
f Eu
ro
Amount Invested into companies incorporated in a given country
Amount invested into ICT companies incorporated in a given country
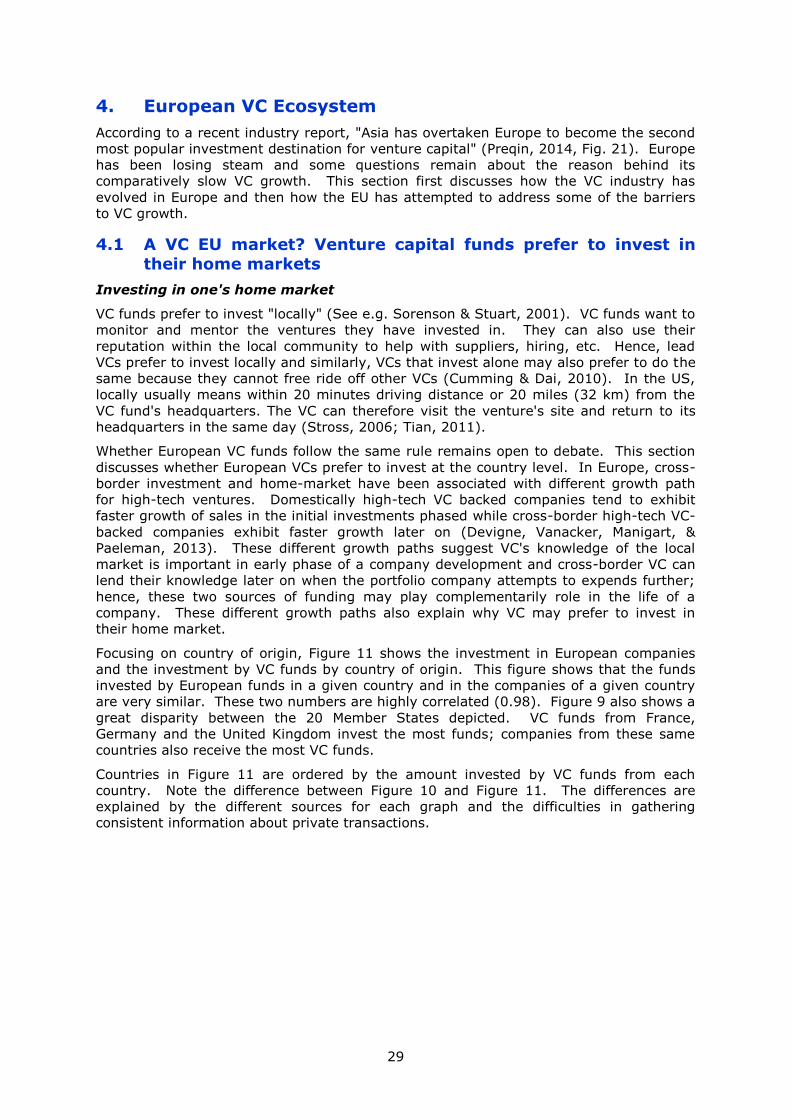
29
4. European VC Ecosystem
According to a recent industry report, "Asia has overtaken Europe to become the second
most popular investment destination for venture capital" (Preqin, 2014, Fig. 21). Europe
has been losing steam and some questions remain about the reason behind its
comparatively slow VC growth. This section first discusses how the VC industry has
evolved in Europe and then how the EU has attempted to address some of the barriers
to VC growth.
4.1 A VC EU market? Venture capital funds prefer to invest in
their home markets
Investing in one's home market
VC funds prefer to invest "locally" (See e.g. Sorenson & Stuart, 2001). VC funds want to
monitor and mentor the ventures they have invested in. They can also use their
reputation within the local community to help with suppliers, hiring, etc. Hence, lead
VCs prefer to invest locally and similarly, VCs that invest alone may also prefer to do the
same because they cannot free ride off other VCs (Cumming & Dai, 2010). In the US,
locally usually means within 20 minutes driving distance or 20 miles (32 km) from the
VC fund's headquarters. The VC can therefore visit the venture's site and return to its
headquarters in the same day (Stross, 2006; Tian, 2011).
Whether European VC funds follow the same rule remains open to debate. This section
discusses whether European VCs prefer to invest at the country level. In Europe, cross-
border investment and home-market have been associated with different growth path
for high-tech ventures. Domestically high-tech VC backed companies tend to exhibit
faster growth of sales in the initial investments phased while cross-border high-tech VC-
backed companies exhibit faster growth later on (Devigne, Vanacker, Manigart, &
Paeleman, 2013). These different growth paths suggest VC's knowledge of the local
market is important in early phase of a company development and cross-border VC can
lend their knowledge later on when the portfolio company attempts to expends further;
hence, these two sources of funding may play complementarily role in the life of a
company. These different growth paths also explain why VC may prefer to invest in
their home market.
Focusing on country of origin, Figure 11 shows the investment in European companies
and the investment by VC funds by country of origin. This figure shows that the funds
invested by European funds in a given country and in the companies of a given country
are very similar. These two numbers are highly correlated (0.98). Figure 9 also shows a
great disparity between the 20 Member States depicted. VC funds from France,
Germany and the United Kingdom invest the most funds; companies from these same
countries also receive the most VC funds.
Countries in Figure 11 are ordered by the amount invested by VC funds from each
country. Note the difference between Figure 10 and Figure 11. The differences are
explained by the different sources for each graph and the difficulties in gathering
consistent information about private transactions.
30
Figure 11: Amount Invested by European VC Funds and in European
Companies24
Source: EVCA/PEREP_Analytics
This preference for local investment has been interpreted to mean that Europe needs to
raise its own funds to invest in its own local companies. It has, however, been argued
that Europe is a less fertile entrepreneurial ecosystem for the VC industry than the
United States (see e.g. Black & Gilson, 1999; Bottazzi & Da Rin, 2002; Isenberg, 2010).
Ernst and Young reports that, between 2006 and 2013, EU VC investments vary between
19% (in 2012) and 24% (in 2010) of the US VC investments (Ernst & Young, 2014).
Multiple hypotheses have been put forward to explain the differences and can be divided
into two categories: supply-based and demand-based explanations.
Supply-based explanations
Supply-based explanations focus on the availability of funds. It has been argued that
lack of funds is the main hindrance to the VC market in Europe. The US saw a boom in
VC fundraising following the loosening of the prudent investor rule, which encouraged
institutional investment (Gompers & Lerner, 1998). In most of Europe, institutional
investors remain a minority (Mayer, Schoors, & Yafeh, 2005) and their lack of
involvement may explain the lack of funds. Evidence suggests, however, that their
relatively-smaller involvement has not hindered the fundraising efforts and relative to
gross domestic product, European countries have caught up with the United States in
terms of VC funds invested (Oehler, Pukthuanthong, Rummer, & Walker, 2011).
Another argument put forward to explain the gap between the US and the EU is the lack
of profitability. Since VC funds have a limited lifespan and need to cash in their
investment, they rely on acquisitions and IPOs. To attract funds in the first place,
investors must believe they can profit. European VCs mainly rely on exiting through
acquisitions (Cumming D., 2008). VC funds may, however, prefer IPOs because they
24 Note that because Figures 8 and 9 use two different datasets. Since the Dow Jones dataset and the PEREP Analytics use different methods to gather data, which are kept private, they provide different data and should not be compared.
0
100
200
300
400
500
600
700
800
900
Am
ou
nts
in
million
s o
f Eu
ro
Amount invested by VC Funds of a given country Amounted invested into the companies of a given country
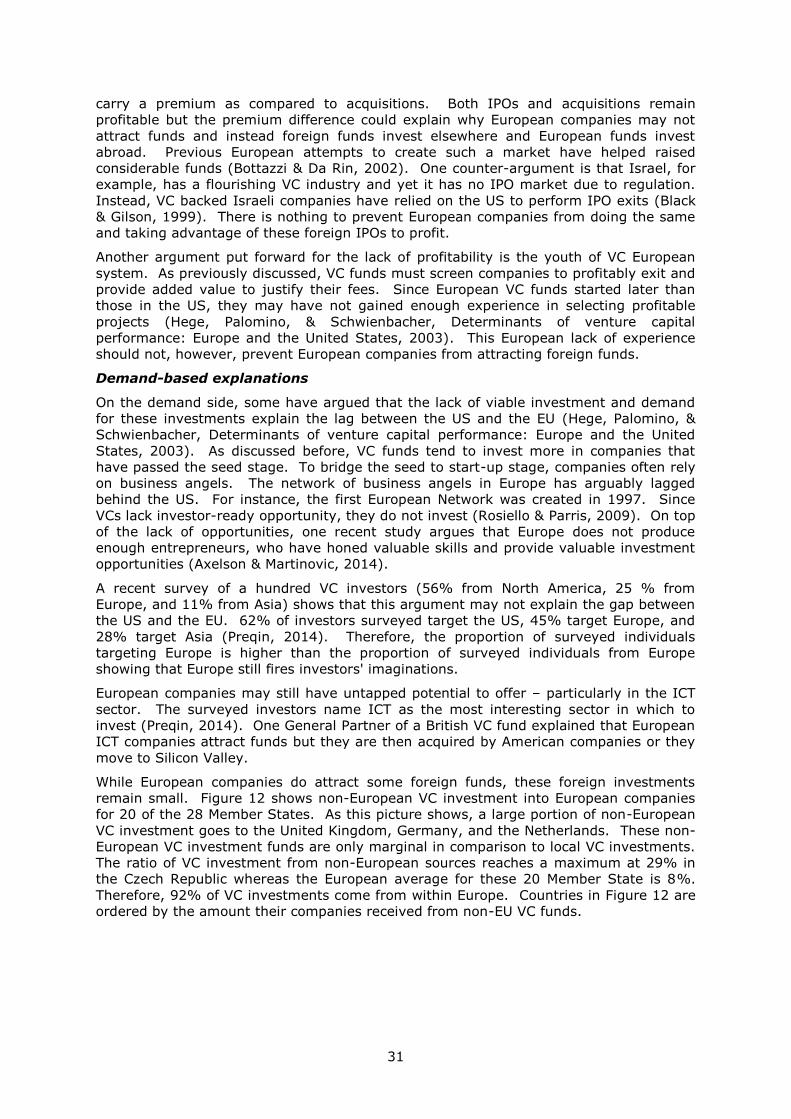
31
carry a premium as compared to acquisitions. Both IPOs and acquisitions remain
profitable but the premium difference could explain why European companies may not
attract funds and instead foreign funds invest elsewhere and European funds invest
abroad. Previous European attempts to create such a market have helped raised
considerable funds (Bottazzi & Da Rin, 2002). One counter-argument is that Israel, for
example, has a flourishing VC industry and yet it has no IPO market due to regulation.
Instead, VC backed Israeli companies have relied on the US to perform IPO exits (Black
& Gilson, 1999). There is nothing to prevent European companies from doing the same
and taking advantage of these foreign IPOs to profit.
Another argument put forward for the lack of profitability is the youth of VC European
system. As previously discussed, VC funds must screen companies to profitably exit and
provide added value to justify their fees. Since European VC funds started later than
those in the US, they may have not gained enough experience in selecting profitable
projects (Hege, Palomino, & Schwienbacher, Determinants of venture capital
performance: Europe and the United States, 2003). This European lack of experience
should not, however, prevent European companies from attracting foreign funds.
Demand-based explanations
On the demand side, some have argued that the lack of viable investment and demand
for these investments explain the lag between the US and the EU (Hege, Palomino, &
Schwienbacher, Determinants of venture capital performance: Europe and the United
States, 2003). As discussed before, VC funds tend to invest more in companies that
have passed the seed stage. To bridge the seed to start-up stage, companies often rely
on business angels. The network of business angels in Europe has arguably lagged
behind the US. For instance, the first European Network was created in 1997. Since
VCs lack investor-ready opportunity, they do not invest (Rosiello & Parris, 2009). On top
of the lack of opportunities, one recent study argues that Europe does not produce
enough entrepreneurs, who have honed valuable skills and provide valuable investment
opportunities (Axelson & Martinovic, 2014).
A recent survey of a hundred VC investors (56% from North America, 25 % from
Europe, and 11% from Asia) shows that this argument may not explain the gap between
the US and the EU. 62% of investors surveyed target the US, 45% target Europe, and
28% target Asia (Preqin, 2014). Therefore, the proportion of surveyed individuals
targeting Europe is higher than the proportion of surveyed individuals from Europe
showing that Europe still fires investors' imaginations.
European companies may still have untapped potential to offer – particularly in the ICT
sector. The surveyed investors name ICT as the most interesting sector in which to
invest (Preqin, 2014). One General Partner of a British VC fund explained that European
ICT companies attract funds but they are then acquired by American companies or they
move to Silicon Valley.
While European companies do attract some foreign funds, these foreign investments
remain small. Figure 12 shows non-European VC investment into European companies
for 20 of the 28 Member States. As this picture shows, a large portion of non-European
VC investment goes to the United Kingdom, Germany, and the Netherlands. These non-
European VC investment funds are only marginal in comparison to local VC investments.
The ratio of VC investment from non-European sources reaches a maximum at 29% in
the Czech Republic whereas the European average for these 20 Member State is 8%.
Therefore, 92% of VC investments come from within Europe. Countries in Figure 12 are
ordered by the amount their companies received from non-EU VC funds.
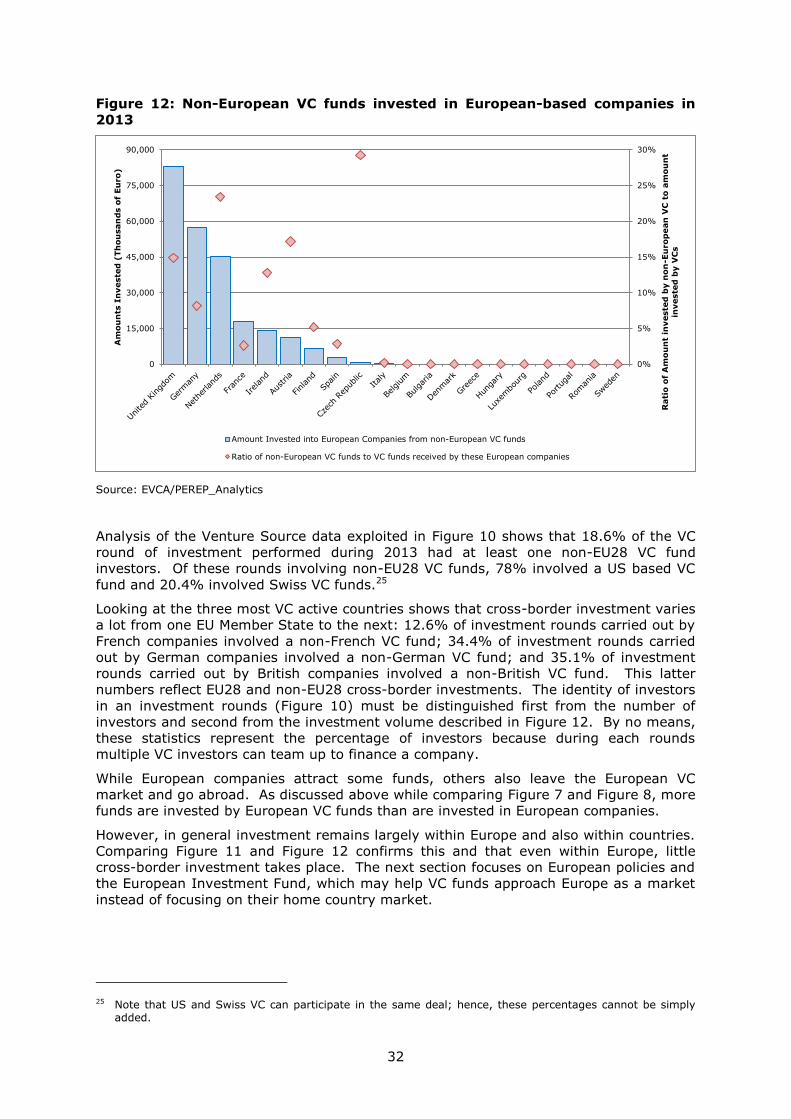
32
Figure 12: Non-European VC funds invested in European-based companies in
2013
Source: EVCA/PEREP_Analytics
Analysis of the Venture Source data exploited in Figure 10 shows that 18.6% of the VC
round of investment performed during 2013 had at least one non-EU28 VC fund
investors. Of these rounds involving non-EU28 VC funds, 78% involved a US based VC
fund and 20.4% involved Swiss VC funds.25
Looking at the three most VC active countries shows that cross-border investment varies
a lot from one EU Member State to the next: 12.6% of investment rounds carried out by
French companies involved a non-French VC fund; 34.4% of investment rounds carried
out by German companies involved a non-German VC fund; and 35.1% of investment
rounds carried out by British companies involved a non-British VC fund. This latter
numbers reflect EU28 and non-EU28 cross-border investments. The identity of investors
in an investment rounds (Figure 10) must be distinguished first from the number of
investors and second from the investment volume described in Figure 12. By no means,
these statistics represent the percentage of investors because during each rounds
multiple VC investors can team up to finance a company.
While European companies attract some funds, others also leave the European VC
market and go abroad. As discussed above while comparing Figure 7 and Figure 8, more
funds are invested by European VC funds than are invested in European companies.
However, in general investment remains largely within Europe and also within countries.
Comparing Figure 11 and Figure 12 confirms this and that even within Europe, little
cross-border investment takes place. The next section focuses on European policies and
the European Investment Fund, which may help VC funds approach Europe as a market
instead of focusing on their home country market.
25 Note that US and Swiss VC can participate in the same deal; hence, these percentages cannot be simply added.
0%
5%
10%
15%
20%
25%
30%
0
15,000
30,000
45,000
60,000
75,000
90,000
Rati
o o
f A
mou
nt
investe
d b
y n
on
-Eu
rop
ean
VC
to a
mou
nt
investe
d b
y V
Cs
Am
ou
nts
In
veste
d (
Th
ou
san
ds o
f Eu
ro)
Amount Invested into European Companies from non-European VC funds
Ratio of non-European VC funds to VC funds received by these European companies
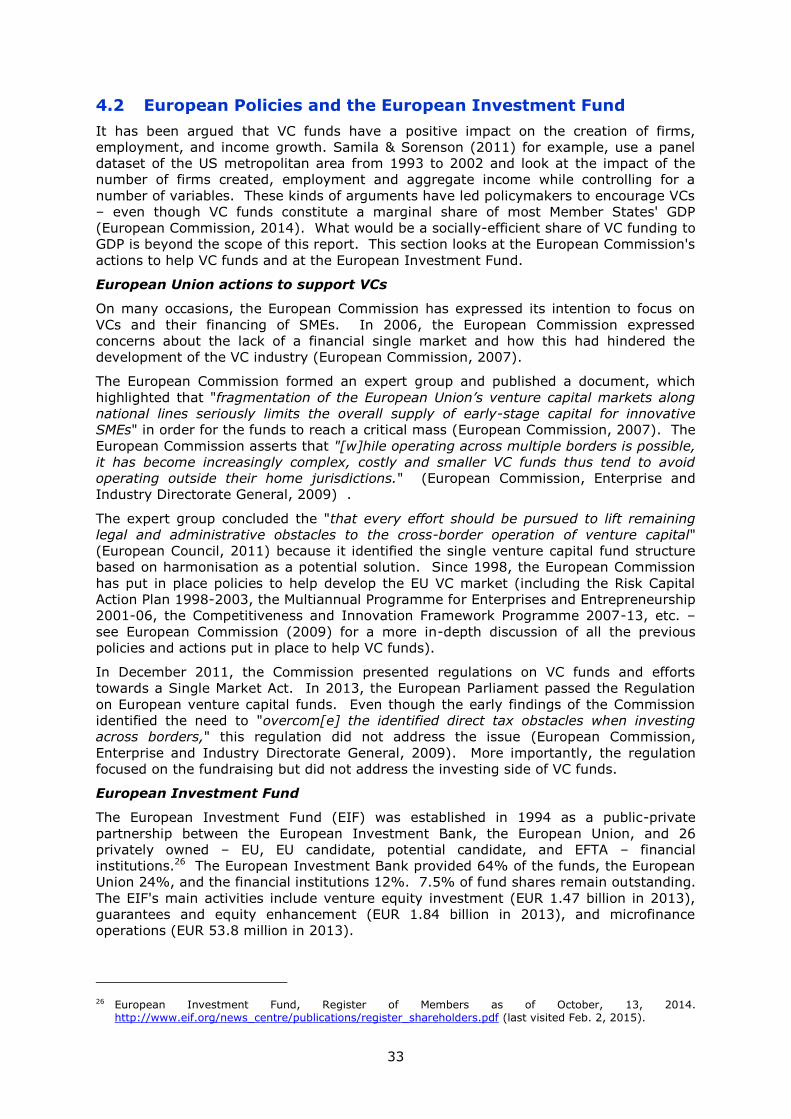
33
4.2 European Policies and the European Investment Fund
It has been argued that VC funds have a positive impact on the creation of firms,
employment, and income growth. Samila & Sorenson (2011) for example, use a panel
dataset of the US metropolitan area from 1993 to 2002 and look at the impact of the
number of firms created, employment and aggregate income while controlling for a
number of variables. These kinds of arguments have led policymakers to encourage VCs
– even though VC funds constitute a marginal share of most Member States' GDP
(European Commission, 2014). What would be a socially-efficient share of VC funding to
GDP is beyond the scope of this report. This section looks at the European Commission's
actions to help VC funds and at the European Investment Fund.
European Union actions to support VCs
On many occasions, the European Commission has expressed its intention to focus on
VCs and their financing of SMEs. In 2006, the European Commission expressed
concerns about the lack of a financial single market and how this had hindered the
development of the VC industry (European Commission, 2007).
The European Commission formed an expert group and published a document, which
highlighted that "fragmentation of the European Union’s venture capital markets along
national lines seriously limits the overall supply of early-stage capital for innovative
SMEs" in order for the funds to reach a critical mass (European Commission, 2007). The
European Commission asserts that "[w]hile operating across multiple borders is possible,
it has become increasingly complex, costly and smaller VC funds thus tend to avoid
operating outside their home jurisdictions." (European Commission, Enterprise and
Industry Directorate General, 2009) .
The expert group concluded the "that every effort should be pursued to lift remaining
legal and administrative obstacles to the cross-border operation of venture capital"
(European Council, 2011) because it identified the single venture capital fund structure
based on harmonisation as a potential solution. Since 1998, the European Commission
has put in place policies to help develop the EU VC market (including the Risk Capital
Action Plan 1998-2003, the Multiannual Programme for Enterprises and Entrepreneurship
2001-06, the Competitiveness and Innovation Framework Programme 2007-13, etc. –
see European Commission (2009) for a more in-depth discussion of all the previous
policies and actions put in place to help VC funds).
In December 2011, the Commission presented regulations on VC funds and efforts
towards a Single Market Act. In 2013, the European Parliament passed the Regulation
on European venture capital funds. Even though the early findings of the Commission
identified the need to "overcom[e] the identified direct tax obstacles when investing
across borders," this regulation did not address the issue (European Commission,
Enterprise and Industry Directorate General, 2009). More importantly, the regulation
focused on the fundraising but did not address the investing side of VC funds.
European Investment Fund
The European Investment Fund (EIF) was established in 1994 as a public-private
partnership between the European Investment Bank, the European Union, and 26
privately owned – EU, EU candidate, potential candidate, and EFTA – financial
institutions.26 The European Investment Bank provided 64% of the funds, the European
Union 24%, and the financial institutions 12%. 7.5% of fund shares remain outstanding.
The EIF's main activities include venture equity investment (EUR 1.47 billion in 2013),
guarantees and equity enhancement (EUR 1.84 billion in 2013), and microfinance
operations (EUR 53.8 million in 2013).
26 European Investment Fund, Register of Members as of October, 13, 2014. http://www.eif.org/news_centre/publications/register_shareholders.pdf (last visited Feb. 2, 2015).
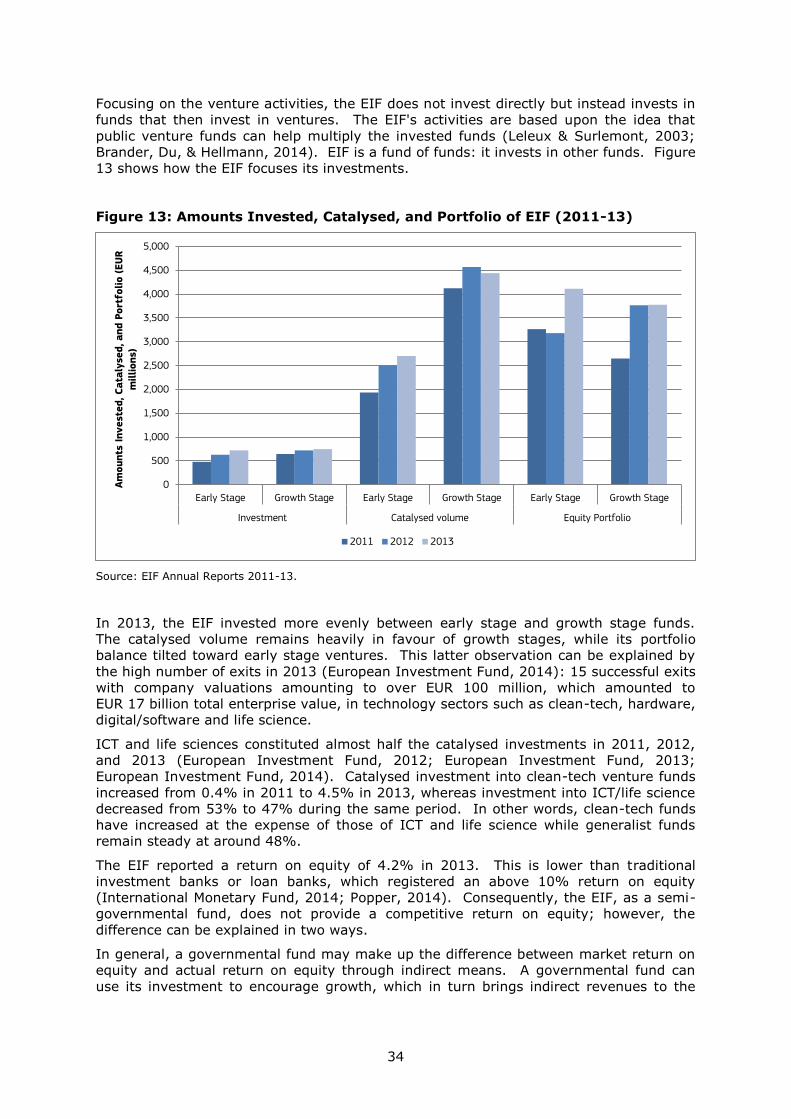
34
Focusing on the venture activities, the EIF does not invest directly but instead invests in
funds that then invest in ventures. The EIF's activities are based upon the idea that
public venture funds can help multiply the invested funds (Leleux & Surlemont, 2003;
Brander, Du, & Hellmann, 2014). EIF is a fund of funds: it invests in other funds. Figure
13 shows how the EIF focuses its investments.
Figure 13: Amounts Invested, Catalysed, and Portfolio of EIF (2011-13)
Source: EIF Annual Reports 2011-13.
In 2013, the EIF invested more evenly between early stage and growth stage funds.
The catalysed volume remains heavily in favour of growth stages, while its portfolio
balance tilted toward early stage ventures. This latter observation can be explained by
the high number of exits in 2013 (European Investment Fund, 2014): 15 successful exits
with company valuations amounting to over EUR 100 million, which amounted to
EUR 17 billion total enterprise value, in technology sectors such as clean-tech, hardware,
digital/software and life science.
ICT and life sciences constituted almost half the catalysed investments in 2011, 2012,
and 2013 (European Investment Fund, 2012; European Investment Fund, 2013;
European Investment Fund, 2014). Catalysed investment into clean-tech venture funds
increased from 0.4% in 2011 to 4.5% in 2013, whereas investment into ICT/life science
decreased from 53% to 47% during the same period. In other words, clean-tech funds
have increased at the expense of those of ICT and life science while generalist funds
remain steady at around 48%.
The EIF reported a return on equity of 4.2% in 2013. This is lower than traditional
investment banks or loan banks, which registered an above 10% return on equity
(International Monetary Fund, 2014; Popper, 2014). Consequently, the EIF, as a semi-
governmental fund, does not provide a competitive return on equity; however, the
difference can be explained in two ways.
In general, a governmental fund may make up the difference between market return on
equity and actual return on equity through indirect means. A governmental fund can
use its investment to encourage growth, which in turn brings indirect revenues to the
0
500
1,000
1,500
2,000
2,500
3,000
3,500
4,000
4,500
5,000
Early Stage Growth Stage Early Stage Growth Stage Early Stage Growth Stage
Investment Catalysed volume Equity Portfolio
Am
ounts
Invest
ed, C
ata
lyse
d, and P
ort
folio (
EU
R
millions)
2011 2012 2013

35
government through higher tax revenues. Hence, a governmental fund need not reach
the same returns as private investment as discussed previously in Section 1.
Governmental funds may also pursue goals other than competitive return, such as social
goals. For instance, the EIF has invested in "social impact" endeavours and EUR 52
million in a Social Impact Accelerator funds-of-fun. These projects would probably have
a lower direct return on equity but they may create social benefits that are directly not
measurable such as social inclusion, community empowerment, etc.
Even if public funds perform below their equivalent private funds, they can contribute to
society and economic growth.
The EIF also helps create a sense of European community and joint endeavour. It helps
cross-border investments because it draws from 26 local investment institutions to
redistribute across Europe to investment funds, which probably invest more locally.
Thus, the EIF provides another indirect way to increase the currently marginal cross-
border investment.
Table 1 shows a sample of EIF initiatives across the greater Europe. As can be seen
through these initiatives, EIF partners up with local governments to create fund-of-funds
that will then be invested into VC funds along with private funds. Most projects target
specific countries. For instance, NEOTEC is a fund of fund that created in 2006 and that
invested in VC funds that invested in Spain. Other initiatives are target smaller regions.
For instance, LfA-EIF Facility is a fund-of-fund created in 2009 and that invested in VC
that invested in the Bavarian region of Germany.
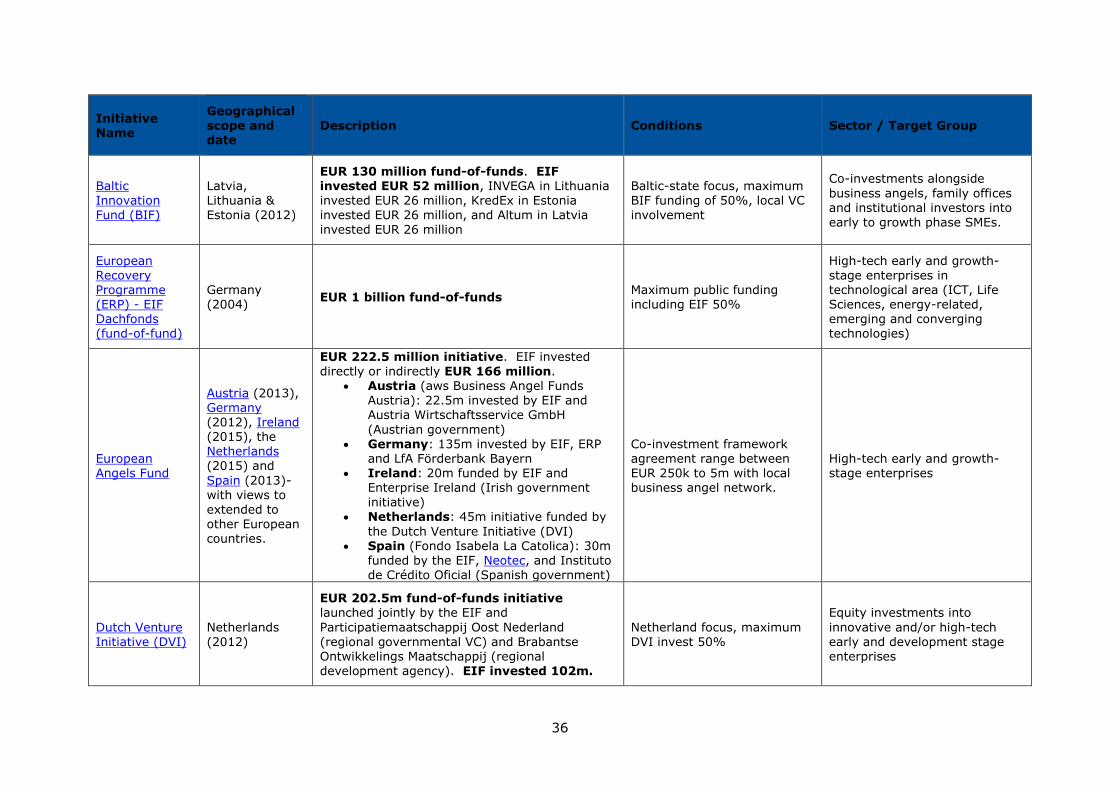
36
Initiative Name
Geographical scope and date
Description Conditions Sector / Target Group
Baltic Innovation
Fund (BIF)
Latvia, Lithuania &
Estonia (2012)
EUR 130 million fund-of-funds. EIF invested EUR 52 million, INVEGA in Lithuania invested EUR 26 million, KredEx in Estonia
invested EUR 26 million, and Altum in Latvia invested EUR 26 million
Baltic-state focus, maximum BIF funding of 50%, local VC
involvement
Co-investments alongside
business angels, family offices and institutional investors into
early to growth phase SMEs.
European Recovery Programme (ERP) - EIF Dachfonds (fund-of-fund)
Germany (2004)
EUR 1 billion fund-of-funds Maximum public funding including EIF 50%
High-tech early and growth-stage enterprises in technological area (ICT, Life Sciences, energy-related, emerging and converging technologies)
European Angels Fund
Austria (2013), Germany (2012), Ireland (2015), the Netherlands (2015) and
Spain (2013)- with views to
extended to other European countries.
EUR 222.5 million initiative. EIF invested directly or indirectly EUR 166 million.
Austria (aws Business Angel Funds Austria): 22.5m invested by EIF and Austria Wirtschaftsservice GmbH
(Austrian government) Germany: 135m invested by EIF, ERP
and LfA Förderbank Bayern Ireland: 20m funded by EIF and
Enterprise Ireland (Irish government
initiative) Netherlands: 45m initiative funded by
the Dutch Venture Initiative (DVI) Spain (Fondo Isabela La Catolica): 30m
funded by the EIF, Neotec, and Instituto de Crédito Oficial (Spanish government)
Co-investment framework agreement range between EUR 250k to 5m with local business angel network.
High-tech early and growth-stage enterprises
Dutch Venture
Initiative (DVI)
Netherlands
(2012)
EUR 202.5m fund-of-funds initiative launched jointly by the EIF and
Participatiemaatschappij Oost Nederland
(regional governmental VC) and Brabantse Ontwikkelings Maatschappij (regional development agency). EIF invested 102m.
Netherland focus, maximum
DVI invest 50%
Equity investments into
innovative and/or high-tech
early and development stage enterprises
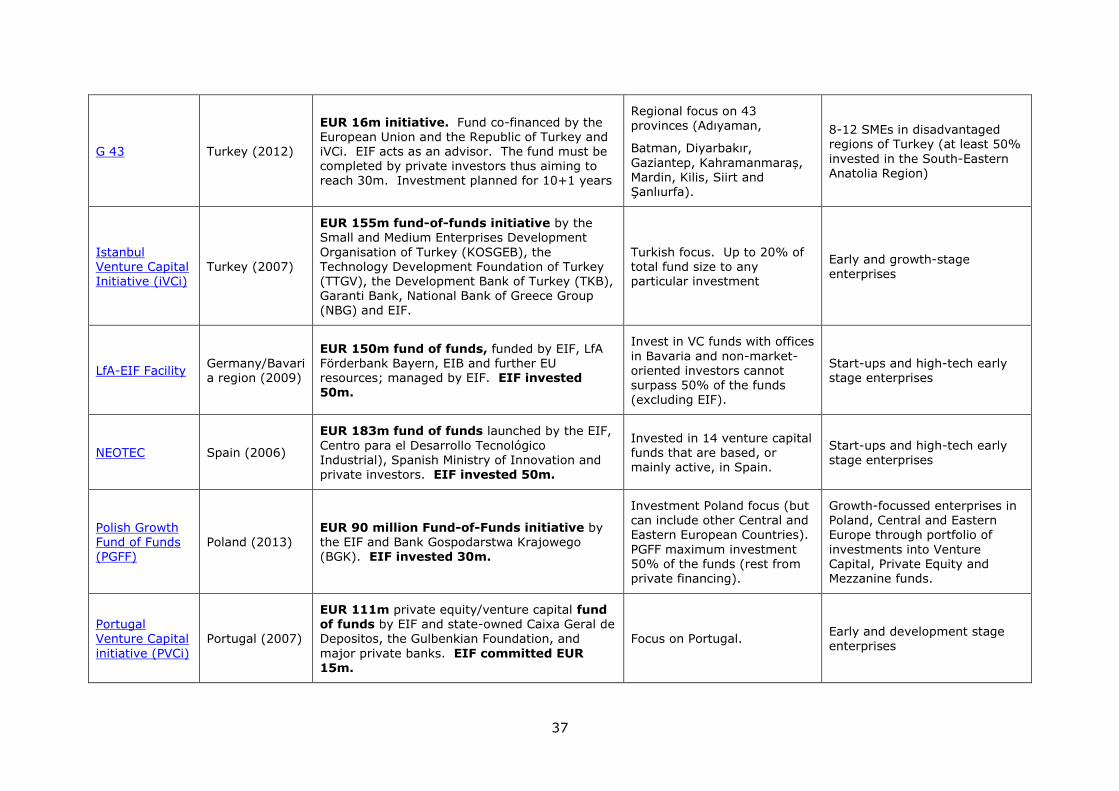
37
G 43 Turkey (2012)
EUR 16m initiative. Fund co-financed by the European Union and the Republic of Turkey and iVCi. EIF acts as an advisor. The fund must be completed by private investors thus aiming to reach 30m. Investment planned for 10+1 years
Regional focus on 43 provinces (Adıyaman,
Batman, Diyarbakır,
Gaziantep, Kahramanmaraș, Mardin, Kilis, Siirt and Şanlıurfa).
8-12 SMEs in disadvantaged regions of Turkey (at least 50%
invested in the South-Eastern Anatolia Region)
Istanbul Venture Capital Initiative (iVCi)
Turkey (2007)
EUR 155m fund-of-funds initiative by the Small and Medium Enterprises Development
Organisation of Turkey (KOSGEB), the Technology Development Foundation of Turkey (TTGV), the Development Bank of Turkey (TKB), Garanti Bank, National Bank of Greece Group (NBG) and EIF.
Turkish focus. Up to 20% of total fund size to any particular investment
Early and growth-stage enterprises
LfA-EIF Facility
Germany/Bavaria region (2009)
EUR 150m fund of funds, funded by EIF, LfA
Förderbank Bayern, EIB and further EU resources; managed by EIF. EIF invested 50m.
Invest in VC funds with offices
in Bavaria and non-market-oriented investors cannot surpass 50% of the funds (excluding EIF).
Start-ups and high-tech early stage enterprises
NEOTEC Spain (2006)
EUR 183m fund of funds launched by the EIF,
Centro para el Desarrollo Tecnológico Industrial), Spanish Ministry of Innovation and private investors. EIF invested 50m.
Invested in 14 venture capital funds that are based, or mainly active, in Spain.
Start-ups and high-tech early stage enterprises
Polish Growth Fund of Funds (PGFF)
Poland (2013) EUR 90 million Fund-of-Funds initiative by the EIF and Bank Gospodarstwa Krajowego (BGK). EIF invested 30m.
Investment Poland focus (but can include other Central and Eastern European Countries).
PGFF maximum investment 50% of the funds (rest from private financing).
Growth-focussed enterprises in Poland, Central and Eastern Europe through portfolio of
investments into Venture Capital, Private Equity and Mezzanine funds.
Portugal Venture Capital
initiative (PVCi)
Portugal (2007)
EUR 111m private equity/venture capital fund of funds by EIF and state-owned Caixa Geral de Depositos, the Gulbenkian Foundation, and
major private banks. EIF committed EUR 15m.
Focus on Portugal. Early and development stage
enterprises
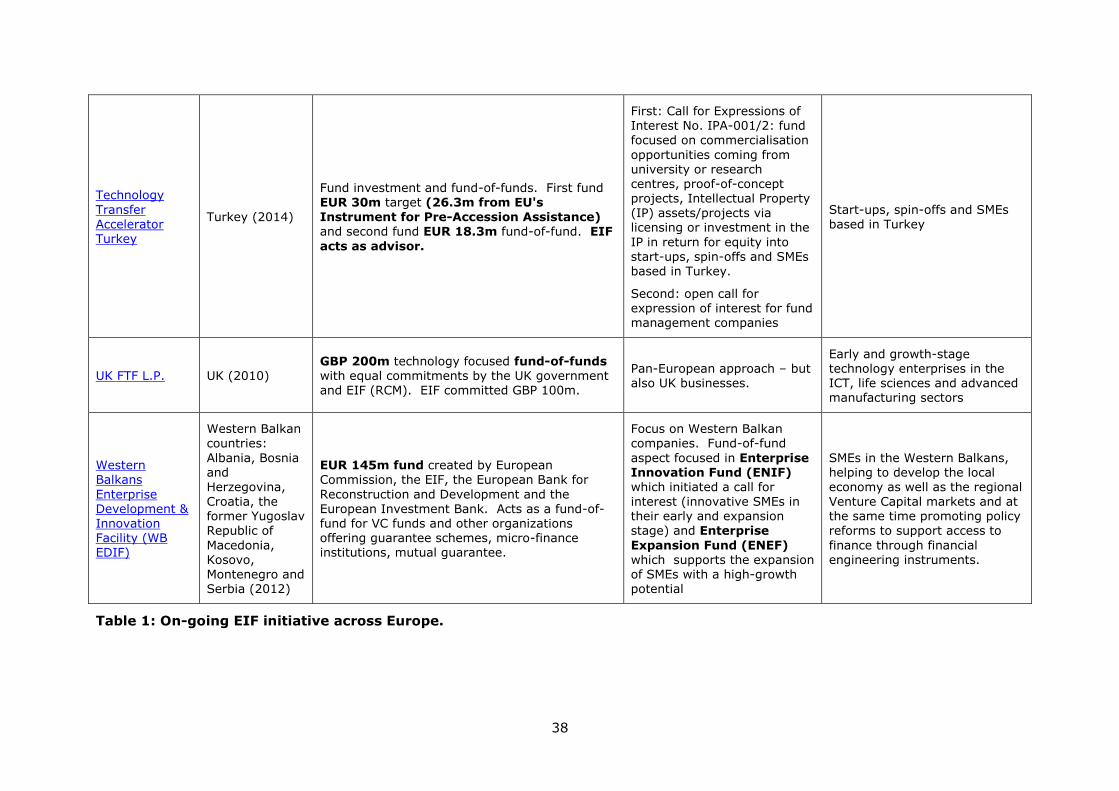
38
Technology
Transfer
Accelerator Turkey
Turkey (2014)
Fund investment and fund-of-funds. First fund EUR 30m target (26.3m from EU's
Instrument for Pre-Accession Assistance) and second fund EUR 18.3m fund-of-fund. EIF
acts as advisor.
First: Call for Expressions of Interest No. IPA-001/2: fund focused on commercialisation
opportunities coming from university or research centres, proof-of-concept projects, Intellectual Property
(IP) assets/projects via licensing or investment in the
IP in return for equity into start-ups, spin-offs and SMEs based in Turkey.
Second: open call for expression of interest for fund management companies
Start-ups, spin-offs and SMEs
based in Turkey
UK FTF L.P. UK (2010) GBP 200m technology focused fund-of-funds with equal commitments by the UK government and EIF (RCM). EIF committed GBP 100m.
Pan-European approach – but also UK businesses.
Early and growth-stage technology enterprises in the ICT, life sciences and advanced manufacturing sectors
Western Balkans
Enterprise
Development & Innovation Facility (WB EDIF)
Western Balkan countries:
Albania, Bosnia and Herzegovina,
Croatia, the former Yugoslav Republic of
Macedonia, Kosovo, Montenegro and Serbia (2012)
EUR 145m fund created by European Commission, the EIF, the European Bank for
Reconstruction and Development and the
European Investment Bank. Acts as a fund-of-fund for VC funds and other organizations offering guarantee schemes, micro-finance institutions, mutual guarantee.
Focus on Western Balkan companies. Fund-of-fund
aspect focused in Enterprise Innovation Fund (ENIF) which initiated a call for
interest (innovative SMEs in their early and expansion stage) and Enterprise
Expansion Fund (ENEF) which supports the expansion of SMEs with a high-growth potential
SMEs in the Western Balkans, helping to develop the local economy as well as the regional
Venture Capital markets and at the same time promoting policy reforms to support access to
finance through financial engineering instruments.
Table 1: On-going EIF initiative across Europe.
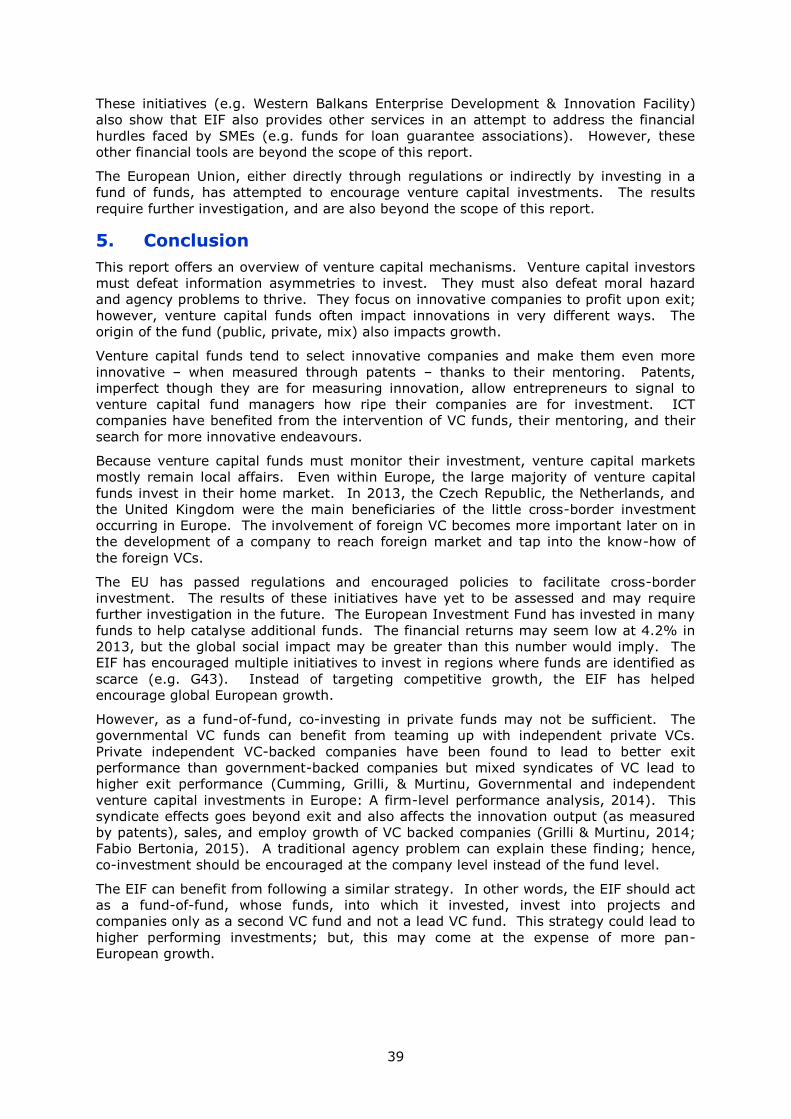
39
These initiatives (e.g. Western Balkans Enterprise Development & Innovation Facility)
also show that EIF also provides other services in an attempt to address the financial
hurdles faced by SMEs (e.g. funds for loan guarantee associations). However, these
other financial tools are beyond the scope of this report.
The European Union, either directly through regulations or indirectly by investing in a
fund of funds, has attempted to encourage venture capital investments. The results
require further investigation, and are also beyond the scope of this report.
5. Conclusion
This report offers an overview of venture capital mechanisms. Venture capital investors
must defeat information asymmetries to invest. They must also defeat moral hazard
and agency problems to thrive. They focus on innovative companies to profit upon exit;
however, venture capital funds often impact innovations in very different ways. The
origin of the fund (public, private, mix) also impacts growth.
Venture capital funds tend to select innovative companies and make them even more
innovative – when measured through patents – thanks to their mentoring. Patents,
imperfect though they are for measuring innovation, allow entrepreneurs to signal to
venture capital fund managers how ripe their companies are for investment. ICT
companies have benefited from the intervention of VC funds, their mentoring, and their
search for more innovative endeavours.
Because venture capital funds must monitor their investment, venture capital markets
mostly remain local affairs. Even within Europe, the large majority of venture capital
funds invest in their home market. In 2013, the Czech Republic, the Netherlands, and
the United Kingdom were the main beneficiaries of the little cross-border investment
occurring in Europe. The involvement of foreign VC becomes more important later on in
the development of a company to reach foreign market and tap into the know-how of
the foreign VCs.
The EU has passed regulations and encouraged policies to facilitate cross-border
investment. The results of these initiatives have yet to be assessed and may require
further investigation in the future. The European Investment Fund has invested in many
funds to help catalyse additional funds. The financial returns may seem low at 4.2% in
2013, but the global social impact may be greater than this number would imply. The
EIF has encouraged multiple initiatives to invest in regions where funds are identified as
scarce (e.g. G43). Instead of targeting competitive growth, the EIF has helped
encourage global European growth.
However, as a fund-of-fund, co-investing in private funds may not be sufficient. The
governmental VC funds can benefit from teaming up with independent private VCs.
Private independent VC-backed companies have been found to lead to better exit
performance than government-backed companies but mixed syndicates of VC lead to
higher exit performance (Cumming, Grilli, & Murtinu, Governmental and independent
venture capital investments in Europe: A firm-level performance analysis, 2014). This
syndicate effects goes beyond exit and also affects the innovation output (as measured
by patents), sales, and employ growth of VC backed companies (Grilli & Murtinu, 2014;
Fabio Bertonia, 2015). A traditional agency problem can explain these finding; hence,
co-investment should be encouraged at the company level instead of the fund level.
The EIF can benefit from following a similar strategy. In other words, the EIF should act
as a fund-of-fund, whose funds, into which it invested, invest into projects and
companies only as a second VC fund and not a lead VC fund. This strategy could lead to
higher performing investments; but, this may come at the expense of more pan-
European growth.
40
Bibliography
Alden, W. (2015, January 21). Venture Capital Outpaces Buyouts in Investment Returns. Retrieved from The New York Times:
http://dealbook.nytimes.com/2015/01/21/venture-capital-outpaces-buyouts-in-investment-returns/
Avnimelech, G., Rosiello, A., & Teubal, M. (2010). Evolutionary interpretation of venture capital policy in Israel, Germany, UK and
Scotland. Science and Public Policy, 1-12. Axelson, U., & Martinovic, M. (2014). European Venture Capital: Myths
and Facts. London, UK: British Private Equity & Venture Capital Association.
Beacham, M., & Datta, B. (2013). Who Becomes the Winner? Effects of
Venture Capital on Firms' Innovative Incentives. University of York Working Paper.
Bergemann, D., & Hege, U. (1998). Venture capital financing, moral hazard and learning. Journal of Banking & Finance, 703-35.
Bertoni, F., & Grilli., L. (2005). The causality relationship between external private equity financing and the growth of new technology-
based firms. 32nd Conference of the European Association for Research in Industrial Economics, Porto. .
Biagi, F. (2013). ICT and Productivity: A Review of the Literature. Institute for Prospective Technological Studies Digital Economy
Working Paper 2013/07. Black, B. S., & Gilson, R. J. (1999). Does venture capital require an active
stock market? Journal of Applied Corporate Finance, 36-48. Bottazzi, L., & Da Rin, M. (2002). Venture capital in Europe and the
financing of innovative companies. Economic Policy, 229-270.
Brander, J. A., Du, Q., & Hellmann, T. (2014). The Effects of Government-Sponsored Venture Capital: International Evidence. Review of
Finance, 1–48. Brau, J. C., & Fawcett, S. E. (2006). Initial Public Offerings: An Analysis of
Theory and Practice. Journal fo Finance, 399-436. Brau, J. C., Francis, B., & Kohers, N. (2003). The Choice of IPO versus
Takover: Empirical Evidence. The Journal of Business, 583-612. BVCA. (2002). Limited Partnership Agreement. London: BVCA.
Chemmanur, T., Loutskina, E., & Tian, X. (2015). Corporate Venture Capital, Value Creation, and Innovation. Review of Financial
Studies. Croce, A., Martí, J., & Murtinu, S. (2013). The impact of venture capital
on the productivity growth of European entrepreneurial firms: ‘Screening’ or ‘value added’ effect? Journal of Business Venturing,
489–510.
Cumming, D. (2008). Contracts and Exits in Venture Capital Finance. The Review of Financial Studies, 1947-1982.
Cumming, D. J. (2006). The Determinants of Venture Capital Portfolio Size: Empirical Evidence. Journal of Business , 1083-1126.
41
Cumming, D. J., & MacIntosh, J. G. (2003). A cross-country comparison
of full and partial venture capital exits. Journal of Banking & Finance, 511–548.
Cumming, D. J., Grilli, L., & Murtinu, S. (2014). Governmental and independent venture capital investments in Europe: A firm-level
performance analysis. Journal of Corporate Finance. Cumming, D., & Dai, N. (2010). Locas bias in venture capital investments.
Journal of Empirical Finance, 362-380. Cumming, D., Fleming, G., & Schwienbacher, A. (2006). Legality and
venture capital exits. Journal of Corporate Finance, 214-245. Cumming, D., Fleming, G., & Schwienbacher, A. (2007). The Structure of
Venture Capital Funds. In H. Landstroom, Handbook of Research on Venture Capital (pp. 155-176). Edward Elgar Pub.
Devigne, D., Vanacker, T., Manigart, S., & Paeleman, I. (2013). The Role of Domestic and Cross-Border Venture Capital Investors in the
Growth of Portfolio Companies. Small Business Economics, 553-
573. Dubiansky, J. E. (2006). An analysis for the valuation of venture capital-
funded startup firm patents. B.U. Journal of Science and Technology Law, 170.
Engel, D., & Keilbach, M. (2007). Firm-level implications of early stage venture capital investment – An empirical investigation. Journal of
Empirical Finance, 150-167. Ernst & Young. (2014). Adapting and evolving: Global venture capital
insights and trends 2014. Ernst & Young. European Commission. (2007). Accompanying the document -
Communication from the Commission to the Council, the European Parliament, the European Economic and Social Committee and the
Committee of the Regions: Removing obstacles to cross-border investments by venture capital funds. Brussels: European
Commission.
European Commission. (2007). Communication from the Commission to the Council, the European Parliament, the European Economic and
Social Comittee and the Committee of the Region: Removing obstacles to cross-border investments by venture capital funds.
Brussels: Commission Staff Working Document. European Commission. (2014, June). Access to Finance for SMEs: Venture
capital. Retrieved from European Commission: http://ec.europa.eu/growth/tools-databases/smaf/venture-
capital/index_en.htm European Commission, Enterprise and Industry Directorate General.
(2009). Cross-border venture capital in the European Union. European Commission.
European Council. (2011). Conclusions of the European Council (4 February 2011). Brussels, Belgium: European Commission.
European Investment Fund. (2012). Annual Report 2011. Luxembourg:
European Investment Fund.
42
European Investment Fund. (2013). Annual Report 2012. Luxembourg:
European Investment Fund. European Investment Fund. (2014). Annual Report 2013. Luxembourg:
European Investment Fund. European Parliament and Council. (2013, April 17). REGULATION (EU) No
345/2013 OF THE EUROPEAN PARLIAMENT AND OF THE COUNCIL of 17 April 2013 on European venture capital funds. Official Journal
of the European Union. Brussels, Belgium. European Private Equity and Venture Capital Association. (2013). 2013
European Private Equity Activity. Brussels, Belgium: European Private Equity and Venture Capital Association.
European Private Equity and Venture Capital Association. (2014, May 6). 2013 The EVCA Yearbook. Retrieved from European Private Equity &
Venture Capital Association: http://www.evca.eu/research/activity-data/annual-activity-statistics/
European Private Equity and Venture Capital Association Tax and Legal
Committee. (2010). Private Equity Fund Structures in Europe. European Private Equity and Venture Capital Association.
Fabio Bertonia, T. T. (2015). Does governmental venture capital spur invention and innovation? Evidence from young European biotech
companies. Research Policy, 925–935. Fried, V. H., Bruton, G. D., & Hisrich, R. D. (1998). Strategy and the
board of directors in venture capital-backed firms. Journal of business venturing, 493-503.
Gabison, G. A. (2015). Birth, Survival, Growth, and Death of ICT Companies. Luxembourg: European Commission Joint Research
Centre. Gilson, R. J. (2003). Engineering a Venture Capital Market: Lessons from
the American Experience. Stanford Law Review, 1067-1103. Gompers, P. A. (1995). Optimal Investment, Monitoring, and the Staging
of Venture Capital. The Journal of Finance, 1461-1489.
Gompers, P. A. (1997). Ownership and Control in Entrepreneurial Firms: An Examination of Convertible Securities in Venture Capital
Investments. Harvard Business School working paper. Gompers, P. A., & Lerner, J. (1998). What Drives Venture Capital
Fundraising? Brookings Papers on Economic Activity. Microeconomics, 149-204.
Gompers, P. A., & Lerner, J. (2004). The Venture Capital Cycle. MIT Press.
Gompers, P., & Lerner, J. (2000). Money chasing deals? The impact of fund inflows on private equity valuations. Journal of Financial
Economics, 281-325. Gompers, P., & Lerner, J. (2001). The Venture Capital Revolution. The
Journal of Economic Perspectives, 145-168. Graham, S. J., Merges, R. P., Samuelson, P., & Sichelman, T. (2009).
High Technology Entrepreneurs and the Patent. Berkeley
Technology Law Journal, 1255-1328.
43
Griliches, Z. (1998). Patent Statistics as Economic Indicators: A Survey.
In Z. Griliches, R & D and Productivity: the Economic Evidence (pp. 287-343). Chicago: University of Chicago Press.
Grilli, L., & Murtinu, S. (2014). Government, venture capital and the growth of European high-tech entrepreneurial firms. Research
Policy, 1523–1543. Häussler, C., Harhoff, D., & Müller, E. (2009). To Be Financed or Not -
The Role of Patents for Venture Capital Financing. CEPR Discussion Paper No. DP7115.
Hege, U., Palomino, F., & Schwienbacher, A. (2003). Determinants of venture capital performance: Europe and the United States. LSE
Ricafe Working Paper 1. Hege, U., Palomino, F., & Schwienbacher, A. (2009). Venture capital
performance: the disparity between Europe and the United States. Finance, 7-50.
Hirukawa, M., & Ueda, M. (2011). Venture Capital and Innovation: Which
is First? Pacific Economic Review, 421-65. Hsu, D. H. (2007). Experienced entrepreneurial founders, organizational
capital, and venture capital funding. Research Policy, 722-41. Intel Capital. (2014). Backgrounder. Intel Capital.
International Monetary Fund. (2014). Euro Area Policies. Washington, DC: International Monetary Fund.
Ipsos Mori. (2013). 2013 SMEs’ Access to Finance survey. http://ec.europa.eu/enterprise/policies/finance/files/2013-safe-
analytical-report_en.pdf: European Commission. Isenberg, D. J. (2010). How to start an entrepreneurial revolution.
Harvard Business Review, 40-50. Kaplan, S. N., & Strömberg, P. (2003). Financial Contracting Theory
Meets the Real World: An Empirical Analysis of Venture Capital Contracts. The Review of Economic Studies, 281-315.
Klausner, M., & Litvak, K. (2002). What Economists Have Taught Us
About Venture Capital Contracting. In M. J. Whincop, Bridging the Entrepreneurial Financing Gap: Linking Governance With Regulatory
Policy. Ashgate Pub Ltd. Kortum, S., & Lerner, J. (2000). Assessing the Contribution of Venture
Capital to Innovation. RAND Journal of Economics , 674-92. Lantz, J.-S., Sahut, J.-M., & Teulon, F. (2011). What is the Real Role of
Corporate Venture Capital. International Journal of Business, 368-382.
Lee, P. M., & Waha, S. (2004). Grandstanding, certification and the underpricing of venture capital backed IPOs. Journal of Financial
Economics, 375-407. Leleux, B., & Surlemont, B. (2003). Public versus private venture capital:
seeding or crowding out? A pan-European analysis. Journal of Business Venturing, 81–104.
Long, C. (2002). Patent Signals. The University of Chicago Law Review,
625-679.
44
Manigart, S., De Waele, K., Wright, M., Robbie, K., Desbrières, P.,
Sapienza, H. J., et al. (2002). Determinants of required return in venture capital investments: a five-country study. Journal of
Business Venturing, 291-312. Mason, C. M., & Harrison, R. T. (2002). The Geography of Venture Capital
Investments in the UK. Transactions of the Institute of British Geographers, 427-451.
Mayer, C., Schoors, K., & Yafeh, Y. (2005). Sources of Funds and Investment Strategies of Venture Capital Funds: Evidence from
Germany, Israel, Japan and the UK. Journal of Corporate Fiannce, 586-608.
Metrick, A., & Yasuda, A. (2011). Venture Capital & the Finance of Innovation. John Wiley & Sons, Inc.
Moncada-Paternò-Castello, P., Vezzani, A., Hervás, F., & Montresor, S. (2014). Financing R&D and Innovation for Corporate Growth: What
new evidence should policymakers know? Sevilla, Spain: European
Commission, Joint Research Centre - Institute for Prospective Technological Studies.
Nahata, R. (2008). Venture capita lreputation and investment performance. Journal of Financial Economics, 127-151.
OECD & Eurostat. (2005). Oslo Manual. OECD Publishing. OECD. (2011). Financing High-Growth Firms: The Role of Angel Investors.
OECD Publishing. OECD. (2011). OECD Guide to Measuring the Information Society. OECD
Publishing. OECD. (2015). Financing SMEs and Entrepreneurs 2015: An OECD
Scoreboard. OECD Publishing. Oehler, A., Pukthuanthong, K., Rummer, M., & Walker, T. (2011). Venture
capital in Europe: closing the gap to the U.S. In G. N. Gregoriou, M. Kooli, & R. Kraeussl, Venture Capital in Europe (Quantitative
Finance) (pp. 3-17).
Pearce, R., & Barnes, S. (2006). Raising Venture Capital. John Wiley & Sons.
Peneder, M. (2010). The impact of venture capital on innovation behaviour and firm growth. Venture Capital, 83-107.
Polder, M., van Leeuwen, G., Mohnen, P., & Raymond, W. (2010). Product, Process and Organizational Innovation: Drivers,
Complementarity and Productivity Effects. UNU-MERIT working paper.
Popper, N. (2014, October 7). Profit at Goldman Less Easy to Find. Retrieved from New York Times:
http://dealbook.nytimes.com/2014/10/07/profit-at-goldman-less-easy-to-find/
Preqin. (2014). Preqin Special Report: Venture Capital. Preqin. Rosiello, A., & Parris, S. (2009). The Patterns of Venture Capital
Investment in the UK Bio-Healthcare Sector: The Role of Proximity,
Cumulative Learning and Specialisation. Venture Capital, 185-211.

45
Sahlman, W. A. (1990). The structure and governance of venture-capital
organizations. Journal of Financial Economics, 473–521. Samila, S., & Sorenson, O. (2011). Venture capital, entrepreneurship, and
economic growth. The Review of Economics and Statistics, 338-349. Schröder, C. (2013). Regional and company‐specific factors for high
growth dynamics of ICT companies in Germany with particular emphasis on knowledge spillovers. Regional Science , 741-772.
Schumpeter, J. A. (1939). Business Cycles, a Theoretical, Historial and Statistical Analysis of the Capitalist Process.
Schwienbacher, A. (2005). An empirical analysis of venture capital exits
in Europe and the United States. EFA 2002 Berlin Meetings Discussion Paper.
Solomon, S. D. (2014, December 16). Throwing Money at Start-Ups in Frenzy to Find the Next Uber. Retrieved from The New York Times:
http://dealbook.nytimes.com/2014/12/16/throwing-money-at-start-ups-in-frenzy-to-find-the-next-uber/?_r=0
Sorenson, O., & Stuart, T. E. (2001). Syndication Networks and the Spatial Distribution of Venture Capital Investments. American
Journal of Sociology, 1546-88. Spiezia, V. (2011). Are ICT Users More Innovative? an Analysis of ICT-
Enabled Innovation in OECD Firms. 2011: OECD Journal: Economic Studies.
Stross, R. (2006, October 22). It’s Not the People You Know. It’s Where You Are. Retrieved from New York Times:
http://www.nytimes.com/2006/10/22/business/yourmoney/22digi.h
tml Tian, X. (2011). The causes and consequences of venture capital stage
financing. Journal of Financial Economics, 132–159. Triantis, G. G. (1999). Financial Contract Design in the World of Venture
Capital. In P. Gompers, & J. Lerner, The Venture Capital Cycle. MIT. Useche, D. (2012). Are patents signals for the IPO market? Evidence for
an empirical analysis of the US and the European software industry. University of Montesquieu Bordeaux IV working paper.

46
List of Figures
Figure 1: Venture Capital Funds Invested by Sectors in Europe (in billion €) .............. 6
Figure 2: Amount raised by VC Funds according to the Type of Investors in Europe
(in billions of Euro) ................................................................................................................................................. 10
Figure 3: Funds Raised and Invested by All Private Equity Funds (2007-13) in
Europe (billions of Euro) .................................................................................................................................... 12
Figure 4: Functioning of Venture Capital Funds ............................................................................... 14
Figure 5: Companies Development Stage and VC Fund Involvement ............................... 16
Figure 6: Amount raised by European VC funds by Types of Companies Targeted17
Figure 7: Amount Invested by European VC Funds into Companies according to
their Development Stage ................................................................................................................................... 18
Figure 8: Number of European Companies receiving VC funding (by types of
companies) .................................................................................................................................................................... 19
Figure 9: Average amount invested by VC in European Companies (by types of
companies) .................................................................................................................................................................... 20
Figure 10: Amount of VC Funds invested in each European Member State and
Amount of VC Funds invested in ICT Companies in 2013 (millions of Euro) .............. 28
Figure 11: Amount Invested by European VC Funds and in European Companies . 30
Figure 12: Non-European VC funds invested in European-based companies in
2013 .................................................................................................................................................................................. 32
Figure 13: Amounts Invested, Catalysed, and Portfolio of EIF (2011-13) ................... 34

How to obtain EU publications
Our publications are available from EU Bookshop (http://bookshop.europa.eu),
where you can place an order with the sales agent of your choice.
The Publications Office has a worldwide network of sales agents.
You can obtain their contact details by sending a fax to (352) 29 29-42758.
Europe Direct is a service to help you find answers to your questions about the European Union
Free phone number (*): 00 800 6 7 8 9 10 11
(*) Certain mobile telephone operators do not allow access to 00 800 numbers or these calls may be billed.
A great deal of additional information on the European Union is available on the Internet.
It can be accessed through the Europa server http://europa.eu

doi:10.2791/6709
ISBN 978-92-79-54183-4
JRC Mission
As the Commission’s
in-house science service,
the Joint Research Centre’s
mission is to provide EU
policies with independent,
evidence-based scientific
and technical support
throughout the whole
policy cycle.
Working in close
cooperation with policy
Directorates-General,
the JRC addresses key
societal challenges while
stimulating innovation
through developing
new methods, tools
and standards, and sharing
its know-how with
the Member States,
the scientific community
and international partners.
Serving society Stimulating innovation Supporting legislation
LF-N
A-2
7651-E
N-N