vegetation indexes and delineation of management zones for ... · vegetation indexes and...
TRANSCRIPT
e-ISSN 1983-4063 - www.agro.ufg.br/pat - Pesq. Agropec. Trop., Goiânia, v. 47, n. 2, p. 168-177, Apr./Jun. 2017
Vegetation indexes and delineation of management zones for soybean1
Amanda Carolina Marx Bacellar Kuiawski2, José Lucas Safanelli3, Eduardo Leonel Bottega4, Antonio Mendes de Oliveira Neto5, Naiara Guerra6
INTRODUCTION
In Brazil, the soybean [Glycine Max (L.) Merr] crop was sown in more than 33 million hectares, in the 2015/2016 harvest, representing 57 % of the total area planted with cereals in the country (Conab 2016). Due to its socioeconomic importance in the primary production sector, soybean cultivation has been the subject of research on different themes.
ABSTRACT RESUMO
The reduction of production costs and the increase in yield, coupled with the use of practices to reduce environmental impacts, are the main challenges for soybean cropping (Cavalett & Ortega 2009). The use of precision agriculture techniques is a promising solution to tackle these challenges.
The delimitation of site-specific management zones is considered an operational and economically feasible approach within precision agriculture
1. Manuscript received in Oct./2016 and accepted for publication in Jun./2017 (http://dx.doi.org/10.1590/1983-40632016v4743904).2. Simbiose Agrotecnologia Biológica, Maracajú, MS, Brazil. E-mail: [email protected].
3. Universidade de São Paulo, Escola Superior de Agricultura Luiz de Queiroz, Departamento de Ciência do Solo, Piracicaba, SP, Brazil. E-mail: [email protected].
4. Universidade Federal de Santa Maria, Cachoeira do Sul, RS, Brazil. E-mail: [email protected]. Instituto Federal de Santa Catarina, Rio do Sul, SC, Brazil. E-mail: [email protected].
6. Universidade Federal de Santa Catarina, Curitibanos, SC, Brazil. E-mail: [email protected].
The delimitation of site-specific management zones may be an operational and economically feasible approach in precision agriculture. This study aimed at investigating the spatial correlations between spectral indexes sampled during different growth stages of soybean and crop yield. Soil attributes stratified in each zone and the influence of altitude were also assessed. The simple ratio index, normalized difference vegetation index and soil-adjusted vegetation index were calculated for soybean at the V6, R5 and R5.5 stages. Spatial dependence analysis via semivariogram was performed for the vegetation indexes, soybean yield and terrain elevation. The crop yield map was taken as a reference to assess the spatial agreement with the different maps generated from the spectral indexes. The average values for chemical and granulometric soil attributes were calculated and analyzed by their means among the zones delineated. The field division into two management zones, due to the combination of altitude, simple ratio index of the V6 stage and soil-adjusted vegetation index of the R5.5 stage, showed the highest agreement with the soybean yield map. Differences between the delineated zones were identified for the phosphorus, clay and silt contents.
KEYWORDS: Glycine Max (L) Merr.; precision agriculture; spectrorradiometry.
Índices de vegetação na delimitação de zonas de manejo para a soja
A delimitação de zonas para fins de manejo específico pode ser uma abordagem operacional e economicamente viável na agricultura de precisão. Objetivou-se investigar a relação entre índices espectrais amostrados durante diferentes estádios fenológicos da cultura da soja e as zonas de produtividade da lavoura. Atributos do solo estratificados em cada zona e a influência da altitude também foram estudados. Foram calculados os índices de razão simples, de vegetação por diferença normalizada e de vegetação ajustado ao solo, durante os estádios V6, R5 e R5.5 da soja. Procedeu-se à análise de dependência espacial via semivariogramas para os índices de vegetação, produtividade da soja e elevação do terreno. O mapa da produtividade foi tomado como referência para avaliar a concordância espacial com os diferentes mapas gerados a partir dos índices espectrais. Os valores médios de atributos químicos e granulométricos do solo foram calculados e analisados por teste de médias entre as zonas delineadas. A divisão do campo em duas zonas de manejo, em função da combinação da altitude, índice de razão simples do estádio V6 e índice de vegetação ajustado ao solo do estádio R5.5, foi a que apresentou maior concordância com o mapa de produtividade da soja. Foram identificadas diferenças nos teores de fósforo, argila e silte, nas zonas de manejo delineadas.
PALAVRAS-CHAVE: Glycine Max (L) Merr.; agricultura de precisão; espectrorradiometria.
169
169
Vegetation indexes and delineation of management zones for soybean
e-ISSN 1983-4063 - www.agro.ufg.br/pat - Pesq. Agropec. Trop., Goiânia, v. 47, n. 2, p. 168-177, Apr./Jun. 2017
(Song et al. 2009), and the identification of these zones within a crop can be made from different techniques and sources of information, such as yield maps (Xiang et al. 2007) and soil sampling grids (Bottega et al. 2014). The use of sensors that measure mechanical, physical and chemical properties has also been highlighted for this purpose, especially when associated with soil attributes (Adamchuk et al. 2004).
Scudiero et al. (2013) successfully delimited site-specific management zones in 21 hectares with corn using a spectral sensor and apparent electrical soil conductivity. The optical and electromagnetic soil properties enable the characterization of the spatial variability of corn yield, which is mainly related to salinity, density, organic carbon and clay content. These variables are considered determinant for crop yield.
Spectral vegetation sensors were used by Abrahão et al. (2009) to discriminate nitrogen rates and identify the indexes that best correlate with chlorophyll and dry mass readings of Tanzania grass (Panicum maximum Jacq.). The indexes that presented the best results were those that used red to near infrared regions of the electromagnetic spectrum.
In soybean crop, studies using proximal spectral sensors, i.e., with the plant canopy measured within a distance of less than 2 m, have been correlated with the plant biochemistry (Singh et al. 2013) and also used for weed discrimination (Koger et al. 2003, Safanelli et al. 2014). Studies on the in situ crop monitoring using proximal sensors within precision agriculture approaches have also been conducted with wheat, barley and forage crops (Abrahão et al. 2009, Mahajan et al. 2014, Xu et al. 2014).
In this context, this study had the following objectives: 1) to study the spatial variability of the canopy spectral response as a function of the development stage of the soybean crop; 2) to evaluate the spatial correlation between vegetation indexes and soybean yield; 3) to delineate management zones capable of stratifying soil attributes from the use of spectral indexes of the soybean canopy and altimetry values.
MATERIAL AND METHODS
The study was carried out in Curitibanos, Santa Catarina state, Brazil, in a 13-ha area with
record of onion and garlic cultivation, and, prior to the experiment, oat cultivation. The area is located at the 22J spindle, with central coordinates for the Universal Transverse de Mercator (UTM) of 6,975,550 m North and 542,250 m East (WGS84 - World Geodetic System 1984). The climate of the region is humid mesotherm with mild summer (Cfb), with average annual temperature of 16 ºC and average precipitation of 1,600 mm (Alvares et al. 2013). The soil is classified as Haplohumox, “Latossolo Bruno” according to the Brazilian Soil Classification System (Santos et al. 2013), with a very clayey texture.
The soybean [Glycine max (L) Merr.] crop was directly sown under oat straw on November 29, 2013, with spacing of 0.5 m between rows and density of 16 seeds m-1. A mixed mineral fertilizer, in the formulation 2-24-13 (NPK), with 11 % of Ca, 4.3 % of S, 0.03 % of B and 0.1 % of Zn, was used at a dose of 350 kg ha-1, applied to the sowing line. The Brasmax® Potência RR cultivar was used.
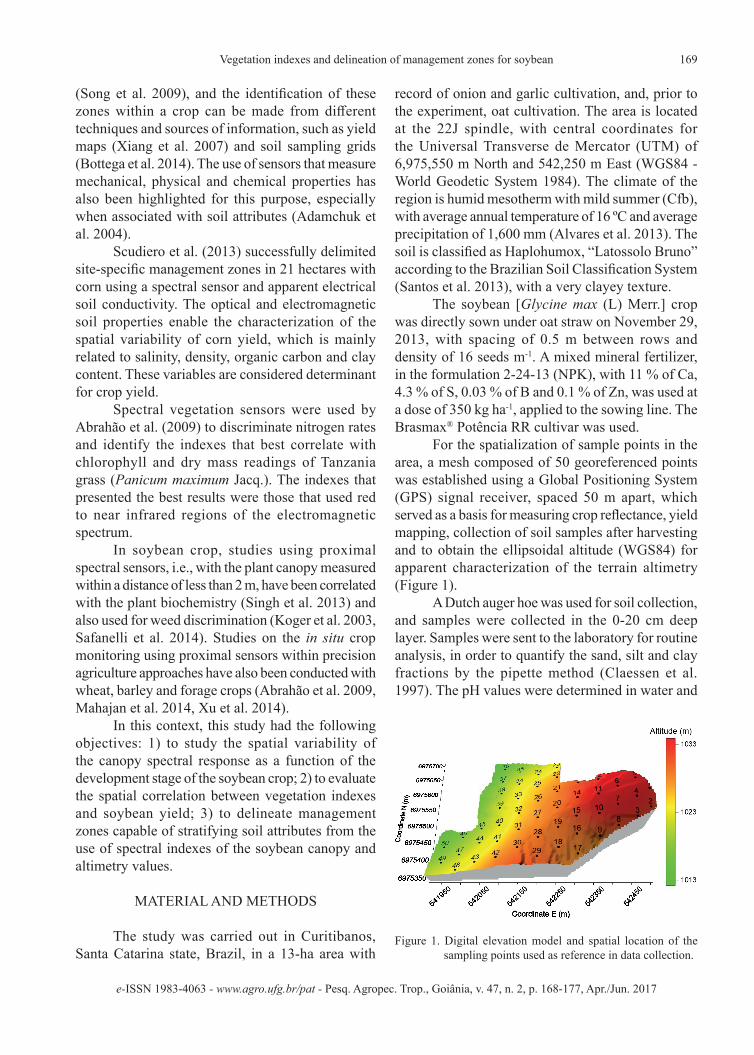
For the spatialization of sample points in the area, a mesh composed of 50 georeferenced points was established using a Global Positioning System (GPS) signal receiver, spaced 50 m apart, which served as a basis for measuring crop reflectance, yield mapping, collection of soil samples after harvesting and to obtain the ellipsoidal altitude (WGS84) for apparent characterization of the terrain altimetry (Figure 1).
A Dutch auger hoe was used for soil collection, and samples were collected in the 0-20 cm deep layer. Samples were sent to the laboratory for routine analysis, in order to quantify the sand, silt and clay fractions by the pipette method (Claessen et al. 1997). The pH values were determined in water and
Figure 1. Digital elevation model and spatial location of the sampling points used as reference in data collection.
170 A. C. M. B. Kuiawski et al. (2017)
e-ISSN 1983-4063 - www.agro.ufg.br/pat - Pesq. Agropec. Trop., Goiânia, v. 47, n. 2, p. 168-177, Apr./Jun. 2017
the exchangeable calcium and magnesium contents were determined by atomic absorption spectroscopy, after extraction with 1.0 mol L KCl (Claessen et al. 1997). The phosphorus and potassium contents were determined from the Melich-1 extractor (Tedesco et al. 1995). The soil organic matter was estimated by determining the total organic carbon, using the Mébius method in digestion block (Nelson & Sommers 1996), multiplying the result by the conversion factor 1.72. Base saturation was estimated as described by Claessen et al. (1997)
At each sampling point, the crop reflectance was measured at three different phenological stages: sixth node with open trifoliate leaves (V6 - 49 days after planting), when most plant pods were at 2-4 cm in length (R5 - 98 days after planting) and when most pods had formed grains and initiated physiological maturation (R5.5 - 119 days after planting). Spectral readings were performed between 11:00 am and 01:00 pm, in order to minimize the effects of the sunlight geometry. The FieldSpec® HandHeld 2TM ASD Inc. spectroradiometer model, which operates in the wavelength range of 325-1,075 nm, with accuracy of 1 nm and spectral resolution of < 3 nm, at 700 nm, was used. However, only the spectral range of 445-900 nm was used in the study, due to the presence of noises at the beginning and end of the original spectral measurement range of the apparatus.
The apparatus was vertically positioned at 1.20 m above the canopy of plants at each sampling point, with field of view generated by a 10 º lens facing nadir (field of view reading diameter ~ 21 cm). Each spectral reading was systematically collected after the average of 50 repetitions, calculated by the apparatus in 34 ms. Calibrations were performed using a Spectralon® plate, before each spectral reading and at each geospatial point. Four replicates were performed for later calculation of the mean bidirectional reflectance factor. Calibration aimed at reducing the reading error due to possible variations of the radiant energy affected by the atmosphere.
The following vegetation indexes were calculated: simple ratio index (SRI), normalized difference vegetation index (NDVI) and soil-adjusted vegetation index (SAVI). These vegetation indexes were considered suitable for structural analysis of the vegetation, when using hyperspectral data in precision agriculture, by Whiting et al. (2008). The authors also emphasized that the use of indexes provides a better comparison of samples, reducing
not only regions of no interest, but also minimizing the sources of variations, due to lighting and canopy geometries. In order to calculate the three indexes, the following equations (Whiting et al. 2008) were used:
SRI = R NIR
NDVI = (NIR - R) (NIR + R)
SAVI = NIR - R (1 + L) NIR + R + L
The parameters R, NIR and L represent the red band, near infrared band and weighting coefficient (value used = 0.25), respectively. The R and NIR bands were also delineated as those of the study conducted by Abrahão et al. (2009), with R being the mean bidirectional reflectance factor within the range of 620-670 nm and NIR the mean bidirectional reflectance factor of the range 840-880 nm.
Soybean yield mapping was performed by manual harvest at each sampling point on April 25, 2014 (147 days after planting). Three lines of 1 m, equivalent to 1.35 m2, were collected. Samples were threshed and weighed and the moisture content of grains was measured by the capacitance method. The water weight was discounted from the soybean weight, and 13 % of moisture was considered as the default value. Corrected grain weight values were expressed in kg ha-1.
The analysis of the spatial variability of soil attributes, yield, generation of management areas and calculation of the Kappa coefficient were performed using the KrigMe software (Valente 2010). The descriptive statistics of the variables, Pearson correlation of the sampled points and Student’s t-test to compare the management zones were performed using the Assistat statistical software (Silva & Azevedo 2002).
Spatial dependence analysis was performed to evaluate the variability of vegetation indexes, soybean yield and soil elevation. The adjustment of variograms was performed by the following equation, assuming the stationarity of the intrinsic hypothesis:
N(h)ŷ(h) = 1 ∑ [Z(xi) - Z(xi + h)]2
2N(h) i = 1
where, ŷ(h) is the semivariance, as a function of the separation distance (h) between pairs of points; h the
171
171
Vegetation indexes and delineation of management zones for soybean
e-ISSN 1983-4063 - www.agro.ufg.br/pat - Pesq. Agropec. Trop., Goiânia, v. 47, n. 2, p. 168-177, Apr./Jun. 2017
separation distance between pairs of points; and N(h) the number of experimental pairs of observations Z(xi) and Z(xi + h), separated by a distance h.
The following theoretical models of semivariance were tested: linear with plateau, Gaussian, spherical and exponential, and the best model was selected based on the smallest sum of squares of the residue and higher determination coefficient (R2). The selected models were submitted to cross validation analysis.
Management zone maps were generated only for variables that presented spatial dependence. To delineate the management zones, these variables were worked in isolation and combined (management zones delineated using more than one variable). The management zone map generated from soybean yield was used as a reference map for comparison with other management zone maps. The number of management zones was determined based on the fuzziness performance index, which estimates the degree of separation of members in different classes, and the modified partition entropy, which estimates the degree of disorganization created by the number of zones. These indexes show values between 0 and 1, and the optimal number of management zones is obtained when both indexes are minimized (Song et al. 2009). The similarity measure used was the Euclidean distance.
Only those management zone maps with Kappa coefficient value equal to or greater than 0.55 (with the yield map and calculated by the same sampling points), which is an intermediate threshold in relation to the maximum value of 1, were adopted as a selection criterion. The Kappa coefficient value is an indicative of how similar are maps generated with the reference map. Kappa coefficient values equal to zero indicate that the maps are totally different, and the similarity between maps tends to increase as the Kappa coefficient tends to 1. The Kappa coefficient value was calculated using the method proposed by Hudson & Ramm (1987). The highest Kappa coefficient between two classifications occurs when the agreement is maximized, with the Kappa coefficient closest to 1 (Kitchen et al. 2005).
After a selection of highly representative maps, the average value of each soil attribute was calculated in management areas (clay, silt, sand, pH, calcium, magnesium, potassium, phosphorus, organic matter and base saturation). The Student’s t-test (p < 0.05) was used to verify the existence of
a significant difference between the average values of soil attributes for each zone. Thus, it was possible to determine which management zone map could differentiate the greatest number of soil attributes.
RESULTS AND DISCUSSION
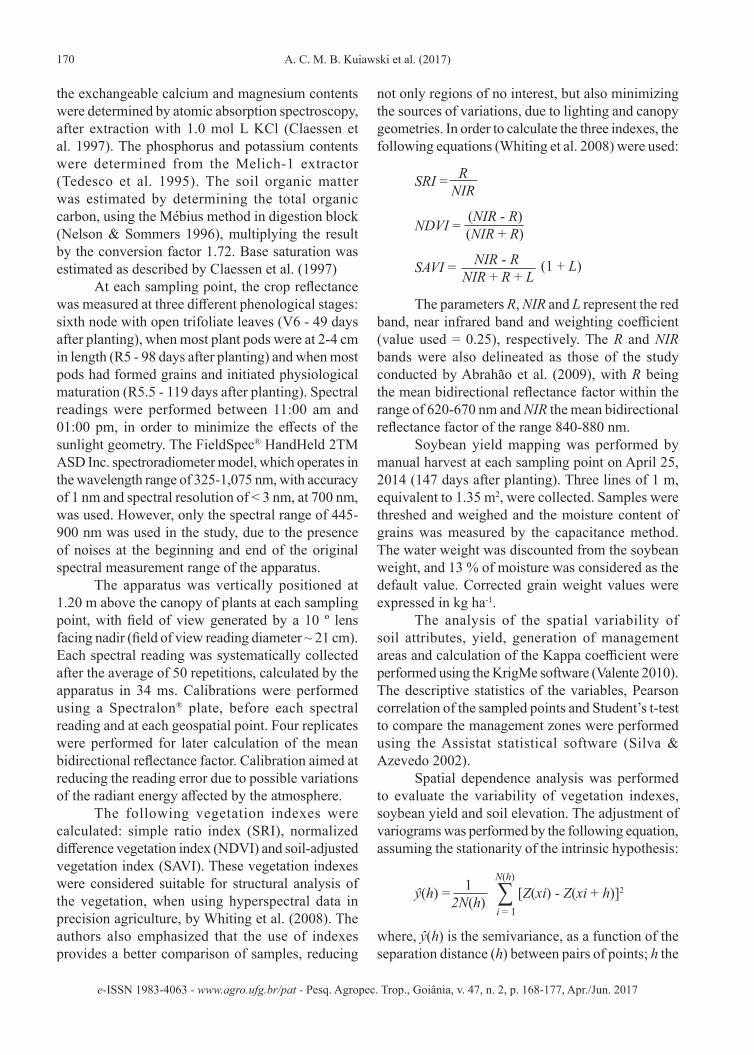
The three crop growth stages presented similar behavior, but with different reflectance peaks, especially at the wavelengths 550 nm (green) and 750 nm (near infrared), particularly the latter (Figure 2). This result was already expected, since reflectance in the green band is influenced by the chlorophyll content in the plant, which strongly absorbs radiation in the blue and red region for photosynthesis, reflecting and transmitting the remaining green light. The near infrared band, in turn, is influenced by the electromagnetic radiation of the cell structure of mesophyll and canopy. The differences in reflectance are associated with growth and development characteristics of the plant (Ponzoni et al. 2012).
In the visible region (400-700 nm), most of the radiation on the vegetative canopy is absorbed by the photosynthetic pigments of leaves. The pigments that most influence reflectance are chlorophylls a and b, with the highest absorption peaks at wavelengths of 680 nm and 480 nm (Moreira 2012). As the crop progresses in its growth cycle, the amount of chlorophyll tends to decrease, with the highest values being observed for the vegetative stage and the lowest ones for the reproductive stage.
The reflectance values were used to calculate the vegetation indexes, which simplify the variations
Figure 2. Spectral response of the soybean crop to the three different crop growth stages studied.
172 A. C. M. B. Kuiawski et al. (2017)
e-ISSN 1983-4063 - www.agro.ufg.br/pat - Pesq. Agropec. Trop., Goiânia, v. 47, n. 2, p. 168-177, Apr./Jun. 2017
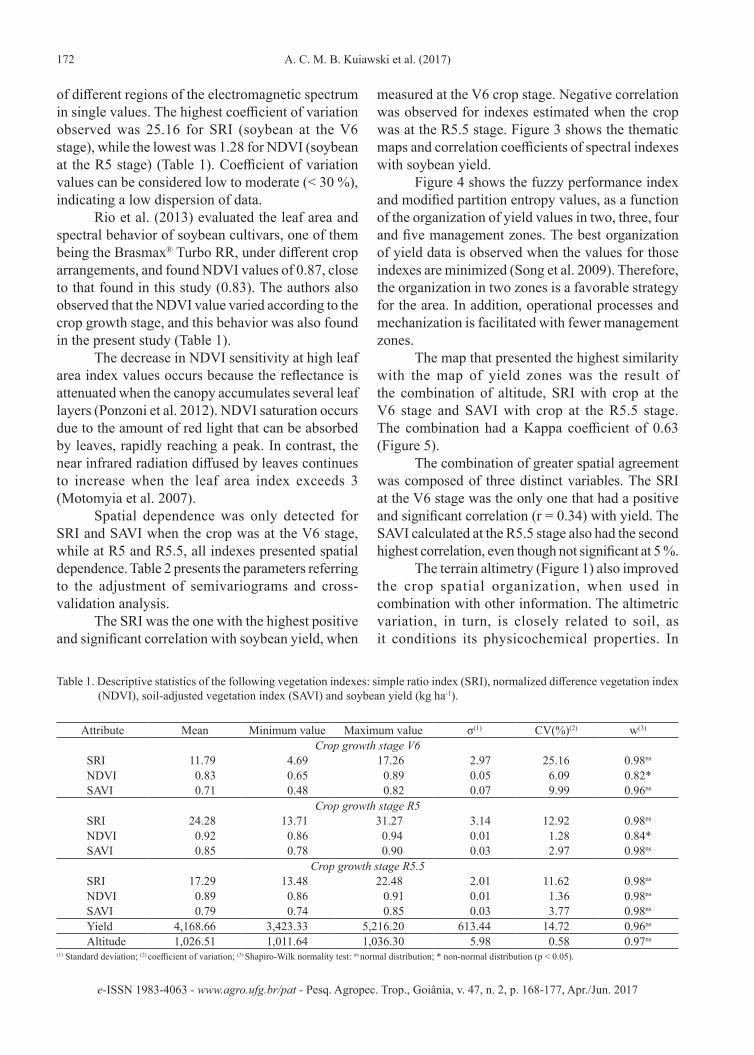
of different regions of the electromagnetic spectrum in single values. The highest coefficient of variation observed was 25.16 for SRI (soybean at the V6 stage), while the lowest was 1.28 for NDVI (soybean at the R5 stage) (Table 1). Coefficient of variation values can be considered low to moderate (< 30 %), indicating a low dispersion of data.
Rio et al. (2013) evaluated the leaf area and spectral behavior of soybean cultivars, one of them being the Brasmax® Turbo RR, under different crop arrangements, and found NDVI values of 0.87, close to that found in this study (0.83). The authors also observed that the NDVI value varied according to the crop growth stage, and this behavior was also found in the present study (Table 1).
The decrease in NDVI sensitivity at high leaf area index values occurs because the reflectance is attenuated when the canopy accumulates several leaf layers (Ponzoni et al. 2012). NDVI saturation occurs due to the amount of red light that can be absorbed by leaves, rapidly reaching a peak. In contrast, the near infrared radiation diffused by leaves continues to increase when the leaf area index exceeds 3 (Motomyia et al. 2007).
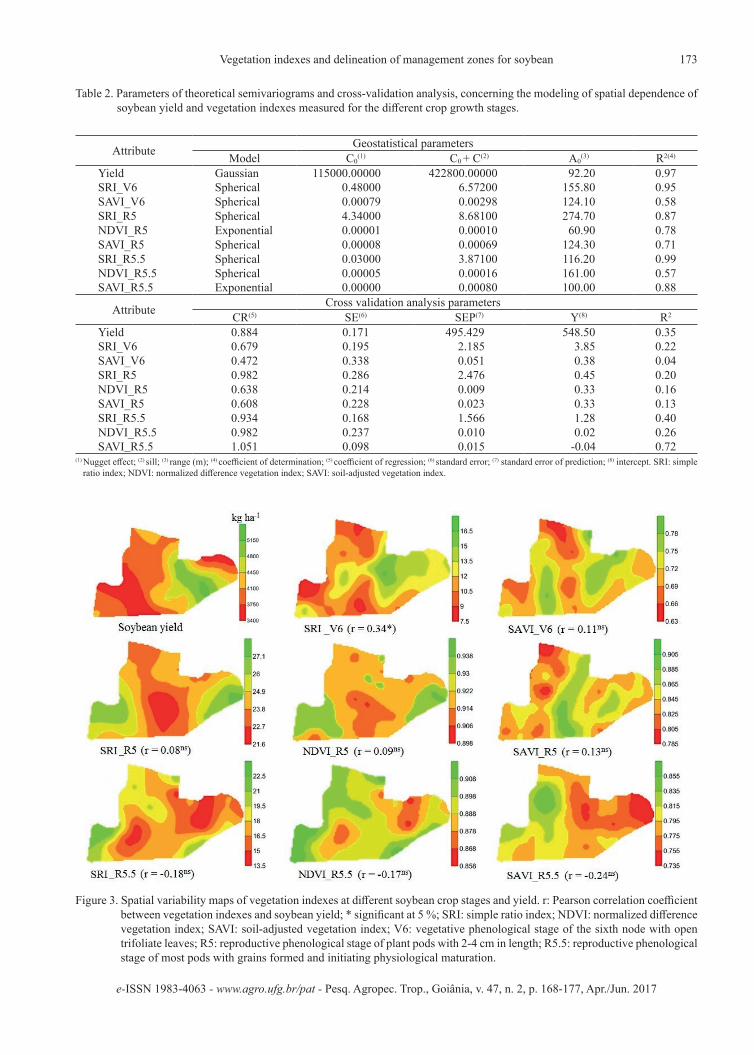
Spatial dependence was only detected for SRI and SAVI when the crop was at the V6 stage, while at R5 and R5.5, all indexes presented spatial dependence. Table 2 presents the parameters referring to the adjustment of semivariograms and cross-validation analysis.
The SRI was the one with the highest positive and significant correlation with soybean yield, when
measured at the V6 crop stage. Negative correlation was observed for indexes estimated when the crop was at the R5.5 stage. Figure 3 shows the thematic maps and correlation coefficients of spectral indexes with soybean yield.
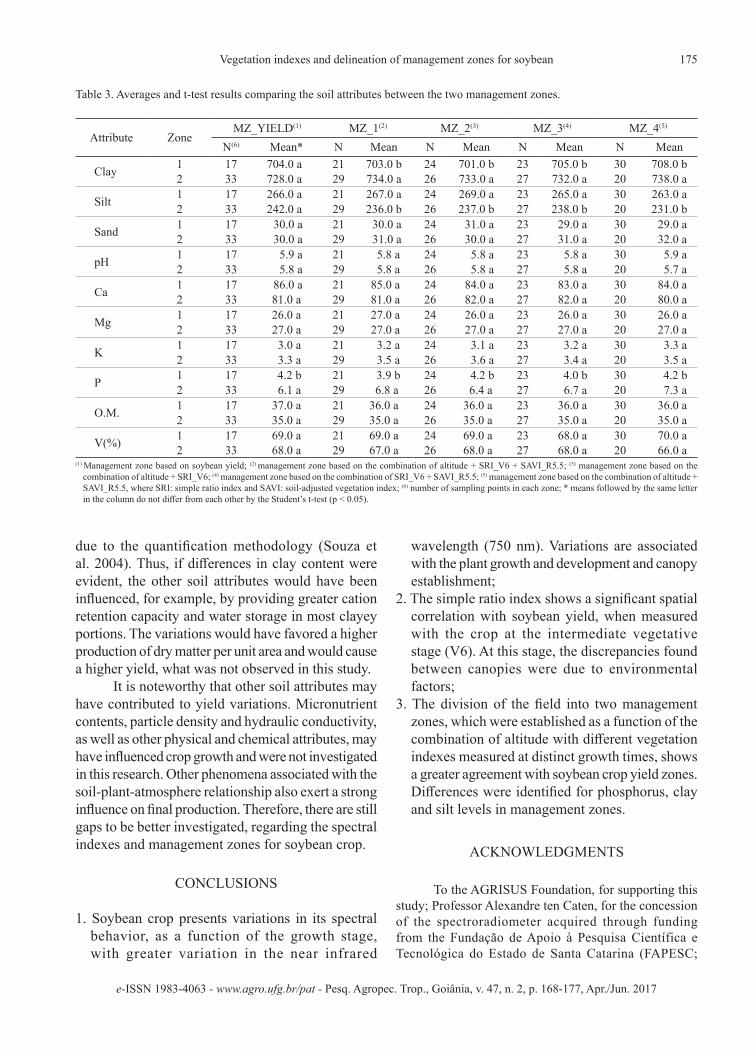
Figure 4 shows the fuzzy performance index and modified partition entropy values, as a function of the organization of yield values in two, three, four and five management zones. The best organization of yield data is observed when the values for those indexes are minimized (Song et al. 2009). Therefore, the organization in two zones is a favorable strategy for the area. In addition, operational processes and mechanization is facilitated with fewer management zones.
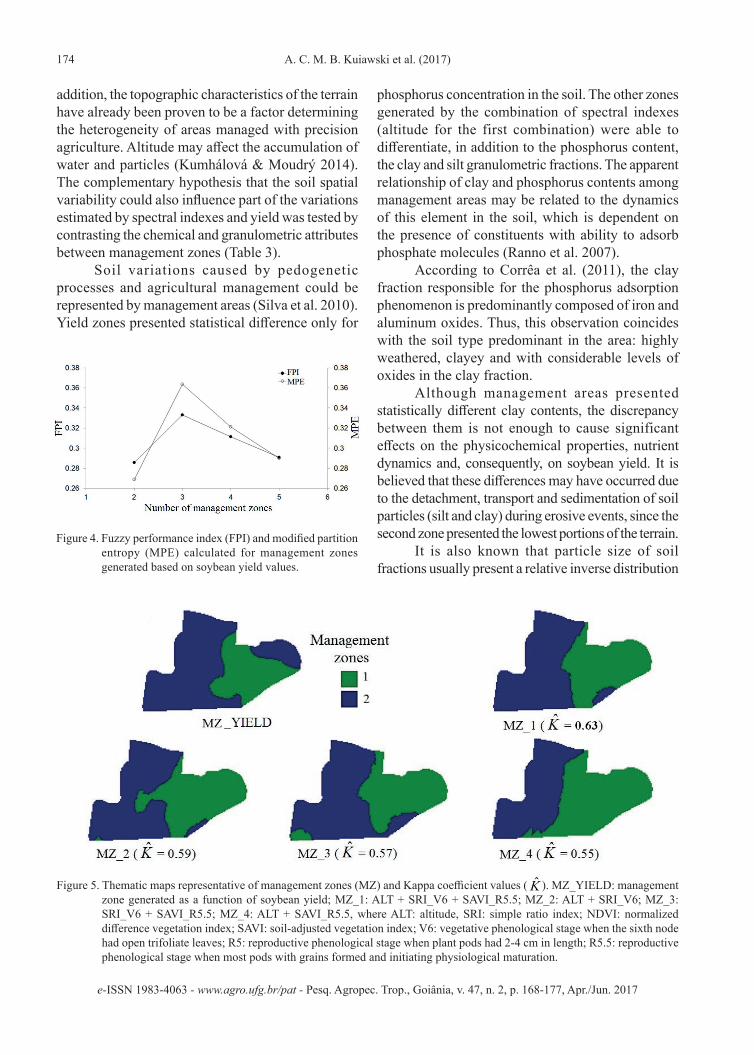
The map that presented the highest similarity with the map of yield zones was the result of the combination of altitude, SRI with crop at the V6 stage and SAVI with crop at the R5.5 stage. The combination had a Kappa coefficient of 0.63 (Figure 5).
The combination of greater spatial agreement was composed of three distinct variables. The SRI at the V6 stage was the only one that had a positive and significant correlation (r = 0.34) with yield. The SAVI calculated at the R5.5 stage also had the second highest correlation, even though not significant at 5 %.
The terrain altimetry (Figure 1) also improved the crop spatial organization, when used in combination with other information. The altimetric variation, in turn, is closely related to soil, as it conditions its physicochemical properties. In
(1) Standard deviation; (2) coefficient of variation; (3) Shapiro-Wilk normality test: ns normal distribution; * non-normal distribution (p < 0.05).
Attribute Mean Minimum value Maximum value σ(1) CV(%)(2) w(3)
Crop growth stage V6SRI 11.79 4.69 17.26 2.97 25.16 0.98ns
NDVI 0.83 0.65 0.89 0.05 6.09 0.82*SAVI 0.71 0.48 0.82 0.07 9.99 0.96ns
Crop growth stage R5SRI 24.28 13.71 31.27 3.14 12.92 0.98ns
NDVI 0.92 0.86 0.94 0.01 1.28 0.84*SAVI 0.85 0.78 0.90 0.03 2.97 0.98ns
Crop growth stage R5.5SRI 17.29 13.48 22.48 2.01 11.62 0.98ns
NDVI 0.89 0.86 0.91 0.01 1.36 0.98ns
SAVI 0.79 0.74 0.85 0.03 3.77 0.98ns
Yield 4,168.66 3,423.33 5,216.20 613.44 14.72 0.96ns
Altitude 1,026.51 1,011.64 1,036.30 5.98 0.58 0.97ns
Table 1. Descriptive statistics of the following vegetation indexes: simple ratio index (SRI), normalized difference vegetation index (NDVI), soil-adjusted vegetation index (SAVI) and soybean yield (kg ha-1).
173
173
Vegetation indexes and delineation of management zones for soybean
e-ISSN 1983-4063 - www.agro.ufg.br/pat - Pesq. Agropec. Trop., Goiânia, v. 47, n. 2, p. 168-177, Apr./Jun. 2017
Figure 3. Spatial variability maps of vegetation indexes at different soybean crop stages and yield. r: Pearson correlation coefficient between vegetation indexes and soybean yield; * significant at 5 %; SRI: simple ratio index; NDVI: normalized difference vegetation index; SAVI: soil-adjusted vegetation index; V6: vegetative phenological stage of the sixth node with open trifoliate leaves; R5: reproductive phenological stage of plant pods with 2-4 cm in length; R5.5: reproductive phenological stage of most pods with grains formed and initiating physiological maturation.
(1) Nugget effect; (2) sill; (3) range (m); (4) coefficient of determination; (5) coefficient of regression; (6) standard error; (7) standard error of prediction; (8) intercept. SRI: simple ratio index; NDVI: normalized difference vegetation index; SAVI: soil-adjusted vegetation index.
Table 2. Parameters of theoretical semivariograms and cross-validation analysis, concerning the modeling of spatial dependence of soybean yield and vegetation indexes measured for the different crop growth stages.
Attribute Geostatistical parametersModel C0
(1) C0 + C(2) A0(3) R2(4)
Yield Gaussian 115000.00000 422800.00000 92.20 0.97SRI_V6 Spherical 0.48000 6.57200 155.80 0.95SAVI_V6 Spherical 0.00079 0.00298 124.10 0.58SRI_R5 Spherical 4.34000 8.68100 274.70 0.87NDVI_R5 Exponential 0.00001 0.00010 60.90 0.78SAVI_R5 Spherical 0.00008 0.00069 124.30 0.71SRI_R5.5 Spherical 0.03000 3.87100 116.20 0.99NDVI_R5.5 Spherical 0.00005 0.00016 161.00 0.57SAVI_R5.5 Exponential 0.00000 0.00080 100.00 0.88
Attribute Cross validation analysis parametersCR(5) SE(6) SEP(7) Y(8) R2
Yield 0.884 0.171 495.429 548.50 0.35SRI_V6 0.679 0.195 2.185 3.85 0.22SAVI_V6 0.472 0.338 0.051 0.38 0.04SRI_R5 0.982 0.286 2.476 0.45 0.20NDVI_R5 0.638 0.214 0.009 0.33 0.16SAVI_R5 0.608 0.228 0.023 0.33 0.13SRI_R5.5 0.934 0.168 1.566 1.28 0.40NDVI_R5.5 0.982 0.237 0.010 0.02 0.26SAVI_R5.5 1.051 0.098 0.015 -0.04 0.72
174 A. C. M. B. Kuiawski et al. (2017)
e-ISSN 1983-4063 - www.agro.ufg.br/pat - Pesq. Agropec. Trop., Goiânia, v. 47, n. 2, p. 168-177, Apr./Jun. 2017
addition, the topographic characteristics of the terrain have already been proven to be a factor determining the heterogeneity of areas managed with precision agriculture. Altitude may affect the accumulation of water and particles (Kumhálová & Moudrý 2014). The complementary hypothesis that the soil spatial variability could also influence part of the variations estimated by spectral indexes and yield was tested by contrasting the chemical and granulometric attributes between management zones (Table 3).
Soil variations caused by pedogenetic processes and agricultural management could be represented by management areas (Silva et al. 2010). Yield zones presented statistical difference only for
phosphorus concentration in the soil. The other zones generated by the combination of spectral indexes (altitude for the first combination) were able to differentiate, in addition to the phosphorus content, the clay and silt granulometric fractions. The apparent relationship of clay and phosphorus contents among management areas may be related to the dynamics of this element in the soil, which is dependent on the presence of constituents with ability to adsorb phosphate molecules (Ranno et al. 2007).
According to Corrêa et al. (2011), the clay fraction responsible for the phosphorus adsorption phenomenon is predominantly composed of iron and aluminum oxides. Thus, this observation coincides with the soil type predominant in the area: highly weathered, clayey and with considerable levels of oxides in the clay fraction.
Although management areas presented statistically different clay contents, the discrepancy between them is not enough to cause significant effects on the physicochemical properties, nutrient dynamics and, consequently, on soybean yield. It is believed that these differences may have occurred due to the detachment, transport and sedimentation of soil particles (silt and clay) during erosive events, since the second zone presented the lowest portions of the terrain.
It is also known that particle size of soil fractions usually present a relative inverse distribution
Figure 5. Thematic maps representative of management zones (MZ) and Kappa coefficient values ( K̂ ). MZ_YIELD: management zone generated as a function of soybean yield; MZ_1: ALT + SRI_V6 + SAVI_R5.5; MZ_2: ALT + SRI_V6; MZ_3: SRI_V6 + SAVI_R5.5; MZ_4: ALT + SAVI_R5.5, where ALT: altitude, SRI: simple ratio index; NDVI: normalized difference vegetation index; SAVI: soil-adjusted vegetation index; V6: vegetative phenological stage when the sixth node had open trifoliate leaves; R5: reproductive phenological stage when plant pods had 2-4 cm in length; R5.5: reproductive phenological stage when most pods with grains formed and initiating physiological maturation.
Figure 4. Fuzzy performance index (FPI) and modified partition entropy (MPE) calculated for management zones generated based on soybean yield values.
175
175
Vegetation indexes and delineation of management zones for soybean
e-ISSN 1983-4063 - www.agro.ufg.br/pat - Pesq. Agropec. Trop., Goiânia, v. 47, n. 2, p. 168-177, Apr./Jun. 2017
due to the quantification methodology (Souza et al. 2004). Thus, if differences in clay content were evident, the other soil attributes would have been influenced, for example, by providing greater cation retention capacity and water storage in most clayey portions. The variations would have favored a higher production of dry matter per unit area and would cause a higher yield, what was not observed in this study.
It is noteworthy that other soil attributes may have contributed to yield variations. Micronutrient contents, particle density and hydraulic conductivity, as well as other physical and chemical attributes, may have influenced crop growth and were not investigated in this research. Other phenomena associated with the soil-plant-atmosphere relationship also exert a strong influence on final production. Therefore, there are still gaps to be better investigated, regarding the spectral indexes and management zones for soybean crop.
CONCLUSIONS
1. Soybean crop presents variations in its spectral behavior, as a function of the growth stage, with greater variation in the near infrared
wavelength (750 nm). Variations are associated with the plant growth and development and canopy establishment;
2. The simple ratio index shows a significant spatial correlation with soybean yield, when measured with the crop at the intermediate vegetative stage (V6). At this stage, the discrepancies found between canopies were due to environmental factors;
3. The division of the field into two management zones, which were established as a function of the combination of altitude with different vegetation indexes measured at distinct growth times, shows a greater agreement with soybean crop yield zones. Differences were identified for phosphorus, clay and silt levels in management zones.
ACKNOWLEDGMENTS
To the AGRISUS Foundation, for supporting this study; Professor Alexandre ten Caten, for the concession of the spectroradiometer acquired through funding from the Fundação de Apoio à Pesquisa Científica e Tecnológica do Estado de Santa Catarina (FAPESC;
Table 3. Averages and t-test results comparing the soil attributes between the two management zones.
Attribute ZoneMZ_YIELD(1) MZ_1(2) MZ_2(3) MZ_3(4) MZ_4(5)
N(6) Mean* N Mean N Mean N Mean N Mean
Clay 1 17 704.0 a 21 703.0 b 24 701.0 b 23 705.0 b 30 708.0 b2 33 728.0 a 29 734.0 a 26 733.0 a 27 732.0 a 20 738.0 a
Silt 1 17 266.0 a 21 267.0 a 24 269.0 a 23 265.0 a 30 263.0 a2 33 242.0 a 29 236.0 b 26 237.0 b 27 238.0 b 20 231.0 b
Sand 1 17 30.0 a 21 30.0 a 24 31.0 a 23 29.0 a 30 29.0 a2 33 30.0 a 29 31.0 a 26 30.0 a 27 31.0 a 20 32.0 a
pH 1 17 5.9 a 21 5.8 a 24 5.8 a 23 5.8 a 30 5.9 a2 33 5.8 a 29 5.8 a 26 5.8 a 27 5.8 a 20 5.7 a
Ca 1 17 86.0 a 21 85.0 a 24 84.0 a 23 83.0 a 30 84.0 a2 33 81.0 a 29 81.0 a 26 82.0 a 27 82.0 a 20 80.0 a
Mg 1 17 26.0 a 21 27.0 a 24 26.0 a 23 26.0 a 30 26.0 a2 33 27.0 a 29 27.0 a 26 27.0 a 27 27.0 a 20 27.0 a
K 1 17 3.0 a 21 3.2 a 24 3.1 a 23 3.2 a 30 3.3 a2 33 3.3 a 29 3.5 a 26 3.6 a 27 3.4 a 20 3.5 a
P 1 17 4.2 b 21 3.9 b 24 4.2 b 23 4.0 b 30 4.2 b2 33 6.1 a 29 6.8 a 26 6.4 a 27 6.7 a 20 7.3 a
O.M. 1 17 37.0 a 21 36.0 a 24 36.0 a 23 36.0 a 30 36.0 a2 33 35.0 a 29 35.0 a 26 35.0 a 27 35.0 a 20 35.0 a
V(%) 1 17 69.0 a 21 69.0 a 24 69.0 a 23 68.0 a 30 70.0 a2 33 68.0 a 29 67.0 a 26 68.0 a 27 68.0 a 20 66.0 a
(1) Management zone based on soybean yield; (2) management zone based on the combination of altitude + SRI_V6 + SAVI_R5.5; (3) management zone based on the combination of altitude + SRI_V6; (4) management zone based on the combination of SRI_V6 + SAVI_R5.5; (5) management zone based on the combination of altitude + SAVI_R5.5, where SRI: simple ratio index and SAVI: soil-adjusted vegetation index; (6) number of sampling points in each zone; * means followed by the same letter in the column do not differ from each other by the Student’s t-test (p < 0.05).
176 A. C. M. B. Kuiawski et al. (2017)
e-ISSN 1983-4063 - www.agro.ufg.br/pat - Pesq. Agropec. Trop., Goiânia, v. 47, n. 2, p. 168-177, Apr./Jun. 2017
Process Nº. 2012000094); and the farmer Mr. Kaoru Antonio Haramoto, for the availability of the area and all the logistics used in the performance of this study.
REFERENCES
ABRAHÃO, S. A. et al. Índices de vegetação de base espectral para discriminar doses de nitrogênio em capim-tanzânia. Revista Brasileira de Zootecnia, v. 38, n. 9, p. 1637-1644, 2009.
ADAMCHUK, V. I. et al. On-the-go soil sensors for precision agriculture. Computers and Electronics in Agriculture, v. 44, n. 1, p. 71-91, 2004.
ALVARES, C. A. et al. Köppen’s climate classification map for Brazil. Meteorologische Zeitschrift, v. 22, n. 6, p. 711-728, 2013.
BOTTEGA, E. L. et al. Sampling grid density and lime recommendation in an Oxisol. Revista Brasileira de Engenharia Agrícola e Ambiental, v. 18, n. 11, p. 1142-1148, 2014.
CAVALETT, O.; ORTEGA, E. Energy, nutrients balance, and economic assessment of soybean production and industrialization in Brazil. Journal of Cleaner Production, v. 17, n. 8, p. 762-771, 2009.
CLAESSEN, M. E. C. et al. Manual de métodos de análise de solo. 2. ed. Rio de Janeiro: Embrapa-CNPS, 1997.
COMPANHIA NACIONAL DE ABASTECIMENTO (Conab). Acompanhamento da safra brasileira de grãos 2015/2016: 9º levantamento. Brasília, DF: Conab, 2016.
CORRÊA, R. M.; NASCIMENTO, C. W. A.; ROCHA, A. T. Adsorção de fósforo em dez solos do Estado de Pernambuco e suas relações com parâmetros físicos e químicos. Acta Scientiarum Agronomy, v. 33, n. 1, p. 153-159, 2011.
HUDSON, W. D.; RAMM, C. W. Correct formulation of the kappa coefficient of agreement. Photogrammetric Engineering & Remote Sensing, v. 53, n. 4, p. 421-422, 1987.
KITCHEN, N. R. et al. Delineating productivity zones on claypan soil fields using apparent soil electrical conductivity. Computer and Electronics in Agriculture, v. 46, n. 1-3, p. 285-308, 2005.
KOGER, C. H. et al. Wavelet analysis of hyperspectral reflectance data for detecting pitted morning glory (Ipomoea lacunosa) in soybean (Glycine max). Remote Sensing of Environment, v. 86, n. 1, p. 108-119, 2003.
KUMHÁLOVÁ, J.; MOUDRÝ, V. Topographical characteristics for precision agriculture in conditions of the Czech Republic. Applied Geography, v. 50, n. 1, p. 90-98, 2014.
MAHAJAN, G. R. et al. Using hyperspectral remote sensing techniques to monitor nitrogen, phosphorus, sulphur and potassium in wheat (Triticum aestivum L.). Precision Agriculture, v. 15, n. 5, p. 499-522, 2014.
MOREIRA, M. A. Fundamentos do sensoriamento remoto e metodologias de aplicação. 4. ed. Viçosa: UFV, 2012.
MOTOMIYA, A. V. A. et al. Determinação da intensidade de infestação de nematoide em algodoeiro sob diferentes doses de nitrogênio por meio de um sensor óptico ativo. In: CONGRESSO BRASILEIRO DE ALGODÃO, 6., 2007, Uberlândia. Anais... Available at: <http://www.cnpa.embrapa.br/produtos/algodao/publicacoes/cba6/trabalhos/ Nematologia/Trabalho%20N01.pdf>. Access on: May 27, 2016.
NELSON, D. W.; SOMMERS, L. E. Total carbon, organic carbon and organic matter. In: SPARKS, D. L. et al. (Eds.). Methods of soil analysis: chemical methods. Madison: Soil Science Society of America, 1996. p. 961-1010.
PONZONI, F. J. et al. Sensoriamento remoto da vegetação. 2. ed. São Paulo: Oficina de Textos, 2012.
RANNO, S. K. et al. Capacidade de adsorção de fósforo em solos de várzea do Estado do Rio Grande do Sul. Revista Brasileira de Ciência do Solo, v. 31, n. 1, p. 21-28, 2007.
RIO, A. et al. Área foliar e comportamento espectral de cultivares de soja sob distintos arranjos de plantas. In: JORNADA ACADÊMICA DA EMBRAPA SOJA, 8., 2013, Londrina. Anais... Available at: <https://www.alice.cnptia.embrapa.br/alice/bitstream/doc/964033/1/ espectraldecultivaresdesojasobdistintosarranjosdeplantas.pdf>. Access on: May 31, 2016.
SAFANELLI, J. L. et al. Diferenciação de Euphorbia Heterophylla L. em lavoura de soja utilizando espectrorradiometria. In: CONGRESSO BRASILEIRO DE GEOPROCESSAMENTO, 5., 2014, Gramado. Anais... Available at: <http://www.cartografia.org.br/cbc/trabalhos/4/200/CT04-33_1402927461.pdf >. Access on: May 27, 2016.
SANTOS, H. G. et al. Sistema brasileiro de classificação de solos. Rio de Janeiro: Embrapa Solos, 2013.
SCUDIERO, E. et al. Delineation of site-specific management units in a saline region at the Venice Lagoon margin, Italy, using soil reflectance and apparent electrical conductivity. Computers and Electronics in Agriculture, v. 99, n. 1, p. 54-64, 2013.
SILVA, F. A. S. E.; AZEVEDO, C. A. V. Versão do programa computacional Assistat para o sistema operacional Windows. Revista Brasileira de Produtos Agroindustriais, v. 4, n. 1, p. 71-78, 2002.
177
177
Vegetation indexes and delineation of management zones for soybean
e-ISSN 1983-4063 - www.agro.ufg.br/pat - Pesq. Agropec. Trop., Goiânia, v. 47, n. 2, p. 168-177, Apr./Jun. 2017
SILVA, S. A. et al. Variabilidade espacial do fósforo e das frações granulométricas de um Latossolo Vermelho Amarelo. Revista Ciência Agronômica, v. 41, n. 1, p. 1-8, 2010.
SINGH, S. K. et al. Quantification of leaf pigments in soybean (Glycine max (L.) Merr.) based on wavelet decomposition of hyperspectral features. Field Crops Research, v. 149, n. 1, p. 20-32, 2013.
SONG, X. et al. The delineation of agricultural management zones with high resolution remotely sensed data. Precision Agriculture, v. 10, n. 6, p. 471-487, 2009.
SOUZA, Z. M. et al. Variabilidade espacial da textura de um Latossolo Vermelho Amarelo Eutroférrico sob cultivo de cana-de-açúcar. Engenharia Agrícola, v. 24, n. 2, p. 309-319, 2004.
TEDESCO, M. J. et al. Análise de solo, plantas e outros materiais. 2. ed. Porto Alegre: Universidade Federal do Rio Grande do Sul, 1995.
VALENTE, D. S. M. Desenvolvimento de um sistema de apoio à decisão para definir zonas de manejo em cafeicultura de precisão. 122 f. 2010. Tese (Doutorado em Engenharia Agrícola) - Universidade Federal de Viçosa, Viçosa, 2010.
WHITING, M. L. et al. Hyperspectral mapping of crop and soils for precision agriculture. In: REMOTE SENSING AND MODELING OF ECOSYSTEMS FOR SUSTAINABILITY, 3., 2008, San Diego. Proceedings… San Diego: Wei Gao and Susan L. Ustin, 2008. p. 1-15.
XIANG, L. et al. Delineation and scale effect of precision agriculture management zones using yield monitor data over four years. Agriculture Sciences in China, v. 6, n. 2, p. 180-188, 2007.
XU, X. et al. Using optimal combination method and in situ hyperspectral measurements to estimate leaf nitrogen concentration in barley. Precision Agriculture, v. 15, n. 2, p. 227-240, 2014.