variation in soil properties caused by irrigation and cultivation in the central gezira of sudan
TRANSCRIPT

Soil & Tillage Research, 13 (1989) 57-74 57 Elsevier Science Publishers B.V., Amsterdam - - Printed in The Netherlands
Variation in Soil Propert ies Caused by Irrigation and Cult ivation in the Central Gezira of Sudan
I.M. BURAYMAH 1 and R. WEBSTER 2
1Soil Survey Administration, Wad Medani (Sudan) ~Rothamsted Experimental Station, Harpenden, Hertfordshire AL5 2JQ (Gt. Britain)
(Accepted for publication 13 June 1988)
ABSTRACT
Buraymah, I.M. and Webster, R., 1989. Variation in soil properties caused by irrigation and cul- tivation in the central Gezira of Sudan. Soil Tillage Res., 13: 57-74.
The variation in soil created by agriculture under irrigation is assessed by comparing the soil on two adjacent 3.75-ha plots on vertisol in the Sudan Gezira. One plot has been cultivated and irrigated by flooding for over 50 years; the other remained in its original natural condition. The topsoil (to 30 cm) was sampled at intervals of 6.25 m on a grid and the pH, electrical conductivity and sodium adsorption ratio measured. The sample variances were up to 3 times larger on the irrigated plot than on the natural one. A spatial analysis showed almost no spatial dependence on the natural plot but a fairly strong dependence after irrigation with marked anisotropy. Most variation occurred perpendicular to the present river channel, but there was also subsidiary short- range variation approximately in the direction of flooding. To illustrate these effects, statistical surfaces were estimated by simple kriging from the data and their variograms and displayed as block diagrams.
INTRODUCTION
The soil of any region, however small, varies from place to place. This can present difficulties for the farmer, who can overcome them by dividing his land into more homogeneous parcels or attempt to homogenize the topsoil at least by cultivation, or some combination of the two. Irrigation in arid regions often results in local waterlogging and accumulation of salt. It is difficult to apply irrigation water uniformly, especially by flooding. Slight unevenness of the land surface causes water to pond in some places and not others. Ploughing creates more or less large ridges and furrows, and it can be difficult to flatten these completely before irrigating. Therefore, although the farmer desires a uniform soil, his management may inevitably create variation. If this is in the form of local redistribution or accumulation of salt then the result can be serious.
We know of no long-term trials designed to assess the effect of irrigation
0167-1987/89/$03.50 © 1989 Elsevier Science Publishers B.V.

58
farming on soil variation• The experimental programme at the Wad Medani research station in the central Gezira, however, provides an opportunity to study the effect of irrigation on soil pattern. Large-scale irrigation farming began in the region in 1925 and was supported by experiments at Wad Medani. As part of the research, one plot of land was left in its native condition, while the rest was irrigated to grow a variety of crops. Thus, by comparing the unused plot with the adjacent land the effect of farming on soil variation could be assessed. This paper describes the results of a survey designed specifically to make this comparison.
THE GEZIRA IRRIGATION SCHEME
The Gezira (Arabic for island) is a triangular region, bounded by the White and Blue Nile rivers south of their confluence, Fig. 1. It is part of the Central Clay Plain of Sudan with a slope of only 0.02%• It lies on alluvium at least 20- m thick derived from the Ethiopian Highlands. The soil is dark brown or grey
16¢
1 4 "
!
N
Jebel Aul ia
-: ~...: .~ ": ' ' . . .Y" . .
..%.-,
\ ":.4 2 0 4 0 6 0 "~(
i I I
I
K H A R T O U M
Gez i ra I r r igated Area
H a s a h e i s a
0 1 0 0 " ~ , • Sennar
N a d Medani
i ~ , ,ome. . i ] i I 3 2 " 3 3 " 3 4 "
Fig. 1. Map of the Gezira, showing the extent of irrigation farming and the location of the sample plots.

59
cracking clay (vertisol) with montmorillonite as the dominant clay mineral. The climate is hot and arid or semi-arid {mean annual temperature is 27°C and mean annual rainfall ranges from 200 mm in the north to 450 mm in the south) and the natural vegetation consists of sparse Acacia spp. and grasses.
The Gezira Irrigation Scheme began as a small pilot scheme in 1911 on 105 ha at Taiba, 10-km north of Wad Medani. Water was pumped directly from the Blue Nile river. Its area was gradually increased by the installation of more pumps further south. Large-scale irrigation was started in 1925, when a dam was constructed at Sennar (Fig. 1), and today since the construction of the Roseries Dam further south, some 900 000 ha are irrigated by water from the Blue Nile.
Cotton is the principal economic crop. It is grown in rotation with wheat, groundnuts, sorghum and vegetables. For cotton, the land is ploughed to a depth of about 22 cm and then formed into ridges 22-cm high and 80-cm apart. For wheat, the land is disc-harrowed and then levelled, while for groundnuts and sorghum, it is disc-ploughed and ridged. Irrigation is by flooding at an approximate rate of 1000 m 3 h a - ' every 14 days for cotton and more variably for the other crops. Excess water is led away through surface drains. Waterlog- ging occurs locally in years of exceptionally heavy rain, but too infrequently to have needed changes to the drainage system (Farbrother, 1972). The quality of water from the Blue Nile is good. Mustafa (1973) recorded maxima in the electrical conductivity of 0.12-0.22 ms c m - ' at low water over a 6-year period, and maximum values of sodium-concentration and sodium-adsorption ratio (SAR) of 1.3 m.e. l - ' and 1.44 respectively. Nitrogen fertilizer, as urea, is broadcast for cotton at about 120 kg of N ha- 1. Wheat receives about 80 kg N ha- ', broadcast at sowing. No other fertilizers are applied.
Research on the dynamic behaviour of the soil under irrigation began si- multaneously with the establishment of the Gezira Scheme in 1925. Rai ( 1969 ) summarized the work. The results were conflicting, and Rai could not draw general conclusions on the effect of irrigation because there were no compari- sons between the irrigated land and that left in its natural state.
PROCEDURE
To study the long-term effect of this agricultural practice on the soil, we compared the soil on two plots of land at Wad Medani, the agricultural re- search station established shortly after the inception of the Gezira Scheme. One plot had been used, as described, for more than 50 years, the other had been preserved in its natural condition, unused. The soil is the Suleimi series, the typical dark cracking clay (vertisol) first described by Greene (1928) that covers more than 90% of the Gezira. It contains some 60% of clay throughout the profile with a cation exchange capacity of approximately 100 m.e. per 100 g of clay. Robinson et al. (1969) provided a full description and chemical anal-

60
TABLE 1
Sampling variances within circular supports of 1-m radius
Plot Property M e a n Variance loglo
Mean Variance
Natural
Irrigated
pH 7.78 0.004250 EC 0.521 0.002650 -0.284 0.001086 (ms cm- l) SAR 3.26 0.2478 0.509 0.003998 pH 7.51 0.003833 EC 0.439 0.005300 - 0.362 0.001457 (mscm -1) SAR 2.03 0.06658 0.284 0.003288
EC = electrical conductivity; SAR = sodium adsorption ratio.
ysis, and in the appendix we give the latest bench-mark description by Nachtergaele (1976) together with average chemical analyses for the series.
The two plots, each 250 × 150 m, were adjacent to one another, though on opposite sides of an irrigation canal, some 4 km from the Blue Nile, see Fig. 1. The irrigated plot was cultivated in the nor th-south direction and flooded from the southern end and drained to the north.
In 1985, the soil of the two plots was sampled to 30 cm on a square grid at 6.25-m intervals. Using a bucket auger of 8-cm diameter, 5 cores were taken at random in a circle of 1-m radius around each grid node. The cores for each node were bulked for analysis. The sampling was performed along 24 rows from south to north in each plot. In alternate rows the sampling interval was in- creased to 12.5 m. The grid on the irrigated plot had 41 columns, tha t on the natural plot had only 36.
In the laboratory the samples of soil were air-dried, crushed to pass 2 mm and analysed in batches. Each batch consisted of 31 samples by rows. The pH was determined in a 1:1 suspension of 0.01 molar CaC12. Electrical conductivity was measured in a 1:1 soil:water saturation extract. Soluble sodium, calcium and magnesium were measured on the same extract and the sodium adsorption (SAR) calculated from the relation
SAR = N a / x / ( C a + Mg) /2
where Na, Ca and Mg are expressed as concentrations in m.e. l-1. To obtain an estimate of the variation within the sampling support, i.e. the
circles of 1-m radius, a further 60 samples of soil were taken at random within the 1-m circles around 12 randomly chosen grid nodes. These were analysed chemically as above and the average variances within circles calculated. The results are given in Table 1.

61
Preliminary data analysis
The frequency distributions of the data were examined first. Figure 2 shows them plotted as histograms, and they are summarized in Table 1. The distri- butions of electrical conductivity are markedly skewed with long upper tails, and, as Fig. 2 shows, they are well fitted by log-normal curves. The sodium adsorption ratio of the irrigated soil is also fairly strongly skewed and it too appears to be log-normally distributed. On the natural plot the distribution is only slightly skewed, and the log-normal curve fits little better than the normal curve. The pH on both plots is approximately normally distributed.
Since the purpose of the study was to see how using the land has affected the soil pattern, it was important to stabilize the variances. The measurements of conductivity and sodium-adsorption ratio were therefore transformed to their common logarithms for further analysis and comparisons. Table 2 gives their means and variances on these scales. The pH is, of course, already a logarith- mic transformation. So by transforming the others, all were brought to loga- rithmic scales.
Table 2 shows that using the land has diminished the average pH and con-
Ndturol Irrigoted
i Z05
i 7.25 7.45 Z55 7.85 8.05 7105
pH
7 2 5 Z 4 5 Z65 7 85 8 0 5
Electr ical c o n d u c t i v i t y
mS dm -~
4 6 8 10 12 14
1 2 3 4 5 6 7 1 2 3 4 5 6 7
Fig. 2. Frequency dis t r ibut ions of the data. Normal curves are fitted to those of pH and log-normal curves to those of the other variables.

62
TABLE 2
Summary of statistics
Plot Property Number of Mean Variance Skewness loglo measurements
Mean Variance Skewness
Natural pH 645 7.72 0.007534 -0.12 EC 642 0.524 0.005230 1 .47 -0.284 0.003209 0.65 (mscm -1)
SAR 642 3.52 0.5388 0.48 0.537 0.008762 -0.72 Irrigated pH 744 7.62 0.01186 -0.63
EC 744 0.501 0.01764 2.10 -0.312 0.009934 1.03 (ms cm -~) SAR 744 2.11 0.4051 1.07 0.306 0.016840 -0.22
EC = electrical conductivity; SAR = sodium adsorption ratio.
ductivity somewhat and the sodium adsorption ratio more so. This is presum- ably because sodium has been leached by drainage after irrigation. The variation in all three properties is increased, however, and most markedly for conductivity.
Spatial analysis
The distribution of the variation in space was analysed by computing var- iograms of each property. With sampling on a regular square grid we could estimate semi-variances at regular intervals in two dimensions using the for- mula given by Webster (1985). Alternatively, we could regularize the semi- variances over angular sectors. For this paper we show the results in the latter form since it is easier to present the fitted models in this way. The computing formula is
1 m(h) f + h ) } 2
I where '2 (h) is the estimated semi-variance for points separated by the lag h, m (h) is the number of pairs of observations at that separation, and z (xl) de- notes the measured value of the soil property z at position xi in the plane. The lag h in this formula, is a vector with both distance and direction, and here embraces a small range in each. The distance was incremented in single units of the sampling intervals, i.e. 6.25 in, with a range of one interval, and the direction incremented in steps of 22.5 ° with a range of 22.5 °. The results are shown in Figs. 3-5 for pH, electrical conductivity and sodium-adsorption ratio respectively. In each figure the variogram for the natural plot is presented above

63
0 . 0 1 5
O4
"1" CL 0 . 0 1 0
0 . 0 0 5
0
, : - - . - ~ - I - | - j - ~ - - - : - T ', ! , o ~- • ~ o o o o
o o
o 0
Natural
I I I I 1 I I I
0 . 0 2 0
0 . 0 1 5
O4
• ~ 0 . 0 1 0
0 . 0 0 5
Directions
o N - S • E - W
• N N W - S S E • W S W - E N E
V N W - S E E] S W - N E
• W N W - E S E A S S W - N N E
| } - - o
- - 0 0
0 0
0
_ _ - ; - J - - - t, X
I
I rr igated
J I I I I 1 I I 0 25 50 75 100
L a g / m
Fig. 3. Semi-variograms of pH with different symbols for the eight directions. The lines show the fitted models (from Table 2 ).

64
0.010
Od #, E 0 ¢D E o
0 v
;>-
0.008
0.006
0.004
0 - Natural
0 .012
• __m_ •
0.010 _m- m - - • - ' - l - I • -~e--vo v
• ! ; ° L ! - - ~" 0.008 ~.- - ~ • [] :
o . . - , _ _ - o z~ 0
~ u." - = o
e o.oo8 ! O
O o n
" 0.004 o
0.002 I rr igated
I I I I I I I I 0 25 50 76 100
Lag/m Fig. 4. Semi-variograms of electrical conductivity. The symbols for eight directions are shown in Fig. 3, and the lines are those of the models specified in Table 2.
that of the irrigated one. The semi-variances for the eight directions are dis- played with distinguishing symbols.
The variograms show immediately the larger variances on the irrigated land. For pH this appears only at the longer lags: there is little difference between the two up to 25 m (4 lag units) . For conductivity and SAR, however, the differences are manifest at all lags.
A second difference in soil between the used and unused is the auto-corre- lation. At the scale of investigation, there is almost none for pH and conduc- tivity on the natural plot. The semi-variance are on average much the same at

0 . 0 1 5 -
6 5
¢~ 0 . 0 1 0
~" 0 . 0 0 5
. | _ - - - - = ' - ' T - 9
- - " 5 ~ - g ~ - V V •
. . . . A /h
o
o
Natura l
I I 1 1 I I I I
0 . 0 2 5
0 . 0 2 0
o~ 0 . 0 1 5 IZ
~- 0 . 0 1 0
0 . 0 0 5
. ~"| o v X ~ ~ - ' e v ~ n • A W • J .
--~--0-- 0 0 0
o o
O
I r r iga ted
I I I I I I I 1 0 2 5 5 0 75 1 0 0
L a g / m
Fig. 5. Semi-variograms of sodium adsorption ratio. The symbols for eight directions are as shown in Fig. 3, and the lines are the models specified in Table 2.
all lag distances: in the language of the subject the variograms are almost "pure nugget". The semi-variance of SAR increases somewhat with increasing dis- tance. This behaviour contrasts with that on the irrigated plot where there is a fairly marked auto-correlation.
The third feature of the variograms on the irrigated plot is that they show anisotropy: variation is substantially more in some directions than others. For pH and conductivity maximum variation appears in the direction approxi- mately W N W to ESE, symbol [7, whereas for SAR it appears more nearly east to west, symbol o. These are rough approximations at this stage. Furthermore

66
they apply to the variograms over the whole range of the lag distances shown in Figs. 3-5. Over the first few lag intervals, the variograms show another kind of anisotropy. There is a fluctuation in semi-variance with a peak at about three sampling intervals, i.e. about 20 m, that is more apparent in directions close to nor th-south than east-west. This feature is absent from the vario- grams of the natural plot. The reason for this will become apparent when we construct the statistical surfaces.
The final feature of all the variograms that needs mention is the way in which the semi-variances in the nor th-south direction, i.e. along the rows of the grid, lie consistently below those in the other seven directions over the first few lags. This is almost certainly a procedural artifact. As described above, the survey was performed by sampling sequentially along the rows of the grid, and in the laboratory the chemical determinations were made in batches by rows. Thus any inconsistency in field technique from day to day and any batch-to- batch variation in the laboratory will have swollen the measured variance be- tween rows but not that over short distances within rows. The analysis reveals this, and future studies of this kind should embody procedures such as those described by McGrath (1987) for avoiding large errors at least in the laboratory.
To summarize this information quantitatively and also to provide equations for kriging, see below, we fitted models to the sample variograms by least squares approximation as described by McBratney and Webster (1986). The best fit- ting models turned out to be linear or exponential, and for the irrigated plot anisotropic also. Their formulae are given below. Linear
7(h,0) =Co + h~ (0) 7(0) =0
Exponential
{ 7(h,0)=Co + c 1 - exp
7(0) =0
The function ~ is given by
n(O)={A2cos2(O-O) + B2sin2(O_~)} 1/2
where A and B are the gradient or distance parameters of the model and O is the angle that maximizes the function. Table 3 states the model fitted for each variable and plot and gives the estimates of the parameters. The models are shown either as single lines, where variation is isotropic, or as their envelopes where anisotropic in Figs. 3-5.

67
T h e f i t ted models conf i rm the in tu i t ive assessment of the sample vario- grams. T h e an i so t ropy ratio, A/B, is about 3 for all t h ree var iables on the i r r iga ted plot, and on this p lo t the angle of m a x i m u m var ia t ion is about 1.3 rad or 75 ° f rom the d i rec t ion a long the rows. No te t h a t the angle ¢ for the expo- nen t ia l models as given in Tab le 3 is the d i rec t ion in which the d is tance pa ram- e te r is greatest , and hence the var ia t ion least. In fact, it is reasonable to assume t h a t the angles found by f i t t ing models separa te ly for the th ree p roper t i es are all es t imates of a c o m m o n angle, which is be t t e r e s t ima ted by pool ing the three. Pool ing gives an es t imate of 1.30 rad for the d i rec t ion of m a x i m u m var ia t ion (0 for the l inear model ) and 2.87 rad for the m i n i m u m (0 for the exponen t ia l models ). F i t t ing the models afresh wi th these values of O gives the resul ts l isted in Table 4. T h e var ia t ion on the na tu ra l p lo t is a lmos t wholly nugget, though
TABLE3
Best fitting models for semi-variograms
Property Plot Model Parameter ~ Estimate
pH Natural Linear co 0.00630 Isotropic b 0.0000125
Irrigated Exponential co 0.00522 Anisotropic c 0.0109
A 185.7 B 67.7 0 2.84 rad
logxo EC
loglo SAR
Natural Linear Isotropic
Irrigated Exponential Anisotropic
Co 0.00244 b 0.00000624 Co 0.00629 c 0.00491 A 117.9 B 39.8 0 2.56 rad
Natural Exponential co 0.00573 Anisotropic c 0.03776
A 2243 B 675 ¢ 2.62 rad
Irrigated Linear co 0.01009 Anisotropic A 0.000126
B 0.0000451 1.64 rad
aThe symbols are defined in the text. For the linear models the gradients are in units of variance per metre and for the exponential models the distance parameters are in metres. EC = electrical conductivity; SAR = sodium adsorption ratio.

68
TABLE 4
Semi-variogram models for irrigated plot with a common direction of 1.30 radians for that of maximum variation
Property Model Parameter a Estimate
pH Exponential co 0.00491 c 0.01040 A 151.1 B 61.6
EC Exponential Co 0.00654 c 0.00542
(loglo ms cm -~ ) A 150.0 B 60.5
SAR Linear co 0.01183 {loglo) A 0.0000916
B 0.0000427
"The symbols are defined in the text. For the linear models the gradients are in units of variance per metre and for the exponential models the distance parameters are in metres. EC = electrical conductivity; SAR = sodium adsorption ratio.
for SAR it was possible to detect an anisotropy similar to tha t on the irrigated plot.
Kriging
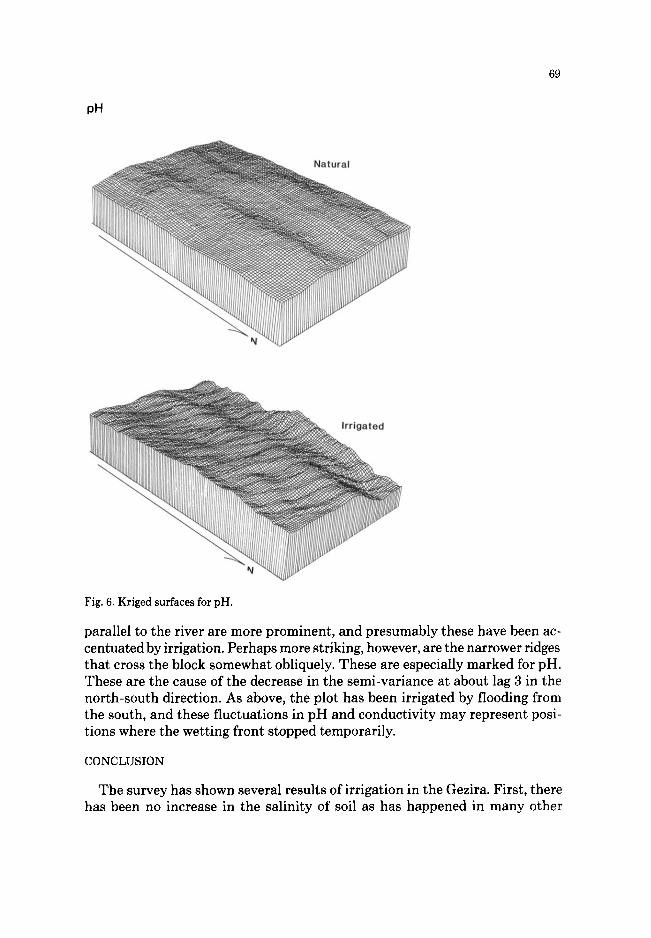
Although the models for the variograms summarize the variat ion on the two plots and the differences brought about by use, these differences are best shown as contrast ing statistical surfaces. To form these we est imated the values of the three propert ies at the nodes of a fine grid at 2.083-m intervals, i.e. at one third of the original sampling interval. We did this by simple kriging from the data and the variogram models, with a common angle of anisotropy, ~ in Table 4, as described by Burgess and Webster (1980a,b). We then displayed the sur- faces as block diagrams using the program Surface II (Sampson, 1978 ). Figures 6-8 show the results. In these, each individual est imate is for a 10 × 10-m block with the grid node at its centre.
The surfaces for the natural plot show very little variation. There is a slight undulat ion tha t was identified in the variogram only for the sodium-adsorption ratio. The undulat ions are approximately parallel to the course of the Blue Nile and may relate to small variations in the depositional sequence.
The surfaces for the irrigated plot contrast markedly with the above. As expected from the variograms the variat ion is much larger. The undulat ions
pH
69
Fig. 6. Kriged surfaces for pH.
parallel to the river are more prominent, and presumably these have been ac- centuated by irrigation. Perhaps more striking, however, are the narrower ridges that cross the block somewhat obliquely. These are especially marked for pH. These are the cause of the decrease in the semi-variance at about lag 3 in the north-south direction. As above, the plot has been irrigated by flooding from the south, and these fluctuations in pH and conductivity may represent posi- tions where the wetting front stopped temporarily.
CONCLUSION
The survey has shown several results of irrigation in the Gezira. First, there has been no increase in the salinity of soil as has happened in many other

70
Electrical conductivity
Fig. 7. Kriged surfaces for electrical conductivity.
irrigation schemes. In fact, on this plot there has been a small decrease. The water of the Blue Nile is pure, and what little salt it contains has been able to drain from the soil. Farming under irrigation has increased the variation. It appears to have accentuated the fluctuations in pH, conductivity and sodium- adsorption ratio already present parallel to the Blue Nile, but more especially it has created variation across these. The most likely explanation is that there has been local leaching immediately behind wetting fronts, where the flood water has been ponded temporarily.
In this instance, the consequence is not serious for farming. If the process is general, however, then irrigation managers would be well advised to conduct

SAR
7]
N
Fig. 8. Kriged surfaces for SAR.
detailed surveys of soil salinity and pH to ensure that local increases in either do not impair the overall quality of the land.
ACKNOWLEDGEMENT
We thank Mrs Joyce Munden for her help with the computing and for the graphics.
APPENDIX
Details of Suleimi series
This is the description of a modal profile at Wad Sadallah (Block 21 ), Shu- bra minor canal, Plot 7, Hawasha F, Central Gezira, Gezira Canalization

72
Scheme, Blue Nile Province, Sudan (approximately 14 ° 31' N, 33 ° 20'E) on nearly level land under fallow on Blue Nile alluvium. It was made on 5 June 1966.
All 0 -3 cm Dark brown (10YR 4/3 ) moist and brown (10YR 5/3 ) dry clay; strong very
fine and fine granular structure, very sticky, very plastic, friable moist, hard dry; frequent small hard irregular grey CaC03 nodules; matrix calcareous; few fine roots; abrupt smooth boundary; pH 8.4 (2-6-cm thick).
A12 3-35 cm Dark brown (10YR 4/3) moist and dry clay; weak medium sub-angular blocky
structure; very sticky; very plastic, firm moist, hard dry; fine vertical cracks (1-2-cm wide); frequent small hard irregular gray CaCO3 nodules; few shell fragments; common fine roots; matrix calcareous; gradual wavy boundary; pH 8.4 (30-40-cm thick).
A13 35-70 cm Dark brown (10YR 4/3 ) moist clay with a few very dark moist grey (10YR
3/1 ) tongues (about 15% ); very sticky, very plastic, firm moist, hard dry; few vertical cracks (1-2-cm wide) ending at about 60 cm; few small (10-20-cm) sand pockets; CaC03 nodules and shell fragments as in above horizon; very few fine roots; few large (1-2 cm) soft patches of lime, calcareous matrix; gradual wavy boundary; pH 8.5 (30-35-cm thick).
AC 70-100 cm
Dark brown (10YR 3/2) and very dark grey (10YR 3/1) moist clay mixed in about equal proportions; weak medium subangular blocky structure; very sticky, very plastic, firm moist, hard dry; few parallelepiped aggregates with shiny slickenside faces; few vertical cracks (5-10 mm wide); frequent small hard irregular grey CACO3 nodules; few shell fragments; very few fine roots; few large (1-2 cm) soft patches of lime, calcareous matrix, gradual wavy boundary; pH 8.6 (30-35-cm thick).
A11bz 100-135 cm Very dark grey (10YR 3/1) moist clay; weak medium sub-angular blocky
structure; sticky, plastic, firm moist, hard dry; few fine and medium discontin- uous vertical inped pores; few small hard spherical grey CaCO3 concretions few shell fragments; calcareous matrix; common fine and medium sized gypsum crystals; clear wavy boundary; pH 8.6 (30-35-cm thick).

73
Z
©
to.
~S
r~9
~S
r ~
t ~
o ~
Z ~
• ~ o~
0 ~
o
a~
U
o
~ v
©
. ~ o ~

74
A12bz 135-150 cm Very dark grey (10YR 3/1 ) clay with about 20% dark yellowish b rown (10YR
3 /4 ) mois t s t reaks; massive; s t icky, plastic, f i rm moist , h a rd dry; few very fine and fine d i scon t inuous ver t ica l inped pores; CaCO3 nodules and shell frag- me n t s as in above horizon; few large (1-2 cm) soft l ime patches ; calcareous matr ix; clear wavy boundary ; p H 8.6 (15-20-cm th i ck ) .
C 150-200 cm Dark yel lowish b rown (10YR 4 / 4 ) mois t clay wi th a few very dark grey
(10YR 3 / 1 ) mois t s t reaks and few fa in t da rk b ro w n (7 .5YR 4 / 4 ) mot t les ; massive; s t icky, plastic, ve ry firm, very hard; few t e rmi t e nests; small h a rd i r regular CaCO3 nodules; few shell f ragments ; a few soft l ime pa tches (1 cm) , calcareous matr ix ; p H 8.6.
REFERENCES
Burgess, T.M. and Webster, R., 1980a. Optimal interpolation and isarithmic mapping of soil prop- erties. I. The semi-variogram and punctual Kriging. J. Soil Sci., 31: 315-331.
Burgess, T.M. and Webster, R.,1980b. Optimal interpolation and isarithmic mapping of soil prop- erties. II. Block Kriging. J. Soil Sci., 31: 333-341.
Farbrother, H.G., 1972. Field behaviour of Gezira clay under irrigation. Cotton Grow. Rev., 49: 1- 27.
Greene, H., 1928. Soil profile in the eastern Gezira. J. Agric. Sci., Cambridge, 18: 518-530. McBratney, A.B. and Webster, R., 1986. Choosing functions for semi-variograms of soil properties
and fitting them to sampling estimates. J. Soil Sci., 37: 617-639. McGrath, S.P., 1987. Computerized quality control, statistics and regional mapping of the con-
centrations of trace and major elements in the soil of England and Wales. Soil Use Manage., 3: 31-38.
Mustafa, M.A., 1973. Appraisal of the water quality of the Blue and White Niles for irrigation use. Afr. Soils, 18: 113-124.
Nachtergaele, F.O., 1976. Suleimi Series, Bench Mark Soil Description. Ministry of Agriculture, Sudan, Bulletin, No. 26.
Rai, K.D., 1969. Long-term effect of irrigated cotton on soil. In: Cotton Growth in the Gezira Environment. A symposium to mark the 50th anniversary of the Gezira Research Station, Agricultural Research Corporation, Wad Medani, pp. 17-28.
Robinson, G.H., Magar, W.Y. and Rai, K.D., 1969. Soil properties in relation to cotton growth. In: Cotton Growth in the Gezira Environment. A symposium to mark the 50th anniversary of the Gezira Research Station, Agricultural Research Corporation, Wad Medani, pp. 5-16.
Sampson, R.J., 1978. The Surface II Graphic System {Revision One). Series on Spatial Analysis No. 1, Kansas Geological Survey, Lawrence.
Webster, R., 1985. Spatial analysis of soil in the field. Adv. Soil Sci., 3: 1-70.