variable message signs harmonisation principles of vms ... · 3 esg4 – variable message signs...
TRANSCRIPT

Variable Message Signs Harmonisation
PRINCIPLES OF VMS MESSAGES DESIGN
Supporting guideline VMS-DG01 | VERSION 02-00-00 | DECEMBER 2012

2
ESG4 – VARIABLE MESSAGE SIGNS HARMONISATION
VMS-DG01 – PRINCIPLES OF VMS MESSAGES DESIGN
COORDINATORS: ALBERTO ARBAIZA & ANTONIO LUCAS-ALBA
ew-dg-2012_vms-dg01_principlesofvmsdesign_02-00-00.docx 31/12/2012 2/60
Contact Coordinator Alberto Arbaiza, Dirección General de Tráfico, Spain, [email protected]
Antonio Lucas-Alba, DGT/Universidad de Zaragoza, Spain, [email protected]
Coordinator support
M. Teresa Blanch, Universitat de València, Spain, [email protected]
Ana B. Cabrejas, Universitat de València, Spain, [email protected]
Preamble EasyWay is a cooperation of road authorities and road operators from 27 European countries that have teamed up to unlock the benefits of cooperation and harmonisation in the deployment of Intelligent Transport Systems (ITS) on Europe’s major road network. ITS as a technology is a known contributor to sustainable mobility in terms of improved safety, efficiency and reduced environmental impact. Nevertheless, fragmented deployment on a national level will fail to deliver seamless European services and will not contribute to a coherent European Transport network. The European Member States have consequently launched the EasyWay project together with the European Commission as a platform to harmonise their ITS deployments.
This document has been drafted by EasyWay as part of the set of documents containing the 2012 version of the EasyWay Deployment Guidelines (DG 2012). These guidelines have been developed by EasyWay experts and practitioners. They have undergone a thorough review by international domain experts in an intense peer review exercise and they have been validated by the participating Member State Partners of EasyWay in an extensive formal Member State consultation process, which finally led to their adoption as basis for all deployment activities in future EasyWay phases.
EasyWay as a project is not a standardisation body, nor does it have any power to legally constrain the Member State in their national deployment activities. It is therefore crucial to understand that these documents are neither technical standards, nor are they specifications as they would be required for such cases, e.g. as currently developed by the European Commission as their part of the implementation of the ITS Directive 2010/40/EU. But since a certain level of strictness in compliance is required to achieve the intended goal of the EasyWay Deployment Guidelines – harmonisation and interoperability in Europe – the guideline documents are written in a way that clearly defines criteria that deployments have to fulfil in order to claim overall compliance with the guideline.
Although not legally binding in any sense, compliance may be required for the eligibility of deployments in future ITS road projects co-funded by the European Commission. Deviation from compliance requirements may nevertheless be unavoidable in some cases and well justified. It is therefore expected that compliance statements may contain an explanation that justifies deviation in such cases. This is known as the “comply or explain” principle.
Although not standards themselves, the EasyWay DG2012 Deployment Guidelines in some cases do mention – and sometimes require – the use of such standards. This is the case in particular regarding the use of the CEN/TS 16157 series of technical specifications for data exchange (“DATEX II”). Although standardised data exchange interfaces are a powerful tool towards harmonised services in Europe, it must be understood that real world deployments have to fit into existing – and sometimes extensive – infrastructures and investment in these infrastructures must be protected. It is therefore important to note that the use of DATEX II mentioned below as a MUST is referred to implementation of “new” data exchange systems and not the utilisation of the existing ones, unless these latter affect harmonisation of deployments or interoperability of services.

3
ESG4 – VARIABLE MESSAGE SIGNS HARMONISATION
VMS-DG01 – PRINCIPLES OF VMS MESSAGES DESIGN
COORDINATORS: ALBERTO ARBAIZA & ANTONIO LUCAS-ALBA
ew-dg-2012_vms-dg01_principlesofvmsdesign_02-00-00.docx 31/12/2012 3/60
Service at a glance SERVICE DEFINITION
ESG4 DG01 presents the general philosophy of VMS message design, synthesized through its 32 principles. Any VMS operator in Europe, by following such recommendations when composing VMS messages, will contribute to the construction of a more harmonised TERN.

4
ESG4 – VARIABLE MESSAGE SIGNS HARMONISATION
VMS-DG01 – PRINCIPLES OF VMS MESSAGES DESIGN
COORDINATORS: ALBERTO ARBAIZA & ANTONIO LUCAS-ALBA
ew-dg-2012_vms-dg01_principlesofvmsdesign_02-00-00.docx 31/12/2012 4/60
Table of Content 1 Introduction .......................................................................................................................................... 7
1.1 The concept of the EasyWay Deployment Guidelines ........................................................................... 7
1.1.1 Preliminary note ................................................................................................................................ 7
1.1.2 Applying Deployment Guidelines – the “comply or explain” principle ............................................. 7
1.1.3 Use of Language in Part A ................................................................................................................. 7
1.2 ITS-Service Profile .................................................................................................................................. 9
2 Part A: Harmonization Requirements .................................................................................................. 10
2.1 Service Definition................................................................................................................................. 10
2.2 Functional Requirements .................................................................................................................... 11
2.3 Technical Requirements ...................................................................................................................... 12
2.4 Common Look & Feel .......................................................................................................................... 12
2.4.1. Principles of design: significant, general and specific ......................................................................... 12
2.4.2. General principles of design ................................................................................................................ 13
2.4.3. Specific principles of design ............................................................................................................ 24
2.5 Level of Service Definition ................................................................................................................... 25
2.5.1 Preliminary remark .......................................................................................................................... 25
2.5.2 Level of Service Criteria ................................................................................................................... 25
2.5.3 Level of Service Criteria related to Operating Environment ........................................................... 26
3 Part B: Supplementary Information ..................................................................................................... 27
3.1 Examples of deployment ..................................................................................................................... 27
3.1.1 Examples of implementation of DG01 in Spain ............................................................................... 27
3.1.2 A pictogram reservoir ...................................................................................................................... 28
3.2 Taking VMS types into account when building specific messages ...................................................... 32
3. Annex A: Compliance Checklist ............................................................................................................ 41
3.4. Compliance checklist "should" ............................................................................................................ 41
4 Annex B: Bibliography ......................................................................................................................... 43
5 Annex C: Content annexes 1 to 12: additional information backing general principles of design ......... 45

5
ESG4 – VARIABLE MESSAGE SIGNS HARMONISATION
VMS-DG01 – PRINCIPLES OF VMS MESSAGES DESIGN
COORDINATORS: ALBERTO ARBAIZA & ANTONIO LUCAS-ALBA
ew-dg-2012_vms-dg01_principlesofvmsdesign_02-00-00.docx 31/12/2012 5/60
List of figures and tables
Figure 1: Some examples of different VMS lay-outs covered in DG01 ................................................................. 11
Figure 2: Ordering of information units. An example of a standard VMS display selection ................................. 17
Figure 3: Example of implementation of DG01 in Spain ....................................................................................... 28
Figure 4: Pictograms in the 2011 working book (1) .............................................................................................. 29
Figure 5: Pictograms in the 2011 working book (2) .............................................................................................. 30
Figure 6: Pictograms in the 2011 working book (3) .............................................................................................. 31
Figure 7: Some examples of different VMS lay-outs covered in DG02 ................................................................. 32
Figure 8: The main information elements for a given road/traffic situation (e.g., congestion, no exit) and the six main VMS devices where it could be located ....................................................................................................... 34
Figure 9: The main information elements for a given road/traffic situation (e.g., congestion, no exit): paths for placing the information elements ......................................................................................................................... 34
Figure 10: The main information elements for a given road/traffic situation (e.g., congestion, no exit, due to road works) and the order and structure assigned in the five main VMS devices ............................................... 35
Figure 11: Congestion - no exit ............................................................................................................................. 37
Figure 12: Congestion - exit available ................................................................................................................... 37
Figure 13: Congestion - exit available ................................................................................................................... 38
Figure 14: Road closed - exit available .................................................................................................................. 38
Figure 15: Next exit closed due to road works...................................................................................................... 39
Figure 16: Strong wind .......................................................................................................................................... 39
Figure 17: Slippery road due to snow/ice ............................................................................................................. 40
Figure 18: Slippery road due to rain, water, pools, flooding................................................................................. 40
Table 1: Part A - requirement wording ................................................................................................................... 8
Table 2: Recommendations for locating information units in different signing functions in VMS (E = main Event, L = Location, A = Advice or Additional information, C = Cause of event) .............................................................. 17
Table 3: Standard abbreviations .......................................................................................................................... 18
Table 4: Short terms, symbols and non-standard abbreviations .......................................................................... 18
Table 5: Location formulations for VMS that are far/near/within traffic/weather related events. [* Cells that apply only to weather related events.] [+ Cells that apply only to traffic related events] ................................... 21
Table 6: Recommendations for displaying information on correspondence times .............................................. 22
Table 7: Recommendations for locating information on optional routing ........................................................... 23
Table 8: Recommendations for locating information units in pre-announcements ............................................. 23

6
ESG4 – VARIABLE MESSAGE SIGNS HARMONISATION
VMS-DG01 – PRINCIPLES OF VMS MESSAGES DESIGN
COORDINATORS: ALBERTO ARBAIZA & ANTONIO LUCAS-ALBA
ew-dg-2012_vms-dg01_principlesofvmsdesign_02-00-00.docx 31/12/2012 6/60
List of abbreviations CL & F Required Common Look & Feel
DG01 VMS Deployment Guideline 01
DT Dirección de Tráfico. Basque Country
ESG4 Expert & Study Group 4
FIVE Framework for a Harmonised Implementation of VMS in Europe
FR Functional Requirements
ITS Intelligent Transport Systems
IU Information Units
LED Light Emitting Diode
MS Member State
OE Operating Environments
OR Organizational Requirements
PPT Pictogram-Pictogram-Text
PTP Pictogram-Text-Pictogram
RE.2 Consolidated Resolution 2. Road Signs and Signals
SCT Servei Català de Trànsit
SOMS Substituting/Optimizing (variable) Message Signs
TCC Traffic Control Centre
TERN Trans European Road Network
TR Technical Requirements
UNECE United Nations Economic Commission for Europe
WP. 1 Working Party 1. Traffic Safety. United Nations Economic Commission for Europe.
VAMOS White Book for Variable Message Signs Application
VMS Variable Message Signs

7
ESG4 – VARIABLE MESSAGE SIGNS HARMONISATION
VMS-DG01 – PRINCIPLES OF VMS MESSAGES DESIGN
COORDINATORS: ALBERTO ARBAIZA & ANTONIO LUCAS-ALBA
ew-dg-2012_vms-dg01_principlesofvmsdesign_02-00-00.docx 31/12/2012 7/60
1 Introduction 1.1 The concept of the EasyWay Deployment Guidelines
1.1.1 Preliminary note
This document is one of a set of documents for the EasyWay project, a project for Europe-wide ITS deployment on main TERN corridors undertaken by national road authorities and operators with associated partners including the automotive industry, telecom operators and public transport stakeholders. It sets clear targets, identifies the set of necessary European ITS services to deploy (Traveller Information, Traffic Management and Freight and Logistic Services) and is an efficient platform that allows the European mobility stakeholders to achieve a coordinated and combined deployment of these pan-European services.
EasyWay started in 2007 and has since established a huge body of knowledge and a consensus for the harmonised deployment of these ITS services. This knowledge has been captured in documents providing guidance on service deployment - the EasyWay Deployment Guidelines.
The first iteration of the Deployment Guidelines mainly captured best practice. This strongly supported service deployment within EasyWay by:
• making EasyWay partners in deployment aware of experiences made in other European deployment programmes.
• helping to avoid making errors others had already made
• reducing risk and facilitating efficient deployment by highlighting important and critical issues to consider
Meanwhile, this best practice has already successfully contributed to ITS deployments across Europe. It is now possible to take the logical next step and actually start recommending those elements of service deployment that have proven their contribution to both the success of the local deployment, as well as the European added value of harmonised deployment for seamless and interoperable services.
1.1.2 Applying Deployment Guidelines – the “comply or explain” principle
The step from descriptive best practice towards clear recommendations is reflected in the document structure used for this generation of the Deployment Guidelines. Apart from introduction and the annexes that cover specific additional material, the Deployment Guidelines consist of two main sections:
Part A – this part covers the recommendations and requirements that are proven to contribute to successful deployment and have been agreed by the EasyWay partners as elements that should be part of all deployments of this particular service within the scope of EasyWay. Thus, the content of this section is prescriptive by nature. EasyWay partners are expected to ensure that their deployments are compliant with the specifications in this section. Wherever concrete circumstances in a project do not allow these recommendations to be followed fully, EasyWay partners are expected to provide a substantial explanation for the need for this deviation. This concept is known as the “comply or explain” principle.
Part B – this part offers an opportunity to provide more valuable but less prescriptive information. Supplementary information may be contained including – but not limited to – regional/national examples of deployment and business model aspects like stakeholder involvement or cost/benefit analysis results.
1.1.3 Use of Language in Part A
It is essential for every prescriptive document to provide specifications in a well-defined and unambiguous language. There are various definitions that clarify the use of particular words (such as those listed below) within their prescriptive texts.
For the purpose of the EasyWay Deployment Guidelines, the well-established provisions of the RFC 2119 (http://www.ietf.org/rfc/rfc2119.txt, see (1)) are used, which is used to specify the basic Internet standards:

8
ESG4 – VARIABLE MESSAGE SIGNS HARMONISATION
VMS-DG01 – PRINCIPLES OF VMS MESSAGES DESIGN
COORDINATORS: ALBERTO ARBAIZA & ANTONIO LUCAS-ALBA
ew-dg-2012_vms-dg01_principlesofvmsdesign_02-00-00.docx 31/12/2012 8/60
The key words "MUST", "MUST NOT", "REQUIRED", "SHALL", "SHALL NOT", "SHOULD", "SHOULD NOT", "RECOMMENDED", "MAY", and "OPTIONAL" in this document are to be interpreted as described in RFC 2119.
An overview of the keywords, their meaning and the possible answers in the context of part A provides the following table. In general the keywords in brackets are possible, but their use is not recommended in order to avoid confusion which may arise as a consequence of different common linguistic usage of the terms in the different EU member states.
Table 1: Part A - requirement wording
Note: the capitalisation of these keywords that is frequently used in IT standards is not recommended for EasyWay Deployment Guidelines.
The use of this 'requirements language' allows the direct transfer of the requirements stated in part A to a compliance checklist.
The following paragraph gives an example for a functional requirement:
Functional requirement:
• FR2: Data and information collected by both automatically and non-technical sources must be based upon both a consistent geographic reference model and a time validity model, which both must be part of data description.
Beneath “Requirement” a new semantic element “Advice” is proposed for part A, which has not the character of a hard requirement but of a “recommendation” and hence must not be listed in the compliance checklist. “Advice” is not immediately related to the three pillars of ITS-service harmonization (Interoperability, Common look & feel, Quality criteria) but to “inner features” of an ITS-service. Nevertheless such an element delivers a European added value and hence should be addressed by the deployment guidelines.
The notation for using the advice element in the text is as follows:
Organisational advice:
• Clear definitions of organisational aspects are a crucial precondition for the successful implementation of a "Forecast and real-time event information service" and should be documented and accepted of all involved parties/partners in form of a Common partner arrangement/MoU - Memorandum of understanding, which establishes the details of co-operation.

9
ESG4 – VARIABLE MESSAGE SIGNS HARMONISATION
VMS-DG01 – PRINCIPLES OF VMS MESSAGES DESIGN
COORDINATORS: ALBERTO ARBAIZA & ANTONIO LUCAS-ALBA
ew-dg-2012_vms-dg01_principlesofvmsdesign_02-00-00.docx 31/12/2012 9/60
1.2 ITS-Service Profile
The Expert and Study Group 4 focuses on VMS message harmonisation. As expressed in the Working Book [1], our compilation of the current use of VMS displays by 13 countries, “if we use the same specific VMS design to inform about the same road event we can say we have achieved harmonisation. So, in order to reach VMS (message) harmonisation, VMS per road/traffic situation has to be specifically addressed by all participants (be it at national or international level).” (p. 13). DG01, the first ESG4 consolidated output, is a simplified set of rules to communicate with European drivers via VMS. DG01 brings 32 general principles of VMS design that focus on different aspects concerning the structure, order and functionality of the information displayed considering the end user: the European driver. For example, any VMS message displayed in Europe should be functional in terms of human processing capabilities (e.g., not using too many words, avoiding scrolling, avoiding alternate messages, and the like). Also, the order and structure of the informative elements displayed (pictograms, alphanumeric, text) is important in terms of the European driver in order to create regularities when we “talk” to them via VMS (e.g., the main element should be a representative pictogram, the location should be placed accordingly, the advice follows –not precedes- the main information, and the like). We are not describing road/traffic situations and actions through VMS in natural language, but using “Picto+” language. And such language only conveys well for European drivers when certain rules are followed.
Using the principles of this guideline to build consistent messages is not always easy, especially since there is a large variety in the types of VMS used in Europe. In section 3.2 of Part B we give some examples of how this can be achieved for a number of road/traffic situations taking into account the type of VMS used. In a later stage more guidance could be given for all road/traffic situations.

10
ESG4 – VARIABLE MESSAGE SIGNS HARMONISATION
VMS-DG01 – PRINCIPLES OF VMS MESSAGES DESIGN
COORDINATORS: ALBERTO ARBAIZA & ANTONIO LUCAS-ALBA
ew-dg-2012_vms-dg01_principlesofvmsdesign_02-00-00.docx 31/12/2012 10/60
2 Part A: Harmonization Requirements 2.1 Service Definition
The present ESG4 DG01 (General Principles of Design) is addressed to VMS that are mainly meant for displaying messages related to road/traffic situations in the network. Most of these VMS are large constructions, mounted on gantries and positioned over the road; some are mounted on poles at the side of the road. Gantry mounted lane-control VMS are currently only considered in this Guideline when used in combination with extra VMS positioned between the traffic lanes for displaying warnings in combination with the speed limits and/or lane restrictions.
DG01 focuses on the general principles of design that can be applied to the following categories of road/traffic situations for which messages can be displayed:
• Congestion
• Traffic flow information
• Unplanned events
• Road works
• Dynamic Traffic Management
• Weather related information
• Pre-announcements
• Co-modality and special circumstances and
• Campaign messages
In most cases VMS are placed with a main goal in mind, for instance warning about a danger or providing traffic flow information. But often the use is not limited to that main goal, since due to the road/traffic circumstances the display of other messages might become more urgent.
DG01 recognises that there is a large diversity in technology, and also in the types of VMS used. The principles of design appointed are suited for all current types of VMS used:
• Warning and/or regulatory signs used in lane-control systems
• Text-only VMS with generally 2-3 lines of text
• Text VMS with a pictogram area on the left side
• Text VMS with 2 pictogram areas on the left side
• Text VMS with a pictogram area on both sides, and
• Full matrix panels, which can display bitmaps.

11
ESG4 – VARIABLE MESSAGE SIGNS HARMONISATION
VMS-DG01 – PRINCIPLES OF VMS MESSAGES DESIGN
COORDINATORS: ALBERTO ARBAIZA & ANTONIO LUCAS-ALBA
ew-dg-2012_vms-dg01_principlesofvmsdesign_02-00-00.docx 31/12/2012 11/60
T R A T T O C H I U S O
U S C I T A
O B B L I G A T O R I A
Figure 1: Some examples of different VMS lay-outs covered in DG011
Also technically there can be big differences. Most modern VMS use LED technology now, but some other technology, like halogen bulbs combined with flip disks or fibre optics, still exist. Sometimes flashing lights are used to attract attention.
Many text displays still use 5x7 letter matrices and can display text in capitals only, while newer full LED displays make it possible to use mixed case text and can even display small pictograms embedded in the text.
Many VMS are placed at strategic locations, for instance shortly before important motorway exits or motorway junctions; this is because at those points a traffic diversion is possible, dependant on the message displayed. But sometimes these VMS are also used at regular intervals along motorways, thus providing a basic traffic management system, especially on roads that have no lane control systems.
2.2 Functional Requirements
The use of VMS is, in most cases, coordinated from a traffic control centre, where a control system will be used to control and monitor the VMS used. In case many VMS are used, it is very important that the operator can have a clear overview of all messages displayed. The user interface should also help the operator in setting up, changing and cancelling the messages.
Some messages will be automatically displayed, without intervention of an operator; for instance travel time indications based on automatically obtained traffic data. Some other messages can be planned beforehand, for instance in case of road works or pre-announcements. In those cases the rules of this guideline can be applied “off-line”, and long before they are used. But some other messages, like those related to sudden incidents or weather circumstances, need a quick reaction from a traffic operator. This means traffic operators need to be trained in using the basic principles of the guideline.
1 German dWiSta (bottom left) are very specific VMS, focused on rerouting and adopting structure and formats similar to posted directional panels. The signs consist of two full matrix fields and a fixed share with the direction arrows (for each lane) and the highway numbers.

12
ESG4 – VARIABLE MESSAGE SIGNS HARMONISATION
VMS-DG01 – PRINCIPLES OF VMS MESSAGES DESIGN
COORDINATORS: ALBERTO ARBAIZA & ANTONIO LUCAS-ALBA
ew-dg-2012_vms-dg01_principlesofvmsdesign_02-00-00.docx 31/12/2012 12/60
In order to be prepared for displaying the relevant VMS messages in case of unforeseen events (like road closures in case of accidents) it is advisable to prepare scenarios for all sorts of situations that can occur, and to have a control system that can handle those scenarios. Also in case of foreseen events the use of prepared scenarios can save a lot of time and possible confusion.
It is almost unavoidable that various simultaneous requests for displaying information on a VMS will be made, while only one message can be displayed. There can be more reasons for wanting messages on a certain VMS, and only one display. This is even more difficult when more authorities are involved, who all have their own interests. For instance a city might want to indicate traffic delays towards the centre, while displaying travel time information on a ring road is also relevant. For cases like these all parties involved should make clear rules and a priority mechanism should be developed.
Control centres should have a reliable logging of all messages displayed, in order to be able to show exactly what was displayed when and where, in case authorities might want to investigate incidents or complaints.
2.3 Technical Requirements
For technical requirements of VMS the European standard EN 12966 can be used; in many countries compliance with this standard is even obliged. This standard contains performance requirements and test methods for both visual and physical properties of VMS. The purchaser can choose from various performance classes for properties like colour, luminance, contrast and beam width. This should be done based on the perceived use of the VMS. The requirements for luminance (light output) will for instance be higher for use on motorways than for use in a city, while on the other hand the beam width needed will be bigger in city circumstances because a wider viewing area will be needed there. The annexes of this standard also give guidance on graphics, dimensions and on making sensible choices for (combinations of) performance classes.
For text fonts used on VMS, care should be taken in choosing the font. Standard text fonts are not always suited for VMS, because the radiation of the light emitting elements can easily seem to close gaps (in letters like a, e etc.) that are too small. Some special fonts have been developed for use on VMS for this reason.
As to the use of colours, some VMS use just one colour like yellow (amber) or white. When traffic signs are shown in the pictogram area, at least red should be available too. As LED technology is improving all the time, more and more full colour signs are appearing nowadays. However, care should be taken to use these possibilities sparingly and to make use of more colours only in case this is necessary to make the message better understood.
Most VMS receive their input from a control centre via a communication protocol. An important consideration is whether fonts and/or pictures should be stored in the sign or not. Containing all information in the sign means keeping the communication simple, but it is an enormous reduction of flexibility. A system that makes it possible to download fonts and or pictograms to the sign gives more flexibility, while for full matrix displays sending complete bitmaps gives maximum freedom.
2.4 Common Look & Feel
2.4.1. Principles of design: significant, general and specific
VMS message harmonisation is reached when the messages which are displayed have the same meaning and look the same or similarly to all partners involved in the harmonisation process. The European reality, 23 official languages in the EU, 22 MS involved in the EASYWAY programme, directly points to a VMS message harmonisation based on the pre-eminence of internationally understood pictograms and focused on the European Common Space (TERN). This is the main principle and determines the rest of the sub-principles of the design: principles that lead to more international (less text dependent) VMS messages. Following the 1968 Convention and sharing the common icons of that catalogue is a priority recommendation as well.
The absolute goal of ESG4 is working towards shareable, international VMS displays. The elementary informative elements (pictograms, abstract alphanumeric characters, abbreviations, etc.), the main structures for text configuration, the combination of pictograms and text, all must follow design principles that maximize that main goal.
13
ESG4 – VARIABLE MESSAGE SIGNS HARMONISATION
VMS-DG01 – PRINCIPLES OF VMS MESSAGES DESIGN
COORDINATORS: ALBERTO ARBAIZA & ANTONIO LUCAS-ALBA
ew-dg-2012_vms-dg01_principlesofvmsdesign_02-00-00.docx 31/12/2012 13/60
But working only on general principles of VMS design is not enough. Translating general recommendations of design into messages displayed on different types of VMS used across Europe is another item that should be considered. This idea made us consider four main VMS types using pictograms: pictogram-text (traditional), pictogram-pictogram-text , pictogram-text-pictogram , and full matrix . Eventually, text-only VMS were also included. Obviously, text-only VMS have a local applicability (they lack pictograms, the international element par excellence) but text structures and probably some simple alphanumeric could be harmonised as well. General design principles for VMS are the main issue of this guideline.
The international harmonisation of Variable Message Signs critically depends on signing strategies that rely on pictograms and abstract characters. This statement takes form in the most general principle within this DG01:
THE SIGNIFICANT PRINCIPLE
The catalogue in the 1968 Convention on Road Signs and Signals[2] and the recommendations in the Consolidated Resolution on Road Signs and Signals (RE.2, November 2008), should provide the basis for the pictograms to be used.
The Significant Principle concerns all Deployment Guidelines developed within the EasyWay frame, adopting the following fundamental form:
“The display of signs/pictograms on VMS or other end-user devices should be in accordance with prevailing national road codes and where applicable be in line with the requirements of the EW-DG for Variable Message Signs Harmonization VMS-DG01:
• MS which ratified the 1968 Convention MUST respect the 1968 Convention and SHOULD consider the Consolidated Resolution on Road Signs and Signals (R.E.2);
• MS which did sign but not ratify the 1968 Convention SHOULD follow the 1968 Convention and also consider the R.E.2.
It is up to the deploying road operator to ensure that real signs are well and widely understood by the road users.”
2.4.2. General principles of design
The design principles for messages on VMS are divided into 6 categories:
1. Considerations that should be made before using VMS
2. The use of pictograms
3. The use of alphanumeric elements
4. Strategies in relation to certain road/traffic events
5. The use of regulatory messages
6. Specific principles of design
2.4.2.1. First issue: considerations for operators before using VMS
Something to consider: Switched on/switched off Every time drivers see a VMS switched on, they will be invited to read the message displayed. If the information provided is frequently useless, or absurd, drivers will start to disregard the VMS messages, or consider the information as not important (“congestion as always”, “travel times as always”) or read the message only partially. But then drivers might not be prepared when it is really necessary to read a message. The result: a well VMS-furnished road but a more dangerous road network (see Annex 1).
PRINCIPLE 1.1
VMS should only be used for the management of temporary events.
PRINCIPLE 1.2

14
ESG4 – VARIABLE MESSAGE SIGNS HARMONISATION
VMS-DG01 – PRINCIPLES OF VMS MESSAGES DESIGN
COORDINATORS: ALBERTO ARBAIZA & ANTONIO LUCAS-ALBA
ew-dg-2012_vms-dg01_principlesofvmsdesign_02-00-00.docx 31/12/2012 14/60
VMS should only be used to display relevant road/traffic information. An exception could be the display of a dot, or the time, to indicate that the VMS is operational.
The use of campaign messages: consider secondary effects on the whole VMS system Following the previous point we should be careful with the information displayed on VMS (which type, how frequently). We have to avoid displaying information that is unnecessary or irrelevant, i.e., not directly related to mobility and/or safety goals.
However, some road operators use VMS as a complementary mass medium. We see VMS displaying generic road safety information, sometimes linked to safety campaigns. If, for whatever international, national or local reasons this is done, some measures should be adopted. The quality and organisation of the informative elements displayed should help drivers to distinguish at which type of information they are looking.
PRINCIPLE 1.3
Campaign messages should not use pictograms and the text should be centred to help distinguish them from higher priority messages If campaign messages are nevertheless displayed: some recommendations Road safety campaign messages, if used, should follow certain recommendations.
PRINCIPLE 1.4
Campaign messages are of low priority, and should be overwritten when higher priority messages are required
PRINCIPLE 1.5
Campaign messages should be avoided on VMS immediately in advance of a VMS displaying critical traffic related information.
PRINCIPLE 1.6
Campaign messages should follow certain restrictions: not in dangerous situations (e.g., low visibility) and during an appropriate time scale.
PRINCIPLE 1.7
Campaign messages should always support a specific road safety campaign, and should not be displayed unless they are part of a wider communications strategy
Limit the number of informative units per message A VMS will communicate a message efficiently if it is readable, considering both the distance between the driver and the VMS and the time he/she has to read it. We assume here that the corresponding standards have been followed by VMS manufacturers and that the driver has the right visual acuity (see Annex 2 in Part B, point 3.3). Such requisites are important as they determine two fundamental questions: the reading distance that should be established and the number of information units that can be read in the time available.
VMS display a number of information elements such as pictograms, abstract signs, numbers, words (e.g. descriptors, a toponym) and abbreviations. Such elements are clustered into coherent informative segments or information units (IU). An information unit may be described as the answer we obtain for a question that is meaningful to drivers [3, 4]. For example, if I ask to myself “What happens?” or “What should I do?” the first question could be answered with “congestion” or “strong wind” and the second could be answered with “slow down” or “take exit A-23”. An information unit may be made by one or several words or pictograms. In order to ensure intelligibility, information units are normally placed in the same line on the VMS, thus helping a coherent read.
PRINCIPLE 1.8
To ensure they are safe to read, VMS on high speed roads (e.g., >100km/h) should not display more than 4 information units per message.

15
ESG4 – VARIABLE MESSAGE SIGNS HARMONISATION
VMS-DG01 – PRINCIPLES OF VMS MESSAGES DESIGN
COORDINATORS: ALBERTO ARBAIZA & ANTONIO LUCAS-ALBA
ew-dg-2012_vms-dg01_principlesofvmsdesign_02-00-00.docx 31/12/2012 15/60
The need to avoid redundancy Drivers have limited time to comprehend a message: unnecessary terms should be avoided, including redundant terms. If we want drivers to read the whole information twice, we should facilitate this. The only exception to such a rule is the educational use of text on a temporary basis [5] i.e. additional text to support certain pictograms that are new or whose meaning is not clear (See Annex 3).
PRINCIPLE 1.9
The meaning of a pictogram should not also be shown in text in a VMS message, unless required to educate drivers as to the meaning of a new pictogram.
Alternating messages VMS are displayed on high speed roads where reading time is limited. Only in certain critical situations the use of alternating VMS (i.e. complete messages on a single VMS that alternate) is an adequate option, after making sure that drivers enjoy sufficient reading time (e.g., 2-3 seconds per alternate message) and no other option is available.
PRINCIPLE 1.10
Alternating messages on VMS should be avoided, as they are a potential distraction to drivers.
Flashing, blinking and scrolling messages on VMS This guideline suggests ways to differentiate between immediate dangers and other, less urgent, traffic situations (see 4th issue: location formulations, principles 4.1, 4.2). Flashing lights on VMS should be used with caution, exceptionally and precisely because by using flashing lights in conjunction with VMS messages, we introduce a particular category to drivers: “messages that really are important” (with flash) vs. “other messages”. Not every VMS is equipped with flashing lights, so harmonisation is difficult.
PRINCIPLE 1.11
Flashing lights should only be used under critical circumstances and for a reduced set of road/traffic events for safety reasons.
Flashing lights or other movement (blinking, scrolling) are meant to attract attention to the information displayed. However, this often reveals a poor use of the signing devices (switching on variable devices should be enough, see Annex 4).
PRINCIPLE 1.12
Blinking and scrolling effects should be avoided on VMS.
2.4.2.2. Second issue: the use of pictograms on VMS
The selection of the main pictogram: a critical issue The pictogram is the main informative element in the whole communication chain, as it synthesizes complex road/traffic situations, can be read from a distance twice as far as the text and makes use of a potentially universal language: pictures [6]. The main pictogram will determine a) which complementary informative elements (alphanumeric characters, secondary pictograms, text) will be used and so b) the resulting informative structure of the VMS.
Two basic features determine the adequacy of pictogram selection in a given context: specificity and orientation to action. When designing a VMS message, specific pictograms (e.g. road works) should have pre-eminence over more generic alternatives (e.g. generic danger) because they transmit more information themselves and need less complementary text. Similarly, pictograms that are Consequence-oriented (e.g., congestion) should have priority over cause-oriented ones (e.g. accident) because telling or orienting (any international) drivers about what to do is more important than telling them why. Normally, consequence-oriented pictograms are also highly specific ones (see Annex 5).

16
ESG4 – VARIABLE MESSAGE SIGNS HARMONISATION
VMS-DG01 – PRINCIPLES OF VMS MESSAGES DESIGN
COORDINATORS: ALBERTO ARBAIZA & ANTONIO LUCAS-ALBA
ew-dg-2012_vms-dg01_principlesofvmsdesign_02-00-00.docx 31/12/2012 16/60
PRINCIPLE 2.1
When available, a pictogram should be the main element of the message.
PRINCIPLE 2.2
Consequence-oriented pictograms should have priority over cause-oriented ones.
PRINCIPLE 2.3
Specific pictograms should have priority over generic ones.
VMS that display more than one pictogram: considering priorities Distinguishing between causes and consequences is sometimes difficult. An accident may be the cause of congestion (consequence). But congestion may be the cause to display a speed limit (consequence). Regulatory pictograms are the most consequence oriented ones. The consequence of the pictogram is clear: do what it requests. Danger warning signs demand more generic actions (e.g., be attentive, slow down, mind the hard shoulder, etc). According to this, when two pictograms are available for managing a road/traffic situation the regulatory pictogram(s) should go first, then danger warning pictograms and then informative (see Annex 5).
But there is another fundamental parameter to take into account, the VMS layout itself. Some VMS show two pictograms and text, others show pictogram-text-pictogram, others may be totally flexible. This is solved following the same rationale. In any VMS message there is a main, coordinated set of pictogram-and-text that should be optimised, minimising the use of text. Supra-linguistic elements should be used in order to promote comprehension at the international level. This coordinated set of pictogram-and-text (PICTO+) is what really counts besides the particular features of each layout (see Annex 6 and principle 6.1 below).
PRINCIPLE 2.4
There is a functional hierarchy in VMS messages: first regulatory, then danger warning, then informative, and pictograms should be selected accordingly.
Including new and/or re-designed pictograms One of the main problems is the lack of pictograms for all road/traffic situations that require them. Some new designs have recently been suggested in the Consolidated Resolution on Road Signs and Signals [7] (see Annex 7). Also the revision of current signing practices in the Working Book (2011) will possibly yield some alternatives that will be subject to (empirical) scrutiny by ESG4 in the near future (see point 3.2 in Part B).
2.4.2.3. Third issue: the use of alphanumeric elements on VMS
Organising informative elements within the alphanumeric (text) area The Framework for a Harmonized Implementation of VMS in Europe or “FIVE” (1997-2004) is a principal European reference in terms of variable signing [8]. FIVE proposes for danger warning messages, which are the most frequently used on VMS, that the first text line shows information concerning the nature of event, the second text line distance or length, and the third line information concerning the cause of the event or a piece of advice.
However, this is too generic in terms of what can be considered the nature and/or the cause of the event. Secondly, it is not flexible enough considering the diversity and size of location formulations for distance or length and combinations. Thirdly, it is somehow unrealistic in terms of the place that each category (nature, location, advice, cause) should occupy on the VMS i.e. the number of characters per line would need to be very high in order to keep to this order strictly and without variations.
To address these issues, this Guideline adopts the following three rules (see Annex 8):
1. Arrange the information according to an order (not according to a fixed location).
2. Distinguish between consecutive cause-event (e.g., accident-then-congestion) and simultaneous cause-event (e.g., snowing and slippery road).

17
ESG4 – VARIABLE MESSAGE SIGNS HARMONISATION
VMS-DG01 – PRINCIPLES OF VMS MESSAGES DESIGN
COORDINATORS: ALBERTO ARBAIZA & ANTONIO LUCAS-ALBA
ew-dg-2012_vms-dg01_principlesofvmsdesign_02-00-00.docx 31/12/2012 17/60
3. Length may sometimes be seen as part of the event itself. For example, congestion of 15 kilometres. Hence, we face a 15 km length congestion…
Figure 2: Ordering of information units. An example of a standard VMS display selection
PRINCIPLE 3.1
The Information Units (IU) should be placed on the VMS following a recommended order that depends on message type i.e. Information Unit 1–Main Event; Information Unit 2–Location; Information Unit 3–Advice; Information Unit 4-Cause of the Event.
POSITION
ON VMS ESG4 RECOMMENDATIONS FOR MESSAGE TYPE
REGULATORY DANGER WARNING REPORTING DANGER
OR INFORMATIVE
Inf. Unit 1 E (a pictogram suffices) E E2
Inf. Unit 2 (L) L L
Inf, Unit 3/4 (C) A/C A/C
Table 2: Recommendations for locating information units in different signing functions in VMS (E = main Event, L = Location, A = Advice or Additional information, C = Cause of event)
PRINCIPLE 3.2
For causes and events that are simultaneous, the informative element describing the cause and supporting the main pictogram should be placed at the start of the text area as part of Information Unit 1. For causes and events that are consecutive, the informative element describing the cause should be placed as Information Unit 3.
Hence, simultaneous causes-events (e.g., slippery road caused by ice, snow, oil spillage, and the like) would be displayed placing the pictogram (slippery road) and the cause (e.g., oil spillage) in the first text line (Information Unit 1). Consecutive causes-events (e.g., congestion caused by an accident, lane closure, and so on) would be displayed placing the pictogram (congestion) and the cause (e.g., accident) in the third line (Information Unit 3).
PRINCIPLE 3.3
If used, the quantitative length should be placed in the Information Unit 1 in order to integrate pictogram and additional information (such case includes the possibility of displaying length just below the pictogram).
Recommended European terminology and abbreviations – “Europeanisms”
Ideally, pictograms and abstract alphanumeric characters (e.g. an arrow) or (nearly) universal text (numbers, abbreviations, short terms) would allow for VMS to be read by anybody. We may distinguish between two
2 Note that in text-only VMS the location shall be placed first, followed by the event.

18
ESG4 – VARIABLE MESSAGE SIGNS HARMONISATION
VMS-DG01 – PRINCIPLES OF VMS MESSAGES DESIGN
COORDINATORS: ALBERTO ARBAIZA & ANTONIO LUCAS-ALBA
ew-dg-2012_vms-dg01_principlesofvmsdesign_02-00-00.docx 31/12/2012 18/60
types of simplifications: standardised international abbreviations (table 3) and short terms, symbols or non-standard abbreviations (table 4).
CONCEPT ABBREVIATION
Kilometre/kilometres
Metre/metres
Hour/hours
Minute/minutes
Ton
Kilogram
KM or km
M or m
H or h
MIN or min
T or t
KG or kg
Table 3: Standard abbreviations
On VMS messages the better comprehended and shorter terms, symbols and non-standard abbreviations should be used. Abbreviations are normally written with the same font as the abbreviated word (Her Majesty, H.M.; example gratia, e.g.), although using both is not infrequent. Most abbreviations can be written in lower case even in rudimentary VMS with 5x7 pixels per character, as it is already common with travel times (min)3.
CONCEPT SHORT TERMS, SYMBOLS
Equal
Exit
Information
Parking
Park-and-Ride
BUS
By way of, through
=
i
P
P+R
BUS
VIA or via
Table 4: Short terms, symbols and non-standard abbreviations
PRINCIPLE 3.4
Graphical elements should be used when possible (e.g. pictograms, symbols).
For indicating the length (of, for instance, road works, or a queue) ESG4 tests showed that a simple equal sign (=) is very well understood.
PRINCIPLE 3.5
Only well-known symbols and international abbreviations should be used (see table 3 and 4).
2.4.2.4. Fourth issue: strategies to locate road/traffic events
The issue of distance on posted danger warning signs and on VMS VMS may say something about potential dangers that are very near (say 500m) but also about dangers that happen quite far away (e.g. beyond 5km). So we should ensure to give drivers appropriate keys to decipher
3 A more detailed account of what the SOMS Project call “Europeanisms” may be found in [15]

19
ESG4 – VARIABLE MESSAGE SIGNS HARMONISATION
VMS-DG01 – PRINCIPLES OF VMS MESSAGES DESIGN
COORDINATORS: ALBERTO ARBAIZA & ANTONIO LUCAS-ALBA
ew-dg-2012_vms-dg01_principlesofvmsdesign_02-00-00.docx 31/12/2012 19/60
which messages require immediate and special attention, direct and unavoidable, and which messages require just awareness of the situation that may or may not apply to his/her trip (e.g., he/she may deviate or stop before reaching that point, see Annex 9):
• Limiting the anticipation range for danger. Using danger warning on VMS (with red triangle) only when dangerous events are near. With 120km/h speed flows “near” could be approximately between 0 and 5km, or between 0 and 2.5 minutes.
• Not specifying distance on the panel. Better not let drivers calculate how near the danger is but use warning pictograms (i.e. those with red triangles) in case the danger is soon, or close.
• Support formally the distinction between danger warning and reporting danger. Danger warning displays have a clear format (a traffic sign framed by a red triangle). The proposal is to preserve the standard warning sign for events that are close (< 5km) and not to use a red triangle for events that are far from the VMS (i.e. > 5km).
Tests carried out by ESG4 clearly show that the use of a square box, instead of a triangle, around well-known pictograms hardly influences its comprehension. Furthermore, the interpretation of symbols in a square box is much less associated with “warning” than its counterpart in a triangle. Some well-known signs in square box are already part of the R.E.2.
For drivers to be able to distinguish between these two situations, we need to provide them with the adequate categorisation elements, with the characteristics that allow them to determine if the situation belongs to one set or the other. The two characteristics are:
• Graphical representation of danger: with or without red triangle.
• Indication of specific distance to event: absent or present.
Locating road/traffic events: space and time-based formulations Space-based location formulations are the most common in road information: distance, length and distance-length combinations. Recommendations are given in Table 5. This table articulates three main parameters:
Traffic events vs. weather related events. Road works or congestion can be located with a different accuracy than wind or fog. The recommended space-based location formulations should consider this and give a practical range of applicable formulations according to traffic vs. weather events.
Far, near, within. The position of the VMS with respect to the event itself is essential, particularly for road safety. Provided that near events are informed consistently (distance range) drivers should learn to expect the event soon after the VMS and increase attention accordingly. This is why too accurate formulations are avoided: not using distance at all, giving a range with a generic origin (“until location A”) and using certain advice (slow down, moderate speed) should accustom drivers to care and worry about safety parameters. Location formulations for VMS within the event follow similar premises.
Events that are far away from the VMS allow for a broader set of location formulations (i.e., quantitative and qualitative formulations). Here the main concern is increasing possibilities for traffic managers dealing with mobility issues.
Quantitative and qualitative formulations. Ideally all formulations would be accurate and based on numbers (quantitative). However when road operators cannot technically and operatively assume such specific formulations, qualitative formulations (i.e., broad topological indications) are used instead.
PRINCIPLE 4.1
Danger warning signs should be used on VMS to warn about events that are near (e.g., between 0 and 5 km, which equals 0 to 2.5 minutes when driving at 120km/h).
PRINCIPLE 4.2

20
ESG4 – VARIABLE MESSAGE SIGNS HARMONISATION
VMS-DG01 – PRINCIPLES OF VMS MESSAGES DESIGN
COORDINATORS: ALBERTO ARBAIZA & ANTONIO LUCAS-ALBA
ew-dg-2012_vms-dg01_principlesofvmsdesign_02-00-00.docx 31/12/2012 20/60
Pictograms reporting danger (i.e., without red triangle) should be used on VMS to inform about dangerous events that are far (i.e. beyond 5 km, which equals 2.5 minutes or more when driving at 120 km/h).
PRINCIPLE 4.3
The indication of specific distance to an event or its location should only be present on signs reporting danger (i.e., displayed before dangerous events that are far), following the format in table 5.
PRINCIPLE 4.4
The set of location formulations used should be adjusted as required to the different nature of traffic and weather related events (see table 5).

21
ESG4 – VARIABLE MESSAGE SIGNS HARMONISATION
VMS-DG01 – PRINCIPLES OF VMS MESSAGES DESIGN
COORDINATORS: ALBERTO ARBAIZA & ANTONIO LUCAS-ALBA
ew-dg-2012_vms-dg01_principlesofvmsdesign_02-00-00.docx 31/12/2012 21/60
Distance to Road/Traffic Event
Example
Suggested formulation when the VMS is…
FAR NEAR WITHIN
QU
ALI
TATI
VE
Warning LOCATION FORMULATION
YES YES*
Position (IN) LOCATION A
YES e.g. (IN) GRACELAND
Length (TO) LOCATION A
YES YES YES e.g., (TO) GRACELAND
Distance-length
(FROM) LOCATION A (TO) LOCATION B
YES e.g. (FROM) GRACELAND
(TO) GRACEWOOD
(AFTER/FROM) LOCATION A
YES e.g. (AFTER/FROM) GRACELAND
Approximate
position
(IN THE DIRECTION OF)LOCATION /REGION
YES e.g. (IN THE DIRECTION OF) GRACELAND
(IN) ROAD No.
(TOWARDS) LOCATION /REGION
YES e.g. (IN) ROAD 321
e.g. (TOWARDS) GRACELAND
QU
AN
TITA
TIV
E
Distance (ON) X KM
YES e.g. (ON) 10 KM
Length
(FOR) X KM
↑X KM↑
= X KM
YES+ YES+ YES+ e.g. (FOR) 10 KM
e.g., ↑10 KM↑
e.g. = 10 KM
Table 5: Location formulations for VMS that are far/near/within traffic/weather related events. [* Cells that apply only to weather related events.] [+ Cells that apply only to traffic related events]4
Time-based formulations Time-based information has increasing importance for informing about the traffic situation.
Two approaches can be distinguished in practice, displaying travel times and/or delay times5. Travel times may or may not indicate traffic flow problems, whereas delay times always point to some problems (normally
4 Note that also low case fonts can be used for location formulations
5 Due to the lack of sufficient experience, at the present time there are no specific formulations for delay times that can be recommended internationally.

22
ESG4 – VARIABLE MESSAGE SIGNS HARMONISATION
VMS-DG01 – PRINCIPLES OF VMS MESSAGES DESIGN
COORDINATORS: ALBERTO ARBAIZA & ANTONIO LUCAS-ALBA
ew-dg-2012_vms-dg01_principlesofvmsdesign_02-00-00.docx 31/12/2012 22/60
congestion). The key issue here is accuracy and technical capabilities. When travel times cannot be registered and informed about with accuracy, the operator may resort to more coarse estimations (e.g., 20 minutes more, due to congestion). The specific categories of delays used will differ according to the specific characteristics of the road infrastructures (length, existing alternatives). Cognitive manageability of circumstances for the human actor should also be considered. Drivers will easily use a few and basic categories (e.g., 20 min, 40 min, 1 hour, more than 1 hour of delay) to deal with the road environment (see Annex 10).
The main informative elements on travel times displays are:
• Referent location. It may be a location based on city names, meaningful points (bridges, tunnels, borders, countries) and also on road or exit/junction names (or numbers). Some countries, notably
Sweden and the Netherlands substitute the exit name with an abstract pictogram ( ). The advantage is that VMS using 5x7 text boxes may use that sign occupying just two characters, i.e. it may be standardised all over.
• Time unit. Normally minutes (min) and less frequently hours (h) or hours and minutes together.
• Location-time spread. The information concerning location and time should be separated and ordered (i.e. listed), to ensure faster recognition and readability.
• Titling. Some formulations do not use a title. Others frame the travel time formulations with titles as “Expected time”, “To City A”, “To ring road”, etc.
PRINCIPLE 4.5
If reliable timings are not available, it should be considered displaying more general information (e.g. 30 minutes, 45 minutes, one hour, etc.).
PRINCIPLE 4.6
Travel times should be built up according to basic informative units and structures
The basic travel time structures are:
• Correspondence times. They are shown by listing a number of locations and the corresponding travel time estimations (in minutes, hours).
POSITION ON VMS CORRESPONDENCE TIMES EXAMPLE
Line 1 LOCATION A XX min GRACELAND 35 min
Line 2 LOCATION B YY min GRACEWOOD 40 min
Line N (…) (…)
Table 6: Recommendations for displaying information on correspondence times
• Optional routing. In this case travel times for two routes to the same destination are displayed (see Annex 10).

23
ESG4 – VARIABLE MESSAGE SIGNS HARMONISATION
VMS-DG01 – PRINCIPLES OF VMS MESSAGES DESIGN
COORDINATORS: ALBERTO ARBAIZA & ANTONIO LUCAS-ALBA
ew-dg-2012_vms-dg01_principlesofvmsdesign_02-00-00.docx 31/12/2012 23/60
POSITION
ON VMS OPTIONAL ROUTING EXAMPLE
Line 1 (TO) LOCATION A GRACELAND
Line 2 VIA ROAD A XX min VIA A-1 35 min
Line 3 VIA ROAD B YY min VIA B-1 45 min
Table 7: Recommendations for locating information on optional routing
Locating road/traffic events: pre-announcements The organization of the road network is normally tied to circumstances tactically related to space (e.g. the exit 145, 15 km away, is blocked), but it can also be linked to circumstances strategically related to time (e.g.: road works here tomorrow). Pre-announcements linked to time allow drivers that participate in frequent and dense traffic flows (e.g. commuters) to explore and decide on alternative routes.
PRINCIPLE 4.7
Information in pre-announcement messages should be displayed according to the following order. Information Unit 1 – Time referent; Information Unit 2 – Location-Situation; Information Unit 3 – Event; Information Unit 4 -Advice or additional information
POSITION
ON VMS PRE-ANNOUNCEMENTS EXAMPLE
IU 1 TIME REFERENT (WHEN)6 Next week
IU 2 Location-Situation (WHERE) A-13 Closed
IU 3/4 Event/Advice or additional Info (WHY/WHAT)
Road works
Table 8: Recommendations for locating information units in pre-announcements
2.4.2.5. Fifth issue: the use of regulatory messages
Before imposing restrictions by means of VMS, some basic conditions should be checked, and some parameters known:
First criterion: Functional adequacy of the regulatory function
Before displaying regulatory messages on VMS we should first make sure that this will really solve our road/traffic situation, i.e. that if drivers behave according to displayed regulations (e.g., reducing speed, keeping certain distance between vehicles, etc.) our traffic problem will be solved adequately, in the expected way.
Second criterion: Possibility to quantify the magnitude of regulations
6 Note that a specific order on the placement of informative units, according to the particular traffic context of pre-announcements, is recommended.

24
ESG4 – VARIABLE MESSAGE SIGNS HARMONISATION
VMS-DG01 – PRINCIPLES OF VMS MESSAGES DESIGN
COORDINATORS: ALBERTO ARBAIZA & ANTONIO LUCAS-ALBA
ew-dg-2012_vms-dg01_principlesofvmsdesign_02-00-00.docx 31/12/2012 24/60
The second step is making sure that we can clearly specify the magnitude (time, place, distance, length, etc.) of the specific regulation applied. Examples could be headway distance (when to start, what distance, for how long), speed limit (which one, beginning, length), compulsory use of snow chains (time, road section), etc.
Third criterion: Enforcement
Enforcement determines our capacity to efficiently and credibly manage the collective response to the regulations displayed. If drivers perceive that regulations are not necessary, they may violate them or may try to adapt regulations to their personal criteria. If, in addition, drivers see no enforcement they might not obey the message.
If these criteria are accomplished, it is adequate to display regulatory messages on VMS. Otherwise, danger warning or recommending are better options (see Annex 11).
PRINCIPLE 5.1
Regulatory VMS messages should only be used when at least the two first criteria (functional adequacy and quantification), can be successfully accomplished. The compliance rate could be increased by a further basic criterium – the enforcement
VMS may combine and display different sorts of information. Regulatory messages, however, are meant to be simple and specific, including the appropriate pictogram and some basic, additional information (e.g., weight, width, height or length of trucks). Besides these elementary pieces of information, we should avoid adding more information using complementary text (e.g., explanatory text).
PRINCIPLE 5.2
Regulatory messages should be used without any additional text, if possible
Some regulatory pictograms include some text (e.g., numbers, km, m, T). Such text belongs to the pictograms intrinsically and it is not what we consider additional here.
2.4.3. Specific principles of design
When VMS are showing more than one pictogram (i.e., pictogram-pictogram-text VMS, pictogram-text-pictogram VMS or full matrix VMS) the position each pictogram will occupy on the VMS should be considered. Each specific VMS device constrains both the content and structure of the messages displayed to a certain extent.
The fundamental issue here is the way each VMS message is read (see Annex 12). We read from left to right, and from top to bottom. Normally the main pictogram is accompanied by complementary information referring to this main pictogram. The second pictogram should not interfere in the meaning of the first. It is just a complementary pictogram.
PRINCIPLE 6.1
Pictograms on Pictogram-Text-Pictogram and Pictogram-Pictogram-Text VMS should be placed following these two criteria:
• Pictograms are placed according to priority: 1st Mandatory pictograms, 2nd Danger warnings, 3rd Reported danger, 4th Other informative pictograms.
• The pictogram with the highest priority is placed immediately to the left of the text. This is the left hand (first) pictogram in case of Pictogram-Text-Pictogram VMS, and the right hand (second) pictogram in case of a Pictogram-Pictogram-Text VMS.

25
ESG4 – VARIABLE MESSAGE SIGNS HARMONISATION
VMS-DG01 – PRINCIPLES OF VMS MESSAGES DESIGN
COORDINATORS: ALBERTO ARBAIZA & ANTONIO LUCAS-ALBA
ew-dg-2012_vms-dg01_principlesofvmsdesign_02-00-00.docx 31/12/2012 25/60
2.5 Level of Service Definition
2.5.1 Preliminary remark
The scope of EasyWay is to provide Core European Services to the European road users. These services are harmonized in content and functionality, but also in their availability: The road users shall be able to expect certain services in a specific road environment. In order to provide a basis for the harmonization process EasyWay needs a tool to define such environments in an agreed manner. This tool is the Operating Environments – a set of pre-defined road environments combining physical layout of the road and network typology with traffic characteristics.
In essence, EasyWay has agreed on a set of 18 pre-defined Operating Environments (OE) where each OE is a combination of three criteria:
• Physical characteristics – Motorways, other 3/4 lane roads or 2-lane roads
• Network typology – Corridor, Network, Link or Critical spot
• Traffic characteristics – Traffic flow and road safety situations (with optional additions)
For more information and details, visit http://www.easyway-its.eu/document-center/document/open/490/ and download the Guidance for Classifying the EasyWay Network into OE ver. 1.0.
2.5.2 Level of Service Criteria
The VMS management in itself is not a real service, but a tool to provide services in the different fields: Traveller Information, Traffic Management, Freight and Logistics. Therefore it does not appear very appropriate to define a level of service for VMS, while clearly their European harmonization can give a good contribution to the level of the above mentioned different services.
However some parameters can be identified characterising the effectiveness of the VMS messages, and some suggestions given for their implementation and management as general guidelines for road operators:
Below such parameters and recommendations are reported in summary, considering that the compliance with these issues determines, in a certain sense, the level of impact on the related different services:
• About quantity and location, a VMS should always be available along the interested road or motorway road before each “decision” point (entrances, exits, main parking and service areas, links to other roads/motorways, etc.).
• About quality, various aspects are significant:
o Visibility at the right distance (size of pictograms and/or texts and technology used)
o Correct number of information units
o Timely and complete information (depending on TCC, monitoring systems, telecom infrastructure, operations organization, data exchange, etc.)
o Coherence with other information tools (radio, TV, internet, on board units)
• In general, European harmonization is the core target, i. e. observance of the principles described in previous chapters.

26
ESG4 – VARIABLE MESSAGE SIGNS HARMONISATION
VMS-DG01 – PRINCIPLES OF VMS MESSAGES DESIGN
COORDINATOrs: ALBERTO ARBAIZA & ANTONIO LUCAS-ALBA
ew-dg-2012_vms-dg01_principlesofvmsdesign_02-00-00.docx 31/12/2012 26/60
2.5.3 Level of Service Criteria related to Operating Environment
As no formal level of service exists also the relationship to the operating Environment is not applicable and the direct correspondence to Operating Environment has to be found in the Guidelines for the services making use of VMS.
Nevertheless here as well we can consider and suggest, in general, that as more critical the operating environment is (high traffic, trucks relevance, weather problems, etc.), the more important the correct and timely utilization of VMS and the observance of the given recommendations become.

27
ESG4 – VARIABLE MESSAGE SIGNS HARMONISATION
VMS-DG01 – PRINCIPLES OF VMS MESSAGES DESIGN
COORDINATORS: ALBERTO ARBAIZA & ANTONIO LUCAS-ALBA
ew-dg-2012_vms-dg01_principlesofvmsdesign_02-00-00.docx 31/12/2012 27/60
3 Part B: Supplementary Information EasyWay Deployment Guidelines are twofold:
• Part A elaborates on the content of the ITS service addressed, including the entire deployment framework including Requirements and Levels of Services.
• Part B is an appendix of educational content. Its objective is to illustrate part A with examples and feedback from deployments in the field.
This lively chapter is subject to continuous development and update. It consists in a database of national practices and experiences which, as cross-fertilisation material, can benefit any road operator in Europe.
Bearing in mind the cyclic nature of the elaboration of EasyWay Deployment Guidelines, one can assume that the first edition of the 2012 Guidelines will not yet include users’ experience on its content. Forthcoming ITS deployments based on part A of this Deployment Guideline will generate feedback which will in-turn be integrated into the next revised version of part B.
3.1 Examples of deployment
The influence of DG01 is permeating practice and internal regulations in the different countries belonging to ESG4. More specifically, Italy is currently preparing a legal frame concerning VMS use, drawing on the contents and experience of DG01. Even countries not directly involved with ESG4, like Romania, seem to take it as a reference for near future implementations. However, the Spanish Traffic Administration is to date the more compromised example in terms of the application of DG01. DGT-Spain has led the ESG4-Mare Nostrum project since 2003.
3.1.1 Examples of implementation of DG01 in Spain
Context
The Spanish Dirección General de Tráfico (DGT, Directorate General of Traffic) manages a dense VMS network summing nearly 1,600 VMS across seven regional Traffic Control Centres. The great majority of VMS in Spain can show either one or two pictograms. Considering the fact that four official languages co-exist in Spain, harmonising VMS “beyond words” is a European approach that Spain shares too. The early versions of the ESG4 DG01 were soon considered as a tool for instructing DGT VMS operators about the essential aspects concerning VMS use. The Spanish VMS Operators Handbook (October 2008) already included the essential narrative concerning the harmonisation of VMS messages. The 32 general design principles, coming out from such narrative, had not been formulated yet neither in Europe, nor in Spain.
System implemented
On 13 June 2009, DGT brought the first formal version of DG01 to law through the Boletín Oficial del Estado (BOE, nº 143). The legal status of this disposition is very high, all Traffic Control Centres managed by DGT should comply with it, and it is just one step below the Spanish General Road Law concerning not only to DGT, but also to two other regional instances, Servei Català de Trànsit (SCT, Catalonia) and Dirección de Tráfico (DT, Basque Country). DGT manages seven of the nine TCC in Spain, so this disposition is very relevant in terms of the number of users concerned.
Responsible of the implementation/contact
Two DGT Spanish officers, Federico Fernández (DGT Vice-director, Subdirección de General de Gestión del Tráfico y Movilidad) and Alberto Arbaiza (also ESG4 Chair) are directly involved on the implementation described above. The Norm itself is available in the link below (also available in English on request to ESG4 Secretariat/DGT).
http://www.dgt.es/portal/es/normas_legislacion/otras_normas/

28
ESG4 – VARIABLE MESSAGE SIGNS HARMONISATION
VMS-DG01 – PRINCIPLES OF VMS MESSAGES DESIGN
COORDINATORS: ALBERTO ARBAIZA & ANTONIO LUCAS-ALBA
ew-dg-2012_vms-dg01_principlesofvmsdesign_02-00-00.docx 31/12/2012 28/60
Figure 3: Example of implementation of DG01 in Spain
3.1.2 A pictogram reservoir
The recently issued 3rd Edition of the Working Book (2011) shows the real pictograms currently used in 13 countries. Many times pictograms differ, and harmonisation will then need more time and effort. Below follows a list of pictograms extracted from the Working Book considering the most frequent coincidences per road/traffic situation (10 working packages). Most pictograms are well-known, but as it may be seen there is a lot of room for improvement, including the need to innovate through empirical tests.

29
ESG4 – VARIABLE MESSAGE SIGNS HARMONISATION
VMS-DG01 – PRINCIPLES OF VMS MESSAGES DESIGN
COORDINATORS: ALBERTO ARBAIZA & ANTONIO LUCAS-ALBA
ew-dg-2012_vms-dg01_principlesofvmsdesign_02-00-00.docx 31/12/2012 29/60
Figure 4: Pictograms in the 2011 working book (1)

30
ESG4 – VARIABLE MESSAGE SIGNS HARMONISATION
VMS-DG01 – PRINCIPLES OF VMS MESSAGES DESIGN
COORDINATORS: ALBERTO ARBAIZA & ANTONIO LUCAS-ALBA
ew-dg-2012_vms-dg01_principlesofvmsdesign_02-00-00.docx 31/12/2012 30/60
Figure 5: Pictograms in the 2011 working book (2)

31
ESG4 – VARIABLE MESSAGE SIGNS HARMONISATION
VMS-DG01 – PRINCIPLES OF VMS MESSAGES DESIGN
COORDINATORS: ALBERTO ARBAIZA & ANTONIO LUCAS-ALBA
ew-dg-2012_vms-dg01_principlesofvmsdesign_02-00-00.docx 31/12/2012 31/60
Figure 6: Pictograms in the 2011 working book (3)
32
ESG4 – VARIABLE MESSAGE SIGNS HARMONISATION
VMS-DG01 – PRINCIPLES OF VMS MESSAGES DESIGN
COORDINATORS: ALBERTO ARBAIZA & ANTONIO LUCAS-ALBA
ew-dg-2012_vms-dg01_principlesofvmsdesign_02-00-00.docx 31/12/2012 32/60
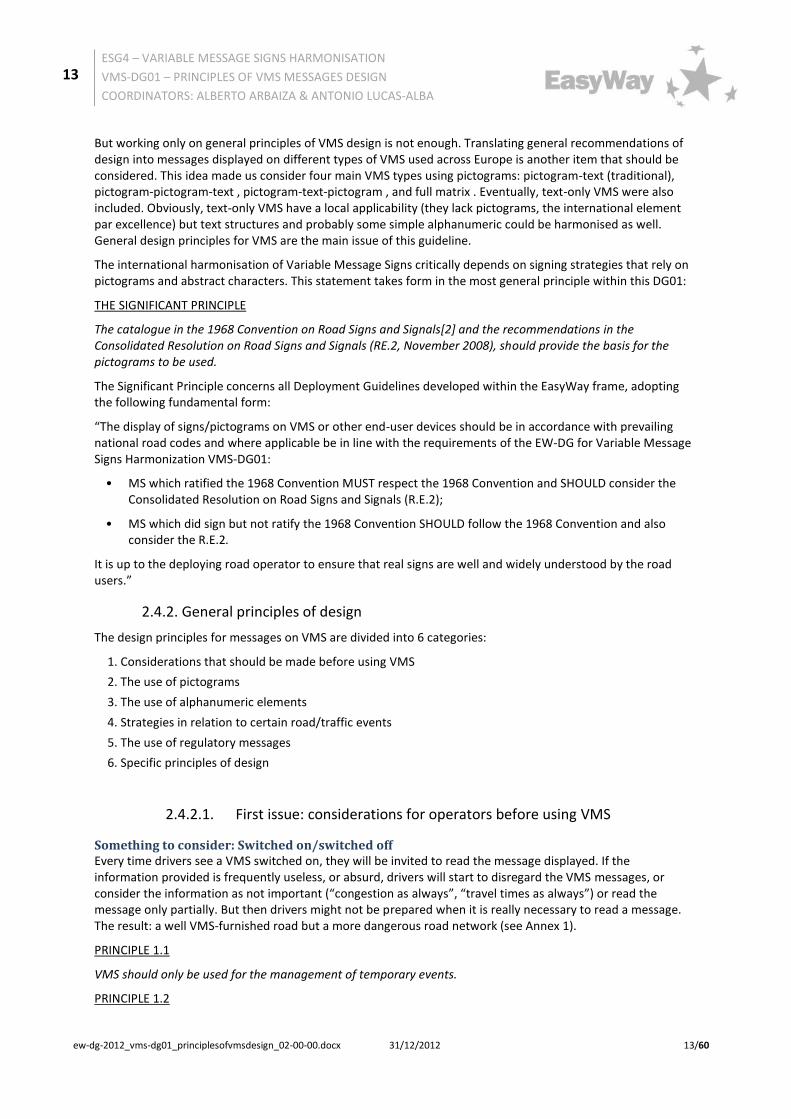
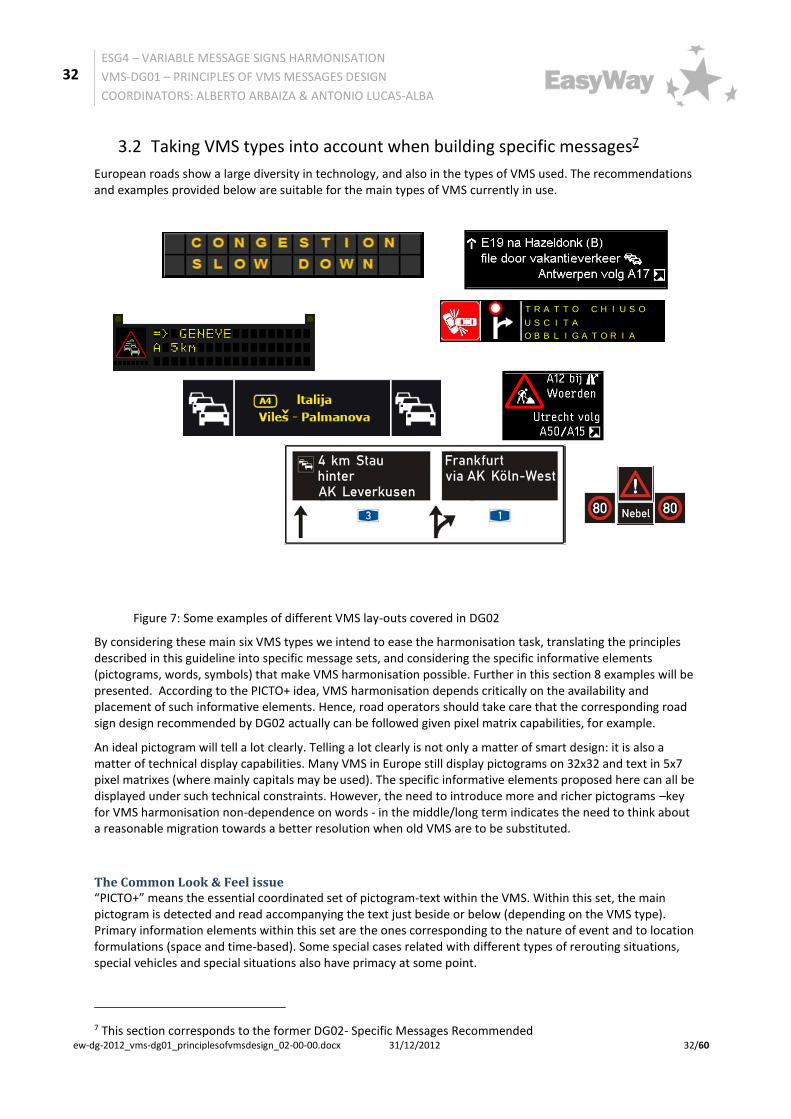
3.2 Taking VMS types into account when building specific messages7
European roads show a large diversity in technology, and also in the types of VMS used. The recommendations and examples provided below are suitable for the main types of VMS currently in use.
By considering these main six VMS types we intend to ease the harmonisation task, translating the principles described in this guideline into specific message sets, and considering the specific informative elements (pictograms, words, symbols) that make VMS harmonisation possible. Further in this section 8 examples will be presented. According to the PICTO+ idea, VMS harmonisation depends critically on the availability and placement of such informative elements. Hence, road operators should take care that the corresponding road sign design recommended by DG02 actually can be followed given pixel matrix capabilities, for example.
An ideal pictogram will tell a lot clearly. Telling a lot clearly is not only a matter of smart design: it is also a matter of technical display capabilities. Many VMS in Europe still display pictograms on 32x32 and text in 5x7 pixel matrixes (where mainly capitals may be used). The specific informative elements proposed here can all be displayed under such technical constraints. However, the need to introduce more and richer pictograms –key for VMS harmonisation non-dependence on words - in the middle/long term indicates the need to think about a reasonable migration towards a better resolution when old VMS are to be substituted.
The Common Look & Feel issue “PICTO+” means the essential coordinated set of pictogram-text within the VMS. Within this set, the main pictogram is detected and read accompanying the text just beside or below (depending on the VMS type). Primary information elements within this set are the ones corresponding to the nature of event and to location formulations (space and time-based). Some special cases related with different types of rerouting situations, special vehicles and special situations also have primacy at some point.
7 This section corresponds to the former DG02- Specific Messages Recommended
T R A T T O C H I U S O
U S C I T A
O B B L I G A T O R I A
Figure 7: Some examples of different VMS lay-outs covered in DG02

33
ESG4 – VARIABLE MESSAGE SIGNS HARMONISATION
VMS-DG01 – PRINCIPLES OF VMS MESSAGES DESIGN
COORDINATORS: ALBERTO ARBAIZA & ANTONIO LUCAS-ALBA
ew-dg-2012_vms-dg01_principlesofvmsdesign_02-00-00.docx 31/12/2012 33/60
Secondary elements are not unimportant, yet not essential. By secondary elements we generally understand advice, causes and general recommendations. The importance of these messages concerns drivers comfort as drivers like to know the causes and complementary information in order to understand out what’s going on.
Some interpretation keys Optional terms are put into brackets. Words, terms or expressions which we could be used optionally on the VMS are indicated using round brackets (…).
Locating informative elements using these Guidelines and building the VMS message
What this section provides are the elements necessary for the message to be built according to the particular operator needs. For obtaining the recommended message one has to know what recommendations are strict (e.g., main pictogram selected, location formulations) and which degrees of freedom are allowed for operators to select and use the corresponding message.
Three main steps will suffice, but before let us remember that, from left to right, we are working with six main VMS types8:
• Warning and/or regulatory signs used in lane-control systems
• Text-only VMS (no pictograms)
• Pictogram-text VMS (only one pictogram and three lines of text)
• Pictogram-pictogram-text VMS (three lines of text)
• Pictogram-text-pictogram VMS (three lines of text)
• Full-matrix VMS (flexible configurations of pictograms and text).
The first step consists on identifying the situation and the corresponding VMS in use: in the example below, congestion when no exit is available, and the VMS is far from the congestion (see wp1.1 to get all the message variations in terms to distance VMS-event).
8 Note that these five VMS types generically represent most configurations in Europe, but not all of them. It is also easy to work out design from some of them. For example, some road operators have pictogram-text VMS with only two lines of text (not three). The basic elements of our second VMS would be enough then. Additional configurations (e.g., for lane control systems or variable directional signs) could also be worked out and added to this frame of specific messages recommended.

34
ESG4 – VARIABLE MESSAGE SIGNS HARMONISATION
VMS-DG01 – PRINCIPLES OF VMS MESSAGES DESIGN
COORDINATORS: ALBERTO ARBAIZA & ANTONIO LUCAS-ALBA
ew-dg-2012_vms-dg01_principlesofvmsdesign_02-00-00.docx 31/12/2012 34/60
Figure 8: The main information elements for a given road/traffic situation (e.g., congestion, no exit) and the six main VMS devices where it could be located
Figure 9: The main information elements for a given road/traffic situation (e.g., congestion, no exit): paths for placing the information elements
Note than the text-only VMS only will get the word congestion (in blue). Note also that in the rest of the VMS, the congestion pictogram is placed so the secondary, accompanying information makes sense besides it (left/right or below) depending on the VMS type. The green line concerns location (second line in all VMS except the full matrix one).
The third step consists on selecting the specific informative elements and structure for the specific VMS type, following the adequate and necessary distribution:

35
ESG4 – VARIABLE MESSAGE SIGNS HARMONISATION
VMS-DG01 – PRINCIPLES OF VMS MESSAGES DESIGN
COORDINATORS: ALBERTO ARBAIZA & ANTONIO LUCAS-ALBA
ew-dg-2012_vms-dg01_principlesofvmsdesign_02-00-00.docx 31/12/2012 35/60
Figure 10: The main information elements for a given road/traffic situation (e.g., congestion, no exit, due to road works) and the order and structure assigned in the five main VMS devices
Figure 10 shows (grey rectangle) the basic components to be used for that specific situation [congestion (no exit available), located at… and caused by…]. As you can see in the recommendations below each case is verbally described and also represented by a graphical sketch9.
The main (large) pictogram on the left is the informative element leading the disposition of the rest: this is a key role. Any additional information, location, advice, makes sense after (or before) that pictogram. Note that some VMS (pictogram-pictogram-text, full matrix) must place the cause (e.g. road works) before the consequence (congestion) for the message, including the complementary text, to make sense. The examples given hereafter take into account the “individual differences” of the corresponding VMS devices. There is a need to provide with flexible display formulations to ensure the same interpretation on the part of drivers considering the specific VMS they look at. Disregarding that fact means that VMS harmonisation would not be possible in Europe.
Note that, in this example, the pictogram has not red triangle (see DG01, principle 4.2). Then the alphanumeric elements follow, in order: nature of event-location-cause/advice (see DG01, principles 3.1 and 3.2). Note that the word congestion is in blue and between brackets. This is because, although pictogram-text redundancy is generally not advised (DG01, principle 1.9), text-only VMS must use it (no pictogram is available in such devices). Location formulations may vary a lot depending on the specific road/traffic context (DG01, principle 4.4), and the use of the specific location may condition the possibility of using or not additional information. Finally, the grey rectangle shows (just below) an array of possibilities to display the third basic element, cause and/or advice: either using text or a pictogram, depending on display possibilities (some VMS cannot show a second pictogram) and/or on pictogram availability (not all ideas can be communicated using pictograms, not always the needed pictograms are available).
9 At the present stage, this seems to be the most synthetic way of listing the specific recommended messages for 5 VMS types. Future developments more specifically concerning such or such VMS type, at national or regional level, could bring more concrete (less schematic) inventories of the corresponding VMS devices in use (e.g., pictogram-text) and the specific VMS recommended for that VMS device.

36
ESG4 – VARIABLE MESSAGE SIGNS HARMONISATION
VMS-DG01 – PRINCIPLES OF VMS MESSAGES DESIGN
COORDINATORS: ALBERTO ARBAIZA & ANTONIO LUCAS-ALBA
ew-dg-2012_vms-dg01_principlesofvmsdesign_02-00-00.docx 31/12/2012 36/60
The paragraph above further explains the need and adequacy of further guidance: all these principles mentioned (4.2, 3.1, 3.2, 1.9, 4.4, and the like) are already embedded in the specific messages given in the examples, within the grey boxes. These VMS are built up according to DG01 general design principles.
Some road/traffic situations allow for different selections for the case: general or specific (e.g., use of travel times, or specific messages for trucks). Most times only the general case is the only one available however.
Finally, once the specific VMS has been obtained, one should do the last check. Make sure the message obtained can be applied to one’s VMS (placement, number of characters per line, etc.). A complete VMS will have been obtained.
VMS Harmonisation: Specific Messages Recommended10 A reminder: messages listed below refer to three main situations: a) when the VMS is far from the event (> 5 km), when the VMS is near the event (≤ 5 km), when the VMS is within the event.
10 August 2012

37
ESG4 – VARIABLE MESSAGE SIGNS HARMONISATION
VMS-DG01 – PRINCIPLES OF VMS MESSAGES DESIGN
COORDINATORS: ALBERTO ARBAIZA & ANTONIO LUCAS-ALBA
ew-dg-2012_vms-dg01_principlesofvmsdesign_02-00-00.docx 31/12/2012 37/60
WP.1 Congestion
WP.1.1 Congestion- no exit
Messages intended to warn against a traffic jam on the road section, no exit available11.
Figure 11: Congestion - no exit
WP.1.2 Congestion- exit available [ONCOMING CASE]
Messages intended to warn against a traffic jam on the road section, one exit available.
Figure 12: Congestion - exit available
11 Speed limits and recommendations listed below are only examples of possibilities. The specific decision concerning the use of specific speed limits, recommendations or generic advices (“moderate speed”) belongs to the TCC responsible of the management of such road section.

38
ESG4 – VARIABLE MESSAGE SIGNS HARMONISATION
VMS-DG01 – PRINCIPLES OF VMS MESSAGES DESIGN
COORDINATORS: ALBERTO ARBAIZA & ANTONIO LUCAS-ALBA
ew-dg-2012_vms-dg01_principlesofvmsdesign_02-00-00.docx 31/12/2012 38/60
WP.1.3 Congestion at exit [ONCOMING CASE] Messages intended to warn against a traffic jam on the next exit.
Figure 13: Congestion - exit available
WP.5. Road works
WP.5.1. Road closed –exit available
Messages intended to indicate that the road is closed ahead due to road works and that there is a compulsory exit available.
Figure 14: Road closed - exit available

39
ESG4 – VARIABLE MESSAGE SIGNS HARMONISATION
VMS-DG01 – PRINCIPLES OF VMS MESSAGES DESIGN
COORDINATORS: ALBERTO ARBAIZA & ANTONIO LUCAS-ALBA
ew-dg-2012_vms-dg01_principlesofvmsdesign_02-00-00.docx 31/12/2012 39/60
WP.5.2. Next exit closed due to road works
Messages intended to indicate that the next exit is closed due to road works and that drivers should remain in the main road or take a different exit.
Figure 15: Next exit closed due to road works
WP.7 Weather information
WP.7.1 Strong wind
Messages intended to warn against the existence of strong wind
Figure 16: Strong wind

40
ESG4 – VARIABLE MESSAGE SIGNS HARMONISATION
VMS-DG01 – PRINCIPLES OF VMS MESSAGES DESIGN
COORDINATORS: ALBERTO ARBAIZA & ANTONIO LUCAS-ALBA
ew-dg-2012_vms-dg01_principlesofvmsdesign_02-00-00.docx 31/12/2012 40/60
WP.7.3.1 Slippery road due to snow/ice
Messages intended to warn on the existence of a slippery road section due to ice or snow.
Figure 17: Slippery road due to snow/ice
WP.7.3.2 Slippery road due to rain, water, pools, flooding
Messages intended to warn on the existence of a slippery road section due to excess of water or pools.
Figure 18: Slippery road due to rain, water, pools, flooding

41
ESG4 – VARIABLE MESSAGE SIGNS HARMONISATION
VMS-DG01 – PRINCIPLES OF VMS MESSAGES DESIGN
COORDINATORS: ALBERTO ARBAIZA & ANTONIO LUCAS-ALBA
ew-dg-2012_vms-dg01_principlesofvmsdesign_02-00-00.docx 31/12/2012 41/60
3. Annex A: Compliance Checklist 3.4. Compliance checklist "should"
# Requirement
Fulfilled?
If no – explanation of deviation Yes No
Functional requirements
none
Organisational requirements
none
Technical requirements
none
Common Look & Feel requirements
Principle 1.1
Principle 1.2
Principle 1.3
Principle 1.4
Principle 1.5
Principle 1.6
Principle 1.7
Principle 1.8
Principle 1.9
Principle 1.10
Principle 1.11
Principle 1.12
Principle 2.1
Principle 2.2
Principle 2.3
Principle 2.4
Principle 2.5
Principle 3.1
Principle 3.2
Principle 3.3
Principle 3.4
Principle 3.5

42
ESG4 – VARIABLE MESSAGE SIGNS HARMONISATION
VMS-DG01 – PRINCIPLES OF VMS MESSAGES DESIGN
COORDINATORS: ALBERTO ARBAIZA & ANTONIO LUCAS-ALBA
ew-dg-2012_vms-dg01_principlesofvmsdesign_02-00-00.docx 31/12/2012 42/60
Principle 4.1
Principle 4.2
Principle 4.3
Principle 4.4
Principle 4.5
Principle 4.6
Principle 4.7
Principle 5.1
Principle 5.2
Principle 6.1

43
ESG4 – VARIABLE MESSAGE SIGNS HARMONISATION
VMS-DG01 – PRINCIPLES OF VMS MESSAGES DESIGN
COORDINATORS: ALBERTO ARBAIZA & ANTONIO LUCAS-ALBA
ew-dg-2012_vms-dg01_principlesofvmsdesign_02-00-00.docx 31/12/2012 43/60
4 Annex B: Bibliography [1] Blanch, M.T., Lucas, A., Messina, C. (2009). ES4-Mare Nostrum: the Working Book. Madrid: DGT.
[2] UNECE (1968/1995). Convention on Road Signs and Signals, E/CONF.56/17/Rev.1/Amend.1. Available: http://www.unece.org/trans/main/welcwp1.html
[3] Dudek, C. L. (2002). Guidelines for Changeable Message Sign Messages. FHWA, U.S. Department of Transportation, Washington, D.C.
[4] Dudek, C. L. (2004). Changeable Message Sign Operation and Messaging Handbook. Report: FHWA-OP-03-070. FHWA, U.S. Department of Transportation, Washington, D.C.
[5] Dewar, R.E. (2006). Road warnings with traffic control devices. In M.S.Wogalter (Ed.): Handbook of Warnings. Mahwah, NJ: LEA, p. 177-185.
[6] Wogalter, M.S., Sojourner, R.J. and Brelsford, J.W. (1997). Comprehension and retention of safety pictorials. Ergonomics, 40., No. 5, 531-542.
[7] UNECE (2008). ECE/TRANS/WP.1/119 - Consolidated Resolution on Road Signs and Signals (R.E.2). Available at: http://www.unece.org/trans/roadsafe/wp1fdoc.html
[8] WERD/DERD (2000). Framework for harmonized implementation of variable message signs in Europe. Final version 3.0, spring 2000. West European Road Directors (WERD), Deputy European Road Directors (DERD).
[9] Nenzi, R. (1997). Use of Dynamic Signing (VMS). Volume 3C. Telematics on the Trans European road Network 2 – TELTEN2. Final Report. Brussels: ERTICO.
[10] Piot, D. (2003). Etude d’impact des messages diffusés par PMV Influence des messages de sensibilisation à la sécurité. Société des Autoroutes Paris-Rhin-Rhône.
[11] SETRA (1994). Panneaux de signalisation à messages variables. Bagneux: Service d’Études Techniques des Routes et Autoroutes -SETRA.
[12] CIE (Commission Internationale de l´Éclariage) (1994). Technical Report. Variable message signs. CIE 111-1994. Vienna: Austria.
[13] Erke, A., Sagberg, F., Hagman, R. (2007). Effects of route guidance variable message signs (VMS) on driver behaviour. Transportation Research Part F, 10, p. 447–457.
[14] Simlinger, P., Egger, S., Galinski, Ch. (2007). Proposal on unified pictograms, keywords, bilingual verbal messages and typefaces for VMS in the TERN. SOMS/IN-SAFETY. IN-SAFETY Deliverable 2.3. Contract N. 506716. January, 2008.
[15] Krampen, M. (1983). Icons on the road. Semiotica, 43 (1/2), 1-203, p. 30.
[16] Lucas, A., Montoro, L. (2004). Some critical remarks on a new traffic system: VMS Part II. In C. Castro & T. Horberry (Eds.): The Human Factors of Transport Signs. Boca Raton: CRC Press, p. 199-212.
[17] Rasmussen, J. (1983). Skills, rules and knowledge: signals, signs and symbols, and other distinctions in human performance models. IEEE Transactions on Systems, Man and Cybernetics, 13 (3), p. 257-266.
[18] Beccaria, G., Bolelli, A., Wrathall, C.W., Rutley, K.S., Schneider, H.W., Balz, W., Friedrich, B., Ploss, G., Cremer, M., Putensen, K., Naso, P.G. and Schlüter, M. (1991). White book for variable message signs application. Sobrero: The VAMOS Consortium.
[19] Lay, M.G. (2004). Design of traffic signs. In C. Castro & T. Horberry (Eds.): The Human Factors of Transport Signs. Boca Raton: CRC Press, p. 25-48.
[20] Bjornskau,T., Elvik,R. (1992). Can road traffic law enforcement permanently reduce the number of accidents? Accident Analysis and Prevention, 24, p. 507-520.

44
ESG4 – VARIABLE MESSAGE SIGNS HARMONISATION
VMS-DG01 – PRINCIPLES OF VMS MESSAGES DESIGN
COORDINATORS: ALBERTO ARBAIZA & ANTONIO LUCAS-ALBA
ew-dg-2012_vms-dg01_principlesofvmsdesign_02-00-00.docx 31/12/2012 44/60
[21] De Waard, D. and Rooijers, T. (1994). An experimental study to evaluate the effectiveness of different methods and intensities of law enforcement on driving speed on motorways. Accident Analysis and Prevention, Vol. 26, No 6, p. 751-765.

45
ESG4 – VARIABLE MESSAGE SIGNS HARMONISATION
VMS-DG01 – PRINCIPLES OF VMS MESSAGES DESIGN
COORDINATORS: ALBERTO ARBAIZA & ANTONIO LUCAS-ALBA
ew-dg-2012_vms-dg01_principlesofvmsdesign_02-00-00.docx 31/12/2012 45/60
5 Annex C: Content annexes 1 to 12: additional information backing general principles of design
Annex 1. Switched on/switched off, a fundamental question
VMS are meant to inform about unexpected, changing circumstances affecting the road or traffic. In general terms, the main purpose for the acquisition and use of information is reducing uncertainty with respect to a given situation and a given (mobility) goal. In the VMS road context the genesis of uncertainty is defined by the dichotomy of VMS being switched on or off.
When we see a VMS switched off we assume that, within the range of information normally displayed by VMS, nothing is going to perturb our trip (e.g., heavy congestion, diversion, closed lanes or roads, etc.). However, a VMS switched on generates uncertainty that will only be reduced when we are near of the VMS so we can read and process the information that is displayed, and act accordingly (e.g., reducing speed, increasing attention, and the like).
When many VMS are frequently switched on and displaying information, changes in the levels of uncertainty in the mind of the driver happens very frequently too (according to the cycle “uncertainty increase” (when VMS is far from the event are seen) - “uncertainty reduction” (when VMS is actually read). Then not only attention demands may overload drivers, but also drivers get emotionally aroused quite frequently. When nearly all VMS display similar information (e.g., warning of congestion, travel times, etc.) that cycle of uncertainty arousal-reduction can be processed by drivers without thoroughly reading the content of the message (i.e., mechanically or mindlessly): “congestion as ever”, “travel times as ever”. Once this point is passed, and reaches the whole VMS system, the information display gets somehow spoiled.
This stage can be identified when additional gadgets are implemented (for example, flashing lights). When drivers drive under such circumstances without adopting particular measures (attention, speed) and see that nothing really happens, the risk of drivers not being prepared when it is really necessary increases. Clearly, if the insufficient impact of VMS information (due to excess, here is the paradox) do not bring drivers to adopt appropriate measures, the result is a more dangerous road network.
Following the previous point, we have to avoid displaying information that does not refer to specific real-time traffic issues. Certainly, too many messages will not make a safer, more operative road. We have to distinguish educational contents from the specific information concerning road safety, linked to the immediate traffic context (the original function that gave birth to VMS).
If, for whatever international, national or local reasons, this is nevertheless going to happen, some measures should be adopted. Drivers should learn to distinguish which type of information they are looking at: tactical

46
ESG4 – VARIABLE MESSAGE SIGNS HARMONISATION
VMS-DG01 – PRINCIPLES OF VMS MESSAGES DESIGN
COORDINATORS: ALBERTO ARBAIZA & ANTONIO LUCAS-ALBA
ew-dg-2012_vms-dg01_principlesofvmsdesign_02-00-00.docx 31/12/2012 46/60
and/or strategic messages, both subsumed on the label “traffic messages” [9], or road safety campaign messages. A careless, mindless reading might be applied to campaign messages, something that should never happen with traffic messages. Here a fundamental point follows: the possibility to distinguish them comes from the quality and organisation of the informative elements themselves. For example, traffic messages should be displayed with text justified to left besides a pictogram12. Campaign messages will show centred text and no pictogram (Fig. 1). This recommendation refers to VMS messages which aim to remind of certain driving rules (‘buckle up’) that should not show a pictogram.
Finally, road safety campaign messages, if used, should take into account certain recommendations [10]:
1. VMS immediately in advance (i.e. less than 5km) of the first tactical or strategic VMS message should remain blank (i.e. campaign messages should be avoided). Drivers’ minds should be free of interferences from previous campaign messages when expected to react to tactical or strategic messages.
2. The display of campaign messages should always stick to a limited time frame both in terms of the day (e.g. two hours) and in terms of the exhibition period (e.g. two weeks) and also considering the less intense traffic periods (e.g., weekends).
3. The display of campaign messages will always be linked to a specific road safety campaign that is supported by variety of other media (press, radio, television, billboards, etc.). In this way we gain an optimal recognition of the message with a minimal degree of interference and time.
Annex 2. Number of informative units per message
A priori, two main parameters should be considered to make a VMS readable: the distance between the driver and the VMS and the time he/she has to read it. We assume here that standard conditions apply both to VMS as product13 and to the driver14. Then two fundamental magnitudes may be fixed: the reading distance that should be established and the number of information units that can be read (more information units will need more reading time).
Driving speed, visual acuity, the location and height of signs on the VMS and the number of information units displayed are the fundamental elements to consider. The height of the signs displayed is important as it determines the reading distance15. VMS displaying characters of 22, 32 and 42 cm height will yield reading
12 The exception to the rule is vertical layout, when text is placed below the pictogram as in MS-4.
13 European Standard EN 12966-1: Vertical road signs –Part 1: Variable Message Signs.
14 Annex III of Council Directive 91/439/EEC of 29 July 1991 on driving licenses indicates that Group 1 (drivers of vehicles categories A, B, B+E and subcategory A1 and B1) shall have a binocular visual acuity, with corrective lenses if necessary, of at least 0,5 (6/12) when using both eyes together. Group 2 (C, C+E, D, D+E and of subcategory C1, C1+E, D1 and D1+E) should have a visual acuity, with corrective lenses if necessary, of at least 0,8 (6/7) in the better eye and at least 0,5 (6/12) in the worse eye.
15 There is another important parameter for this calculation: the height of the characters on the VMS according to visual acuity. Although certain variability may be observed, all in all the literature suggests adopting a ‘normal’ distance to read a sign (in meters) of 6 by the character height (in centimetres) [7, 11, 12]. This nearly equates to what normally is considered standard visual acuity (6/6, or 1), i.e., being able to read at a distance 687 times the height of characters in millimetres [CIE]. If we were to adopt strictly the minimum requirements fixed by the 1991 European Directive (6/12, or 0,5) either the character height should be more than doubled (68cm in the example above) for such drivers to enjoy a window frame of 200 meters or the legibility window reconsidered, and diminished by 50% (100 meters approximately). As a consequence, we should expect a percentage of the drivers’ population to slow down in order to gain time to

47
ESG4 – VARIABLE MESSAGE SIGNS HARMONISATION
VMS-DG01 – PRINCIPLES OF VMS MESSAGES DESIGN
COORDINATORS: ALBERTO ARBAIZA & ANTONIO LUCAS-ALBA
ew-dg-2012_vms-dg01_principlesofvmsdesign_02-00-00.docx 31/12/2012 47/60
distances of 151, 220 and 288 m respectively. However an adequate reading window will eliminate the last meters for people should not read the VMS up beyond an angle of 10 degrees16. The resulting reading windows are now 115, 184 and 252 m. The question then is to relate speed (time) and the number of information units that can be read. This ratio is normally expressed following a simplified formulation, derived from empirical studies [11, 12]:
𝑡 = 2 +𝑛
3
Where t is the time in seconds and n is the number of words one has to read entirely twice. Reading three words twice bring us to a reading window of 3 seconds. With a reading window of 5 seconds, and travel speed of 120km/h, messages should be short and simple. It is not unusual to observe how drivers diminish speed as they get near VMS, particularly when more text is displayed. A message with six words will require, in principle, at least 4 seconds according to the formulation shown above. Slowing down to 100 km/h will yield an extra second (reading messages more comfortably). This type of reactions (drivers reducing speed in order to read long messages) are part of real traffic behaviour and we should be aware of it [13].
As mentioned in Part A, VMS display pictograms, abstract signs, numbers, words (e.g. descriptors, toponyms) and abbreviations forming information units. Table 1 shows examples of the number of words and information units for VMS displaying characters height of 32 cm at different speeds. All in all, if a range of 4-7 words besides a pictogram with travel speeds of 120km/h builds a frame of 2-4 information units per message that should not be exceeded. Only exceptional cases (e.g., VMS displayed to drivers moving at 60km/h due to congestion, or snow) should alter this basic rule.
DRIVING SPEED 60KM/H 80KM/H 100KM/H 120KM/H
Reading time (characters of 32 cm height) 11.23 s 8.42 s 6.74 s 5.61 s
Maximum number of words: N = 3*(T-2)17 25-27 17-19 12-14 8-10
Range of information units 6-10 4-8 3-6 2-4
TABLE 1. NUMBER OF INFORMATION UNITS THAT CAN BE DISPLAYED AT DIFFERENT TRAVEL SPEEDS ON VMS (EXAMPLE)
Annex 3. The need to avoid redundancy
As advanced in Part A, redundancy, i.e., the practice of repeating the same pictogram twice (with VMS able to display two pictograms), or repeating totally or partially with text the information that is already showed by the pictogram (e.g. using words as ‘caution’, ‘danger’, or ‘look out’ besides a danger warning pictogram), is not advisable.
The only exception to such rule is the use of educational tabs or texts on a temporary basis [6]. So when we are using pictograms that need some ‘help’ (e.g., the pictogram for ‘bad visibility’ or ‘accident’ recently included within RE.2, etc.), we introduce text whose meaning is partially redundant with that pictogram. In addition, the reason for complementing the pictogram for bad visibility (Fig. 2) could be a) we want the driver to understand the bad visibility is due to fog, b) we want the driver to differentiate between fog and alternative problems of visibility such as rain or smoke.
16 The final section that should be removed (R) is calculated according to the function R= (M-
h)/tangentwhere M = location (height) where the VMS character is placed (e.g. 7.5m), h = driver height
while driving (e.g. 1.2m), = maximum angle for reading (10 degrees). The resulting R is approximately 36 meters.
17 This is an approximate parameter and other issues (word length) should be also considered. In addition, one should remember that this calculation was originally developed for painted signs (not LED signs). The general advice is to be careful and take a conservative approach on the number of words displayed.

48
ESG4 – VARIABLE MESSAGE SIGNS HARMONISATION
VMS-DG01 – PRINCIPLES OF VMS MESSAGES DESIGN
COORDINATORS: ALBERTO ARBAIZA & ANTONIO LUCAS-ALBA
ew-dg-2012_vms-dg01_principlesofvmsdesign_02-00-00.docx 31/12/2012 48/60
Annex 4. Flashing, blinking and scrolling messages on VMS
Flashing lights are normally meant to indicate immediate dangerous situations. However, not every VMS is equipped with flashing lights, and the present Guidelines suggest ways to differentiate between immediate dangers and other traffic situations with standard equipment. In addition, flashing lights on VMS should be used with caution, exceptionally and precisely. By using flashing lights in conjunction with VMS messages, we introduce a particular category to drivers: “messages that really are important” (with flash) vs. “other messages”. The need to use flashing lights therefore indicates a poor management of VMS in general: too many messages, not always functional or useful make drivers disregard VMS.
Motion effects concerning the information displayed on VMS (blinking, scrolling) are a delicate question. Clearly, as flashing lights, its main function should be attracting attention to the information displayed. Again, this very additional need (reinforce attention to VMS) involves a poor use of signing devices that are variable in nature (and should attract attention themselves, simply by being switched on). In addition, the very need to read and interpret “evasive” information makes it difficult and dangerous while driving: to keep track and attend to other circumstances should kept the main percentage of attention resources.
But scrolling and blinking have additional drawbacks: diminishing the time the information is available for reading. Scrolling is clearly ill-advised for two additional reasons: it may be used to display much more information that can be hold in a panel, and may force memory beyond easy limits. Blinking is normally applied to pictograms, not text. It can also be problematic, calling for unexpected optical effects, although partial blinking (i.e., only some parts of the pictogram blink, for example the red frame goes on and off) has been recently tested [14]. The implications of the use of this display strategies for certain groups (drivers with minor visual impairments, old drivers, etc.), during the driving task should be thoroughly studied before recurring to them. For that reason, the advice in the past has been to avoid blinking and scrolling [11].
Annex 5. The selection of the main pictogram
As stated in Part A, the pictogram is the main element in the whole communication chain. To main features should be considered: specific and consequence-oriented. Specific pictograms should have pre-eminence (compared to generic ones) because they transmit more information and need less complementary text in order to communicate something. Pictograms that are consequence-oriented should have priority (compared to cause-oriented ones) because the former show information that is more important in the timing of actions that should be followed by drivers. Normally, consequence-oriented pictograms are also highly specific ones (Fig. 3).
Such criteria are fundamental. Sometimes, a number of different official ‘legal’ pictograms are available and could be used for the same event: then appropriate criteria for selecting pictograms reduce heterogeneity. If all information going after the main pictogram complements its meaning and if the main pictogram selected in order to portray the road/traffic is not appropriate, the driver will confront heterogeneous information that is unnecessary and easy to avoid. Selecting the right pictogram makes extra words unnecessary.

49
ESG4 – VARIABLE MESSAGE SIGNS HARMONISATION
VMS-DG01 – PRINCIPLES OF VMS MESSAGES DESIGN
COORDINATORS: ALBERTO ARBAIZA & ANTONIO LUCAS-ALBA
ew-dg-2012_vms-dg01_principlesofvmsdesign_02-00-00.docx 31/12/2012 49/60
Annex 6. VMS that display more than one pictogram
By selecting consequence-oriented, specific pictograms we need less text to complement its meaning. We now have to think about these two features not only within danger warning pictograms but considering pictograms in general. Also, because new VMS are able to display more than one pictogram we should think of a way to prioritise and harmonise them too.
As said in Part A, what is cause and what is consequence in all related to signing information sometimes is clear, but sometimes is relative. Given the highly specific nature of regulatory messages, they should have priority in the process of pictogram selection (Fig. 4). That means that when two pictograms are available for managing a road/traffic situation the regulatory pictogram(s) should go first, then danger warning pictograms and then informative (however, see the fifth issue to screen difficulties concerning the use of regulatory pictograms on VMS).
The selection of the main pictogram follows clear rules: the pictogram that is more consequence oriented and specific describing the situation will be selected because it will need less complementary text. It is also clear that the text or whatever information we may need (nature of event, location) will logically follow the main pictogram. In principle, the main pictogram should normally be placed first considering the order by which we normally read the information: from left to right, from to top to bottom and text should follow it naturally.
But there is another fundamental parameter to take into account: not all VMS allow for the same pictogram distribution (Fig. 5). We have to remember the core philosophy followed here for signing. We could call it “PICTO+” language. The essence of VMS message harmonisation lies there. In any VMS message the main pictogram commands. There is a main, coordinated set of pictogram-and-text that should be optimised, minimising the use of text. See principle 6.1.

50
ESG4 – VARIABLE MESSAGE SIGNS HARMONISATION
VMS-DG01 – PRINCIPLES OF VMS MESSAGES DESIGN
COORDINATORS: ALBERTO ARBAIZA & ANTONIO LUCAS-ALBA
ew-dg-2012_vms-dg01_principlesofvmsdesign_02-00-00.docx 31/12/2012 50/60
In summary, regulatory signs are the most specific and consequence oriented ones. The structure of German VMS designed to manage speeds according to incidents reflects this point (Fig. 6). Here the prohibition (60km/h) is the specific consequence coming from the danger that is the cause (congestion). The German example is not only good in terms of consequences-causes. It also shows on simple, effective VMS designs based on pictograms and not on words. Danger warning signs are not so specific, compared to regulatory, and normally call for a set of generic actions on the part of drivers: increase caution, attention, slow down, etc. Informative signs do not always apply equally to all drivers, and conformity to informative indications (recommendations) is relatively low. The location of pictograms on VMS that can display more than one pictogram should consider these parameters regarding function and effect of road signs.
Annex 7. New and/or re-designed pictograms: innovation and derivation
When a new traffic sign needs to be designed several options are available: utterly innovating or recurring to a kind of graphic syncretism or fusion. The 1968 Convention shows both alternatives. Following American Philosopher Charles S. Peirce, we may categorise two main types of signs, icons (pictograms with many resemblances to the real referent) and symbols (pictograms with a relationship with the referent that should be learned). Figure 7 shows examples of these two categories.
Ideally, all traffic signs should be icons, but it is difficult to find universal, pure icons in order to describe road situations: the exact traffic situation should be determined and drawn in a simple form so it can be represented with the basic tools of the 1968 Convention (shapes, colours, forms, etc.) [15, 16]. Some other constraints should added, coming from VMS themselves: matrix resolution of 32x32 or 64x64 pixels (5x7 or 8x11 for the alphanumeric) and using 4 or 5 colours. Given all difficulties mentioned, more ‘easy going’ symbols (not icons) are also frequently used.
The alternative to radical innovation is derivation, or building new signs making the most of existing ones. This is not uncommon on the 1968 Convention catalogue (Fig. 8). Forming signs with known signs that are easy to
FIGURE 5. ‘PICTO+’ philosophy applied to different layouts

51
ESG4 – VARIABLE MESSAGE SIGNS HARMONISATION
VMS-DG01 – PRINCIPLES OF VMS MESSAGES DESIGN
COORDINATORS: ALBERTO ARBAIZA & ANTONIO LUCAS-ALBA
ew-dg-2012_vms-dg01_principlesofvmsdesign_02-00-00.docx 31/12/2012 51/60
learn is an interesting option, something similar to the use of composed words (paperwork, mastermind, gunshot). Two examples of derivation are of interest here, addition (putting several known pictures together) and translation (using the same picture within a different frame, changing its main signing function). VMS need to make the most of both types of signs, either the new ones (e.g., ghost driver, icons if possible) or the derived ones (e.g., different ways to indicate closure and diversion options).
Pictograms reporting danger
This guideline refers to new signs that have been obtained mainly by deriving, either by addition or by translation. Putting pictures normally used with a danger warning red triangle, within a frame made for informative signs, is developing signs by translation (Fig. 9). This procedure yields some practical benefits too (without triangle, pictures may be enlarged by a 25%, and thus seen and read sooner).
But the most important benefit is helping drivers to create more adequate and realistic expectations about what is going on or what is going to happen on the road, sooner or later. The driving task has been traditionally conceived as a goal oriented task [17]. Information classified as danger warning (‘near’, for example 0-5km) would concern tactical and operative driving actions. Here the driver should prepare specifically for the situation he/she is approaching to soon, and the abilities involved concern manoeuvring, steering, controlling speed, etc. On the other hand, reporting danger (‘far’, e.g., beyond 5-10 km) may be assumed as a mere anticipation with time (pre-warning) and can also be studied for alternative plans (see fourth issue). After seeing such signs, the driver can proceed normally, but he/she should learn that a margin for additional actions exists (e.g., changing route, stop and rest, asking in a petrol station, etc.). In fact, provided that drivers learn well the difference between both formats, managers could think of alternative possibilities for reporting signs, indicating events that are far away in space (‘road works in 20km’) but also in time (‘road works here tomorrow morning’). It all opens new expectations and more possibilities for traffic management.
Some other road signs included within the ESG4 DG01 have been built by addition and refer particularly to the domain of road capacity. Following Nenzi [9], some refer to tactical actions (hard shoulder use) and some to strategic actions (road/exit closed-available routes).
Hard shoulder use
Provided that essential conditions for lanes are assured (wide enough, robust, etc.) hard shoulder availability involves at least three graphic elements: a) hard shoulder may be used, b) end of the use of hard shoulder, c)

52
ESG4 – VARIABLE MESSAGE SIGNS HARMONISATION
VMS-DG01 – PRINCIPLES OF VMS MESSAGES DESIGN
COORDINATORS: ALBERTO ARBAIZA & ANTONIO LUCAS-ALBA
ew-dg-2012_vms-dg01_principlesofvmsdesign_02-00-00.docx 31/12/2012 52/60
hard shoulder may not be used (Fig. 10). Compared to pictures previously used for that matter, this seems to be a better solution, particularly for on-site signing devices. The alternative is extending the traditional cross-arrow scheme to the hard shoulder, making the most of such signing infrastructures within urban areas and surroundings.
Road/exit closed and alternative ways
The possibility of redirecting traffic flows in order to optimise existing alternatives is one of the main goals of variable signing. One of the most important situations refers to road closures that promote a mandate, particularly when road works or maintenance operations allow road managers to forecast and redirect flows. VMS can then play an important role in anticipating the situation in the mind of drivers. Obviously, additional posted signs and beacons are expected in the very same problem area. The last RE.2 [7] included an alternative for such situations, following the examples of Italy and France (Fig. 11) and results from the SOMS Project [14]. One of the signs indicates the road is closed and the next exit is compulsory. The other group of signs indicate a closed exit and the possible alternatives available: continue and take exit before/after the closed exit.
Annex 8. Organising informative elements within the alphanumeric (text) area
As indicated in Part A, to adapt FIVE recommendations, DG01 adopts the following three rules:
1. It is more realistic and opens more possibilities to arrange the information according to an order (not to a location) in the first, second and third lines of text. 2. Sometimes we may distinguish between nature of event and cause and sometimes we cannot. 3. Length may sometimes be seen as nature of event (e.g., congestion).
Locating the information on the panel: flexibility within a given order
We read information from left to right, from top to bottom. According to this, FIVE recommends to locate the information on the VMS following a structure in which the additional information concerning the nature of event (e.g., text that nuances the pictogram) goes to the first line, the information concerning distance-length (or mixed formulations) would occupy the second line and the information relative to advice or cause would occupy the third line.
The advantages for such strict placement of information are clear: on the one hand, the driver gets used to follow a logical order of information according to its importance (top to bottom): in this way an order of priority is proposed to drivers. On the other hand, the driver could guess about the type of information simply

53
ESG4 – VARIABLE MESSAGE SIGNS HARMONISATION
VMS-DG01 – PRINCIPLES OF VMS MESSAGES DESIGN
COORDINATORS: ALBERTO ARBAIZA & ANTONIO LUCAS-ALBA
ew-dg-2012_vms-dg01_principlesofvmsdesign_02-00-00.docx 31/12/2012 53/60
by the position it occupies on the VMS message. Even in foreign countries, the inferential process is facilitated to drivers.
However, this recommendation, following a strict location according to element category, faces a problem: it will only work well with a large (infinite) number of characters per line. However, this is not really the case; we normally work with a rank of 12-20 characters per line. The result is that the recommended positions get invariably spoiled. We may think, for instance, about the use of qualitative distance-length with geographical locators (city or exit names): ideally it would take one line, but normally it takes no less than two lines on the panel (see table 3).
Still building on FIVE recommendations, a more realistic alternative would be to follow such criteria in a more flexible way, as a general criterion to order information units on the VMS. More than a strict location, we should follow an order for locating (Fig. 12). This algorithm would better integrate some of the most habitual events on VMS. The fundamental issue is to make clear which type or category of information goes first. For example, one message could present no nature of event if the pictogram is good enough (suppose congestion) and take the second and third lines for indicating distance-length. Or, a long advice could occupy the second and third line if no distance-length is needed and nature of event fits well on the first line.
The examples mentioned propose situations that exhaust the number of available lines. But it could also happen that not so many elements were necessary, leaving some lines empty. There are two options then, occupy the lines following the order (and leave the last line empty) or return to the basic FIVE proposal (try to locate the information on the corresponding line within the order). Our recommendation would be to return to FIVE when possible, particularly when the gap allowed between two lines of text could contribute to improve the interpretation of text and the VMS message as a whole.
Nature of danger vs. Cause of danger
Sometimes there is a clear difference between what is nature of danger and cause of danger: it happens when road/traffic events are independent and happen consecutively. Then the link cause-consequence is clear and FIVE recommendations are correct. For instance, an accident, road works or lane closures cause congestion. We term this consecutive cause-consequence. Using our rules (based upon amendments to FIVE recommendations), what is consequence (congestion) should be indicated with the pictogram and what is cause (road works, accident, lane closure) should occupy the third line. Figure 13 shows an example.
We may appreciate how adequate this scheme is by looking at the distortion introduced by a different disposition, locating the cause first (Fig. 14). Here the distance cannot be interpreted unambiguously with

54
ESG4 – VARIABLE MESSAGE SIGNS HARMONISATION
VMS-DG01 – PRINCIPLES OF VMS MESSAGES DESIGN
COORDINATORS: ALBERTO ARBAIZA & ANTONIO LUCAS-ALBA
ew-dg-2012_vms-dg01_principlesofvmsdesign_02-00-00.docx 31/12/2012 54/60
respect to both events. Only if drivers were already within the congestion, the message could be interpreted as “congestion and road works until Siegsdorf”. However, figure 13 it is still better in terms of what really is interesting for drivers: knowing the congestion length (the real thing), not the length of the road works.
There are, however, certain cases related with weather events in which the different nature of event/cause is not clear because both happen simultaneously and are located at the same distance e.g. slippery road caused by snow or caused by water pools. We term this simultaneous cause-consequence. In addition, in order to describe the event on the pictogram (consequence) we normally have to say something else about the nature of the event because the pictogram does not really describe it very specifically (Fig. 15). This simultaneity introduces a discontinuity within FIVE’s consequence-cause schema. Even knowing the recommendation “locate the cause on the third line”, when we deal with weather related events road operators normally locate the cause on the first line. In such cases, nature of event and cause share many dimensions. When the cause is also an element that implies the pictogram meaning and, when its presence is simultaneous (same distance), supporting text to explain the pictogram can be placed in the first text area of the VMS i.e. Information Unit 1 includes picto PLUS text.
One more reason to locate text complementing the pictogram meaning in the first text area comes from events that are difficult to locate with accuracy and go better with qualitative locations (Fig. 16). When cause-consequence are simultaneous we may integrate, without semantic problems, length formulations on the first line, then text (e.g., ‘ice=8km’, ‘smoke=2km’) when the VMS is within the event itself.
Consider length as part of nature of event
FIVE recommends locating distance/length on the second line. Some weather events show how length can be considered nature of event as well, but probably the most compelling case is congestion. Tests undertaken by the ESG4-Mare Nostrum group show that around 70% of drivers from several countries read “congestion = 10 km” as “congestion length of 10 km”. This is another exception to FIVE’s norm that can be generalised to all road/traffic events where length is part of the event. It should then be located in the first line too.
In sum:

55
ESG4 – VARIABLE MESSAGE SIGNS HARMONISATION
VMS-DG01 – PRINCIPLES OF VMS MESSAGES DESIGN
COORDINATORS: ALBERTO ARBAIZA & ANTONIO LUCAS-ALBA
ew-dg-2012_vms-dg01_principlesofvmsdesign_02-00-00.docx 31/12/2012 55/60
1. It is unavoidable to be flexible with the locating information criterion, although within a fixed order: nature of event-location-advise-cause. The final assignments of space to lines will depend on the needs and possibilities according to VMS type. 2. It is convenient to distinguish between ‘simultaneous’ causes (almost always weather or circumstantial events conditioning visibility and road adherence) and causes that are consecutive with respect to the event (here the location differs from the event caused by them). Simultaneous causes (snow, ice, smoke, rain) are understood as ‘nature of event’ and located first, whereas consecutive causes (accidents, roadworks, lane closures, etc.) are located third on the VMS or are shown by the second pictogram (according to VMS type). 3. It is convenient to categorise length as information relative to ‘nature of event’, in particular quantitative length of congestion, and not as independent information (as distance is). It should be preferably located as part of the first information element (which may cover picto and text).
Annex 9. The problem of distance on posted danger warning signs and on VMS
Originally, danger warning pictograms were thought as an answer to problems concerning the design or the topography of the network: non levered roads, dangerous bends, crossings, etc. [15, 19]. Posted danger warning pictograms are doubly virtuous, as they both specify and anticipate a danger, so drivers may act safely (being more attentive in a crossing, moderating speed in a bend, and so on).
However, it will happen like this within limits: in preparing to act safely, drivers will have to take into account distance to the danger. Posted danger warning signs have been normally successful with respect to that issue (anticipation) precisely due to its fixed relationship concerning the danger they anticipate on the road network (e.g. dangerous bend). Given basic human parameters concerning attention and perception (e.g. visual acuity, driving speed) we may obtain a rank of distances in order to locate the danger warning sign on the road both considering the driver (when he/she will see and read the sign) and the danger itself (the sign will give the driver enough time to proceed safely). For example according to the 1968 Convention danger warning signs are posted between 150m and 250m before the road section where the danger is expected. So, the anticipation distance for dangerous event is relatively short.
Other norms also specify quite short timings. For example, specific speed limits (e.g. due to road works) are supposed to be reminded (refreshed) every 1 minute to drivers18 , and indications for motorway exits are placed 500m and 1000m before. What is important to note is that all that regulations introduce the basic parameters that shape drivers’ expectations concerning informative indications on the road and the time available to react to them.
As a rule, what is potentially dangerous is located soon after the sign (normally, only seconds away). Note: for road traffic events and situations to which we should readily react, or events that should catch our attention all the time, we have an approximate space-time rank that is defined by the informative structure of the road network. Road signs and indications create an idea and accustom drivers to what is imminent and immediate, in time and distance, and it oscillates between the few seconds and the minute (or two minutes), or between the hundred meters and the few kilometres (something between two and four kilometres). These parameters conform, explicitly or implicitly to a general structure of actions and reactions on the road network (according to type of road) to which drivers get used to, and contribute to shape their expectations, the ideas and categories they have about what is far-near, long-short, slow-fast within the traffic context (table 2).
18 Interestingly, 1 minute is the standard upper limit for short term memory

56
ESG4 – VARIABLE MESSAGE SIGNS HARMONISATION
VMS-DG01 – PRINCIPLES OF VMS MESSAGES DESIGN
COORDINATORS: ALBERTO ARBAIZA & ANTONIO LUCAS-ALBA
ew-dg-2012_vms-dg01_principlesofvmsdesign_02-00-00.docx 31/12/2012 56/60
Speed
Distance to…
From danger-warning
to dangerous event in...
Distance travelled in
From panel to exit
React Slow down Stop total 150m 250m 1 min 1000 m
80km/h 17m 27m 44m 88m 6,8s 11,3s 1333,3m 45s
100km/h 21m 49m 70m 140m 5,4s 9,0s 1666,7m 36s
120km/h 25m 78m 103m 206m 4,5s 7,5s 2000m 30s
TABLE 2. TIME, DISTANCE AND BASIC DRIVING OPERATIONS WITHIN ROAD TRAFFIC
This use of fixed signs may influence VMS messages. On the one hand, because posted signs are overwhelmingly present compared to VMS, the rate is millions to thousands. The problem here is the space-time dimension: facing a road event, how long to retain the information, how long to keep attention high. VMS are conspicuous devices, but how long for in the mind of drivers? VMS are more flexible than posted signs but have also problems. Posted signs context is highly structured. The VMS events that can be displayed are quite diverse (compare fog with road works, congestion with wind).
Distance is here an important question. We should be aware of the relatively narrow span for danger warning posted signs to distance VMS-event (150m-250m), that is never known before hand on VMS. This fact has always been considered an advantage i.e. we can indicate congestion 15 km before and more. However, driving 15 km at 120 km/h takes about 8 minutes (table 3) and this quadruples the standard learned with posted danger warning signs. How do drivers deal with this excess when facing potential road dangers?
minutes 1 2 3 4 5 6 7 8
metres 2.000 4.000 6.000 8.000 10.000 12.000 14.000 16.000
TABLE 3. RELATION OF TIME AND DISTANCE AT 120KM/H
In general terms, the main goal of information acquisition and use is uncertainty reduction. A switched on VMS generates uncertainty that is reduced as soon as we read and process the information it displays and act accordingly, for example, reducing speed, increasing alert, etc. (Fig. 17). When many VMS display information many times the process of activation and deactivation of uncertainty is frequent, and this involves a risk of attention and emotion overload on the road. When this point is reached, in terms of the whole system, the information display moves towards a “spoil” threshold. If the insufficient impact of information (due to excess, not to lack) did not make the driver to take appropriate specific actions, the road system grows a little more dangerous.
It may happen that the presence of danger warning messages is too high, even on VMS. This fact is worsened by the space-time range that many road operators consider appropriate today to display danger warning messages, perhaps too wide (say from 0 to 20km or more). This wide range of anticipation has an impact in the rate of danger warning messages displayed (if the range was from 0 to 10 km, the potential number of VMS switched on would be smaller). The final result is that drivers are always seeing information on VMS, particularly road works and congestions, which are located near or far.

57
ESG4 – VARIABLE MESSAGE SIGNS HARMONISATION
VMS-DG01 – PRINCIPLES OF VMS MESSAGES DESIGN
COORDINATORS: ALBERTO ARBAIZA & ANTONIO LUCAS-ALBA
ew-dg-2012_vms-dg01_principlesofvmsdesign_02-00-00.docx 31/12/2012 57/60
Figure 17. Distance and type of information (14; p. 35)
In summary, some reasons support that messages anticipating dangerous but far away events should be referred to a range of distance, and should adopt a format and design different to messages anticipating dangerous near events. It is only normal that this consideration (warn vs. report about danger) did not enjoy parallel within the 1968 Convention catalogue up to now because such catalogue was originated under a static consideration of road problems and road information. This far-near dichotomy is more relevant to VMS.
Annex 10. Locating road/traffic events: time-based formulations
Travel times still share a small percentage of useful displays on the road. There is, however, a trend with a higher number of automatically displayed travel times on roads. We should ask ourselves about the consequence of such a practice, the consequences of switching on and off (see First Issue). In the future, travel time displays may abandon the quantity stance, “the more the better”. Road operators may compromise with a quality stance: display useful travel times that help drivers rationalise their trip decisions. Illuminating roads with travel times displays, bringing a fake sense of modernity, is not really the question.
Drivers will easily use a few and basic categories to cope and manage reality. For example the VAMOS White Book [18, p. 4-21] recommends that, when quantifying a delay, no more than four delay levels should be displayed. According to VAMOS [18], surveys indicate that the average driver will divert only to avoid a delay of 20 minutes or more. If the delay is about one hour, 95% of drivers would divert. The specific information concerning delay time is more important than the incident provoking it for drivers to decide what to do. VAMOS recommendations identify 4 display levels (15, 30, 45 and 1 hour or more). Again, the specific magnitudes of delay should be appraised by local operators according to the characteristics of the particular road network being operated, but no more than 4 different categories should be proposed to drivers.
Figure 18. Some travel times formulations, including some complementary text and graphic elements.
Annex 11. The use of regulatory messages
When road managers consider the regulatory option, the background against it should be understood (see box below). Three main criteria have been presented in Part A. If these three criteria, functionality, quantification

58
ESG4 – VARIABLE MESSAGE SIGNS HARMONISATION
VMS-DG01 – PRINCIPLES OF VMS MESSAGES DESIGN
COORDINATORS: ALBERTO ARBAIZA & ANTONIO LUCAS-ALBA
ew-dg-2012_vms-dg01_principlesofvmsdesign_02-00-00.docx 31/12/2012 58/60
and enforcement, are accomplished, it is adequate to display regulatory messages on VMS. Otherwise, danger warning is a better option. Then drivers regulate themselves: if they guess the warning makes sense or they are used to consistent warning signing, they will act accordingly. Another option is to recommend (for example, speed): drivers may or may not accept the advice, depending on a number of factors (previous history, reliability, self-confidence, etc.). If VMS operators do not follow the three criteria, we risk using the tool that drivers dislike the most (limiting their behaviour, be obliged) in an inefficient manner. The risk is a losing credibility systemically, damaging VMS efficacy and also our intention of prohibiting or mandating in the future.
Annex 12. Rules for locating information on pictogram-text-pictogram VMS
A suggested set of rules for VMS displaying ‘pictogram-text-pictogram’ (PTP) follow. These rules consider an order of functional priority of signs, from more to less consequence oriented pictograms to less: regulatory, then danger warning, then informative.
1. If a regulatory sign is placed on the left, then a regulatory sign can be shown on the right, or a danger warning or an informative one. The sign on the left –obligation, prohibition- will not be the same as the sign on the right (principle of non-redundancy) although it can hold the same function with
different content.
2. If a danger warning sign is placed on the left, then a danger warning sign can be shown on the right, or an informative one. The sign on the left –danger warning- will not be the same as the sign on the right (principle of
non-redundancy) although it can hold the same function with different content.
3. If an informative sign is placed on the left, then an informative sign can be shown on the right. The sign on the left –informative - will not be the same as the sign on the right (principle of non-redundancy) although it can
hold the same function with different content.
Note that these algorithms are intended to safeguard two aspects:
1. Priority of pictograms according to consequence orientation. Clearly, the most consequence oriented pictograms for drivers are 1st regulatory, 2nd danger warning, 3rd informative.

59
ESG4 – VARIABLE MESSAGE SIGNS HARMONISATION
VMS-DG01 – PRINCIPLES OF VMS MESSAGES DESIGN
COORDINATORS: ALBERTO ARBAIZA & ANTONIO LUCAS-ALBA
ew-dg-2012_vms-dg01_principlesofvmsdesign_02-00-00.docx 31/12/2012 59/60
2. The correct interpretation of the combination between the main pictogram (the first one seen beginning to read from left to right on this VMS) and the text accompanying it. These are the main reasons for the structure and algorithms adopted.
Rules for locating information on pictogram-pictogram-text VMS
However, let us now take the case of the “Italian” VMS displaying pictogram-pictogram-text (PPT). For the same principles to be kept, norms should be adapted to a different type of VMS:
1. Place secondary pictograms first, then the main pictogram as it goes beside complementary text. Then, if a regulatory sign is placed on the right, a regulatory sign can be shown on the left, or a danger warning one or an informative one. The sign on the right –obligation, prohibition- will not be
the same as the sign on the left (principle of non-redundancy) although it can hold the same function with different content.
2. If a danger warning sign is placed on the right, then a danger warning sign can be shown on the left, or an informative one. The sign on the right –danger warning- will not be the same as the sign on the left (principle of non-redundancy) although it can hold the same function with different
content.
3. If an informative sign is placed on the right, then an informative sign can be shown on the left. The sign on the right –informative - will not be the same as the sign on the left (principle of non-redundancy) although it can hold the same function with different content.
Following with this question, the need to provide a logical way for structuring information on VMS, full matrix VMS (e.g., MS-4) are most challenging. When looking at the PPT (Italian) and the PTP (Portuguese, Slovenian, Spanish) VMS, we may discover that sometimes one layout serves better the comprehension of users than others. To show it simply:
This message can be read as “Road works cause congestion that is located wherever”. No doubt should appear: location refers to what is just beside, congestion.
This message can be read as “Congestion, located wherever, caused by road works”. No doubt should appear location refers to what is just beside: congestion.
Let us see another example:
We read “congestion located wherever, recommended speed of 90km/h”. The speed recommendation is the information linked to the congestion located near. It is true that the recommendation is the consequence of congestion. But locating the congestion (left) takes priority according to
road safety principle (it is only a recommendation).
Here we read “recommended speed of 90km/h due to congestion located…”. However, the message adopts a different principle: the consequence goes first then the cause (congestion) and the location.
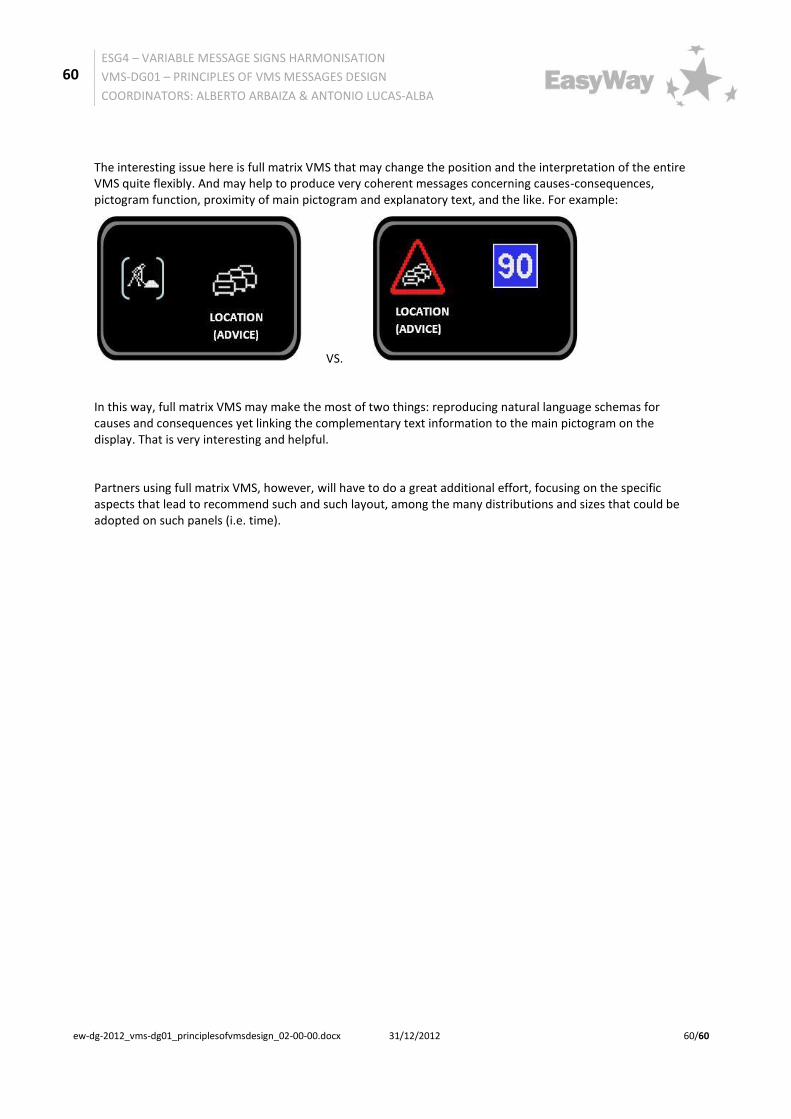
60
ESG4 – VARIABLE MESSAGE SIGNS HARMONISATION
VMS-DG01 – PRINCIPLES OF VMS MESSAGES DESIGN
COORDINATORS: ALBERTO ARBAIZA & ANTONIO LUCAS-ALBA
ew-dg-2012_vms-dg01_principlesofvmsdesign_02-00-00.docx 31/12/2012 60/60
The interesting issue here is full matrix VMS that may change the position and the interpretation of the entire VMS quite flexibly. And may help to produce very coherent messages concerning causes-consequences, pictogram function, proximity of main pictogram and explanatory text, and the like. For example:
VS.
In this way, full matrix VMS may make the most of two things: reproducing natural language schemas for causes and consequences yet linking the complementary text information to the main pictogram on the display. That is very interesting and helpful.
Partners using full matrix VMS, however, will have to do a great additional effort, focusing on the specific aspects that lead to recommend such and such layout, among the many distributions and sizes that could be adopted on such panels (i.e. time).