vanguard short-term inflation-protected securities index fund · • for the 12 months ended...
TRANSCRIPT

Vanguard Short-Term Inflation-Protected
Securities Index Fund
Annual Report | September 30, 2018

Contents
Please note: The opinions expressed in this report are just that—informed opinions. They should not be considered promisesor advice. Also, please keep in mind that the information and opinions cover the period through the date on the front of thisreport. Of course, the risks of investing in your fund are spelled out in the prospectus.
See the Glossary for definitions of investment terms used in this report.
Vanguard’s Principles for Investing Success
We want to give you the best chance of investment success. Theseprinciples, grounded in Vanguard’s research and experience, can put you onthe right path.
Goals. Create clear, appropriate investment goals.
Balance. Develop a suitable asset allocation using broadly diversified funds.
Cost. Minimize cost.
Discipline. Maintain perspective and long-term discipline.
A single theme unites these principles: Focus on the things you can control.We believe there is no wiser course for any investor.
Your Fund’s Performance at a Glance. . . . . . . . . . . . . . . . . . 1
CEO’s Perspective. . . . . . . . . . . . . . . . . . . . . . . . . . . . . . . . . 3
Fund Profile. . . . . . . . . . . . . . . . . . . . . . . . . . . . . . . . . . . . . . .5
Performance Summary. . . . . . . . . . . . . . . . . . . . . . . . . . . . . .6
Financial Statements. . . . . . . . . . . . . . . . . . . . . . . . . . . . . . . 9
About Your Fund’s Expenses. . . . . . . . . . . . . . . . . . . . . . . . 25
Glossary. . . . . . . . . . . . . . . . . . . . . . . . . . . . . . . . . . . . . . . . 27

Your Fund’s Performance at a Glance
1
Total Returns: Fiscal Year Ended September 30, 2018
30-Day SECYield
IncomeReturns
CapitalReturns
TotalReturns
Vanguard Short-Term Inflation-Protected Securities Index Fund
Investor Shares 0.79% 3.09% -2.18% 0.91%
ETF Shares 0.85
Market Price 0.97
Net Asset Value 1.01
Admiral™ Shares 0.85 3.18 -2.18 1.00
Institutional Shares 0.87 3.20 -2.18 1.02
Bloomberg Barclays U.S. Treasury Inflation-ProtectedSecurities (TIPS) 0–5 Year Index 1.01
Inflation-Protected Bond Funds Average 0.33
Inflation-Protected Bond Funds Average: Derived from data provided by Lipper, a Thomson Reuters Company. Admiral Shares carry lower expenses and are available to investors who meet certain account-balance requirements. Institutional Sharesare available to certain institutional investors who meet specific administrative, service, and account-size criteria. The Vanguard ETF®Shares shown are traded on the Nasdaq exchange and are available only through brokers. The table provides ETF returns based on boththe Nasdaq market price and the net asset value for a share. U.S. Pat. Nos. 6,879,964; 7,337,138; 7,720,749; 7,925,573; 8,090,646; and8,417,623.
For the ETF Shares, the market price is determined by the midpoint of the bid-offer spread as of the closing time of the New York StockExchange (generally 4 p.m., Eastern time). The net asset value is also determined as of the NYSE closing time. For more information abouthow the ETF Shares' market prices have compared with their net asset value, visit vanguard.com, select your ETF, and then select thePrice and Performance tab. The ETF premium/discount analysis there shows the percentages of days on which the ETF Shares' marketprice was above or below the NAV.
• For the 12 months ended September 30, 2018, Vanguard Short-Term Inflation-Protected
Securities Index Fund returned 0.91% for Investor Shares, tracking its benchmark (+1.01%)
and ahead of the average return of its peer funds (+0.33%). The 30-day SEC yield for
Investor Shares began the period at –0.20% and ended at 0.79%.
• Prices of regular U.S. Treasury securities fell during the period as economic prospects
brightened and interest rates rose. Treasury inflation-protected securities (TIPS)
outperformed regular Treasuries as inflation expectations increased, a development
that typically favors TIPS over nominal Treasuries.
• A measure of expected inflation over the next five years (the gap between nominal
and TIPS yields) widened from 1.82% to 2.04%.
• Since inception, the fund’s average annual return has been in line with that of its
benchmark and has exceeded that of its peers.

2
Total Returns: Inception Through September 30, 2018
Average
Annual Return
Short-Term Inflation-Protected Securities Index Fund Investor Shares (Returns since inception:
10/16/2012) 0.23%
Bloomberg Barclays U.S. Treasury Inflation-Protected Securities (TIPS) 0–5 Year Index 0.32
Inflation-Protected Bond Funds Average -0.40
Inflation-Protected Bond Funds Average: Derived from data provided by Lipper, a Thomson Reuters Company.
The figures shown represent past performance, which is not a guarantee of future results. (Currentperformance may be lower or higher than the performance data cited. For performance data current to themost recent month-end, visit our website at vanguard.com/performance.) Note, too, that both investmentreturns and principal value can fluctuate widely, so an investor’s shares, when sold, could be worth moreor less than their original cost.
Expense RatiosYour Fund Compared With Its Peer Group
Investor
Shares
ETF
Shares
Admiral
Shares
Institutional
Shares
Peer Group
Average
Short-Term Inflation-Protected Securities Index
Fund 0.15% 0.06% 0.06% 0.04% 0.71%
The fund expense ratios shown are from the prospectus dated January 26, 2018, and represent estimated costs for the current fiscal year.For the fiscal year ended September 30, 2018, the expense ratios were 0.14% for Investor Shares, 0.06% for ETF Shares, 0.06% forAdmiral Shares, and 0.04% for Institutional Shares. The peer-group expense ratio is derived from data provided by Lipper, a ThomsonReuters Company, and captures information through year-end 2017.
Peer group: Inflation-Protected Bond Funds.
Dear Shareholder,
Over the years, I’ve found that prudent
investors exhibit a common trait:
discipline. No matter how the markets
move or what new investing fad hits the
headlines, those who stay focused on
their goals and tune out the noise are
set up for long-term success.
The prime gateway to investing is saving,
and you don’t usually become a saver
without a healthy dose of discipline.
Savers make the decision to sock away
part of their income, which means
spending less and delaying gratification,
no matter how difficult that may be.
Of course, disciplined investing extends
beyond diligent saving. The financial
markets, in the short term especially,
are unpredictable; I have yet to meet the
investor who can time them perfectly.
It takes discipline to resist the urge to
go all-in when markets are frothy or to
retreat when things look bleak.
Staying put with your investments is one
strategy for handling volatility. Another,
rebalancing, requires even more discipline
because it means steering your money
away from strong performers and toward
poorer performers.
Patience—a form of discipline—is also
the friend of long-term investors. Higher
returns are the potential reward for
weathering the market’s turbulence
and uncertainty.
CEO’s Perspective
Tim BuckleyPresident and Chief Executive Officer
3

We have been enjoying one of the longest
bull markets in history, but it won’t continue
forever. Prepare yourself now for how
you will react when volatility comes back.
Don’t panic. Don’t chase returns or look
for answers outside the asset classes you
trust. And be sure to rebalance periodically,
even when there’s turmoil.
Whether you’re a master of self-control,
get a boost from technology, or work with
a professional advisor, know that discipline
is necessary to get the most out of your
investment portfolio. And know that
Vanguard is with you for the entire ride.
Thank you for your continued loyalty.
Sincerely,
Mortimer J. Buckley
President and Chief Executive Officer
October 18, 2018
Market Barometer Average Annual Total Returns
Periods Ended September 30, 2018
One Year Three Years Five Years
Stocks
Russell 1000 Index (Large-caps) 17.76% 17.07% 13.67%
Russell 2000 Index (Small-caps) 15.24 17.12 11.07
Russell 3000 Index (Broad U.S. market) 17.58 17.07 13.46
FTSE All-World ex US Index (International) 2.13 10.18 4.51
Bonds
Bloomberg Barclays U.S. Aggregate Bond Index
(Broad taxable market) -1.22% 1.31% 2.16%
Bloomberg Barclays Municipal Bond Index
(Broad tax-exempt market) 0.35 2.24 3.54
FTSE Three-Month U.S. Treasury Bill Index 1.57 0.80 0.48
CPI
Consumer Price Index 2.28% 1.99% 1.52%
4

5
Short-Term Inflation-Protected Securities Index Fund
Fund ProfileAs of September 30, 2018
1 The expense ratios shown are from the prospectus dated January 26, 2018, and represent estimated costs for the current fiscal year. Forthe fiscal year ended September 30, 2018, the expense ratios were 0.14% for Investor Shares, 0.06% for ETF Shares, 0.06% for AdmiralShares, and 0.04% for Institutional Shares.
2 Yields of inflation-protected securities tend to be lower than those of nominal bonds, because the former do not incorporate marketexpectations about inflation. The principal amounts—and thus the interest payments—of inflation-protected securities are adjusted overtime to reflect inflation. 5
Share-Class Characteristics
Investor
Shares ETF Shares
Admiral
Shares
Institutional
Shares
Ticker Symbol VTIPX VTIP VTAPX VTSPX
Expense Ratio1 0.15% 0.06% 0.06% 0.04%
30-Day SEC Yield2 0.79% 0.85% 0.85% 0.87%
Financial Attributes
Fund
Bloomberg
Barclays
U.S. TIPS
0–5 Year
Index
Bloomberg
Barclays
Aggregate
Bond Index
Number of Bonds 15 15 10,112
Yield to Maturity
(before expenses) 2.7% 2.7% 3.5%
Average Coupon 0.5% 0.5% 3.2%
Average Duration 2.7 years 2.7 years 6.0 years
Average Effective
Maturity 2.7 years 2.7 years 8.4 years
Short-Term
Reserves 0.1% — —
Sector Diversification (% of portfolio)
Treasury/Agency 100.0%
The agency and mortgage-backed securities sectors may includeissues from government-sponsored enterprises; such issues aregenerally not backed by the full faith and credit of the U.S.government.
Volatility Measures
Bloomberg
Barclays U.S.
TIPS 0–5
Year Index
BloombergBarclays
Aggregate
Bond Index
R-Squared 0.99 0.45
Beta 1.03 0.32
These measures show the degree and timing of the fund’sfluctuations compared with the indexes over 36 months.
Distribution by Credit Quality (% of portfolio)
U.S. Government 100.0%
Credit-quality ratings are obtained from Barclays and are fromMoody's, Fitch, and S&P. When ratings from all three agencies areused, the median rating is shown. When ratings from two of theagencies are used, the lower rating for each issue is shown. "NotRated" is used to classify securities for which a rating is notavailable. For more information about these ratings, see theGlossary entry for Credit Quality.
Distribution by Effective Maturity
(% of portfolio)
Under 1 Year 15.3%
1 - 3 Years 40.7
3 - 5 Years 44.0
Average Maturity
Short
Treasury/ Agency
Investment-Grade
Corporate
Below Investment-Grade
Med. Long
Credit Quality
Investment Focus

All of the returns in this report represent past performance, which is not a guarantee of future results that may be achieved by the fund. (Current performance may be lower or higher thanthe performance data cited. For performance data current to the most recent month-end, visitour website at vanguard.com/performance.) Note, too, that both investment returns and principal value can fluctuate widely, so an investor’s shares, when sold, could be worth more or less than their original cost. The returns shown do not reflect taxes that a shareholder would pay
on fund distributions or on the sale of fund shares.
Short-Term Inflation-Protected Securities Index Fund
Performance Summary
See Financial Highlights for dividend and capital gains information.
6
Cumulative Performance: October 16, 2012, Through September 30, 2018Initial Investment of $10,000
201820172016201520142013
$14,000
6,000
10,136
Average Annual Total Returns
Periods Ended September 30, 2018
OneYear
FiveYears
SinceInception
(10/16/2012)
Final Valueof a $10,000Investment
Short-Term Inflation-ProtectedSecurities Index Fund Investor Shares 0.91% 0.45% 0.23% $10,136
• • • • • • • •Bloomberg Barclays U.S. TreasuryInflation-Protected Securities (TIPS) 0–5Year Index 1.01 0.63 0.32 10,192
- - - - - - Inflation-Protected Bond Funds Average 0.33 0.80 -0.40 9,766
________ Bloomberg Barclays U.S. AggregateBond Index -1.22 2.16 1.52 10,939
Inflation-Protected Bond Funds Average: Derived from data provided by Lipper, a Thomson Reuters Company.
"Since Inception" performance is calculated from the Investor Shares’ inception date for both the fund and its comparative standards.
OneYear
FiveYears
SinceInception
(10/12/2012)
Final Valueof a $10,000Investment
Short-Term Inflation-Protected SecuritiesIndex Fund ETF Shares Net Asset Value 1.01% 0.55% 0.32% $10,190
Bloomberg Barclays U.S. TreasuryInflation-Protected Securities (TIPS) 0–5 YearIndex 1.01 0.63 0.32 10,191
Bloomberg Barclays U.S. Aggregate BondIndex -1.22 2.16 1.49 10,924
"Since Inception" performance is calculated from the ETF Shares’ inception date for both the fund and its comparative standards.

Short-Term Inflation-Protected Securities Index Fund
7
Average Annual Total Returns
Periods Ended September 30, 2018
OneYear
FiveYears
SinceInception
(10/16/2012)
Final Valueof a $10,000Investment
Short-Term Inflation-Protected Securities Index Fund Admiral Shares 1.00% 0.54% 0.32% $10,190
Bloomberg Barclays U.S. Treasury Inflation-Protected Securities (TIPS) 0–5 Year Index 1.01 0.63 0.32 10,192
Bloomberg Barclays U.S. Aggregate Bond Index -1.22 2.16 1.52 10,939
"Since Inception" performance is calculated from the Admiral Shares’ inception date for both the fund and its comparative standards.
OneYear
FiveYears
SinceInception
(10/17/2012)
Final Valueof a $5,000,000
InvestmentShort-Term Inflation-Protected SecuritiesIndex Fund Institutional Shares 1.02% 0.58% 0.35% $5,106,110
Bloomberg Barclays U.S. TreasuryInflation-Protected Securities (TIPS) 0–5 YearIndex 1.01 0.63 0.33 5,099,649
Bloomberg Barclays U.S. Aggregate BondIndex -1.22 2.16 1.56 5,482,127
"Since Inception" performance is calculated from the Institutional Shares’ inception date for both the fund and its comparative standards.
Cumulative Returns of ETF Shares: October 12, 2012, Through September 30, 2018
OneYear
FiveYears
SinceInception
(10/12/2012)
Short-Term Inflation-Protected Securities Index FundETF Shares Market Price 0.97% 2.68% 1.95%
Short-Term Inflation-Protected Securities Index FundETF Shares Net Asset Value 1.01 2.77 1.90
Bloomberg Barclays U.S. TreasuryInflation-Protected Securities (TIPS) 0–5 Year Index 1.01 3.17 1.91
"Since Inception" performance is calculated from the ETF Shares’ inception date for both the fund and its comparative standards.

Short-Term Inflation-Protected Securities Index Fund
8
Fiscal-Year Total Returns (%): October 16, 2012, Through September 30, 2018
Investor Shares
BloombergBarclays
U.S. TIPS0–5 Year
Index
Fiscal Year Income Returns Capital Returns Total Returns Total Returns
2013 0.09% -1.00% -0.91% -1.20%
2014 0.02 -0.04 -0.02 0.21
2015 0.70 -2.06 -1.36 -1.19
2016 0.43 2.05 2.48 2.62
2017 0.55 -0.24 0.31 0.51
2018 3.09 -2.18 0.91 1.01

Short-Term Inflation-Protected Securities Index Fund
Financial Statements
Statement of Net AssetsAs of September 30, 2018
U.S. Government and Agency Obligations (99.8%)
U.S. Government Securities (99.8%)
United States Treasury Inflation Indexed Bonds 2.125% 1/15/19 611,359 719,383
United States Treasury Inflation Indexed Bonds 0.125% 4/15/19 2,368,971 2,532,265
United States Treasury Inflation Indexed Bonds 1.875% 7/15/19 691,566 826,300
United States Treasury Inflation Indexed Bonds 1.375% 1/15/20 854,400 1,002,692
United States Treasury Inflation Indexed Bonds 0.125% 4/15/20 2,373,265 2,521,202
United States Treasury Inflation Indexed Bonds 1.250% 7/15/20 1,316,264 1,538,578
United States Treasury Inflation Indexed Bonds 1.125% 1/15/21 1,524,576 1,766,478
United States Treasury Inflation Indexed Bonds 0.125% 4/15/21 2,086,324 2,173,312
United States Treasury Inflation Indexed Bonds 0.625% 7/15/21 1,661,078 1,852,344
United States Treasury Inflation Indexed Bonds 0.125% 1/15/22 1,840,130 1,997,945
United States Treasury Inflation Indexed Bonds 0.125% 4/15/22 2,082,192 2,096,612
United States Treasury Inflation Indexed Bonds 0.125% 7/15/22 1,928,722 2,062,399
United States Treasury Inflation Indexed Bonds 0.125% 1/15/23 1,944,537 2,055,325
United States Treasury Inflation Indexed Bonds 0.625% 4/15/23 1,471,333 1,473,843
United States Treasury Inflation Indexed Bonds 0.375% 7/15/23 1,942,808 2,062,740
Total U.S. Government and Agency Obligations (Cost $27,125,074) 26,681,418
Shares
Temporary Cash Investment (0.1%)
Money Market Fund (0.1%)1 Vanguard Market Liquidity Fund (Cost $16,415) 2.209% 164,149 16,415
Total Investments (99.9%) (Cost $27,141,489) 26,697,833
Face Market
Maturity Amount Value•
Coupon Date ($000) ($000)
The fund reports a complete list of its holdings in regulatory filings four times in each fiscal year, at
the quarter-ends. For the second and fourth fiscal quarters, the lists appear in the fund’s semiannual
and annual reports to shareholders. For the first and third fiscal quarters, the fund files the lists with
the Securities and Exchange Commission on Form N-Q. Shareholders can look up the fund’s Forms
N-Q on the SEC’s website at sec.gov. Forms N-Q may also be reviewed and copied at the SEC’s
Public Reference Room (see the back cover of this report for further information).
9

Short-Term Inflation-Protected Securities Index Fund
Other Assets and Liabilities (0.1%)
Other Assets
Investment in Vanguard 1,342
Receivables for Accrued Income 33,204
Receivables for Capital Shares Issued 157,442
Total Other Assets 191,988
Liabilities
Payables for Investment Securities Purchased (150,428)
Payables for Capital Shares Redeemed (12,415)
Payables to Vanguard (3,753)
Other Liabilities (24)
Total Liabilities (166,620)
Net Assets (100%) 26,723,201
At September 30, 2018, net assets consisted of:
Amount
($000)
Paid-in Capital 27,246,405
Undistributed Net Investment Income 93,720
Accumulated Net Realized Losses (173,268)
Unrealized Appreciation (Depreciation) (443,656)
Net Assets 26,723,201
Investor Shares—Net Assets
Applicable to 275,641,114 outstanding $.001 par value shares of
beneficial interest (unlimited authorization) 6,678,915
Net Asset Value Per Share—Investor Shares $24.23
ETF Shares—Net Assets
Applicable to 112,792,013 outstanding $.001 par value shares of
beneficial interest (unlimited authorization) 5,452,562
Net Asset Value Per Share—ETF Shares $48.34
Admiral Shares—Net Assets
Applicable to 269,015,939 outstanding $.001 par value shares of
beneficial interest (unlimited authorization) 6,524,944
Net Asset Value Per Share—Admiral Shares $24.25
Amount
($000)
10

Short-Term Inflation-Protected Securities Index Fund
Institutional Shares—Net Assets
Applicable to 332,379,281 outstanding $.001 par value shares of
beneficial interest (unlimited authorization) 8,066,780
Net Asset Value Per Share—Institutional Shares $24.27
• See Note A in Notes to Financial Statements.
1 Affiliated money market fund available only to Vanguard funds and certain trusts and accounts managed by Vanguard. Rate shown is the 7-day yield.
Amount
($000)
See accompanying Notes, which are an integral part of the Financial Statements.
11

Year Ended
September 30, 2018
($000)
Investment Income
Income
Interest1 702,385
Total Income 702,385
Expenses
The Vanguard Group—Note B
Investment Advisory Services 764
Management and Administrative—Investor Shares 7,543
Management and Administrative—ETF Shares 2,194
Management and Administrative—Admiral Shares 2,677
Management and Administrative—Institutional Shares 2,514
Marketing and Distribution—Investor Shares 1,011
Marketing and Distribution—ETF Shares 281
Marketing and Distribution—Admiral Shares 456
Marketing and Distribution—Institutional Shares 221
Custodian Fees 130
Auditing Fees 64
Shareholders’ Reports and Proxy—Investor Shares 71
Shareholders’ Reports and Proxy—ETF Shares 222
Shareholders’ Reports and Proxy—Admiral Shares 111
Shareholders’ Reports and Proxy—Institutional Shares 7
Trustees’ Fees and Expenses 15
Total Expenses 18,281
Net Investment Income 684,104
Realized Net Gain (Loss)
Investment Securities Sold1,2 (41,881)
Futures Contracts 1,884
Realized Net Gain (Loss) (39,997)
Change in Unrealized Appreciation (Depreciation) of Investment Securities1 (398,504)
Net Increase (Decrease) in Net Assets Resulting from Operations 245,603
1 Interest income, realized net gain (loss), and change in unrealized appreciation (depreciation) from an affiliated company of the fund were $3,306,000, $186,000, and $1,000, respectively. Purchases and sales are for temporary cash investment purposes.
2 Includes $29,083,000 of net gains resulting from in-kind redemptions; such gains are not taxable to the fund.
Statement of Operations
Short-Term Inflation-Protected Securities Index Fund
See accompanying Notes, which are an integral part of the Financial Statements.
12

Statement of Changes in Net Assets
Short-Term Inflation-Protected Securities Index Fund
See accompanying Notes, which are an integral part of the Financial Statements.
Year Ended September 30,
2018 2017
($000) ($000)
Increase (Decrease) in Net Assets
Operations
Net Investment Income 684,104 254,685
Realized Net Gain (Loss) (39,997) (7,041)
Change in Unrealized Appreciation (Depreciation) (398,504) (168,286)
Net Increase (Decrease) in Net Assets Resulting from Operations 245,603 79,358
Distributions
Net Investment Income
Investor Shares (196,531) (27,992)
ETF Shares (158,959) (21,465)
Admiral Shares (186,081) (26,937)
Institutional Shares (242,955) (44,908)
Realized Capital Gain
Investor Shares — —
ETF Shares — —
Admiral Shares — —
Institutional Shares — —
Total Distributions (784,526) (121,302)
Capital Share Transactions
Investor Shares 912,377 826,514
ETF Shares 1,681,666 1,409,404
Admiral Shares 1,573,157 1,712,740
Institutional Shares 1,245,525 1,503,409
Net Increase (Decrease) from Capital Share Transactions 5,412,725 5,452,067
Total Increase (Decrease) 4,873,802 5,410,123
Net Assets
Beginning of Period 21,849,399 16,439,276
End of Period1 26,723,201 21,849,399
1 Net Assets—End of Period includes undistributed (overdistributed) net investment income of $93,720,000 and $194,124,000.
13

Investor Shares
For a Share Outstanding Year Ended September 30,
Throughout Each Period 2018 2017 2016 2015 2014
Net Asset Value, Beginning of Period $24.77 $24.83 $24.23 $24.74 $24.75
Investment Operations
Net Investment Income .6691 .3121 .0801 (.131) .183
Net Realized and Unrealized Gain (Loss)
on Investments (.448) (.237) .520 (.206) (.189)
Total from Investment Operations .221 .075 .600 (.337) (.006)
Distributions
Dividends from Net Investment Income (.761) (.135) — (.173) (.004)
Distributions from Realized Capital Gains — — — — —
Total Distributions (.761) (.135) — (.173) (.004)
Net Asset Value, End of Period $24.23 $24.77 $24.83 $24.23 $24.74
Total Return2 0.91% 0.31% 2.48% -1.36% -0.02%
Ratios/Supplemental Data
Net Assets, End of Period (Millions) $6,679 $5,904 $5,088 $4,532 $4,517
Ratio of Total Expenses to Average Net Assets 0.14% 0.15% 0.16% 0.17% 0.20%
Ratio of Net Investment Income to
Average Net Assets 2.73% 1.26% 0.42% (0.53%) 0.88%
Portfolio Turnover Rate3 25% 27% 28% 26% 18%
1 Calculated based on average shares outstanding.
2 Total returns do not include account service fees that may have applied in the periods shown. Fund prospectuses provide information about any applicable account service fees.
3 Excludes the value of portfolio securities received or delivered as a result of in-kind purchases or redemptions of the fund’s capital shares, including ETF Creation Units.
Financial Highlights
See accompanying Notes, which are an integral part of the Financial Statements.
Short-Term Inflation-Protected Securities Index Fund
14

ETF Shares
For a Share Outstanding Year Ended September 30,
Throughout Each Period 2018 2017 2016 2015 2014
Net Asset Value, Beginning of Period $49.41 $49.59 $48.36 $49.38 $49.36
Investment Operations
Net Investment Income 1.3581 .6711 .2511 (.210) .414
Net Realized and Unrealized Gain (Loss)
on Investments (.869) (.477) .979 (.415) (.371)
Total from Investment Operations .489 .194 1.230 (.625) .043
Distributions
Dividends from Net Investment Income (1.559) (.374) — (.395) (.023)
Distributions from Realized Capital Gains — — — — —
Total Distributions (1.559) (.374) — (.395) (.023)
Net Asset Value, End of Period $48.34 $49.41 $49.59 $48.36 $49.38
Total Return 1.01% 0.40% 2.54% -1.26% 0.09%
Ratios/Supplemental Data
Net Assets, End of Period (Millions) $5,453 $3,881 $2,478 $1,838 $1,336
Ratio of Total Expenses to Average Net Assets 0.06% 0.06% 0.07% 0.08% 0.10%
Ratio of Net Investment Income to
Average Net Assets 2.81% 1.35% 0.51% (0.44%) 0.98%
Portfolio Turnover Rate2 25% 27% 28% 26% 18%
1 Calculated based on average shares outstanding.
2 Excludes the value of portfolio securities received or delivered as a result of in-kind purchases or redemptions of the fund’s capital shares, including ETF Creation Units.
Financial Highlights
See accompanying Notes, which are an integral part of the Financial Statements.
Short-Term Inflation-Protected Securities Index Fund
15

Admiral Shares
For a Share Outstanding Year Ended September 30,
Throughout Each Period 2018 2017 2016 2015 2014
Net Asset Value, Beginning of Period $24.79 $24.88 $24.27 $24.77 $24.77
Investment Operations
Net Investment Income .6921 .3381 .1491 (.105) .209
Net Realized and Unrealized Gain (Loss)
on Investments (.450) (.241) .461 (.197) (.195)
Total from Investment Operations .242 .097 .610 (.302) .014
Distributions
Dividends from Net Investment Income (.782) (.187) — (.198) (.014)
Distributions from Realized Capital Gains — — — — —
Total Distributions (.782) (.187) — (.198) (.014)
Net Asset Value, End of Period $24.25 $24.79 $24.88 $24.27 $24.77
Total Return2 1.00% 0.40% 2.51% -1.22% 0.06%
Ratios/Supplemental Data
Net Assets, End of Period (Millions) $6,525 $5,078 $3,373 $2,126 $1,518
Ratio of Total Expenses to Average Net Assets 0.06% 0.06% 0.07% 0.08% 0.10%
Ratio of Net Investment Income to
Average Net Assets 2.81% 1.35% 0.51% (0.44%) 0.98%
Portfolio Turnover Rate3 25% 27% 28% 26% 18%
1 Calculated based on average shares outstanding.
2 Total returns do not include account service fees that may have applied in the periods shown. Fund prospectuses provide information about any applicable account service fees.
3 Excludes the value of portfolio securities received or delivered as a result of in-kind purchases or redemptions of the fund’s capital shares, including ETF Creation Units.
Financial Highlights
See accompanying Notes, which are an integral part of the Financial Statements.
Short-Term Inflation-Protected Securities Index Fund
16

Institutional Shares
For a Share Outstanding Year Ended September 30,
Throughout Each Period 2018 2017 2016 2015 2014
Net Asset Value, Beginning of Period $24.81 $24.90 $24.28 $24.78 $24.77
Investment Operations
Net Investment Income .6961 .3331 .1391 (.099) .215
Net Realized and Unrealized Gain (Loss)
on Investments (.449) (.225) .481 (.196) (.189)
Total from Investment Operations .247 .108 .620 (.295) .026
Distributions
Dividends from Net Investment Income (.787) (.198) — (.205) (.016)
Distributions from Realized Capital Gains — — — — —
Total Distributions (.787) (.198) — (.205) (.016)
Net Asset Value, End of Period $24.27 $24.81 $24.90 $24.28 $24.78
Total Return 1.02% 0.44% 2.55% -1.19% 0.11%
Ratios/Supplemental Data
Net Assets, End of Period (Millions) $8,067 $6,986 $5,500 $3,837 $2,706
Ratio of Total Expenses to Average Net Assets 0.04% 0.04% 0.04% 0.05% 0.07%
Ratio of Net Investment Income to
Average Net Assets 2.83% 1.37% 0.54% (0.41%) 1.01%
Portfolio Turnover Rate2 25% 27% 28% 26% 18%
1 Calculated based on average shares outstanding.
2 Excludes the value of portfolio securities received or delivered as a result of in-kind purchases or redemptions of the fund’s capital shares, including ETF Creation Units.
Financial Highlights
See accompanying Notes, which are an integral part of the Financial Statements.
Short-Term Inflation-Protected Securities Index Fund
17

Notes to Financial Statements
Short-Term Inflation-Protected Securities Index Fund
Vanguard Short-Term Inflation-Protected Securities Index Fund is registered under the Investment
Company Act of 1940 as an open-end investment company, or mutual fund. The fund offers four
classes of shares: Investor Shares, ETF Shares, Admiral Shares, and Institutional Shares. Investor
Shares are available to any investor who meets the fund’s minimum purchase requirements. ETF
Shares are listed for trading on Nasdaq; they can be purchased and sold through a broker. Admiral
Shares and Institutional Shares are designed for investors who meet certain administrative, service,
and account-size criteria.
A. The following significant accounting policies conform to generally accepted accounting principles
for U.S. investment companies. The fund consistently follows such policies in preparing its financial
statements.
1. Security Valuation: Securities are valued as of the close of trading on the New York Stock Exchange
(generally 4 p.m., Eastern time) on the valuation date. Bonds and temporary cash investments are
valued using the latest bid prices or using valuations based on a matrix system (which considers
such factors as security prices, yields, maturities, and ratings), both as furnished by independent
pricing services. Investments in Vanguard Market Liquidity Fund are valued at that fund’s net asset
value. Securities for which market quotations are not readily available, or whose values have been
affected by events occurring before the fund’s pricing time but after the close of the securities’
primary markets, are valued by methods deemed by the board of trustees to represent fair value.
2. Futures Contracts: The fund uses futures contracts to invest in fixed income asset classes with
greater efficiency and lower cost than is possible through direct investment, to add value when
these instruments are attractively priced, or to adjust sensitivity to changes in interest rates. The
primary risks associated with the use of futures contracts are imperfect correlation between changes
in market values of bonds held by the fund and the prices of futures contracts, and the possibility
of an illiquid market. Counterparty risk involving futures is mitigated because a regulated clearing-
house is the counterparty instead of the clearing broker. To further mitigate counterparty risk, the
fund trades futures contracts on an exchange, monitors the financial strength of its clearing brokers
and clearinghouse, and has entered into clearing agreements with its clearing brokers. The clearing-
house imposes initial margin requirements to secure the fund’s performance and requires daily
settlement of variation margin representing changes in the market value of each contract. Any
assets pledged as initial margin for open contracts are noted in the Statement of Net Assets.
Futures contracts are valued at their quoted daily settlement prices. The notional amounts of the
contracts are not recorded in the Statement of Net Assets. Fluctuations in the value of the contracts
are recorded in the Statement of Net Assets as an asset (liability) and in the Statement of Operations
as unrealized appreciation (depreciation) until the contracts are closed, when they are recorded as
realized futures gains (losses).
During the year ended September 30, 2018, the fund’s average investments in long and short futures
contracts each represented less than 1% of net assets, respectively, based on the average of the
notional amounts at each quarter-end during the period. The fund had no open futures contracts
at September 30, 2018.
3. Federal Income Taxes: The fund intends to continue to qualify as a regulated investment company
and distribute all of its taxable income. Management has analyzed the fund’s tax positions taken for
all open federal income tax years (September 30, 2015–2018), and has concluded that no provision
for federal income tax is required in the fund’s financial statements.
18

Short-Term Inflation-Protected Securities Index Fund
4. Distributions: Distributions to shareholders are recorded on the ex-dividend date. Distributions
are determined on a tax basis and may differ from net investment income and realized capital gains
for financial reporting purposes.
5. Credit Facility: The fund and certain other funds managed by The Vanguard Group (“Vanguard”)
participate in a $3.1 billion committed credit facility provided by a syndicate of lenders pursuant to
a credit agreement that may be renewed annually; each fund is individually liable for its borrowings,
if any, under the credit facility. Borrowings may be utilized for temporary and emergency purposes,
and are subject to the fund’s regulatory and contractual borrowing restrictions. The participating
funds are charged administrative fees and an annual commitment fee of 0.10% of the undrawn
amount of the facility; these fees are allocated to the funds based on a method approved by the
fund’s board of trustees and included in Management and Administrative expenses on the fund’s
Statement of Operations. Any borrowings under this facility bear interest at a rate based upon the
higher of the one-month London Interbank Offered Rate, federal funds effective rate, or overnight
bank funding rate plus an agreed-upon spread.
The fund had no borrowings outstanding at September 30, 2018, or at any time during the period
then ended.
6. Other: Interest income includes income distributions received from Vanguard Market Liquidity
Fund and is accrued daily. Premiums and discounts on debt securities purchased are amortized
and accreted, respectively, to interest income over the lives of the respective securities. Inflation
adjustments to the face amount of inflation-indexed securities are included in interest income.
Security transactions are accounted for on the date securities are bought or sold. Costs used to
determine realized gains (losses) on the sale of investment securities are those of the specific
securities sold.
Each class of shares has equal rights as to assets and earnings, except that each class separately
bears certain class-specific expenses related to maintenance of shareholder accounts (included in
Management and Administrative expenses), shareholder reporting, and the proxy. Marketing and
distribution expenses are allocated to each class of shares based on a method approved by the
board of trustees. Income, other non-class-specific expenses, and gains and losses on investments
are allocated to each class of shares based on its relative net assets.
B. In accordance with the terms of a Funds’ Service Agreement (the “FSA”) between Vanguard
and the fund, Vanguard furnishes to the fund investment advisory, corporate management,
administrative, marketing, and distribution services at Vanguard’s cost of operations (as defined
by the FSA). These costs of operations are allocated to the fund based on methods and guidelines
approved by the board of trustees. Vanguard does not require reimbursement in the current period
for certain costs of operations (such as deferred compensation/benefits and risk/insurance costs);
the fund’s liability for these costs of operations is included in Payables to Vanguard on the Statement
of Net Assets. All other costs of operations payable to Vanguard are generally settled twice a month.
Upon the request of Vanguard, the fund may invest up to 0.40% of its net assets as capital in
Vanguard. At September 30, 2018, the fund had contributed to Vanguard capital in the amount of
$1,342,000, representing 0.01% of the fund’s net assets and 0.54% of Vanguard’s capitalization.
The fund’s trustees and officers are also directors and employees, respectively, of Vanguard.
19
20
Short-Term Inflation-Protected Securities Index Fund
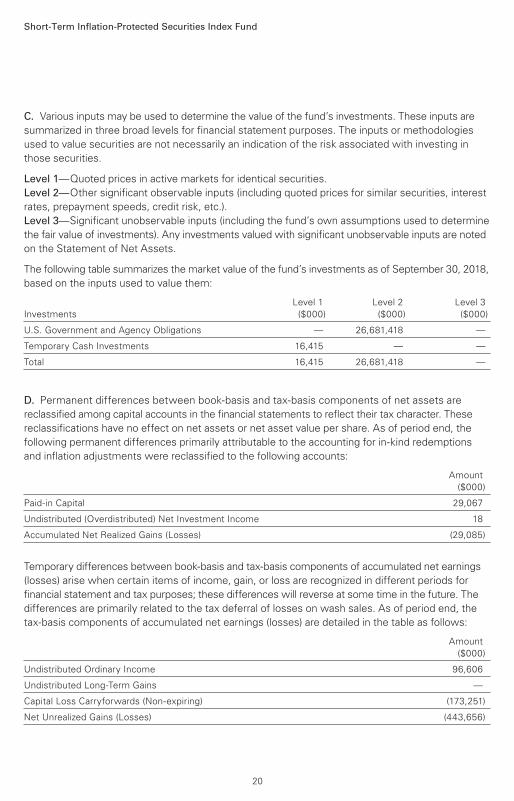
C. Various inputs may be used to determine the value of the fund’s investments. These inputs are
summarized in three broad levels for financial statement purposes. The inputs or methodologies
used to value securities are not necessarily an indication of the risk associated with investing in
those securities.
Level 1—Quoted prices in active markets for identical securities.
Level 2—Other significant observable inputs (including quoted prices for similar securities, interest
rates, prepayment speeds, credit risk, etc.).
Level 3—Significant unobservable inputs (including the fund’s own assumptions used to determine
the fair value of investments). Any investments valued with significant unobservable inputs are noted
on the Statement of Net Assets.
The following table summarizes the market value of the fund’s investments as of September 30, 2018,
based on the inputs used to value them:
Level 1 Level 2 Level 3
Investments ($000) ($000) ($000)
U.S. Government and Agency Obligations — 26,681,418 —
Temporary Cash Investments 16,415 — —
Total 16,415 26,681,418 —
D. Permanent differences between book-basis and tax-basis components of net assets are
reclassified among capital accounts in the financial statements to reflect their tax character. These
reclassifications have no effect on net assets or net asset value per share. As of period end, the
following permanent differences primarily attributable to the accounting for in-kind redemptions
and inflation adjustments were reclassified to the following accounts:
Amount
($000)
Paid-in Capital 29,067
Undistributed (Overdistributed) Net Investment Income 18
Accumulated Net Realized Gains (Losses) (29,085)
Temporary differences between book-basis and tax-basis components of accumulated net earnings
(losses) arise when certain items of income, gain, or loss are recognized in different periods for
financial statement and tax purposes; these differences will reverse at some time in the future. The
differences are primarily related to the tax deferral of losses on wash sales. As of period end, the
tax-basis components of accumulated net earnings (losses) are detailed in the table as follows:
Amount
($000)
Undistributed Ordinary Income 96,606
Undistributed Long-Term Gains —
Capital Loss Carryforwards (Non-expiring) (173,251)
Net Unrealized Gains (Losses) (443,656)

Short-Term Inflation-Protected Securities Index Fund
As of September 30, 2018, gross unrealized appreciation and depreciation for investments and
derivatives based on cost for U.S. federal income tax purposes were as follows:
Amount
($000)
Tax Cost 27,141,489
Gross Unrealized Appreciation —
Gross Unrealized Depreciation (443,656)
Net Unrealized Appreciation (Depreciation) (443,656)
E. During the year ended September 30, 2018, the fund purchased $10,983,028,000 of investment
securities and sold $6,371,883,000 of investment securities, other than temporary cash investments.
Purchases and sales include $1,641,452,000 and $336,914,000, respectively, in connection with
in-kind purchases and redemptions of the fund’s capital shares.
F. Capital share transactions for each class of shares were:
Year Ended September 30,
2018 2017
Amount Shares Amount Shares
($000) (000) ($000) (000)
Investor Shares
Issued 938,053 38,252 1,069,872 43,271
Issued in Lieu of Cash Distributions 196,139 8,067 27,936 1,136
Redeemed (221,815) (9,082) (271,294) (10,974)
Net Increase (Decrease)—Investor Shares 912,377 37,237 826,514 33,433
ETF Shares
Issued 2,079,941 42,425 1,524,321 30,900
Issued in Lieu of Cash Distributions — — — —
Redeemed (398,275) (8,175) (114,917) (2,325)
Net Increase (Decrease)—ETF Shares 1,681,666 34,250 1,409,404 28,575
Admiral Shares
Issued 2,310,017 94,161 2,400,906 97,067
Issued in Lieu of Cash Distributions 170,230 6,995 25,001 1,016
Redeemed (907,090) (36,988) (713,167) (28,817)
Net Increase (Decrease)—Admiral Shares 1,573,157 64,168 1,712,740 69,266
Institutional Shares
Issued 1,960,417 79,837 2,636,078 106,487
Issued in Lieu of Cash Distributions 238,639 9,799 44,322 1,801
Redeemed (953,531) (38,884) (1,176,991) (47,524)
Net Increase (Decrease)—Institutional Shares 1,245,525 50,752 1,503,409 60,764
21

Short-Term Inflation-Protected Securities Index Fund
At September 30, 2018, one shareholder was the record or beneficial owner of 36% of the fund’s
net assets. If the shareholder were to redeem its investment in the fund, the redemption might
result in an increase in the fund’s expense ratio, cause the fund to incur higher transaction costs,
or lead to the realization of taxable capital gains.
G. Management has determined that no events or transactions occurred subsequent to September 30,
2018, that would require recognition or disclosure in these financial statements.
22

To the Board of Trustees of Vanguard Malvern Funds and Shareholders of Vanguard Short-Term
Inflation-Protected Securities Index Fund
Opinion on the Financial Statements
We have audited the accompanying statement of net assets of Vanguard Short-Term Inflation-
Protected Securities Index Fund (one of the funds constituting Vanguard Malvern Funds, referred
to hereafter as the “Fund”) as of September 30, 2018, the related statement of operations for the
year ended September 30, 2018, the statement of changes in net assets for each of the two years
in the period ended September 30, 2018, including the related notes, and the financial highlights
for each of the five years in the period ended September 30, 2018 (collectively referred to as the
“financial statements”). In our opinion, the financial statements present fairly, in all material respects,
the financial position of the Fund as of September 30, 2018, the results of its operations for the year
then ended, the changes in its net assets for each of the two years in the period ended September 30,
2018 and the financial highlights for each of the five years in the period ended September 30, 2018
in conformity with accounting principles generally accepted in the United States of America.
Basis for Opinion
These financial statements are the responsibility of the Fund’s management. Our responsibility
is to express an opinion on the Fund’s financial statements based on our audits. We are a public
accounting firm registered with the Public Company Accounting Oversight Board (United States)
(“PCAOB”) and are required to be independent with respect to the Fund in accordance with the
U.S. federal securities laws and the applicable rules and regulations of the Securities and Exchange
Commission and the PCAOB.
We conducted our audits of these financial statements in accordance with the standards of the
PCAOB. Those standards require that we plan and perform the audit to obtain reasonable assurance
about whether the financial statements are free of material misstatement, whether due to error
or fraud.
Our audits included performing procedures to assess the risks of material misstatement of the
financial statements, whether due to error or fraud, and performing procedures that respond to
those risks. Such procedures included examining, on a test basis, evidence regarding the amounts
and disclosures in the financial statements. Our audits also included evaluating the accounting
principles used and significant estimates made by management, as well as evaluating the overall
presentation of the financial statements. Our procedures included confirmation of securities owned
as of September 30, 2018 by correspondence with the custodians and brokers and by agreement
to the underlying ownership records of the transfer agent; when replies were not received from
brokers, we performed other auditing procedures. We believe that our audits provide a reasonable
basis for our opinion.
/s/PricewaterhouseCoopers LLP
Philadelphia, Pennsylvania
November 15, 2018
We have served as the auditor of one or more investment companies in The Vanguard Group of
Funds since 1975.
Report of Independent Registered Public Accounting Firm
23

Special 2018 tax information (unaudited) for Vanguard Short-Term Inflation-Protected Securities Index Fund
This information for the fiscal year ended September 30, 2018, is included pursuant to provisions
of the Internal Revenue Code.
For nonresident alien shareholders, 99.9% of income dividends are interest-related dividends.
24
About Your Fund’s Expenses
25
As a shareholder of the fund, you incur ongoing costs, which include costs for portfolio management,
administrative services, and shareholder reports (like this one), among others. Operating expenses,
which are deducted from a fund’s gross income, directly reduce the investment return of the fund.
A fund’s expenses are expressed as a percentage of its average net assets. This figure is known as
the expense ratio. The following examples are intended to help you understand the ongoing costs (in
dollars) of investing in your fund and to compare these costs with those of other mutual funds. The
examples are based on an investment of $1,000 made at the beginning of the period shown and held
for the entire period.
The accompanying table illustrates your fund’s costs in two ways:
• Based on actual fund return. This section helps you to estimate the actual expenses that you
paid over the period. The ”Ending Account Value“ shown is derived from the fund‘s actual return,
and the third column shows the dollar amount that would have been paid by an investor who started
with $1,000 in the fund. You may use the information here, together with the amount you invested,
to estimate the expenses that you paid over the period.
To do so, simply divide your account value by $1,000 (for example, an $8,600 account value divided
by $1,000 = 8.6), then multiply the result by the number given for your fund under the heading
”Expenses Paid During Period.“
• Based on hypothetical 5% yearly return. This section is intended to help you compare your
fund‘s costs with those of other mutual funds. It assumes that the fund had a yearly return of 5%
before expenses, but that the expense ratio is unchanged. In this case—because the return used is
not the fund’s actual return—the results do not apply to your investment. The example is useful in
making comparisons because the Securities and Exchange Commission requires all mutual funds to
calculate expenses based on a 5% return. You can assess your fund’s costs by comparing this
hypothetical example with the hypothetical examples that appear in shareholder reports of other
funds.
Note that the expenses shown in the table are meant to highlight and help you compare ongoingcosts only and do not reflect transaction costs incurred by the fund for buying and sellingsecurities. Further, the expenses do not include any purchase, redemption, or account servicefees described in the fund prospectus. If such fees were applied to your account, your costswould be higher. Your fund does not carry a “sales load.”
The calculations assume no shares were bought or sold during the period. Your actual costs may
have been higher or lower, depending on the amount of your investment and the timing of any
purchases or redemptions.
You can find more information about the fund’s expenses, including annual expense ratios, in the
Financial Statements section of this report. For additional information on operating expenses and
other shareholder costs, please refer to your fund’s current prospectus.

26
Six Months Ended September 30, 2018
Short-Term Inflation-Protected Securities Index
Fund
Beginning
Account Value
3/31/2018
Ending
Account Value
9/30/2018
Expenses
Paid During
Period
Based on Actual Fund Return
Investor Shares $1,000.00 $1,005.57 $0.65
ETF Shares 1,000.00 1,005.92 0.30
Admiral Shares 1,000.00 1,005.76 0.30
Institutional Shares 1,000.00 1,006.31 0.20
Based on Hypothetical 5% Yearly Return
Investor Shares $1,000.00 $1,024.42 $0.66
ETF Shares 1,000.00 1,024.77 0.30
Admiral Shares 1,000.00 1,024.77 0.30
Institutional Shares 1,000.00 1,024.87 0.20
The calculations are based on expenses incurred in the most recent six-month period. The fund’s annualized six-month expense ratios forthat period are 0.13% for Investor Shares, 0.06% for ETF Shares, 0.06% for Admiral Shares, and 0.04% for Institutional Shares. The dollaramounts shown as “Expenses Paid” are equal to the annualized expense ratio multiplied by the average account value over the period,multiplied by the number of days in the most recent six-month period, then divided by the number of days in the most recent 12-monthperiod (183/365).

Glossary
27
30-Day SEC Yield. A fund’s 30-day SEC yield is derived using a formula specified by the U.S.
Securities and Exchange Commission. Under the formula, data related to the fund’s security
holdings in the previous 30 days are used to calculate the fund’s hypothetical net income for that
period, which is then annualized and divided by the fund’s estimated average net assets over the
calculation period. For the purposes of this calculation, a security’s income is based on its current
market yield to maturity (for bonds), its actual income (for asset-backed securities), or its
projected dividend yield (for stocks). Because the SEC yield represents hypothetical annualized
income, it will differ—at times significantly—from the fund’s actual experience. As a result, the
fund’s income distributions may be higher or lower than implied by the SEC yield.
Average Coupon. The average interest rate paid on the fixed income securities held by a fund. It
is expressed as a percentage of face value.
Average Duration. An estimate of how much the value of the fund’s bonds will fluctuate in
response to a change in “real” interest rates—meaning rates without inflation expectations built
in. Real interest rates are reflected in market yields for inflation-adjusted securities. To see how
the fund’s bond values could change, multiply the average duration by the change in real rates.
For example, if the average duration were five years, then the value of the fund’s bonds would
decline by about 5% if real interest rates rose by 1 percentage point. Conversely, if real rates fell
by a percentage point, the value of the bonds would rise about 5%.
Average Effective Maturity. The average length of time until fixed income securities held by a
fund reach maturity and are repaid, taking into consideration the possibility that the issuer may call
the bond before its maturity date. The figure reflects the proportion of fund assets represented by
each security; it also reflects any futures contracts held. In general, the longer the average
effective maturity, the more a fund’s share price will fluctuate in response to changes in market
interest rates.
Credit Quality. Credit-quality ratings are measured on a scale that generally ranges from AAA
(highest) to D (lowest). U.S. Treasury, U.S. Agency, and U.S. Agency mortgage-backed securities
appear under “U.S. Government.” Credit-quality ratings are obtained from Barclays and are from
Moody’s, Fitch, and S&P. When ratings from all three agencies are used, the median rating is
shown. When ratings from two of the agencies are used, the lower rating for each issue is
shown. “Not Rated” is used to classify securities for which a rating is not available.
Expense Ratio. A fund’s total annual operating expenses expressed as a percentage of the fund’s
average net assets. The expense ratio includes management and administrative expenses, but
does not include the transaction costs of buying and selling portfolio securities.
Inception Date. The date on which the assets of a fund (or one of its share classes) are first
invested in accordance with the fund’s investment objective. For funds with a subscription period,
the inception date is the day after that period ends. Investment performance is measured from
the inception date.
Short-Term Reserves. The percentage of a fund invested in highly liquid, short-term securities
that can be readily converted to cash.

28
Yield to Maturity. This term generally refers to the rate of return an investor would receive if the
fixed income securities held by a fund were held to their maturity dates. For the Short-Term
Inflation-Protected Securities Index Fund, the calculation is modified by adding in the inflation
adjustment made over the past 12 months. This change results in a figure more directly
comparable to the yield-to-maturity figures for other types of bond funds. (An unmodified yield to
maturity is used in calculating the fund’s 30-Day SEC Yield.)

BLOOMBERG is a trademark and service mark of Bloomberg Finance L.P. BARCLAYS is a trademark and service mark of
Barclays Bank Plc, used under license. Bloomberg Finance L.P. and its affiliates, including Bloomberg Index Services Limited
(BISL) (collectively, Bloomberg), or Bloomberg’s licensors, own all proprietary rights in the Bloomberg Barclays U.S. Treasury
Inflation-Protected Securities (Tips) 0–5 Year Index (Index or Bloomberg Barclays Index).
Neither Barclays Bank Plc, Barclays Capital Inc., or any affiliate (collectively Barclays) or Bloomberg is the issuer or
producer of the Short-Term Inflation-Protected Securities Index Fund and neither Bloomberg nor Barclays has any
responsibilities, obligations or duties to investors in the Short-Term Inflation-Protected Securities Index Fund. The Index is
licensed for use by The Vanguard Group, Inc. (Vanguard) as the sponsor of the Short-Term Inflation-Protected Securities
Index Fund. Bloomberg and Barclays’ only relationship with Vanguard in respect of the Index is the licensing of the Index,
which is determined, composed and calculated by BISL, or any successor thereto, without regard to the Issuer or the Short-
Term Inflation-Protected Securities Index Fund or the owners of the Short-Term Inflation-Protected Securities Index Fund.
Additionally, Vanguard may for itself execute transaction(s) with Barclays in or relating to the Index in connection with the
Short-Term Inflation-Protected Securities Index Fund. Investors acquire the Short-Term Inflation-Protected Securities Index
Fund from Vanguard and investors neither acquire any interest in the Index nor enter into any relationship of any kind
whatsoever with Bloomberg or Barclays upon making an investment in the Short-Term Inflation-Protected Securities Index
Fund. The Short-Term Inflation-Protected Securities Index Fund is not sponsored, endorsed, sold or promoted by Bloomberg
or Barclays. Neither Bloomberg nor Barclays makes any representation or warranty, express or implied regarding the
advisability of investing in the Short-Term Inflation-Protected Securities Index Fund or the advisability of investing in
securities generally or the ability of the Index to track corresponding or relative market performance. Neither Bloomberg
nor Barclays has passed on the legality or suitability of the Short-Term Inflation-Protected Securities Index Fund with
respect to any person or entity. Neither Bloomberg nor Barclays is responsible for and has not participated in the
determination of the timing of, prices at, or quantities of the Short-Term Inflation-Protected Securities Index Fund to be
issued. Neither Bloomberg nor Barclays has any obligation to take the needs of the Issuer or the owners of the Short-Term
Inflation-Protected Securities Index Fund or any other third party into consideration in determining, composing or
calculating the Index. Neither Bloomberg nor Barclays has any obligation or liability in connection with administration,
marketing or trading of the Short-Term Inflation-Protected Securities Index Fund.
29

The licensing agreement between Bloomberg and Barclays is solely for the benefit of Bloomberg and Barclays and not for
the benefit of the owners of the Short-Term Inflation-Protected Securities Index Fund, investors or other third parties. In
addition, the licensing agreement between Vanguard and Bloomberg is solely for the benefit of Vanguard and Bloomberg
and not for the benefit of the owners of the Short-Term Inflation-Protected Securities Index Fund, investors or other
third parties.
NEITHER BLOOMBERG NOR BARCLAYS SHALL HAVE ANY LIABILITY TO THE ISSUER, INVESTORS OR TO OTHER THIRD
PARTIES FOR THE QUALITY, ACCURACY AND/OR COMPLETENESS OF THE BLOOMBERG BARCLAYS INDEX OR ANY
DATA INCLUDED THEREIN OR FOR INTERRUPTIONS IN THE DELIVERY OF THE BLOOMBERG BARCLAYS INDEX. NEITHER
BLOOMBERG NOR BARCLAYS MAKES ANY WARRANTY, EXPRESS OR IMPLIED, AS TO RESULTS TO BE OBTAINED BY
THE ISSUER, THE INVESTORS OR ANY OTHER PERSON OR ENTITY FROM THE USE OF THE BLOOMBERG BARCLAYS
INDEX OR ANY DATA INCLUDED THEREIN. NEITHER BLOOMBERG NOR BARCLAYS MAKES ANY EXPRESS OR IMPLIED
WARRANTIES, AND EACH HEREBY EXPRESSLY DISCLAIMS ALL WARRANTIES OF MERCHANTABILITY OR FITNESS FOR
A PARTICULAR PURPOSE OR USE WITH RESPECT TO THE BLOOMBERG BARCLAYS INDEX OR ANY DATA INCLUDED
THEREIN. BLOOMBERG RESERVES THE RIGHT TO CHANGE THE METHODS OF CALCULATION OR PUBLICATION, OR
TO CEASE THE CALCULATION OR PUBLICATION OF THE BLOOMBERG BARCLAYS INDEX, AND NEITHER BLOOMBERG
NOR BARCLAYS SHALL BE LIABLE FOR ANY MISCALCULATION OF OR ANY INCORRECT, DELAYED OR INTERRUPTED
PUBLICATION WITH RESPECT TO ANY OF THE BLOOMBERG BARCLAYS INDEX. NEITHER BLOOMBERG NOR
BARCLAYS SHALL BE LIABLE FOR ANY DAMAGES, INCLUDING, WITHOUT LIMITATION, ANY SPECIAL, INDIRECT
OR CONSEQUENTIAL DAMAGES, OR ANY LOST PROFITS AND EVEN IF ADVISED OF THE POSSIBILITY OF SUCH,
RESULTING FROM THE USE OF THE BLOOMBERG BARCLAYS INDEX OR ANY DATA INCLUDED THEREIN OR WITH
RESPECT TO THE SHORT-TERM INFLATION-PROTECTED SECURITIES INDEX FUND.
None of the information supplied by Bloomberg or Barclays and used in this publication may be reproduced in any manner
without the prior written permission of both Bloomberg and Barclays Capital, the investment banking division of Barclays
Bank Plc. Barclays Bank Plc is registered in England No. 1026167. Registered office 1 Churchill Place London E14 5HP.
© 2018 Bloomberg. Used with Permission.
Source: Bloomberg Index Services Limited. Copyright 2018, Bloomberg. All rights reserved.
30

The People Who Govern Your Fund
The trustees of your mutual fund are there to see that the fund is operated and managed in your
best interests since, as a shareholder, you are a part owner of the fund. Your fund’s trustees also
serve on the board of directors of The Vanguard Group, Inc., which is owned by the Vanguard
funds and provides services to them on an at-cost basis.
A majority of Vanguard’s board members are independent, meaning that they have no affiliation
with Vanguard or the funds they oversee, apart from the sizable personal investments they have
made as private individuals. The independent board members have distinguished backgrounds
in business, academia, and public service. Each of the trustees and executive officers oversees
211 Vanguard funds.
Information for each trustee and executive officer of the fund appears below. The mailing address
of the trustees and officers is P.O. Box 876, Valley Forge, PA 19482. More information about the
trustees is in the Statement of Additional Information, which can be obtained, without charge,
by contacting Vanguard at 800-662-7447, or online at vanguard.com.
Interested Trustees1
F. William McNabb III
Born in 1957. Trustee since July 2009. Principal
occupation(s) during the past five years and
other experience: chairman of the board
(January 2010–present) of Vanguard and of each
of the investment companies served by Vanguard,
trustee (2009–present) of each of the investment
companies served by Vanguard, and director
(2008–present) of Vanguard. Chief executive officer
and president (2008–2017) of Vanguard and each
of the investment companies served by Vanguard,
managing director (1995–2008) of Vanguard,
and director (1997–2018) of Vanguard Marketing
Corporation. Director (2018–present) of
UnitedHealth Group.
Mortimer J. Buckley
Born in 1969. Trustee since January 2018. Principal
occupation(s) during the past five years and
other experience: chief executive officer
(January 2018–present) of Vanguard; chief executive
officer, president, and trustee (January 2018–present)
of each of the investment companies served by
Vanguard; president and director (2017–present) of
Vanguard; and president (February 2018–present) of
Vanguard Marketing Corporation. Chief investment
officer (2013–2017), managing director (2002–2017),
head of the Retail Investor Group (2006–2012), and
chief information officer (2001–2006) of Vanguard.
Chairman of the board (2011–2017) of the Children’s
Hospital of Philadelphia.
Independent Trustees
Emerson U. Fullwood
Born in 1948. Trustee since January 2008. Principal
occupation(s) during the past five years and other
experience: executive chief staff and marketing officer
for North America and corporate vice president (retired
2008) of Xerox Corporation (document management
products and services). Former president of the
Worldwide Channels Group, Latin America, and
Worldwide Customer Service and executive chief
staff officer of Developing Markets of Xerox. Executive
in residence and 2009–2010 Distinguished Minett
Professor at the Rochester Institute of Technology.
Lead director of SPX FLOW, Inc. (multi-industry
manufacturing). Director of the University of Rochester
Medical Center, the Monroe Community College
Foundation, the United Way of Rochester, North
Carolina A&T University, and Roberts Wesleyan
College. Trustee of the University of Rochester.
Amy Gutmann
Born in 1949. Trustee since June 2006. Principal
occupation(s) during the past five years and other
experience: president (2004–present) of the University
of Pennsylvania. Christopher H. Browne Distinguished
Professor of Political Science, School of Arts and
Sciences, and professor of communication, Annenberg
School for Communication, with secondary faculty
appointments in the Department of Philosophy, School
of Arts and Sciences, and at the Graduate School of
Education, University of Pennsylvania. Trustee of the
National Constitution Center.
1 Mr. McNabb and Mr. Buckley are considered “interested persons,” as defined in the Investment Company Act of 1940, because they are officers of the Vanguard funds.

JoAnn Heffernan Heisen
Born in 1950. Trustee since July 1998. Principal
occupation(s) during the past five years and other
experience: corporate vice president of Johnson &
Johnson (pharmaceuticals/medical devices/consumer
products) and member of its executive committee
(1997–2008). Chief global diversity officer (retired
2008), vice president and chief information officer
(1997–2006), controller (1995–1997), treasurer
(1991–1995), and assistant treasurer (1989–1991)
of Johnson & Johnson. Director of Skytop Lodge
Corporation (hotels) and the Robert Wood Johnson
Foundation. Member of the advisory board of the
Institute for Women’s Leadership at Rutgers University.
F. Joseph Loughrey
Born in 1949. Trustee since October 2009. Principal
occupation(s) during the past five years and other
experience: president and chief operating officer
(retired 2009) and vice chairman of the board
(2008–2009) of Cummins Inc. (industrial machinery).
Chairman of the board of Hillenbrand, Inc. (specialized
consumer services), Oxfam America, and the Lumina
Foundation for Education. Director of the V Foundation
for Cancer Research. Member of the advisory council
for the College of Arts and Letters and chair of the
advisory board to the Kellogg Institute for International
Studies, both at the University of Notre Dame.
Mark Loughridge
Born in 1953. Trustee since March 2012. Principal
occupation(s) during the past five years and other
experience: senior vice president and chief financial
officer (retired 2013) of IBM (information technology
services). Fiduciary member of IBM’s Retirement
Plan Committee (2004–2013), senior vice president
and general manager (2002–2004) of IBM Global
Financing, vice president and controller (1998–2002)
of IBM, and a variety of other prior management roles
at IBM. Member of the Council on Chicago Booth.
Scott C. Malpass
Born in 1962. Trustee since March 2012. Principal
occupation(s) during the past five years and other
experience: chief investment officer (1989–present)
and vice president (1996–present) of the University
of Notre Dame. Assistant professor of finance at the
Mendoza College of Business, University of Notre
Dame, and member of the Notre Dame 403(b)
Investment Committee. Chairman of the board of
TIFF Advisory Services, Inc. Member of the board
of Catholic Investment Services, Inc. (investment
advisors), the board of advisors for Spruceview
Capital Partners, and the board of superintendence
of the Institute for the Works of Religion.
Deanna Mulligan
Born in 1963. Trustee since January 2018. Principal
occupation(s) during the past five years and other
experience: president (2010–present) and chief
executive officer (2011–present) of The Guardian
Life Insurance Company of America. Chief operating
officer (2010–2011) and executive vice president
(2008–2010) of Individual Life and Disability of
The Guardian Life Insurance Company of America.
Member of the board of The Guardian Life Insurance
Company of America, the American Council of Life
Insurers, the Partnership for New York City (business
leadership), and the Committee Encouraging Corporate
Philanthropy. Trustee of the Economic Club of New
York and the Bruce Museum (arts and science).
Member of the Advisory Council for the Stanford
Graduate School of Business.
André F. Perold
Born in 1952. Trustee since December 2004. Principal
occupation(s) during the past five years and other
experience: George Gund Professor of Finance and
Banking, Emeritus at the Harvard Business School
(retired 2011). Chief investment officer and co-
managing partner of HighVista Strategies LLC
(private investment firm). Overseer of the Museum
of Fine Arts Boston.
Sarah Bloom Raskin
Born in 1961. Trustee since January 2018. Principal
occupation(s) during the past five years and other
experience: deputy secretary (2014–2017) of
the United States Department of the Treasury.
Governor (2010–2014) of the Federal Reserve Board.
Commissioner (2007–2010) of financial regulation
for the State of Maryland. Member of the board of
directors (2012–2014) of Neighborhood Reinvestment
Corporation. Director of i(x) Investments, LLC.
Peter F. Volanakis
Born in 1955. Trustee since July 2009. Principal
occupation(s) during the past five years and other
experience: president and chief operating officer
(retired 2010) of Corning Incorporated (communications
equipment) and director of Corning Incorporated
(2000–2010) and Dow Corning (2001–2010).
Director (2012) of SPX Corporation (multi-industry
manufacturing). Overseer of the Amos Tuck School
of Business Administration, Dartmouth College
(2001–2013). Chairman of the board of trustees of
Colby-Sawyer College. Member of the Board of
Hypertherm Inc. (industrial cutting systems, software,
and consumables).

Executive Officers
Glenn Booraem
Born in 1967. Principal occupation(s) during the past
five years and other experience: principal of Vanguard.
Investment stewardship officer (2017–present),
treasurer (2015–2017), controller (2010–2015),
and assistant controller (2001–2010) of each of
the investment companies served by Vanguard.
Christine M. Buchanan
Born in 1970. Principal occupation(s) during the past
five years and other experience: principal of Vanguard
and global head of Fund Administration at Vanguard.
Treasurer (2017–present) of each of the investment
companies served by Vanguard. Partner (2005–2017)
at KPMG LLP (audit, tax, and advisory services).
Brian Dvorak
Born in 1973. Principal occupation(s) during the past
five years and other experience: principal of Vanguard.
Chief compliance officer (2017–present) of Vanguard
and each of the investment companies served by
Vanguard. Assistant vice president (2017–present) of
Vanguard Marketing Corporation. Vice president and
director of Enterprise Risk Management (2011–2013)
at Oppenheimer Funds, Inc.
Thomas J. Higgins
Born in 1957. Principal occupation(s) during the past
five years and other experience: principal of Vanguard.
Chief financial officer (2008–present) and treasurer
(1998–2008) of each of the investment companies
served by Vanguard.
Peter Mahoney
Born in 1974. Principal occupation(s) during the past
five years and other experience: principal of Vanguard.
Controller (2015–present) of each of the investment
companies served by Vanguard. Head of International
Fund Services (2008–2014) at Vanguard.
Anne E. Robinson
Born in 1970. Principal occupation(s) during the
past five years and other experience: general
counsel (2016–present) of Vanguard. Secretary
(2016–present) of Vanguard and of each of the
investment companies served by Vanguard.
Managing director (2016–present) of Vanguard.
Director and senior vice president (2016–2018)
of Vanguard Marketing Corporation. Managing
director and general counsel of Global Cards and
Consumer Services (2014–2016) at Citigroup.
Counsel (2003–2014) at American Express.
Michael Rollings
Born in 1963. Principal occupation(s) during the
past five years and other experience: finance
director (2017–present) and treasurer (2017) of each
of the investment companies served by Vanguard.
Managing director (2016–present) of Vanguard. Chief
financial officer (2016–present) of Vanguard. Director
(2016–present) of Vanguard Marketing Corporation.
Executive vice president and chief financial officer
(2006–2016) of MassMutual Financial Group.
Vanguard Senior Management Team
Joseph Brennan Chris D. McIsaac
Mortimer J. Buckley James M. Norris
Gregory Davis Thomas M. Rampulla
John James Karin A. Risi
Martha G. King Anne E. Robinson
John T. Marcante Michael Rollings
Chairman Emeritus and Senior Advisor
John J. Brennan
Chairman, 1996–2009
Chief Executive Officer and President, 1996–2008
Founder
John C. Bogle
Chairman and Chief Executive Officer, 1974–1996

P.O. Box 2600
Valley Forge, PA 19482-2600
Connect with Vanguard® > vanguard.com
Fund Information > 800-662-7447
Direct Investor Account Services > 800-662-2739
Institutional Investor Services > 800-523-1036
Text Telephone for PeopleWho Are Deaf or Hard of Hearing > 800-749-7273
This material may be used in conjunctionwith the offering of shares of any Vanguardfund only if preceded or accompanied bythe fund’s current prospectus.
All comparative mutual fund data are from Lipper, aThomson Reuters Company, or Morningstar, Inc., unlessotherwise noted.
You can obtain a free copy of Vanguard’s proxy votingguidelines by visiting vanguard.com/proxyreporting or bycalling Vanguard at 800-662-2739. The guidelines arealso available from the SEC’s website, sec.gov. Inaddition, you may obtain a free report on how your fundvoted the proxies for securities it owned during the 12months ended June 30. To get the report, visit eithervanguard.com/proxyreporting or sec.gov.
You can review and copy information about your fund atthe SEC’s Public Reference Room in Washington, D.C. Tofind out more about this public service, call the SEC at202-551-8090. Information about your fund is alsoavailable on the SEC’s website, and you can receivecopies of this information, for a fee, by sending arequest in either of two ways: via email addressed [email protected] or via regular mail addressed to thePublic Reference Section, Securities and ExchangeCommission, Washington, DC 20549-1520.
© 2018 The Vanguard Group, Inc.All rights reserved.Vanguard Marketing Corporation, Distributor.
Q19670 112018