vanguard inflation-protected securities fund€¢ for the 12 months ended december 31, 2017,...
TRANSCRIPT

Vanguard Inflation-Protected Securities Fund
Annual Report | December 31, 2017

Contents
Please note: The opinions expressed in this report are just that—informed opinions. They should not be considered promisesor advice. Also, please keep in mind that the information and opinions cover the period through the date on the front of thisreport. Of course, the risks of investing in your fund are spelled out in the prospectus.
See the Glossary for definitions of investment terms used in this report.About the cover: Nautical images have been part of Vanguard’s rich heritage since its start in 1975. For anincoming ship, a lighthouse offers a beacon and safe path to shore. You can similarly depend on Vanguard to putyou first––and light the way––as you strive to meet your financial goals. Our client focus and low costs,stemming from our unique ownership structure, assure that your interests are paramount.
Vanguard’s Principles for Investing Success
We want to give you the best chance of investment success. Theseprinciples, grounded in Vanguard’s research and experience, can put you onthe right path.
Goals. Create clear, appropriate investment goals.
Balance. Develop a suitable asset allocation using broadly diversified funds.
Cost. Minimize cost.
Discipline. Maintain perspective and long-term discipline.
A single theme unites these principles: Focus on the things you can control.We believe there is no wiser course for any investor.
Your Fund’s Performance at a Glance. . . . . . . . . . . . . . . . . . 1
Chairman’s Perspective. . . . . . . . . . . . . . . . . . . . . . . . . . . . . 3
Advisor’s Report. . . . . . . . . . . . . . . . . . . . . . . . . . . . . . . . . . . 7
Results of Proxy Voting. . . . . . . . . . . . . . . . . . . . . . . . . . . . 11
Fund Profile. . . . . . . . . . . . . . . . . . . . . . . . . . . . . . . . . . . . . .13
Performance Summary. . . . . . . . . . . . . . . . . . . . . . . . . . . . .14
Financial Statements. . . . . . . . . . . . . . . . . . . . . . . . . . . . . . 16
About Your Fund’s Expenses. . . . . . . . . . . . . . . . . . . . . . . . 31
Glossary. . . . . . . . . . . . . . . . . . . . . . . . . . . . . . . . . . . . . . . . 33

Your Fund’s Performance at a Glance
1
Total Returns: Fiscal Year Ended December 31, 2017
30-Day SECYield
IncomeReturns
CapitalReturns
TotalReturns
Vanguard Inflation-Protected Securities Fund
Investor Shares 0.26% 2.35% 0.46% 2.81%
Admiral™ Shares 0.36 2.44 0.47 2.91
Institutional Shares 0.39 2.49 0.48 2.97
Bloomberg Barclays U.S. Treasury Inflation ProtectedSecurities Index 3.01
Inflation-Protected Bond Funds Average 2.44
Inflation-Protected Bond Funds Average: Derived from data provided by Lipper, a Thomson Reuters Company.
Admiral Shares carry lower expenses and are available to investors who meet certain account-balance requirements. Institutional Sharesare available to certain institutional investors who meet specific administrative, service, and account-size criteria.
Total Returns: Ten Years Ended December 31, 2017
Average
Annual Return
Inflation-Protected Securities Fund Investor Shares 3.26%
Bloomberg Barclays U.S. Treasury Inflation Protected Securities Index 3.53
Inflation-Protected Bond Funds Average 2.67
Inflation-Protected Bond Funds Average: Derived from data provided by Lipper, a Thomson Reuters Company.
The figures shown represent past performance, which is not a guarantee of future results. (Current performance may be lower or higher than the performance data cited. For performance data current to the most recent month-end, visit our website at vanguard.com/performance.) Note, too, that both investment returns and principal value can fluctuate widely, so an investor’s shares, when sold, could be worth more or less than their original cost.
• For the 12 months ended December 31, 2017, Vanguard Inflation-Protected
Securities Fund returned 2.81% for Investor Shares, 2.91% for Admiral Shares, and
2.97% for Institutional Shares. Those returns were in line with the return of the fund’s
benchmark, the Bloomberg Barclays U.S. Treasury Inflation Protected Securities Index,
and ahead of the average return of peer-group funds.
• Short-term rates rose in reaction to the Federal Reserve’s three interest rate hikes
during the year. But yields fell and prices rose for longer-term bonds, reflecting
uncertainty over the direction of inflation and the current administration’s legislative
agenda. Treasuries underperformed investment-grade corporate bonds.
• Yields of Treasury inflation-protected securities (TIPS) were higher on the short end
of the maturity spectrum but decreased on the longer end.
• A measure of expected inflation over the next five years—based on the gap between
nominal Treasury and TIPS yields—increased slightly, to 1.83% from 1.80%.

2
Expense RatiosYour Fund Compared With Its Peer Group
Investor
Shares
Admiral
Shares
Institutional
Shares
Peer Group
Average
Inflation-Protected Securities Fund 0.20% 0.10% 0.07% 0.74%
The fund expense ratios shown are from the prospectus dated April 26, 2017, and represent estimated costs for the current fiscal year. Forthe fiscal year ended December 31, 2017, the fund’s expense ratios were 0.20% for Investor Shares, 0.10% for Admiral Shares, and0.07% for Institutional Shares. The peer-group expense ratio is derived from data provided by Lipper, a Thomson Reuters Company, andcaptures information through year-end 2016.
Peer group: Inflation-Protected Bond Funds.

Dear Shareholder,
Lately I’ve been asked a lot about my
legacy. And candidly, that phrase bugs
me—it isn’t my legacy. Vanguard’s
success is a result of thousands of
my colleagues committing to a clear
mission: helping investors achieve
their financial goals.
The reason the topic has come up is
that on December 31, 2017, I officially
stepped down as Vanguard’s CEO after
almost a decade in that role. I’ll remain
chairman for a period to be determined
by the board of directors. Tim Buckley,
who was previously Vanguard’s president
and chief investment officer, was elected
CEO. I can’t think of a better successor.
I’ve spent 32 years at Vanguard—almost
my entire professional life—and during
that time I’ve had the good fortune of
working with smart, principled colleagues
from across the world. I’ve learned from
each of them.
In particular, I would like to thank
Jack Bogle, our founder, who took a
chance on me when I was a young
business school graduate, and Jack
Brennan, my predecessor as CEO,
who constantly challenged me with
new roles and responsibilities.
Chairman’s Perspective
Bill McNabbChairman
3

When you’re just starting out, there
is nothing quite like getting votes of
confidence from people you respect.
The short listA milestone like this naturally brings about
some reflection. With that in mind, here’s
a tally—by no means exhaustive—of the
accomplishments that we at Vanguard are
proud of:
Low costs. Over the last decade, we cut
our average asset-weighted expense ratio
by about 50%.1 This isn’t a result of some
contrived price war. Since its founding,
Vanguard has emphasized the benefits
of low-cost investing. As Jack Bogle once
said: “The honest steward who charges
least, wins most. But not for himself; for
those investors who entrust their assets
to his care. It is not all that complicated.”
Global diversification. Through our
thought leadership and investment
options, such as our target-date funds,
Vanguard has encouraged clients to
obtain exposure to international markets.
Global diversification isn’t just about
helping to control risk—it can also be a
way of expanding your set of opportunities
and harnessing the potential of all markets.
Market Barometer Average Annual Total Returns
Periods Ended December 31, 2017
One Year Three Years Five Years
Stocks
Russell 1000 Index (Large-caps) 21.69% 11.23% 15.71%
Russell 2000 Index (Small-caps) 14.65 9.96 14.12
Russell 3000 Index (Broad U.S. market) 21.13 11.12 15.58
FTSE All-World ex US Index (International) 27.11 8.27 7.19
Bonds
Bloomberg Barclays U.S. Aggregate Bond Index
(Broad taxable market) 3.54% 2.24% 2.10%
Bloomberg Barclays Municipal Bond Index
(Broad tax-exempt market) 5.45 2.98 3.02
Citigroup Three-Month U.S. Treasury Bill Index 0.84 0.37 0.23
CPI
Consumer Price Index 2.11% 1.64% 1.43%
1 Source: Vanguard calculation, based on data from Morningstar, Inc., as of December 31, 2016.
4

I’ve been glad to see more and more
clients embracing global diversification.
I believe this trend will continue as
Vanguard’s way of investing takes
hold in international markets.
Affordable advice. In the wake of the
2008–2009 Global Financial Crisis, we
began working on a new advice model.
In 2015, we launched Vanguard Personal
Advisor Services®, a hybrid advice offering
that delivers value through a combination
of a professional advisor and powerful
digital technology at a competitive price.
Across the industry, we’ve seen the
cost of providing advice coming down.
Traditional advisors are embracing
low-cost investments, and that, in turn,
helps them reduce costs for their own
clients. This is a trend that all of us at
Vanguard would like to see continue.
Great people. I’ve interacted with
hundreds of companies of all sizes and
in all industries, and the one quality that
sets Vanguard apart from most of them is
our emphasis on people. It’s a testament
to our culture that colleagues spend 15,
20, or, as in my case, more than 30 years
of their professional lives here. Investors
benefit because we have consistent,
experienced fund management teams
and a deep bench of talent that ensures
that things go smoothly when it’s time
for a transition.
We’ve done a great job attracting new
talent, too. We made some notable
additions to senior management in the
last two years, and we’re continuously
grooming our next generation of leaders.
Ready for what comes nextWhen I was contemplating coming to
work at Vanguard, I sat down with my
rowing coach at his home in Philadelphia.
Over cheese steaks, he told me that the
most important thing was to work for a
company that had the same values I held
deeply. He was like a second father to
me, so I trusted his judgment at a time
when I wasn’t so sure about my own.
Back then, I never could have anticipated
the success Vanguard would have in the
coming decades.
I’m no better at predicting the future
now. Vanguard has enjoyed significant
growth in the last few years, and that
presents its own unique set of challenges
and opportunities, such as the role we’re
playing in advocating for better corporate
governance among companies our funds
invest in. And the asset management
industry is confronting significant changes
brought on by technology, shifting
demographics, and new regulations.
Although the future is uncertain, I’m
confident that Vanguard is well-prepared
to tackle whatever comes its way. And
one thing I’m sure of: There are big parts
of the world that would be well-served
by our way of investing.
5

It’s humbling to think about the impact
the work we do at Vanguard has on
clients who are trying to raise a family,
buy a first home, save for college, or
prepare for retirement. I’ve always tried
to make decisions with investors’ best
interests in mind. It has been a privilege
working with people who hold to that
same ideal.
Thank you for entrusting us with
your assets.
Sincerely,
F. William McNabb III
Chairman
January 1, 2018
6

Advisor’s Report
7
For the 12 months ended December 31,
2017, Vanguard Inflation-Protected
Securities Fund returned 2.81% for
Investor Shares, 2.91% for Admiral
Shares, and 2.97% for Institutional Shares.
Those returns were in line with the return
of the fund’s benchmark, the Bloomberg
Barclays U.S. Treasury Inflation Protected
Securities Index, and ahead of the average
return of peer-group funds.
Investment environmentA surge of optimism that followed the
November 2016 U.S. presidential election
spilled over into the beginning of the
year, as investors grew enthusiastic
about a new policy agenda focused on
tax reform, infrastructure spending, and
greater deregulation—all designed to spark
economic growth. While political gridlock
initially cooled some of that optimism,
stocks continued to rise throughout the
period, with many market indexes hitting
record highs as companies posted strong
profits and initiatives such as tax reform
were passed by Congress.
The Federal Reserve was also enthusiastic
about the health of the U.S. economy. It
raised rates three times during the year,
pushing its target range for the federal
funds rate to 1.25%–1.5%. It also began
to reduce its $4.5 trillion balance sheet.
All were signals that the central bank was
intent on normalizing monetary policy.
The Fed’s decisions were likely buoyed
by decent economic readings. The U.S.
economy shrugged off weather-related
events to grow at a 3% pace in the third
quarter. (Fourth-quarter results were not
available at the time of this writing.) That
performance was spurred by increases
in consumer spending, investments in
Yields of U.S. Treasury Inflation-Protected Securities(Real Yields)
December 31, June 30, December 31,
Maturity 2016 2017 2017
2 Years -0.54% -0.25% 0.19%
3 Years -0.35 -0.19 0.21
5 Years 0.13 0.13 0.38
7 Years 0.43 0.39 0.51
10 Years 0.62 0.57 0.60
20 Years 0.89 0.85 0.73
30 Years 1.06 1.04 0.83
Source: Vanguard.

8
inventory, and exports. The unemployment
rate continued to grind lower, dropping to
4.1% in December after starting the year
at 4.8%. But wage growth remained
elusive, with workers, on average, making
as much at the end of the period as when
it started.
Inflation confounded market watchers.
As the year began, annual changes in the
consumer price index (CPI) approached
or exceeded the Fed’s 2% target, but
inflation readings moderated throughout
the spring and early summer. Another
measure that is watched closely by the
Fed, the core personal consumption
expenditures (PCE) index, also moderated
in the middle of the year and remained
below the CPI and the Fed’s target
inflation level.
While it wasn’t clear what was behind
the readings—sluggish commodity prices
may have been a culprit—some market
watchers believed the Fed had gotten
ahead of itself with interest rate hikes,
leading to a sell-off in parts of the bond
market. However, Janet Yellen, the Fed
chairwoman at the time, described the
effect as “transitory,” which seemed to
be proven out as inflation inched back
up while the year drew to a close.
Management of the portfolioThe U.S. Treasury uses the non-seasonally
adjusted CPI for urban consumers (CPI-U
NSA) to govern the inflation adjustments
made for Treasury inflation-protected
securities (TIPS). In general, this measure
rose for most of the period. It increased
the most in January (+0.6%) and
September (+0.5%) and decreased
slightly in July, October, and December.
The short end of the TIPS yield curve,
which is sensitive to interest rates,
increased amid the Fed’s three rate hikes
(and investors expected more increases in
2018). Short-term yields turned positive for
the first time in years. The 1-year TIPS real
yield ended the period at 0.15%, up from
–0.69% a year earlier, and the 3-year TIPS
real yield finished at 0.21%, up from
–0.35% 12 months earlier.
Long-term TIPS yields decreased,
reversing a trend that began toward the
end of the previous year, when investors
flocked to riskier assets as they grew
optimistic about the new administration’s
policy agenda. The decrease was likely the
result of uncertainty over the direction of
inflation and an acknowledgement that the
legislative agenda and regulatory rollback
would bolster growth in the near term.
The 30-year TIPS real yield ended the
period at 0.83%, down from 1.06% at
the beginning of the period. The 10-year
TIPS real yield ended the period at 0.60%,
down from 0.62% one year earlier.
In the Treasury market, yields followed
a similar trajectory. The 1-year and 3-year
yields ended the period at 1.74% and
1.97%, respectively, up from 0.81%
and 1.45% at the beginning of the year.

9
Meanwhile, long-term Treasury yields
decreased. The 30-year and the 10-year
nominal yields ended the period at
2.74% and 2.41% respectively, down
from 3.07% and 2.45% one year earlier.
The break-even inflation (BEI) rate,
which is the difference between
nominal Treasury yields and TIPS yields,
changed only modestly during the year.
For example, the 2-year BEI declined
to 1.69% from 1.73%, the 5-year BEI
increased to 1.83% from 1.80%, and
the 10-year BEI dropped to 1.81%
from 1.83%.
Heading into the year, we maintained
an overweight allocation to long-dated
securities, reflecting our expectation that
the Fed would maintain a very gradual
pace of rate hikes. That positioning initially
detracted from performance as inflation
readings weakened and investors moved
out of TIPS.
We continued to see potential in these
securities, however, given our view that
inflation would move higher in the medium
term. That conviction paid off as the year
progressed and inflation moved higher
amid stronger global growth and the
narrowing of the gap between the actual
output of the economy and its potential
output. We unwound our break-even
inflation trade as we anticipated inflation
to moderate. We reallocated those assets
across the curve and into tactical positions
that adhere to our inflation outlook.
In a year with 2%-plus inflation, we were
successful at generating sufficient income
from fund holdings through inflation
adjustments triggered by monthly changes
in the CPI-U NSA. This allowed us to make
distributions during the period.
OutlookIn spite of long-term structural challenges
posed by, among other things, the pace of
productivity growth, demographic trends,
and the impact of new technologies,
the U.S. economy should break above
its long-term potential growth rate of
about 2% in 2018.
The unemployment rate has fallen to its
lowest level since 2000 and is likely to
move even lower. A reemergence of
upward pressure on wages, along with
stable and broader global growth and
some recovery in commodity prices, may
lead to stronger inflation than currently
anticipated by financial markets. Recent
weakness in the U.S. dollar is also likely
to bolster core inflation metrics, albeit
moderately and over the course of
the next year. However, our long-term
outlook, which calls for tepid inflation,
remains unchanged.
That backdrop should justify the Fed in
raising the federal funds rate to at least
2% by the end of 2018. It will probably
want to stick to the framework and
timetable it has laid out for reductions
in its balance sheet, barring unexpected
economic data or unintended consequences
from tapering in the bond market.

10
Volatility could well pick up from the
very low levels we’ve been experiencing.
The list of potential catalysts is long and
varied. Risks include an inflation surprise
driven by globally tight labor markets,
trade negotiations, or geopolitical tensions.
In addition, as 2018 unfolds, we anticipate
a convergence of monetary policy, with
central banks adopting a less accommo-
dative stance—some raising rates, some
planning to raise rates, some reducing
quantitative easing while overall bond
purchases are reduced. This has the
potential to have an impact on volatility
and the term premium—the difference
between yields on long- and short-term
bonds—in the second half of the year.
Gemma Wright-Casparius, Principal
Vanguard Fixed Income Group
January 22, 2018

Results of Proxy Voting
At a special meeting of shareholders on November 15, 2017, fund shareholders approved the
following proposals:
Proposal 1—Elect trustees for the fund.*
The individuals listed in the table below were elected as trustees for the fund. All trustees with the
exception of Ms. Mulligan, Ms. Raskin, and Mr. Buckley (each of whom already serves as a director
of The Vanguard Group, Inc.) served as trustees to the funds prior to the shareholder meeting.
Percentage
Trustee For Withheld For
Mortimer J. Buckley 26,722,274,549 429,483,723 98.4%
Emerson U. Fullwood 26,714,366,172 437,392,100 98.4%
Amy Gutmann 26,712,915,408 438,842,863 98.4%
JoAnn Heffernan Heisen 26,721,561,272 430,196,999 98.4%
F. Joseph Loughrey 26,717,701,002 434,057,269 98.4%
Mark Loughridge 26,720,437,223 431,321,049 98.4%
Scott C. Malpass 26,702,773,184 448,985,088 98.3%
F. William McNabb III 26,712,434,734 439,323,538 98.4%
Deanna Mulligan 26,719,931,246 431,827,026 98.4%
André F. Perold 26,676,518,168 475,240,103 98.3%
Sarah Bloom Raskin 26,713,372,343 438,385,928 98.4%
Peter F. Volanakis 26,706,957,628 444,800,644 98.4%
* Results are for all funds within the same trust.
Proposal 2—Approve a manager-of-managers arrangement with third-party investment advisors.
This arrangement enables the fund to enter into and materially amend investment advisory
arrangements with third-party investment advisors, subject to the approval of the fund’s board
of trustees and certain conditions imposed by the Securities and Exchange Commission, while
avoiding the costs and delays associated with obtaining future shareholder approval.
Broker Percentage
Vanguard Fund For Abstain Against Non-Votes For
Inflation-Protected
Securities Fund 779,640,127 37,703,625 46,610,146 191,922,465 73.8%
11

Proposal 3—Approve a manager-of-managers arrangement with wholly owned subsidiaries of Vanguard.
This arrangement enables Vanguard or the fund to enter into and materially amend investment
advisory arrangements with wholly owned subsidiaries of Vanguard, subject to the approval of the
fund’s board of trustees and any conditions imposed by the Securities and Exchange Commission
(SEC), while avoiding the costs and delays associated with obtaining future shareholder approval.
The ability of the fund to operate in this manner is contingent upon the SEC’s approval of a pending
application for an order of exemption.
Broker Percentage
Vanguard Fund For Abstain Against Non-Votes For
Inflation-Protected
Securities Fund 787,847,093 36,808,312 39,298,492 191,922,465 74.6%
Fund shareholders did not approve the following proposal:
Proposal 7—Institute transparent procedures to avoid holding investments in companies that, in
management’s judgment, substantially contribute to genocide or crimes against humanity, the most
egregious violations of human rights. Such procedures may include time-limited engagement with
problem companies if management believes that their behavior can be changed.
The trustees recommended a vote against the proposal for the following reasons: (1) Vanguard
is fully compliant with all applicable U.S. laws and regulations that prohibit the investment in any
company owned or controlled by the government of Sudan; (2) the addition of further investment
constraints is not in fund shareholders’ best interests if those constraints are unrelated to a fund’s
stated investment objective, policies, and strategies; and (3) divestment is an ineffective means
to implement social change, as it often puts the shares into the hands of another owner with
no direct impact to the company’s capitalization.
Broker Percentage
Vanguard Fund For Abstain Against Non-Votes For
Inflation-Protected
Securities Fund 167,138,870 80,505,287 616,309,740 191,922,465 15.8%
12

Inflation-Protected Securities Fund
Fund ProfileAs of December 31, 2017
1 The expense ratios shown are from the prospectus dated April 26, 2017, and represent estimated costs for the current fiscal year. Forthe fiscal year ended December 31, 2017, the expense ratios were 0.20% for Investor Shares, 0.10% for Admiral Shares, and 0.07% forInstitutional Shares.
2 Yields of inflation-protected securities tend to be lower than those of nominal bonds, because the former do not incorporate marketexpectations about inflation. The principal amounts—and thus the interest payments—of inflation-protected securities are adjusted overtime to reflect inflation.
13
Financial Attributes
Fund
Bloomberg
Barclays
Inflation
Protected
Securities
Index
Bloomberg
Barclays US
Aggregate
Bond Index
Number of Bonds 39 38 9,706
Yield to Maturity
(before expenses) 2.4% 2.3% 2.7%
Average Coupon 0.8% 0.8% 3.1%
Average Duration 7.9 years 7.7 years 6.0 years
Average Effective
Maturity 8.5 years 8.3 years 8.2 years
Short-Term
Reserves 1.0% — —
Volatility Measures
Bloomberg
Barclays
Inflation
Protected
Securities
Index
Bloomberg
Barclays US
Aggregate
Bond
Index
R-Squared 0.99 0.71
Beta 1.03 1.09
These measures show the degree and timing of the fund’s fluctuations compared with the indexes over 36 months.
Share-Class Characteristics
InvestorShares
AdmiralShares
InstitutionalShares
Ticker Symbol VIPSX VAIPX VIPIX
Expense Ratio1 0.20% 0.10% 0.07%
30-Day SEC Yield2 0.26% 0.36% 0.39%
Distribution by Effective Maturity
(% of portfolio)
Under 1 Year 0.3%
1 - 3 Years 14.7
3 - 5 Years 21.7
5 - 10 Years 40.4
10 - 20 Years 9.7
20 - 30 Years 13.2
Distribution by Credit Quality (% of portfolio)
U.S. Government 100.0%
Credit-quality ratings are obtained from Moody's and S&P, and the higher rating for each issue is shown. "Not Rated" is used to classify securities for which a rating is not available. Not rated securities include a fund's investment in Vanguard Market Liquidity Fund or Vanguard Municipal Cash Management Fund, each of which invests in high-quality money market instruments and may serve as a cash management vehicle for the Vanguard funds, trusts, and accounts. For more information about these ratings, see the Glossary entry for Credit Quality.
Investment Focus
Average Maturity
Short
Treasury/ Agency
Investment-Grade
Corporate
Below Investment-Grade
Med. Long
Credit Quality
Sector Diversification (% of portfolio)
Treasury/Agency 100.0%
The agency and mortgage-backed securities sectors may include issues from government-sponsored enterprises; such issues are generally not backed by the full faith and credit of the U.S. government.

All of the returns in this report represent past performance, which is not a guarantee of future results that may be achieved by the fund. (Current performance may be lower or higher thanthe performance data cited. For performance data current to the most recent month-end, visitour website at vanguard.com/performance.) Note, too, that both investment returns and principal value can fluctuate widely, so an investor’s shares, when sold, could be worth more or less than their original cost. The returns shown do not reflect taxes that a shareholder would pay
on fund distributions or on the sale of fund shares.
Inflation-Protected Securities Fund
Performance Summary
See Financial Highlights for dividend and capital gains information.
14
Cumulative Performance: December 31, 2007, Through December 31, 2017Initial Investment of $10,000
2017201620152014201320122011201020092008
$17,000
8,000
13,786
Average Annual Total Returns
Periods Ended December 31, 2017
OneYear
FiveYears
TenYears
Final Valueof a $10,000Investment
Inflation-Protected Securities FundInvestor Shares 2.81% -0.05% 3.26% $13,786
• • • • • • • •Bloomberg Barclays U.S. TreasuryInflation Protected Securities Index 3.01 0.13 3.53 14,144
– – – – Inflation-Protected Bond FundsAverage 2.44 -0.37 2.67 13,013
________ Bloomberg Barclays U.S. AggregateBond Index 3.54 2.10 4.01 14,811
Inflation-Protected Bond Funds Average: Derived from data provided by Lipper, a Thomson Reuters Company.
OneYear
FiveYears
TenYears
Final Valueof a $50,000Investment
Inflation-Protected Securities Fund Admiral Shares 2.91% 0.06% 3.37% $69,650
Bloomberg Barclays U.S. Treasury Inflation Protected Securities Index 3.01 0.13 3.53 70,720
Bloomberg Barclays U.S. Aggregate Bond Index 3.54 2.10 4.01 74,053

Inflation-Protected Securities Fund
15
Average Annual Total Returns
Periods Ended December 31, 2017
OneYear
FiveYears
TenYears
Final Valueof a $5,000,000
Investment
Inflation-Protected Securities FundInstitutional Shares 2.97% 0.10% 3.40% $6,987,407
Bloomberg Barclays U.S. Treasury InflationProtected Securities Index 3.01 0.13 3.53 7,072,049
Bloomberg Barclays U.S. Aggregate BondIndex 3.54 2.10 4.01 7,405,275
Fiscal-Year Total Returns (%): December 31, 2007, Through December 31, 2017
Investor Shares
BloombergBarclaysInflation
ProtectedSecurities
Index
Fiscal Year Income Returns Capital Returns Total Returns Total Returns
2008 4.62% -7.47% -2.85% -2.35%
2009 1.86 8.94 10.80 11.41
2010 2.58 3.59 6.17 6.31
2011 4.56 8.68 13.24 13.56
2012 2.62 4.16 6.78 6.98
2013 1.47 -10.39 -8.92 -8.61
2014 2.17 1.66 3.83 3.64
2015 0.74 -2.57 -1.83 -1.44
2016 3.23 1.29 4.52 4.68
2017 2.35 0.46 2.81 3.01

Inflation-Protected Securities Fund
Financial Statements
Statement of Net AssetsAs of December 31, 2017
U.S. Government and Agency Obligations (98.8%)
U.S. Government Securities (98.8%)
United States Treasury Inflation Indexed Bonds 2.125% 1/15/19 280,697 329,086
United States Treasury Inflation Indexed Bonds 0.125% 4/15/19 868,580 912,050
United States Treasury Inflation Indexed Bonds 1.875% 7/15/19 342,276 407,577
United States Treasury Inflation Indexed Bonds 1.375% 1/15/20 395,584 462,931
United States Treasury Inflation Indexed Bonds 0.125% 4/15/20 1,105,200 1,161,744
United States Treasury Inflation Indexed Bonds 1.250% 7/15/20 641,210 748,689
United States Treasury Inflation Indexed Bonds 1.125% 1/15/21 770,499 894,463
United States Treasury Inflation Indexed Bonds 0.125% 4/15/21 1,060,500 1,098,870
United States Treasury Inflation Indexed Bonds 0.625% 7/15/21 857,801 956,388
United States Treasury Inflation Indexed Bonds 0.125% 1/15/22 937,671 1,017,264
United States Treasury Inflation Indexed Bonds 0.125% 4/15/22 1,045,000 1,051,952
United States Treasury Inflation Indexed Bonds 0.125% 7/15/22 987,019 1,056,876
United States Treasury Inflation Indexed Bonds 0.125% 1/15/23 1,125,330 1,192,977
United States Treasury Inflation Indexed Bonds 0.375% 7/15/23 1,030,936 1,100,228
United States Treasury Inflation Indexed Bonds 0.625% 1/15/24 991,256 1,065,742
United States Treasury Inflation Indexed Bonds 0.125% 7/15/24 988,771 1,014,152
United States Treasury Inflation Indexed Bonds 0.250% 1/15/25 1,000,300 1,031,951
United States Treasury Inflation Indexed Bonds 2.375% 1/15/25 521,651 777,226
United States Treasury Inflation Indexed Bonds 0.375% 7/15/25 1,001,844 1,043,038
United States Treasury Inflation Indexed Bonds 0.625% 1/15/26 887,522 935,581
United States Treasury Inflation Indexed Bonds 2.000% 1/15/26 399,727 558,328
United States Treasury Inflation Indexed Bonds 0.125% 7/15/26 853,304 857,502
United States Treasury Inflation Indexed Bonds 0.375% 1/15/27 855,439 866,692
United States Treasury Inflation Indexed Bonds 2.375% 1/15/27 314,047 448,945
United States Treasury Inflation Indexed Bonds 0.375% 7/15/27 290,000 290,687
United States Treasury Inflation Indexed Bonds 1.750% 1/15/28 340,866 450,627
United States Treasury Inflation Indexed Bonds 3.625% 4/15/28 222,575 445,197
United States Treasury Inflation Indexed Bonds 2.500% 1/15/29 342,170 476,5821 United States Treasury Inflation Indexed Bonds 3.875% 4/15/29 275,242 562,757
United States Treasury Inflation Indexed Bonds 3.375% 4/15/32 112,029 215,253
United States Treasury Inflation Indexed Bonds 2.125% 2/15/40 94,056 139,489
United States Treasury Inflation Indexed Bonds 2.125% 2/15/41 240,258 354,127
United States Treasury Inflation Indexed Bonds 0.750% 2/15/42 442,145 486,274
United States Treasury Inflation Indexed Bonds 0.625% 2/15/43 324,755 340,198
United States Treasury Inflation Indexed Bonds 1.375% 2/15/44 502,735 613,307
United States Treasury Inflation Indexed Bonds 0.750% 2/15/45 675,400 710,453
Face Market
Maturity Amount Value•
Coupon Date ($000) ($000)
The fund reports a complete list of its holdings in regulatory filings four times in each fiscal year, at
the quarter-ends. For the second and fourth fiscal quarters, the lists appear in the fund’s semiannual
and annual reports to shareholders. For the first and third fiscal quarters, the fund files the lists with
the Securities and Exchange Commission on Form N-Q. Shareholders can look up the fund’s Forms
N-Q on the SEC’s website at sec.gov. Forms N-Q may also be reviewed and copied at the SEC’s
Public Reference Room (see the back cover of this report for further information).
16

Inflation-Protected Securities Fund
United States Treasury Inflation Indexed Bonds 1.000% 2/15/46 435,582 483,563
United States Treasury Inflation Indexed Bonds 0.875% 2/15/47 554,100 587,253
United States Treasury Note/Bond 0.750% 9/30/18 100,000 99,281
Total U.S. Government and Agency Obligations (Cost $26,429,024) 27,245,300
Shares
Temporary Cash Investment (1.0%)
Money Market Fund (1.0%)2 Vanguard Market Liquidity Fund
(Cost $265,190) 1.458% 2,651,769 265,203
Total Investments (99.8%) (Cost $26,694,214) 27,510,503
Notional
Expiration Exercise Amount Value
Date Contracts Price ($000) ($000)
Liability for Written Options on Futures (0.0%)
Call Options on 10-year U.S. Treasury
Note Futures Contracts 1/26/18 186 USD 126.00 23,436 (9)
Put Options on 10-year U.S. Treasury
Note Futures Contracts 1/26/18 186 USD 124.00 23,064 (79)
Put Options on 10-year U.S. Treasury
Note Futures Contracts 2/23/18 1,858 USD 122.50 227,605 (348)
Put Options on 10-year U.S. Treasury
Note Futures Contracts 2/23/18 465 USD 122.00 56,730 (58)
Total Liability for Written Options on Futures (Premiums Received $730) (494)
Amount
($000)
Other Assets and Liabilities (0.2%)
Other Assets
Investment in Vanguard 1,515
Receivables for Accrued Income 83,266
Receivables for Capital Shares Issued 47,705
Variation Margin Receivable—Futures Contracts 2,568
Other Assets 255
Total Other Assets 135,309
Other Liabilities
Payables for Investment Securities Purchased (620)
Payables for Capital Shares Redeemed (52,668)
Payables to Vanguard (26,877)
Variation Margin Payable—Futures Contracts (1,670)
Total Other Liabilities (81,835)
Net Assets (100%) 27,563,483
Face Market
Maturity Amount Value•
Coupon Date ($000) ($000)
17

Inflation-Protected Securities Fund
At December 31, 2017, net assets consisted of:
Amount
($000)
Paid-in Capital 26,798,613
Overdistributed Net Investment Income (15,945)
Accumulated Net Realized Losses (31,270)
Unrealized Appreciation (Depreciation)
Investment Securities 816,289
Futures Contracts (4,440)
Options on Futures Contracts 236
Net Assets 27,563,483
Investor Shares—Net Assets
Applicable to 317,338,753 outstanding $.001 par value shares of
beneficial interest (unlimited authorization) 4,138,860
Net Asset Value Per Share—Investor Shares $13.04
Admiral Shares—Net Assets
Applicable to 543,631,935 outstanding $.001 par value shares of
beneficial interest (unlimited authorization) 13,916,663
Net Asset Value Per Share—Admiral Shares $25.60
Institutional Shares—Net Assets
Applicable to 911,823,309 outstanding $.001 par value shares of
beneficial interest (unlimited authorization) 9,507,960
Net Asset Value Per Share—Institutional Shares $10.43
• See Note A in Notes to Financial Statements.
1 Securities with a value of $4,754,000 have been segregated as initial margin for open futures contracts.
2 Affiliated money market fund available only to Vanguard funds and certain trusts and accounts managed by Vanguard. Rate shown is the 7-day yield.
18

Inflation-Protected Securities Fund
See accompanying Notes, which are an integral part of the Financial Statements.
Derivative Financial Instruments Outstanding as of Period End
Futures Contracts
($000)
Value and
Number of Unrealized
Long (Short) Notional Appreciation
Expiration Contracts Amount (Depreciation)
Long Futures Contracts
2-Year U.S. Treasury Note March 2018 6,479 1,387,215 (1,565)
10-Year U.S. Treasury Note March 2018 3,838 476,092 (441)
Ultra 10-Year U.S. Treasury Note March 2018 2,307 308,129 (391)
(2,397)
Short Futures Contracts
Ultra Long U.S. Treasury Bond March 2018 (2,505) (419,979) (1,858)
5-Year U.S. Treasury Note March 2018 (1,678) (194,923) (185)
(2,043)
(4,440)
Unrealized appreciation (depreciation) on open futures contracts is required to be treated as realized
gain (loss) for tax purposes.
19

Year Ended
December 31, 2017
($000)
Investment Income
Income
Interest1 694,838
Total Income 694,838
Expenses
The Vanguard Group—Note B
Investment Advisory Services 3,413
Management and Administrative—Investor Shares 7,013
Management and Administrative—Admiral Shares 9,950
Management and Administrative—Institutional Shares 4,651
Marketing and Distribution—Investor Shares 717
Marketing and Distribution—Admiral Shares 1,161
Marketing and Distribution—Institutional Shares 245
Custodian Fees 131
Auditing Fees 41
Shareholders’ Reports and Proxy—Investor Shares 444
Shareholders’ Reports and Proxy—Admiral Shares 564
Shareholders’ Reports and Proxy—Institutional Shares 260
Trustees’ Fees and Expenses 23
Total Expenses 28,613
Net Investment Income 666,225
Realized Net Gain (Loss)
Investment Securities Sold1 (2,730)
Futures Contracts (31,666)
Purchased Options on Futures Contracts (2,348)
Written Options on Futures Contracts 9,361
Realized Net Gain (Loss) (27,383)
Change in Unrealized Appreciation (Depreciation)
Investment Securities1 127,776
Futures Contracts (5,341)
Written Options on Futures Contracts (957)
Change in Unrealized Appreciation (Depreciation) 121,478
Net Increase (Decrease) in Net Assets Resulting from Operations 760,320
1 Interest income, realized net gain (loss), and change in unrealized appreciation (depreciation) from an affiliated company of the fund were $2,861,000, $14,000, and $11,000, respectively.
Statement of Operations
Inflation-Protected Securities Fund
See accompanying Notes, which are an integral part of the Financial Statements.
20

Statement of Changes in Net Assets
Inflation-Protected Securities Fund
See accompanying Notes, which are an integral part of the Financial Statements.
Year Ended December 31,
2017 2016
($000) ($000)
Increase (Decrease) in Net Assets
Operations
Net Investment Income 666,225 505,306
Realized Net Gain (Loss) (27,383) 56,121
Change in Unrealized Appreciation (Depreciation) 121,478 464,975
Net Increase (Decrease) in Net Assets Resulting from Operations 760,320 1,026,402
Distributions
Net Investment Income
Investor Shares (96,588) (89,680)
Admiral Shares (329,839) (251,324)
Institutional Shares (227,183) (176,121)
Realized Capital Gain1
Investor Shares — (5,713)
Admiral Shares — (16,005)
Institutional Shares — (11,234)
Return of Capital
Investor Shares — (52,119)
Admiral Shares — (146,011)
Institutional Shares — (102,484)
Total Distributions (653,610) (850,691)
Capital Share Transactions
Investor Shares (380,258) (315,211)
Admiral Shares 1,662,662 1,609,525
Institutional Shares 836,653 1,117,521
Net Increase (Decrease) from Capital Share Transactions 2,119,057 2,411,835
Total Increase (Decrease) 2,225,767 2,587,546
Net Assets
Beginning of Period 25,337,716 22,750,170
End of Period2 27,563,483 25,337,716
1 Includes fiscal 2017 and 2016 short-term gain distributions totaling $0 and $0, respectively. Short-term gain distributions are treated as ordinary income dividends for tax purposes.
2 Net Assets—End of Period includes undistributed (overdistributed) net investment income of ($15,945,000) and ($38,465,000).
21

Investor Shares
For a Share Outstanding Year Ended December 31,
Throughout Each Period 2017 2016 2015 2014 2013
Net Asset Value, Beginning of Period $12.98 $12.84 $13.18 $12.98 $14.53
Investment Operations
Net Investment Income .3101 .263 .098 .224 .210
Net Realized and Unrealized Gain (Loss)
on Investments .053 .315 (.339) .273 (1.499)
Total from Investment Operations .363 .578 (.241) .497 (1.289)
Distributions
Dividends from Net Investment Income (.303) (.266) (.098) (.281) (.216)
Distributions from Realized Capital Gains — (.017) (.001) (.016) (.045)
Return of Capital — (.155) — — —
Total Distributions (.303) (.438) (.099) (.297) (.261)
Net Asset Value, End of Period $13.04 $12.98 $12.84 $13.18 $12.98
Total Return2 2.81% 4.52% -1.83% 3.83% -8.92%
Ratios/Supplemental Data
Net Assets, End of Period (Millions) $4,139 $4,496 $4,746 $5,604 $6,577
Ratio of Total Expenses to Average Net Assets 0.20% 0.20% 0.20% 0.20% 0.20%
Ratio of Net Investment Income to
Average Net Assets 2.38% 1.99% 0.72% 2.01% 1.33%
Portfolio Turnover Rate3 22% 27% 43% 39% 44%
1 Calculated based on average shares outstanding.
2 Total returns do not include account service fees that may have applied in the periods shown. Fund prospectuses provide information about any applicable account service fees.
3 Excludes the value of portfolio securities received or delivered as a result of in-kind purchases or redemptions of the fund’s capital shares.
Financial Highlights
See accompanying Notes, which are an integral part of the Financial Statements.
Inflation-Protected Securities Fund
22
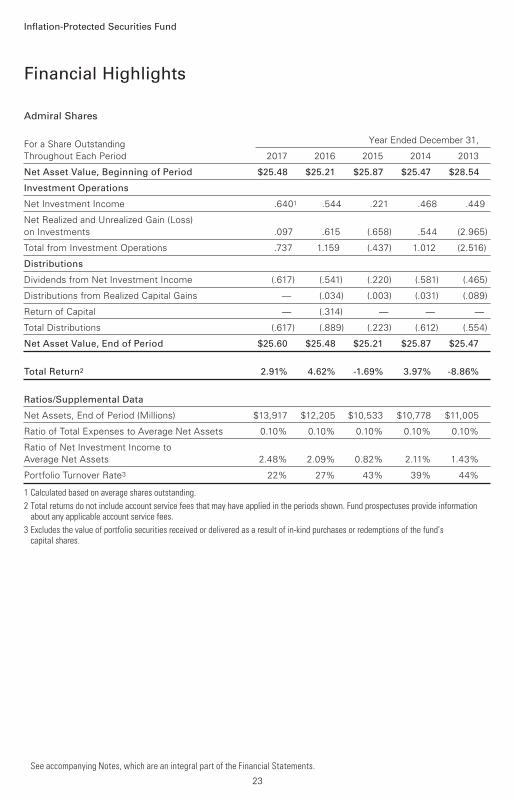
Admiral Shares
For a Share Outstanding Year Ended December 31,
Throughout Each Period 2017 2016 2015 2014 2013
Net Asset Value, Beginning of Period $25.48 $25.21 $25.87 $25.47 $28.54
Investment Operations
Net Investment Income .6401 .544 .221 .468 .449
Net Realized and Unrealized Gain (Loss)
on Investments .097 .615 (.658) .544 (2.965)
Total from Investment Operations .737 1.159 (.437) 1.012 (2.516)
Distributions
Dividends from Net Investment Income (.617) (.541) (.220) (.581) (.465)
Distributions from Realized Capital Gains — (.034) (.003) (.031) (.089)
Return of Capital — (.314) — — —
Total Distributions (.617) (.889) (.223) (.612) (.554)
Net Asset Value, End of Period $25.60 $25.48 $25.21 $25.87 $25.47
Total Return2 2.91% 4.62% -1.69% 3.97% -8.86%
Ratios/Supplemental Data
Net Assets, End of Period (Millions) $13,917 $12,205 $10,533 $10,778 $11,005
Ratio of Total Expenses to Average Net Assets 0.10% 0.10% 0.10% 0.10% 0.10%
Ratio of Net Investment Income to
Average Net Assets 2.48% 2.09% 0.82% 2.11% 1.43%
Portfolio Turnover Rate3 22% 27% 43% 39% 44%
1 Calculated based on average shares outstanding.
2 Total returns do not include account service fees that may have applied in the periods shown. Fund prospectuses provide information about any applicable account service fees.
3 Excludes the value of portfolio securities received or delivered as a result of in-kind purchases or redemptions of the fund’s capital shares.
Financial Highlights
See accompanying Notes, which are an integral part of the Financial Statements.
Inflation-Protected Securities Fund
23
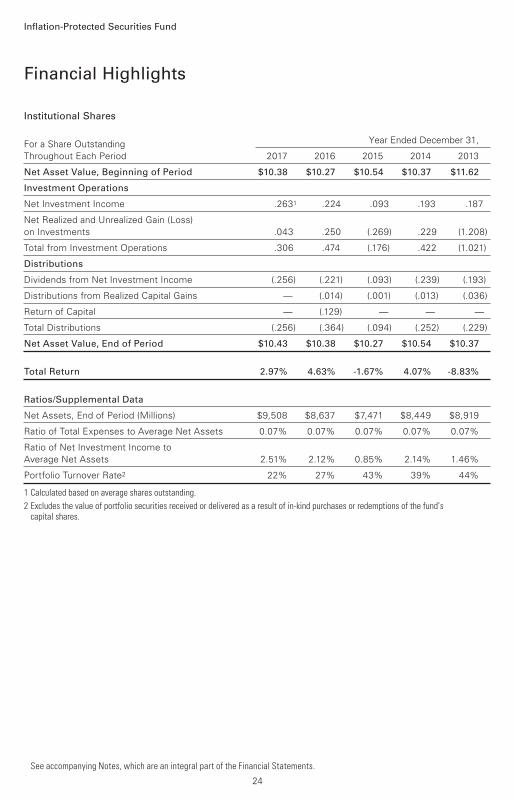
Institutional Shares
For a Share Outstanding Year Ended December 31,
Throughout Each Period 2017 2016 2015 2014 2013
Net Asset Value, Beginning of Period $10.38 $10.27 $10.54 $10.37 $11.62
Investment Operations
Net Investment Income .2631 .224 .093 .193 .187
Net Realized and Unrealized Gain (Loss)
on Investments .043 .250 (.269) .229 (1.208)
Total from Investment Operations .306 .474 (.176) .422 (1.021)
Distributions
Dividends from Net Investment Income (.256) (.221) (.093) (.239) (.193)
Distributions from Realized Capital Gains — (.014) (.001) (.013) (.036)
Return of Capital — (.129) — — —
Total Distributions (.256) (.364) (.094) (.252) (.229)
Net Asset Value, End of Period $10.43 $10.38 $10.27 $10.54 $10.37
Total Return 2.97% 4.63% -1.67% 4.07% -8.83%
Ratios/Supplemental Data
Net Assets, End of Period (Millions) $9,508 $8,637 $7,471 $8,449 $8,919
Ratio of Total Expenses to Average Net Assets 0.07% 0.07% 0.07% 0.07% 0.07%
Ratio of Net Investment Income to
Average Net Assets 2.51% 2.12% 0.85% 2.14% 1.46%
Portfolio Turnover Rate2 22% 27% 43% 39% 44%
1 Calculated based on average shares outstanding.
2 Excludes the value of portfolio securities received or delivered as a result of in-kind purchases or redemptions of the fund’s capital shares.
Financial Highlights
See accompanying Notes, which are an integral part of the Financial Statements.
Inflation-Protected Securities Fund
24

Notes to Financial Statements
Inflation-Protected Securities Fund
Vanguard Inflation-Protected Securities Fund is registered under the Investment Company Act
of 1940 as an open-end investment company, or mutual fund. The fund offers three classes of
shares: Investor Shares, Admiral Shares, and Institutional Shares. Investor Shares are available
to any investor who meets the fund’s minimum purchase requirements. Admiral Shares and
Institutional Shares are designed for investors who meet certain administrative, service, and
account-size criteria.
A. The following significant accounting policies conform to generally accepted accounting
principles for U.S. investment companies. The fund consistently follows such policies in
preparing its financial statements.
1. Security Valuation: Securities are valued as of the close of trading on the New York Stock
Exchange (generally 4 p.m., Eastern time) on the valuation date. Bonds and temporary cash
investments are valued using the latest bid prices or using valuations based on a matrix system
(which considers such factors as security prices, yields, maturities, and ratings), both as furnished
by independent pricing services. Investments in Vanguard Market Liquidity Fund are valued at that
fund’s net asset value. Securities for which market quotations are not readily available, or whose
values have been affected by events occurring before the fund’s pricing time but after the close
of the securities’ primary markets, are valued by methods deemed by the board of trustees to
represent fair value.
2. Futures and Options: The fund uses futures contracts and options on futures contracts to invest
in fixed income asset classes with greater efficiency and lower cost than is possible through direct
investment, to add value when these instruments are attractively priced, or to adjust sensitivity
to changes in interest rates. The primary risks associated with the use of futures contracts are
imperfect correlation between changes in market values of bonds held by the fund and the prices
of futures contracts, and the possibility of an illiquid market. The primary risk associated with
purchasing options is that interest rates move in such a way that the option is out-of-the-money,
the position is worthless at expiration, and the fund loses the premium paid. The primary risk
associated with writing options is that interest rates move in such a way that the option is
in-the-money, the counterparty exercises the option, and the fund loses an amount equal to the
market value of the option written less the premium received. Counterparty risk involving futures
and exchange-traded options is mitigated because a regulated clearinghouse is the counterparty
instead of the clearing broker. To further mitigate counterparty risk, the fund trades futures and
options on an exchange, monitors the financial strength of its clearing brokers and clearinghouse,
and has entered into clearing agreements with its clearing brokers. The clearinghouse imposes
initial margin requirements to secure the fund’s performance and requires daily settlement of
variation margin representing changes in the market value of each contract.
Futures contracts are valued at their quoted daily settlement prices. The notional amounts of
the contracts are not recorded in the Statement of Net Assets. Fluctuations in the value of the
contracts are recorded in the Statement of Net Assets as an asset (liability) and in the Statement
of Operations as unrealized appreciation (depreciation) until the contracts are closed, when they
are recorded as realized futures gains (losses).
During the year ended December 31, 2017, the fund’s average investments in long and short
futures contracts represented 8% and 4% of net assets, respectively, based on the average
of the notional amounts at each quarter-end during the period.
25

Inflation-Protected Securities Fund
Options on futures contrats are also valued at their quoted daily settlement price. The premium
paid for a purchased option is recorded in the Statement of Net Assets as an asset that is
subsequently adjusted daily to the current market value of the option purchased. The premium
received for a written option is recorded in the Statement of Net Assets as an asset with an
equal liability that is subsequently adjusted daily to the current market value of the option written.
Fluctuations in the value of the options are recorded in the Statement of Operations as unrealized
appreciation (depreciation) until expired, closed, or exercised, at which time realized gains (losses)
are recognized.
During the year ended December 31, 2017, the fund’s average value of investments in options
purchased and options written each represented less than 1% of net assets, based on the average
market values at each quarter-end during the period.
3. Federal Income Taxes: The fund intends to continue to qualify as a regulated investment
company and distribute all of its taxable income. Management has analyzed the fund’s tax positions
taken for all open federal income tax years (December 31, 2014–2017), and has concluded that no
provision for federal income tax is required in the fund’s financial statements.
4. Distributions: Distributions to shareholders are recorded on the ex-dividend date.
5. Credit Facility: The fund and certain other funds managed by The Vanguard Group (“Vanguard”)
participate in a $3.1 billion committed credit facility provided by a syndicate of lenders pursuant to
a credit agreement that may be renewed annually; each fund is individually liable for its borrowings,
if any, under the credit facility. Borrowings may be utilized for temporary and emergency purposes,
and are subject to the fund’s regulatory and contractual borrowing restrictions. The participating
funds are charged administrative fees and an annual commitment fee of 0.10% of the undrawn
amount of the facility; these fees are allocated to the funds based on a method approved by the
fund’s board of trustees and included in Management and Administrative expenses on the fund’s
Statement of Operations. Any borrowings under this facility bear interest at a rate based upon the
higher of the one-month London Interbank Offered Rate, federal funds effective rate, or overnight
bank funding rate plus an agreed-upon spread.
The fund had no borrowings outstanding at December 31, 2017, or at any time during the period
then ended.
6. Other: Interest income includes income distributions received from Vanguard Market Liquidity
Fund and is accrued daily. Premiums and discounts on debt securities purchased are amortized
and accreted, respectively, to interest income over the lives of the respective securities. Inflation
adjustments to the face amount of inflation-indexed securities are included in interest income.
Security transactions are accounted for on the date securities are bought or sold. Costs used to
determine realized gains (losses) on the sale of investment securities are those of the specific
securities sold.
Each class of shares has equal rights as to assets and earnings, except that each class separately
bears certain class-specific expenses related to maintenance of shareholder accounts (included in
Management and Administrative expenses), shareholder reporting, and the proxy. Marketing and
distribution expenses are allocated to each class of shares based on a method approved by the
board of trustees. Income, other non-class-specific expenses, and gains and losses on
investments are allocated to each class of shares based on its relative net assets.
26

Inflation-Protected Securities Fund
B. In accordance with the terms of a Funds’ Service Agreement (the “FSA”) between Vanguard
and the fund, Vanguard furnishes to the fund investment advisory, corporate management,
administrative, marketing, and distribution services at Vanguard’s cost of operations (as defined
by the FSA). These costs of operations are allocated to the fund based on methods and guidelines
approved by the board of trustees. Vanguard does not require reimbursement in the current period
for certain costs of operations (such as deferred compensation/benefits and risk/insurance costs);
the fund’s liability for these costs of operations is included in Payables to Vanguard on the
Statement of Net Assets.
Upon the request of Vanguard, the fund may invest up to 0.40% of its net assets as capital in
Vanguard. At December 31, 2017, the fund had contributed to Vanguard capital in the amount of
$1,515,000, representing 0.01% of the fund’s net assets and 0.61% of Vanguard’s capitalization.
The fund’s trustees and officers are also directors and employees, respectively, of Vanguard.
C. Various inputs may be used to determine the value of the fund’s investments. These inputs are
summarized in three broad levels for financial statement purposes. The inputs or methodologies
used to value securities are not necessarily an indication of the risk associated with investing in
those securities.
Level 1—Quoted prices in active markets for identical securities.
Level 2—Other significant observable inputs (including quoted prices for similar securities, interest
rates, prepayment speeds, credit risk, etc.).
Level 3—Significant unobservable inputs (including the fund’s own assumptions used to determine
the fair value of investments). Any investments valued with significant unobservable inputs are
noted on the Statement of Net Assets.
The following table summarizes the market value of the fund’s investments as of December 31,
2017, based on the inputs used to value them:
Level 1 Level 2 Level 3
Investments ($000) ($000) ($000)
U.S. Government and Agency Obligations — 27,245,300 —
Temporary Cash Investments 265,203 — —
Liability for Options Written (494) — —
Futures Contracts—Assets1 2,568 — —
Futures Contracts—Liabilities1 (1,670) — —
Total 265,607 27,245,300 —
1 Represents variation margin on the last day of the reporting period.
D. Distributions are determined on a tax basis and may differ from net investment income and
realized capital gains for financial reporting purposes. Differences may be permanent or temporary.
Permanent differences are reclassified among capital accounts in the financial statements to reflect
their tax character. Temporary differences arise when certain items of income, expense, gain, or
loss are recognized in different periods for financial statement and tax purposes. These differences
will reverse at some time in the future. Differences in classification may also result from the
treatment of short-term gains as ordinary income for tax purposes.
27

Inflation-Protected Securities Fund
Certain of the fund’s U.S. Treasury inflation-indexed securities experienced deflation and
amortization adjustments that reduced interest income and the cost of investments for financial
statement purposes by an amount greater than the reduction of taxable income; the additional
income reduction will be deferred for tax purposes until it is used to offset future inflation
adjustments that increase taxable income. The difference becomes permanent if the securities
are sold. During the year ended December 31, 2017, the fund realized gains of $81,000 related
to previously tax-deferred deflation adjustments, which have been reclassified from accumulated
net realized losses to overdistributed net investment income.
At December 31, 2017, the cost of investment securities for tax purposes was $26,694,214,000.
Net unrealized appreciation of investment securities for tax purposes was $816,289,000, consisting
of unrealized gains of $963,938,000 on securities that had risen in value since their purchase and
$147,649,000 in unrealized losses on securities that had fallen in value since their purchase.
For tax purposes, at December 31, 2017, the fund had $9,518,000 of ordinary income available for
distribution. The fund had available capital losses totaling $35,474,000 that may be carried forward
indefinitely to offset future net capital gains.
E. During the year ended December 31, 2017, the fund purchased $7,030,076,000 of investment
securities and sold $5,818,795,000 of investment securities, other than temporary cash
investments.
F. Capital share transactions for each class of shares were:
Year Ended December 31,
2017 2016
Amount Shares Amount Shares
($000) (000) ($000) (000)
Investor Shares
Issued 777,761 59,276 770,934 57,434
Issued in Lieu of Cash Distributions 90,059 6,924 137,360 10,637
Redeemed (1,248,078) (95,089) (1,223,505) (91,396)
Net Increase (Decrease)—Investor Shares (380,258) (28,889) (315,211) (23,325)
Admiral Shares
Issued 4,169,314 161,824 3,739,034 141,759
Issued in Lieu of Cash Distributions 287,868 11,277 356,604 14,069
Redeemed (2,794,520) (108,430) (2,486,113) (94,684)
Net Increase (Decrease)—Admiral Shares 1,662,662 64,671 1,609,525 61,144
Institutional Shares
Issued 2,345,338 223,313 2,508,964 233,293
Issued in Lieu of Cash Distributions 215,166 20,686 277,290 26,864
Redeemed (1,723,851) (164,223) (1,668,733) (155,705)
Net Increase (Decrease)—Institutional Shares 836,653 79,776 1,117,521 104,452
G. Management has determined that no material events or transactions occurred subsequent to
December 31, 2017, that would require recognition or disclosure in these financial statements.
28

To the Board of Trustees of Vanguard Bond Index Funds and Shareholders of Vanguard
Inflation-Protected Securities Fund
Opinion on the Financial Statements
We have audited the accompanying statement of net assets of Vanguard Inflation-Protected
Securities Fund (one of the funds constituting Vanguard Bond Index Funds, referred to hereafter
as the “Fund”) as of December 31, 2017, the related statement of operations for the year ended
December 31, 2017, the statement of changes in net assets for each of the two years in the
period ended December 31, 2017, including the related notes, and the financial highlights for
each of the five years in the period ended December 31, 2017 (collectively referred to as the
“financial statements”). In our opinion, the financial statements present fairly, in all material
respects, the financial position of the Fund as of December 31, 2017, the results of its
operations for the year then ended, the changes in its net assets for each of the two years
in the period ended December 31, 2017 and the financial highlights for each of the five years
in the period ended December 31, 2017 in conformity with accounting principles generally
accepted in the United States of America.
Basis for Opinion
These financial statements are the responsibility of the Fund’s management. Our responsibility
is to express an opinion on the Fund’s financial statements based on our audits. We are a public
accounting firm registered with the Public Company Accounting Oversight Board (United States)
(“PCAOB”) and are required to be independent with respect to the Fund in accordance with the
U.S. federal securities laws and the applicable rules and regulations of the Securities and
Exchange Commission and the PCAOB.
We conducted our audits of these financial statements in accordance with the standards of
the PCAOB. Those standards require that we plan and perform the audit to obtain reasonable
assurance about whether the financial statements are free of material misstatement, whether
due to error or fraud.
Our audits included performing procedures to assess the risks of material misstatement of the
financial statements, whether due to error or fraud, and performing procedures that respond to
those risks. Such procedures included examining, on a test basis, evidence regarding the amounts
and disclosures in the financial statements. Our audits also included evaluating the accounting
principles used and significant estimates made by management, as well as evaluating the overall
presentation of the financial statements. Our procedures included confirmation of securities owned
as of December 31, 2017 by correspondence with the custodian and brokers and by agreement
to the underlying ownership records of the transfer agent. We believe that our audits provide a
reasonable basis for our opinion.
/s/PricewaterhouseCoopers LLP
Philadelphia, Pennsylvania
February 14, 2018
We have served as the auditor of one or more investment companies in The Vanguard Group of
Funds since 1975.
Report of Independent Registered Public Accounting Firm
29

Special 2017 tax information (unaudited) for Vanguard Inflation-Protected Securities Fund
This information for the fiscal year ended December 31, 2017, is included pursuant to provisions
of the Internal Revenue Code.
For nonresident alien shareholders, 100% of income dividends are interest-related dividends.
30

About Your Fund’s Expenses
31
As a shareholder of the fund, you incur ongoing costs, which include costs for portfolio management,
administrative services, and shareholder reports (like this one), among others. Operating expenses,
which are deducted from a fund’s gross income, directly reduce the investment return of the fund.
A fund’s expenses are expressed as a percentage of its average net assets. This figure is known as
the expense ratio. The following examples are intended to help you understand the ongoing costs (in
dollars) of investing in your fund and to compare these costs with those of other mutual funds. The
examples are based on an investment of $1,000 made at the beginning of the period shown and held
for the entire period.
The accompanying table illustrates your fund’s costs in two ways:
• Based on actual fund return. This section helps you to estimate the actual expenses that you
paid over the period. The ”Ending Account Value“ shown is derived from the fund‘s actual return,
and the third column shows the dollar amount that would have been paid by an investor who started
with $1,000 in the fund. You may use the information here, together with the amount you invested,
to estimate the expenses that you paid over the period.
To do so, simply divide your account value by $1,000 (for example, an $8,600 account value divided
by $1,000 = 8.6), then multiply the result by the number given for your fund under the heading
”Expenses Paid During Period.“
• Based on hypothetical 5% yearly return. This section is intended to help you compare your
fund‘s costs with those of other mutual funds. It assumes that the fund had a yearly return of 5%
before expenses, but that the expense ratio is unchanged. In this case—because the return used is
not the fund’s actual return—the results do not apply to your investment. The example is useful in
making comparisons because the Securities and Exchange Commission requires all mutual funds to
calculate expenses based on a 5% return. You can assess your fund’s costs by comparing this
hypothetical example with the hypothetical examples that appear in shareholder reports of other
funds.
Note that the expenses shown in the table are meant to highlight and help you compare ongoingcosts only and do not reflect transaction costs incurred by the fund for buying and sellingsecurities. Further, the expenses do not include any purchase, redemption, or account servicefees described in the fund prospectus. If such fees were applied to your account, your costswould be higher. Your fund does not carry a “sales load.”
The calculations assume no shares were bought or sold during the period. Your actual costs may
have been higher or lower, depending on the amount of your investment and the timing of any
purchases or redemptions.
You can find more information about the fund’s expenses, including annual expense ratios, in the
Financial Statements section of this report. For additional information on operating expenses and
other shareholder costs, please refer to your fund’s current prospectus.

32
Six Months Ended December 31, 2017
Inflation-Protected Securities Fund
Beginning
Account Value
6/30/2017
Ending
Account Value
12/31/2017
Expenses
Paid During
Period
Based on Actual Fund Return
Investor Shares $1,000.00 $1,019.13 $1.02
Admiral Shares 1,000.00 1,019.95 0.51
Institutional Shares 1,000.00 1,020.17 0.36
Based on Hypothetical 5% Yearly Return
Investor Shares $1,000.00 $1,024.20 $1.02
Admiral Shares 1,000.00 1,024.70 0.51
Institutional Shares 1,000.00 1,024.85 0.36
The calculations are based on expenses incurred in the most recent six-month period. The fund’s annualized six-month expense ratios forthat period are 0.20% for Investor Shares, 0.10% for Admiral Shares, and 0.07% for Institutional Shares. The dollar amounts shown as“Expenses Paid” are equal to the annualized expense ratio multiplied by the average account value over the period, multiplied by thenumber of days in the most recent six-month period, then divided by the number of days in the most recent 12-month period (184/365).

Glossary
33
30-Day SEC Yield. A fund’s 30-day SEC yield is derived using a formula specified by the U.S.
Securities and Exchange Commission. Under the formula, data related to the fund’s security
holdings in the previous 30 days are used to calculate the fund’s hypothetical net income for that
period, which is then annualized and divided by the fund’s estimated average net assets over the
calculation period. For the purposes of this calculation, a security’s income is based on its current
market yield to maturity (for bonds), its actual income (for asset-backed securities), or its
projected dividend yield (for stocks). Because the SEC yield represents hypothetical annualized
income, it will differ—at times significantly—from the fund’s actual experience. As a result, the
fund’s income distributions may be higher or lower than implied by the SEC yield.
Average Coupon. The average interest rate paid on the fixed income securities held by a fund. It
is expressed as a percentage of face value.
Average Duration. An estimate of how much the value of the fund’s bonds will fluctuate in
response to a change in “real” interest rates—meaning rates without inflation expectations built
in. Real interest rates are reflected in market yields for inflation-adjusted securities. To see how
the fund’s bond values could change, multiply the average duration by the change in real rates.
For example, if the average duration were five years, then the value of the fund’s bonds would
decline by about 5% if real interest rates rose by 1 percentage point. Conversely, if real rates fell
by a percentage point, the value of the bonds would rise about 5%.
Average Effective Maturity. The average length of time until fixed income securities held by a
fund reach maturity and are repaid, taking into consideration the possibility that the issuer may call
the bond before its maturity date. The figure reflects the proportion of fund assets represented by
each security; it also reflects any futures contracts held. In general, the longer the average
effective maturity, the more a fund’s share price will fluctuate in response to changes in market
interest rates.
Beta. A measure of the magnitude of a fund’s past share-price fluctuations in relation to the ups
and downs of a given market index. The index is assigned a beta of 1.00. Compared with a given
index, a fund with a beta of 1.20 typically would have seen its share price rise or fall by 12%
when the index rose or fell by 10%. For this report, beta is based on returns over the past 36
months for both the fund and the index. Note that a fund’s beta should be reviewed in conjunction
with its R-squared (see definition). The lower the R-squared, the less correlation there is between
the fund and the index, and the less reliable beta is as an indicator of volatility.
Credit Quality. Credit-quality ratings are measured on a scale that generally ranges from AAA
(highest) to D (lowest). U.S. Treasury, U.S. Agency, and U.S. Agency mortgage-backed securities
appear under “U.S. Government.” Credit-quality ratings are obtained from Moody’s and S&P, and
the higher rating for each issue is shown. ”Not Rated” is used to classify securities for which a
rating is not available. Not rated securities include a fund’s investment in Vanguard Market
Liquidity Fund or Vanguard Municipal Cash Management Fund, each of which invests in
high-quality money market instruments and may serve as a cash management vehicle for the
Vanguard funds, trusts, and accounts.
Expense Ratio. A fund’s total annual operating expenses expressed as a percentage of the fund’s
average net assets. The expense ratio includes management and administrative expenses, but
does not include the transaction costs of buying and selling portfolio securities.

34
Inception Date. The date on which the assets of a fund (or one of its share classes) are first
invested in accordance with the fund’s investment objective. For funds with a subscription period,
the inception date is the day after that period ends. Investment performance is measured from
the inception date.
R-Squared. A measure of how much of a fund’s past returns can be explained by the returns
from the market in general, as measured by a given index. If a fund’s total returns were precisely
synchronized with an index’s returns, its R-squared would be 1.00. If the fund’s returns bore no
relationship to the index’s returns, its R-squared would be 0. For this report, R-squared is based
on returns over the past 36 months for both the fund and the index.
Short-Term Reserves. The percentage of a fund invested in highly liquid, short-term securities
that can be readily converted to cash.
Yield to Maturity. This term generally refers to the rate of return an investor would receive if the
fixed income securities held by a fund were held to their maturity dates. For the
Inflation-Protected Securities Fund, the calculation is modified by adding in the inflation
adjustment made over the past 12 months. This change results in a figure more directly
comparable to the yield-to-maturity figures for other types of bond funds. (An unmodified yield to
maturity is used in calculating the fund’s 30-Day SEC Yield.)

BLOOMBERG is a trademark and service mark of Bloomberg Finance L.P. BARCLAYS is a trademark and service mark of
Barclays Bank Plc, used under license. Bloomberg Finance L.P. and its affiliates, including Bloomberg Index Services Limited
(BISL) (collectively, Bloomberg), or Bloomberg’s licensors, own all proprietary rights in the Bloomberg Barclays U.S. Treasury
Inflation Protected Securities Index (the Index or Bloomberg Barclays Index).
Neither Barclays Bank Plc, Barclays Capital Inc., or any affiliate (collectively Barclays) or Bloomberg is the issuer or producer
of the Inflation-Protected Securities Fund and neither Bloomberg nor Barclays has any responsibilities, obligations or duties
to investors in the Inflation-Protected Securities Fund. The Index is licensed for use by The Vanguard Group, Inc. (Vanguard)
as the sponsor of the Inflation-Protected Securities Fund. Bloomberg and Barclays’ only relationship with Vanguard in
respect of the Index is the licensing of the Index, which is determined, composed and calculated by BISL, or any successor
thereto, without regard to the Issuer or the Inflation-Protected Securities Fund or the owners of the Inflation-Protected
Securities Fund.
Additionally, Vanguard may for itself execute transaction(s) with Barclays in or relating to the Index in connection with
the Inflation-Protected Securities Fund. Investors acquire the Inflation-Protected Securities Fund from Vanguard and
investors neither acquire any interest in the Index nor enter into any relationship of any kind whatsoever with Bloomberg
or Barclays upon making an investment in the Inflation-Protected Securities Fund. The Inflation-Protected Securities Fund
is not sponsored, endorsed, sold or promoted by Bloomberg or Barclays. Neither Bloomberg nor Barclays makes any
representation or warranty, express or implied regarding the advisability of investing in the Inflation-Protected Securities
Fund or the advisability of investing in securities generally or the ability of the Index to track corresponding or relative
market performance. Neither Bloomberg nor Barclays has passed on the legality or suitability of the Inflation-Protected
Securities Fund with respect to any person or entity. Neither Bloomberg nor Barclays is responsible for and has not
participated in the determination of the timing of, prices at, or quantities of the Inflation-Protected Securities Fund to be
issued. Neither Bloomberg nor Barclays has any obligation to take the needs of the Issuer or the owners of the Inflation-
Protected Securities Fund or any other third party into consideration in determining, composing or calculating the Index.
Neither Bloomberg nor Barclays has any obligation or liability in connection with administration, marketing or trading of
the Inflation-Protected Securities Fund.
The licensing agreement between Bloomberg and Barclays is solely for the benefit of Bloomberg and Barclays and not
for the benefit of the owners of the Inflation-Protected Securities Fund, investors or other third parties. In addition, the
licensing agreement between Vanguard and Bloomberg is solely for the benefit of Vanguard and Bloomberg and not for
the benefit of the owners of the Inflation-Protected Securities Fund, investors or other third parties.
35

NEITHER BLOOMBERG NOR BARCLAYS SHALL HAVE ANY LIABILITY TO THE ISSUER, INVESTORS OR TO OTHER THIRD
PARTIES FOR THE QUALITY, ACCURACY AND/OR COMPLETENESS OF THE BLOOMBERG BARCLAYS INDEX OR ANY
DATA INCLUDED THEREIN OR FOR INTERRUPTIONS IN THE DELIVERY OF THE BLOOMBERG BARCLAYS INDEX. NEITHER
BLOOMBERG NOR BARCLAYS MAKES ANY WARRANTY, EXPRESS OR IMPLIED, AS TO RESULTS TO BE OBTAINED BY
THE ISSUER, THE INVESTORS OR ANY OTHER PERSON OR ENTITY FROM THE USE OF THE BLOOMBERG BARCLAYS
INDEX OR ANY DATA INCLUDED THEREIN. NEITHER BLOOMBERG NOR BARCLAYS MAKES ANY EXPRESS OR IMPLIED
WARRANTIES, AND EACH HEREBY EXPRESSLY DISCLAIMS ALL WARRANTIES OF MERCHANTABILITY OR FITNESS
FOR A PARTICULAR PURPOSE OR USE WITH RESPECT TO THE BLOOMBERG BARCLAYS INDEX OR ANY DATA INCLUDED
THEREIN. BLOOMBERG RESERVES THE RIGHT TO CHANGE THE METHODS OF CALCULATION OR PUBLICATION, OR TO
CEASE THE CALCULATION OR PUBLICATION OF THE BLOOMBERG BARCLAYS INDEX, AND NEITHER BLOOMBERG NOR
BARCLAYS SHALL BE LIABLE FOR ANY MISCALCULATION OF OR ANY INCORRECT, DELAYED OR INTERRUPTED
PUBLICATION WITH RESPECT TO THE BLOOMBERG BARCLAYS INDEX. NEITHER BLOOMBERG NOR BARCLAYS SHALL
BE LIABLE FOR ANY DAMAGES, INCLUDING, WITHOUT LIMITATION, ANY SPECIAL, INDIRECT OR CONSEQUENTIAL
DAMAGES, OR ANY LOST PROFITS AND EVEN IF ADVISED OF THE POSSIBLITY OF SUCH, RESULTING FROM THE USE
OF THE BLOOMBERG BARCLAYS INDEX OR ANY DATA INCLUDED THEREIN OR WITH RESPECT TO THE INFLATION-
PROTECTED SECURITIES FUND.
None of the information supplied by Bloomberg or Barclays and used in this publication may be reproduced in any manner
without the prior written permission of both Bloomberg and Barclays Capital, the investment banking division of Barclays
Bank Plc. Barclays Bank Plc is registered in England No. 1026167. Registered office 1 Churchill Place London E14 5HP.
© 2017 Bloomberg. Used with Permission.
Source: Bloomberg Index Services Limited. Copyright 2017, Bloomberg. All rights reserved.
36

The People Who Govern Your Fund
The trustees of your mutual fund are there to see that the fund is operated and managed in your
best interests since, as a shareholder, you are a part owner of the fund. Your fund’s trustees also
serve on the board of directors of The Vanguard Group, Inc., which is owned by the Vanguard
funds and provides services to them on an at-cost basis.
A majority of Vanguard’s board members are independent, meaning that they have no affiliation
with Vanguard or the funds they oversee, apart from the sizable personal investments they have
made as private individuals. The independent board members have distinguished backgrounds
in business, academia, and public service. Each of the trustees and executive officers oversees
201 Vanguard funds.
Information for each trustee and executive officer of the fund appears below. The mailing address
of the trustees and officers is P.O. Box 876, Valley Forge, PA 19482. More information about the
trustees is in the Statement of Additional Information, which can be obtained, without charge,
by contacting Vanguard at 800-662-7447, or online at vanguard.com.
Interested Trustee1
F. William McNabb III
Born 1957. Trustee Since July 2009. Chairman
of the Board. Principal Occupation(s) During the
Past Five Years and Other Experience: Chairman
of the Board of The Vanguard Group, Inc., and
of each of the investment companies served by
The Vanguard Group, since January 2010; Chief
Executive Officer and Director of The Vanguard
Group and President and Chief Executive Officer
of each of the investment companies served by
The Vanguard Group, since 2008; Director of
Vanguard Marketing Corporation; President of
The Vanguard Group (2008–2017); Managing
Director of The Vanguard Group (1995–2008).
Independent Trustees
Emerson U. Fullwood
Born 1948. Trustee Since January 2008. Principal
Occupation(s) During the Past Five Years and Other
Experience: Executive Chief Staff and Marketing
Officer for North America and Corporate Vice
President (retired 2008) of Xerox Corporation
(document manage ment products and services);
Executive in Residence and 2009–2010
Distinguished Minett Professor at the Rochester
Institute of Technology; Lead Director of SPX
FLOW, Inc. (multi-industry manufacturing);
Director of the United Way of Rochester, the
University of Rochester Medical Center, Monroe
Community College Foundation, North Carolina
A&T University, and Roberts Wesleyan College;
Trustee of the University of Rochester.
Rajiv L. Gupta
Born 1945. Trustee Since December 2001.2
Principal Occupation(s) During the Past Five
Years and Other Experience: Chairman and
Chief Executive Officer (retired 2009) and
President (2006–2008) of Rohm and Haas Co.
(chemicals); Director of Arconic Inc. (diversified
manufacturer), HP Inc. (printer and personal
computer manufacturing), and Delphi Automotive
plc (automotive components); Senior Advisor at
New Mountain Capital.
Amy Gutmann
Born 1949. Trustee Since June 2006. Principal
Occupation(s) During the Past Five Years and
Other Experience: President of the University
of Pennsylvania; Christopher H. Browne
1 Mr. McNabb is considered an “interested person,” as defined in the Investment Company Act of 1940, because he is an officer of the Vanguard funds.
2 December 2002 for Vanguard Equity Income Fund, the Vanguard Municipal Bond Funds, and the Vanguard State Tax-Exempt Funds.

Distinguished Professor of Political Science,
School of Arts and Sciences, and Professor
of Communication, Annenberg School for
Communication, with secondary faculty appoint-
ments in the Department of Philosophy, School
of Arts and Sciences, and at the Graduate School
of Education, University of Pennsylvania; Trustee
of the National Constitution Center.
JoAnn Heffernan Heisen
Born 1950. Trustee Since July 1998. Principal
Occupation(s) During the Past Five Years and
Other Experience: Corporate Vice President
and Member of the Executive Committee
(1997–2008), Chief Global Diversity Officer
(retired 2008), Vice President and Chief
Information Officer (1997–2006), Controller
(1995–1997), Treasurer (1991–1995), and
Assistant Treasurer (1989–1991) of Johnson
& Johnson (pharmaceuticals/medical devices/
consumer products); Director of Skytop Lodge
Corporation (hotels) and the Robert Wood
Johnson Foundation; Member of the Advisory
Board of the Institute for Women’s Leadership
at Rutgers University.
F. Joseph Loughrey
Born 1949. Trustee Since October 2009.
Principal Occupation(s) During the Past Five
Years and Other Experience: President and Chief
Operating Officer (retired 2009) of Cummins Inc.
(industrial machinery); Chairman of the Board of
Hillenbrand, Inc. (specialized consumer services),
Oxfam America, and the Lumina Foundation for
Education; Director of the V Foundation for
Cancer Research; Member of the Advisory
Council for the College of Arts and Letters
and Chair of the Advisory Board to the Kellogg
Institute for International Studies, both at the
University of Notre Dame.
Mark Loughridge
Born 1953. Trustee Since March 2012. Principal
Occupation(s) During the Past Five Years and
Other Experience: Senior Vice President and
Chief Financial Officer (retired 2013) at IBM
(information technology services); Fiduciary
Member of IBM’s Retirement Plan Committee
(2004–2013); Member of the Council on
Chicago Booth.
Scott C. Malpass
Born 1962. Trustee Since March 2012. Principal
Occupation(s) During the Past Five Years and
Other Experience: Chief Investment Officer and
Vice President at the University of Notre Dame;
Assistant Professor of Finance at the Mendoza
College of Business at Notre Dame; Member of
the Notre Dame 403(b) Investment Committee,
the Board of Advisors for Spruceview Capital
Partners, the Board of Catholic Investment
Services, Inc. (investment advisor), and the
Board of Superintendence of the Institute for
the Works of Religion; Chairman of the Board of
TIFF Advisory Services, Inc. (investment advisor).
André F. Perold
Born 1952. Trustee Since December 2004.
Principal Occupation(s) During the Past Five Years
and Other Experience: George Gund Professor of
Finance and Banking, Emeritus at the Harvard
Business School (retired 2011); Chief Investment
Officer and Co-Managing Partner of HighVista
Strategies LLC (private investment firm);
Overseer of the Museum of Fine Arts Boston.
Peter F. Volanakis
Born 1955. Trustee Since July 2009. Principal
Occupation(s) During the Past Five Years and
Other Experience: President and Chief Operating
Officer (retired 2010) of Corning Incorporated
(communications equipment); Chairman of the
Board of Trustees of Colby-Sawyer College;
Member of the Board of Hypertherm, Inc.
(industrial cutting systems, software, and
consumables).

Executive Officers
Glenn Booraem
Born 1967. Investment Stewardship Officer Since
February 2017. Principal Occupation(s) During the
Past Five Years and Other Experience: Principal of
The Vanguard Group, Inc.; Treasurer (2015–2017),
Controller (2010–2015), and Assistant Controller
(2001–2010) of each of the investment companies
served by The Vanguard Group.
Christine M. Buchanan
Born 1970. Treasurer Since November 2017.
Principal Occupation(s) During the Past Five Years
and Other Experience: Principal of The Vanguard
Group, Inc.; Treasurer of each of the investment
companies served by The Vanguard Group;
Global Head of Vanguard Fund Administration
at The Vanguard Group; Partner at KPMG LLP
(2005–2017).
Thomas J. Higgins
Born 1957. Chief Financial Officer Since
September 2008. Principal Occupation(s) During
the Past Five Years and Other Experience: Principal
of The Vanguard Group, Inc.; Chief Financial Officer
of each of the investment companies served by
The Vanguard Group; Treasurer of each of the
investment companies served by The Vanguard
Group (1998–2008).
Peter Mahoney
Born 1974. Controller Since May 2015. Principal
Occupation(s) During the Past Five Years and
Other Experience: Principal of The Vanguard
Group, Inc.; Controller of each of the investment
companies served by The Vanguard Group; Head
of International Fund Services at The Vanguard
Group (2008–2014).
Anne E. Robinson
Born 1970. Secretary Since September 2016.
Principal Occupation(s) During the Past Five Years
and Other Experience: Managing Director of The
Vanguard Group, Inc.; General Counsel of The
Vanguard Group; Secretary of The Vanguard Group
and of each of the investment companies served
by The Vanguard Group; Director and Senior Vice
President of Vanguard Marketing Corporation;
Managing Director and General Counsel of Global
Cards and Consumer Services at Citigroup
(2014–2016); Counsel at American Express
(2003–2014).
Michael Rollings
Born 1963. Finance Director Since November 2017.
Principal Occupation(s) During the Past Five Years
and Other Experience: Managing Director of
The Vanguard Group, Inc.; Director of Vanguard
Marketing Corporation; Treasurer of each of the
investment companies served by The Vanguard
Group (February 2017–November 2017); Executive
Vice President and Chief Financial Officer of
MassMutual Financial Group (2006–2016).
Vanguard Senior Management Team
Mortimer J. Buckley Chris D. McIsaac
Gregory Davis James M. Norris
John James Thomas M. Rampulla
Martha G. King Karin A. Risi
John T. Marcante
Chairman Emeritus and Senior Advisor
John J. Brennan
Chairman, 1996–2009
Chief Executive Officer and President, 1996–2008
Founder
John C. Bogle
Chairman and Chief Executive Officer, 1974–1996

P.O. Box 2600
Valley Forge, PA 19482-2600
Connect with Vanguard® > vanguard.com
Fund Information > 800-662-7447
Direct Investor Account Services > 800-662-2739
Institutional Investor Services > 800-523-1036
Text Telephone for PeopleWho Are Deaf or Hard of Hearing > 800-749-7273
This material may be used in conjunctionwith the offering of shares of any Vanguardfund only if preceded or accompanied bythe fund’s current prospectus.
All comparative mutual fund data are from Lipper, aThomson Reuters Company, or Morningstar, Inc., unlessotherwise noted.
You can obtain a free copy of Vanguard’s proxy votingguidelines by visiting vanguard.com/proxyreporting or bycalling Vanguard at 800-662-2739. The guidelines arealso available from the SEC’s website, sec.gov. Inaddition, you may obtain a free report on how your fundvoted the proxies for securities it owned during the 12months ended June 30. To get the report, visit eithervanguard.com/proxyreporting or sec.gov.
You can review and copy information about your fund atthe SEC’s Public Reference Room in Washington, D.C. Tofind out more about this public service, call the SEC at202-551-8090. Information about your fund is alsoavailable on the SEC’s website, and you can receivecopies of this information, for a fee, by sending arequest in either of two ways: via email addressed [email protected] or via regular mail addressed to thePublic Reference Section, Securities and ExchangeCommission, Washington, DC 20549-1520.
© 2018 The Vanguard Group, Inc.All rights reserved.Vanguard Marketing Corporation, Distributor.
Q1190 022018