van ness avenue bus rapid transit (brt) … rapid transit (brt) feasibility study ... route in the...
TRANSCRIPT
VAN NESS AVENUE
BUS RAPID TRANSIT (BRT)
FEASIBILITY STUDY
DECEMBER 2006
SAN FRANCISCO COUNTY TRANSPORTATION AUTHORITY

Section 1: Introduction 1-1
CONTENTS1 INTRODUCTION .......................... 1-1
1.1 STUDY GOALS AND OBJECTIVES .............. 1-2
1.2 VAN NESS CORRIDOR STUDY AREA ............ 1-3
1.3 REPORT CONTENTS ............................. 1-3
SECTION 1: INTRODUCTIONVAN NESS AVENUE BRT FEASIBILITY STUDY
DECEMBER 2006
1 IntroductionIn 2003, 75% of San Francisco voters approved
Proposition K, the extension of San Francisco’s sales tax for transportation, along with its New Expenditure Plan (NEP). The NEP called for an integrated citywide network of rapid bus and rail transit, including the “creation of fast, frequent, and reliable bus rapid transit service,” or BRT, on Van Ness Avenue, Geary Boulevard, and Potrero Street. The 2004 Countywide Transportation Plan (CWTP) emphasized the role of this proposed network in retaining and expanding transit ridership citywide. The CWTP forecast that the share of trips made by transit will decline in the future unless measures are taken to increase its competitiveness relative to the car. The CWTP analysis found that only a network of fast, reliable, and comfortable transit citywide – shown in Figure 1.1 below – can cost-effectively reverse the trend toward declining transit mode share.
The northwestern quadrant of San Francisco is a major gap in the city’s rapid transit network. Van Ness Avenue is the primary north-south

SAN FRANCISCO COUNTY TRANSPORTATION AUTHORITY: Van Ness BRT Study 1-2
route in the northern half of San Francisco, with tens of thousands of travelers using MUNI and Golden Gate Transit on Van Ness Avenue each day. Transit services along Van Ness connect northwest San Francisco to the MUNI Metro rail network and to regional rail, including Golden Gate Transit, Caltrain, and BART. Van Ness Avenue is also a state highway, serving as a key link from San Francisco to Marin County via Lombard Street.
This study assesses the feasibility of implementing BRT on Van Ness Avenue as the strategy for establishing fast and reliable transit service on this key north-south corridor. The study examines which BRT designs offer the greatest benefi ts and fewest negative impacts. This report and its recommendations provide the foundation for implementing BRT on Van Ness Avenue.
This study has been conducted as a collaborative inter-agency and community process, involving close coordination with the Municipal Transportation Agency (MTA) and other city and regional agencies, as well as extensive public outreach. This study serves as a model for innovative inter-agency collaboration on major transportation projects, integrating urban design, land use, and public utilities planning into the transportation project development process.
1.1 STUDY GOALS AND OBJECTIVES
The inter-agency Van Ness BRT study team established goals for BRT on Van Ness Avenue that encompass both localized transportation improvements and systemwide gains:
Goal 1: Improve the level of service for existing transit passengers
Goal 2: Establish an effi cient north/south link in San Francisco’s transit network
Goal 3: Support the identity of the Van Ness corridor through a robust landscape and urban design program that also integrates new transit infrastructure with adjacent land uses
Goal 4: Develop standards for implementing BRT services citywide
Goal 1: Improve the level of service for existing transit passengers
Objective 1: Provide a transit service that reduces delays and that runs reliably
Objective 2: Provide a high-quality customer waiting, riding, and transfer experience
Objective 3: Increase the effi ciency and visibility of connections and transfers to other regional and local routes
Goal 2: Establish an effi cient north/south link in San Francisco’s transit network
Objective 1: Optimize conditions for rapid and reliable north-south bus operations
Objective 2: Reduce bus bunching and maintain schedule adherence
Objective 3: Expedite passenger loading and unloading
Goal 3: Support the identity of the Van Ness corridor through a robust landscape and urban design program that also integrates new transit infrastructure with adjacent land uses
Objective 1: Distinguish Van Ness as a unique corridor
Objective 2: Improve pedestrian safety and comfort
Figure 1-1: Transit Priority Network

Section 1: Introduction 1-3
Objective 3: Support access to adjacent land uses through transit infrastructure
Goal 4: Develop standards for implementing BRT services citywide
Objective 1: Demonstrate a systematic and comprehensive planning process that allows for easy applicability in other corridors and in other contexts
Objective 2: Create a toolkit of best practices to allow other studies to apply lessons learned that are appropriate within the local context
1.2 VAN NESS CORRIDOR STUDY AREA
Van Ness Avenue is a bustling six lane arterial carrying a mix of cars, trucks, transit, pedestrians, and bicycles. One of San Francisco’s key north-south arterials, Van Ness Avenue also serves as State Route 101, connecting freeway entrances and exits to the south with Lombard Street and the Golden Gate Bridge access to the north. The street is densely crossed by a number of arterials running east and west, forming a dense grid.
The study area, shown in Figure 1-2, extends about 2 miles from Mission Street in the south, to Lombard to the north. From east to west, the study area includes the one-way pairs Larkin
and Hyde; the local commercial street Polk; and the high-capacity one-way arterials Franklin and Gough to the west. While Franklin and Gough also carry large volumes of north/south traffi c, Van Ness Avenue is the most direct regional route through this part of the city, and is offi cially mapped and signed to serve this role.
1.3 REPORT CONTENTS
To achieve these goals and objectives, the Authority convened an interagency study team to develop and evaluate BRT design alternatives for Van Ness Avenue. This report documents the complete study process and results:
Section 1: Introduction
This introductory section contains an overview of the Van Ness BRT project, an outline of project goals and objectives, and a brief description of the study area.
Section 2: Existing Conditions and Transportation Needs
This section documents the existing transportation supply and demand on Van Ness Avenue. The top priority transportation needs for are documented through a technical and community process.
Section 3: Alternative BRT Design Concepts
Section 3 describes the key features of BRT as defi ned by the San Francisco interagency study team, and outlines key design principles for developing BRT alternatives on Van Ness, as well as the four alternative BRT design concepts developed for Van Ness Avenue (plus a “no project” alternative).
Section 4: Evaluation Methodology and Evaluation Results
This section documents the methodology used for evaluating the likely impacts and benefi ts of BRT on Van Ness Avenue and presents the results of the study team’s evaluation of likely benefi ts and impacts of BRT on Van Ness Avenue for a number of key project aspects: transit performance, transit rider experience, access and pedestrian amenities, urban and landscape design, traffi c operations and parking, cost, and construction impacts.
Section 5: Next Steps
This section outlines the next steps in the process of implementing BRT on Van Ness Avenue, including a funding and implementation plan.
Section 6: Appendices
Figure 1-2: Van Ness Corridor Study Area
Section 2: Existing Conditions and Transportation Needs 2-1
CONTENTS1 INTRODUCTION .......................... 2-2
1.1 METHODOLOGY ............................... 2-2
1.2 SUMMARY OF KEY FINDINGS ................. 2-2
2 STREET LAYOUT .......................... 2-42.1 STREET CONFIGURATION....................... 2-4
2.2 INTERSECTION CONTROLS ................... 2-5
2.3 TURN RESTRICTIONS AND TURN POCKETS ................................ 2-5
2.4 UTILITIES ....................................... 2-5
2.5 KEY STREET LAYOUT CONDITIONS AND NEEDS .................................... 2-6
3 DEMOGRAPHICS AND LAND USE ........ 2-73.1 NEIGHBORHOODS ............................. 2-7
3.3 KEY LAND USE CONDITIONS AND NEEDS ................................... 2-11
4 TRAVEL DEMAND ........................2-124.1 TRAVEL DEMAND METHODOLOGY .......... 2-12
4.2 SCREENLINE-BASED TRAVEL DEMAND ..... 2-12
4.3 ZONE-BASED TRAVEL DEMAND ............. 2-14
4.4 KEY TRAVEL DEMAND CONDITIONS AND NEEDS ................................... 2-15
5 TRANSIT SUPPLY ........................2-175.1 TRANSIT SUPPLY METHODOLOGY .......... 2-17
5.2 TRANSIT SUPPLY FINDINGS ................. 2-17
5.3 RELEVANT OUTREACH FEEDBACK .......... 2-18
5.4 KEY TRANSIT SUPPLY CONDITIONS AND NEEDS ................................... 2-19
6 TRANSIT DEMAND .......................2-206.1 TRANSIT DEMAND METHODOLOGY ........ 2-20
6.2 RIDERSHIP STATISTICS ....................... 2-20
6.3 BUSIEST STOPS ............................... 2-23
6.4 RELEVANT WORKSHOP FEEDBACK ......... 2-23
6.5 KEY TRANSIT DEMAND CONDITIONS AND NEEDS ................................... 2-23
SECTION 2: EXISTING CONDITIONS AND TRANSPORTATION NEEDS
VAN NESS AVENUE BRT FEASIBILITY STUDYDECEMBER 2006
7 TRANSIT OPERATING CONDITIONS ...2-247.1 SPEED AND DELAY ANALYSIS ................ 2-24
7.2 RELIABILITY ANALYSIS ....................... 2-26
7.3 RELEVANT WORKSHOP FEEDBACK ......... 2-28
7.4 KEY NEEDS FOR TRANSIT OPERATION ..... 2-30
8 AUTO CONDITIONS .....................2-318.1 TRAFFIC VOLUMES ........................... 2-31
8.2 AUTO SPEEDS AND DELAYS .................. 2-31
8.4 RELEVANT WORKSHOP FEEDBACK ......... 2-33
8.5 KEY NEEDS FOR AUTOS ...................... 2-34
9 PARKING CONDITIONS ..................2-359.1 PARKING CONDITIONS METHODOLOGY ... 2-35
9.2 PARKING SUPPLY AND OCCUPANCY FINDINGS ...................... 2-35
9.3 RELEVANT WORKSHOP FEEDBACK ......... 2-35
9.4 KEY NEEDS FOR PARKING ................... 2-36
10 PEDESTRIAN AND BICYCLE CONDITIONS ..................2-3710.1 EXISTING CONDITIONS AND
IMPROVEMENTS .............................. 2-37
10.2 WALKABILITY ANALYSIS ...................... 2-38
10.3 PEDESTRIAN SAFETY ......................... 2-40
10.4 RELEVANT WORKSHOP FEEDBACK ......... 2-42
10.5 KEY NEEDS FOR PEDESTRIANS AND BICYCLISTS .............................. 2-42
11 URBAN AND LANDSCAPE DESIGN CONDITIONS ...................2-4411.1 URBAN AND LANDSCAPE DESIGN
CONDITIONS METHODOLOGY ............... 2-44
11-2 LANDSCAPE DESIGN FINDINGS ............. 2-44
11.3 URBAN DESIGN FINDINGS ................... 2-44
11.4 RELEVANT WORKSHOP FEEDBACK ......... 2-45
11.5 KEY NEEDS FOR URBAN AND LANDSCAPE DESIGN ......................... 2-46

SAN FRANCISCO COUNTY TRANSPORTATION AUTHORITY: Van Ness BRT Study 2-2
1 Introduction
This section summarizes the results of the analysis of existing conditions and the assessment of transportation needs on the Van Ness Corridor. The analysis is documented here through ten chapters that describe the Van Ness corridor study area; the land use; travel demand and supply; transit operating performance; mixed traffi c operating conditions; bicycle and pedestrian conditions; and landscape and urban design. Each chapter includes a summary of community feedback gathered at public outreach events conducted during the preparation of the analysis. Key needs, opportunities, and constraints that can inform that the BRT design process are identifi ed at the end of each chapter.
1.1 METHODOLOGY
Transportation conditions and needs are documented through an array of methods both quantitative and qualitative. Information is analyzed from the City’s GIS database of land uses; the US Census 2000, the San Francisco Planning Department’s forecasts of future jobs and housing growth, the San Francisco County Transportation Authority’s travel demand forecasting model (SF-CHAMP), data collected by the Authority and the Municipal Transportation Agency (MTA) on traffi c volumes and transit ridership; the MTA’s Synchro traffi c operations model, the MTA’s engineering drawings of the street confi guration and signal timing plans, state data collected on traffi c-related collisions, and fi eld observations and inventories.
1.2 SUMMARY OF KEY FINDINGS
The assessment of existing transportation conditions and needs on Van Ness Avenue identifi ed four major areas of transportation performance:
Separate transit from auto traffi c to reduce delays and improve travel times.
People use Van Ness to drive, wait for and ride transit, walk, and ride bicycles. Van Ness Avenue itself is the primary transit street in the corridor, carrying up to 85 percent of all transit trips in the corridor on this key north-south route. Most of the people using the Van Ness corridor are making their trip entirely within San Francisco.
•
Those travelers should have a competitive and attractive transit alternative.
However, buses spend half their travel time on Van Ness completely stopped. This amounts to 10 minutes of the 20-minute trip from Mission to Lombard. Travel is almost twice as fast for drivers on Van Ness as for transit riders. Drivers also experience less overall delay on Van Ness Avenue than do transit riders.
Improve reliability by reducing delays associated with loading and unloading, ensuring on-time pullouts and removing buses from mixed-fl ow traffi c.
Wait times for buses vary widely. About 1/3 of the time, passengers will wait more than eight minutes for a bus – double the scheduled wait time. Travel in mixed traffi c slows buses, reduces bus reliability, and leads to bus bunching. When time spent loading and unloading passengers – dwell time – is subtracted from transit travel time, buses remain as much as 35 percent slower than cars. As buses travel in traffi c, they become increasingly unreliable, and buses begin to bunch together.
Improve the safety and comfort of pedestrian crossing conditions.
For those walking along the corridor or walking to transit, the experience is mixed. On the one hand, Van Ness sidewalks are relatively wide and buffered from auto traffi c by parallel parking, fronted by active commercial uses, and landscaped.
On the other hand, Van Ness Avenue is a wide street with high auto traffi c volumes. Street treatments that make crossing Van Ness easier, such as curb extensions, visible crosswalks, wide medians, and pedestrian count down signals, are not consistently provided. Pedestrian scale lighting, an important amenity that is currently lacking on Van Ness Avenue, should be incorporated in future BRT designs.
Upgrade urban design to support walking, improve the waiting environment for transit, support the civic destinations on the corridor, and integrate transit infrastructure with adjacent land uses.
Van Ness Avenue lacks a coordinated set of street furniture; newspaper racks, trash cans,
•
•
•
Section 2: Existing Conditions and Transportation Needs 2-3
benches and signage should work together to reinforce the stature of the street. Continuous street tree plantings, transit shelter improvements, and a comprehensive street furniture and lighting plan would establish a more unifi ed identity for this key Avenue.
Historic design elements on Van Ness Avenue, such as the streetlights, can be integrated into a contemporary design that improves pedestrian amenities and connections, especially adjacent to improved transit facilities, and emphasizes the avenue’s special role as one of the city grand thoroughfares. The landscaped medians running down the center of Van Ness can be leveraged as a consistent, visible element in the street’s identity and urban design.
The Civic Center segment of Van Ness Avenue between McAllister and Grove is a major landmark along the boulevard and an opportunity for signature urban design treatment. The intersections of Van Ness Avenue, Market Street, and Mission Street – the gateway to the corridor – are also key opportunity sites.
SAN FRANCISCO COUNTY TRANSPORTATION AUTHORITY: Van Ness BRT Study 2-4
2 Street Layout
This section provides an overview of functional design of the Van Ness BRT study area, and the confi guration of Van Ness Avenue specifi cally.
2.1 STREET CONFIGURATION
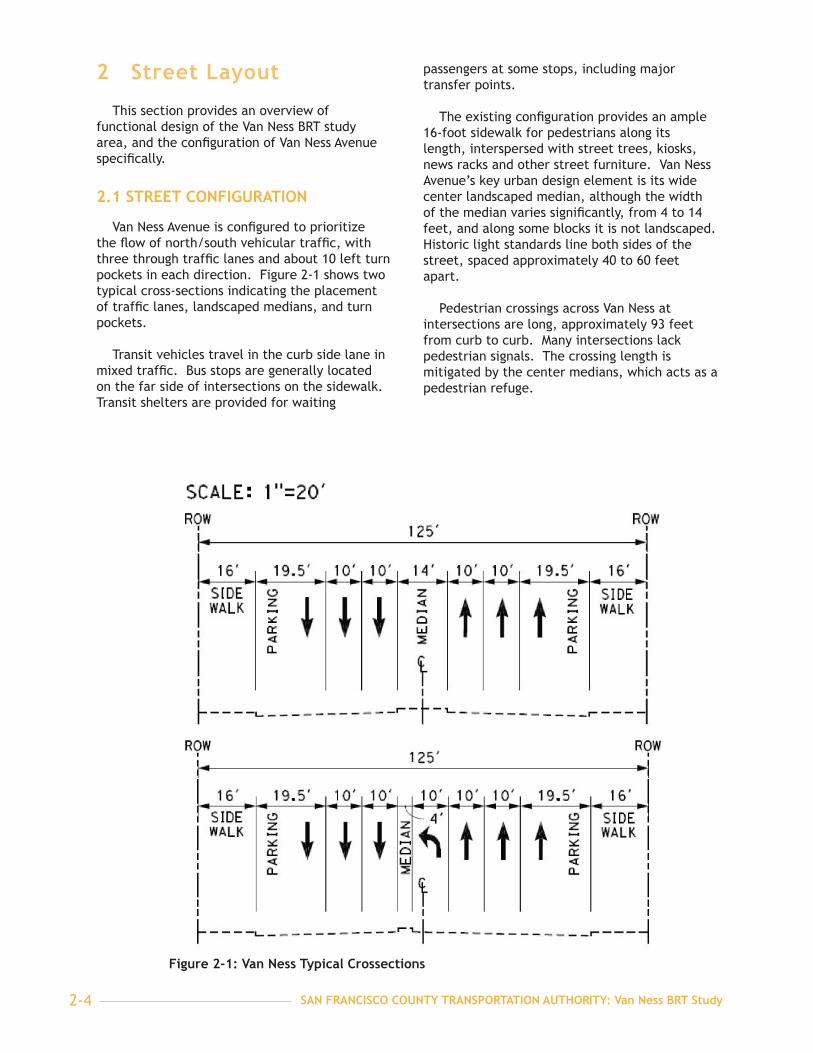
Van Ness Avenue is confi gured to prioritize the fl ow of north/south vehicular traffi c, with three through traffi c lanes and about 10 left turn pockets in each direction. Figure 2-1 shows two typical cross-sections indicating the placement of traffi c lanes, landscaped medians, and turn pockets.
Transit vehicles travel in the curb side lane in mixed traffi c. Bus stops are generally located on the far side of intersections on the sidewalk. Transit shelters are provided for waiting
passengers at some stops, including major transfer points.
The existing confi guration provides an ample 16-foot sidewalk for pedestrians along its length, interspersed with street trees, kiosks, news racks and other street furniture. Van Ness Avenue’s key urban design element is its wide center landscaped median, although the width of the median varies signifi cantly, from 4 to 14 feet, and along some blocks it is not landscaped. Historic light standards line both sides of the street, spaced approximately 40 to 60 feet apart.
Pedestrian crossings across Van Ness at intersections are long, approximately 93 feet from curb to curb. Many intersections lack pedestrian signals. The crossing length is mitigated by the center medians, which acts as a pedestrian refuge.
Figure 2-1: Van Ness Typical Crossections

Section 2: Existing Conditions and Transportation Needs 2-5
2.2 INTERSECTION CONTROLS
In a congested urban environment, traffi c signals at intersections manage the confl icting movements of vehicles, pedestrians, and bicycles. Van Ness is crossed by a dense grid of east-west streets carrying high volumes of traffi c, therefore creating many confl icting movements; each of the 29 intersections in the study area is signalized. Traffi c signals are coordinated with the Central Freeway signal system to the southwest; the North of Market system to the east; and the Lombard system to the north. On Van Ness Avenue, the high traffi c volumes require enough green time to get the majority of cars through each cycle.
Pedestrian signals are timed to allow pedestrians to reach a median refuge island at 2.5 feet per second (fps), and to cross from curb to curb at three fps. Nearly all pedestrians will are able to cross the entire street if they start their cross before the “red hand” begins to fl ash.
2.3 TURN RESTRICTIONS AND TURN POCKETS
Right turns are not restricted along the length of Van Ness Avenue other than at the intersections with Market Street and Oak Street, where right turns at red lights are prohibited.
Table 2-1 lists the intersections on Van Ness Avenue with the highest numbers of right-turning cars.
Table 2-1: Intersections with Highest Right Turn Volumes
Street RT Volume / hr. (PM peak)
Bush 176
Clay 170
California 150
Market 127
Golden Gate 117
Mission 113
O’Farrell 100
Post 100
Van Ness Avenue serves large volumes of left turn movements through 10 left-turn pockets in the southbound direction, and 11 left turn pockets in the northbound direction (not
including the three northbound left turn pockets at Lombard). Left turns are prohibited except where pockets are provided. Table 2-2 shows the highest left-turn volumes for intersections along Van Ness Avenue.
Table 2-2: Highest Left Turn Volumes by intersection
Street LT Volume / hr.
Existing Left-turn pocket
Lombard 1,498 NB
Hayes 538 NB
O’Farrell 223 SB
Broadway 221 SB
Bush 212 SB
Geary 197 NB
Sacramento 158 NB
Pine 156 NB
Turk 140 NB
Ellis 120 NB
Union 118 NB
2.4 UTILITIES
In addition to serving as a transportation facility, Van Ness Avenue provides access to key public utilities. The Department of Public Works identifi ed three types of underground utilities in the Van Ness corridor: sewer, water, and special fi refi ghting water systems (see Appendix 1 for more detail).
2.4.1 Sewer
From Market to Lombard Street, manholes and various sizes and types of sewer lines run down the center of Van Ness Avenue. The sewer lines are located underneath the existing center median.
2.4.2 San Francisco Water Department (SFWD)
The SFWD system feeds low pressure fi re hydrants and provides drinking water to the businesses and residents in the area. The system includes underground pipes, gate valves to control water fl ow, and hydrants along both the west and east sides of the street.

SAN FRANCISCO COUNTY TRANSPORTATION AUTHORITY: Van Ness BRT Study 2-6
2.4.3 Auxiliary Water Supply System (AWSS)
The AWSS system is a high pressure water system that supplies water to the San Francisco Fire Department. The system includes underground pipes, gate valves to control water fl ow, and 10 underground cisterns. The AWSS lines run along both the east and west sides of Van Ness Avenue underneath the roadway.
2.5 KEY STREET LAYOUT CONDITIONS AND NEEDS
Enhance Van Ness Avenue’s multimodal role. People use Van Ness Avenue to drive, wait for and ride transit, walk, and ride bicycles. Transportation improvements to Van Ness must reinforce and encourage this multimodal use.
Effi cient use of wide rights-of-way. Van Ness Avenue is one of San Francisco’s widest arterials. Improvements should establish the most effi cient use of the wide rights-of-way to maximize transportation function while enhancing urban design.
North-South route. Van Ness Avenue serves as a key north-south route for all modes of transportation. In addition to serving local pedestrian, transit and vehicular traffi c from Lombard to South Van Ness, Van Ness Avenue also functions as the section of Highway 101 routed through San Francisco. Any future designs should address this dual role.
•
•
•

Section 2: Existing Conditions and Transportation Needs 2-7
3 Demographics and Land Use
This chapter summarizes the land use plans that cover the Van Ness corridor, and describes the land uses along the corridor, focusing on jobs and housing.
3.1 NEIGHBORHOODS
The focus of activity along the Van Ness corridor goes through several transitions from Mission to Lombard. Around Market Street and Civic Center, daytime civic job-related activities and uses predominate, although there is signifi cant nighttime activity around the performing arts venues west of City Hall. Van Ness Avenue serves as the “front door” to major employers, city offi ces, and supports important transit access to the north and south for commuters during the workweek. North to Geary Boulevard, a concentration of large destination retail and entertainment venues attracts a broader range of users at all times of day and on weekends. North of Broadway, the corridor is quieter, with most retail/service-related activities clustered on Polk Street, one block east.
Both the Polk Street and the Hayes Valley neighborhood retail districts have a strong relationship to Van Ness Avenue. Polk Street, lined with relatively small-scale retail, is well-served by transit and is complemented by many of the larger retail and commercial activities on Van Ness Avenue. Hayes Valley plays an important role in serving patrons from the government offi ces and performing arts venues along Van Ness. Many attribute the success of its upscale restaurants and retail to the extra business that these connections provide.
For more detail about the neighborhoods along the Van Ness Avenue corridor, see Appendix 2.
3.1.1 Plans and Policies
Several major planning efforts have focused on parts of the Van Ness study area over the past 20 years. These include the Van Ness Avenue Area Plan, the Civic Center Area Plan, and the three Better Neighborhoods Plans. These land use policies and controls for Van Ness Avenue, such as the Van Ness Avenue Plan and Special Use District, encourage relatively dense, mixed-
use infi ll development with active, pedestrian-oriented retail and related uses on the ground fl oor. Nearly 1,000 new units of housing have been built as part of mixed-use development along the corridor, and several additional projects are under construction.
3.1.2 The Van Ness Avenue Area Plan
In 1986, the City adopted the Van Ness Area Plan. The Van Ness Avenue Special Use District was added to the Planning Code in 1988 to implement the policies contained in the area plan. The Plan is intended to promote the development of Van Ness Avenue as the city’s most prominent north-south thoroughfare, with high-density mixed-use development, formal design features, and relatively wide sidewalks.
The key objectives of the Van Ness Area Plan address:
Land Use: Encourage the development of new high-density housing with ground-level commercial on Van Ness Avenue south of Broadway and medium-density north of Broadway.
Urban Design: Establish height and bulk controls to appropriately frame the width of Van Ness Avenue; encourage a uniform street wall.
Residential Livability: Promote a safe and attractive environment for residential and commercial uses.
Streetscape: Create an attractive street and sidewalk space which contributes to the transformation of Van Ness Avenue into a grand street with a prominent residential component.
Transportation and Circulation: Provide safe and effi cient movement for all users of Van Ness.
Approximately 1,000 housing units have been developed along Van Ness Avenue since the special use district was adopted. While the plan has successfully encouraged dense residential development along Van Ness, it has not led to a unifi ed streetscape design and pedestrian-friendly public realm.
3.1.3 The Civic Center Area Plan
The Civic Center Area Plan outlines a series of policies to guide development in and around Civic Center, an area including City Hall nearby government offi ces, and cultural performing arts institutions. The plan did not include specifi c
•
•
•
•
•

SAN FRANCISCO COUNTY TRANSPORTATION AUTHORITY: Van Ness BRT Study 2-8
Figure 2-2: Van Ness Corridor Land Use

Section 2: Existing Conditions and Transportation Needs 2-9
zoning and planning code changes, but called for a comprehensive program of street and pedestrian improvements in the area.
3.1.4 The Market and Octavia Better Neighborhoods Plan
Released in December 2003, the Draft Market and Octavia Neighborhood Plan proposes improving transit service on Van Ness by establishing dedicated transit lanes, and develops detailed policies to encourage the transformation of the area around South Van Ness Avenue from Market to Division Streets, known as “SoMa West,” into a dynamic new mixed-use residential neighborhood. The plan allows 2,500 new housing units around South Van Ness Avenue and Mission Street. Extensive public investments in streets, pedestrian crossings, and streetscapes are envisioned as improvements to transit service on Van Ness Avenue.
3.2 LAND USES
Van Ness Avenue is one of the city’s major streets – it serves a diverse range of functions, for both the city and the region as a whole, as shown in Figure 2-2. At the western edge of San Francisco’s central area, the Van Ness corridor supports nearly 45,000 jobs and 25,000 housing units, most of which are located in older, walkable historic neighborhoods. With dense housing and employment located within easy walking distance of each other, improved transit service on Van Ness Avenue has the potential to affect the transit experience of the thousands of existing riders, as well as to attract a large number of new riders to the system.
3.2.1 Corridor Land Use Overview
Van Ness Avenue anchors City Hall, government offi ces, the Symphony, Opera, and other performing arts venues where more than 20,000 jobs are clustered within 3 blocks.
North of McAllister Street to California Street, Van Ness Avenue supports a broad range of relatively intense land uses. There is a range of “destination” retail uses (home furnishings and electronics sales), a substantial number of housing units in the Tenderloin/Polk Street and Cathedral Hill areas, as well as several large multi-screen movie theaters (Opera Plaza and the AMC 1000). Several automobile dealerships are clustered here, as well as more than a dozen large hotels. Several high-density
housing developments (8-16 stories) have been completed recently or are nearly complete.
North of California to Broadway, Van Ness Avenue supports a range of religious institutions, as well as less intensive and more neighborhood-serving retail. There is a scattering of large and small multiunit residential buildings, and relatively little new development.
North of Broadway, Van Ness Avenue is primarily residential, with a scattering of hotels close to Lombard Street. This portion of Van Ness has a relatively well-defi ned pattern of individual apartment buildings, with a scattering of neighborhood-serving retail located at the intersections.
One school fronts Van Ness Avenue itself; however, numerous schools and colleges are located within the Van Ness Study Area. Of the 19 schools and colleges located within the study boundaries, nine are public or private schools that include grades K-5 or higher. The majority of schools and colleges are located south of Bush Street.
Figure 2-3: Residential Buildings along Van Ness Avenue

SAN FRANCISCO COUNTY TRANSPORTATION AUTHORITY: Van Ness BRT Study 2-10
3.2.2 Residential Uses
Total dwelling units within ¼ mile: 24,937 Dwelling units/acre within ¼ mile: 93
Van Ness Avenue supports the largest concentration of housing of any of the city’s major transit corridors. The majority of these dwelling units are concentrated in the Tenderloin /Polk Gulch area east of Van Ness Avenue and south of Broadway, and in the Cathedral Hill/Lower Pacifi c Heights area west of Van Ness Avenue around Lafayette Park. As shown in Figure 2-3, most of the housing units in these areas are in large, multi-unit apartment buildings built between 1920 and 1960. More expensive, single family homes dominate west of Van Ness Avenue, and less expensive rental housing to the east. While these concentrations provide substantial housing in the Van Ness corridor, relatively little fronts directly onto Van Ness Avenue, which is dominated by large commercial uses south of Broadway.
North of Broadway, there is substantial housing at a more moderate scale through the lower Russian Hill and Marina areas. While housing is far less concentrated in these areas, it is more evenly distributed with commercial uses and many residential buildings front directly onto Van Ness Avenue.
In contrast to more recent residential development in other parts of the city, housing along the corridor provides relatively little dedicated off-street parking, especially south of Broadway. This has kept vehicle ownership rates in the area far below citywide averages and supports above-average transit ridership. In fact, forty-six percent of households in the area do not own cars, compared to 29 percent for the city as a whole (US Census 2000).
3.2.3 Employment and Non Residential Uses
Total Employment: 44,237 Number of employees per business: 10
The Van Ness corridor supports a wide range of businesses, institutions, and cultural arts, and religious organizations anchored by the Civic Center area. Some examples are shown in Figure 2-4. There is a broad distribution of non-residential activities at a variety of scales, representative of the relatively intense vertical mix of uses that generally thrives east of Van Ness Avenue. Eighty eight percent of those jobs are in major centers of retail and offi ce employment located south of Broadway.
Retail and entertainment activities are distributed throughout the area. Neighborhood-serving retail is concentrated along adjacent commercial streets such as Polk and Green Streets, and in the Hayes/Gough portion of Hayes Valley. Large-scale retail activities such as automobile dealerships, home furnishings, and electronic sales are located along Van Ness Avenue north of the Civic Center and south of Broadway. Visitor-serving activities, primarily hotels, can be found throughout the area, but there is a cluster of larger hotels in the Cathedral Hill area around Geary and California Streets.
Government and institutional employment accounts for more than half of the 45,000 jobs located along the corridor. Almost all of those jobs are in the Civic Center area north of Market Street and south of Golden Gate Avenue. Several thousand jobs in cultural/performing arts organizations are also clustered in this area. South of Market Street, there are more than 5,000 jobs in the corridor associated with a handful of large corporate employers (Bank of America, Goodwill Industries, and others).
Figure 2-4: Non-Residential Uses along Van Ness Avenue

Section 2: Existing Conditions and Transportation Needs 2-11
3.3 KEY LAND USE CONDITIONS AND NEEDS
The existing mix of land uses supports rapid transit. The density of residential and employment activity on the Van Ness corridor as it exists today is more than suffi cient for sustaining a BRT system.
Transit must serve an array of uses. The Van Ness Corridor is a neighborhood, jobs center, and cultural and civic destination. Upgrades to transportation facilities on Van Ness Avenue must support a wide array of users and neighbors – from residential and large scale business uses, to commuters, as well as nighttime entertainment travelers.
Low vehicle ownership rate. Vehicle ownership rates in the area are far below citywide averages and supports above-average transit ridership. In the Van Ness corridor, 46 percent of households do not own cars, compared to 29 percent citywide.
•
•
•
•
SAN FRANCISCO COUNTY TRANSPORTATION AUTHORITY: Van Ness BRT Study 2-12
4 Travel Demand
This section describes the overall demand for travel along the Van Ness corridor for all modes of transportation: mixed traffi c, transit, walking, and bicycling. It describes the numbers of people and vehicles using Van Ness Avenue, as well as the parallel streets, throughout the day and during the evening peak period. It also describes the modes of transportation used by people traveling to and from the neighborhoods around Van Ness Avenue.
4.1 TRAVEL DEMAND METHODOLOGY
All travel demand fi ndings come from the Authority’s travel demand forecasting model, SF-CHAMP. Two basic model analyses are useful to describe overall travel demand: a “screenline” analysis and a “zone based” analysis. The screenline analysis is most useful for describing the volumes of car and transit trips on Van Ness Avenue itself during the day, or during the PM peak period. The zone-based analysis is most useful for describing the mode share and origins or destinations of trips that come to or leave from the neighborhoods within the Van Ness study area. For more detail about these analyses, see Appendix 3.
4.2 SCREENLINE-BASED TRAVEL DEMAND
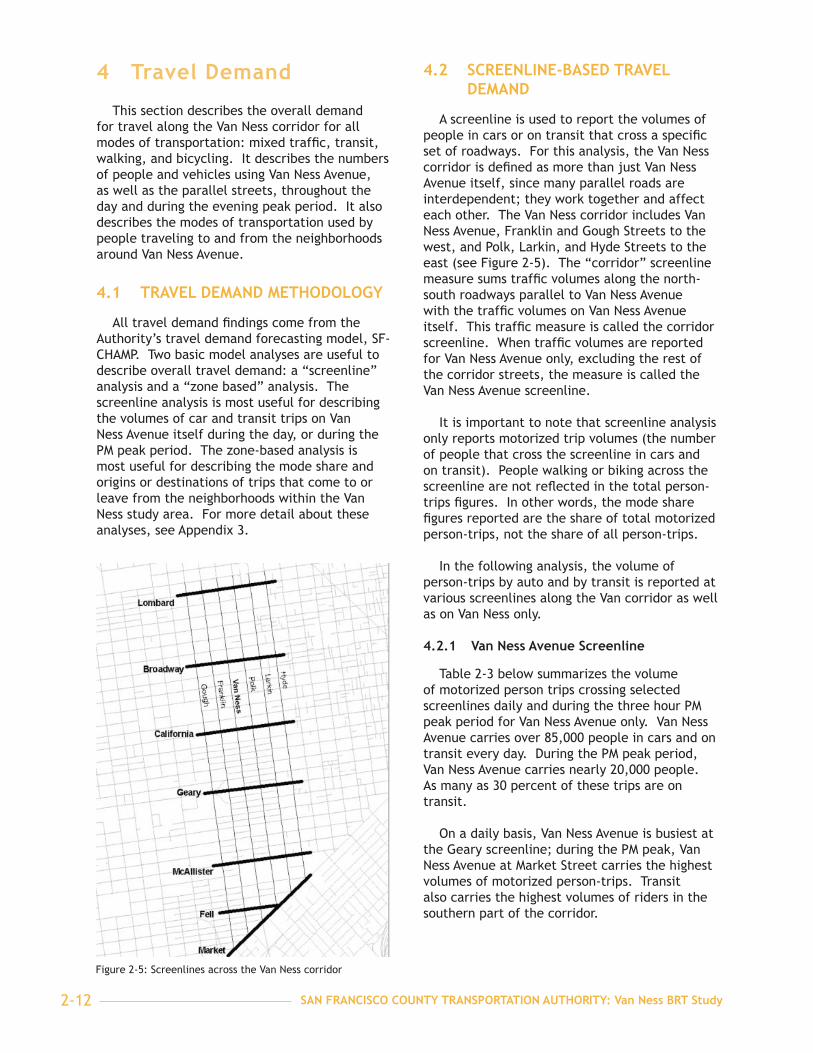
A screenline is used to report the volumes of people in cars or on transit that cross a specifi c set of roadways. For this analysis, the Van Ness corridor is defi ned as more than just Van Ness Avenue itself, since many parallel roads are interdependent; they work together and affect each other. The Van Ness corridor includes Van Ness Avenue, Franklin and Gough Streets to the west, and Polk, Larkin, and Hyde Streets to the east (see Figure 2-5). The “corridor” screenline measure sums traffi c volumes along the north-south roadways parallel to Van Ness Avenue with the traffi c volumes on Van Ness Avenue itself. This traffi c measure is called the corridor screenline. When traffi c volumes are reported for Van Ness Avenue only, excluding the rest of the corridor streets, the measure is called the Van Ness Avenue screenline.
It is important to note that screenline analysis only reports motorized trip volumes (the number of people that cross the screenline in cars and on transit). People walking or biking across the screenline are not refl ected in the total person-trips fi gures. In other words, the mode share fi gures reported are the share of total motorized person-trips, not the share of all person-trips.
In the following analysis, the volume of person-trips by auto and by transit is reported at various screenlines along the Van corridor as well as on Van Ness only.
4.2.1 Van Ness Avenue Screenline
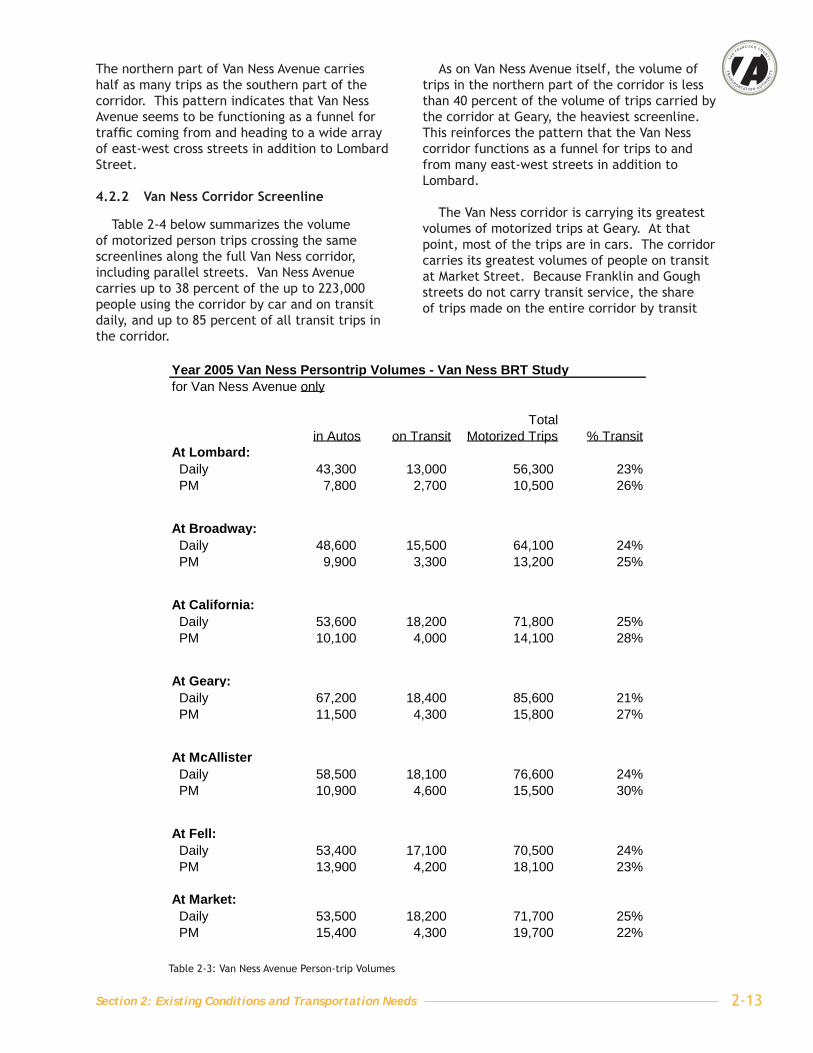
Table 2-3 below summarizes the volume of motorized person trips crossing selected screenlines daily and during the three hour PM peak period for Van Ness Avenue only. Van Ness Avenue carries over 85,000 people in cars and on transit every day. During the PM peak period, Van Ness Avenue carries nearly 20,000 people. As many as 30 percent of these trips are on transit.
On a daily basis, Van Ness Avenue is busiest at the Geary screenline; during the PM peak, Van Ness Avenue at Market Street carries the highest volumes of motorized person-trips. Transit also carries the highest volumes of riders in the southern part of the corridor.
Figure 2-5: Screenlines across the Van Ness corridor
Section 2: Existing Conditions and Transportation Needs 2-13
The northern part of Van Ness Avenue carries half as many trips as the southern part of the corridor. This pattern indicates that Van Ness Avenue seems to be functioning as a funnel for traffi c coming from and heading to a wide array of east-west cross streets in addition to Lombard Street.
4.2.2 Van Ness Corridor Screenline
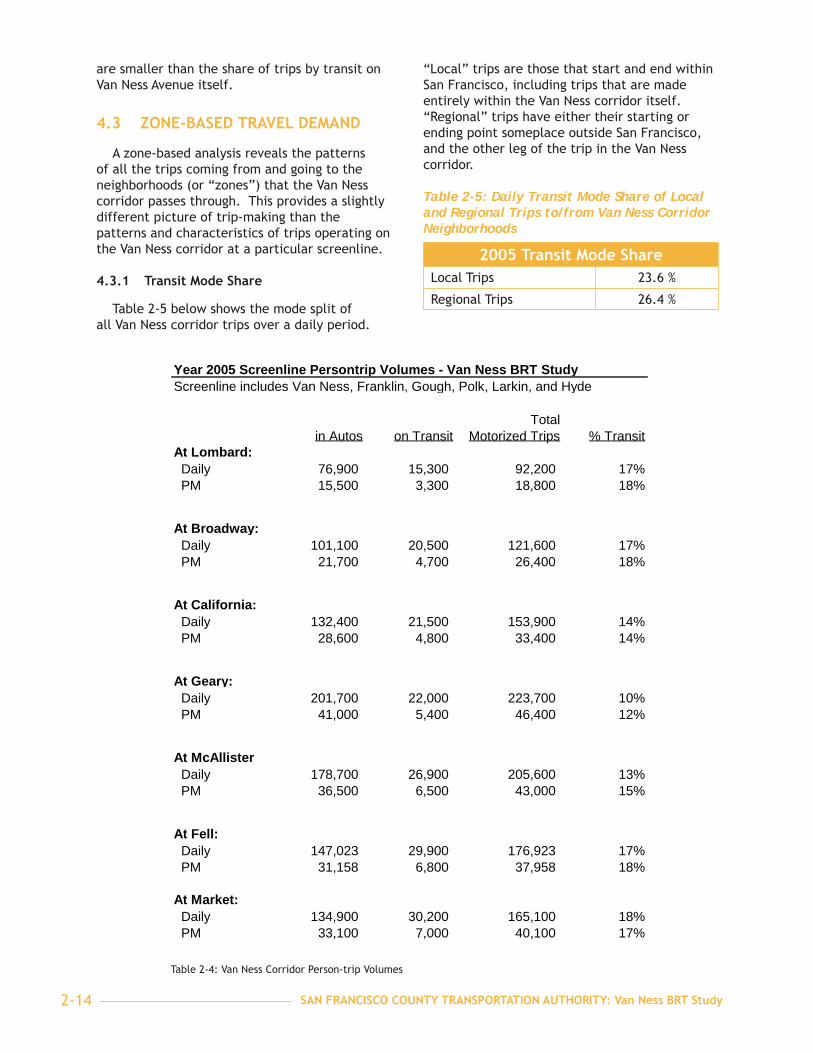
Table 2-4 below summarizes the volume of motorized person trips crossing the same screenlines along the full Van Ness corridor, including parallel streets. Van Ness Avenue carries up to 38 percent of the up to 223,000 people using the corridor by car and on transit daily, and up to 85 percent of all transit trips in the corridor.
As on Van Ness Avenue itself, the volume of trips in the northern part of the corridor is less than 40 percent of the volume of trips carried by the corridor at Geary, the heaviest screenline. This reinforces the pattern that the Van Ness corridor functions as a funnel for trips to and from many east-west streets in addition to Lombard.
The Van Ness corridor is carrying its greatest volumes of motorized trips at Geary. At that point, most of the trips are in cars. The corridor carries its greatest volumes of people on transit at Market Street. Because Franklin and Gough streets do not carry transit service, the share of trips made on the entire corridor by transit
Year 2005 Van Ness Persontrip Volumes - Van Ness BRT Studyfor Van Ness Avenue only
Totalin Autos on Transit Motorized Trips % Transit
At Lombard: Daily 43,300 13,000 56,300 23% PM 7,800 2,700 10,500 26%
At Broadway: Daily 48,600 15,500 64,100 24% PM 9,900 3,300 13,200 25%
At California: Daily 53,600 18,200 71,800 25% PM 10,100 4,000 14,100 28%
At Geary: Daily 67,200 18,400 85,600 21% PM 11,500 4,300 15,800 27%
At McAllister Daily 58,500 18,100 76,600 24% PM 10,900 4,600 15,500 30%
At Fell: Daily 53,400 17,100 70,500 24% PM 13,900 4,200 18,100 23%
At Market: Daily 53,500 18,200 71,700 25% PM 15,400 4,300 19,700 22%
Table 2-3: Van Ness Avenue Person-trip Volumes
SAN FRANCISCO COUNTY TRANSPORTATION AUTHORITY: Van Ness BRT Study 2-14
are smaller than the share of trips by transit on Van Ness Avenue itself.
4.3 ZONE-BASED TRAVEL DEMAND
A zone-based analysis reveals the patterns of all the trips coming from and going to the neighborhoods (or “zones”) that the Van Ness corridor passes through. This provides a slightly different picture of trip-making than the patterns and characteristics of trips operating on the Van Ness corridor at a particular screenline.
4.3.1 Transit Mode Share
Table 2-5 below shows the mode split of all Van Ness corridor trips over a daily period.
“Local” trips are those that start and end within San Francisco, including trips that are made entirely within the Van Ness corridor itself. “Regional” trips have either their starting or ending point someplace outside San Francisco, and the other leg of the trip in the Van Ness corridor.
Table 2-5: Daily Transit Mode Share of Local and Regional Trips to/from Van Ness Corridor Neighborhoods
2005 Transit Mode Share2005 Transit Mode ShareLocal Trips 23.6 %
Regional Trips 26.4 %
Year 2005 Screenline Persontrip Volumes - Van Ness BRT StudyScreenline includes Van Ness, Franklin, Gough, Polk, Larkin, and Hyde
Totalin Autos on Transit Motorized Trips % Transit
At Lombard: Daily 76,900 15,300 92,200 17% PM 15,500 3,300 18,800 18%
At Broadway: Daily 101,100 20,500 121,600 17% PM 21,700 4,700 26,400 18%
At California: Daily 132,400 21,500 153,900 14% PM 28,600 4,800 33,400 14%
At Geary: Daily 201,700 22,000 223,700 10% PM 41,000 5,400 46,400 12%
At McAllister Daily 178,700 26,900 205,600 13% PM 36,500 6,500 43,000 15%
At Fell: Daily 147,023 29,900 176,923 17% PM 31,158 6,800 37,958 18%
At Market: Daily 134,900 30,200 165,100 18% PM 33,100 7,000 40,100 17%
Table 2-4: Van Ness Corridor Person-trip Volumes

Section 2: Existing Conditions and Transportation Needs 2-15
Most trips to or from the Van Ness corridor neighborhoods and other parts of San Francisco are made by car, followed closely by trips on foot. About 24 percent of the trips to and from the Van Ness corridor and other parts of San Francisco are made by transit. This is a substantially greater than the to the 16 percent daily transit mode share citywide. Regional trips to and from the corridor are mostly made by car. Interestingly, regional trips to and from the Van Ness corridor are more likely to be made by transit. Of all the regional trips to and from the corridor, 26 percent are on transit.
Transit shares are lowest from the Van Ness corridor to the North and South bays and among intra-district and adjacent-district trips, refl ecting lower transit accessibility and higher walk/bike accessibility, respectively.
4.3.2 Local and Regional Travel
In its role as US 101 through the city, Van Ness Avenue carries a high volume of regional trips. As shown in Table 2-6, two-thirds (67 percent) of auto trips on Van Ness Avenue are local trips – they have both their origin and destination in San Francisco. One-third (33 percent) of overall PM peak period auto trips on Van Ness Avenue are regional, with either an origin or destination outside of San Francisco. Just one-half of one percent of the trips on Van Ness Avenue pass completely through the city, with both trip ends outside of San Francisco.
Table 2-6: Regional vs. Local Travel on the Van Ness Corridor
Travel on the Van Ness CorridorTravel on the Van Ness CorridorPM Peak Regional
TripsLocal Trips
Total
33% 67 % 100%
4.3.3 Through Travel
Van Ness Avenue also carries a high volume of through-trips headed for other parts of the city or region, and are not destined for locations along the corridor.
Table 2-7. Vehicle Through Travel on Van Ness (pm peak)
Trip TypeTrips that start or end on the Van Ness corridor
47.9 %
- Trips that start and end on the Van Ness corridor
2.9 %
Trips with no start or end on the Van Ness corridor
52.1 %
- Trips with neither trip start or end in San Francisco
0.5 %
Total 100 %
As shown in Table 2-7, about 48 percent of total vehicle trips on Van Ness Avenue do have a starting point or ending point on the corridor; however, about 52 percent of vehicle trips on Van Ness Avenue during the PM peak do not have a starting or ending point on the corridor, and are just passing through to and from other parts of the city or the region.
Interestingly, only one-half of one percent of total trips using Van Ness Avenue have both origin and destination outside San Francisco.
4.4 KEY TRAVEL DEMAND CONDITIONS AND NEEDS
Transit mode shares already high. Transit is used for about 25 percent of trips to and from the Van Ness corridor; this is substantially greater than the 16 percent daily transit mode share citywide.
Regional travel by transit is important. Over one-quarter – 26 percent – of the trips to and from outside San Francisco and the Van Ness corridor are already being made by transit.
Van Ness Avenue is the corridor’s primary transit street. Van Ness Avenue itself carries up to 38 percent of the up to 223,000 total trips in cars and on transit using the corridor daily, and up to 85 percent of all transit trips in the corridor.
•
•
•
SAN FRANCISCO COUNTY TRANSPORTATION AUTHORITY: Van Ness BRT Study 2-16
The southern part of the corridor carries the most traffi c. Most of the demand for travel is in the southern part of the corridor, so improvements to this portion of the corridor should be addressed fi rst.
Providing access to Lombard is not the main role of Van Ness. Van Ness Avenue – and in fact, the entire corridor, including parallel streets – functions as more than just a link to and from Lombard Street and the Golden Gate Bridge. Many travelers use Van Ness as a north-south link to other east-west thoroughfares such as Geary, Pine, and Broadway.
Local transit access is key. Most of the people using the Van Ness corridor are making their trip entirely within San Francisco. Those travelers should have a competitive and attractive transit alternative.
•
•
•

Section 2: Existing Conditions and Transportation Needs 2-17
5 Transit Supply
This section describes the transit services currently provided on Van Ness Avenue: the routes, frequencies, and stop locations.
5.1 TRANSIT SUPPLY METHODOLOGY
Transit supply is documented based on Muni’s scheduled service.
5.2 TRANSIT SUPPLY FINDINGS
5.2.1 Routes
Muni operates two routes that serve the length of Van Ness Avenue from Mission Street to North Point: the 47-Van Ness (47) and the 49-Mission (49). Other Muni routes travel on a portion of Van Ness Avenue, as shown in Figure 2-6, and Golden Gate Transit uses Van Ness Avenue between McAllister/Golden Gate and Lombard.
In addition to the core Muni service provided by the 47 and 49 lines on Van Ness Avenue itself, several important lines cross the street, including the 1-California and 38-Geary lines. Transferring to and from transit service on Van Ness Avenue is an important part of the corridor’s role in the city’s larger transit network. Activity on Van Ness Avenue tends to be concentrated at these transfer points: Market, McAllister, Geary/O’Farrell, California and Union Streets.
Both the 47 and the 49 routes have nearly identical service frequencies, as shown in Table 2-8. Schedules are designed to work together,
with buses from each route arriving to stops in a staggered fashion. This design results in a combined headway of buses arriving about every 3.5 minutes during the peak periods and off-peak midday.
5.2.2 47-Van Ness
Figure 2-7 shows the full extent of route 47. The 47 serves Van Ness Avenue and South
Table 2-8: Van Ness Avenue Muni Routes in the Study Area
Route
Average Weekday Ridership
(2003)
From/To Direction
Number of blocks on Van Ness
PM Headway
MiddayHeadway
49-Van Ness Mission
29,175 Mission- North Point Both 28 7 min 9
47-Van Ness 13,917 Mission- North Point Both 28 8 min 9
27-Bryant 8,838 Jackson- Washington SB only 1 12 min 12
12-Folsom 7,929 Washington- Pacifi c NB only 1 10 min 20
30X-Stockton Express
2,225 Chestnut- Broadway Both 6 10 min 9
76-Marin Headlands
NA Post- Lombard Both 16 Sundays only
Sundays only
Figure 2-6: Van Ness AvenueTransit Routes and Frequency

SAN FRANCISCO COUNTY TRANSPORTATION AUTHORITY: Van Ness BRT Study 2-18
of Market (SOMA), traveling from Fort Mason to Civic Center and to the Fourth and Townsend Caltrain station via Bryant and Harrison. The 47 provides important connections to Fisherman’s Wharf and Caltrain.
5.2.3 49-Van Ness Mission
The full extent of route 49 is shown in Figure 2-7. The 49 traverses the city along Van Ness Avenue and then along Mission Street, from Fort Mason to City College (at Ocean and Phelan).
The 47 and 49 share the same stops along Van Ness Avenue in the study area between Mission and North Point. Outside the study area they have different routes: the 49 begins at North Point and travels south to City College, whereas the 47 starts in Fisherman’s Wharf, meets the 49 at North Point, leaves Van Ness Avenue at Mission Street and travels through SOMA to terminate at the 4th/King Caltrain station.
5.2.4 Golden Gate Transit Service
Golden Gate Transit runs service to and from Marin County on Van Ness Avenue using three routes: the 70, 80 and 93. These routes offer
primarily commuter services between Marin County and downtown San Francisco. There are limited stops along the Van Ness corridor to board Golden Gate Transit or transfer from Golden Gate Transit to Muni, with only four boarding/alighting opportunities on Van Ness Avenue. Golden Gate Transit stops on Van Ness are located at Geary, O’Farrell, and Turk. The Civic Center is served by an additional stop on McAllister Street at Polk Street.
5.3 RELEVANT OUTREACH FEEDBACK
Public outreach events held in fall 2004 and spring 2005 asked community members for feedback on transportation needs in the Van Ness corridor. This section highlights the key concerns regarding transit supply gathered during the public outreach effort. A complete summary of the events and feedback is included as Appendix 4.
About 45 percent of participants used transit to reach the public workshops, so it is not surprising that improving transit along the Van Ness corridor proved to be a the top concern of workshop participants. Although transit supply,
Figure 2-7: Muni Routes 47 and 49 on Van Ness
Fort Mason
Caltrain
Fishermans Wharf
City Hall
City College ofSan Francisco
Van Ness Avenue
LegendRoute 47
Route 49
Route 47
Rou
te 4
9

Section 2: Existing Conditions and Transportation Needs 2-19
reliability, speed, and demand are closely linked, this section focuses on transit supply issues.
Community comments related to transit supply included complaints about full transit vehicles passing up stops; infrequent weekend and off-peak service; and the need for an exclusive transit right of way. Notable comments include:
Need better dispatching at Van Ness and Aquatic Park.
Design BRT in a way that it will be easy to convert to rail.
Changing bus drivers mid-route is frustrating. Take breaks at ends, not in middle.
Franklin seems to be a fast-moving street – why not put a line there? It would off-load burdens from Van Ness and may also increase ridership.
Provide special student-only buses in the morning to reduce confl icts with seniors; provide shuttle service (like the Castro shuttle) during commute hours.
•
•
•
•
•
5.4 KEY TRANSIT SUPPLY CONDITIONS AND NEEDS
North-south role. Van Ness Avenue transit supplies the primary north-south service in this part of Muni’s transit network.
Van Ness Avenue routes include many important transfers to east-west routes. Although the Van Ness corridor should be prioritized for north-south transit, the street is crossed by several heavily used east-west routes, including the 38- and 38-L Geary, that also deserve priority.
Accommodate Golden Gate Transit. Golden Gate Transit along Van Ness is the primary transit link between this part of the city and the North Bay. As such, improvements must support improved Golden Gate Transit services.
Recognize regional transit connections. The Van Ness Avenue routes connect to Caltrain, a primary transit service provider to the South Bay. Transit improvements on Van Ness Avenue should move towards improving this connection.
•
•
•
•
SAN FRANCISCO COUNTY TRANSPORTATION AUTHORITY: Van Ness BRT Study 2-20
6 Transit Demand
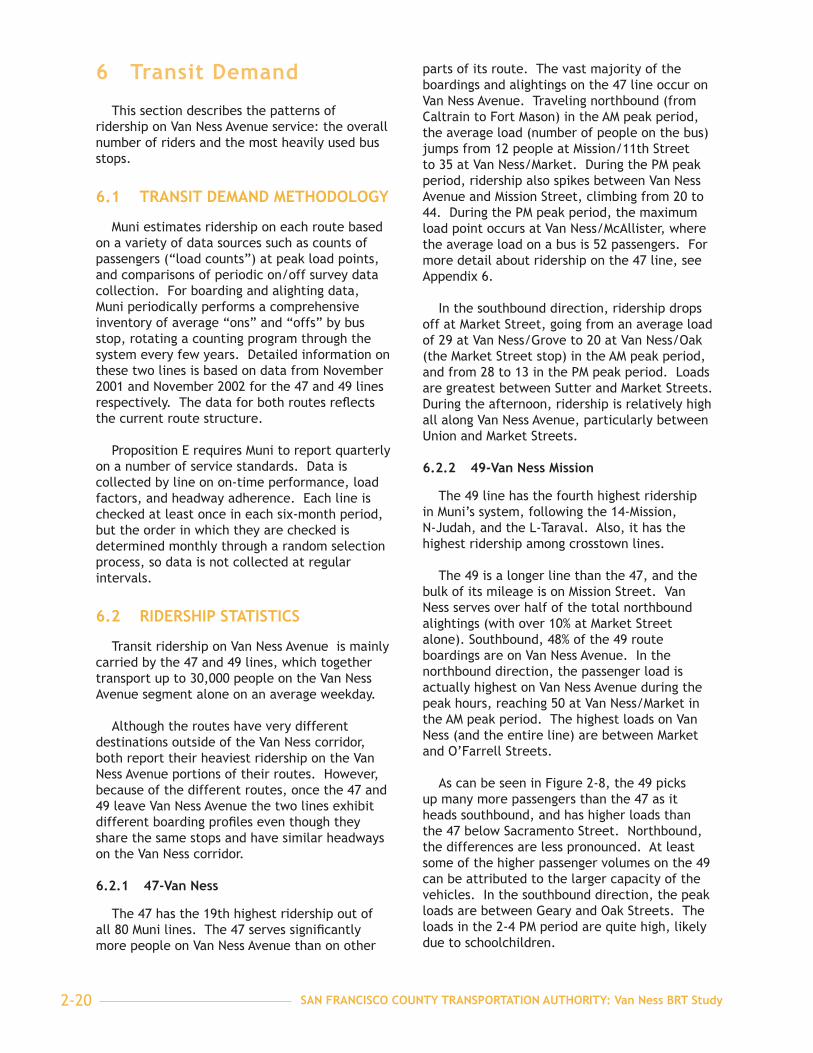
This section describes the patterns of ridership on Van Ness Avenue service: the overall number of riders and the most heavily used bus stops.
6.1 TRANSIT DEMAND METHODOLOGY
Muni estimates ridership on each route based on a variety of data sources such as counts of passengers (“load counts”) at peak load points, and comparisons of periodic on/off survey data collection. For boarding and alighting data, Muni periodically performs a comprehensive inventory of average “ons” and “offs” by bus stop, rotating a counting program through the system every few years. Detailed information on these two lines is based on data from November 2001 and November 2002 for the 47 and 49 lines respectively. The data for both routes refl ects the current route structure.
Proposition E requires Muni to report quarterly on a number of service standards. Data is collected by line on on-time performance, load factors, and headway adherence. Each line is checked at least once in each six-month period, but the order in which they are checked is determined monthly through a random selection process, so data is not collected at regular intervals.
6.2 RIDERSHIP STATISTICS
Transit ridership on Van Ness Avenue is mainly carried by the 47 and 49 lines, which together transport up to 30,000 people on the Van Ness Avenue segment alone on an average weekday.
Although the routes have very different destinations outside of the Van Ness corridor, both report their heaviest ridership on the Van Ness Avenue portions of their routes. However, because of the different routes, once the 47 and 49 leave Van Ness Avenue the two lines exhibit different boarding profi les even though they share the same stops and have similar headways on the Van Ness corridor.
6.2.1 47-Van Ness
The 47 has the 19th highest ridership out of all 80 Muni lines. The 47 serves signifi cantly more people on Van Ness Avenue than on other
parts of its route. The vast majority of the boardings and alightings on the 47 line occur on Van Ness Avenue. Traveling northbound (from Caltrain to Fort Mason) in the AM peak period, the average load (number of people on the bus) jumps from 12 people at Mission/11th Street to 35 at Van Ness/Market. During the PM peak period, ridership also spikes between Van Ness Avenue and Mission Street, climbing from 20 to 44. During the PM peak period, the maximum load point occurs at Van Ness/McAllister, where the average load on a bus is 52 passengers. For more detail about ridership on the 47 line, see Appendix 6.
In the southbound direction, ridership drops off at Market Street, going from an average load of 29 at Van Ness/Grove to 20 at Van Ness/Oak (the Market Street stop) in the AM peak period, and from 28 to 13 in the PM peak period. Loads are greatest between Sutter and Market Streets. During the afternoon, ridership is relatively high all along Van Ness Avenue, particularly between Union and Market Streets.
6.2.2 49-Van Ness Mission
The 49 line has the fourth highest ridership in Muni’s system, following the 14-Mission, N-Judah, and the L-Taraval. Also, it has the highest ridership among crosstown lines.
The 49 is a longer line than the 47, and the bulk of its mileage is on Mission Street. Van Ness serves over half of the total northbound alightings (with over 10% at Market Street alone). Southbound, 48% of the 49 route boardings are on Van Ness Avenue. In the northbound direction, the passenger load is actually highest on Van Ness Avenue during the peak hours, reaching 50 at Van Ness/Market in the AM peak period. The highest loads on Van Ness (and the entire line) are between Market and O’Farrell Streets.
As can be seen in Figure 2-8, the 49 picks up many more passengers than the 47 as it heads southbound, and has higher loads than the 47 below Sacramento Street. Northbound, the differences are less pronounced. At least some of the higher passenger volumes on the 49 can be attributed to the larger capacity of the vehicles. In the southbound direction, the peak loads are between Geary and Oak Streets. The loads in the 2-4 PM period are quite high, likely due to schoolchildren.

Section 2: Existing Conditions and Transportation Needs 2-21
0
50
100
150
200
250
300
350
Nort
h P
oin
t
Ches
tnut
Gre
enw
ich
Unio
n
Val
lejo
Pac
ific
Jack
son
Sac
ram
ento
Pin
e
Sutt
er
Gea
ry
O'F
arre
ll
Eddy
McA
llist
er
Gro
ve
Oak
Mar
ket
Mission
0
200
400
600
800
1000
1200
1400
1600
1800
2000
47 Boardings
49 Boardings
47 Volume
49 Volume
Boar
din
gs
Volu
me
2005 Southbound
0
50
100
150
200
250
300
350
400
450
ssio
n
arke
t
Gro
ve
liste
r
Turk
Edd
y
Farre
ll
Pos
t
Sut
ter
orni
a
Cla
y
ckso
n
dway
Uni
on
nwic
h
estn
ut
ncis
co
Poi
nt
0
200
400
600
800
1000
1200
1400
1600
1800
2000
49 Boardings47 Volume49 Volume
Boa
rdin
gs Vol
ume
2005 Northbound
47 Boardings
Figure 2-8: MUNI Ridership Patterns on Van Ness
SAN FRANCISCO COUNTY TRANSPORTATION AUTHORITY: Van Ness BRT Study 2-22
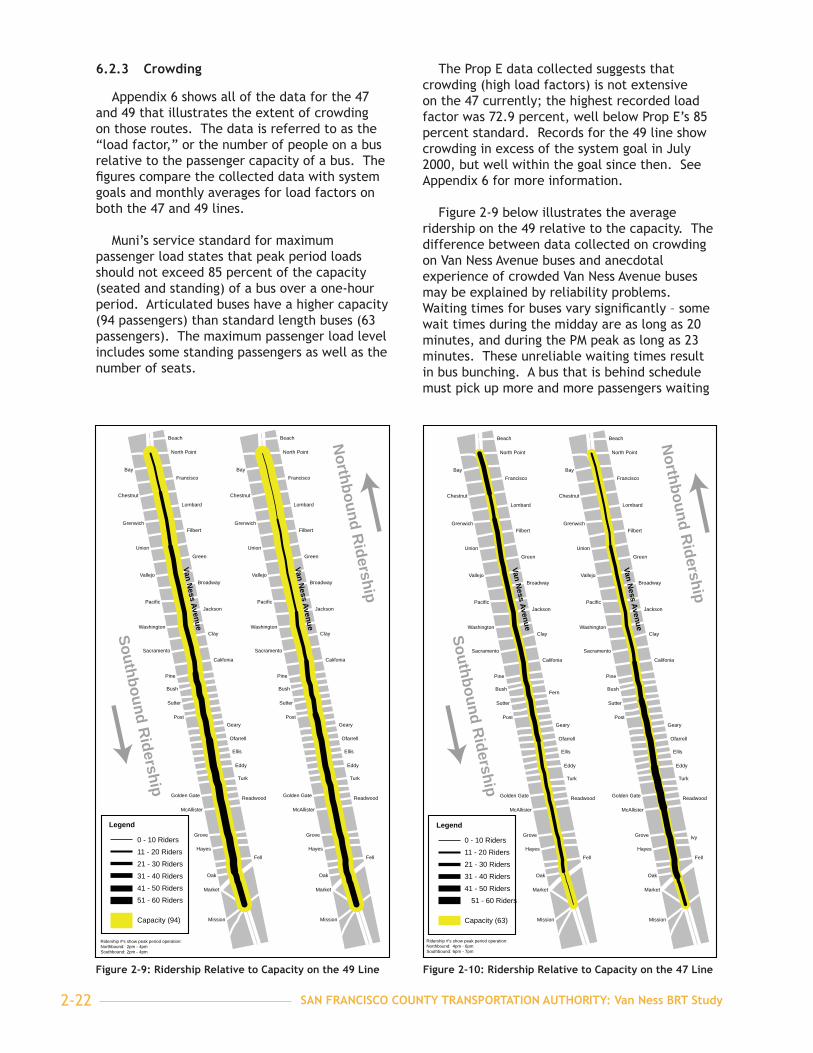
6.2.3 Crowding
Appendix 6 shows all of the data for the 47 and 49 that illustrates the extent of crowding on those routes. The data is referred to as the “load factor,” or the number of people on a bus relative to the passenger capacity of a bus. The fi gures compare the collected data with system goals and monthly averages for load factors on both the 47 and 49 lines.
Muni’s service standard for maximum passenger load states that peak period loads should not exceed 85 percent of the capacity (seated and standing) of a bus over a one-hour period. Articulated buses have a higher capacity (94 passengers) than standard length buses (63 passengers). The maximum passenger load level includes some standing passengers as well as the number of seats.
The Prop E data collected suggests that crowding (high load factors) is not extensive on the 47 currently; the highest recorded load factor was 72.9 percent, well below Prop E’s 85 percent standard. Records for the 49 line show crowding in excess of the system goal in July 2000, but well within the goal since then. See Appendix 6 for more information.
Figure 2-9 below illustrates the average ridership on the 49 relative to the capacity. The difference between data collected on crowding on Van Ness Avenue buses and anecdotal experience of crowded Van Ness Avenue buses may be explained by reliability problems. Waiting times for buses vary signifi cantly – some wait times during the midday are as long as 20 minutes, and during the PM peak as long as 23 minutes. These unreliable waiting times result in bus bunching. A bus that is behind schedule must pick up more and more passengers waiting
0 - 10 Riders11 - 20 Riders21 - 30 Riders31 - 40 Riders41 - 50 Riders51 - 60 Riders
Ridership #'s show peak period operation:Northbound: 2pm - 4pmSouthbound: 2pm - 4pm
Southbound Ridership
Northbound R
idershipBeach
North Point
Francisco
Lombard
Filbert
Green
Broadway
Jackson
Clay
Califonia
Geary
Ofarrell
Ellis
Eddy
Oak
Market
Mission
Turk
Golden Gate Readwood
McAllister
Grove
Hayes
Fell
Bay
Chestnut
Grenwich
Union
Vallejo
Pacific
Washington
Sacramento
Pine
Bush
Sutter
Post
Beach
North Point
Francisco
Lombard
Filbert
Green
Broadway
Jackson
Clay
Califonia
Geary
Ofarrell
Ellis
Eddy
Oak
Market
Mission
Turk
Golden Gate Readwood
McAllister
Grove
Hayes
Fell
Bay
Chestnut
Grenwich
Union
Vallejo
Pacific
Washington
Sacramento
Pine
Bush
Sutter
Post
Legend
Capacity (94)
Van Ness Avenue
Van Ness Avenue
Figure 2-9: Ridership Relative to Capacity on the 49 Line
0 - 10 Riders11 - 20 Riders21 - 30 Riders31 - 40 Riders41 - 50 Riders
51 - 60 Riders
Capacity (63)
Northbound R
idership
Ridership #'s show peak period operation:Northbound: 4pm - 6pmSouthbound: 6pm - 7pm
Southbound Ridership
Beach
North Point
Francisco
Lombard
Filbert
Green
Broadway
Jackson
Clay
Califonia
Fern
Geary
Ofarrell
Ellis
Eddy
Oak
Market
Mission
Turk
Golden Gate Readwood
McAllister
Grove
Hayes
Fell
Bay
Chestnut
Grenwich
Union
Vallejo
Pacific
Washington
Sacramento
Pine
Bush
Sutter
Post
Beach
North Point
Francisco
Lombard
Filbert
Green
Broadway
Jackson
Clay
Califonia
Geary
Ofarrell
Ellis
Eddy
Oak
Market
Mission
Turk
Golden Gate Readwood
McAllister
Grove Ivy
Hayes
Fell
Bay
Chestnut
Grenwich
Union
Vallejo
Pacific
Washington
Sacramento
Pine
Bush
Sutter
Post
Legend
Van Ness Avenue
Van Ness Avenue
Figure 2-10: Ridership Relative to Capacity on the 47 Line

Section 2: Existing Conditions and Transportation Needs 2-23
at stops. This bus becomes very crowded and increasingly behind schedule. The following bus picks up increasingly fewer passengers at stops, and is relatively less crowded, and eventually may catch up to the bus preceding it. The result of unreliable bus headways is crowded conditions experienced by passengers.
6.2.4 Transfer Activity
The Authority’s Onboard Survey of Muni passengers shows that major transfers occur between the 47/49 lines and many other routes. In order of transfer activity, the major transfer lines along Van Ness Avenue are:
Table 2-9: Percent of Van Ness Avenue Transfers
Muni Route Lines
K/L/M/N/J Muni Metro lines 36 %
38/38L-Geary 12 %
14-Mission 8 %
30-Stockton/Chestnut 8 %
21-Hayes 8 %
1-California 7 %
71/71L-Haight/Noriega 7 %
Other lines with transfers to and from Van Ness Avenue routes include the 5-Fulton, 45-Union, and 12-Folsom. Just over 40 percent of all 47 and 49 riders in the survey stated that their trip requires at least one transfer - this is greater transfer activity than the 35 percent transfer rate citywide.
6.3 BUSIEST STOPS
Major stops in the corridor are similar for both lines. Mission and Market streets are the heaviest stops northbound, and Union, Pine, O’Farrell, and Oak/Market Streets are the heaviest stops southbound. Both directions see a large change in ridership at Geary and O’Farrell, presumably due to transfers at the 38-Geary line. The Eddy stop has very few boardings in either direction, for either line.
Market Street has by far the heaviest boarding and alighting activity, where a total of about 4,300 people get on or off in the course of a day. A full 26 percent of all the boardings on the 47 line are at Market.
The other stops with high boarding activity are at Mission and at the Caltrain terminal. A total of 12 percent of the alightings are at the
Caltrain terminal, reinforcing the importance of the 47 for connecting to regional services.
6.4 RELEVANT WORKSHOP FEEDBACK
Public outreach events held in fall 2004 and spring 2005 asked community members for feedback on transportation needs in the Van Ness corridor. This section highlights the key concerns regarding transit demand gathered during the public outreach effort. A complete summary of the events and feedback is included as Appendix 5.
About 45 percent of participants used transit to reach the public workshops, so it is not surprising that improving transit along the Van Ness corridor proved to be a the top concern of workshop participants. Although transit supply, reliability, speed, and demand are closely linked, this section focuses on transit demand issues. Key concerns and suggestions include:
Creating a dedicated bus lane was the top suggestion for improving transit on Van Ness at all of the workshops.
Students and faculty at Galileo High School cited shorter wait time as the single best way to improve transit.
Responses gathered at the Van Ness/Market Street bus stop mobile workshop indicate concerns about bus crowding. As the busiest bus stop along the Van Ness corridor, it is not surprising that bus crowding was the top transit concern.
6.5 KEY TRANSIT DEMAND CONDITIONS AND NEEDS
Focus on heavily used stops. Van Ness Avenue transit passengers mainly use a number of key stops. Other stops are much less utilized. Those stops should be considered for consolidation to help improve travel times and reduce delays.
Facilitate transfers. Over 40 percent of all 47 and 49 riders make at least one transfer. This is unsurprising, since Van Ness Avenue transit service connects with many heavily used east-west cross routes, as well as regional services such as Golden Gate Transit, Muni Metro and Caltrain. Transfers with those important routes should be preserved and facilitated.
Van Ness Avenue is a key segment of both the 47 and 49 routes, both in overall mileage and in ridership.
•
•
•
•
•
•
SAN FRANCISCO COUNTY TRANSPORTATION AUTHORITY: Van Ness BRT Study 2-24
7 Transit Operating Conditions
This section analyzes transit operating performance: the speed and delay, reliability, and bunching of the buses. The Authority and MTA collected data to understand the causes and extent of delays and unreliability for transit on Van Ness Avenue; the results are presented here.
7.1 SPEED AND DELAY ANALYSIS
Speed-delay data is collected by observers who ride buses as they travel their route, measuring travel times and the duration of delays associated with waiting at signals, boarding passengers or pulling out into traffi c. It also allows for a detailed analysis of dwell time– time spent loading and unloading passengers– and dwell time variability.
7.1.1 Methodology
Data on transit speeds and delays are collected by on-board recorders who time bus travel from stop to stop as well as the duration of each type of delay. At bus stops, collectors record the time from when the bus doors fi rst open to when the bus doors close. Delay is defi ned as time spent at a complete stop. Several types of transit delay were measured:
Dwell time delay. This measures the time from when the bus doors open until they close
Signal delay. This is the time spent waiting at red lights
Mixed traffi c delay. This includes time spent waiting to pull in and out of traffi c and time spent behind parking, double-parked, or right-turning cars
The on-board recording captures the relative magnitude of the different types of delay experienced by buses. This data provides a block-by-block explanation of delays, dwell times, and other occurrences on the route.
7.1.2 Speed and Travel Time Findings
Figure 2.11 shows a summary of the speed and travel time results and a comparison with the auto traffi c, further described in Section 8. Bus travel times range between 18 and 22 minutes between Mission and Lombard, an average speed of 5-7 mph.
As shown above, transit travel times are nearly twice as long as auto travel times for the same segment. The Mission to McAllister Street segment of Van Ness Avenue is the slowest, though the section of Van Ness Avenue from McAllister to California Streets performs only slightly better.
•
•
•

Section 2: Existing Conditions and Transportation Needs 2-25
Figu
re 2
-11:
Com
pari
son
of T
rans
it a
nd A
uto
Spee
ds a
nd D
elay
s

SAN FRANCISCO COUNTY TRANSPORTATION AUTHORITY: Van Ness BRT Study 2-26
7.1.3 Delay Findings
Half the total transit travel time on Van Ness Avenue is spent in delay, which amounts to about 10 minutes of transit travel time spent completely stopped. As shown in Figure 2-12, about half of that stopped time is time spent loading/unloading at stops, or dwell time.
Mixed traffi c delays that do not result in the bus coming to a complete stop are refl ected in the slower average speeds of buses relative to cars. Notably, the difference in speed between cars and transit is not explained simply by the time needed for transit to pick up and drop off passengers. When dwell times are subtracted from total transit travel time, buses still travel as much as 35 percent more slowly on average than cars. This refl ects mixed traffi c friction associated with travel time in the right-hand lanes and behind slow vehicle traffi c. Mixed traffi c delays also signifi cantly affect bus reliability, and lead to bunching, described in Section 7.2.
Finally, delays to transit are slightly concentrated between Mission and McAllister. This segment from Mission to McAllister has the most delay per mile, resulting in slower average
speeds through this southern part of the study area.
7.2 RELIABILITY ANALYSIS
Reliability data is collected to understand average wait times and the variation in the amount of time that passengers spend waiting for the bus, to determine the proportion of buses that are bunched and off-schedule, and to determine whether this bunching occurs on Van Ness Avenue itself or is due to insuffi cient route control.
7.2.1 Methodology
Data was collected for the southbound direction only because this direction is more congested, and is also nearest to the starting points of both routes.
Reliability analysis positions data collectors at several locations up and down a transit route. Three data collectors were used simultaneously at North Point, O’Farrell, and Oak. Data was collected on both the 47 and 49 lines. The North Point stop was selected because it is as close to the starting point of each route as possible. This allows the analysis to distinguish
Bus Delay Van Ness Corridor SB PM Peak In Minutes
4.8
1.89
4.9
9.73Signal DelayMixed Traffic DelayDwell DelayTime Spent Moving
Bus Delay Van Ness Corridor NB Midday In Minutes
4.6
0.3
4.9
9.3
Signal DelayMixed Traffic DelayDwell DelayTime Spent moving
Bus Delay Van Ness Corridor NB PM Peak In Minutes
3.7
0.7
4.4
9.8
Signal DelayMixed Traffic DelayDwell DelayTime Spent moving
Bus Delay Van Ness Corridor SB PM Peak In Minutes
4.8
1.89
4.9
9.73Signal DelayMixed Traffic DelayDwell DelayTime Spent Moving
Figure 2-12: Delay for Van Ness Buses

Section 2: Existing Conditions and Transportation Needs 2-27
between schedule adherence at the start of the run versus schedule adherence within the study area.
Findings are described in terms of passenger wait times and bus headways. An average headway is the amount of time between sequential buses of the same route traveling in the same direction. While long gaps in service are problematic for obvious reasons, buses coming too frequently also indicate problems. When buses on the same route are spaced less than 60 seconds apart, they are considered bunched, which can contribute to crowding. Buses traveling too close together have uneven passenger loads, making the fi rst bus signifi cantly more crowded than the second bus.
7.2.2 Reliability Findings
One of the top problems of Van Ness Avenue buses is poor reliability. Reliability problems are revealed in many ways: the share of buses that maintain scheduled headways; the variation in the wait times experienced by riders; and the proportion of bus runs that begin on time.
The scheduled headways for the 47 and 49 routes are eight minutes and seven minutes, respectively, in the PM peak period. The departure times for these routes are staggered, meaning that a passenger waiting for a bus on Van Ness Avenue should have a bus come by every 3.5 minutes.
However, the analysis documents the wide variation in wait times for buses. Though average headways and wait times for both the 47 and 49 are consistent with schedules, the variability in wait time – measured as the standard deviation in headway – is high: as much as 50 percent of the average headway. This means that passengers experience very unreliable – and sometimes very long – wait times. Data reports that 10 percent of passengers waited for 12 minutes or longer, and wait times reached as much as 23 minutes. The 47, like the 49, occasionally has extremely long wait times, up to 18 minutes, which is more than twice the average headway.
Travel in mixed traffi c along the corridor leads to reliability problems, increasing variability of headways, and an increase in bunched buses. The study measured the extent to which Van Ness Avenue buses are increasingly off-schedule as they travel south, indicating the effect of mixed traffi c on reliability. Figures 2-13 and
2-14 below illustrate this. The fi rst fi gure presents the distribution of headways for the 49 route as it begins its midday runs at North Point. Most buses begin their run on schedule, and no buses are bunched. By the time these same buses reach Oak/Market, about three percent of the buses have become bunched, and the distribution of headways has fl attened. Passengers are just as likely to wait for two minutes as they are to wait for 12 minutes.
This data illustrates how travel in mixed traffi c increases the unreliability of bus operations. Although average wait times during both the AM and PM peak periods are normal – around four minutes – and average headways and wait times are consistent with the schedules, the standard deviation in wait time reveals the unreliability problems. Some wait times during the midday were as long as 20 minutes, and during the PM peak as long as 23 minutes.
Route management also affects bus reliability. Buses that do not begin their runs on time compound the unpredictability of passenger wait times. Data collected at North Point, the starting point for route 49, documents that in the PM, buses on the 49 line typically enter the corridor off-schedule, increasing the likelihood of bunching. Figures 2-13 and 2-14 illustrate the bus headways on the 49 line starting their route at North Point.
7.2.3 Bus Bunching Findings
Mixed traffi c conditions on Van Ness Avenue result in bus bunching. Even though the 49 began nearly 70 percent of runs on time (by Prop E standards), only 41 percent were on time by the time these buses reached O’Farrell. Buses were never bunched at the start of their routes, but four percent on average would become bunched by the time buses reach O’Farrell, and eight percent are bunched by the time buses reach Oak. The bunching is not severe, but does develop during travel in mixed traffi c.
The staggered schedule for routes 47 and 49 often does not work in operation. For the two routes combined, between eight and 22 percent of buses in the PM peak are bunched on Van Ness Avenue at North Point and/or O’Farrell Streets. This is important since many passengers unload at Market Street, and are indifferent about which bus they take (the 47 or 49). For these passengers, a 47 and 49 arriving together are bunched from the passenger’s perspective. Moreover, even when the 47 and 49 are

SAN FRANCISCO COUNTY TRANSPORTATION AUTHORITY: Van Ness BRT Study 2-28
considered together, unacceptably long wait times of as much as 15 minutes are sometimes experienced.
7.3 RELEVANT WORKSHOP FEEDBACK
Public outreach events held in fall 2004 and spring 2005 asked community members for feedback on transportation needs in the Van Ness corridor. This section highlights the key concerns regarding transit performance gathered during the public outreach effort. A
complete summary of the events and feedback is included as Appendix 4.
About 45 percent of participants used transit to reach the public workshops, so it is not surprising that improving transit along the Van Ness corridor proved to be the top concern of workshop participants. Although transit supply, reliability, speed, and demand are closely linked, this section focuses on transit performance issues. Key concerns and suggestions include:
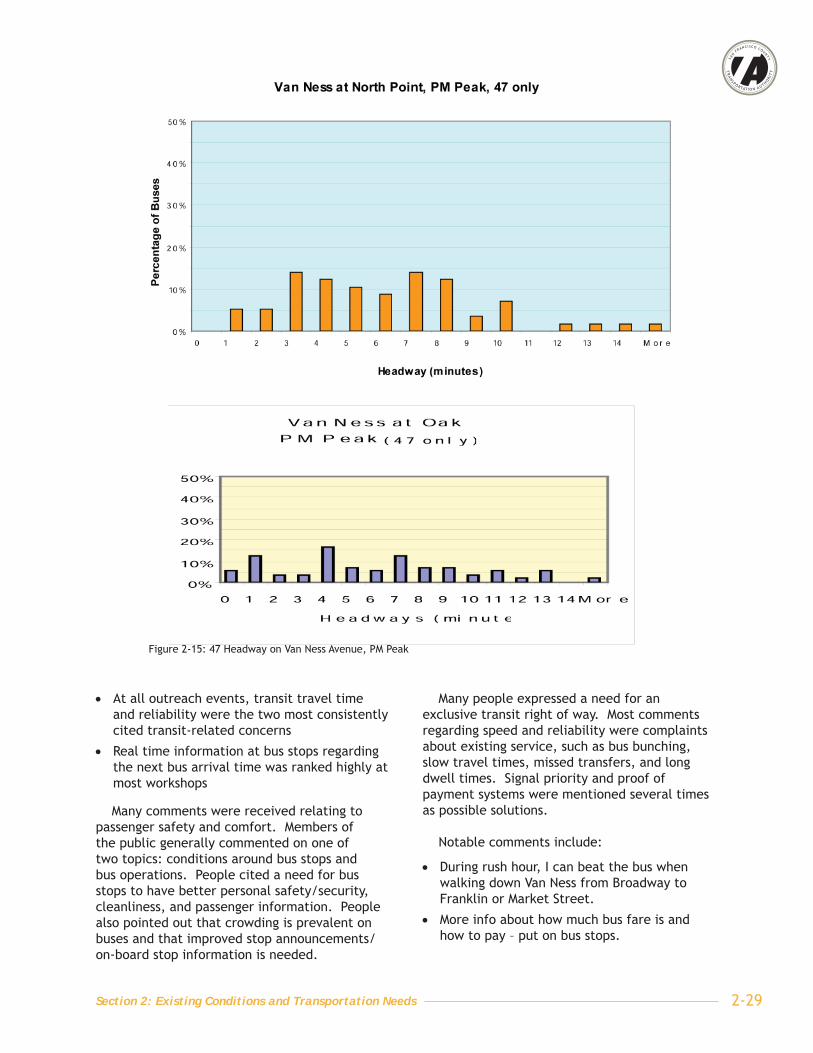
Figure 2-13: 49 Headway on Van Ness at North Point and Oak/Market, Midday
Figure 2-14: 47 Headway on Van Ness at North Point , PM Peak
Section 2: Existing Conditions and Transportation Needs 2-29
At all outreach events, transit travel time and reliability were the two most consistently cited transit-related concerns
Real time information at bus stops regarding the next bus arrival time was ranked highly at most workshops
Many comments were received relating to passenger safety and comfort. Members of the public generally commented on one of two topics: conditions around bus stops and bus operations. People cited a need for bus stops to have better personal safety/security, cleanliness, and passenger information. People also pointed out that crowding is prevalent on buses and that improved stop announcements/on-board stop information is needed.
•
•
Many people expressed a need for an exclusive transit right of way. Most comments regarding speed and reliability were complaints about existing service, such as bus bunching, slow travel times, missed transfers, and long dwell times. Signal priority and proof of payment systems were mentioned several times as possible solutions.
Notable comments include:
During rush hour, I can beat the bus when walking down Van Ness from Broadway to Franklin or Market Street.
More info about how much bus fare is and how to pay – put on bus stops.
•
•
Figure 2-15: 47 Headway on Van Ness Avenue, PM Peak
SAN FRANCISCO COUNTY TRANSPORTATION AUTHORITY: Van Ness BRT Study 2-30
Create an honor system of paying fares – that way all doors on bus will allow for entry and exit of passengers instead of creating the bottleneck at the front doors to collect fare. Honor system can be enforced with additional offi cers on board.
Use RFID [radio frequency identifi cation] bus passes and sensors at doors to validate bus passes, similar to library books/gates.
Reduce parking on Van Ness to maintain traffi c fl ow for buses and autos.
Inform [auto] drivers about alternate routes to their destination other than via Van Ness, to help relieve congestion.
7.4 KEY NEEDS FOR TRANSIT OPERATION
Average bus speeds are between fi ve and seven mph, meaning that it takes 18-22 minutes to make the trip between Mission and Lombard Streets on transit.
•
•
•
•
•
Buses spend half their travel time on Van Ness Avenue completely stopped. This amounts to 10 minutes of the 20-minute trip from Mission to Lombard Streets.
Wait times for buses vary widely. About one-third of the time, passengers will wait more than eight minutes for their bus.
Travel in mixed traffi c slows buses, reduces bus reliability, and leads to bus bunching. When time spent loading and unloading passengers – dwell time – is subtracted from transit travel time, buses remain as much as 35 percent slower than cars. As buses travel in mixed traffi c, variation in headway increases, and buses begin to bunch.
More route management is needed to increase the number of buses that begin their route on time. Entering the corridor off-schedule results in unreliable passenger wait times and a greater likelihood of bunching.
•
•
•
•
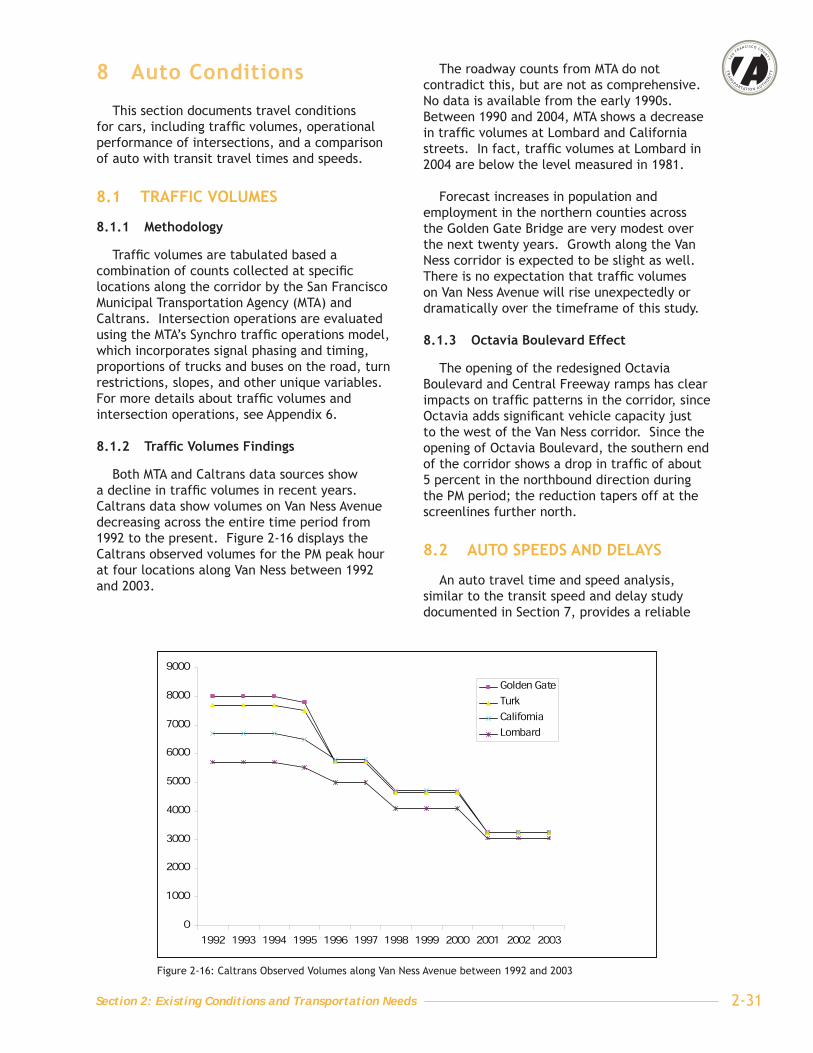
Section 2: Existing Conditions and Transportation Needs 2-31
Figure 2-16: Caltrans Observed Volumes along Van Ness Avenue between 1992 and 2003
0
1000
2000
3000
4000
5000
6000
7000
8000
9000
1992 1993 1994 1995 1996 1997 1998 1999 2000 2001 2002 2003
Golden Gate
Turk
California
Lombard
8 Auto Conditions
This section documents travel conditions for cars, including traffi c volumes, operational performance of intersections, and a comparison of auto with transit travel times and speeds.
8.1 TRAFFIC VOLUMES
8.1.1 Methodology
Traffi c volumes are tabulated based a combination of counts collected at specifi c locations along the corridor by the San Francisco Municipal Transportation Agency (MTA) and Caltrans. Intersection operations are evaluated using the MTA’s Synchro traffi c operations model, which incorporates signal phasing and timing, proportions of trucks and buses on the road, turn restrictions, slopes, and other unique variables. For more details about traffi c volumes and intersection operations, see Appendix 6.
8.1.2 Traffi c Volumes Findings
Both MTA and Caltrans data sources show a decline in traffi c volumes in recent years. Caltrans data show volumes on Van Ness Avenue decreasing across the entire time period from 1992 to the present. Figure 2-16 displays the Caltrans observed volumes for the PM peak hour at four locations along Van Ness between 1992 and 2003.
The roadway counts from MTA do not contradict this, but are not as comprehensive. No data is available from the early 1990s. Between 1990 and 2004, MTA shows a decrease in traffi c volumes at Lombard and California streets. In fact, traffi c volumes at Lombard in 2004 are below the level measured in 1981.
Forecast increases in population and employment in the northern counties across the Golden Gate Bridge are very modest over the next twenty years. Growth along the Van Ness corridor is expected to be slight as well. There is no expectation that traffi c volumes on Van Ness Avenue will rise unexpectedly or dramatically over the timeframe of this study.
8.1.3 Octavia Boulevard Effect
The opening of the redesigned Octavia Boulevard and Central Freeway ramps has clear impacts on traffi c patterns in the corridor, since Octavia adds signifi cant vehicle capacity just to the west of the Van Ness corridor. Since the opening of Octavia Boulevard, the southern end of the corridor shows a drop in traffi c of about 5 percent in the northbound direction during the PM period; the reduction tapers off at the screenlines further north.
8.2 AUTO SPEEDS AND DELAYS
An auto travel time and speed analysis, similar to the transit speed and delay study documented in Section 7, provides a reliable
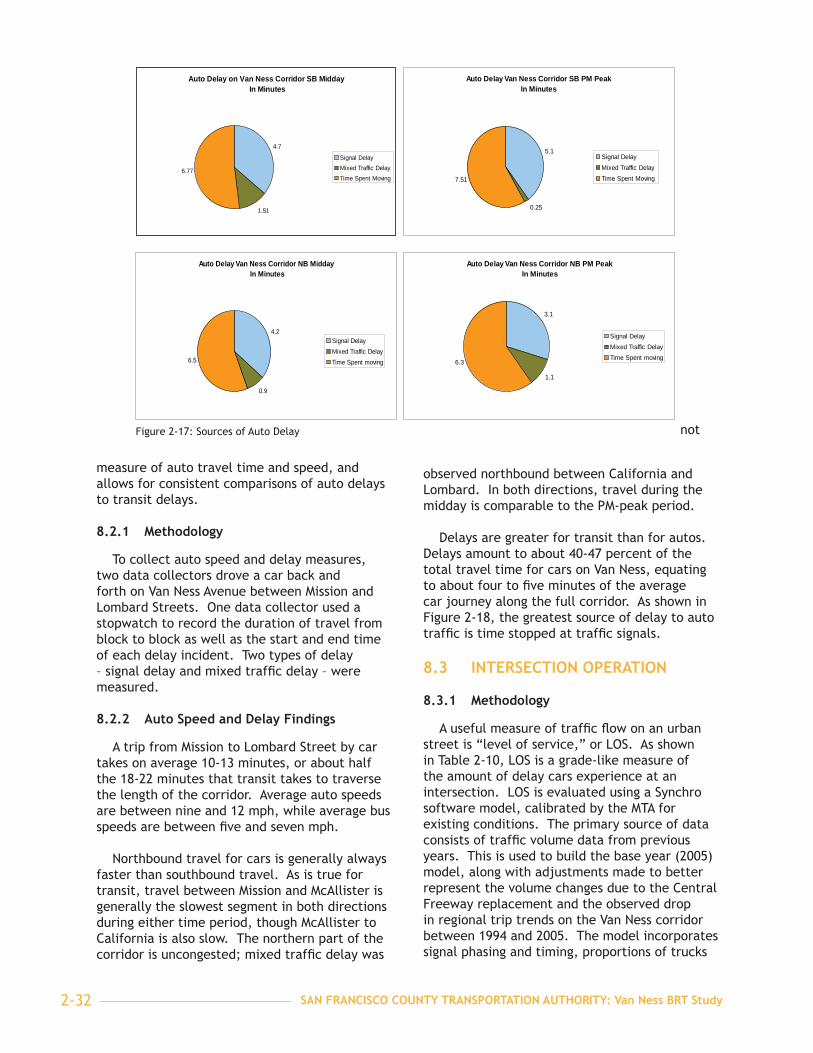
SAN FRANCISCO COUNTY TRANSPORTATION AUTHORITY: Van Ness BRT Study 2-32
measure of auto travel time and speed, and allows for consistent comparisons of auto delays to transit delays.
8.2.1 Methodology
To collect auto speed and delay measures, two data collectors drove a car back and forth on Van Ness Avenue between Mission and Lombard Streets. One data collector used a stopwatch to record the duration of travel from block to block as well as the start and end time of each delay incident. Two types of delay – signal delay and mixed traffi c delay – were measured.
8.2.2 Auto Speed and Delay Findings
A trip from Mission to Lombard Street by car takes on average 10-13 minutes, or about half the 18-22 minutes that transit takes to traverse the length of the corridor. Average auto speeds are between nine and 12 mph, while average bus speeds are between fi ve and seven mph.
Northbound travel for cars is generally always faster than southbound travel. As is true for transit, travel between Mission and McAllister is generally the slowest segment in both directions during either time period, though McAllister to California is also slow. The northern part of the corridor is uncongested; mixed traffi c delay was
not
observed northbound between California and Lombard. In both directions, travel during the midday is comparable to the PM-peak period.
Delays are greater for transit than for autos. Delays amount to about 40-47 percent of the total travel time for cars on Van Ness, equating to about four to fi ve minutes of the average car journey along the full corridor. As shown in Figure 2-18, the greatest source of delay to auto traffi c is time stopped at traffi c signals.
8.3 INTERSECTION OPERATION
8.3.1 Methodology
A useful measure of traffi c fl ow on an urban street is “level of service,” or LOS. As shown in Table 2-10, LOS is a grade-like measure of the amount of delay cars experience at an intersection. LOS is evaluated using a Synchro software model, calibrated by the MTA for existing conditions. The primary source of data consists of traffi c volume data from previous years. This is used to build the base year (2005) model, along with adjustments made to better represent the volume changes due to the Central Freeway replacement and the observed drop in regional trip trends on the Van Ness corridor between 1994 and 2005. The model incorporates signal phasing and timing, proportions of trucks
Figure 2-17: Sources of Auto Delay
Auto Delay on Van Ness Corridor SB Midday In Minutes
4.7
1.51
6.77
Signal DelayMixed Traffic DelayTime Spent Moving
Auto Delay Van Ness Corridor SB PM PeakIn Minutes
5.1
0.25
7.51
Signal DelayMixed Traffic DelayTime Spent Moving
Auto Delay Van Ness Corridor NB PM Peak In Minutes
3.1
1.1
6.3
Signal DelayMixed Traffic DelayTime Spent moving
Auto Delay Van Ness Corridor NB Midday In Minutes
4.2
0.9
6.5
Signal DelayMixed Traffic DelayTime Spent moving

Section 2: Existing Conditions and Transportation Needs 2-33
and buses on the road, turn restrictions, slopes, and other variables.
Table 2-10: Level of Service
LOS Delay per Vehicle (seconds)
A ≤ 10
B > 10 and ≤ 20
C > 20 and ≤ 35
D > 35 and ≤ 55
E > 55 and ≤ 80
F > 80
8.3.2 Intersection Operation Findings
MTA calculated LOS, as well as other measures, for the 29 intersections in the corridor study area. Of the 58 intersection approaches (southbound and northbound) only one intersection approach – northbound on Van Ness at Lombard – experiences delays equivalent to LOS E. As shown in Table 2-11, most intersection approaches rate LOS A or B. With the exception of Lombard, intersections to the north of Geary are more likely to operate at LOS A or B. As shown in Figure 2-18, only 17 of the 58 intersection have delays more than 30 seconds.
This indicates that intersection operations on Van Ness Avenue are smooth; based on anecdotal observation, however, exceptions to the smooth operation occur during special events, which often overlap with the PM commute period in the Van Ness corridor.
Table 2-11: Van Ness Avenue Intersection LOS
LOS Northbound approach
Southbound approach
A 14 13
B 6 8
C 8 6
D 0 2
E/F 1 0
8.4 RELEVANT WORKSHOP FEEDBACK
Public outreach events held in fall 2004 and spring 2005 asked community members for feedback on transportation needs in the Van Ness corridor. This section highlights the key concerns regarding auto conditions gathered during the public outreach effort. A complete summary of the events and feedback is included as Appendix 4.
Approximately 20 percent of workshop participants traveled to the workshops by car (either driving alone, driving with others, or getting a ride). The vast majority of comments gathered from community workshops regarding automobile conditions were complaints about the negative impact of vehicular traffi c on pedestrians and bus riders. Workshops participants were concerned about the high speed of traffi c, and the need for law enforcement of various traffi c-related offenses,
Figure 2-18: Van Ness Intersection Operation

SAN FRANCISCO COUNTY TRANSPORTATION AUTHORITY: Van Ness BRT Study 2-34
such as speeding, red light running, and crosswalk blocking/infringement.
About 10 percent of respondents thought that the most important transportation need on Van Ness was reducing the amount of time drivers spent sitting in traffi c. At many workshops, automobile conditions, bus crowding, and pedestrian/bicycle conditions were of roughly equal importance.
Notable comments include:
Losing a lane of traffi c for buses is not worth the impact to drivers. All Van Ness lanes are critical for auto fl ow.
People in cars who drive too fast, run lights, and don't watch for pedestrians need more traffi c law enforcement.
8.5 KEY NEEDS FOR AUTOS
Traffi c fl ows relatively smoothly. Although the overall volume of vehicular traffi c is high, Van Ness Avenue generally fl ows smoothly with traffi c passing through intersections in a single traffi c cycle. The vast majority of intersections are ranked LOS A or B, with
•
•
•
intersection delay for automobiles generally less 30 seconds.
The greatest delays to cars are caused by traffi c signals, yet signal delay accounts for less than a third of total auto travel time on Van Ness Avenue.
Travel is almost twice as fast for drivers on Van Ness Avenue as for transit riders. Drivers also experience less overall delay on Van Ness Avenue than do transit riders.
Special events affect traffi c fl ow. The generally smooth fl ow of traffi c on Van Ness Avenue is affected by special events in the Civic Center area, which also delay buses.
Travel on Van Ness Avenue between Mission and McAllister Streets is slowest and least reliable. This is true for cars as well as for transit, though the section of Van Ness Avenue from McAllister to California Streets does not perform much better for either transit or autos.
Northern Van Ness Avenue is relatively uncongested. The stretch of Van Ness Avenue between California and Lombard Streets carries a lot of traffi c, but is generally uncongested.
•
•
•
•
•

Section 2: Existing Conditions and Transportation Needs 2-35
9 Parking Conditions
On-street parking on Van Ness Avenue not only provides space for delivery vehicles and shoppers to park, but serves as a valuable buffer between pedestrians on the sidewalk and moving vehicles in the street. However, parallel parking movements and double-parking increase transit travel times and reduce transit reliability. This section documents the availability of parallel parking on Van Ness Avenue.
9.1 PARKING CONDITIONS METHODOLOGY
This section documents parking conditions on Van Ness Avenue by recording the existing supply of parking, including the quantity, physical confi guration, metering, and time limit restrictions. The methodology also analyzes how effi ciently the existing supply is managed by documenting occupancy (the percentage of spaces occupied at a time).
Department of Parking and Traffi c (DPT) parking diagrams are the source for data on parking supply, type of parking – passenger zones (white-colored curbs), loading zones (yellow-colored curbs), and tow-away zones – and the location of fi re hydrants and driveways.
9.2 PARKING SUPPLY AND OCCUPANCY FINDINGS
Parking opportunities on Van Ness Avenue include on-street parking, public parking lots, and public and private parking garages. Metered on-street parking is available on most blocks of Van Ness between Mission and Market Streets. Parking has been removed one block of Van Ness Avenue (between Fell and Hayes) to accommodate an additional lane of automobile traffi c.
Van Ness Avenue has 393 parking spaces within the study area, not including yellow and white passenger loading and unloading curb spaces. Of this total, 272 (or about 70 percent) are metered spaces.
Metered parking is $2.50 an hour from Mission to Eddy Streets and $1.50/hour from Eddy to Broadway Streets. The vast majority of metered parking spaces on Van Ness Avenue have a one-hour time limit, though most blocks also have meters with a 30-minute limit. There is only
one metered parking space with a 15-minute limit. Metered parking is priced to maximize the turn-over of parking spaces; this turn-over results in a signifi cant amount of parallel parking movements in the right-hand traffi c lane.
Tables 2-12 and 2-13 show the inventory of the on-street parking spaces and their average occupancy. Tables 9-3 and 9-4 provide a more detailed overview of the types of on-street parking spaces available on Van Ness Avenue. Parking occupancy in the PM peak period is approximately 75 percent.
Table 2-12: Parking Occupancy, West Side of Van Ness Avenue
SegmentNumber
of Spaces
Average Observed
Occupancy
Market - McAllister
48 65 %
McAllister – Post/O’Farrell
30 53 %
Post/O’Farrell – Union
110 78 %
Average West Side Occupancy:
70 %
Table 2-13: Parking Occupancy, East Side of Van Ness Avenue
SegmentNumber
of Spaces
Average Observed
Occupancy
Market - McAllister
35 83 %
McAllister – Post/O’Farrell
37 76 %
Post/O’Farrell – Union
92 71 %
Average East Side Occupancy:
74 %
9.3 RELEVANT WORKSHOP FEEDBACK
Public outreach events held in fall 2004 and spring 2005 asked community members for feedback on transportation needs in the Van Ness corridor. This section highlights the key concerns regarding parking gathered during the public outreach effort. A complete summary

SAN FRANCISCO COUNTY TRANSPORTATION AUTHORITY: Van Ness BRT Study 2-36
of the events and feedback is included as Appendix 4.
Less than fi ve percent of public outreach workshop responses cited parking as the most important transportation need on Van Ness. No comments were received directly pertaining to parking supply. Approximately 20 percent of workshop participants traveled to the workshops by car (either driving alone, driving with others, or getting a ride).
9.4 KEY NEEDS FOR PARKINGParking spaces are used effi ciently from a corridor perspective, as indicated by the 75 percent parking occupancy rates.
Parallel parking serves an important role on Van Ness Avenue. Preserving parallel parking along Van Ness Avenue is especially important to serve as a buffer between pedestrians on the sidewalk and traffi c.
•
•

Section 2: Existing Conditions and Transportation Needs 2-37
10 Pedestrian and Bicycle Conditions
The purpose of the pedestrian assessment is to assess walkability along Van Ness Avenue, and pedestrian comfort and safety at intersections. Walkability is important for preserving Van Ness Avenue as a desirable place to live and work, and is also a critical component of a successful transit system, since every transit trip begins with a walk trip. The walkability analysis presented in this chapter examines three sample segments of the street in detail. Safety along the corridor is also highlighted through an analysis of collision data. This section also includes a description of bicycle facilities in the study area.
10.1 EXISTING CONDITIONS AND IMPROVEMENTS
The existing street confi guration provides an ample 16-foot sidewalk for pedestrians along the length of Van Ness Avenue. Pedestrian crossings of Van Ness are long, approximately 93 feet from curb to curb, and there are many intersections without pedestrian signals. This length is mitigated by center medians, which provide a refuge for crossing pedestrians. Only one intersection within the study corridor – Mission Street at Van Ness Avenue – does not have a pedestrian crossing median or refuge.
MTA has recently installed a number of features to enhance pedestrian access and safety in the corridor, shown in Figures 2-19 and 2-20. These intersection treatments consist of tactile edging on curb ramps, pedestrian refuges in the middle of the road, and curb extensions at corners to reduce overall crossing distances. The locations where enhancements have been provided include the intersections with Clay, Sutter, Sacramento, California, Pine, Bush, Post, O’Farrell and Ellis Streets.
The median cap in Figure 2-20 at the corner intersection of Van Ness Avenue and O’Farrell Streets provides a raised buffer for pedestrians while allowing wheelchair access.
In addition to physical changes to intersections, pedestrian countdown signals are provided at some crossings on Van Ness Avenue. Countdown signals allow pedestrians to judge whether to begin crossing a street. Existing countdown signals are largely limited
to the crossing of side streets although some are available for pedestrians crossing Van Ness Avenue. Signals for crossing Van Ness Avenue have been installed at Pine, McAllister and Market Streets. They have also been installed on the following side streets: Broadway, Jackson, Pacifi c, Bush, Geary, Turk, McAllister, Hayes, 12th and Market Streets.
Figure 2-21: Recent Pedestrian Enhancements Installed on Van Ness Avenue
Figure 2-20: Recent Pedestrian Enhancements Installed within the Corridor

SAN FRANCISCO COUNTY TRANSPORTATION AUTHORITY: Van Ness BRT Study 2-38
MTA was recently awarded Prop K funding to install pedestrian countdown signals at 8 additional intersections.
10.1.1 Bicycle Facilities
There are no bike lanes or “sharrows” (arrow-shaped symbols designating traffi c lanes to be shared with bicyclists) on Van Ness Avenue; however, a discontinuous bike lane is striped one block east on Polk. A designated segment of the citywide bicycle network, the Polk Street bike lane extends 10 blocks from Market to Post. There is a 13-block gap in the bike lane between Post and Union Streets. At Union Street, the bike lane resumes for four blocks to Lombard Street.
Bike racks are placed intermittently along Van Ness and within the study area. MTA has installed 19 U-shaped bike racks within the study area; these racks are concentrated around commercial destinations and can accommodate two bicycles. Additional, privately-installed bicycle racks are located around the governmental and civic institutions.
10.2 WALKABILITY ANALYSIS
10.2.1 Methodology
A pedestrian observer qualitatively assessed the pedestrian environment and crossing conditions at selected locations along Van Ness Avenue. The assessment took into account qualities relevant to the pedestrian environment, including buffer from traffi c, pedestrian crossing conditions, pedestrian-supportive infrastructure, slopes, auto speeds, and safety. The pedestrian observer also gathered an inventory of pedestrian-supportive infrastructure, and cross-referenced this with DPT striping diagrams and Muni’s bus stop GIS shapefi le.
The buffer between pedestrian and vehicular traffi c can be created by on-street parking, trees, and other infrastructure on the sidewalk. Pedestrian crossing conditions are evaluated by crossing distances, block lengths, and distances between crossings, measured using the DPT striping diagrams and GIS layers. Additional relevant aspects of the pedestrian environment include pedestrian countdown signals, street-name and other signage, curb ramps and ramp warnings, crosswalk condition, and pedestrian refuges, including curb extensions and medians.
The infrastructure assessment also considered lighting, benches, street trees, sidewalks, and sidewalk obstructions. Slopes were measured from GIS contour lines provided by the Department of Public Works. Auto speeds were taken through the auto speed and delay studies described in Section 8. Finally, the number of lanes crossed to reach a median was determined from DPT striping diagrams.
10.2.2 Findings
Figures 2-21 through 2-26 illustrate typical pedestrian conditions along Van Ness Avenue. The distance across the street is 93 feet wide from curb to curb; in some locations, crossing distance is shortened where sidewalk bulb-outs have been installed. Van Ness Avenue has two noteworthy hills (grade greater than fi ve percent): from Turk to O’Farrell Streets, and from Jackson to Union Streets. The latter is a relatively long hill that stretches for fi ve blocks. In addition, since parallel parking is generally provided along the entire length of Van Ness Avenue, pedestrians benefi t from a buffer of about eight feet between the sidewalk and traffi c lanes. The buffer is missing on the northbound side of Van Ness between Fell and Hayes Streets.
Table 2-14: Number of lanes crossed to reach a pedestrian refuge
Number of lanes to cross
≤3 4 >4
Number of crossing locations 82 27 1
Pedestrians on average must cross three or fewer lanes of traffi c in order to reach a median. Only one intersection (Van Ness Avenue at Mission Street) lacked a pedestrian median. However, at most intersections the option to cross only three lanes before reaching a median refuge is limited to only one side of the intersection. A typical crossing pattern is three lanes to reach a median (which can be as small as four feet), then another four lanes to fi nish crossing to the other side.
10.2.3 Segment 1 – McAllister to Golden Gate (City Hall)
A qualitative assessment of pedestrian conditions at this location was conducted to provide an inventory of pedestrian infrastructure both at the key City Hall stop as well as on a

Section 2: Existing Conditions and Transportation Needs 2-39
Figure 2-21: The tapered median at many intersections is not ideal as a pedestrian safety refuge
Figure 2-22: A visibly striped zebra crosswalk
Figure 2-24: Informational signage is oriented toward drivers Figure 2-23: Countdown signals are found at some intersections
Figure 2-26: Pedestrians must cross at least six lanes of traffi c
Figure 2-25: At certain locations, bus shelters infringe upon sidewalk space
SAN FRANCISCO COUNTY TRANSPORTATION AUTHORITY: Van Ness BRT Study 2-40
block of more typical pedestrian conditions north of City Hall. See Appendix 8 for a complete inventory.
Amenities provided for pedestrians and transit users include bus shelters for all of the bus stops at McAllister, visible crosswalks, and curb cuts at both intersections. Bulb-outs at three of the corners on McAllister shorten the average crossing distance to reach the center median. The south-side crosswalks across Van Ness Avenue have median caps.
While this section contains far more pedestrian amenities than the typical city block, it still lacks amenities such as pedestrian scale lighting, consistent street names and informational signage for pedestrians, detectable warnings at all curb cut ramps, and median caps on the north-side crosswalks. The prevalence of red-light running at these intersections remains a key concern.
10.2.4 Segment 2 – Geary / O’Farrell
This inventory is intended to inform the development of a key stop on Van Ness Avenue between O’Farrell and Geary, and provide an example of the type of existing infrastructure at key pedestrian locations on the corridor.
Amenities provided for pedestrians and transit users include consistent curb cuts, street trees, and bus shelters at most bus stops. Half of the intersection approaches have corner bulb-outs and median caps.
However, due to the left-turn pockets at Geary and O’Farrell, the center medians are reduced to only 4 feet, a poor refuge for pedestrians. Pedestrian-oriented street names are all but absent, no benches are provided, and crosswalk lines are wearing out at some crossings.
10.2.5 Segment 3 – Green to Filbert / Union Streets
This area was selected to provide a sampling of pedestrian facilities around Union Street at the northern end of the corridor, which has more residential and neighborhood commercial scale uses.
Although this segment does contain pedestrian facilities such as pedestrian countdown and pedestrian fl ashing signals, some street signage,
visible crosswalks, and shelters for some of the bus stops, they are not consistently provided. The left-turns at Green and Union Streets and absence of corner bulb-outs result in less-than-ideal pedestrian crossings; the center median on the south side is only 4 feet. There are no benches, few trees in the median, and auto speeds are fastest in this part of the corridor, exceeding 20 mph.
10.3 PEDESTRIAN SAFETY
Walkability and pedestrian safety are critical to a successful transit system. The conditions through which potential transit riders walk, wait, or otherwise access transit often determine whether they choose to ride. This section on pedestrian safety focuses on collisions involving pedestrians specifi cally on Van Ness Avenue. The pedestrian safety analysis uses data from recorded incidents. Yet there is another unquantifi able aspect of pedestrian safety – how safe pedestrians feel on the street, regardless of the recorded incidents.
10.3.1 Methodology
Pedestrian safety was analyzed using California’s Statewide Integrated Traffi c Records System (SWITRS), which reports collision data. This data can be best analyzed through mapping. When analyzing safety data such as SWITRS, it is important to consider both the absolute number of incidents reported, as well as the pedestrian exposure rate. An intersection that has a high number of incidents, but also has high volumes of pedestrian traffi c, may require a different treatment than an intersection that has little pedestrian traffi c but disproportionately high incidence of collisions. Finally, incident reporting needs to be considered. The SWITRS database only includes incidents for which a police report is fi led. Many pedestrian and bicycle collisions may go unreported.
10.3.2 Findings
Some intersections along Van Ness Avenue have a high number of collisions involving confl icts between pedestrians and vehicles, shown in Figure 2-27. Table 2-13 ranks Van Ness intersections in the order of the total number of reported incidents involving pedestrians.

Section 2: Existing Conditions and Transportation Needs 2-41
Figure 2-27: Pedestrian and Vehicle Incidents on Van Ness Avenue

SAN FRANCISCO COUNTY TRANSPORTATION AUTHORITY: Van Ness BRT Study 2-42
Table 2-13: Incidents Involving Pedestrians on Van Ness Avenue
Cross Street Total
Market 14
Geary 12
Mission 8
Eddy 7
California 7
O’Farrell 6
Fell 5
Broadway 5
Fulton 4
Grove 4
Bush 4
The above intersections should be prioritized for safety treatments.
10.4 RELEVANT WORKSHOP FEEDBACK
Public outreach events held in fall 2004 and spring 2005 asked community members for feedback on transportation needs in the Van Ness corridor. This section highlights the key concerns regarding pedestrian safety and conditions gathered during the public outreach effort. A complete summary of the events and feedback is included as Appendix 4.
Given that a third of participants walked to the workshops, it is not surprising that pedestrian safety proved to be a very signifi cant concern of workshop attendees. Slightly less than two percent of participants biked to the workshops (about the same proportion of San Franciscans that commute to work by bicycle); improving bicycle safety or conditions did not emerge as the highest priority among workshop participants.
Participants provided a wealth of insightful comments regarding inadequate existing conditions and potential future improvements. One of the most prevalent comments related to traffi c safety regarded law enforcement of various traffi c-related offenses, such as speeding, red light running, and crosswalk blocking/infringement. Respondents overwhelmingly chose pedestrian countdown signals as the best way to improve pedestrian conditions. Participants also expressed desire
for more corner bulb-outs and longer crossing time. Comments for improving the safety and conditions around bus stops focused on better personal safety/security, cleanliness, and passenger information.
Notable comments include:
People in cars who drive too fast, run lights, and don't watch for pedestrians need more traffi c law enforcement.
All transit customers are pedestrians at some point of the trip – please prioritize pedestrian and bicycle safety along with transit.
I hate crossing Van Ness on foot. No walk signals in a city?!
As an elementary school teacher in the area, I can say that the amount of time to cross Van Ness is way too short. I have never been able to cross my whole class in the allotted time.
Improve pedestrian crossing conditions – install blinking lights in crosswalks, like at the eastern entrance to the City Hall.
Waiting for a green light in a pedestrian refuge is scary.
10.5 KEY NEEDS FOR PEDESTRIANS AND BICYCLISTS
Mixed experience. For those walking along the corridor or walking to transit, the experience is mixed. On the one hand, Van Ness Avenue sidewalks are relatively wide and buffered from auto traffi c, and fronted by active commercial uses, and landscaped. On the other hand, Van Ness Avenue is a wide street to cross, and corner bulb-outs and adequate median refuges are not consistently available.
Many opportunities to improve safety and comfort. Van Ness Avenue is a wide street with high auto traffi c volumes. Street treatments that improve pedestrian safety, such as curb extensions, visible crosswalks, wide medians, and pedestrian count down signals are not consistently provided.
There is a need for consistent pedestrian-oriented signage. Pedestrian-scaled and consistently available street names are needed. Informational pedestrian signage at key locations such as Market, California, Union, Geary, and O’Farrell Streets, and, especially, at intersections in the Civic Center area.
•
•
•
•
•
•
•
•
•

Section 2: Existing Conditions and Transportation Needs 2-43
Full size medians effectively reduce crossing distances, although these are not available where auto left turns are present. Median caps are needed to protect crosswalks crossing Van Ness at all crossings with a median.
Pedestrian scale lighting, an important amenity that is currently lacking on Van Ness Avenue, should be incorporated in future BRT designs.
•
•
The bike lane on Polk Street provides bicyclists with an attractive and safer alternative to biking on Van Ness, but is incomplete.
•
SAN FRANCISCO COUNTY TRANSPORTATION AUTHORITY: Van Ness BRT Study 2-44
11 Urban and Landscape Design Conditions
This section discusses the opportunities for urban and landscape design to improve the experience of riders, attract more riders, and use BRT as an opportunity to improve the adjacent streetscape, especially through street furniture, street identity, and landscaping.
Urban design addresses the appearance and environmental quality of an area, especially from the perspective of transit riders. At the corridor level, urban design is concerned with the identity and quality of the transit system. At the neighborhood level, it concerns the quality of transit riders’ experience at bus stops and on sidewalks and in crosswalks. It also addresses the vitality of businesses fronting the street, particularly as it is affected by parking deliveries and issues of visibility.
One of the principal elements of urban design is the “streetscape,” which includes the layout and paving of sidewalks, landscaping in sidewalks and medians, street lighting, and signage. Bus stops add other elements, such as bus shelters, seating, information systems (signs, maps, real time information), ticket vending machines, and garbage receptacles.
11.1 URBAN AND LANDSCAPE DESIGN CONDITIONS METHODOLOGY
Urban and landscape design conditions have been analyzed using a combination of GIS data and fi eld observation.
11-2 LANDSCAPE DESIGN FINDINGS
The existing landscape character of Van Ness Avenue is one of the most developed of San Francisco’s major thoroughfares. From Market to Lombard streets, 292 mostly mature trees are planted along the sidewalks. The predominant sidewalk tree is London Plane Tree (Platanus acerifolia). Other common tree species on Van Ness include Ficus microcarpa, Tristania conferta, and Acacia melanoxylon.
In addition to the sidewalk trees, 89 trees are planted in the center median. Thirty-seven mature specimens of various Eucalyptus species and six small fl owering fruit trees have been
joined in recent years by two additional species: 30 Tristania conferta are planted in the narrow median sections created by the left-turn lanes, and 16 Quercus suber (cork oak) are planted where the median is at its full 14-foot width.
Enhancing the median tree planting is an extensive area of 51,000 square feet for median groundcovers. Approximately 28,000 square feet of this area was recently renovated with Ceanothus, geranium ivy and fortnight lily. As part of the renovation, the chain link fence on the Civic Center block between McAllister and Grove streets was replaced with ornamental fencing. Throughout the corridor, the median planting is set back from the back of curb by a 1.5-foot wide concrete or cobble edging. The edging improves safety for maintenance staff by establishing a “shy way” from vehicular traffi c.
A streetscape proposal for the Van Ness Avenue sidewalks from Market to McAllister streets is currently in the planning/agency review phase. The proposal includes sidewalk planting areas with raised curbs and low ornamental fencing, hanging planter baskets from the existing street lights, a landscaped median from Market to Fell streets and new street trees on both sides of Van Ness between Grove and McAllister streets.
Van Ness Avenue currently has a relatively consistent character with respect to the median footprint, maintaining a regular form except where left-turn lanes are provided. The mature trees and approximately 50,000 square feet of groundcover area retain rainwater, thereby reducing storm water runoff.
11.3 URBAN DESIGN FINDINGS
Van Ness Avenue has the potential to be a grand multimodal thoroughfare that links a variety of districts, from the South of Market/Civic Center Area to the Marina and Aquatic Park. The existing design, while functional as an automobile corridor, does not include many of the basic amenities necessary to make it an attractive space for pedestrian use. Large traffi c volumes, along with the discontinuous and disorganized placement of street trees, lighting and furniture, discourage people from using Van Ness Avenue any longer than is necessary. There are frequent confl icts between pedestrians and vehicles, and transit shelters are often

Section 2: Existing Conditions and Transportation Needs 2-45
Figure 2-29: Van Ness light pole luminary and arm
Figure 2-28: Street Views of Van Ness Avenue
inadequate to meet passenger needs. Figure 2-29 shows some typical scenes from Van Ness.
11.3.1 Street Lighting
The streetlights along Van Ness Avenue, shown in Figure 2-29, were originally installed in 1936 using a high-voltage series loop circuit. A series loop consists of a single conductor that is strung from pole to pole, so that if the loop is broken, the entire circuit fails. This is similar to a string of old holiday lights – when one bulb burns out, the entire string fails.
The light poles are constructed of reinforced concrete and are designed to support Muni’s overhead trolley lines as well as streetlight fi xtures. The light fi xtures (teardrop luminaries) which house the bulbs are attached to the poles with decorative arms. The poles are maintained by Muni while the lighting circuit and fi xtures are maintained by the San Francisco Public Utilities Commission (SFPUC). Some of the poles at intersections also support traffi c signals that are maintained by the Department of Parking and Traffi c (DPT).
The SFPUC recently released a report describing plans to phase in improvements to and replacement of streetlights on Van Ness. The entire system requires replacement with a new system that is safe, reliable, energy effi cient, and low maintenance. This replacement will be coordinated with the design and construction of any future BRT alternative.
11.4 RELEVANT WORKSHOP FEEDBACK
Public outreach events held in fall 2004 and spring 2005 asked community members for feedback on transportation needs in the Van Ness corridor. This section highlights the key

SAN FRANCISCO COUNTY TRANSPORTATION AUTHORITY: Van Ness BRT Study 2-46
comments regarding urban and landscape design gathered during the public outreach effort. A complete summary of the events and feedback is included as Appendix 4.
Participants voiced the need to improve pedestrian comfort and overall conditions through better design. The comments also mentioned specifi c design improvements, such as lighting, bus shelters, pedestrian countdown signals, accessibility, streetscape, passenger information and improved landscaping, especially at landmark stops. However, several comments cautioned against focusing too heavily on pedestrian crossing improvements at the expense of the transit improvements.
Notable comments include:
The TA and MTA should treat the entire street of a BRT corridor as the "transit station."
More lighting in the street for pedestrians, bike riders, and vehicles.
Need more trees along Van Ness Avenue. Poplar trees look like a good choice.
Special opportunities at City Hall should try to link civic buildings.
•
•
•
•
11.5 KEY NEEDS FOR URBAN AND LANDSCAPE DESIGN
Leverage historic elements. The Van Ness Avenue light standards have historic value and the potential to complement an overall urban design for the street. Historic elements to the Van Ness streetscape design, including light standards, signage and interspersed tree plantings, can be integrated into a contemporary design that improves pedestrian amenities and connections, especially adjacent to improved transit facilities, and emphasizes the avenue’s special role as one of the city grand thoroughfares.
Strong landscape statement. The landscaped medians running down the center of Van Ness are a key element in the street’s identify and urban design. The landscaped medians provide a consistent, highly visible landscape footprint.
Landmark sites: The City Hall block of Van Ness, between McAllister and Grove, is a major landmark along the boulevard. The intersections of Van Ness with Market and with Mission streets are also key opportunity sites.
Consistent Street Furniture: Continuous street tree plantings, transit shelter improvements, and a comprehensive street furniture and lighting plan would establish a more unifi ed identity for this key thoroughfare. Van Ness lacks a coordinated set of street furniture; newspaper racks, trash cans, benches and signage should work together to reinforce the stature of Van Ness Avenue.
•
•
•
•

Section 3: Defi nition of BRT in San Francisco and Alternative BRT Designs 3-1
CONTENTS1 INTRODUCTION .......................... 3-2
1.1 METHODOLOGY ............................... 3-2
1.2 SUMMARY OF ALTERNATIVE BRT DESIGN CONCEPTS ............................ 3-2
2 BRT IN SAN FRANCISCO ................. 3-32.1 CHARACTERISTICS OF BRT IN
SAN FRANCISCO ............................... 3-3
2.1.1 DEDICATED BUS LANE (A) .................... 3-3
2.2 VAN NESS BRT DESIGN PRINCIPLES ........ 3-4
3 NO-PROJECT ALTERNATIVE ............. 3-63.1 OCTAVIA BOULEVARD/CENTRAL
FREEWAY REPLACEMENT PROJECT ......... 3-6
3.2 TRANSIT RELIABILITY AND ROUTE MANAGEMENT ........................ 3-6
3.3 TRAFFIC SIGNALS AND PEDESTRIAN COUNTDOWN SIGNALS ........ 3-6
3.4 REAL-TIME TRANSIT AND TRAFFIC MANAGEMENT (“SFGO”) .......... 3-6
3.5 STREET LIGHTING............................. 3-7
3.6 MUNI OVERHEAD CATENARY SYSTEM ....... 3-7
3.7 SIDEWALK LANDSCAPING AND BEAUTIFICATION ........................ 3-7
4 ALTERNATIVE BRT DESIGNS OVERVIEW ................................ 3-94.1 COMMON ELEMENTS .......................... 3-9
5 ALTERNATIVE 2, CURB LANE BRT ....3-145.1 TRANSIT FEATURES .......................... 3-14
5.2 PEDESTRIAN TREATMENTS/URBAN AND LANDSCAPE DESIGN .............................3-16
5.3 RELEVANT OUTREACH FEEDBACK .......... 3-16
6 ALTERNATIVE 3, CENTER SIDE BRT (TWO MEDIAN) ..........................3-176.2 PEDESTRIAN TREATMENTS/
URBAN AND LANDSCAPE DESIGN ........... 3-17
6.3 RELEVANT OUTREACH FEEDBACK .......... 3-17
SECTION 3: BRT ALTERNATIVES DEVELOPMENT
VAN NESS AVENUE BRT FEASIBILITY STUDYDECEMBER 2006
7 ALTERNATIVE 4, CENTER SIDE BRT (ONE MEDIANS) .........................3-207.1 TRANSIT FEATURES .......................... 3-20
7.2 PEDESTRIAN TREATMENTS/URBAN AND LANDSCAPE DESIGN ........... 3-22
7.3 RELEVANT OUTREACH FEEDBACK .......... 3-22
8 ALTERNATIVE 5, CENTER SIDE BRT (CENTER MEDIAN) ......................3-238.1 LEFT/RIGHT-DOOR BUSES .................. 3-23
8.2 TRANSIT FEATURES .......................... 3-23
8.3 PEDESTRIAN TREATMENTS/URBAN AND LANDSCAPE DESIGN ........... 3-23
8.4 RELEVANT OUTREACH FEEDBACK .......... 3-23
9 SPECIAL LOCATIONS ....................3-269.1 CITY HALL ..................................... 3-26
9.2 GEARY AND O’FARRELL ...................... 3-26
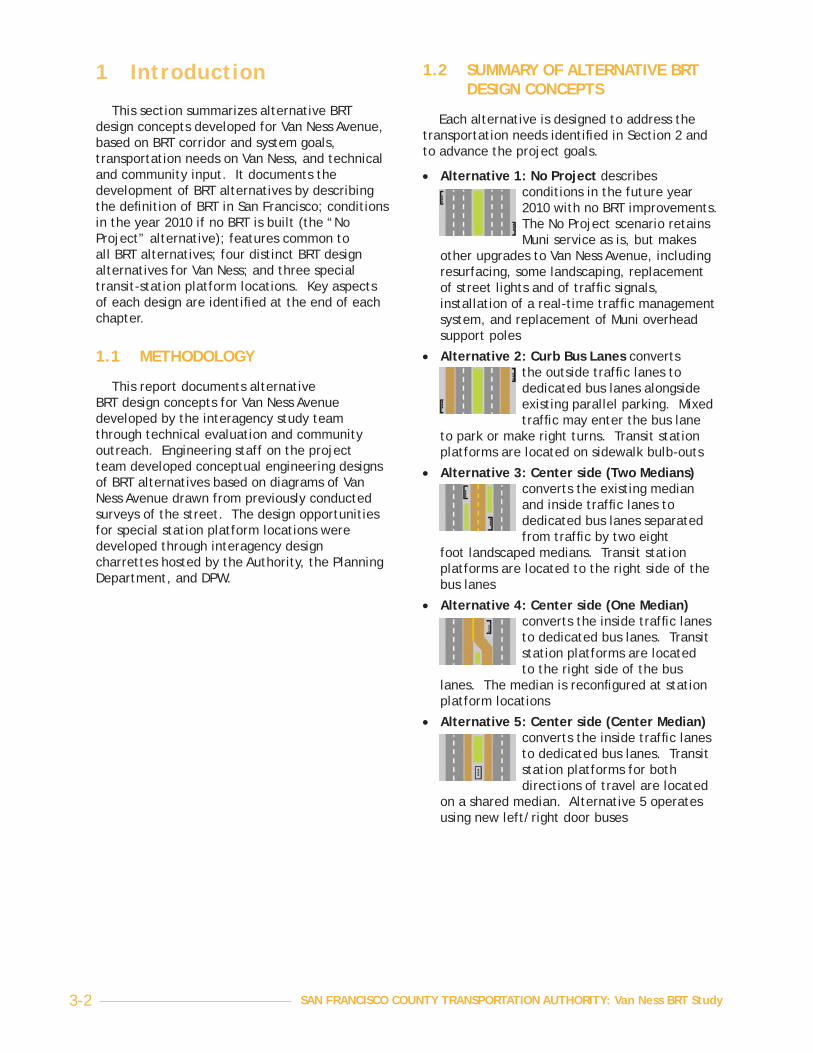
SAN FRANCISCO COUNTY TRANSPORTATION AUTHORITY: Van Ness BRT Study 3-2
1 Introduction
This section summarizes alternative BRT design concepts developed for Van Ness Avenue, based on BRT corridor and system goals, transportation needs on Van Ness, and technical and community input. It documents the development of BRT alternatives by describing the defi nition of BRT in San Francisco; conditions in the year 2010 if no BRT is built (the “No Project” alternative); features common to all BRT alternatives; four distinct BRT design alternatives for Van Ness; and three special transit-station platform locations. Key aspects of each design are identifi ed at the end of each chapter.
1.1 METHODOLOGY
This report documents alternative BRT design concepts for Van Ness Avenue developed by the interagency study team through technical evaluation and community outreach. Engineering staff on the project team developed conceptual engineering designs of BRT alternatives based on diagrams of Van Ness Avenue drawn from previously conducted surveys of the street. The design opportunities for special station platform locations were developed through interagency design charrettes hosted by the Authority, the Planning Department, and DPW.
1.2 SUMMARY OF ALTERNATIVE BRT DESIGN CONCEPTS
Each alternative is designed to address the transportation needs identifi ed in Section 2 and to advance the project goals.
Alternative 1: No Project describes conditions in the future year 2010 with no BRT improvements. The No Project scenario retains Muni service as is, but makes
other upgrades to Van Ness Avenue, including resurfacing, some landscaping, replacement of street lights and of traffi c signals, installation of a real-time traffi c management system, and replacement of Muni overhead support poles
Alternative 2: Curb Bus Lanes converts the outside traffi c lanes to dedicated bus lanes alongside existing parallel parking. Mixed traffi c may enter the bus lane
to park or make right turns. Transit station platforms are located on sidewalk bulb-outs
Alternative 3: Center side (Two Medians) converts the existing median and inside traffi c lanes to dedicated bus lanes separated from traffi c by two eight
foot landscaped medians. Transit station platforms are located to the right side of the bus lanes
Alternative 4: Center side (One Median) converts the inside traffi c lanes to dedicated bus lanes. Transit station platforms are located to the right side of the bus
lanes. The median is reconfi gured at station platform locations
Alternative 5: Center side (Center Median) converts the inside traffi c lanes to dedicated bus lanes. Transit station platforms for both directions of travel are located
on a shared median. Alternative 5 operates using new left/right door buses
•
•
•
•
•

Section 3: Defi nition of BRT in San Francisco and Alternative BRT Designs 3-3
2 BRT in San Francisco
This section describes the key features of BRT as defi ned by the San Francisco interagency study team, and outlines key design principles for developing BRT alternatives on Van Ness.
Bus Rapid Transit (BRT) is a system of improvements intended to cost-effectively reduce transit travel times, improve transit reliability, and increase ridership using bus vehicles. Over 25 cities around the world, such
as those shown in Figure 3-1, have successfully implemented BRT to achieve these goals.
In 2004, the Authority hosted an interagency workshop to defi ne the characteristics of BRT in San Francisco (see Appendix 8). The characteristics of BRT in San Francisco include at least seven key features, described below and illustrated by Figure 3-2
2.1 CHARACTERISTICS OF BRT IN SAN FRANCISCO
2.1.1 Dedicated Bus Lane (A)
BRT operates in a dedicated right-of-way on the street surface. The dedicated lane allows buses to operate free of confl icts with mixed traffi c.
Dedicated bus lanes can be located along the curb, alongside parallel parking, or in the center of the street. Dedicated bus lanes are distinguished from mixed traffi c lanes by colored pavement or other special markings and if located in the center of a roadway, are separated from mixed traffi c lanes by a low curb.
2.1.2 Transit Signal Priority (B)
BRT includes technology to ensure that time stopped at traffi c signals is minimized. Transit signal priority technology allows buses nearing an intersection to extend a green light long enough for them to pass through. This
Figure 3-2. BRT Characteristics
Figure 3-1. BRT in Other Cities

SAN FRANCISCO COUNTY TRANSPORTATION AUTHORITY: Van Ness BRT Study 3-4
technology can also provide a “queue jump” signal phase for entering and exiting bus lanes. A queue jump signal gives buses their own signal phase at intersections, allowing the bus to proceed ahead of other traffi c.
2.1.3 High-Quality Station Platforms with Added Amenities (C)
BRT includes high-quality station platforms with extra amenities for waiting passengers. Station platforms are larger than standard Muni stops, with more seating, larger shelters, and route information. BRT stations also include NextBus real-time arrival signs, which display actual arrival times of the next bus.
2.1.4 Streetscape Improvements and Amenities (D)
Every transit trip begins with a walking trip, and so BRT includes improvements that support walking and pedestrian safety. Streetscape improvements and amenities provide a more comfortable environment for the users of the BRT system. BRT on Van Ness Avenue includes pedestrian-scale sidewalk lighting, pedestrian countdown signals, and improved landscaping that also serves to buffer pedestrians and waiting passengers from motor vehicle traffi c.
2.1.5 Fare Prepayment and All-Door Boarding (E)
On a BRT system, passengers may pay fares at ticket-vending machines located on the station platforms, and may enter the bus through any door, just as on Muni’s Metro system. Fare pre-payment reduces delays caused when all passengers board through the front door to pay fares with cash. Fare pre-payment is enforced by a proof-of-payment system and fare inspectors. BRT passengers may also pay cash fares at the front of buses as they do today.
2.1.6 Advanced Traffi c and Transit Management Systems (F)
BRT uses a variety of advanced traffi c and transit management systems designed to improve service:
Automatic Vehicle Location (AVL) is used to manage transit route operations in real-time, keeping buses on schedule and reducing bunching.
NextBus real-time arrival information at station platforms provides a digital display of the actual arrival times of buses. Real-
•
•
time information can also be used to notify conductors of re-routing delays or other changes.
CCTV (closed-circuit television) at station platforms helps to ensure passenger security.
2.2 VAN NESS BRT DESIGN PRINCIPLES
Each BRT alternative developed for Van Ness Avenue strives to adhere to a set of BRT design principles developed by the Authority in conjunction with study partners (MTA, DPT, the Planning Department, and DPW). Key design principles are highlighted below; the complete set of BRT design principles can be found in Appendix 7.
2.2.1 Busway and Station DesignStation Platforms: Provide minimum platform width of eight feet and minimum length of 120 feet, to accommodate two 60 foot articulated buses. Platforms are sited on the far side of intersections in order to take advantage of transit signal priority. All platforms incorporate improved signage, maps, real-time bus arrival information, enhanced bus shelters, and lighting to enhance safety and comfort for waiting riders.
Fare Payment: Accommodate fare pre-payment and all-door boarding.
Wayfi nding: Facilitate convenient transfers by minimizing walking distance between transfers, minimizing number of intersection crossings, providing wayfi nding information, and locating stations at major land uses with the most convenient transit transfers.
Bus Lanes: Accommodate both Muni and Golden Gate Transit vehicles. Preferred minimum lane width is 12 feet, although 11.5 feet is acceptable where right-of-way is constrained. Weaving of lanes should be minimized to optimize transit operations.
Mixed Traffi c: Minimize confl icts with other vehicles, particularly turning vehicles.
2.2.2 Neighborhood AccessLand Uses: Integrate with future potential land uses at major activity nodes.
Parking: Maintain on-street parking with parking lanes at least eight and ½ feet wide.
2.2.3 Pedestrian EnvironmentCrossing Distance: Reduce crossing distances between pedestrian refuges to a maximum
•
•
•
•
•
•
•
•
•

Section 3: Defi nition of BRT in San Francisco and Alternative BRT Designs 3-5
of four lanes. Pedestrian refuges should be a minimum of four feet wide and extend through the crosswalk.
Lighting: Use pedestrian-scale lighting to provide appropriate intensities and coverage while avoiding over-lighting and glare.
Bicycles: Provide bike lanes on Polk.
2.2.4 Mixed 10-Foot Wide LanesLanes: Provide two lanes for mixed traffi c.
Right Turns: Provide right-turn pockets at high-volume intersections.
Left Turns: Reduce confl icts between left-turning vehicles and bus lanes. Mark turning arrows at left-turn pockets.
2.2.5 Signal PrioritizationCrossing Times: Provide a two and ½ feet-per-second crossing time for pedestrians (including “walk” and fl ashing “don’t walk” phases). Timings should allow enough time for pedestrians to cross the entire street. Pedestrian signal phase should be recalled each cycle.
•
•
•
•
•
•

SAN FRANCISCO COUNTY TRANSPORTATION AUTHORITY: Van Ness BRT Study 3-6
3 No-Project Alternative
BRT on Van Ness Avenue could be operational by 2010. In that timeframe, a number of other transportation-related improvements to Van Ness Avenue are expected. These planned changes are called the “No Project” scenario, and are described below. Engineering drawings of the No Project with utilities are included as Appendix 8.
3.1 OCTAVIA BOULEVARD/CENTRAL FREEWAY REPLACEMENT PROJECT
The Octavia Boulevard/Central Freeway Replacement project was complete as of September 2005. One of the next steps following the opening of Octavia Boulevard is the planned resurfacing of Van Ness Avenue from Erie Street (just south of Duboce Avenue) to Golden Gate Avenue. The resurfacing work, conducted by DPW, could begin in January 2008 and could be coordinated with Van Ness BRT construction.
3.2 TRANSIT RELIABILITY AND ROUTE MANAGEMENT
A number of measures planned by MTA by 2010 could improve the reliability of Van Ness buses. MTA can adjust bus schedules to more accurately refl ect current travel times; this will improve the ability of buses to adhere to their scheduled starting and running times. This adjustment could improve schedule adherence by fi ve percent.
Another step is increasing the presence of on-site route management, a measure supported by the MTA’s Transit Effectiveness Project (TEP), currently underway.
3.3 TRAFFIC SIGNALS AND PEDESTRIAN COUNTDOWN SIGNALS
In June 2005, DPT adjusted the peak-period traffi c-signal cycle timings on Van Ness Avenue. The cycle lengths were all standardized to 90 seconds, coordinated to smooth traffi c fl ow, and adjusted to maintain a pedestrian crossing speed of two and ½ feet per second to the center median. These signal changes were modeled as part of the No Project alternative.
The traffi c signals on Van Ness Avenue and the underground infrastructure supporting them are near the end of their useful life. Many of the Van Ness Avenue intersections require the overhaul of underground signal infrastructure and poles before pedestrian signals can be installed. MTA is installing pedestrian signals with countdown timers at key Van Ness Avenue crossings in advance of the BRT project to improve pedestrian safety in the near term. MTA was recently awarded Prop K funds to install pedestrian countdown signals crossing Van Ness Avenue at Union, Pacifi c, Jackson, Washington, Geary, O’Farrell, Turk, and Golden Gate Streets. These locations were selected because DPT is certain that the conduit is newer at these locations, so retrofi tting will be feasible. Upgrades to the rest of the signals are planned as part of the No Project alternative.
3.4 REAL-TIME TRANSIT AND TRAFFIC MANAGEMENT (“SFGO”)
The City is implementing a program on key San Francisco arterials, including Van Ness, to link traffi c signals together in a central location to:
Permit traffi c supervisors and coordinators to monitor each intersection;
Coordinate signals on a network basis in real time;
Assure that each signal is functioning properly given the time of day and anticipated traffi c fl ows.
This system of two-way traffi c signal communications, called SFgo, is the City’s new, integrated transportation management system, led by DPT. A new fi ber-optic communications network and new advanced traffi c signal controllers will be installed. Traffi c operators will have the ability to monitor traffi c in real time from a “transportation management center,” and alter signal timings to match traffi c patterns as they fl uctuate throughout the day and week. Conventionally, signal timings have been set based on typical traffi c volumes. Special events, incidents and blockages on a street can be dealt with more effectively through the real-time approach.
SFgo is currently being implemented on the Third Street corridor in coordination with the light rail project, and is planned for select SOMA
•
•
•

Section 3: Defi nition of BRT in San Francisco and Alternative BRT Designs 3-7
arterials, for Fell and Oak, and for the Van Ness corridor, including Franklin and Gough.
3.5 STREET LIGHTING
The street lights on Van Ness are near the end of their useful life and will be replaced by the PUC. There are a total of 256 street lights along Van Ness Avenue from Market to North Point Streets, and they are approximately 75 to 80 years old. The PUC project will replace the current incandescent street lighting with high-pressure sodium (HPS) lighting, and by 2010, will replace the full lighting infrastructure with a new one that is safe, reliable, energy effi cient, and low maintenance. The project involves the following phases:
Phase 1: Perform near-term repairs to preserve the functioning of the existing system.
Phase 2: Convert the existing high-voltage system to a standard low-voltage system, and replace the existing series loop wires with a modern low-voltage service-point structure.
Phase 3: Replace the incandescent lighting fi xtures with more aesthetically pleasing HPS lamps; replace deteriorated and eroded poles; install conduit wiring and pull boxes; perform necessary trenching; replace expensive, short-lived luminaries and the temporary ballasts; and bring the street lighting to a normal voltage used with HPS bulbs. The trenching involved with this project would be coordinated with the construction of Van Ness BRT.
3.6 MUNI OVERHEAD CATENARY SYSTEM
The poles that support Muni’s Overhead Catenary System (OCS) are near the end of their useful life and will be replaced as part of Muni’s regular Overhead Support Rehabilitation program. Only the supporting poles – not the wires themselves – require replacement.
3.7 SIDEWALK LANDSCAPING AND BEAUTIFICATION
DPW plans near-term landscaping and beautifi cation improvements for lower Van Ness Avenue from McAllister to Mission Streets. Improvements focus on the sidewalks, and include the following features:
•
•
•
Restore damaged and decayed historic light posts
Organize site furnishings that clutter the sidewalk. Replace existing street furniture with furniture made of materials and colors that refl ect the existing Civic Center treatments
Streamline light posts currently cluttered with straps/signs
Remove redundant strain poles at failed light stops
Fill gaps in the line of sidewalk trees
Install sidewalk planter boxes and improve with landscaping
Install banners and hanging planter baskets
Figure 3-3 illustrates some of the planned landscaping improvements. The project is described further in Appendix 9.
•
•
•
•
•
•
•

SAN FRANCISCO COUNTY TRANSPORTATION AUTHORITY: Van Ness BRT Study 3-8
Figure 3-3: Civic Center Landscaping Upgrades in the No-Project Scenario

Section 3: Defi nition of BRT in San Francisco and Alternative BRT Designs 3-9
4 Alternative BRT Designs Overview
This chapter documents four alternative BRT design concepts for Van Ness Avenue. As summarized in Table 3-1, the alternatives differ based on the positioning of the bus lanes, station platforms, and landscaped median(s):
4.1 COMMON ELEMENTS
All four BRT alternatives share the core BRT features described in Section 1.1: a dedicated bus lane; transit signal priority; high-quality transit platforms; all-door boarding and fare pre-payment; pedestrian safety and urban design upgrades; and advanced transit and traffi c management systems. The alternatives all share additional design elements, described below.
4.1.1 Operating (Service) Plan
A BRT service plan is designed to provide reliable, staggered, consistent headways; a wide span of service with rapid service provided throughout the day and evening, not just during commute periods; and route management to keep buses operating on schedule and with correct spacing.
Each of the BRT alternatives developed for Van Ness Avenue is modeled using the same service plan, including route management and identical service frequencies. The model assumed no increase in service frequency.
4.1.2 Number and Location of Station Stops
BRT helps achieve fast transit travel times by eliminating little-used bus stops and providing stops at major transfer points and at key land use clusters.
Typical local Muni service bus stop spacing is approximately 660 feet (a standard city block). To realize faster travel times, BRT stops need to be spaced farther apart, much like light-rail system stop spacing. The stop spacing of BRT systems in North America typically ranges upward of 1,200 feet. The Van Ness BRT alternatives have an average stop spacing of around 850 feet.
Each of the alternatives share the same number and location of transit station platforms. Land-use characteristics, population densities, transfer points, and grades are all factors weighed in determining where station platforms should be located. Station platform locations for the BRT alternatives are shown in Figure 3-4 below and Table 3-2.
Table 3-1: Alternatives Overview
Alternative Bus Lanes Station Platforms Median(s)Alt 2 – Curb Lane BRT
Curb Curb Center
Alt 3 – Center Side (Two Medians)
Center Side Side
Alt 4 – Center Side (One Median)
Center Side Center
Alt 5 – Center (Center Median)
Center Center Center

SAN FRANCISCO COUNTY TRANSPORTATION AUTHORITY: Van Ness BRT Study 3-10
Figure 3-4: Map of Existing and Proposed BRT Stops
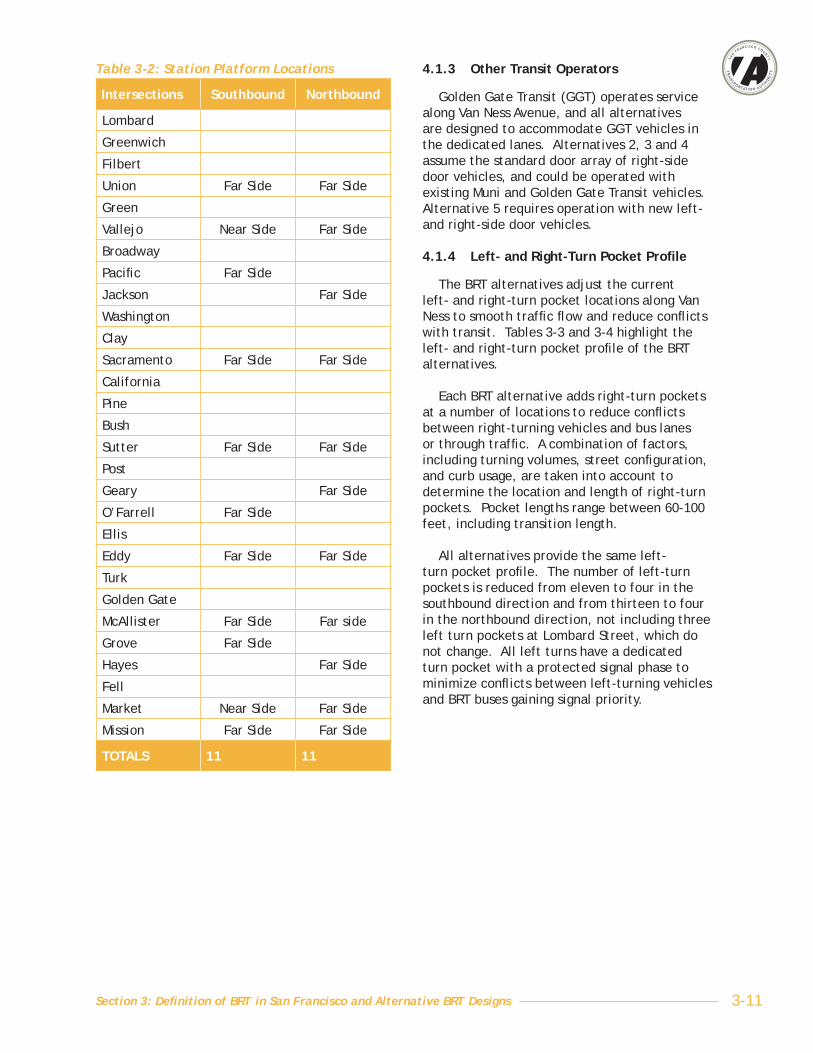
Section 3: Defi nition of BRT in San Francisco and Alternative BRT Designs 3-11
4.1.3 Other Transit Operators
Golden Gate Transit (GGT) operates service along Van Ness Avenue, and all alternatives are designed to accommodate GGT vehicles in the dedicated lanes. Alternatives 2, 3 and 4 assume the standard door array of right-side door vehicles, and could be operated with existing Muni and Golden Gate Transit vehicles. Alternative 5 requires operation with new left- and right-side door vehicles.
4.1.4 Left- and Right-Turn Pocket Profi le
The BRT alternatives adjust the current left- and right-turn pocket locations along Van Ness to smooth traffi c fl ow and reduce confl icts with transit. Tables 3-3 and 3-4 highlight the left- and right-turn pocket profi le of the BRT alternatives.
Each BRT alternative adds right-turn pockets at a number of locations to reduce confl icts between right-turning vehicles and bus lanes or through traffi c. A combination of factors, including turning volumes, street confi guration, and curb usage, are taken into account to determine the location and length of right-turn pockets. Pocket lengths range between 60-100 feet, including transition length.
All alternatives provide the same left-turn pocket profi le. The number of left-turn pockets is reduced from eleven to four in the southbound direction and from thirteen to four in the northbound direction, not including three left turn pockets at Lombard Street, which do not change. All left turns have a dedicated turn pocket with a protected signal phase to minimize confl icts between left-turning vehicles and BRT buses gaining signal priority.
Table 3-2: Station Platform Locations
Intersections Southbound Northbound
Lombard
Greenwich
Filbert
Union Far Side Far Side
Green
Vallejo Near Side Far Side
Broadway
Pacifi c Far Side
Jackson Far Side
Washington
Clay
Sacramento Far Side Far Side
California
Pine
Bush
Sutter Far Side Far Side
Post
Geary Far Side
O’Farrell Far Side
Ellis
Eddy Far Side Far Side
Turk
Golden Gate
McAllister Far Side Far side
Grove Far Side
Hayes Far Side
Fell
Market Near Side Far Side
Mission Far Side Far Side
TOTALS 11 11
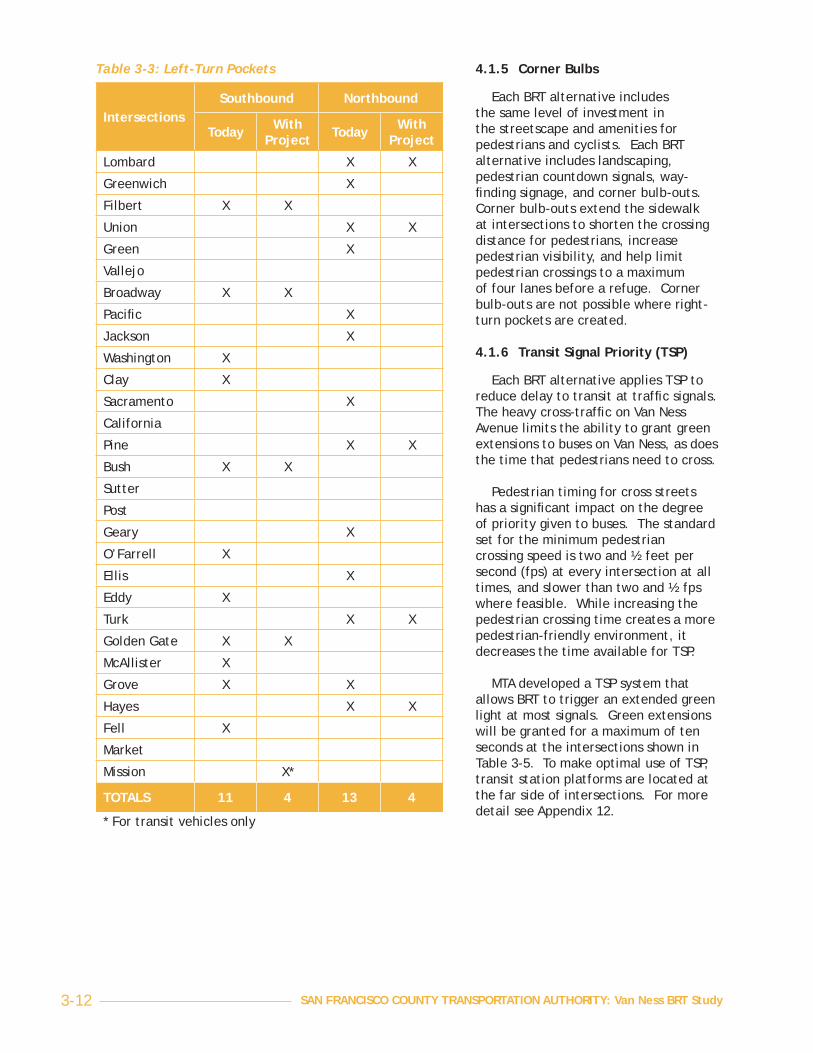
SAN FRANCISCO COUNTY TRANSPORTATION AUTHORITY: Van Ness BRT Study 3-12
4.1.5 Corner Bulbs
Each BRT alternative includes the same level of investment in the streetscape and amenities for pedestrians and cyclists. Each BRT alternative includes landscaping, pedestrian countdown signals, way-fi nding signage, and corner bulb-outs. Corner bulb-outs extend the sidewalk at intersections to shorten the crossing distance for pedestrians, increase pedestrian visibility, and help limit pedestrian crossings to a maximum of four lanes before a refuge. Corner bulb-outs are not possible where right-turn pockets are created.
4.1.6 Transit Signal Priority (TSP)
Each BRT alternative applies TSP to reduce delay to transit at traffi c signals. The heavy cross-traffi c on Van Ness Avenue limits the ability to grant green extensions to buses on Van Ness, as does the time that pedestrians need to cross.
Pedestrian timing for cross streets has a signifi cant impact on the degree of priority given to buses. The standard set for the minimum pedestrian crossing speed is two and ½ feet per second (fps) at every intersection at all times, and slower than two and ½ fps where feasible. While increasing the pedestrian crossing time creates a more pedestrian-friendly environment, it decreases the time available for TSP.
MTA developed a TSP system that allows BRT to trigger an extended green light at most signals. Green extensions will be granted for a maximum of ten seconds at the intersections shown in Table 3-5. To make optimal use of TSP, transit station platforms are located at the far side of intersections. For more detail see Appendix 12.
Table 3-3: Left-Turn Pockets
IntersectionsSouthbound Northbound
Today With Project Today With
Project
Lombard X X
Greenwich X
Filbert X X
Union X X
Green X
Vallejo
Broadway X X
Pacifi c X
Jackson X
Washington X
Clay X
Sacramento X
California
Pine X X
Bush X X
Sutter
Post
Geary X
O’Farrell X
Ellis X
Eddy X
Turk X X
Golden Gate X X
McAllister X
Grove X X
Hayes X X
Fell X
Market
Mission X*
TOTALS 11 4 13 4
* For transit vehicles only

Section 3: Defi nition of BRT in San Francisco and Alternative BRT Designs 3-13
Table 3-5: TSP Intersections
Intersections Transit Signal Priority?
Post Street Yes
Geary Street Yes
O’Farrell Street Yes
Ellis Street Yes
Eddy Street Yes
Turk Street No, Protected Left Turn
Golden Gate No, Protected Left Turn
McAllister Street Yes
Grove Street Yes
Hayes Street No, Protected Left Turn
Fell Street No, Protected Left Turn
Market Street No, heavy transit on Market St.
Mission Street No, but special phases called to allow buses to exit busway
TOTAL 7
4.1.7 Utilities
Each BRT alternative is designed to allow maintenance and repair of underground utilities along Van Ness Avenue, primarily sewer, water, auxiliary water supply system (AWSS) lines and cisterns, gate valves and hydrants.
According to current City standards, fi re hydrants must be relocated if bulb-outs are installed nearby. The City standard stipulates that hydrants must be located within 24 to 27 inches from the face of the curb to the centerline of the hydrant to provide access for specialized trucks which mechanically turn the hydrant gate valves.
Future BRT designs also allow for maintenance workers to access the median area to repair sewer facilities as necessary. This primarily involves the ability to reroute Muni service to a lane other than the center lane in the event of needed sewer repairs. Potentially, each alternative might require the relocation of manholes and associated sewer lines to accommodate proposed medians and boarding islands.
Table 3-4: Right-Turn Pockets
Intersections Southbound Northbound
Lombard
Greenwich
Filbert
Union
Green
Vallejo
Broadway
Pacifi c
Jackson
Washington
Clay X
Sacramento X
California X
Pine X
Bush X
Sutter X
Post X
Geary X
O’Farrell X
Ellis
Eddy
Turk
Golden Gate X
McAllister X
Grove
Hayes
Fell
Market X X
Mission X
TOTALS 7 8

SAN FRANCISCO COUNTY TRANSPORTATION AUTHORITY: Van Ness BRT Study 3-14
5 Alternative 2, Curb Lane BRT
Alternative 2, curb lane BRT, converts the outside, or right-most, traffi c lanes into dedicated bus lanes. Two lanes of mixed traffi c remain on Van Ness Avenue in each direction, as well as parallel parking to the right of the side bus lanes.
Figure 3-5 shows a plan view of Alternative 2. The complete conceptual engineering designs are included as Appendix 11.
5.1 TRANSIT FEATURES
Figure 3-6 illustrates the typical cross-sections. In Figure 3-6, Section 2 depicts Alternative 2 on Van Ness where there are no bus stops or turn pockets, and Section 3 depicts Alternative 2 where there is one bus stop and no turn pockets. Figures 3-7 and 3-8 provide a photorealistic visualization of Alternative 2 at City Hall and at Union Street.
Running Way
The bus lane for Alternative 2 ranges from 11.5 to 12.5 feet. Mixed traffi c will be discouraged from entering the bus lane by colored pavement and “Bus Only” markings. The bus lanes are permeable to mixed traffi c, and cars are allowed to cross the lanes to access parallel parking and to make right turns. Right-turn pockets are designed for intersections with high volumes of right-turning vehicles, in order
Figure 3-6: Alternative 2, Curb Lane BRT, Cross Sections
Figure 3-8: Alternative 2, Curb Lane BRT, at Union Street
Figure 3-7: Alternative 2, Curb Lane BRT, at City Hall

Section 3: Defi nition of BRT in San Francisco and Alternative BRT Designs 3-15
Figu
re 3
-5:
Plan
Vie
w o
f Al
tern
ativ
e 2
SAN FRANCISCO COUNTY TRANSPORTATION AUTHORITY: Van Ness BRT Study 3-16
to reduce the incidence of turning vehicles blocking the bus lane.
Stations
At transit station platforms, the sidewalk is widened into a bus bulb-out approximately 120 feet long (plus transition length) and 6 feet wide. Transit stations and station amenities are sited on sidewalk bus bulb-outs.
5.2 PEDESTRIAN TREATMENTS/URBAN AND LANDSCAPE DESIGN
Alternative 2 retains the existing 14 foot landscaped median. Where existing left-turn pockets are removed, the median is extended and planted, increasing the landscaped area.
Bulb-outs for pedestrian visibility are added at corners where right-turn pockets are not needed.
5.3 RELEVANT OUTREACH FEEDBACK
The Authority gathered public input on the BRT alternatives at two public workshops in October 2005, as well as through a survey posted to the Authority’s website, and through phone calls and emails to the Authority.
This section highlights the key comments and concerns regarding Alternative 2 gathered in the public outreach efforts. The variety of answers and comments received demonstrates that users of the Van Ness corridor are not a homogenous group. A complete summary of questions, answers, and additional comments can be found in Appendix 12.
Workshop and survey participants were encouraged to think about each alternative in turn, analyzing its strengths and drawbacks both overall and specifi cally regarding ten project considerations: transit speed/travel time, pedestrian safety, pedestrian convenience, landscaping, traffi c safety, cost, auto travel time, parking, bicycle safety, and bicycle convenience.
For Alternative 2, pedestrian convenience, pedestrian safety, transit speed/travel time, and traffi c safety were discussed the most. Because 58 percent of participants walked to the workshops and another 31 percent took transit, the focus on pedestrian and auto conditions is not surprising.
In general, participants liked Alternative 2 for its pedestrian safety and convenience benefi ts. Several workshop participants expressed the desire to eliminate some parking in this alternative to provide additional room for sidewalks and buses, and one participant advocated expanding sidewalk amenities like benches and fountains.
However, participants did not favor Alternative 2 in terms of transit speed and traffi c safety. Some felt that it did not differ enough from the current bus system to be considered BRT, and some expressed concern that there was no raised barrier to keep auto traffi c out of the BRT lane, noting that double parking in bus-only lanes elsewhere in the city slowed down transit. Conversely, one participant advocated for the bus lane to be open to all traffi c during non-commute hours and to carpool vehicles during peak periods.
A door-to-door outreach effort was also conducted to obtain feedback from Van Ness merchants on Van Ness. In general, merchants were not enthusiastic about Alternative 2, rating it an average of 2.7 on a scale of 1 to 5 (where 5 indicates a high degree of support and 1 a low degree). Although several merchants pointed out the relatively low cost of the alternative and low construction impact, many were skeptical that it would have a signifi cant effect on transit. One merchant pointed out that the bus-only lanes on O’Farrell Streets are not enforced currently, and another pointed out that right-turning vehicles would slow the buses. One merchant stated that if a project were done at all, it should be one with greater benefi ts. Some were also concerned about the effect of Alternative 2 on auto traffi c. Minimizing the project’s impact on auto traffi c was the merchants’ top priority.

Section 3: Defi nition of BRT in San Francisco and Alternative BRT Designs 3-17
6 Alternative 3, Center Side BRT (Two Median)
Alternative 3 converts the two inside, or center-most, mixed traffi c lanes and the median to create bus lanes separated from mixed traffi c by eight-foot-wide landscaped medians. BRT station platforms are located in the median, on the right side of buses.
Figure 3-9 shows a plan view of Alternative 3. The complete conceptual engineering design is provided as Appendix 13.
Figure 3-10 illustrates the typical cross-sections. In the fi gure, Section 7 depicts Alternative 3 on Van Ness where there are bus stops in each direction; Section 6 depicts Alternative 3 where there is one bus stop and no turn pockets; and Section 12 depicts Alternative
3 where there is a left-turn pocket and no bus stop.
6.1 TRANSIT FEATURES
Figures 3-11 and 3-12 below provide photorealistic visualizations of Alternative 3 at City Hall and at Union Street respectively.
Running Way and Station Platforms
Alternative 3 establishes dedicated bus lanes in the center of the roadway with landscaping and station platforms at the right side of buses. Existing medians are redesigned as two side medians, separating the bus lanes from mixed traffi c lanes. Station platforms are located on eight foot medians to the right side of the bus lanes.
6.2 PEDESTRIAN TREATMENTS/URBAN AND LANDSCAPE DESIGN
Pedestrian improvements in Alternative 3 are intended to ease the crossing from sidewalks to the median station platforms. Corner bulb-outs at intersections reduce crossing distances between sidewalks and stations, and pedestrian countdown signals also increase pedestrian safety. Medians could be buffered from adjacent auto traffi c with raised planters or other streetscape elements.
The key urban design features of Alternative 3 are the dual landscaped medians that run along each side of the bus lanes.
6.3 RELEVANT OUTREACH FEEDBACK
This section highlights the key comments and concerns regarding Alternative 3 gathered in the Authority’s public outreach efforts. A complete summary of questions, answers, and additional comments can be found in Appendix 12.
For Alternative 3, transit speed, landscaping, pedestrian safety, and auto travel time were discussed the most. In general, participants saw transit speed and landscaping benefi ts to Alternative 3. Some mentioned that Alternative 3 was worth its higher cost because the benefi ts of not having buses blocked by turning and double-parked cars were so great. Participants also liked the possibility of re-landscaping the median, which they did not perceive as having great value in its current state.
Figure 3-10: Alternative 3, Center Lane BRT with Side Medians, Cross Sections

SAN FRANCISCO COUNTY TRANSPORTATION AUTHORITY: Van Ness BRT Study 3-18
Figu
re 3
-9:
Plan
Vie
w o
f Al
tern
ativ
e 3,
Cen
ter
Lane
BRT
wit
h Si
de M
edia
ns
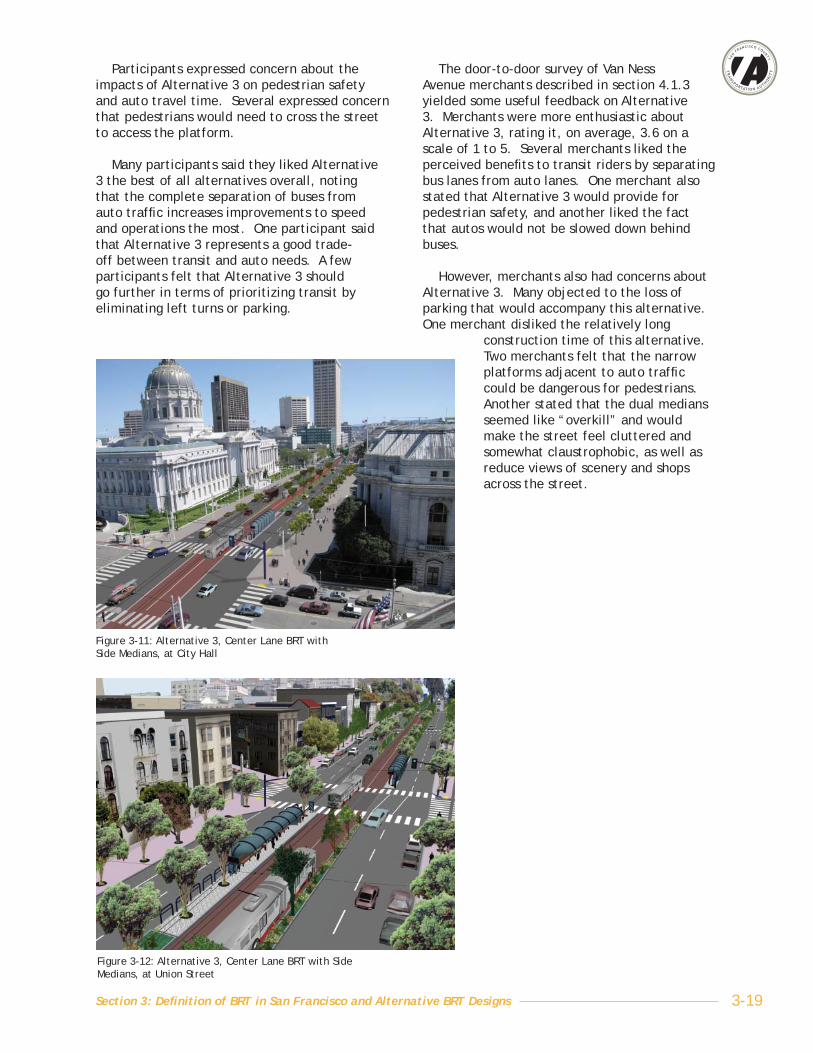
Section 3: Defi nition of BRT in San Francisco and Alternative BRT Designs 3-19
Participants expressed concern about the impacts of Alternative 3 on pedestrian safety and auto travel time. Several expressed concern that pedestrians would need to cross the street to access the platform.
Many participants said they liked Alternative 3 the best of all alternatives overall, noting that the complete separation of buses from auto traffi c increases improvements to speed and operations the most. One participant said that Alternative 3 represents a good trade-off between transit and auto needs. A few participants felt that Alternative 3 should go further in terms of prioritizing transit by eliminating left turns or parking.
The door-to-door survey of Van Ness Avenue merchants described in section 4.1.3 yielded some useful feedback on Alternative 3. Merchants were more enthusiastic about Alternative 3, rating it, on average, 3.6 on a scale of 1 to 5. Several merchants liked the perceived benefi ts to transit riders by separating bus lanes from auto lanes. One merchant also stated that Alternative 3 would provide for pedestrian safety, and another liked the fact that autos would not be slowed down behind buses.
However, merchants also had concerns about Alternative 3. Many objected to the loss of parking that would accompany this alternative. One merchant disliked the relatively long
construction time of this alternative. Two merchants felt that the narrow platforms adjacent to auto traffi c could be dangerous for pedestrians. Another stated that the dual medians seemed like “overkill” and would make the street feel cluttered and somewhat claustrophobic, as well as reduce views of scenery and shops across the street.
Figure 3-11: Alternative 3, Center Lane BRT with Side Medians, at City Hall
Figure 3-12: Alternative 3, Center Lane BRT with Side Medians, at Union Street

SAN FRANCISCO COUNTY TRANSPORTATION AUTHORITY: Van Ness BRT Study 3-20
7 Alternative 4, Center Side BRT (One Medians)
Alternative 4 converts the inside traffi c lanes, on each side of the existing median, to dedicated center bus lanes. This design approach is modifi ed at station platforms, which are located on the right side of the bus lanes. Bus lanes must weave laterally at station platforms to accommodate right-side-door buses.
7.1 TRANSIT FEATURES
Figure 3-13 shows a plan view of Alternative 4. The complete conceptual engineering design is provided as Appendix 14.
Figure 3-14 provides a photorealistic visualization of Alternative 4 at City Hall.
Figure 3-15 illustrates typical cross-sections for Alternative 4. In the fi gure, Section 6 depicts Alternative 4 on Van Ness where there are no bus stops and no turn pockets; Section 11 depicts Alternative 4 where there is one bus stop and no turn pockets; and Section 7 depicts Alternative 4 where there is a left turn pocket and no bus stop.
Running Way
Alternative 4 establishes dedicated bus lanes in the center of the roadway with right-side station platforms, but maintains the existing median wherever possible. The bus weaves laterally to accommodate the center medians and left turns.
Stations
Alternative 4 has the same transit station platform location as Alternative 3. Platforms are located on the right side of center bus lanes. The platforms are designed to be as wide as possible, usually eight feet. Bus stops are 120 feet long to accommodate two 60 foot buses. Station platform design elements such as
Figure 3-14: Alternative 4, Center Lane BRT with Side Platforms and Center Median, at City Hall
Figure 3-15: Alternative 4, Center Lane BRT with Side Platforms and Center Median, Cross Sections

Section 3: Defi nition of BRT in San Francisco and Alternative BRT Designs 3-21
Figu
re 3
-13:
Pla
n Vi
ew o
f Al
tern
ativ
e 4
SAN FRANCISCO COUNTY TRANSPORTATION AUTHORITY: Van Ness BRT Study 3-22
paving, lighting, barriers to protect from traffi c, American with Disabilities Act (AD) boarding needs (ramp/lifts), and others are still under development.
7.2 PEDESTRIAN TREATMENTS/URBAN AND LANDSCAPE DESIGN
The key urban design strategy of Alternative 4 is to ease the crossing from sidewalk to the center station platform, primarily by installing corner bulb-outs and countdown signals. Landscape and railing designs help to buffer waiting passengers from adjacent traffi c lanes. The design includes pedestrian signals, special crosswalk marking or paving, and signage to identify connections to intersecting bus lines and major destinations along the corridor. This alternative also features a single landscaped median wherever possible.
7.3 RELEVANT OUTREACH FEEDBACK
This section highlights the key concerns regarding Alternative 4 in the Authority’s public outreach efforts. A complete summary of questions, answers, and additional comments can be found in Appendix 12.
For Alternative 4, transit speed, landscaping, and pedestrian safety were discussed the most. In general, participants liked the approach of
Alternative 4 to landscaping, although some noted that landscaping was not their greatest concern. Several participants said that avoiding weaving bus lanes was a higher priority to them than landscaping.
Participants had mixed opinions about the effect of Alternative 4 on transit speed. While some were concerned about weaving buses, others felt that the dedicated center lane provided more benefi ts than drawbacks.
In general, participants expressed concern for pedestrians crossing two lanes of auto traffi c and one bus lane to reach the center platform.
The door-to-door survey of Van Ness Avenue merchants described in section 4.1.3 yielded useful feedback on Alternative 4. Merchants rated this alternative 3.9 on a scale of 1 to 5, making it their highest-rated alternative. Three merchants stated that it would increase the safety of pedestrians or the ease of bus boarding. One merchant liked the fact that Alternative 4 would not block the view across the street as much as Alternative 3 would.
However, as with Alternative 3, merchants were concerned about the parking loss in Alternative 4, as well as about its cost. One merchant also expressed concern over confl icts between buses and left-turning vehicles.

Section 3: Defi nition of BRT in San Francisco and Alternative BRT Designs 3-23
8 Alternative 5, Center Side BRT (Center Median)
Alternative 5 converts the inner-most lanes of traffi c to dedicated bus lanes on either side of the existing median. The dedicated lanes are separated by a curb barrier from the adjacent mixed-traffi c lanes. Station platforms are located on the center median, buffered on each side by the bus lanes. Alternative 5 combines several design advantages: center-running bus lanes, preservation of the existing center median, and larger station platform areas.
Figure 3-16 shows the plan view of Alternative 5. The complete conceptual engineering design is provided as Appendix 15.
8.1 LEFT/RIGHT-DOOR BUSES
Alternative 5 would operate with the use of new left- and right-door buses. Several bus manufacturers have a design for a left/right-door articulated bus. This type of bus has been in use in other parts of the world and is just now beginning to be used in the United States, including in Cleveland (Ohio) and Eugene (Oregon). They include such features as low fl oors, fast and simple wheelchair ramp deployment, and a variety of propulsion systems, including hybrid diesel-electric and overhead electric systems. See Appendix 16 for more BRT vehicle information.
8.2 TRANSIT FEATURES
Running Way
The running way for this alternative will be a minimum of 11.5 feet wide. It will have a low curb barrier to delineate it from other travel lanes. Because station platforms are located in the median, the bus lanes do not weave laterally to accommodate right-door vehicles.
Stations
One key design feature of Alternative 5 is the unifi ed, 14 foot center platforms located in the existing median. These unifi ed platforms
provide more space for waiting passengers and a greater buffer between platforms and mixed-traffi c lanes.
8.3 PEDESTRIAN TREATMENTS/URBAN AND LANDSCAPE DESIGN
Alternative 5 includes all the pedestrian treatments applied to other alternatives. Similar to the other BRT alternatives, corner bulb-outs will be added where possible to shorten the crossing distance and to provide more room on the sidewalk at the corners. This alternative has the benefi t of preserving most of the existing 14 foot median. The single median provides ample transit station waiting area compared to the other alternatives. The single median also creates the opportunity for signature station architecture.
8.4 RELEVANT OUTREACH FEEDBACK
This section highlights the key concerns regarding Alternative 5 gathered in the public outreach efforts. A complete summary of questions, answers, and additional comments can be found in Appendix 12.
For Alternative 5, transit speed and pedestrian safety were discussed the most. Participants acknowledged the benefi t of Alternative 5 for transit speeds and travel times. Many participants expressed concern about the effect of Alternative 5 on pedestrian safety because pedestrians would have to cross two
Figure 3-17: Alternative 5, Center-Center Platforms, at City Hall

SAN FRANCISCO COUNTY TRANSPORTATION AUTHORITY: Van Ness BRT Study 3-24
Figu
re 3
-16:
Alt
erna
tive
5,
Cent
er-C
ente
r Pl
atfo
rms,
Pla
n Vi
ew

Section 3: Defi nition of BRT in San Francisco and Alternative BRT Designs 3-25
lanes of traffi c to reach the center platform. Participants support the idea of obtaining left/right-door buses needed for Alternative 5. Some participants were concerned about the effect of left-turning vehicles on transit speed.
SAN FRANCISCO COUNTY TRANSPORTATION AUTHORITY: Van Ness BRT Study 3-26
9 Special Locations
Van Ness Avenue BRT includes three intersections with distinct opportunities for signature station designs: City Hall (between Grove and McAllister Streets), the Geary and O’Farrell Street intersections, and the Market and Mission Street intersections. These locations were chosen for special treatment because they have high pedestrian volumes, are important bus transfer points, and have symbolic importance to the overall design of the corridor.
9.1 CITY HALL
The BRT station platforms at City Hall serve San Francisco’s Civic Center. These stops serve City Hall, the courthouses, the War Memorial Opera House, and Herbst Theater, and are close to many other major civic institutions, such as Symphony Hall and the Main Library. The City Hall location is also a transfer point to the 5 McAllister and 21 Hayes Muni bus lines, with about 4,300 daily passengers using the stops at Grove and McAllister Streets.
Consistency with the existing Civic Center landscape vision and historic Beaux Arts urban design plan is a goal common to all four BRT alternatives. The design of BRT station platforms adjacent to City Hall should be minimal and transparent. One way to achieve this is to maintain the existing signature material and color scheme for the area, making use of Sierra white granite and blue metal.
All three BRT alternatives include signifi cant greening and lighting improvements in the vicinity of City Hall. The existing allées of pollarded plane trees in Civic Center Plaza can be extended along the eastern sidewalk of Van Ness Avenue. Planters and sidewalk extensions can be implemented on the Grove and McAllister Street corners. Pedestrian scale lighting will remedy existing inadequate light levels.
Alternatives 3, 4 and 5 would provide the opportunity for a unifi ed center station platform design. Both station platforms are located on the south side of McAllister Street, which is inconsistent with the design principle of far-side stops. However, this location optimizes the major transfer movements and provides a single, unifi ed site for integrated station platform architecture that complements City Hall. Care must be taken to integrate the platform
smoothly and transparently into the existing design vision of the Civic Center. Alternative 5 preserves the existing 14-foot median with no breaks in the visual line or weaving of the bus lanes.
9.2 GEARY AND O’FARRELL
Geary/O’Farrell is the second busiest transfer point, connecting to the Geary bus lines (Muni routes 38 and 38-L). Close to 7,000 passengers use these stops daily. Geary Boulevard is also under study for BRT service, increasing the importance of this intersection as a major transit hub and orienting feature in the cityscape. This site is also the location of several important land uses, including a proposed new California Pacifi c Medical Center.
9.2.1 Alternative 2 at Geary and O’Farrell
With side-running buses, station platforms on Van Ness would be sited at the southeast corner at Geary (for northbound buses) and at the southwest corner at O’Farrell (for southbound buses). This confi guration is based on the most common transfer movements.
Placing the Van Ness/O’Farrell stations for both BRT routes on the southwest corner of the O’Farrell Street intersection would provide an opportunity for design consistency between the stations. The urban design, legibility, and wayfi nding of this transfer point will be the keys to making the transfers work well.
Figure 3-18 shows a visualization of Alternative 2 between Geary and O’Farrell Streets.
9.2.2 Alternatives 3 and 4 at Geary/O’Farrell
The center-running alternatives present a unique urban design opportunity for this key transfer node. As illustrated in Figure 3-19, single block-long station platforms can be designed with a strong architectural and design statement from Geary to O’Farrell Streets. The platforms would use trees, plantings, and decorative fences to buffer waiting passengers from adjacent mixed-traffi c lanes and to discourage jaywalking. Additionally, crosswalk paving, wayfi nding signage, and other design elements could link Van Ness to the Geary and O’Farrell BRT stations, the proposed hospital, and other key land uses. Distinctive streetscape treatments could be applied on existing sidewalks, including plantings, pedestrian

Section 3: Defi nition of BRT in San Francisco and Alternative BRT Designs 3-27
lighting, and street furniture. The block-long platforms also provide signifi cant added capacity and room for waiting passengers at this high-volume boarding and transfer point.
9.2.3 Alternative 5 at Geary/O’Farrell
Alternative 5 provides the most striking opportunity for unifi ed station platform design as well as the greatest station platform capacity and space for waiting passengers. The 14-foot wide platform would extend in the center of Van Ness from Geary to O’Farrell. Figure 3-20 illustrates a BRT station at this location.
9.3 MARKET AND MISSION
The Market and Mission street intersections are the gateway to Van Ness Avenue and Civic Center, and the most heavily used transfer location (with Muni). Signifi cant design opportunities exist to provide a strong urban design statement at these intersections; to set the tone of a pedestrian- and transit-oriented boulevard; and to facilitate transfers to the 14 Mission and all the Muni lines that operate on and below Market Street.
9.3.1 Mission Street
The Mission Street intersection is both visually and functionally the southern gateway and terminus of the Van Ness corridor. The existing intersection of Van Ness and Mission does not fulfi ll its potential as a statement gateway. Long crossings, wide spaces for turning vehicles, and complicated signal phases make this fi ve-legged intersection a hostile environment for pedestrians and bicyclists, and prioritize freeway-bound traffi c over buses. A number of design objectives were brought to bear in considering this intersection:
Implementing a gateway design element
Shortening pedestrian crossing distances and “tightening” the intersection by increasing pedestrian refuge widths, extending the sidewalks
•
•
Figure 3-19: Alternatives 3 and 4 at Geary/O’Farrell
Figure 3-20: Alternative Five at Geary/O’Farrell
Figure 3-18: Alternative 2, Curb Lane BRT, at Geary/O’Farrell

SAN FRANCISCO COUNTY TRANSPORTATION AUTHORITY: Van Ness BRT Study 3-28
at corners, and reducing turning radii to slow right-turning traffi c
Prioritizing bus movements by providing signal preference as buses enter and exit the busway
Providing streetscape treatments along the block between Market and Mission including street trees, planter beds, and continuation of the historic light poles
Providing special pavement in the center of the intersection along with clear lane delineations to decrease the sensation of being surrounded by concrete
Expanding sidewalk space for waiting transit passengers
The intersection of Van Ness and Mission Street could be highlighted with a vertical gateway element, and greening and open space at one or more corners. This could be a public art element, sculpture, or vertical planting (e.g., palms, poplars or timber bamboo).
Plaza spaces at 12th Street and in front of the car wash at that intersection could provide more landscaping opportunities than are currently available at Market Street. These spaces could have landscaping surrounded by decorative fencing and some seating facing the more active areas of the space. As the area redevelops over time with more active uses, the spaces could be opened up for greater public use.
Figure 3-21 depicts some of the above design concepts.
The design for this intersection can draw upon many elements proposed in the Market/Octavia Better Neighborhoods Plan, currently in the environmental review stage.
The station platform for Muni routes 14 and 49 on Otis Street would be located on an extended sidewalk bulb-out, as opposed to on a median as proposed in the Market/Octavia plan. Several pedestrian improvements are proposed, including bulb-outs, plaza spaces, widening of the existing median on Mission east of Van Ness Avenue, and re-directing 12th Street to form a “T” intersection with Van Ness Avenue north of Mission Street. Other improvements are generally incorporated into the BRT alternatives.
At Mission, transit signal priority will allow routes 47 and 49 to enter and exit the dedicated bus lanes. Buses would exit the lanes and
•
•
•
•
merge into mixed traffi c southbound; route 49 heads southwest to Mission, and route 47 heads southeast to Caltrain.
Entering the busway will involve a minor re-route of the 47 line to enable it to turn onto Van Ness at 12th Street, one block earlier, and then proceed directly into the transit lane at Mission rather than having to make a diffi cult right turn from Mission into the transit lane. Route 47 will proceed north on 12th Street, as opposed to 11th (as it currently does), which would eliminate the need for a quick crossover into the center bus lanes after stopping at Mission/Van Ness. This would also enable a tighter turning radius on the northeast corner of Mission and Van Ness, thereby shortening pedestrian crossing distances.
Supporting the transit catenary wires from a center pole would help reduce pole clutter on the sidewalks, eliminating the need for the historic lights to also serve as catenary support or to install redundant poles alongside the historic lights to support the catenaries.
Muni northbound buses (routes 47 and 49) will likely continue to stop at the northeast corner of
Figure 3-21: Alternative 3 at Mission Street

Section 3: Defi nition of BRT in San Francisco and Alternative BRT Designs 3-29
this intersection, on South Van Ness in front of the Goodwill store. Many riders use this stop, as shown in Table 4 below, and eliminating it would create very long stop spacing between Duboce and Market (2,140 feet) for the 49. Routes 47 and 49 should share a stop so that people can wait at one stop and board either bus.
9.3.2 Market Street
Market Street is the most signifi cant transit stop and transfer point for Van Ness buses, connecting to surface buses and the underground Muni subway. More than 6,000 people every day use the Van Ness station platforms at Market, and 36 percent of all corridor transfers occur here.
Market Street could make use of an architectural statement, such as a distinctive shelter, a vertical art element, or special
treatments on platform waiting areas, to signify arrival to this central station platform location.
All BRT alternatives would locate station platforms on the north side of Market, to facilitate the major transfer movements between north and southbound Van Ness routes and Muni. Alternative 5, center BRT with integrated center platforms, is appealing at this location because of the expanded station platform capacity it provides at this heavily used station.
Figure 3-22 depicts some of the above design concepts.
To create larger-capacity stations as part of Alternatives 3 and 4, the southbound station platform could be relocated to the south side of Market Street, enabling wider platforms in both directions.
Figure 3-22: Alternative 3 at Market Street

Section 4: Evaluation Methodology and Results 4-1
CONTENTS1 INTRODUCTION .......................... 4-2
1.1 OVERVIEW ..................................... 4-2
1.2 SUMMARY OF EVALUATION RESULTS ........ 4-2
2 EVALUATION APPROACH AND CRITERIA ........................... 4-42.1 MEASURES OF EVALUATION .................. 4-4
2.2 THREE-STEP MODELING APPROACH ........ 4-4
3 TRANSIT PERFORMANCE ................ 4-63.1 PURPOSE ....................................... 4-6
3.2 METHODOLOGY ............................... 4-6
3.3 FINDINGS ....................................... 4-7
3.4 WORKSHOP FEEDBACK ...................... 4-11
3.5 KEY CONCLUSIONS ........................... 4-11
4 TRANSIT RIDER EXPERIENCE ..........4-134.1 PURPOSE ...................................... 4-13
4.2 METHODOLOGY .............................. 4-13
4.3 FINDINGS ...................................... 4-14
4.4 WORKSHOP FEEDBACK ...................... 4-15
4.5 KEY CONCLUSIONS ........................... 4-15
5 ACCESS AND PEDESTRIAN AMENITIES ...............................4-175.1 PURPOSE ...................................... 4-17
5.2 METHODOLOGY .............................. 4-17
5.3 FINDINGS ...................................... 4-17
5.4 WORKSHOP FEEDBACK ...................... 4-19
5.5 KEY CONCLUSIONS ........................... 4-20
6 URBAN AND LANDSCAPE DESIGN .....4-216.1 PURPOSE ...................................... 4-21
6.2 METHODOLOGY .............................. 4-21
6.3 FINDINGS ...................................... 4-21
6.4 WORKSHOP FEEDBACK ...................... 4-23
6.5 KEY CONCLUSIONS ........................... 4-24
SECTION 4: BRT ALTERNATIVES EVALUATION
VAN NESS AVENUE BRT FEASIBILITY STUDYDECEMBER 2006
7 TRAFFIC OPERATIONS AND PARKING ............................4-257.1 PURPOSE ...................................... 4-25
7.2 METHODOLOGY .............................. 4-25
7.3 FINDINGS ...................................... 4-26
7.4 WORKSHOP FEEDBACK ...................... 4-29
7.5 KEY CONCLUSIONS ........................... 4-31
8 COST .....................................4-328.1 PURPOSE ...................................... 4-32
8.2 METHODOLOGY .............................. 4-32
8.3 FINDINGS ...................................... 4-32
8.4 KEY CONCLUSIONS ........................... 4-32
9 CONSTRUCTION IMPACTS ..............4-339.1 PURPOSE ...................................... 4-33
9.3 FINDINGS ...................................... 4-33
9.4 WORKSHOP FEEDBACK ...................... 4-33
9.5 KEY CONCLUSIONS ........................... 4-34
10 SUMMARY OF RESULTS AND CONCLUSIONS ....................4-3510.1 TRANSIT OPERATIONS A
ND PERFORMANCE ........................... 4-35
10.2 TRANSIT RIDER EXPERIENCE ................ 4-36
10.3 ACCESS AND PEDESTRIAN SAFETY ......... 4-36
10.4 URBAN AND LANDSCAPE DESIGN ........... 4-36
10.5 TRAFFIC OPERATIONS AND PARKING ...... 4-36
10.6 CAPITAL AND OPERATING COSTS ........... 4-37
10.7 CONSTRUCTION IMPACTS ................... 4-37

SAN FRANCISCO COUNTY TRANSPORTATION AUTHORITY: Van Ness BRT Study 4-2
1 Introduction
1.1 OVERVIEW
This section presents the results of the study team’s evaluation of likely benefi ts and impacts of BRT on Van Ness Avenue. The analysis is documented here through ten chapters that describe the alternatives evaluated; the evaluation approach and criteria, the performance of BRT alternatives with respect to transit operations, transit rider experience, access and pedestrian amenities, urban and landscape design, traffi c operations and parking, capital cost, and construction impacts; and a summary of the evaluation results. Key fi ndings that indicate the benefi ts and impacts of BRT relative to the future with no BRT are identifi ed at the end of each chapter.
1.2 SUMMARY OF EVALUATION RESULTS
The key fi ndings of this section are as follows:
Van Ness can accommodate BRT. Several BRT designs are feasible. This means that there are choices about how to implement BRT on Van Ness Avenue.
BRT offers signifi cant transit performance benefi ts. BRT offers signifi cant transit performance benefi ts, encompassing faster travel times, more reliable wait times, more comfortable service, and systemwide performance benefi ts.
All BRT alternatives are expected to provide signifi cant transit performance benefi ts by reducing travel times and increasing reliability. BRT on Van Ness Avenue is expected to improve travel times on Van Ness Avenue by up to 37 percent on its most congested mile, up to 30% total between Mission and Lombard Streets. This would save up to 3,100 hours of transit passenger travel time daily. In addition to these travel time benefi ts, BRT is expected to signifi cantly improve reliability by eliminating most or all confl icts with mixed traffi c, and by streamlining passenger loading and unloading.
Finally, BRT on Van Ness Avenue is part of a network of rapid transit that improves systemwide performance. The transit travel time and reliability improvements of BRT are
•
•
expected to attract growth in new riders as much as 32 percent, reversing the citywide trend toward declining transit mode share. Sixty percent of these new Van Ness BRT riders are likely to be former drivers.
The Center Lane BRT alternatives (Alternative 3, 4, and 5) provide the greatest benefi ts to transit travel times and transit reliability because they are not permeable to mixed traffi c, and effectively eliminate confl icts with vehicles. Alternative 2 is permeable to mixed traffi c, allowing right turns and parallel parking, diminishing the travel time and reliability benefi ts of BRT. Because Alternatives 3, 4, and 5 provide the greatest transit performance benefi ts, they attract the most riders and provide a greater share of benefi ts to low-income households and households without access to a car. Alternative 5 is able to improve the ease of operating transit vehicles by eliminating confl icts with mixed traffi c as well as reducing weaving.
All BRT alternatives improve the transit rider’s experience and provide a new level of service that is distinct from current Muni service. All BRT Alternatives provide transit station platform amenities and safety improvements including lighting, shelters, signage and wayfi nding information, and real-time transit arrival information. The size and shape of the transit station platforms, and the extent to which the transit lanes weave, and the key variables among alternatives in their effect on transit rider experience.
BRT offers benefi ts beyond transit performance. All BRT alternatives improve pedestrian safety and access by reducing pedestrian crossing distances, providing visible crosswalks, and providing a complete set of countdown signals. BRT increases opportunities to create a distinctive identity for the street, upgrade street furniture and lighting, and increase the amount of green space and trees on Van Ness Avenue. The BRT alternatives vary primarily in the size and shape of the center landscaped median; their design of the median pedestrian refuges; and the amount of buffer they provide to pedestrians on the sidewalk.
BRT impacts are relatively minor and can be minimized. All of the BRT alternatives are expected to divert traffi c from Van Ness Avenue to other streets in the corridor and in
•
•
Section 4: Evaluation Methodology and Results 4-3
the city. The magnitude of those diversions and their impact on congestion on parallel streets requires further study. However, this initial analysis suggests that traffi c will continue to fl ow smoothly on Van Ness Avenue itself, and that the volume of traffi c diverted to parallel streets will amount to only about three additional cars per minute (during the peak period). This magnitude of diversions can be easily managed with traffi c signal timing adjustments. The time it takes to drive from Mission Street to Lombard Street is expected to increase by about 1 minute. Two of the four BRT alternatives have designs that result in an increase in the supply of parallel parking on Van Ness Avenue.
BRT on Van Ness is expected to cost between $60-65 Million – signifi cantly less than a subway or light rail project. BRT is expected to reduce operating costs by reducing the amount of time required for a bus to complete its route. Finally, new low-fl oor buses will be procured through Muni’s vehicle replacement cycle.
The BRT alternatives do not have signifi cantly different expected construction impacts. Several strategies to reduce any construction impacts are feasible with all BRT alternatives.
Begin next phase of project development. Several BRT alternatives, including the Curb Lane BRT Alternative, should continue on to the next phase of project development – environmental analysis and preliminary engineering.
•

SAN FRANCISCO COUNTY TRANSPORTATION AUTHORITY: Van Ness BRT Study 4-4
2 Evaluation Approach and Criteria
This section describes the study team’s approach to evaluating alternative BRT designs for Van Ness Avenue, including the measures of evaluation and corresponding methodologies.
2.1 MEASURES OF EVALUATION
The following chapters document the results of the study team’s evaluation of benefi ts and impacts of each BRT alternative. The alternative BRT concepts are evaluated against a set of seven evaluation measures. Four of the seven measures capture expected project benefi ts, while three address potential impacts or constraints:
Benefi tsTransit operations and performance
Transit rider experience
Access and pedestrian amenity
Urban and landscape design
Impacts/ConstraintsTraffi c operations and parking
Capital and operating costs
Construction impacts
Some evaluation measures are qualitative and others are quantitative. The primary sources of data for evaluating BRT performance include:
San Francisco’s Countywide Travel Demand Forecasting model (SF-CHAMP)
Synchro traffi c operations model
VISSIM traffi c and transit micro-simulation model
Conceptual engineering designs
Data on the performance of other BRT systems around the world
Stakeholder and community outreach
The models used for this study (VISSIM, SF-CHAMP, and Synchro) are described in more detail in the next section. A table describing the evaluation measures and subcriteria is provided in Appendix 17.
•
•
•
•
•
•
•
•
•
•
•
•
•
2.2 THREE-STEP MODELING APPROACH
Many key aspects of BRT performance are assessed using a three-step approach to modeling transportation conditions, summarized in Figure 4-1. The three key models used are:
San Francisco’s Countywide Travel Demand Forecasting model (CHAMP)
Synchro traffi c operations model
VISSIM traffi c and transit micro-simulation model
Figure 4-1: Three-Step BRT Modeling Process
2.2.1 San Francisco Countywide Travel Demand Forecasting Model (SF-CHAMP)
The Authority’s travel demand forecasting model (SF-CHAMP) forecasts how changes in land use, roadway networks, and transit networks are likely to affect travel demand in San Francisco. Complete documentation of SF-CHAMP is included as Appendix 3. Key inputs to the model include:
Expected changes to land use, in terms of number of jobs, households, and employed residents
Estimates of future travel demand from outside San Francisco
Known future roadway network modifi cations, taking into account major roadway projects (such as Octavia Boulevard) as well as all planned changes to Van Ness Avenue and parallel streets
Planned future transit network modifi cations, including changes to bus routes and the addition of major projects such as the Third Street light-rail line
An SF-CHAMP model for the year 2010 without BRT (the “No Project” alternative) was created in addition to SF-CHAMP models for the other
•
•
•
•
•
•
•

Section 4: Evaluation Methodology and Results 4-5
four alternatives. The SF-CHAMP modeling yields the following information:
Changes in numbers of travelers and vehicles on Van Ness and parallel streets
Changes in the proportion of people walking or bicycling
Changes in transit ridership on each route in the Van Ness corridor
Changes in the origins and destinations of travelers in cars and on transit
2.2.2 Synchro Traffi c Operations Model
MTA operates a Synchro traffi c operations model that covers much of the city. Complete documentation of the Synchro model is included as Appendix 6. This model focuses on intersections, since in urban areas, the smoothness of travel at intersections is a key factor in congestion. Synchro assesses how well intersections serve expected numbers of vehicles, and estimates the delays caused at intersections. It also models how changes to signal timing and intersection geometry (the presence of turn pockets, for example) affect intersection operation. Inputs to the Synchro model include:
The roadway confi guration of the corridor
Expected vehicle volumes, including on parallel streets
Number, length, and type of turn pockets
The signal timing plan
The Synchro model outputs that are used for evaluation include:
Queues of vehicles waiting at traffi c lights
The average amount of delay to vehicles at each intersection
An overall metric for the performance of the intersection, called a “level of service” (LOS) grade
•
•
•
•
•
•
•
•
•
•
•
•
2.2.3 VISSIM Micro-Simulation Model
Results from the SF-CHAMP and Synchro models are used as inputs to this third modeling step. Documentation of the VISSIM model is included as Appendix 18. Unlike SF-CHAMP, VISSIM simulates the individual behavior of pedestrians, drivers, and transit riders at each intersection. Unlike Synchro, VISSIM distinguishes between people in vehicles, on transit, and on the sidewalk, and is also able to model transit signal priority – each instance that a bus triggers an extended green light as it approaches an intersection. Key inputs to the VISSIM model include:
Numbers of people on buses, walking, and driving
Movements made by each vehicle at an intersection (e.g., turn left or right, or go through)
Signal timing and locations where signal priority is permitted
The outputs from the VISSIM modeling include:
Transit, truck, and car travel times
Transit reliability
Delay at intersections for people, whether traveling by car, by bus, or on foot.
•
•
•
•
•
•
•
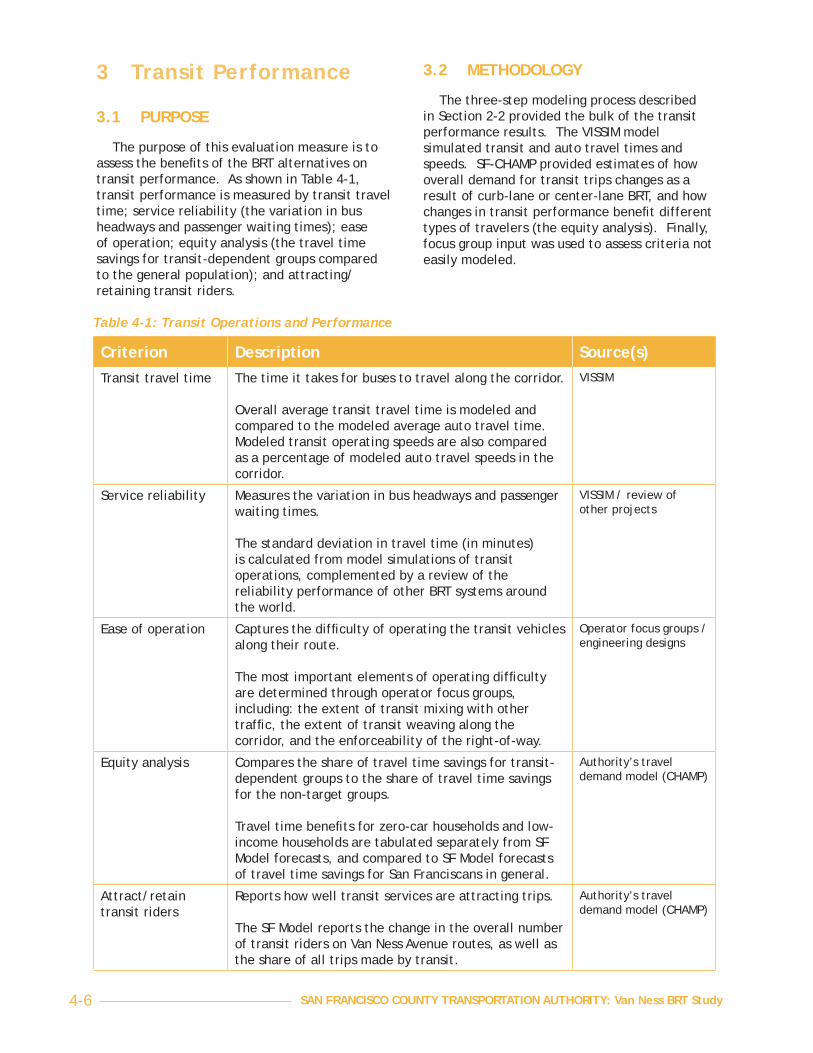
SAN FRANCISCO COUNTY TRANSPORTATION AUTHORITY: Van Ness BRT Study 4-6
3 Transit Performance
3.1 PURPOSE
The purpose of this evaluation measure is to assess the benefi ts of the BRT alternatives on transit performance. As shown in Table 4-1, transit performance is measured by transit travel time; service reliability (the variation in bus headways and passenger waiting times); ease of operation; equity analysis (the travel time savings for transit-dependent groups compared to the general population); and attracting/retaining transit riders.
3.2 METHODOLOGY
The three-step modeling process described in Section 2-2 provided the bulk of the transit performance results. The VISSIM model simulated transit and auto travel times and speeds. SF-CHAMP provided estimates of how overall demand for transit trips changes as a result of curb-lane or center-lane BRT, and how changes in transit performance benefi t different types of travelers (the equity analysis). Finally, focus group input was used to assess criteria not easily modeled.
Table 4-1: Transit Operations and Performance
Criterion Description Source(s)Transit travel time The time it takes for buses to travel along the corridor.
Overall average transit travel time is modeled and compared to the modeled average auto travel time. Modeled transit operating speeds are also compared as a percentage of modeled auto travel speeds in the corridor.
VISSIM
Service reliability Measures the variation in bus headways and passenger waiting times.
The standard deviation in travel time (in minutes) is calculated from model simulations of transit operations, complemented by a review of the reliability performance of other BRT systems around the world.
VISSIM / review of other projects
Ease of operation Captures the diffi culty of operating the transit vehicles along their route.
The most important elements of operating diffi culty are determined through operator focus groups, including: the extent of transit mixing with other traffi c, the extent of transit weaving along the corridor, and the enforceability of the right-of-way.
Operator focus groups / engineering designs
Equity analysis Compares the share of travel time savings for transit-dependent groups to the share of travel time savings for the non-target groups.
Travel time benefi ts for zero-car households and low-income households are tabulated separately from SF Model forecasts, and compared to SF Model forecasts of travel time savings for San Franciscans in general.
Authority’s travel demand model (CHAMP)
Attract/retain transit riders
Reports how well transit services are attracting trips.
The SF Model reports the change in the overall number of transit riders on Van Ness Avenue routes, as well as the share of all trips made by transit.
Authority’s travel demand model (CHAMP)

Section 4: Evaluation Methodology and Results 4-7
3.3 FINDINGS
3.3.1 Transit Travel Times
BRT on Van Ness A is estimated to improve transit travel time signifi cantly compared to the future No Project alternative. Over the completed two-mile corridor from Mission to Lombard, a 30 percent reduction in total transit travel time is expected. In the stretch between Mission and Post, a 37 percent travel time savings is expected. This improvement in travel time amounts to up to six minutes saved each trip, or between 2,600-3,100 hours of transit passenger travel time daily. The transit trip time from Mission to Lombard is reduced from over 19 minutes to under 14 minutes.
No travel time improvements are expected for transit in Alternative 1, the No Project scenario.
Transit speeds are further impeded by slight mixed-traffi c increases in the future, and bus travel times will be longer than they are today in the absence of a BRT project.
Alternative 2, Curb Lane BRT, improves transit travel time by 24 percent on average from Mission to Lombard, whereas Alternatives 3-5 improve transit travel times by at least 30 percent over that two-mile stretch.
These travel time savings are consistent with the improvements experienced by other BRT systems worldwide. BRT projects in other US cities have reduced travel times anywhere from 11 to 35 percent.
Alternative Travel Time2010 No Project
Without BRT, transit travel time takes almost 2 times as long as auto.
Transit travel time from Mission to Lombard is 19.4 minutes.
Curbside BRT Transit travel times improve 24% from Mission to Lombard
About 2,600 hours saved for transit riders daily
Transit travel time from Mission to Lombard is 14.9 minutes.
Center-side BRT
Transit travel times improve 30% from Mission to Lombard
About 3,100 hours saved for transit riders daily
Transit travel time from Mission to Lombard is 13.5 minutes.
Figure 4-2: Transit Travel Time Results

SAN FRANCISCO COUNTY TRANSPORTATION AUTHORITY: Van Ness BRT Study 4-8
3.3.2 Service Reliability
All BRT alternatives improve the reliability of transit service along Van Ness Avenue from Mission to Lombard by reducing confl icts with mixed traffi c and streamlining passenger loading and unloading. Under Alternative 1, buses remain subject to delays caused by operating in mixed traffi c and show no improvements to reliability.
Alternatives 3, 4, and 5 provide the greatest reliability improvements for transit by eliminating confl icts with mixed traffi c and streamlining passenger loading and unloading. Alternative 2 remains subject to some mixed-traffi c delays caused by cars parking and making right turns across the bus lane, and does not improve reliability as much as do the Alternatives 3-5. Because the center-running BRT alternatives have exclusive bus lanes that are not permeable to mixed traffi c, they are not susceptible to these delays, and show the greatest improvements to service reliability.
Alternative Transit Travel Time
Auto Travel Time
2010 No Project
19.4 minutes 11.2 minutes
Curbside BRT
14.9 minutes 11.2 minutes
Center-side BRT
13.5 minutes 11.5 minutes
Figure 4-3: Transit/Auto Travel Times from Mission to Lombard
Alternative Reliability2010 No Project
Increased congestion
Curbside BRT Reduces some confl icts with cars
Remaining confl icts with right-turning and parking cars
Center-side BRT
All confl icts with cars removed
Figure 4-4: Reliability Results
Section 4: Evaluation Methodology and Results 4-9
3.3.3 Ease of Operation
All BRT alternatives improve the ease of operating buses by reducing confl icts with traffi c and eliminating the need for buses to pull in and out of traffi c at bus stops.
Alternative 2 does not remove this problem entirely; buses must weave around parking and right-turning vehicles, as well as around cars that use the bus lane illegally.
Alternatives 3 and 4 are physically separated from mixed traffi c by landscaped medians or a low curb, which improves operations. However, Alternative 3 may present problems in removing disabled buses from the bus lanes in the event of a breakdown, and both designs require some weaving of the transit lanes around left-turn pockets and station platforms.
Alternative 5 provides the greatest total improvement to transit operations because its design includes very little weaving along the corridor, making the route easier and safer for bus operators to navigate.
3.3.4 Equity Analysis
A number of steps in the planning process are intended to advance projects with an equitable distribution of benefi ts and impacts. Broad participation by stakeholders as early as possible helps to ensure that concerns about project design and impacts, as well as about distribution of project benefi ts, are addressed effectively in the design process.
The Van Ness corridor passes through a diverse set of neighborhoods ranging from very low income to very high income. Moreover, 46 percent of households in the corridor do not own cars. The following evaluation measure captures
the degree to which low-income households and households without a car benefi t from BRT on Van Ness relative to households that aren’t low income and that have access to a car.
The SF-CHAMP model can calculate transportation outcomes for different groups of people, such as low-income or zero-car households. To measure the equity of a BRT investment on Van Ness Avenue, the study team measured the share of project benefi ts that would accrue to low-income and zero-car households, as well as the share of project benefi ts that would accrue to households that aren’t low income and that have access to a car. An equitable project is one that benefi t “target” and ”non-target” populations proportionately.
Figure 4-5 reports how BRT project benefi ts accrue to target and non-target populations. The measures were calculated by dividing the share of total travel time savings from BRT that accrue to each group by the share of that group in the population of San Francisco (see Appendix 4 for more details). A result of one is a perfectly equitable result, meaning that the project benefi ts the group in exact proportion to that group’s share of the total population; a result less than one means that the group gets disproportionately less benefi t from the project; and a result greater than one means that the group accrues disproportionately more of the project benefi ts.
The evaluation shows that a disproportionate share of the BRT benefi ts on Van Ness go to low-income and zero-car households. Although all BRT alternatives disproportionately benefi t these target households, Alternatives 3, 4, and 5 provide greater benefi ts to these populations than does Alternative 2, a consequence of the superior transit performance of the center-running BRT lanes.
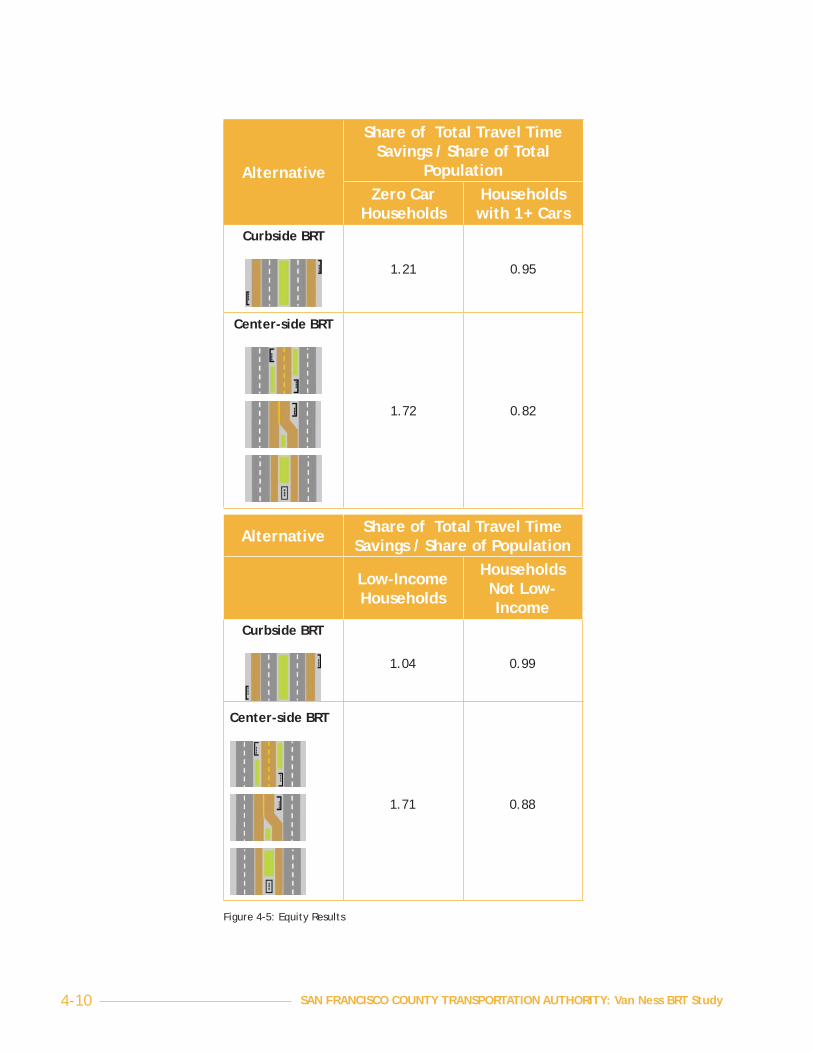
SAN FRANCISCO COUNTY TRANSPORTATION AUTHORITY: Van Ness BRT Study 4-10
Alternative
Share of Total Travel Time Savings / Share of Total
PopulationZero Car
HouseholdsHouseholds with 1+ Cars
Curbside BRT
1.21 0.95
Center-side BRT
1.72 0.82
Alternative Share of Total Travel Time Savings / Share of Population
Low-Income Households
Households Not Low-Income
Curbside BRT
1.04 0.99
Center-side BRT
1.71 0.88
Figure 4-5: Equity Results

Section 4: Evaluation Methodology and Results 4-11
3.3.5 Attract and Retain Transit Riders
By 2010, without BRT improvements, transit ridership on Van Ness Avenue routes will drop by about two percent. This is the consequence of worsening transit performance if no measures are taken to speed travel times and improve reliability. The improved transit travel times that result from Alternative 2 are expected to increase ridership on the Van Ness Avenue routes by 16 percent relative compared to the No Project scenario. Alternatives 3, 4, and 5 improve transit performance more than Alternative 2, and therefore are expected to attract additional ridership. Relative to the No Project alternative, ridership on Alternatives 3, 4, and 5 will increase by 23 percent. Sixty percent of these expected new riders are former drivers. The rest previously either made their trip using a different transit route or by walking.
3.4 WORKSHOP FEEDBACK
At public workshops hosted by the Authority in October 2006, participants were asked questions about their views on Van Ness BRT in small groups. Participants gave their reasons for attending the workshop and described their views of the potential benefi ts and potential negative impacts of BRT. The small discussion groups were followed by a question-and-answer session. The complete summary of workshop results is included as Appendix 19.
Service quality was a common theme. Faster and more reliable service was mentioned most frequently as the key benefi t of BRT. Participants also hoped to see more frequent service and a reduction in bus bunching. Some participants expected BRT on Van Ness Avenue to increase transit ridership and wanted to see an upgraded fl eet of buses as part of the project. Workshop participants were enthusiastic about the prospect of removing some bus stops, though participants wanted to ensure that high-volume stops and stops serving key land uses would be retained.
Some workshop participants noted that left-turning vehicles could slow buses, as would the use of bus lanes by other transit lines, emergency vehicles, and tour buses. Participants were also concerned about the transition between BRT lanes and regular lanes as buses entered and exited the BRT portion of Van Ness. Some participants were unconvinced that Muni’s current bus fl eet would be able to deliver the benefi ts of BRT. Workshop participants recommended that the Authority study further the relationship between BRT on Van Ness routes and changes in other transit lines.
3.5 KEY CONCLUSIONS
The following table summarizes the evaluation of transit operations and performance.
Alternative Ridership2010 No Project
-2.2% (relative to 2005)
Curbside BRT +16% (relative to No Project)
Center-side BRT
+23% (relative to No Project)
Figure 4-6: Ridership Results

SAN FRANCISCO COUNTY TRANSPORTATION AUTHORITY: Van Ness BRT Study 4-12
AlternativeTransit Travel Times
Service Reliability
Ease of Operation Equity
Attract and Retain
Transit Riders
No Project
Curbside BRT
Center-side BRT (two medians)
Center-side BRT (one median)
Center-side BRT (center medians)
Figure 4-7: Transit Operations and Performance Scoring

Section 4: Evaluation Methodology and Results 4-13
4 Transit Rider Experience
4.1 PURPOSE
The purpose of this evaluation is to measure the benefi ts of the BRT alternatives on transit rider experience. Transit rider experience is measured by the quality of the waiting and boarding experience; quality of the in-vehicle experience; wayfi nding ability; safety and security of waiting riders; and the ability to brand a unique identify for the BRT transit route. Table 4-2 below describes the sub-criteria that measure transit rider experience.
4.2 METHODOLOGY
Transit rider experience is measured both qualitatively and quantitatively. Conceptual engineering drawings are the source of estimates for bus weaving, platform capacity, and the buffers between cars and waiting passengers. The SF-CHAMP model provides information on bus crowding. Branding, marketing, the quality of the station platform amenities, and security are assessed qualitatively.
Table 4-2: Transit Rider Experience
Criterion Description Source(s)Quality of waiting and boarding experience
Captures the quality of the passenger waiting and boarding experience.
Street layout and geometry are reviewed to determine the effects of the designs on the reliability of transit service, the width of platforms, and buffers between waiting passengers and auto traffi c.
Engineering designs – quantitative
Design charrettes – qualitative
Quality of in-vehicle experience
Captures the quality of the ride on transit from the passenger’s perspective.
Street layout and geometry are reviewed to assess the effects of the designs on how much buses have to weave along their route and the distance that buses have to travel in mixed traffi c. The Authority’s travel demand model provides forecasts of how full buses will be at their peak load points.
Engineering designs – quantitative
Authority travel demand model (CHAMP)
Wayfi nding ability Captures how visible and legible transit routes and information will be to potential riders.
Street and transit station platform layout and geometry are reviewed to assess how the designs affect the quality and level of information given to passengers, and the ease of transferring from the Van Ness Avenue service to other intersecting routes.
Engineering designs – qualitative
Design charrettes – qualitative
Security of waiting riders
Captures the level of perceived safety and security for waiting passengers.
Street and transit station platform layout and geometry are reviewed to assess the visibility of waiting passengers to other passengers and to people occupying nearby buildings.
Engineering designs – qualitative
Design charrettes – qualitative
BRT transit route branding / identity
Captures the distinctiveness of transit as a special service and the distinctiveness of the entire street.
Street and transit station platform layout and geometry are reviewed to assess the opportunities for unique and distinctive design treatments, the ability to establish consistent design themes and patterns, and the opportunities for raising the visibility of transit service.
Engineering designs – qualitative
Design charrettes – qualitative
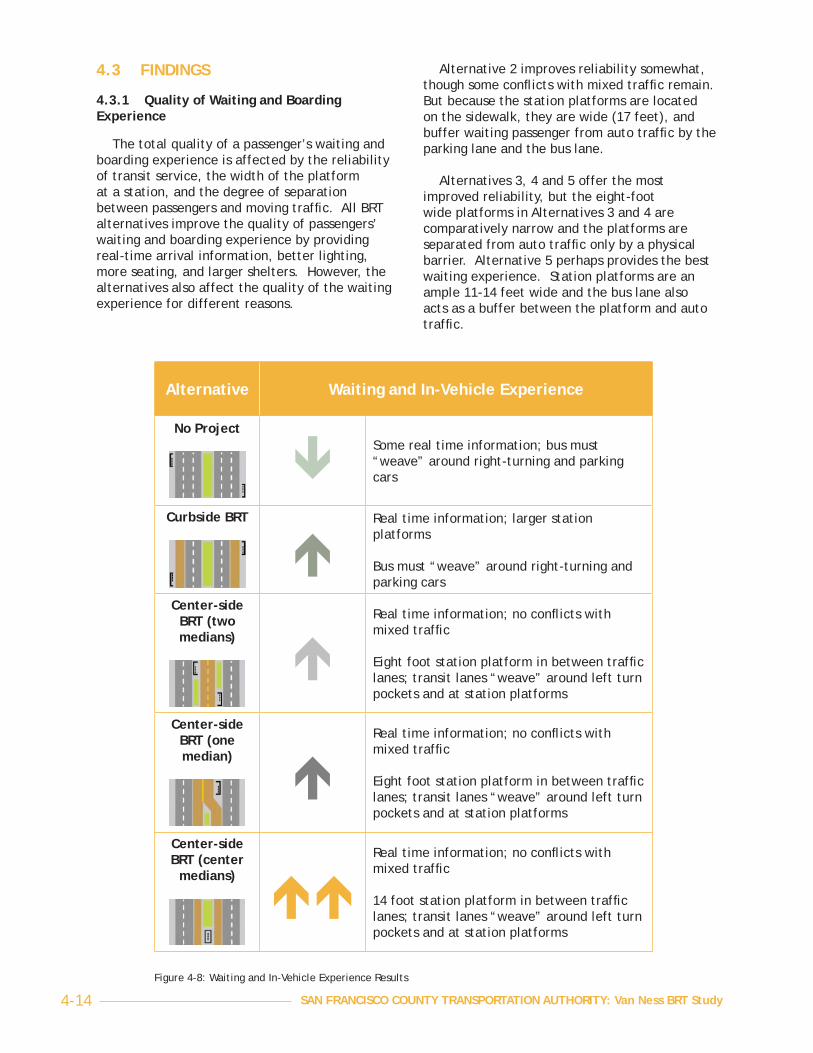
SAN FRANCISCO COUNTY TRANSPORTATION AUTHORITY: Van Ness BRT Study 4-14
4.3 FINDINGS
4.3.1 Quality of Waiting and Boarding Experience
The total quality of a passenger’s waiting and boarding experience is affected by the reliability of transit service, the width of the platform at a station, and the degree of separation between passengers and moving traffi c. All BRT alternatives improve the quality of passengers’ waiting and boarding experience by providing real-time arrival information, better lighting, more seating, and larger shelters. However, the alternatives also affect the quality of the waiting experience for different reasons.
Alternative 2 improves reliability somewhat, though some confl icts with mixed traffi c remain. But because the station platforms are located on the sidewalk, they are wide (17 feet), and buffer waiting passenger from auto traffi c by the parking lane and the bus lane.
Alternatives 3, 4 and 5 offer the most improved reliability, but the eight-foot wide platforms in Alternatives 3 and 4 are comparatively narrow and the platforms are separated from auto traffi c only by a physical barrier. Alternative 5 perhaps provides the best waiting experience. Station platforms are an ample 11-14 feet wide and the bus lane also acts as a buffer between the platform and auto traffi c.
Alternative Waiting and In-Vehicle Experience
No ProjectSome real time information; bus must “weave” around right-turning and parking cars
Curbside BRT Real time information; larger station platforms
Bus must “weave” around right-turning and parking cars
Center-side BRT (two medians)
Real time information; no confl icts with mixed traffi c
Eight foot station platform in between traffi c lanes; transit lanes “weave” around left turn pockets and at station platforms
Center-side BRT (one median)
Real time information; no confl icts with mixed traffi c
Eight foot station platform in between traffi c lanes; transit lanes “weave” around left turn pockets and at station platforms
Center-side BRT (center
medians)
Real time information; no confl icts with mixed traffi c
14 foot station platform in between traffi c lanes; transit lanes “weave” around left turn pockets and at station platforms
Figure 4-8: Waiting and In-Vehicle Experience Results

Section 4: Evaluation Methodology and Results 4-15
4.3.2 Quality of In-Vehicle Experience
The quality of the in-vehicle riding experience is a function of the smoothness (or jerkiness) of the ride and of crowding on the buses. Alternatives 3 and 5 provide the best in-vehicle experience because these alternatives operate separately from mixed traffi c and have moderate to minimal weaving along the corridor, allowing for a smoother passenger ride. Alternatives 2 and 4 involve more weaving of the buses due to either the design itself (Alternative 4) or the need to avoid parking and left-turning vehicles (Alternative 2), both of which reduce passenger comfort.
4.3.3 Wayfi nding
Each BRT alternative provides additional signage to improve general transit wayfi nding and the transfer experience in particular. Providing consistent wayfi nding is simplest in Alternative 5 because the same platform is used for travel in both directions.
4.3.4 Sense of Security for Waiting Riders
BRT station platforms improve security for waiting passengers by providing closed-caption TV monitoring, better lighting, and real-time arrival information. Proof-of-payment zones will be enforced on station platforms. Riders using the system under any of the alternatives will benefi t from a combination of informal surveillance by other riders and physical platform separation from the roadway. Alternatives 2 and 5 might provide an additional perception of security to waiting passengers because they either allow for more passengers on the station platform (Alternative 5) or allow passengers to wait on the sidewalk, with easy access to adjacent land uses (Alternative 2).
4.3.5 BRT Transit Route Branding/Identity
This sub-criterion measures the ability of a design to be recognized by the general public as a high-quality and rapid service.
Although each BRT alternative features colored transit lanes to discourage mixed traffi c, Alternative 2 has a diluted appearance as rapid transit by allowing cars to travel in the bus lane to turn right or park. Moreover, because they are adjacent to the sidewalk, the station platforms in Alternative 2 may be identifi ed with the sidewalk environment rather than with
transit service.
Alternatives 3, 4, and 5 provide the best branding opportunity and strongest identity for BRT because the bus lanes are physically separated from auto lanes, reinforcing their identity as rapid transit. The location of station platforms in the center of the roadway offers the ability to design them uniquely to help advertise the BRT service and coordinate their design with station platforms associated with Geary BRT at the O’Farrell intersection. The width of the station platforms permitted by Alternative 5 creates the opportunity to design signature platforms at Market Street and at City Hall.
4.4 WORKSHOP FEEDBACK
At public workshops hosted by the Authority in October 2006, participants had the opportunity to provide feedback on the Van Ness BRT alternatives evaluation. Many comments addressed the transit rider experience. A complete summary of the workshop input is included as Appendix 19.
Workshop participants hoped that BRT would enhance the rider experience by providing low-boarding technology to make it easier for seniors and others to board the bus. Participants supported NextBus and external fare-vending machines. Some participants said that BRT on Van Ness would increase the safety of transit riders waiting for the bus.
While some participants expected BRT to reduce crowding on buses, others expressed the concern that BRT could make buses more crowded. Some participants noted that rider and motorist education would be important for the success of the project but potentially challenging and recommended that the Authority develop a marketing plan. Participants also recommended that the Authority further study the costs and benefi ts of ticket-vending machines on transit performance.
4.5 KEY CONCLUSIONS
The following table summarizes the evaluation results of each alternative on transit rider experience.
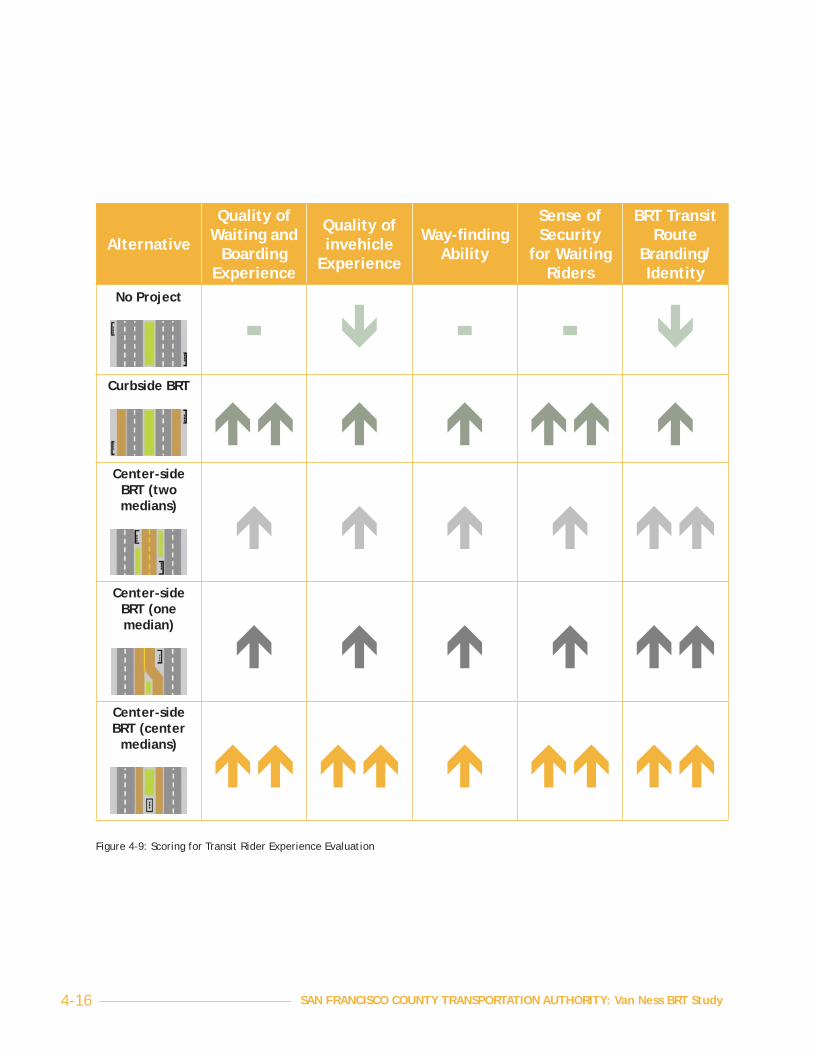
SAN FRANCISCO COUNTY TRANSPORTATION AUTHORITY: Van Ness BRT Study 4-16
Alternative
Quality of Waiting and
Boarding Experience
Quality of invehicle
Experience
Way-fi nding Ability
Sense of Security
for Waiting Riders
BRT Transit Route
Branding/Identity
No Project
Curbside BRT
Center-side BRT (two medians)
Center-side BRT (one median)
Center-side BRT (center
medians)
Figure 4-9: Scoring for Transit Rider Experience Evaluation

Section 4: Evaluation Methodology and Results 4-17
5 Access and Pedestrian Amenities
5.1 PURPOSE
The purpose of this evaluation is to measure the benefi ts of BRT on pedestrian safety and conditions. Access and pedestrian amenities are measured by the street-crossing experience and sidewalk conditions (including safety and comfort for pedestrians); quality of bicycle access (including safety and comfort for bicyclists); and increased employment, retail and consumer accessibility for neighborhoods (the increase in work and shopping opportunities available by transit).
5.2 METHODOLOGY
Much of the evaluation results for this measure were assessed through review of the conceptual engineering drawings prepared for each alternative. The VISSIM microsimulation
model contributed traffi c speed results and CHAMP measured changes in economic opportunities as a result of BRT.
5.3 FINDINGS
5.3.1 Crossing Experience
All BRT alternatives improve the pedestrian crossing experience by installing visible crosswalks and a complete set of countdown signals, as well as increasing the amount of time pedestrians have to cross Van Ness and reducing average crossing distances.
Each alternative reduces average crossing distances for pedestrians by adding curb bulb-outs at many locations. Where bulb-outs are added, crossing distance is reduced by eight feet. Alternative 5 reduces average pedestrian crossing distances the most: from the existing 91.3 feet to 82 feet. Alternative 2 reduces average crossing distance to 83 feet and Alternatives 2 and 4 reduce the average distance to 83.3 feet.
Table 4-3: Access and Pedestrian Amenities
Criterion Description Source(s)
Crossing experience
Measures safety and comfort for pedestrians crossing Van Ness.
Street and transit station platform layout and geometry are reviewed to calculate the number of traffi c lanes pedestrians must cross before reaching a refuge; the width of pedestrian islands; and average crossing distances.
Engineering designs – quantitative
Signal timing plan
Sidewalk conditions
Measures safety and comfort for pedestrians on the sidewalks.
Street and transit station platform layout and geometry are reviewed to calculate the width of the sidewalks under each alternative and whether there are buffers between the sidewalk and moving traffi c (e.g., a parking lane). The speed of traffi c moving adjacent to the sidewalk is measure through the VISSIM micro-simulation model.
VISSIM micro-simulation model
Engineering designs - quantitative
Quality of bicycle access
Measures the safety and comfort for bicyclists riding in the corridor.
Street layout and geometry are reviewed to measure the space available for bicyclists to navigate corridor streets, including the width of the vehicle lane next to parking lanes.
Engineering designs – quantitative
Increased employment, retail and consumer accessibility for neighborhoods
Captures the increase in work and shopping opportunities available by transit.
SF Model forecasts the change in the number of jobs, retail opportunities, and potential customers reachable within a 30 minute transit trip, relative to a 30 minute car trip.
Authority’s travel demand model (CHAMP)

SAN FRANCISCO COUNTY TRANSPORTATION AUTHORITY: Van Ness BRT Study 4-18
The BRT alternatives vary in the design of their median pedestrian refuges and in the number of traffi c lanes that pedestrians must cross before reaching a refuge. Alternative 2 increases the median pedestrian refuge by two feet and eliminates all locations on Van Ness where pedestrians currently must cross more than four lanes of traffi c before reaching a refuge. Alternatives 3 and 4 decrease the average refuge width by three feet. Alternatives 3, 4, and 5 increase the number of locations where pedestrians must cross more than four lanes of traffi c before reaching a refuge by 14, eight, and fi ve locations respectively.
5.3.2 Sidewalk Conditions
All BRT alternatives improve sidewalk conditions on Van Ness through pedestrian-scale street lighting and improved landscaping. Alternative 2 provides an extensive buffer between pedestrians on the sidewalk and moving traffi c through the 12-foot bus lane and either an eight-foot parking lane or a station platform. Although Alternatives 3 and 4 preserve Van Ness Avenue’s wide sidewalks, some blocks lose the parallel parking, losing the buffer between pedestrians and moving auto traffi c.
Alternative Crossing Experience and Sidewalk Conditions
No Project Long crossing distance; few countdown signals
Parallel parking buffers peds from traffi c
Curbside BRTReduced crossing distance; countdown signals; larger median refuges; parallel parking increased; bus bulbs widen sidewalk
Center-side BRT (two medians) Reduced crossing distance;
countdown signals
Parallel parking reduced
Center-side BRT (one median) Reduced crossing distance;
countdown signals
Parallel parking reduced
Center-side BRT (center medians) Reduced crossing distance;
countdown signals larger median refuges; parallel parking increased
Figure 4-10: Results for Crossing Experience and Sidewalk Conditions
Section 4: Evaluation Methodology and Results 4-19
5.3.3 Quality of Bicycle Access
All BRT alternatives benefi t cyclists by lowering traffi c volumes on Van Ness. Alternative 2 presents a drawback to cyclists riding on Van Ness by requiring them to cross the bus lane to make a right turn, as it requires regular mixed-traffi c to do. Under all alternatives, Polk Street continues to function as the best bicycle route through the study area.
5.3.4 Increased Employment and Retail Accessibility for Neighborhoods
Alternative 1, the No Project scenario, does not contribute to expanded accessibility on transit to job and shopping opportunities. Van Ness transit reaches about ¾ of the shopping and work opportunities that can be reached within a half hour by car (70 percent and 82.2 percent of total opportunities available by car, respectively).
All BRT alternatives increase the numbers of jobs and shopping opportunities that can be accessed by transit, and help to close the accessibility gap between transit and cars. Alternative 2 increases the number of shopping and job opportunities accessible by transit to 72.4 percent and 83.2 percent of the number of opportunities available by car, respectively.
Because Alternatives 3, 4, and 5 increase transit travel times the most, they increase transit accessibility to shopping and work by the greatest amounts, bringing the number of shopping and job opportunities to 74.1 percent and 84.3 percent of those available by auto, respectively.
5.4 WORKSHOP FEEDBACK
At public workshops hosted by the Authority in October 2006, citizens had the opportunity to provide feedback on the Van Ness BRT alternatives evaluation. In their comments, some participants addressed access and pedestrian amenities. A complete summary of the workshop is included as Appendix 19.
Many workshop participants expressed concern about BRT’s effect on pedestrian safety, since pedestrians would have to cross several lanes of traffi c to access the station platforms. However, some participants also stated that a BRT project would have a positive effect on Van Ness aesthetically. The potential for jaywalking was also noted as a concern, and participants recommended that the Authority study ways to minimize potential jaywalking between station platforms and the sidewalks.
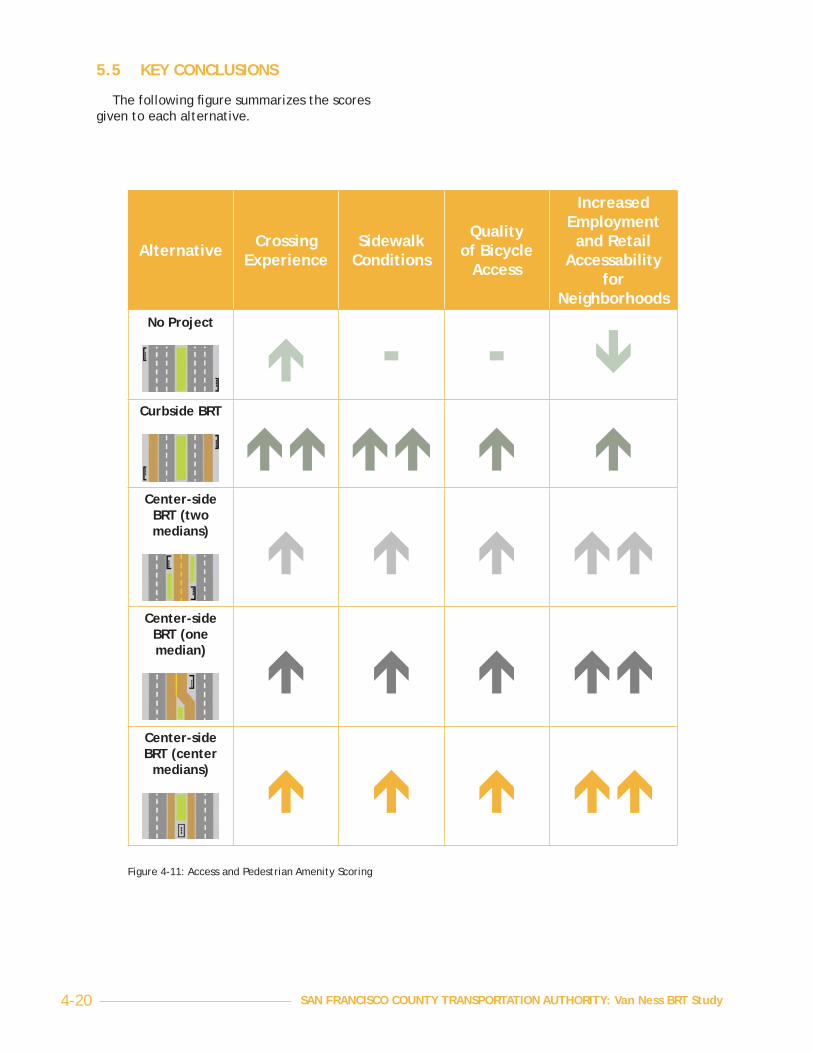
SAN FRANCISCO COUNTY TRANSPORTATION AUTHORITY: Van Ness BRT Study 4-20
5.5 KEY CONCLUSIONS
The following fi gure summarizes the scores given to each alternative.
Alternative Crossing Experience
Sidewalk Conditions
Quality of Bicycle
Access
Increased Employment and Retail
Accessability for
NeighborhoodsNo Project
Curbside BRT
Center-side BRT (two medians)
Center-side BRT (one median)
Center-side BRT (center
medians)
Figure 4-11: Access and Pedestrian Amenity Scoring
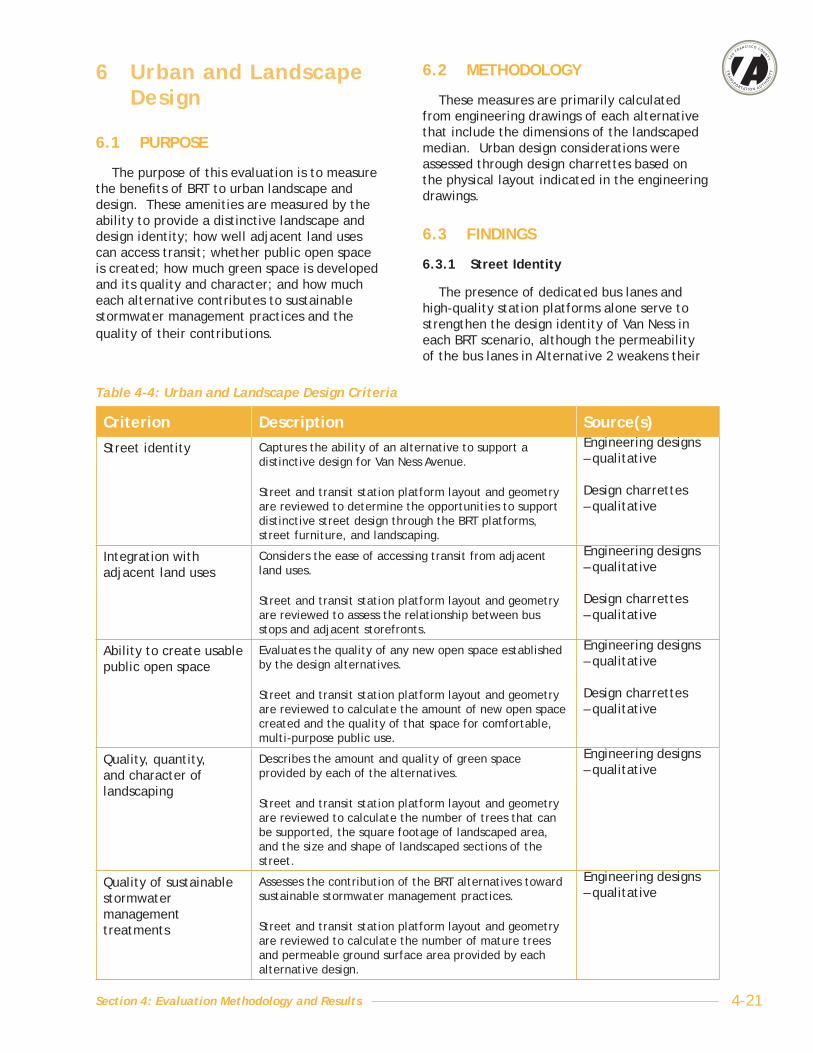
Section 4: Evaluation Methodology and Results 4-21
6 Urban and Landscape Design
6.1 PURPOSE
The purpose of this evaluation is to measure the benefi ts of BRT to urban landscape and design. These amenities are measured by the ability to provide a distinctive landscape and design identity; how well adjacent land uses can access transit; whether public open space is created; how much green space is developed and its quality and character; and how much each alternative contributes to sustainable stormwater management practices and the quality of their contributions.
6.2 METHODOLOGY
These measures are primarily calculated from engineering drawings of each alternative that include the dimensions of the landscaped median. Urban design considerations were assessed through design charrettes based on the physical layout indicated in the engineering drawings.
6.3 FINDINGS
6.3.1 Street Identity
The presence of dedicated bus lanes and high-quality station platforms alone serve to strengthen the design identity of Van Ness in each BRT scenario, although the permeability of the bus lanes in Alternative 2 weakens their
Table 4-4: Urban and Landscape Design Criteria
Criterion Description Source(s)Street identity Captures the ability of an alternative to support a
distinctive design for Van Ness Avenue.
Street and transit station platform layout and geometry are reviewed to determine the opportunities to support distinctive street design through the BRT platforms, street furniture, and landscaping.
Engineering designs – qualitative
Design charrettes – qualitative
Integration with adjacent land uses
Considers the ease of accessing transit from adjacent land uses.
Street and transit station platform layout and geometry are reviewed to assess the relationship between bus stops and adjacent storefronts.
Engineering designs – qualitative
Design charrettes – qualitative
Ability to create usable public open space
Evaluates the quality of any new open space established by the design alternatives.
Street and transit station platform layout and geometry are reviewed to calculate the amount of new open space created and the quality of that space for comfortable, multi-purpose public use.
Engineering designs – qualitative
Design charrettes – qualitative
Quality, quantity, and character of landscaping
Describes the amount and quality of green space provided by each of the alternatives.
Street and transit station platform layout and geometry are reviewed to calculate the number of trees that can be supported, the square footage of landscaped area, and the size and shape of landscaped sections of the street.
Engineering designs – qualitative
Quality of sustainable stormwater management treatments
Assesses the contribution of the BRT alternatives toward sustainable stormwater management practices.
Street and transit station platform layout and geometry are reviewed to calculate the number of mature trees and permeable ground surface area provided by each alternative design.
Engineering designs – qualitative

SAN FRANCISCO COUNTY TRANSPORTATION AUTHORITY: Van Ness BRT Study 4-22
design impact somewhat. All BRT alternatives also include at least one signature station unifi ed with other major transit routes (at Market), and the center-running alternatives also include an additional unifi ed station at O’Farrell. Alternatives 2, 3, and 5 provide for a strong linear axis with consistent central medians, as well as a new gateway median from Mission to Market. Because the median in Alternative 4 weaves and narrows at many points, it results in a weaker design impact. Alternative 5 provides the greatest opportunity for establishing a distinctive identity for Van Ness Avenue with its large, combined-platform stations and the potential for additional unifi ed stations at the Jackson/Pacifi c and Vallejo/Green intersections.
6.3.2 Integration with Adjacent Land Uses
Alternative 2 is the most directly integrated with adjacent Van Ness land uses because pedestrians walking along the sidewalk can easily stop and wait for a bus without crossing any travel lanes.
One key advantage of Alternative 5, Center-Side (Center Median), is the opportunity it provides through the unifi ed station platforms for three block-long stations, which connect more seamlessly with land uses at each corner where stops are located. Center Alternatives 3 and 4 have just one block-long station. It should be noted that the southbound station platform nearest the proposed hospital at Geary/Post is
Alternative Landscaping Opportunities
No ProjectStrong center median; 89 median trees; 51,000 s.f. planted area
Curbside BRTStrong center median; 200 median trees; 94,000 s.f. planted area
Center-side BRT (two medians)
Signature station platforms; 241 median trees; 50,000 s.f. planted area
Inconsistent median shape
Center-side BRT (one median)
Signature station platforms; 169 median trees; 65,000 s.f. planted area
Inconsistent median shape
Center-side BRT (center medians) Strong center median;
signature station platforms; 143 median trees; 55,000 s.f. planted area
Figure 4-12: Landscaping Opportunities

Section 4: Evaluation Methodology and Results 4-23
located farther from this major land use in Alternative 2 than in the other alternatives.
6.3.3 Ability to Create Usable Public Open Space
Each of the BRT alternatives provides the opportunity for a plaza space to be created at 12th Street. Additionally, Alternative 2 creates the wider sidewalks at BRT stops, freeing sidewalk space for tables or other outdoor retail activities.
6.3.4 Quality, Quantity, and Character of Landscaping
All BRT alternatives increase the number of trees on Van Ness and the total square footage of green landscaping, as well as fi ll gaps in the existing tree line of the sidewalk through the current bus stops.
However, the shape and consistency of the landscaped median varies among the alternatives. Alternative 2 preserves the existing wide median, which offers fl exible but consistent landscape design and ease of maintenance. The same is true of Alternative 5, which maintains a more consistent tree pattern in a more consistent center median than the other center lane alternatives. Under Alternative 4, the median is often narrow and irregularly shaped, which makes it more diffi cult to maintain and restricts the landscaping choices. Alternative 3 reconfi gures the medians into narrower lengths, a disadvantage when maintaining and selecting landscaping specimens, particularly trees.
6.3.5 Sustainable Storm Water Management
Storm water management depends heavily upon the amount of landscaped area, which allows water to be absorbed into the ground, as well as the number of mature trees that help hold soil in place. All of the BRT alternatives either sustain current levels of landscaped area or increase those amounts. Alternative 2 doubles the amount of median landscaped area to 94,000 square feet. Alternative 4 has the second highest amount of planted median area, 64,700 square feet. Alternatives 5 and 3 maintain or slightly increase the amount of planted median area.
6.4 WORKSHOP FEEDBACK
At public workshops hosted by the Authority in October 2006, citizens had the opportunity to provide feedback on the Van Ness BRT alternatives evaluation. In their comments, some participants addressed how a BRT project would change the urban and landscape design of Van Ness.
In general, workshop participants felt that a BRT project would improve the urban design of the Van Ness corridor. However, they recommended that the Authority further study the impact of BRT on adjacent land uses, including retail uses and large institutions such as the California-Pacifi c Medical Center.

SAN FRANCISCO COUNTY TRANSPORTATION AUTHORITY: Van Ness BRT Study 4-24
6.5 KEY CONCLUSIONS
The following fi gure summarizes the evaluation results for each alternative on landscape and urban design.
Alternative Street Identity
Integration with
Adjacent Land Uses
Ability to Create Usable
Public Open Space
Quality, Quantity,
and Character
of
Sustainable Storm Water
No Project
Curbside BRT
Center-side BRT (two medians)
Center-side BRT (one median)
Center-side BRT (center medians)
Figure 4-13: Urban Design and Landscaping Scoring

Section 4: Evaluation Methodology and Results 4-25
Table 4-5: Traffi c Operation and Parking Criteria
Criterion Description Source(s)Person delay Measures the operation of intersections and the
fl ow of traffi c for vehicles and for overall person-throughput.
The VISSIM micro-simulation model tabulates delays for vehicles, buses, and pedestrians, and reports these fi gures based on the number of people traveling in cars and on buses to provide fi gures of total changes in delay for people traveling along the corridor. Three measures of person delay are considered: the average delay for all people waiting at an intersection, regardless of how they get there (car, bus, or on a bike or walking); the average delay for people waiting in cars; and the average delay of people waiting in buses.
VISSIM micro-simulation model
Accommodate traffi c circulation and access
Provides a direct measure of impacts to drivers.
The VISSIM micro-simulation model and Synchro traffi c operations model produce tabulations of total intersection performance (expressed as the Volume/Capacity ratio) and delays to cars (expressed as Level of Service, or LOS).
VISSIM micro-simulation model
Synchro traffi c model
Traffi c volumes on parallel streets
Provides a sense of the amount of traffi c diverted from Van Ness due to the project and its impact on the traffi c fl ow of parallel streets.
The Authority’s travel demand model provides estimates of the volumes of traffi c to divert and the likely locations of those diversions. The MTA Synchro traffi c operations model assesses the impact of those diversions on the traffi c fl ow on parallel streets.
Synchro traffi c model
Authority’s travel demand model (CHAMP)
On-street parking Identifi es the change in number of parallel parking spaces on Van Ness as a result of BRT designs.
Street layout and geometry are reviewed to calculate the number of parallel parking spaces added and removed for each alternative.
Engineering designs – quantitative
7 Traffic Operations and Parking
7.1 PURPOSE
The purpose of this evaluation is to measure the effect of BRT on traffi c operations and parking. Traffi c operations are assessed based on the delay experienced at intersections; the smoothness of traffi c fl ow; overall changes in auto travel times; and the extent of traffi c diversions to other streets. Parking is measured by the change in number of spaces available.
7.2 METHODOLOGY
Measuring traffi c operation impacts required extensive use of computer models. The VISSIM micro-simulation model was used to assess delay not only for autos but for all people traveling on Van Ness. VISSIM and Synchro models were used to assess intersection and roadway performance. SF-CHAMP was used to quantify the extent of traffi c diversions, and Synchro was used to assess the impacts of those diversions on traffi c fl ow. Parking impacts were tallied based on engineering drawings.

SAN FRANCISCO COUNTY TRANSPORTATION AUTHORITY: Van Ness BRT Study 4-26
7.3 FINDINGS
7.3.1 Person Delay
In an urban setting, intersections are the key determinants of how smoothly traffi c fl ows. A good way to evaluate the overall fl ow of traffi c is to assess how well intersections serve the traffi c passing through them. Conventional traffi c operations models such as Synchro provide a variety of measures to analyze intersection operations on a vehicle-by-vehicle basis. Up to 30% of the people using Van Ness, however, are in transit vehicles, which are not captured by Synchro.
VISSIM provides similar measures of intersection operations that are adjusted for the number of people using an intersection, not just the number of vehicles. One of the most basic measures of intersection performance is the average amount of time that a person (or vehicle) spends delayed at an intersection – called “person delay” (or “vehicle delay”). VISSIM also calculates the amount of delay
experienced by riders of BRT specifi cally. Figure 4-14 below presents three delay measures: the change in average delay to each person at the average Van Ness intersection; the change in average delay to each BRT rider at the average Van Ness intersection; and the average delay to each vehicle.
All BRT alternatives cut in half the delays experienced by riders of the 47 and 49 lines on Van Ness. Because such a large proportion of Van Ness travelers are on transit, all the BRT alternatives also cut in half the total person-delays at Van Ness intersections.
Despite those gains to transit riders, drivers are not substantially impacted. Average delays for vehicles do increase slightly under Alternatives 3-5. However, all vehicles, not just transit vehicles, benefi t from the green signal extensions given to transit, keeping negative impacts to vehicles in check. Detailed delay results are included as Appendix 25.
Alternative BRT Rider Delay
Vehicle Delay
Total Person Delay
No Project
20.9 19.3 20.8
Curbside BRT
10.6 19.3 19.1
Center-side BRT (center
medians)
10.2 20.9 19.7
Figure 4-14: Person Delay, in Seconds, at an Average Van Ness Intersection

Section 4: Evaluation Methodology and Results 4-27
7.3.2 Accommodate Traffi c Circulation and Access
Synchro provides at least two measures intended to capture the overall performance of an intersection for serving traffi c: intersection “level of service,” or LOS, and the intersection volume to capacity (V/C) ratio. LOS is provided as a grade level between A and F. The V/C ratio is the ratio of the volume of cars traveling through the intersection relative to the capacity of the intersection to serve vehicle traffi c. Each measure is a slightly different way to capture how congested an intersection is. A table of expected intersection operations by direction is provided as Appendix 20.
All BRT alternatives somewhat increase the level traffi c congestion at Van Ness intersections. The average intersection LOS along the corridor decreases from B in the No Project to C with BRT, as shown in Figure 4-16. Travel times for cars from Mission to Lombard do increase, but by less than a minute in each direction.
7.3.3 Traffi c Volumes on Parallel Streets, PM Peak Period
Converting a lane of mixed traffi c in each direction of Van Ness to dedicated transit lanes will reduce mixed traffi c capacity by 33 percent, resulting in some diversion of traffi c from Van Ness onto other streets. SF-CHAMP was used to assess the magnitude of those diversions and the corridors to which that traffi c would likely divert. The Synchro traffi c operations model was used to assess the impact of those diversions on intersection operation on Van Ness and its parallel streets. Documentation is included as Appendix 21.
About 29 percent of the traffi c currently on Van Ness is expected to divert if one lane in each direction is converted to a dedicated transit lane. Because diversions are primarily the results of dedicating a lane and removing some left-turn pockets, all alternatives have about the same expected level of diverted traffi c.
Less than half the diverted traffi c is expected to remain within the corridor, and about half is expected to divert outside the corridor altogether, making use of San Francisco’s grid system. The rest are new transit trips made by former drivers.
This fi nding is consistent with the nature of the traffi c using Van Ness today. Van Ness Avenue carries a high volume of regional and through trips with destinations outside the corridor. An assessment using CHAMP indicates that about 52 percent of the total trips using Van Ness today have no origin or destination on the corridor itself, and thus don’t need to be on the corridor, as shown in Table 4-6.
Table 4-6: Trip Origin/Destination
Through trips
No trip origin or destination on Van Ness corridor
52%
Corridor trips
Trip origin or destination on Van Ness corridor
48%
Total All trips using Van Ness 100%
AlternativeAuto Travel Time (min), Mission to
LombardNo Project
11.2
Curbside BRT
11.2
Center-side BRT (center
medians)
11.5
Figure 4-15: Auto Travel Time Results

SAN FRANCISCO COUNTY TRANSPORTATION AUTHORITY: Van Ness BRT Study 4-28
At the same time, more than half of the travelers using Van Ness today are local to San Francisco:
Regional Trips
Trip origin or destination outside SF 33%
Local Trips Both origin and destination within SF 67%
Total All trips using Van Ness 100%
The volume of trips expected to divert to parallel streets amounts to about three added cars per minute. These added cars are not
expected to break down traffi c operations on the parallel streets. Figure 4-17 shows how intersection operations on parallel streets might be affected. The magnitude of expected diversions onto parallel streets, and the expected impacts of those diversions on traffi c fl ow, will be studied in greater detail in the next phase of this project.
7.3.4 On-Street Parking
There are 393 on-street parking spaces on Van Ness Avenue between Mission and Lombard streets. BRT Alternatives 2 and 4 would increase the overall supply of parallel parking by 16
Figure 4-16: Auto LOS Results
No Project BRT

Section 4: Evaluation Methodology and Results 4-29
Figure 4-17: Parallel Street LOS Results
No Project BRT
and 24 spaces respectively, primarily by adding new spaces at former curbside bus stops. Alternatives 3 and 4 would slightly decrease the parking supply by 36 and 24 spaces respectively, but each of these represents less than 10 percent of the 393 total spaces along Van Ness. Alternative 5 is able to add net new parking because of the minimal weaving necessitated by this design, which lessens the need to remove spaces to accommodate station platforms. A tabulation of changes in parking by block is provided in Appendix 22.
7.4 WORKSHOP FEEDBACK
At public workshops hosted by the Authority in October 2006, citizens had the opportunity to provide feedback on the Van Ness BRT alternatives evaluation. Many of the comments
received at these workshops related to the effect of a BRT project on traffi c operations and parking.
Traffi c congestion and other impacts to drivers were commonly cited as concerns about the impacts of BRT. Workshop participants also expressed concern that traffi c would be diverted to parallel streets, such as Polk, Franklin, and Gough. Other participants considered increased scarcity of parking, road rage, auto-bus confl ict, and the blockage of emergency vehicles as potential concerns. Several participants were concerned about the impact of BRT on businesses that require deliveries.
Workshop participants urged the Authority to study further the project’s traffi c impacts, including diversion to side streets.

SAN FRANCISCO COUNTY TRANSPORTATION AUTHORITY: Van Ness BRT Study 4-30
Alternative Parking
No Project
393 spaces
Curbside BRT+4.1%
16 new spaces
Center-side BRT (two medians) -9.2%
36 spaces removed
Center-side BRT (one median) -6.1%
24 spaces removed
Center-side BRT (center
medians) +6.4%
25 new spaces
Figure 4-18: Parking Results

Section 4: Evaluation Methodology and Results 4-31
7.5 KEY CONCLUSIONS
The following fi gure summarizes the evaluation of each alternative for traffi c circulation and access.
Alternative Person Delay
Accommodate Traffi c
Circulation and Access
Traffi c Volumes
on Parallel Streets
On-street Parking
No Project
Curbside BRT
Center-side BRT (two medians)
Center-side BRT (one median)
Center-side BRT (center medians)
Figure 4-19: Evaluation Results for Traffi c Circulation and Access

SAN FRANCISCO COUNTY TRANSPORTATION AUTHORITY: Van Ness BRT Study 4-32
8 Cost
This section provides conceptual capital cost estimates for BRT on Van Ness, including all project elements affecting capital cost. Likely impacts to operating costs are also addressed.
8.1 PURPOSE
The purpose of this measure is to provide the best conceptual estimates of the capital cost of each BRT alternative, and to identify a plan for funding transit improvements on Van Ness.
8.2 METHODOLOGY
The cost of BRT on Van Ness was estimated by the study team based on the conceptual engineering designs for each alternative, adjusted to refl ect the historical costs of implementing transit construction projects in San Francisco.
8.3 FINDINGS
8.3.1 Capital Costs
BRT on Van Ness between Mission and Lombard streets is expected to cost between $60 million and $65 million (in 2005 dollars). These cost estimates include the landscape, urban
design, and pedestrian environment elements of Van Ness BRT. New BRT buses will be procured through Muni’s regular vehicle-replacement cycle, which is funded through Prop K. Further detail on capital cost estimates is provided as Appendix 23.
8.3.2 Operating Costs
Operating cost savings are an expected result of BRT on Van Ness. This study assumed an operations cost envelope equivalent to today’s operating costs for the Van Ness routes. The key determinant of the cost to operate a service is the route “cycle time,” which dictates the number of buses and drivers that are required to operate at a given frequency of service. By improving bus travel times and by reducing delays, BRT shortens the amount of time it takes a bus to complete its route. This enables the same number of drivers and buses to operate more cycles and ultimately provide a higher frequency of service.
8.4 KEY CONCLUSIONSBRT on Van Ness from Mission to Lombard will cost $60-65 million
BRT is expected to reduce operating costs by reducing the amount of time required for a bus to complete its route
•
•

Section 4: Evaluation Methodology and Results 4-33
9 Construction Impacts
This section describes the likely duration and intensity of Van Ness BRT construction, and identifi es strategies to reduce the construction impact on adjacent land uses.
9.1 PURPOSE
The purpose of this evaluation is to anticipate the duration and intensity of construction on neighboring land uses. Construction impacts are assessed based on the expected duration of construction, in months, and the expected intensity, in the amount of street area under construction for the project.
9.2 METHODOLOGY
Construction impacts were assessed through consultations with construction fi rms with experience in San Francisco. Based on conceptual engineering drawings of the BRT alternatives, the study team developed potential construction approaches to minimize the duration and intensity of BRT construction.
9.3 FINDINGS
9.3.1 Construction Duration
BRT on Van Ness can be constructed within a one-year time frame. If the full segment from Mission to Lombard streets were implemented, construction would likely take place in two simultaneous segments. Construction of BRT would involve 3-4 street blocks at a time, each under construction for about three months, including some nights and weekend construction
as appropriate. One lane of traffi c as well as pedestrian access would be maintained throughout construction.
All feasible project delivery methods that could potentially reduce construction time will be explored.
9.3.2 Construction Intensity
Construction of BRT is of low intensity compared to light-rail or subway construction, as it is similar to a resurfacing and curbing project. If the complete BRT project from Mission to Lombard is implemented, two short segments of Van Ness of 3-4 blocks would be under construction at any given time. Construction could be underway at opposite ends of the corridor simultaneously. During that time, roadway access for the land uses fronting Van Ness could be preserved.
Each alternative involves several key construction elements: repaving, curb bulb-outs, median work and transit station platforms. Because each alternative involves all four of these elements, the construction impacts do not differ signifi cantly among the alternatives.
9.4 WORKSHOP FEEDBACK
At public workshops hosted by the Authority in October 2006, citizens had the opportunity to provide feedback on the Van Ness BRT alternatives evaluation. Several workshop participants expressed concern about the impact of project construction, especially on local merchants, and urged the Authority to take steps to minimize the construction impact of any project on adjacent land uses.
Table 4-7: Construction Impacts Criteria
Criterion Description Source(s)Maintain access to local businesses
This sub-criterion provides an assessment of the construction impact of BRT alternatives on adjacent land uses by estimating the expected duration (months) and intensity (amount of street) under construction to build the project, and considers the opportunities for approaches to reduce construction duration and intensity.
Engineering designs – quantitative
SAN FRANCISCO COUNTY TRANSPORTATION AUTHORITY: Van Ness BRT Study 4-34
9.5 KEY CONCLUSIONSBRT construction is low-intensity and quick relative to major transportation projects such as light-rail or subway construction
BRT on Van Ness can be constructed in a year, in 3-4 block segments for three months apiece
The BRT alternatives do not have signifi cantly different expected construction impacts
An array of construction approaches is available to reduce the duration and intensity of construction, including night and weekend construction
Roadway access to businesses could be preserved throughout the construction time period
•
•
•
•
•
•

Section 4: Evaluation Methodology and Results 4-35
10 Summary of Results and Conclusions
A detailed matrix synthesizing the key results for each evaluation measure is included as Appendix 30.
10.1 TRANSIT OPERATIONS AND PERFORMANCE
All BRT Alternatives are expected to provide signifi cant transit performance benefi ts by reducing travel times and increasing reliability. BRT on Van Ness improves travel times on the
most congested part of Van Ness – Mission to Post – by 28 percent with Alternative 2 and by 37 percent with Alternatives 3-5. These savings amount to about 2,600 hours of transit passenger travel time saved daily for Alternative 2, and 3,100 hours of transit passenger travel time saved daily for Alternatives 3-5. In addition to these travel time benefi ts, BRT is expected to signifi cantly improve reliability by eliminating most or all confl icts with mixed traffi c, and by streamlining passenger loading and unloading.
Finally, BRT on Van Ness is part of a network of rapid transit that improves systemwide performance. The transit travel time and
Alternative
Transit Operations
and Performance
Transit Rider Experience
Access and Pedestrian Amenities
Urban and Landscape
Design
No Project
Curbside BRT
Center-side BRT (two medians)
Center-side BRT (one median)
Center-side BRT (center
medians)
Figure 4-20: Benefi ts Evaluation Summary
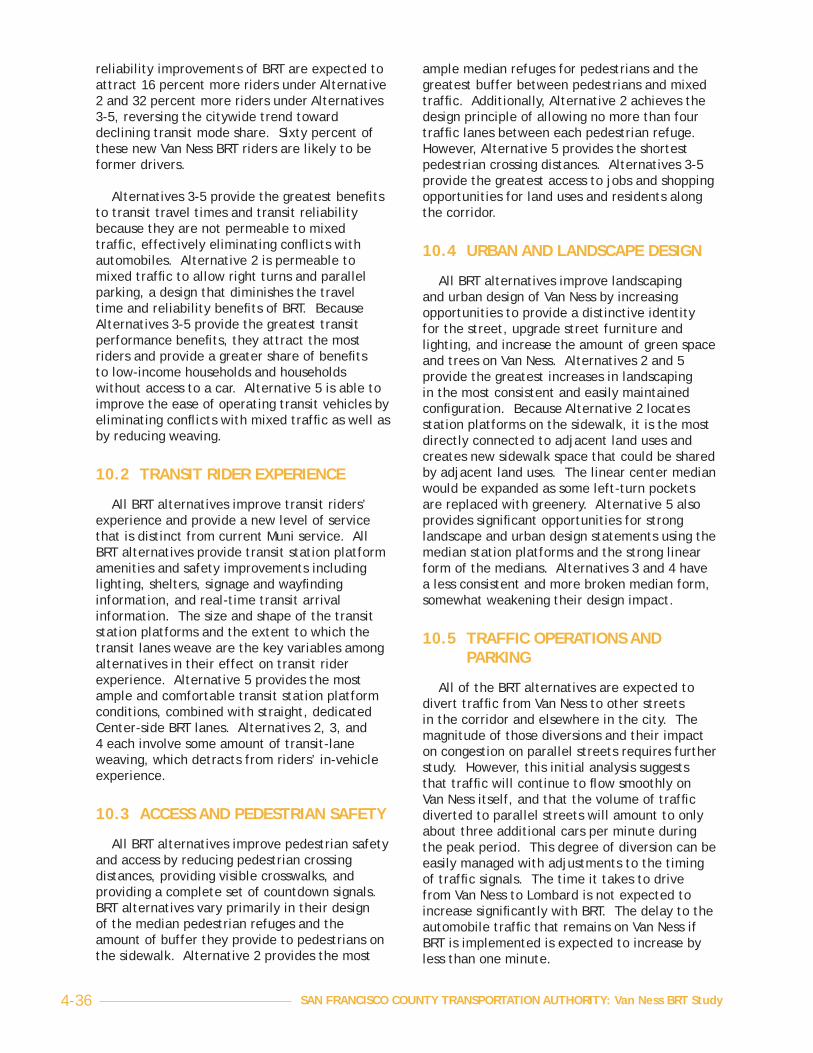
SAN FRANCISCO COUNTY TRANSPORTATION AUTHORITY: Van Ness BRT Study 4-36
reliability improvements of BRT are expected to attract 16 percent more riders under Alternative 2 and 32 percent more riders under Alternatives 3-5, reversing the citywide trend toward declining transit mode share. Sixty percent of these new Van Ness BRT riders are likely to be former drivers.
Alternatives 3-5 provide the greatest benefi ts to transit travel times and transit reliability because they are not permeable to mixed traffi c, effectively eliminating confl icts with automobiles. Alternative 2 is permeable to mixed traffi c to allow right turns and parallel parking, a design that diminishes the travel time and reliability benefi ts of BRT. Because Alternatives 3-5 provide the greatest transit performance benefi ts, they attract the most riders and provide a greater share of benefi ts to low-income households and households without access to a car. Alternative 5 is able to improve the ease of operating transit vehicles by eliminating confl icts with mixed traffi c as well as by reducing weaving.
10.2 TRANSIT RIDER EXPERIENCE
All BRT alternatives improve transit riders’ experience and provide a new level of service that is distinct from current Muni service. All BRT alternatives provide transit station platform amenities and safety improvements including lighting, shelters, signage and wayfi nding information, and real-time transit arrival information. The size and shape of the transit station platforms and the extent to which the transit lanes weave are the key variables among alternatives in their effect on transit rider experience. Alternative 5 provides the most ample and comfortable transit station platform conditions, combined with straight, dedicated Center-side BRT lanes. Alternatives 2, 3, and 4 each involve some amount of transit-lane weaving, which detracts from riders’ in-vehicle experience.
10.3 ACCESS AND PEDESTRIAN SAFETY
All BRT alternatives improve pedestrian safety and access by reducing pedestrian crossing distances, providing visible crosswalks, and providing a complete set of countdown signals. BRT alternatives vary primarily in their design of the median pedestrian refuges and the amount of buffer they provide to pedestrians on the sidewalk. Alternative 2 provides the most
ample median refuges for pedestrians and the greatest buffer between pedestrians and mixed traffi c. Additionally, Alternative 2 achieves the design principle of allowing no more than four traffi c lanes between each pedestrian refuge. However, Alternative 5 provides the shortest pedestrian crossing distances. Alternatives 3-5 provide the greatest access to jobs and shopping opportunities for land uses and residents along the corridor.
10.4 URBAN AND LANDSCAPE DESIGN
All BRT alternatives improve landscaping and urban design of Van Ness by increasing opportunities to provide a distinctive identity for the street, upgrade street furniture and lighting, and increase the amount of green space and trees on Van Ness. Alternatives 2 and 5 provide the greatest increases in landscaping in the most consistent and easily maintained confi guration. Because Alternative 2 locates station platforms on the sidewalk, it is the most directly connected to adjacent land uses and creates new sidewalk space that could be shared by adjacent land uses. The linear center median would be expanded as some left-turn pockets are replaced with greenery. Alternative 5 also provides signifi cant opportunities for strong landscape and urban design statements using the median station platforms and the strong linear form of the medians. Alternatives 3 and 4 have a less consistent and more broken median form, somewhat weakening their design impact.
10.5 TRAFFIC OPERATIONS AND PARKING
All of the BRT alternatives are expected to divert traffi c from Van Ness to other streets in the corridor and elsewhere in the city. The magnitude of those diversions and their impact on congestion on parallel streets requires further study. However, this initial analysis suggests that traffi c will continue to fl ow smoothly on Van Ness itself, and that the volume of traffi c diverted to parallel streets will amount to only about three additional cars per minute during the peak period. This degree of diversion can be easily managed with adjustments to the timing of traffi c signals. The time it takes to drive from Van Ness to Lombard is not expected to increase signifi cantly with BRT. The delay to the automobile traffi c that remains on Van Ness if BRT is implemented is expected to increase by less than one minute.

Section 4: Evaluation Methodology and Results 4-37
All BRT alternatives divert about the same amount of traffi c to parallel streets and increase travel times for drivers about the same amount. Alternative 2 may be considered friendlier to drivers because cars are more likely to use the BRT lane (to make right turns and to parallel park).
Alternatives 2 and 5 increase the supply of parallel parking on Van Ness. Although Alternatives 3 and 4 would remove some parallel parking spaces from Van Ness, the removal is a total of less than 10 percent of the nearly 400 spaces along the street between Mission and Lombard.
10.6 CAPITAL AND OPERATING COSTS
BRT on Van Ness is expected to cost $60-65 million – signifi cantly less than a subway or light-rail project (which could reach $1 billion, based
on cost estimates developed for such projects on other San Francisco corridors). BRT is expected to reduce operating costs by reducing the amount of time required for a bus to complete its route. Finally, new low-fl oor buses with left and right doors will be procured through Muni’s vehicle replacement cycle.
10.7 CONSTRUCTION IMPACTS
The BRT alternatives do not have signifi cantly different expected construction impacts. An array of strategies to reduce any construction impacts are feasible with all BRT alternatives, including some nighttime and weekend construction; preserving traffi c access to land uses fronting Van Ness during construction; and minimizing the length of construction time and the amount of street that is under construction at one time.

Section 5: Next Steps 5-1
CONTENTS1 INTRODUCTION .......................... 5-1
2 PHASING AND FUNDING ................. 5-22.1 PHASING OPPORTUNITIES ..................... 5-2
2.2 FUNDING PLAN .................................. 5-2
3 NEXT STEPS AND IMPLEMENTATION ROADMAP ...........5-23.1 STUDY APPROVAL ............................... 5-2
3.2 NEXT STEPS IN VAN NESS BRT IMPLEMENTATION .......................... 5-2
3.3 WORKSHOP FEEDBACK ......................... 5-3
SECTION 5: NEXT STEPSVAN NESS BRT STUDY
DECEMBER 2006
1 IntroductionThis section describes the next steps involved
in implementing BRT on Van Ness. The fi rst part discusses opportunities for phasing the project for near-term benefi ts, and discusses the funding plan for BRT on Van Ness. The second part outlines the proposed timeline for implementation of BRT on Van Ness, including the steps for approval of this study, and an explanation of the next phases of work. Finally, input into next steps gathered at public workshops is summarized, and opportunities for community involvement in the next stage of study are described.

SAN FRANCISCO COUNTY TRANSPORTATION AUTHORITY: Van Ness BRT Study 5-2
2 Phasing and Funding
2.1 PHASING OPPORTUNITIES
One of the advantages of BRT relative to rail is that BRT can be constructed and put into operation in increments. The needs analysis and evaluation demonstrate that the greatest delays to transit – and the greatest benefi ts that would be realized from BRT – occur in the southern portion of the corridor between Mission and California streets. This southern portion could be prioritized as a fi rst phase of Van Ness BRT, allowing for benefi ts to be realized more quickly, without detracting from the network and connectivity benefi ts of the project since key transfer nodes (Mission/Market, McAllister, and Geary/O’Farrell) would be included in the fi rst phase.
2.2 FUNDING PLAN
Prop K, passed by San Francisco voters in 2004, dedicates close to $200 million for the citywide network of BRT and Transit Preferential Streets improvements. Of this amount, about $20 million is allocated for BRT on Van Ness. This amount will serve as a local match to leverage up to $75 Million from the Federal Transit Administration’s Small Starts program. Small Starts funding is specifi cally dedicated for BRT projects that cost less than $250 million. BRT on Van Ness will be highly competitive for these funds.
Elements of the No Project alternative are funded by a variety of sources. The street lighting upgrade is funded by the SFPUC’s capital budget. The traffi c signals upgrade and “SFgo” real-time traffi c management program is funded by Proposition B, the transportation bond measure passed by California voters in 2006. The replacement of overhead support poles is funded through Muni’s Overhead Rehabilitation program.
3 Next Steps and Implementation Roadmap
3.1 STUDY APPROVAL
This report presents the complete fi ndings of the Van Ness BRT Feasibility Study. This report will be presented to the Authority’s Citizen Advisory Committee (CAC) and Board for approval. The report and fi ndings will also be presented to the Municipal Transportation Agency (MTA) Board, Caltrans, and the Federal Transit Administration (FTA) for their review.
3.2 NEXT STEPS IN VAN NESS BRT IMPLEMENTATION
Figure 5-1 below shows the next steps for implementing BRT on Van Ness.
Following approval of the Van Ness BRT Feasibility Study, the Authority will initiate the environmental analysis of BRT on Van Ness pursuant to state and federal rules, and an alternatives analysis per FTA rules. These studies are intended to analyze environmental impacts and benefi ts of BRT alternatives in detail, further develop and analyze the performance of alternative BRT designs, and identify specifi c strategies to mitigate construction impacts and impacts to traffi c circulation. The environmental and alternatives analyses will be conducted over a one-year time frame and will result in selection of a preferred BRT design for Van Ness. Each of these studies will require approval by the Authority Board, Caltrans, the FTA, and other local, state, and federal agencies and bodies.
Simultaneously, preliminary engineering designs will be prepared for BRT on Van Ness, including surveys, detailed plan and profi le
Figure 5-1: Van Ness BRT Implementation Timeline

Section 5: Next Steps 5-3
drawings, and an assessment of utility and drainage modifi cations.
Following identifi cation and preliminary engineering of the preferred BRT alternative, fi nal designs and construction staging plans will be prepared. These steps will be coordinated with elements of the No Project alternative, including PUC street lighting replacement, resurfacing of Van Ness, and upgrade of traffi c signals.
3.3 WORKSHOP FEEDBACK
At public workshops hosted by the Authority in October 2006, participants identifi ed issues that they would like to see considered in the next stage of study. Key issues that participants identifi ed for further study include the effects of traffi c diversions and strategies to reduce the impact of those diversions; strategies to
educate drivers, both locally and regionally; and strategies to reduce the project’s construction impacts. Participants also wanted to see further analysis of how BRT on Van Ness would interact with potential changes in land use such as the proposed new California Pacifi c Medical Center. Finally, participants urged the Authority to study alternative service and operating plans for the Van Ness routes, and to develop design strategies for reducing the likelihood of jaywalking between transit station platforms and the sidewalks.
Van Ness residents, merchants, transit riders, and other stakeholders will continue to be involved throughout the environmental review process, particularly during the design of strategies to address any traffi c and construction related impacts of BRT on Van Ness and the surrounding streets and neighborhoods.