van eck long/short equity strategy: hedge fund beta … presentations/12_11_13.pdf · van eck...
TRANSCRIPT
Van Eck Long/Short Equity Strategy: Hedge Fund Beta StrategiesTransparent, Liquid Access to Hedge Fund Returns September 30, 2013
Institutional Sales Material. Not for distribution to the public.
This presentation is not an offer or advertisement; it is not intended for public use or distribution. The strategies presented are currently provided through separately managed accounts.
THIS MATERIAL MAY ONLY BE PROVIDED TO YOU BY VAN ECK GLOBAL AND IS FOR YOUR PERSONAL USE ONLY AND MUST NOT BE PASSED ON TO THIRD PARTIES WITHOUT THE PRIOR EXPRESS WRITTEN CONSENT OF VAN ECK GLOBAL. IF YOU HAVE NOT RECEIVED THIS MATERIAL FROM VAN ECK GLOBAL, YOU ARE HEREBY NOTIFIED THAT YOU HAVE RECEIVED IT FROM A NON-AUTHORIZED SOURCE THAT DID NOT ACT ON BEHALF OF VAN ECK GLOBAL AND THAT ANY REVIEW, USE, DISSEMINATION, DISCLOSURE OR COPYING OF THIS MATERIAL IS STRICTLY PROHIBITED. BEFORE MAKING AN INVESTMENT DECISION, PLEASE CONSULT A QUALIFIED INVESTMENT AND TAX ADVISOR.
Any projections, market outlooks or estimates in this material are forward-looking statements and are based upon certain assumptions that are solely the opinion of Van Eck Global. Any projections, outlooks or assumptions should not be construed to be indicative of the actual events which will occur. Further, any information regarding portfolio composition, portfolio composition methodology, investment process or limits, or valuation methods of evaluating companies and markets are intended as guidelines which may be modified or changed by Van Eck Global at any time in its sole discretion without notice.
Forecasts, estimates, and certain information contained herein are based upon proprietary research and the information contained in this material is not intended to be, nor should it be construed or used as investment, tax or legal advice, any recommendation, or an offer to sell, or a solicitation of any offer to buy, an interest in any security. References to specific securities and their issuers or sectors are for illustrative purposes only and are not intended and should not be interpreted as recommendations to purchase or sell such securities or gain exposure to such sectors. The strategies may or may not own the securities or be exposed to the sectors referenced and, if such securities are owned or exposure maintained, no representation is being made that such securities will continue to be held or exposure maintained. Where mentioned, maximum gross exposure is equivalent to the sum of gross long and gross short position. All commodity positions are valued on a notional basis. A position is defined as a single holding, long or short, in a security.
Non-Van Eck Global proprietary information contained herein has been obtained from sources believed to be reliable, but not guaranteed. No part of this material may be reproduced in any form, or referred to in any other publication, without express written permission of Van Eck Global. ©2013, Van Eck Global.
Van Eck Absolute Return Advisers Corp., 335 Madison Avenue, New York, NY 10017 www.vaneck.com 1.800.826.2050
2
Institutional Sales Material. Not for distribution to the public.
True Alpha® Disclosure:The method of ranking relative financial performance described herein is protected by US Patent No.7,707,092. This material is confidential and the sole property of Van Eck Global (“Van Eck"). The datadepicted herein is based on reclassified hedge funds, (the “Data”). Hedge fund data is sourced througheVestment. The ranking of investment funds (the “Rankings”) are based solely on Van Eck’s patentedmetric and, as such, does not represent the sole manner for ranking relative performance of investmentfunds. Van Eck does not represent the Rankings as accurate, true or complete; makes no warranty,express or implied regarding it; and shall not be liable for any losses, damages, costs or expenses of anytype related to its use. Users of this material should not rely upon the Data or the Rankings to make aninvestment decision and should note that past performance is not an indication of future performance.
Market Vectors Hedge Fund Beta Indices’ Performance Disclosure:Market Vectors Hedge Fund Beta Indices are comprised of liquid, tradable ETFs. There can be noassurance that index returns will be correlated with risk factor characteristics on an underlying hedge fundor strategy level. In addition, there can be no assurance that the risk factor proxies will emulate desiredreturn characteristics. There are market risks involved in investing in hedge funds and risks associatedwith investing in liquid, tradable securities (i.e., risk factor proxies) used in attempting to replicate hedgefund results. There is no guarantee of any particular result.All of the Market Vectors Hedge Fund Beta Indices launched on November 21, 2012 and are presentedwith hypothetical pre-inception index performance. While not all of the indices presented herein illustratethe full pre-inception performance history, such as in the 5-year risk/return chart in the Appendix, thefollowing lists both the live and pre-inception performance start dates computed for each index:
Hypothetical Index Performance Disclosure:Hypothetical performance for the strategy presented is based on the Market Vectors Long/Short EquityNorth America Hedge Fund Beta TR Index’s (MVLSNATR Index) live index performance, beginningNovember 21, 2012, and available pre-inception index performance, beginning November 1, 2003.Hypothetical performance, when presented net of fees, assumes a 0.65% annualized deduction formanagement fees and other expenses. The net of fee returns may differ from the fees charged toother accounts. Past performance is not an indication, or guarantee, of future results. Hypotheticalor model performance results have certain inherent limitations. Unlike an actual performance record,simulated results do not represent actual trading and accordingly, may have under- or over-compensatedfor the impact, if any, of certain market factors, such as market disruptions and lack of liquidity. In addition,hypothetical trading does not involve financial risk and no hypothetical trading record can completelyaccount for the impact of financial risk in actual trading (for example, the ability to adhere to a particulartrading program in spite of trading losses). Simulated performance is subject to the fact that it is designedwith the benefit of hindsight. There can be no assurance that Van Eck would have selected or will selectunderlying funds or risk factor proxies similar to those taken in the results presented. There are frequentlysharp differences between the hypothetical performance results and the results subsequently achieved byany particular trading or investment program.
Van Eck Long/Short Equity strategies employ a consistent non-discretionary methodology that, on amonthly basis, produces dynamic allocations to risk factor proxies. These collective proxies formportfolios that capture returns that correlate closely to a strategy-specific hedge fund universe (e.g., “VanEck’s Computed Universe/Index of Long/Short Equity Hedge Funds”), based on Data sourced througheVestment, which is enhanced through the patented rating and ranking system, True Alpha®.
Van Eck Long/Short Equity North America (LSENA) strategy seeks to capture consistent total returnswith lower volatility relative to other long/short equity strategies. LSENA employs an enhanced systematicprocess, producing monthly dynamic allocations to long and short positions in transparent, liquidsecurities, such as exchange-traded products (ETPs). The strategy attempts to deliver the systematicreturn (“beta”) of long/short equity hedge funds investing in North America equities while offering fulltransparency, mark-to-market pricing and daily liquidity without hedge fund pricing and redemptionrestrictions.
The strategy is currently provided through separately managed accounts.
Composite performance is presented net of fees, assuming an annual deduction of 0.50% managementfee, which may differ from the fees charged to other accounts. The composite comprised the Van EckLong/Short Equity North America proprietary account, since January 1, 2011. Beginning May 1, 2011,separately managed client accounts were added to the composite. Since its January 1, 2011 inception,the composite comprised 3 accounts year-end 2011, 3 accounts year-end 2012, and 5 accounts in themost recent quarter-end in 2013. Performance data is unaudited. Performance quoted represents pastperformance and is no guarantee of future results.
Important Index Disclosure & Definitions:“Investable” Benchmarks/Indices refer to indices/portfolios that comprise assets that are easilyaccessible to investors, such as exchange-traded products (“ETPs”). Market Vectors Hedge Fund BetaIndices and Van Eck Long/Short Equity Strategy Portfolio (LSENA) are examples of “Investable”Indices.“Non-Investable” Benchmarks/Indices refer to indices that track hedge fund performance and compriseactual hedge funds, which are not as accessible as ETPs, for various reasons, including when hedgefunds may be closed to new investment or have restrictive terms. Van Eck’s Computed Universe/Indexof Long/Short Equity Hedge Funds and the HFRI Equity Hedge Index are examples of “Non-Investable” Indices.Past performance is no guarantee of future returns. The performance of an index is not an exactrepresentation of any particular investment, as you cannot invest directly in an index.
3
Important Disclosures & Explanations
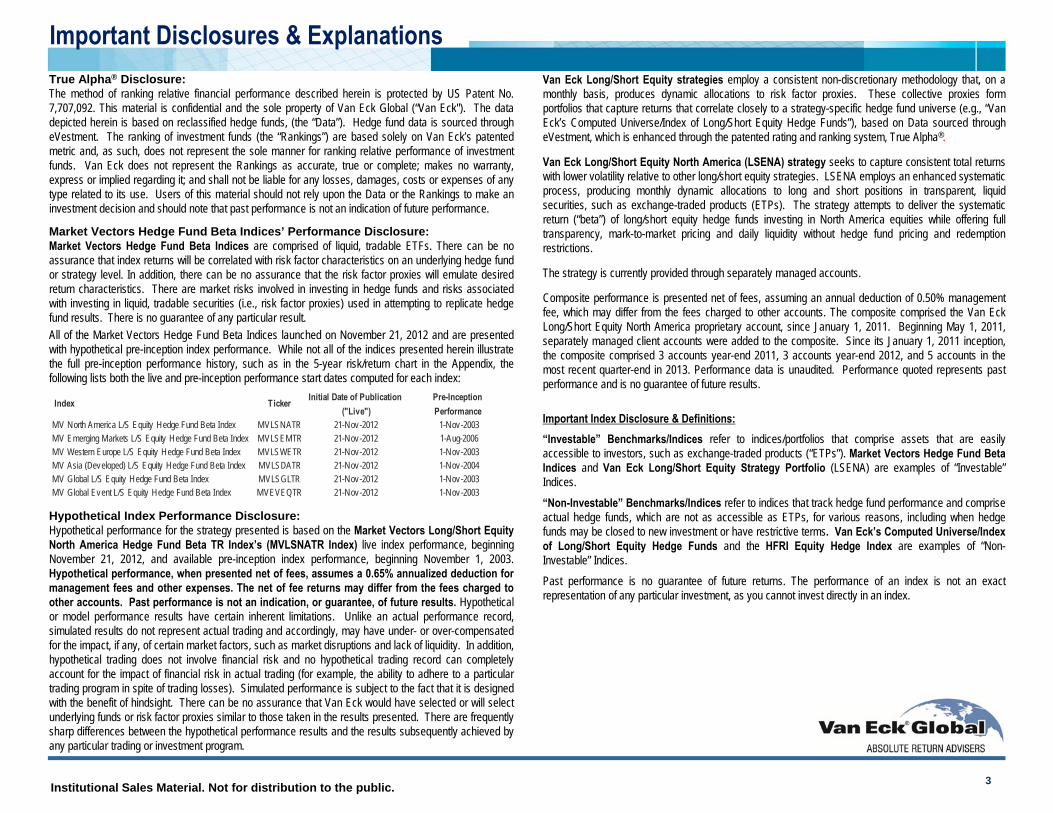
MV North America L/S Equity Hedge Fund Beta Index MVLSNATR 21-Nov-2012 1-Nov-2003MV Emerging Markets L/S Equity Hedge Fund Beta Index MVLSEMTR 21-Nov-2012 1-Aug-2006MV Western Europe L/S Equity Hedge Fund Beta Index MVLSWETR 21-Nov-2012 1-Nov-2003MV Asia (Developed) L/S Equity Hedge Fund Beta Index MVLSDATR 21-Nov-2012 1-Nov-2004MV Global L/S Equity Hedge Fund Beta Index MVLSGLTR 21-Nov-2012 1-Nov-2003MV Global Event L/S Equity Hedge Fund Beta Index MVEVEQTR 21-Nov-2012 1-Nov-2003
Index Initial Date of Publication ("Live")
Ticker Pre-Inception Performance
Institutional Sales Material. Not for distribution to the public.
Contents Introduction to Van Eck
History and Overview
Investment CaseVan Eck Long/Short Equity: A Liquid Alternative StrategyComparative Performance: Consistency and Low VolatilityCapturing Hedge Fund Beta: Quantitative Expertise and Repeatable Systematic ProcessCapturing Hedge Fund Beta Results in Transparent, Liquid Access to Hedge Fund ReturnsLong/Short Equity Investment Choices: Alpha Quest or Beta CaptureAlpha is Volatile and UncertainCapturing Beta is More Certain Capturing Hedge Fund Beta through Portfolios of Hedge Funds
Investment ProcessInvestment Process: Van Eck Long/Short EquityInvestment Process: Portfolio Allocations from Regression AnalysisConclusion: Key PointsBenefits and Uses
Appendix5-Year Risk/Return ComparisonVan Eck Long/Short Equity Return HistoryMeasuring Hedge Fund Alpha with True Alpha®Isolating Alpha to Identify OutliersBiographiesDefinitions and Disclosures
4
Institutional Sales Material. Not for distribution to the public.
Introduction to Van Eck
5
Institutional Sales Material. Not for distribution to the public.
Focused Money Manager with a History of Innovation
In 1955: Van Eck, led by John van Eck, launched one of the first international mutual funds in the U.S.
In 1968: Converted fund to International Investors Gold Fund - the first U.S. gold miners fund
In 1993/4: Launched global hard assets and emerging market equity strategies
In 1996: Launched its first hedge fund
In 2006: Launched Market Vectors exchange-traded funds, which now cover many asset classes
In 2012: Launched Van Eck’s Luxembourg-domiciled SICAV
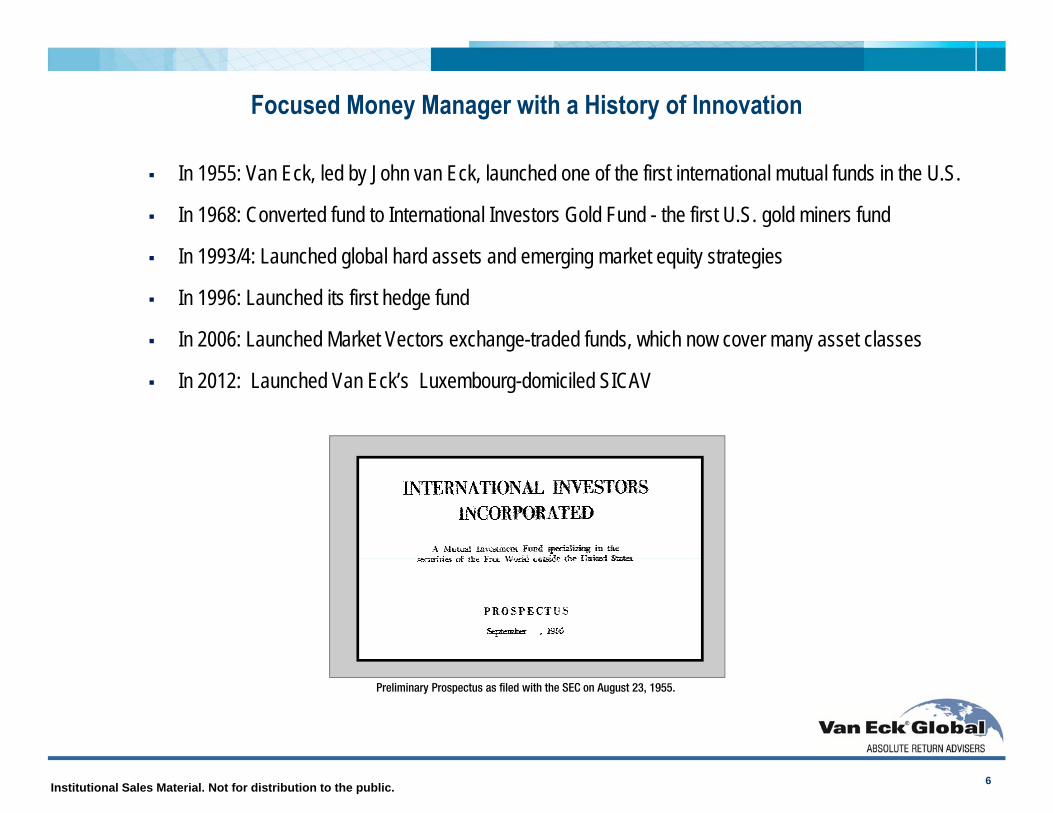
Preliminary Prospectus as filed with the SEC on August 23, 1955.
6
Institutional Sales Material. Not for distribution to the public.
Current Overview
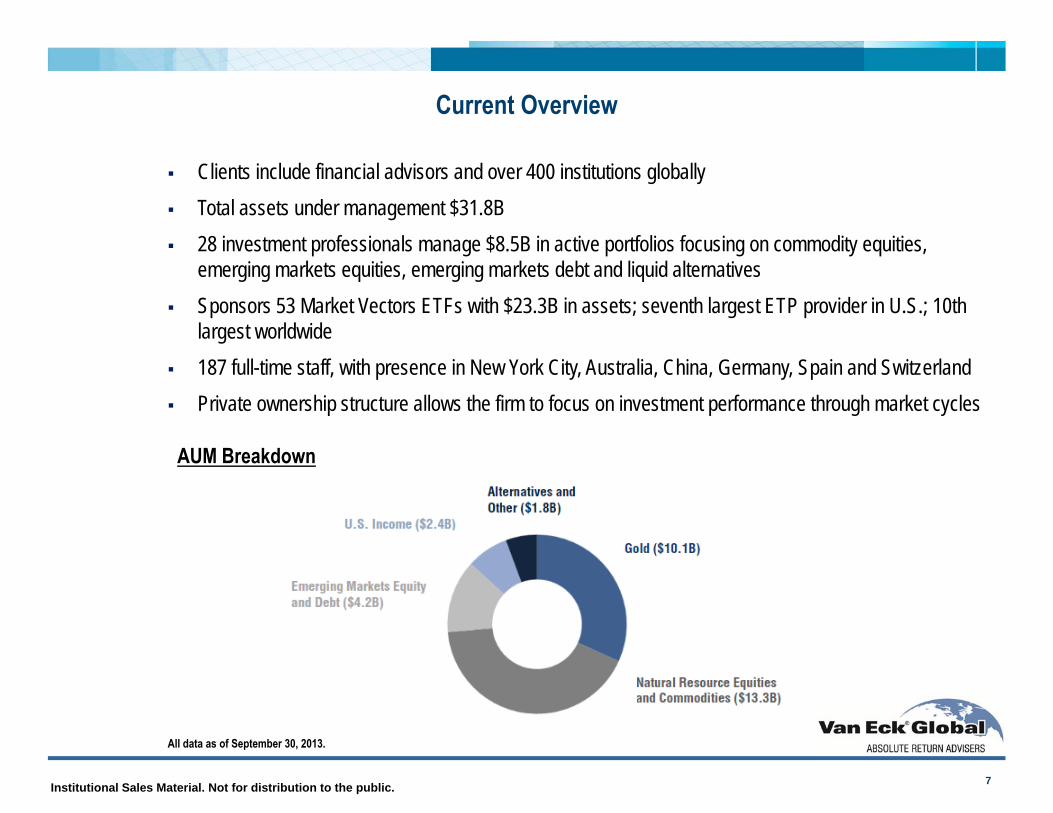
Clients include financial advisors and over 400 institutions globally Total assets under management $31.8B 28 investment professionals manage $8.5B in active portfolios focusing on commodity equities,
emerging markets equities, emerging markets debt and liquid alternatives Sponsors 53 Market Vectors ETFs with $23.3B in assets; seventh largest ETP provider in U.S.; 10th
largest worldwide 187 full-time staff, with presence in New York City, Australia, China, Germany, Spain and Switzerland Private ownership structure allows the firm to focus on investment performance through market cycles
All data as of September 30, 2013.
AUM Breakdown
7
Institutional Sales Material. Not for distribution to the public.
Investment Case
8
Institutional Sales Material. Not for distribution to the public.
Van Eck Long/Short Equity (“LSENA”): A Liquid Alternative Strategy
KEY POINTS
Historically Consistent Risk/Return Characteristics
Low Volatility Equity Strategy
Quantitative Expertise and Repeatable Systematic Process
9
OBJECTIVE
LSENA seeks to capture consistent total returns with lower volatility relative to other long/short equity strategies.
APPROACH
Generate “Investable” Long/Short Equity Benchmark from a Universe of Long/Short Equity Hedge Funds1
1“Investable” Benchmarks/Indices refer to indices/portfolios that comprise assets that are easily accessible to investors, such as exchange-traded products (“ETPs”).“Non-Investable” Benchmarks/Indices refer to indices that track hedge fund performance and comprise actual hedge funds, which are not as accessible as ETPs, for various reasons,including when hedge funds may be closed to new investment or have restrictive terms.Refer to page 2 and 3 for important disclosure notes.
Institutional Sales Material. Not for distribution to the public.
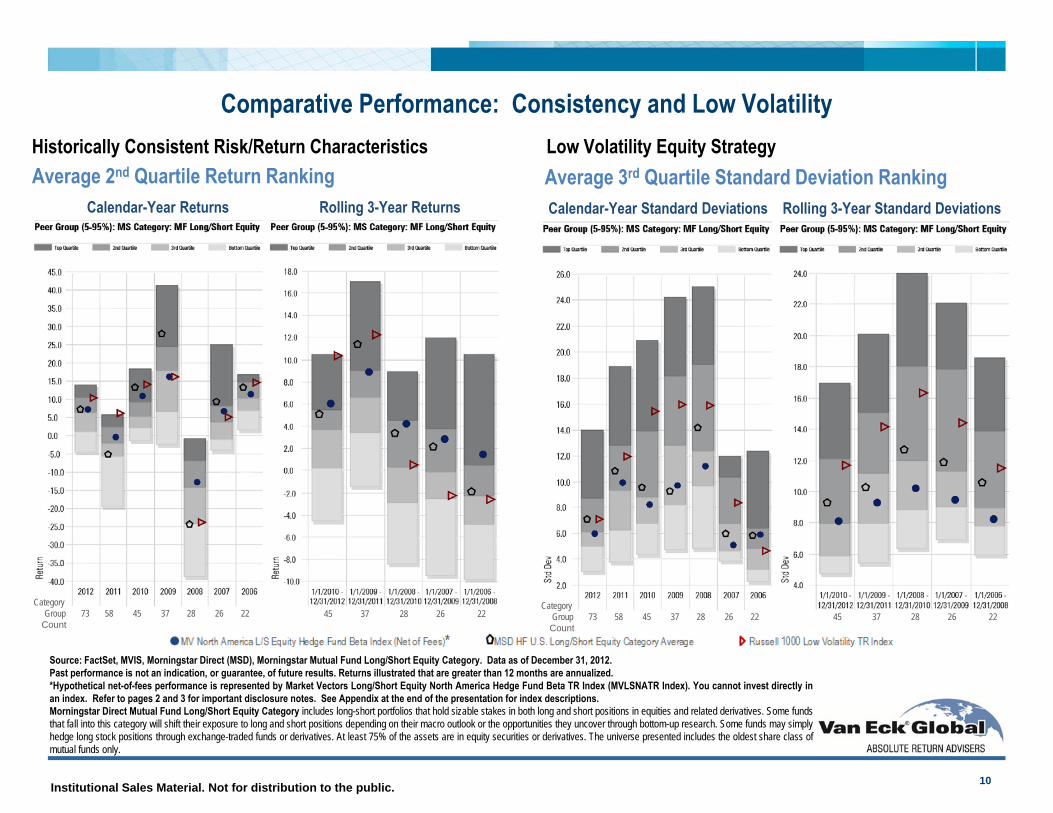
Average 2nd Quartile Return RankingCalendar-Year Returns Rolling 3-Year Returns
Comparative Performance: Consistency and Low VolatilityHistorically Consistent Risk/Return Characteristics Low Volatility Equity Strategy
10
Average 3rd Quartile Standard Deviation RankingCalendar-Year Standard Deviations Rolling 3-Year Standard Deviations
Source: FactSet, MVIS, Morningstar Direct (MSD), Morningstar Mutual Fund Long/Short Equity Category. Data as of December 31, 2012.Past performance is not an indication, or guarantee, of future results. Returns illustrated that are greater than 12 months are annualized.*Hypothetical net-of-fees performance is represented by Market Vectors Long/Short Equity North America Hedge Fund Beta TR Index (MVLSNATR Index). You cannot invest directly inan index. Refer to pages 2 and 3 for important disclosure notes. See Appendix at the end of the presentation for index descriptions.Morningstar Direct Mutual Fund Long/Short Equity Category includes long-short portfolios that hold sizable stakes in both long and short positions in equities and related derivatives. Some fundsthat fall into this category will shift their exposure to long and short positions depending on their macro outlook or the opportunities they uncover through bottom-up research. Some funds may simplyhedge long stock positions through exchange-traded funds or derivatives. At least 75% of the assets are in equity securities or derivatives. The universe presented includes the oldest share class ofmutual funds only.
45 37 28 26 22 45 37 28 26 22 Category
Group 73 58 45 37 28 26 22 Count
CategoryGroup 73 58 45 37 28 26 22 Count
Institutional Sales Material. Not for distribution to the public.
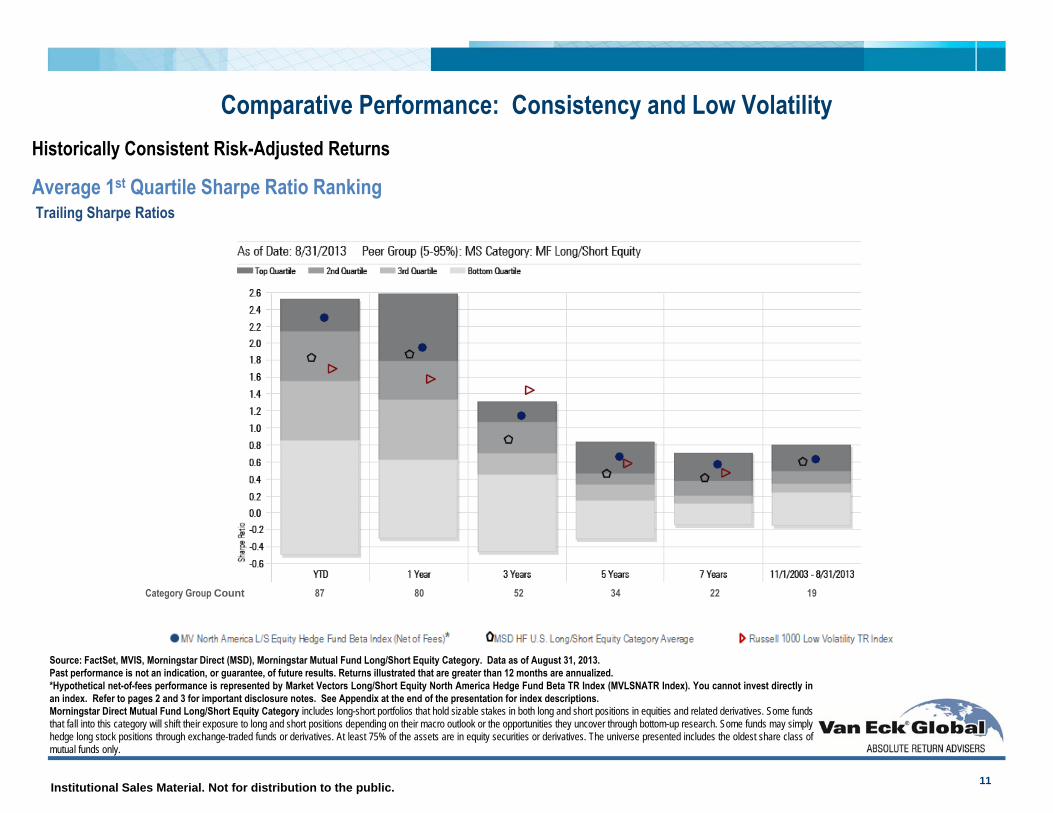
Average 1st Quartile Sharpe Ratio RankingTrailing Sharpe Ratios
Comparative Performance: Consistency and Low VolatilityHistorically Consistent Risk-Adjusted Returns
11
Category Group Count 87 80 52 34 22 19
Source: FactSet, MVIS, Morningstar Direct (MSD), Morningstar Mutual Fund Long/Short Equity Category. Data as of August 31, 2013.Past performance is not an indication, or guarantee, of future results. Returns illustrated that are greater than 12 months are annualized.*Hypothetical net-of-fees performance is represented by Market Vectors Long/Short Equity North America Hedge Fund Beta TR Index (MVLSNATR Index). You cannot invest directly inan index. Refer to pages 2 and 3 for important disclosure notes. See Appendix at the end of the presentation for index descriptions.Morningstar Direct Mutual Fund Long/Short Equity Category includes long-short portfolios that hold sizable stakes in both long and short positions in equities and related derivatives. Some fundsthat fall into this category will shift their exposure to long and short positions depending on their macro outlook or the opportunities they uncover through bottom-up research. Some funds may simplyhedge long stock positions through exchange-traded funds or derivatives. At least 75% of the assets are in equity securities or derivatives. The universe presented includes the oldest share class ofmutual funds only.
Institutional Sales Material. Not for distribution to the public. 12
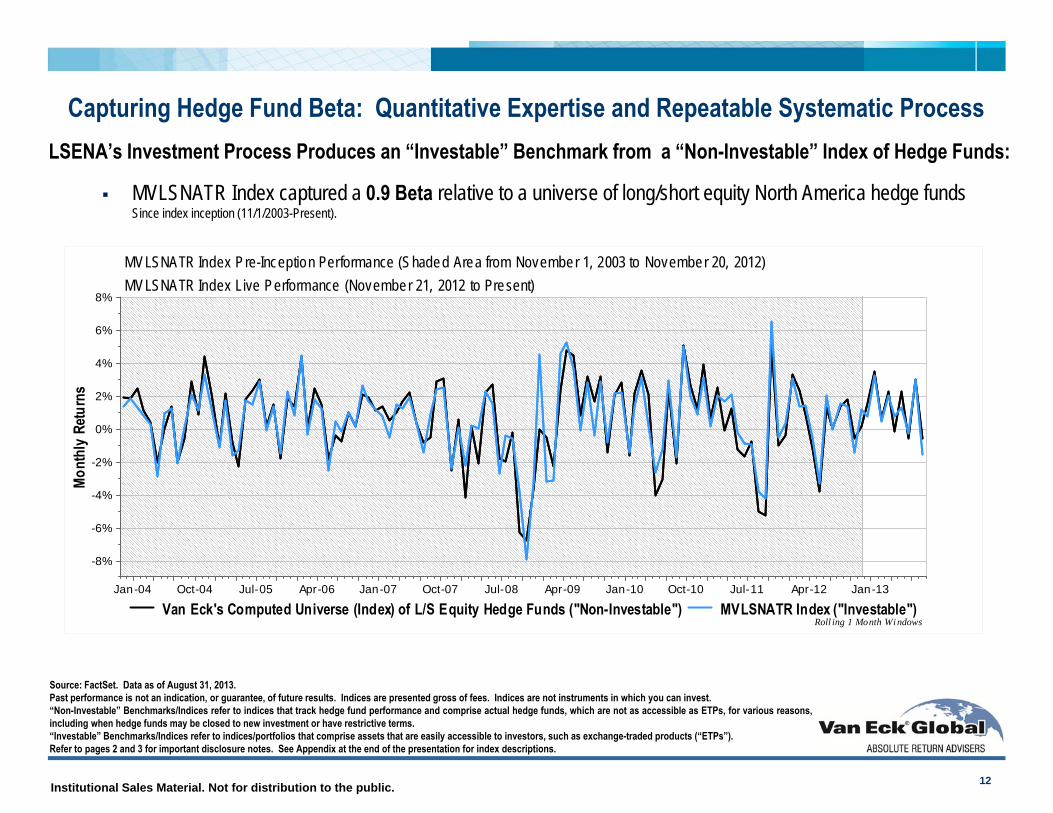
LSENA’s Investment Process Produces an “Investable” Benchmark from a “Non-Investable” Index of Hedge Funds:
MVLSNATR Index captured a 0.9 Beta relative to a universe of long/short equity North America hedge funds Since index inception (11/1/2003-Present).
Jan-04 Oct-04 Jul-05 Apr-06 Jan-07 Oct-07 Jul-08 Apr-09 Jan-10 Oct-10 Jul-11 Apr-12 Jan-13
-8%
-6%
-4%
-2%
0%
2%
4%
6%
8%
Mont
hly
Retu
rns
Roll ing 1 Month Wi ndows
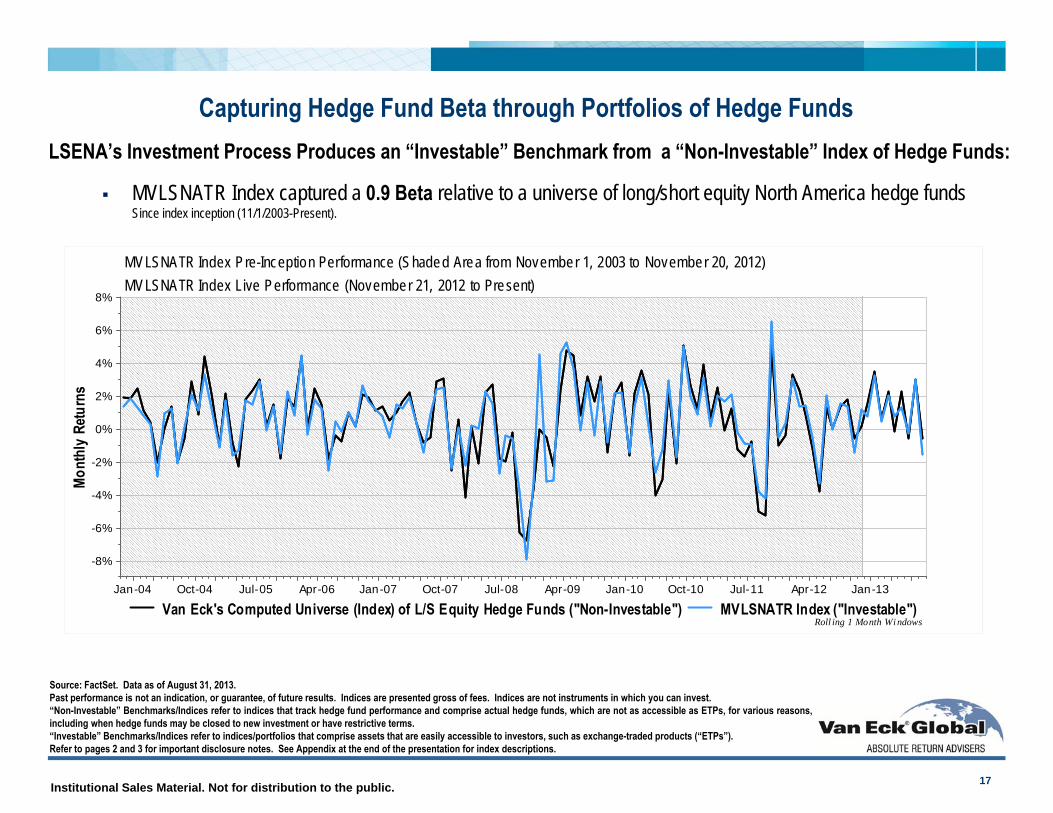
MVLSNATR Index Pre-Inception Performance (Shaded Area from November 1, 2003 to November 20, 2012)MVLSNATR Index Live Performance (November 21, 2012 to Present)
Van Eck's Computed Universe (Index) of L/S Equity Hedge Funds ("Non-Investable") MVLSNATR Index ("Investable")
Source: FactSet. Data as of August 31, 2013.Past performance is not an indication, or guarantee, of future results. Indices are presented gross of fees. Indices are not instruments in which you can invest.“Non-Investable” Benchmarks/Indices refer to indices that track hedge fund performance and comprise actual hedge funds, which are not as accessible as ETPs, for various reasons,including when hedge funds may be closed to new investment or have restrictive terms.“Investable” Benchmarks/Indices refer to indices/portfolios that comprise assets that are easily accessible to investors, such as exchange-traded products (“ETPs”).Refer to pages 2 and 3 for important disclosure notes. See Appendix at the end of the presentation for index descriptions.
Capturing Hedge Fund Beta: Quantitative Expertise and Repeatable Systematic Process
Institutional Sales Material. Not for distribution to the public.
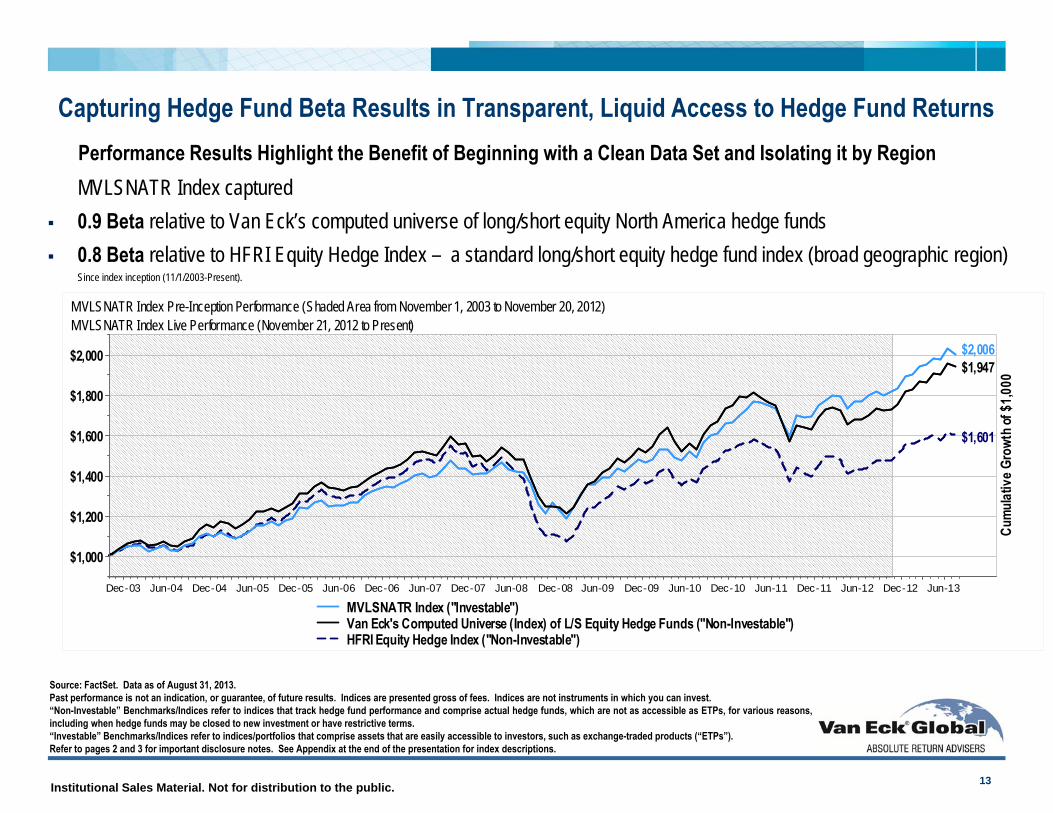
Performance Results Highlight the Benefit of Beginning with a Clean Data Set and Isolating it by Region
13
Capturing Hedge Fund Beta Results in Transparent, Liquid Access to Hedge Fund Returns
MVLSNATR Index captured 0.9 Beta relative to Van Eck’s computed universe of long/short equity North America hedge funds 0.8 Beta relative to HFRI Equity Hedge Index – a standard long/short equity hedge fund index (broad geographic region)
Since index inception (11/1/2003-Present).
Source: FactSet. Data as of August 31, 2013.Past performance is not an indication, or guarantee, of future results. Indices are presented gross of fees. Indices are not instruments in which you can invest.“Non-Investable” Benchmarks/Indices refer to indices that track hedge fund performance and comprise actual hedge funds, which are not as accessible as ETPs, for various reasons,including when hedge funds may be closed to new investment or have restrictive terms.“Investable” Benchmarks/Indices refer to indices/portfolios that comprise assets that are easily accessible to investors, such as exchange-traded products (“ETPs”).Refer to pages 2 and 3 for important disclosure notes. See Appendix at the end of the presentation for index descriptions.
Dec-03 Jun-04 Dec-04 Jun-05 Dec-05 Jun-06 Dec-06 Jun-07 Dec-07 Jun-08 Dec-08 Jun-09 Dec-09 Jun-10 Dec-10 Jun-11 Dec-11 Jun-12 Dec-12 Jun-13
$1,000
$1,200
$1,400
$1,600
$1,800
$2,000
Cumu
lativ
e Gro
wth o
f $1,0
00
$1,601
$1,947$2,006
MVLSNATR Index Pre-Inception Performance (Shaded Area from November 1, 2003 to November 20, 2012)MVLSNATR Index Live Performance (November 21, 2012 to Present)
MVLSNATR Index ("Investable")Van Eck's Computed Universe (Index) of L/S Equity Hedge Funds ("Non-Investable")HFRI Equity Hedge Index ("Non-Investable")
Institutional Sales Material. Not for distribution to the public.
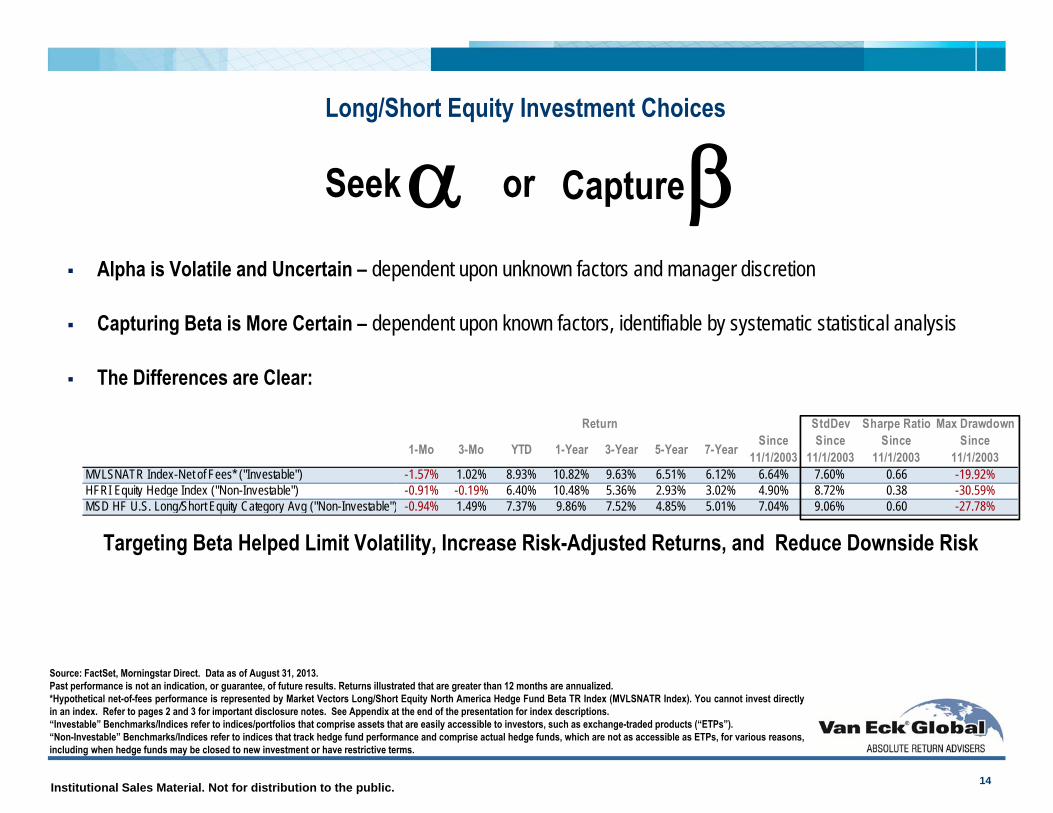
Alpha is Volatile and Uncertain – dependent upon unknown factors and manager discretion
Capturing Beta is More Certain – dependent upon known factors, identifiable by systematic statistical analysis
The Differences are Clear:
Targeting Beta Helped Limit Volatility, Increase Risk-Adjusted Returns, and Reduce Downside Risk
StdDev Sharpe Ratio Max Drawdown
1-Mo 3-Mo YTD 1-Year 3-Year 5-Year 7-Year Since 11/1/2003
Since 11/1/2003
Since 11/1/2003
Since 11/1/2003
MVLSNATR Index-Net of Fees* ("Investable") -1.57% 1.02% 8.93% 10.82% 9.63% 6.51% 6.12% 6.64% 7.60% 0.66 -19.92%HFRI Equity Hedge Index ("Non-Investable") -0.91% -0.19% 6.40% 10.48% 5.36% 2.93% 3.02% 4.90% 8.72% 0.38 -30.59%MSD HF U.S. Long/Short Equity Category Avg ("Non-Investable") -0.94% 1.49% 7.37% 9.86% 7.52% 4.85% 5.01% 7.04% 9.06% 0.60 -27.78%
Return
Long/Short Equity Investment Choices
Seek Captureor
Source: FactSet, Morningstar Direct. Data as of August 31, 2013.Past performance is not an indication, or guarantee, of future results. Returns illustrated that are greater than 12 months are annualized.*Hypothetical net-of-fees performance is represented by Market Vectors Long/Short Equity North America Hedge Fund Beta TR Index (MVLSNATR Index). You cannot invest directlyin an index. Refer to pages 2 and 3 for important disclosure notes. See Appendix at the end of the presentation for index descriptions.“Investable” Benchmarks/Indices refer to indices/portfolios that comprise assets that are easily accessible to investors, such as exchange-traded products (“ETPs”).“Non-Investable” Benchmarks/Indices refer to indices that track hedge fund performance and comprise actual hedge funds, which are not as accessible as ETPs, for various reasons,including when hedge funds may be closed to new investment or have restrictive terms.
14
Institutional Sales Material. Not for distribution to the public.
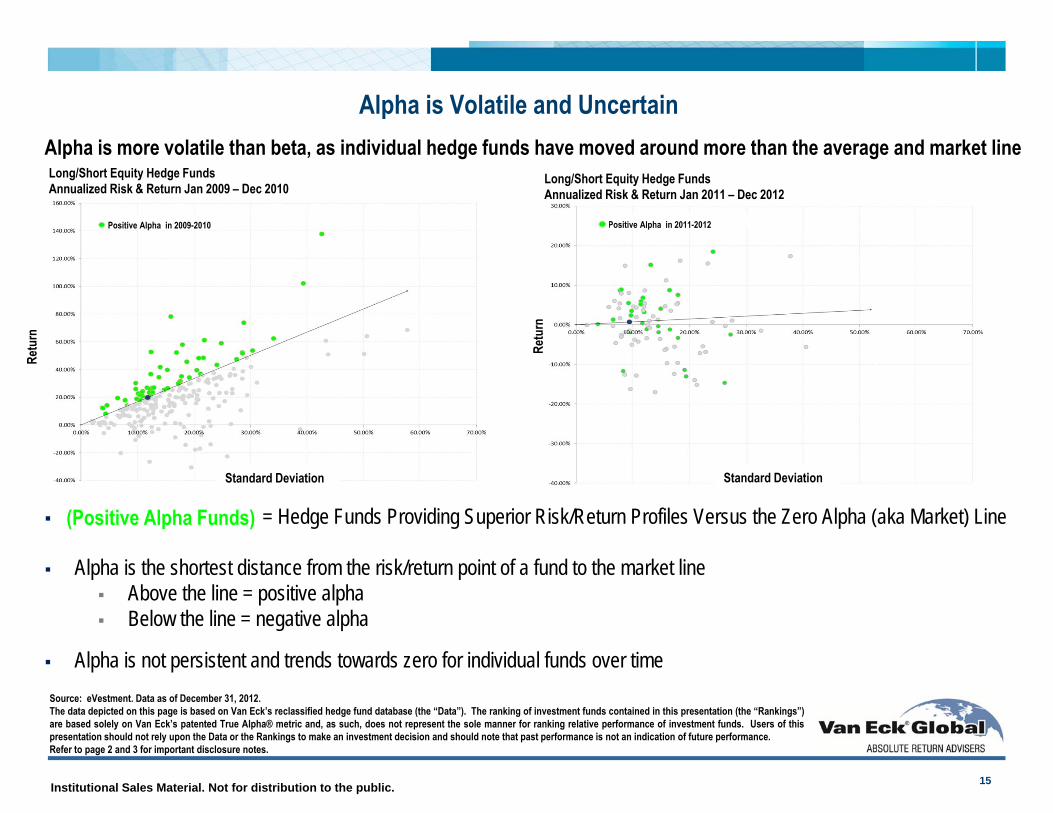
Long/Short Equity Hedge Funds Annualized Risk & Return Jan 2009 – Dec 2010
Source: eVestment. Data as of December 31, 2012.The data depicted on this page is based on Van Eck’s reclassified hedge fund database (the “Data”). The ranking of investment funds contained in this presentation (the “Rankings”)are based solely on Van Eck’s patented True Alpha® metric and, as such, does not represent the sole manner for ranking relative performance of investment funds. Users of thispresentation should not rely upon the Data or the Rankings to make an investment decision and should note that past performance is not an indication of future performance.Refer to page 2 and 3 for important disclosure notes.
Alpha is Volatile and Uncertain
Long/Short Equity Hedge Funds Annualized Risk & Return Jan 2011 – Dec 2012
= Hedge Funds Providing Superior Risk/Return Profiles Versus the Zero Alpha (aka Market) Line
Alpha is the shortest distance from the risk/return point of a fund to the market line Above the line = positive alpha Below the line = negative alpha
Alpha is not persistent and trends towards zero for individual funds over time
Alpha is more volatile than beta, as individual hedge funds have moved around more than the average and market line
(Positive Alpha Funds)
15
Retu
rn
Standard Deviation Standard Deviation
Retu
rn
Positive Alpha in 2011-2012Positive Alpha in 2009-2010
Institutional Sales Material. Not for distribution to the public.
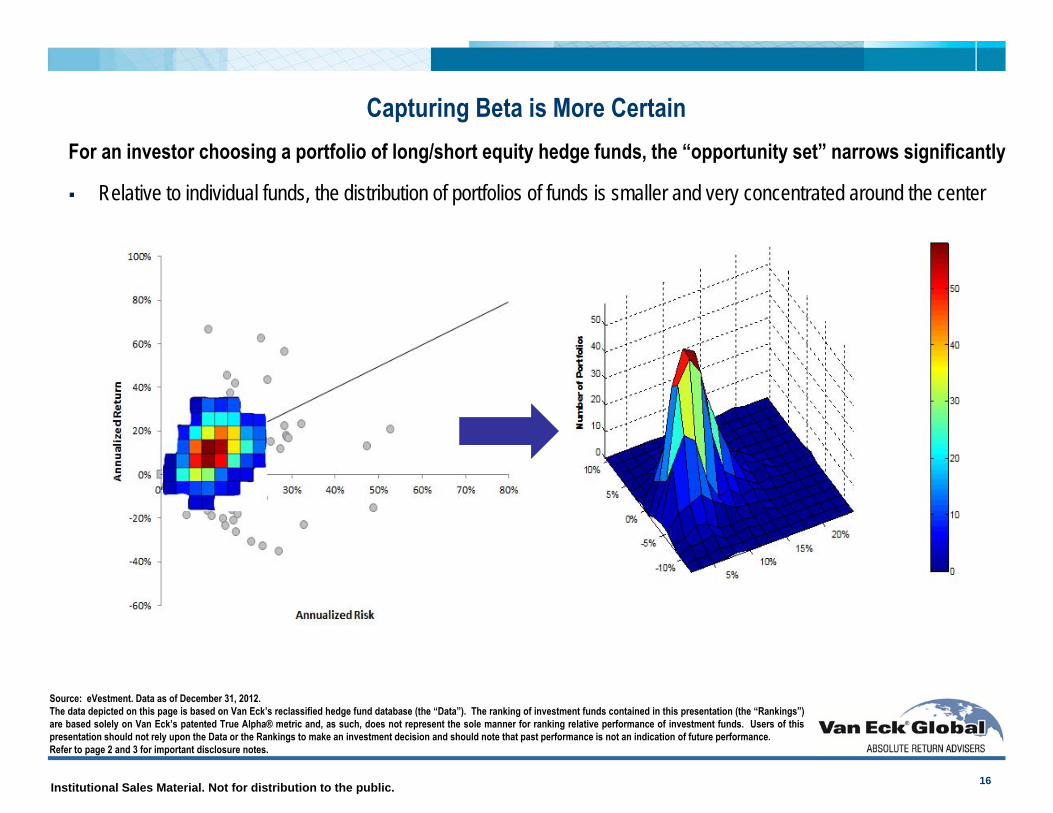
Benchmark ConstructionCapturing Beta is More Certain For an investor choosing a portfolio of long/short equity hedge funds, the “opportunity set” narrows significantly
Relative to individual funds, the distribution of portfolios of funds is smaller and very concentrated around the center
16
Source: eVestment. Data as of December 31, 2012.The data depicted on this page is based on Van Eck’s reclassified hedge fund database (the “Data”). The ranking of investment funds contained in this presentation (the “Rankings”)are based solely on Van Eck’s patented True Alpha® metric and, as such, does not represent the sole manner for ranking relative performance of investment funds. Users of thispresentation should not rely upon the Data or the Rankings to make an investment decision and should note that past performance is not an indication of future performance.Refer to page 2 and 3 for important disclosure notes.
Institutional Sales Material. Not for distribution to the public. 17
LSENA’s Investment Process Produces an “Investable” Benchmark from a “Non-Investable” Index of Hedge Funds:
MVLSNATR Index captured a 0.9 Beta relative to a universe of long/short equity North America hedge funds Since index inception (11/1/2003-Present).
Jan-04 Oct-04 Jul-05 Apr-06 Jan-07 Oct-07 Jul-08 Apr-09 Jan-10 Oct-10 Jul-11 Apr-12 Jan-13
-8%
-6%
-4%
-2%
0%
2%
4%
6%
8%
Mont
hly
Retu
rns
Roll ing 1 Month Wi ndows
MVLSNATR Index Pre-Inception Performance (Shaded Area from November 1, 2003 to November 20, 2012)MVLSNATR Index Live Performance (November 21, 2012 to Present)
Van Eck's Computed Universe (Index) of L/S Equity Hedge Funds ("Non-Investable") MVLSNATR Index ("Investable")
Source: FactSet. Data as of August 31, 2013.Past performance is not an indication, or guarantee, of future results. Indices are presented gross of fees. Indices are not instruments in which you can invest.“Non-Investable” Benchmarks/Indices refer to indices that track hedge fund performance and comprise actual hedge funds, which are not as accessible as ETPs, for various reasons,including when hedge funds may be closed to new investment or have restrictive terms.“Investable” Benchmarks/Indices refer to indices/portfolios that comprise assets that are easily accessible to investors, such as exchange-traded products (“ETPs”).Refer to pages 2 and 3 for important disclosure notes. See Appendix at the end of the presentation for index descriptions.
Capturing Hedge Fund Beta through Portfolios of Hedge Funds
Institutional Sales Material. Not for distribution to the public.
Investment Process
18
Institutional Sales Material. Not for distribution to the public.
Investment Process: Van Eck Long/Short Equity
-60%
-40%
-20%
0%
20%
40%
60%
80%
0% 10% 20% 30% 40% 50%
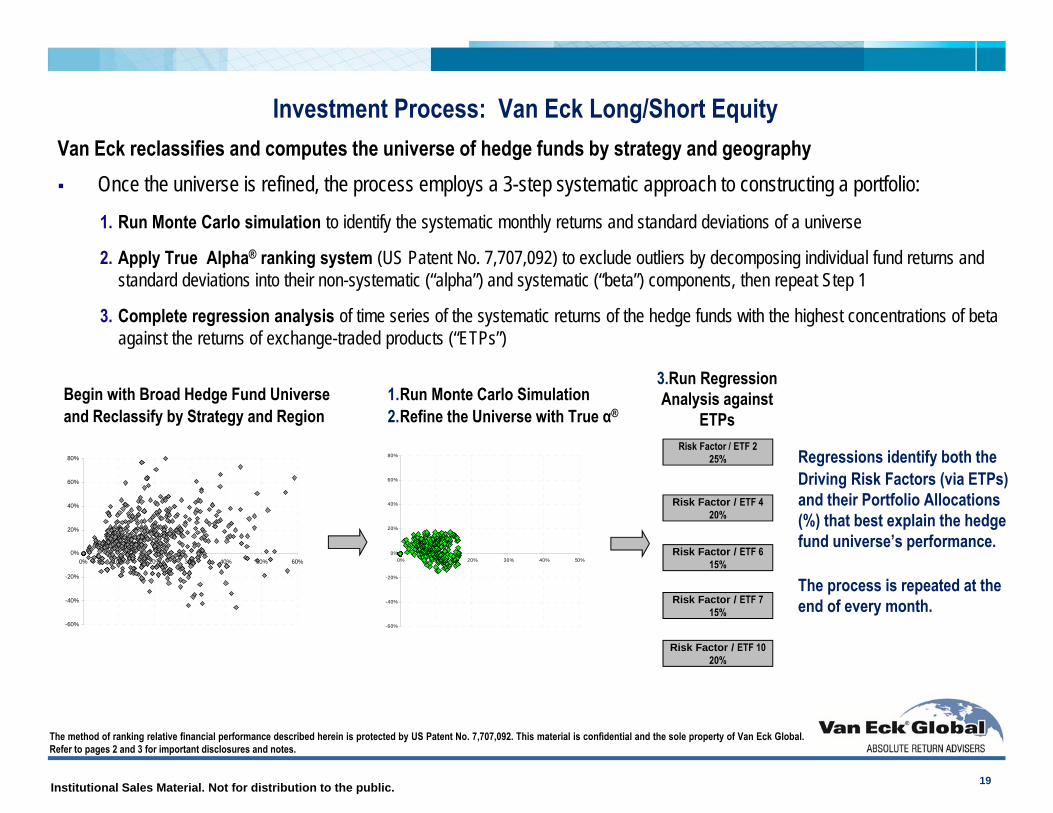
Regressions identify both theDriving Risk Factors (via ETPs) and their Portfolio Allocations (%) that best explain the hedge fund universe’s performance.
The process is repeated at the end of every month.
Begin with Broad Hedge Fund Universe and Reclassify by Strategy and Region
19
Risk Factor / ETF 225%
Risk Factor / ETF 420%
Risk Factor / ETF 615%
Risk Factor / ETF 715%
Risk Factor / ETF 1020%
Van Eck reclassifies and computes the universe of hedge funds by strategy and geography Once the universe is refined, the process employs a 3-step systematic approach to constructing a portfolio:
1. Run Monte Carlo simulation to identify the systematic monthly returns and standard deviations of a universe
2. Apply True Alpha® ranking system (US Patent No. 7,707,092) to exclude outliers by decomposing individual fund returns and standard deviations into their non-systematic (“alpha”) and systematic (“beta”) components, then repeat Step 1
3. Complete regression analysis of time series of the systematic returns of the hedge funds with the highest concentrations of beta against the returns of exchange-traded products (“ETPs”)
The method of ranking relative financial performance described herein is protected by US Patent No. 7,707,092. This material is confidential and the sole property of Van Eck Global.Refer to pages 2 and 3 for important disclosures and notes.
-60%
-40%
-20%
0%
20%
40%
60%
80%
0% 10% 20% 30% 40% 50% 60%
1.Run Monte Carlo Simulation 2.Refine the Universe with True α®
3.Run Regression Analysis against
ETPs
Institutional Sales Material. Not for distribution to the public.
Investment Process: Portfolio Allocations from Regression Analysis
20
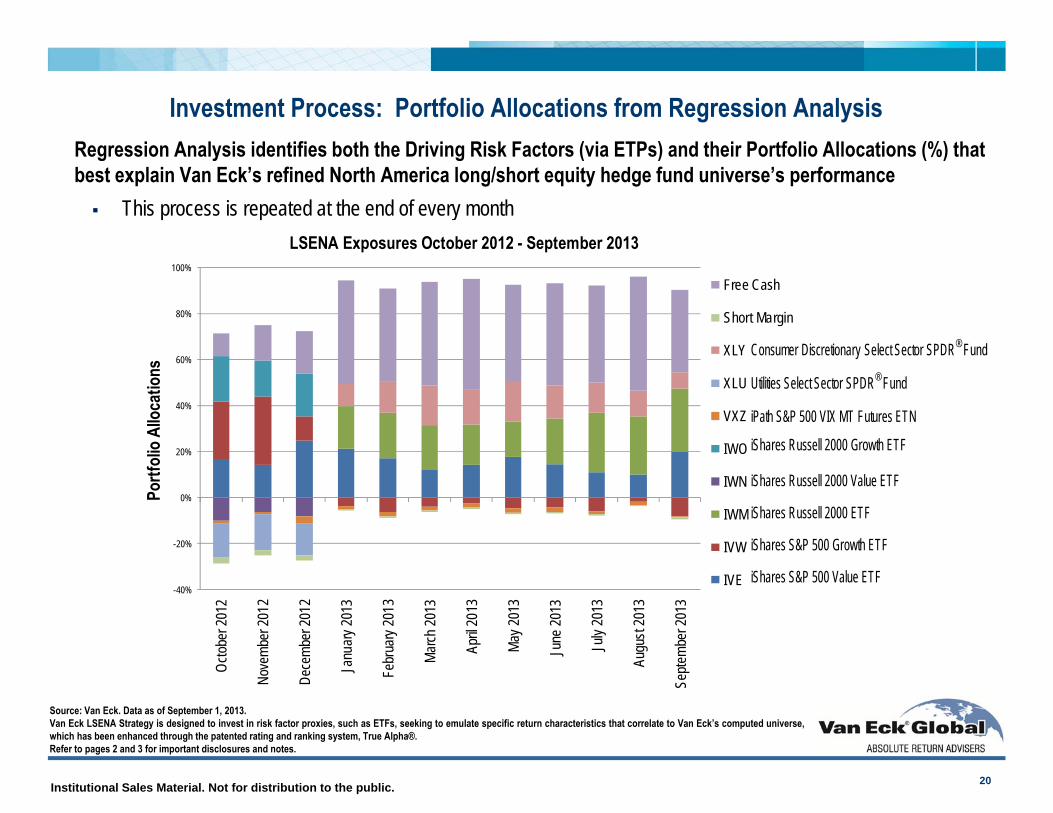
Source: Van Eck. Data as of September 1, 2013.Van Eck LSENA Strategy is designed to invest in risk factor proxies, such as ETFs, seeking to emulate specific return characteristics that correlate to Van Eck’s computed universe,which has been enhanced through the patented rating and ranking system, True Alpha®.Refer to pages 2 and 3 for important disclosures and notes.
Regression Analysis identifies both the Driving Risk Factors (via ETPs) and their Portfolio Allocations (%) that best explain Van Eck’s refined North America long/short equity hedge fund universe’s performance This process is repeated at the end of every month
-40%
-20%
0%
20%
40%
60%
80%
100%
Octob
er 20
12
Nove
mber
2012
Dece
mber
2012
Janu
ary 20
13
Febr
uary
2013
Marc
h 201
3
April
2013
May 2
013
June
2013
July
2013
Augu
st 20
13
Septe
mbe
r 201
3
LSENA Exposures October 2012 - September 2013
Free Cash
Short Margin
XLY
XLU
VXZ
IWO
IWN
IWM
IVW
IVE
Portf
olio A
lloca
tions
Consumer Discretionary Select Sector SPDR® Fund
Utilities Select Sector SPDR® Fund
iPath S&P 500 VIX MT Futures ETN
iShares Russell 2000 Growth ETF
iShares Russell 2000 Value ETF
iShares Russell 2000 ETF
iShares S&P 500 Growth ETF
iShares S&P 500 Value ETF
Institutional Sales Material. Not for distribution to the public.
Conclusion
Van Eck Long/Short Equity: A Liquid Alternative Strategy
KEY POINTS
Historically Consistent Risk/Return Characteristics
Low Volatility Equity Strategy
Quantitative Expertise and Repeatable Systematic Process
21
Refer to pages 2 and 3 for important disclosures and notes.
Institutional Sales Material. Not for distribution to the public.
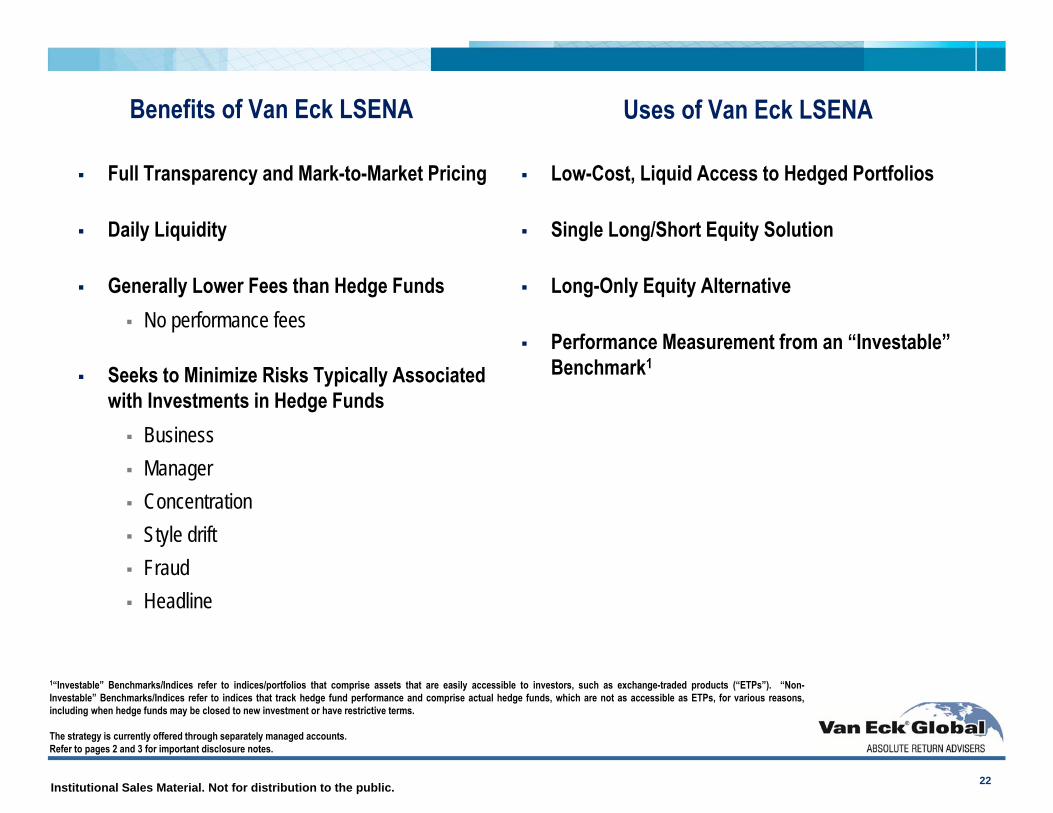
Benefits of Van Eck LSENA
Full Transparency and Mark-to-Market Pricing
Daily Liquidity
Generally Lower Fees than Hedge Funds No performance fees
Seeks to Minimize Risks Typically Associated with Investments in Hedge Funds Business Manager Concentration Style drift Fraud Headline
22
Uses of Van Eck LSENA
Low-Cost, Liquid Access to Hedged Portfolios
Single Long/Short Equity Solution
Long-Only Equity Alternative
Performance Measurement from an “Investable” Benchmark1
1“Investable” Benchmarks/Indices refer to indices/portfolios that comprise assets that are easily accessible to investors, such as exchange-traded products (“ETPs”). “Non-Investable” Benchmarks/Indices refer to indices that track hedge fund performance and comprise actual hedge funds, which are not as accessible as ETPs, for various reasons,including when hedge funds may be closed to new investment or have restrictive terms.
The strategy is currently offered through separately managed accounts.Refer to pages 2 and 3 for important disclosure notes.

Institutional Sales Material. Not for distribution to the public.
Appendix
23

Institutional Sales Material. Not for distribution to the public.
5-Ye
ar R
etur
n
0% 2% 4% 6% 8% 10% 12% 14% 16% 18% 20%
-2%
0%
2%
4%
6%
8%
10%
12%
14%
HFRI Equity Hedge Index
Barclays US Aggregate Bond Index
S&P 500 Index
Barclays US High Yield Credit Bond Index
HFRI Fund Weighted Composite Index
MV L/S Event Equity HFB IndexMV L/S Equity Developed Asia HFB Index
MV L/S Equity Western Europe Index
MV L/S Equity Global HFB Index
Barclays US Corporate Bond Index
MV L/S Equity Emerging Markets HFB Index
MV L/S Equity North Americal HFB Index
HFRI FOF: Strategic Index
Van Eck Long/Short Equity: 5-Year Risk/Return
5-Year Standard Deviation
24
Source: FactSet. Data as of September 30, 2013.Market Vectors Hedge Fund Beta Indices are presented with hypothetical pre-inception index performance prior to November 21, 2012. Refer to pages 2 and 3 for important disclosurenotes. Past performance is not an indication, or guarantee, of future results. Indices are presented gross of fees. Indices are not instruments in which you can invest.Hedge fund indices, denoted with the black diamonds, are considered “Non-Investable” indices. “Non-Investable” Benchmarks/Indices refer to indices that track hedge fundperformance and comprise actual hedge funds, which are not as accessible as ETPs, for various reasons, including when hedge funds may be closed to new investment or haverestrictive terms. “Investable” Benchmarks/Indices refer to indices/portfolios that comprise assets that are easily accessible to investors, such as exchange-traded products (“ETPs”).See Appendix at the end of the presentation for index descriptions.
Institutional Sales Material. Not for distribution to the public.
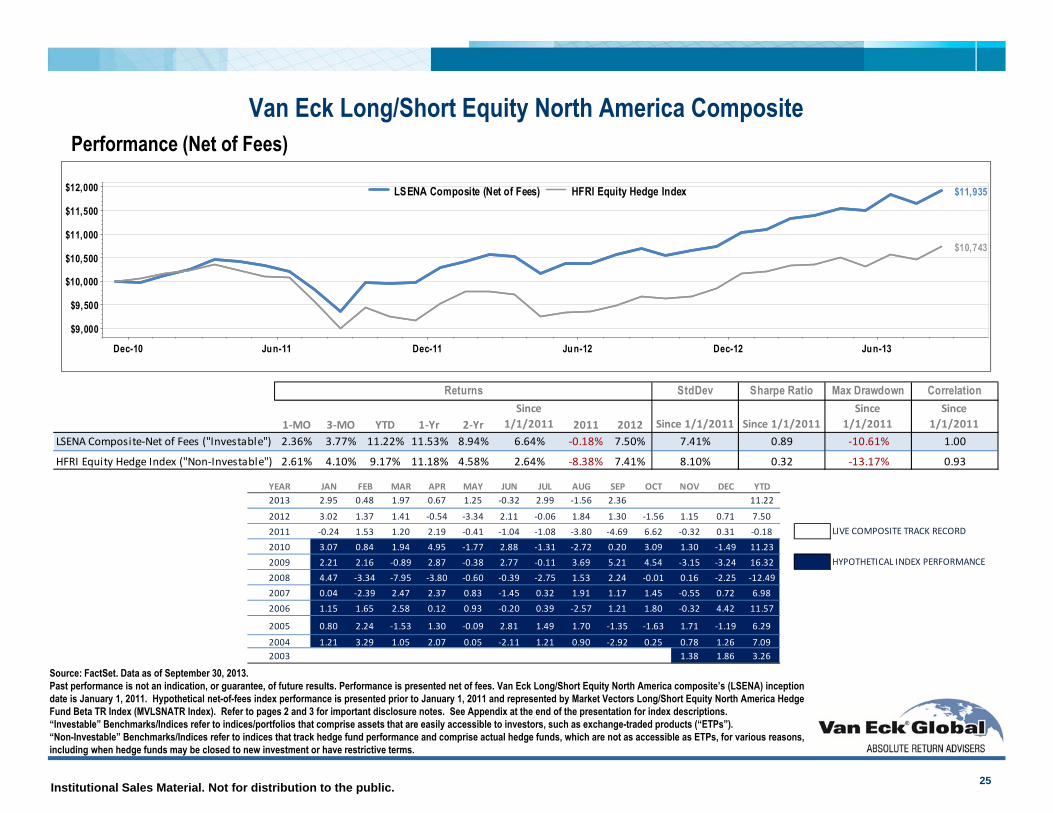
YEAR JAN FEB MAR APR MAY JUN JUL AUG SEP OCT NOV DEC YTD2013 2.95 0.48 1.97 0.67 1.25 ‐0.32 2.99 ‐1.56 2.36 11.22
2012 3.02 1.37 1.41 ‐0.54 ‐3.34 2.11 ‐0.06 1.84 1.30 ‐1.56 1.15 0.71 7.502011 ‐0.24 1.53 1.20 2.19 ‐0.41 ‐1.04 ‐1.08 ‐3.80 ‐4.69 6.62 ‐0.32 0.31 ‐0.18 LIVE COMPOSITE TRACK RECORD
2010 3.07 0.84 1.94 4.95 ‐1.77 2.88 ‐1.31 ‐2.72 0.20 3.09 1.30 ‐1.49 11.232009 2.21 2.16 ‐0.89 2.87 ‐0.38 2.77 ‐0.11 3.69 5.21 4.54 ‐3.15 ‐3.24 16.32 HYPOTHETICAL INDEX PERFORMANCE
2008 4.47 ‐3.34 ‐7.95 ‐3.80 ‐0.60 ‐0.39 ‐2.75 1.53 2.24 ‐0.01 0.16 ‐2.25 ‐12.492007 0.04 ‐2.39 2.47 2.37 0.83 ‐1.45 0.32 1.91 1.17 1.45 ‐0.55 0.72 6.982006 1.15 1.65 2.58 0.12 0.93 ‐0.20 0.39 ‐2.57 1.21 1.80 ‐0.32 4.42 11.57
2005 0.80 2.24 ‐1.53 1.30 ‐0.09 2.81 1.49 1.70 ‐1.35 ‐1.63 1.71 ‐1.19 6.29
2004 1.21 3.29 1.05 2.07 0.05 ‐2.11 1.21 0.90 ‐2.92 0.25 0.78 1.26 7.092003 1.38 1.86 3.26
Performance (Net of Fees)
25
Van Eck Long/Short Equity North America Composite
Source: FactSet. Data as of September 30, 2013.Past performance is not an indication, or guarantee, of future results. Performance is presented net of fees. Van Eck Long/Short Equity North America composite’s (LSENA) inceptiondate is January 1, 2011. Hypothetical net-of-fees index performance is presented prior to January 1, 2011 and represented by Market Vectors Long/Short Equity North America HedgeFund Beta TR Index (MVLSNATR Index). Refer to pages 2 and 3 for important disclosure notes. See Appendix at the end of the presentation for index descriptions.“Investable” Benchmarks/Indices refer to indices/portfolios that comprise assets that are easily accessible to investors, such as exchange-traded products (“ETPs”).“Non-Investable” Benchmarks/Indices refer to indices that track hedge fund performance and comprise actual hedge funds, which are not as accessible as ETPs, for various reasons,including when hedge funds may be closed to new investment or have restrictive terms.
StdDev Sharpe Ratio Max Drawdown Correlation
1‐MO 3‐MO YTD 1‐Yr 2‐YrSince
1/1/2011 2011 2012 Since 1/1/2011 Since 1/1/2011Since
1/1/2011Since
1/1/2011LSENA Composite‐Net of Fees ("Investable") 2.36% 3.77% 11.22% 11.53% 8.94% 6.64% ‐0.18% 7.50% 7.41% 0.89 ‐10.61% 1.00
HFRI Equity Hedge Index ("Non‐Investable") 2.61% 4.10% 9.17% 11.18% 4.58% 2.64% ‐8.38% 7.41% 8.10% 0.32 ‐13.17% 0.93
Returns
Dec-10 Jun-11 Dec-11 Jun-12 Dec-12 Jun-13
$9,000
$9,500
$10,000
$10,500
$11,000
$11,500
$12,000
$10,743
$11,935LSENA Composite (Net of Fees) HFRI Equity Hedge Index
Institutional Sales Material. Not for distribution to the public.
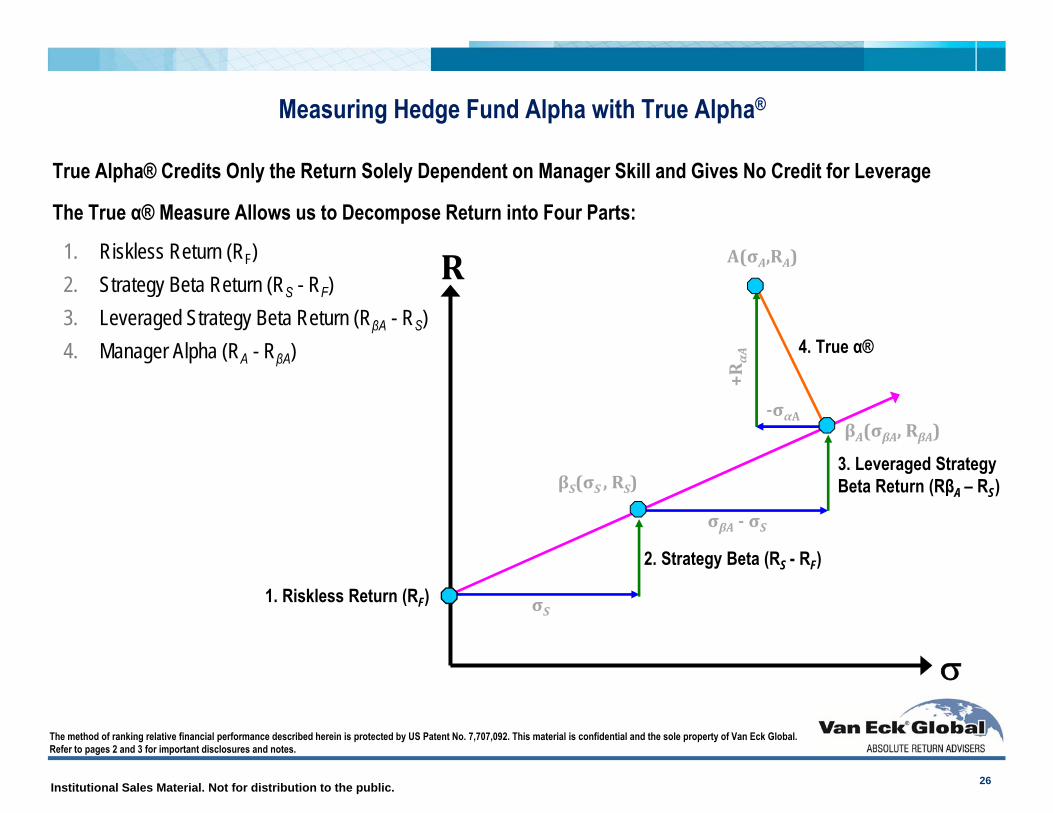
Measuring Hedge Fund Alpha with True Alpha®
1. Riskless Return (RF)2. Strategy Beta Return (RS - RF)3. Leveraged Strategy Beta Return (RβA - RS)4. Manager Alpha (RA - RβA)
R
‐σαA
+RαA
4. True α®
A(σA,RA)
σS
σβA ‐ σS
2. Strategy Beta (RS - RF)
3. Leveraged Strategy Beta Return (RβA – RS)
1. Riskless Return (RF)
βS(σS,RS)
βA(σβA, RβA)
The method of ranking relative financial performance described herein is protected by US Patent No. 7,707,092. This material is confidential and the sole property of Van Eck Global.Refer to pages 2 and 3 for important disclosures and notes.
True Alpha® Credits Only the Return Solely Dependent on Manager Skill and Gives No Credit for Leverage
The True α® Measure Allows us to Decompose Return into Four Parts:
26
Institutional Sales Material. Not for distribution to the public. 27
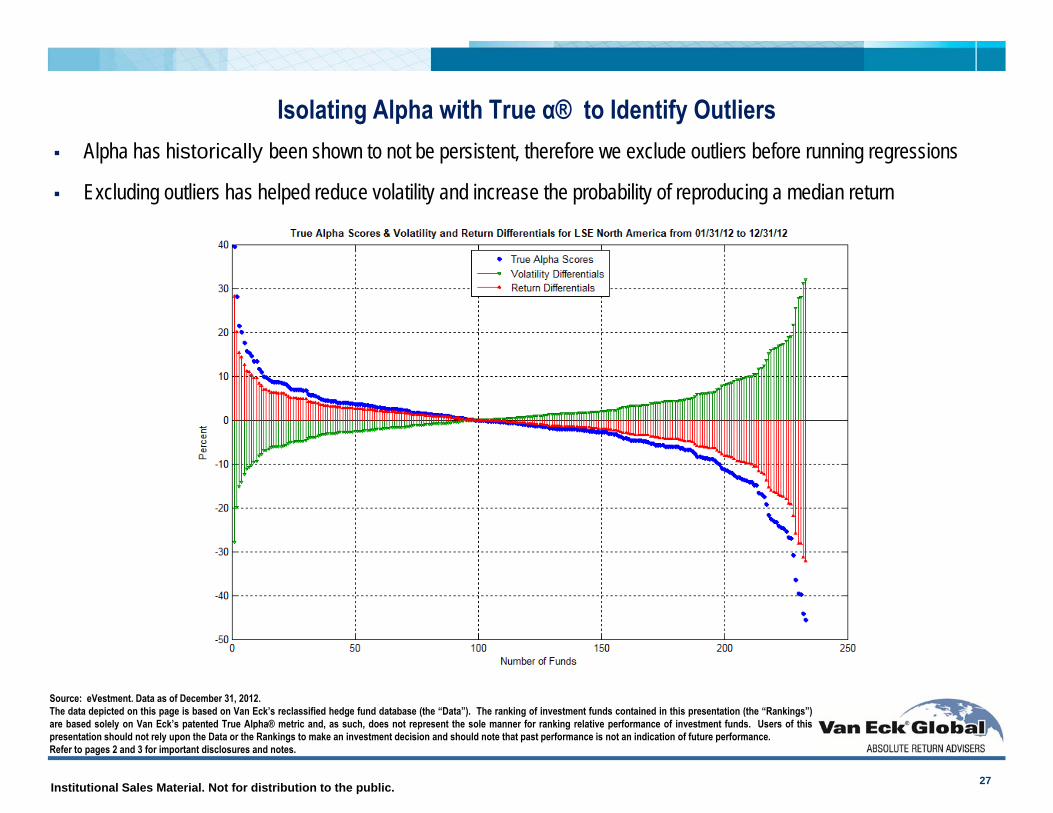
Isolating Alpha with True α® to Identify Outliers Alpha has historically been shown to not be persistent, therefore we exclude outliers before running regressions
Excluding outliers has helped reduce volatility and increase the probability of reproducing a median return
Source: eVestment. Data as of December 31, 2012.The data depicted on this page is based on Van Eck’s reclassified hedge fund database (the “Data”). The ranking of investment funds contained in this presentation (the “Rankings”)are based solely on Van Eck’s patented True Alpha® metric and, as such, does not represent the sole manner for ranking relative performance of investment funds. Users of thispresentation should not rely upon the Data or the Rankings to make an investment decision and should note that past performance is not an indication of future performance.Refer to pages 2 and 3 for important disclosures and notes.
Institutional Sales Material. Not for distribution to the public.
BiographiesMarc Freed is Portfolio Manager for the Van Eck Liquid Alternative investment strategies; he joined Van Eck in June 2012.
Prior to joining Van Eck, Mr. Freed worked at Lyster Watson. In April 2010, he developed the True Alpha® rating and ranking methodology, which waspatented. He is a mathematical economist with over 15 years of experience as a bond trader and investment banker and 10 years of experience as a fundof hedge funds portfolio manager. At Salomon Brothers in New York from 1982-1986, he ran the trading desk for U.S. Government zero coupon bonds(CATS® and STRIPS®). From 1986-1988, he created and managed Salomon’s UK Gilt trading desk in London. In 1989, Mr. Freed managed the Europeangovernment bond trading desk of Morgan Grenfell in London. At Deutsche Bank from 1994-1999, he developed proprietary fixed income pricing models andstructured commercial mortgage transactions as co-founder of Deutsche’s Franchise Finance Group.
Mr. Freed graduated from Brown University with a B.A. in Mathematics and Economics. He received his M.S. from the Sloan School at MIT. He completedcourse work and qualifying exams for a Ph.D. in Economics from the Leonard N. Stern School of Business at New York University. Mr. Freed specializes infinancial economics and game theory. In 2001-2002, Mr. Freed was a Visiting Professor of Economics at Union College.
Ben McMillan is Assistant Portfolio Manager for Van Eck Liquid Alternative investment strategies; he joined Van Eck in June 2012.
Prior to joining Van Eck, he worked at Lyster Watson where he was a quantitative analyst and responsible for the computation and production of thehedge fund strategy indices and maintained and developed the models associated with the quantitative investment strategies.
At American Express, Mr. McMillan held a quantitative role in risk management, developing acquisition risk and profitability decisioning.
Mr. McMillan graduated from Boston University with a B.A. & M.A. in economics. He later went on to receive his MSc in Econometrics from the LondonSchool of Economics.
28
Mark A. Hurrell, CFA is Director, Institutional Sales, responsible for business development and client services; he joined Van Eck in June 2012.
Mr. Hurrell has over 20 years of institutional asset management experience split between the alternative investment market and institutional investmentconsulting. Prior to joining Van Eck, Mr. Hurrell worked at Lyster Watson, and focused his efforts on the development of their “liquid alternative beta”strategies, True Alpha® Trackers. Previously, Mr. Hurrell was at Meridian Capital Partners, Inc. and The Archstone Partnerships, two fund-of-hedge fundmanagers. Prior to transitioning to the fund-of-hedge-funds business, he was a Senior Consultant for Yanni-Bilkey Investment Consulting where he wasresponsible for developing investment policy, asset allocation, investment manager selection, and performance evaluation for a broad range of institutionaland high net worth investors. Mr. Hurrell has a strong financial background, having also held positions managing the New York Euro CD trading desk forCredit Suisse First Boston and as a money market trader for Pittsburgh National Bank. He also taught financial accounting and investment analysis classesat Carnegie Mellon University while attending graduate school. Mr. Hurrell is a member of the Investment Committee for the Association of AmericanMedical Colleges.
Mr. Hurrell received his B.S. in Business Administration from the Indiana University of Pennsylvania and M.B.A. from CarnegieMellon University (Beta Gamma Sigma) where he was the recipient of the Yuji Ijiri Award for Excellence in Accounting. Mr. Hurrell isa CFA charterholder and member of the New York Society of Security Analysts.
Institutional Sales Material. Not for distribution to the public. 29
Index Disclosure and DefinitionsIndex Disclosure & Definitions:The index information is included to show general risk return data and is not intended to imply that the Fund’s portfolio will be similar to the indices either in composition or element of risk. You cannot invest directly in an index. Refer to important disclosures on pages 2 and 3 of this presentation for additional details. Source: FactSet.
Barclays Aggregate Bond Composite Index is comprised of approximately 6,000 publicly traded bonds including US Government, mortgage-backed, corporate, and Yankee bonds with an approximate average maturity of 10 years.
Barclays US Aggregate Corporate Total Return Index is a broad-based benchmark that measures the investment grade, fixed-rate, taxable, corporate bond market. It includes USD-denominatedsecurities publicly issued by U.S. and non-U.S. industrial, utility, and financial issuers that meet specified maturity, liquidity and quality requirements.
Barclays High Yield Credit Bond Index covers the universe of fixed rate, non-investment grade, publicly traded bonds (rated Ba1/BB+ or lower). The bonds have at least one year to final maturity, as well as at least $150 million par amount outstanding.
Morningstar U.S. Long/Short Equity Category Average is the average return of the U.S. long/short equity hedge funds comprising the universe. Long-short portfolios hold sizable stakes in both long and short positions in equities and related derivatives. Some funds that fall into this category will shift their exposure to long and short positions depending on their macro outlook or the opportunities they uncover through bottom-up research. Some funds may simply hedge long stock positions through exchange-traded funds or derivatives. At least 75% of the assets are in equity securities or derivatives.
HFRI FOF: Strategic Index contains Fund of Funds that are classified as "Strategic" and exhibit one or more of the following characteristics: seeks superior returns by primarily investing in funds that generally engage in more opportunistic strategies such as Emerging Markets, Sector specific, and Equity Hedge; exhibits a greater dispersion of returns and higher volatility compared to the HFRI Fund of Funds Composite Index. A fund in the HFRI FOF Strategic Index tends to outperform the HFRI Fund of Fund Composite Index in up markets and underperform the index in down markets.
HFRI Fund Weighted Composite Index is an equal-weighted index that currently includes over 2000 constituent funds, both domestic and offshore. No Fund of Funds are included in the Index. All funds report Net of All Fees returns on a monthly basis and must have at least $50 Million under management or have been actively trading for at least twelve (12) months to be included.
HFRI Equity Hedge Total Index contains Equity Hedge strategies that maintain positions both long and short in primarily equity and equity derivative securities, from a wide variety of investment processes that can be broadly diversified or narrowly focused on specific sectors and can range broadly in terms of levels of net exposure, leverage employed, holding period, concentrations of market capitalizations and valuation ranges of typical portfolios.
S&P 500 DRI (Dividends Reinvested) is a registered trademark of Standard & Poor's, a division of The McGraw-Hill Companies, Inc. The Standard & Poor's 500 (S&P 500). This is an unmanaged and market-value weighted index which includes a representative sample of 500 companies in leading industries of the U.S. economy. The diverse index comprises over 70% of the total market capitalization of all stocks traded in the U.S.
Market Vectors Hedge Fund Beta Indices seek to capture the systematic returns (beta) of hedge funds with similar investment styles that invest in the same asset classes and geographic markets. The indices employ a patented rating and ranking system that filters out funds with low beta as compared to their hedge fund peer group, which seeks to enhance the indices' risk-adjusted returns. Each index is constructed using transparent, liquid ETFs to seek to produce hedge fund-style returns.