value-driven industrial property investment & …...exclusively focused on southern california...
TRANSCRIPT
Value-Driven Industrial Property Investment & ManagementInfill Southern California
June 2014
This page intentionally left blank
Forward Looking Statements
This presentation contains “forward-looking statements” within the meaning of the Private Securities Litigation Reform Act of 1995. We caution investors that any forward-looking statements presented herein are based on management’s beliefs and assumptions and information currently available to management. Such statements are subject to risks, uncertainties and assumptions and may beaffected by known and unknown risks, trends, uncertainties and factors that are beyond our control. Should one or more of these risks or uncertainties materialize, or should underlying assumptions prove incorrect, actual results may vary materially from thoseanticipated, estimated or projected. These risks and uncertainties include, without limitation: general risks affecting the real estate industry (including, without limitation, the market value of our properties, the inability to enter into or renew leases at favorable rates, portfolio occupancy varying from our expectations, dependence on tenants’ financial condition, and competition from other developers, owners and operators of real estate); risks associated with the disruption of credit markets or a global economic slowdown; risks associated with the potential loss of key personnel (most importantly, members of senior management); risks associated with our failure to maintain our status as a REIT under the Internal Revenue Code of 1986, as amended; possible adverse changes in tax and environmental laws; and potential liability for uninsured losses and environmental contamination. The risks described above are not exhaustive, and additional factors could adversely affect our business and financial performance, including those discussed in our annual report on Form 10-K for the year ended December 31, 2013, and subsequent filings with the Securities and Exchange Commission. We expressly disclaim any responsibility to update forward-looking statements, whether as a result of new information, future events or otherwise.
3

The Rexford Mission
4
SAN BERNARDINO COUNTYLOS ANGELES COUNTYVENTURA COUNTY
RIVERSIDE COUNTY
Focused exclusively on generating superior risk-adjusted returns through value-driven industrial property investments located in prime, Southern California infill markets demonstrating favorable long-term tenant demand fundamentals, by capitalizing upon Rexford’s ability to source a volume of high-quality, accretive investment opportunities and our ability to develop and retain high quality employees.
Rexford Property

“Pure-Play” Southern California Industrial Expert
The Rexford Story & Opportunity
Experienced Management Team with Vertically-Integrated Platform
High Quality Properties Located in Superior Infill Locations that Command Premium Rents
Portfolio Well-Positioned to Capitalize on Increasing Occupancy and Rising Rents
Significant External Growth Prospects Driven by Proprietary Deal Sourcing Methods
Growth-Oriented Capital Structure
5

Our Expertise Focused on Southern California
6
Name / Position Biography
Howard SchwimmerCo-Chief Executive
Officer
Exclusively focused on Southern California industrial real estate for 30 years with expertise in property acquisitions, development, value-add repositioning, management, sales and leasing
12 years of experience at Rexford; co-founded Rexford in 2001 Successful track record of acquiring, repositioning, developing, leasing, selling and adding value to
more than 30 million square feet of industrial property in infill Southern California Prior to co-founding Rexford, Executive Vice President and Broker of Record for DAUM
Commercial, California’s oldest industrial real estate brokerage company
Michael FrankelCo-Chief Executive
Officer
Over 27 years of experience focused on Southern California real estate, private equity investing, merger and acquisition advisory, and senior management operating roles
10 years of experience co-managing Rexford Successful track record leading Rexford platform growth to over 7 million square feet under
management Previously responsible for investments at C3, a private equity investment partnership with Comcast
Corporation and manager with LEK Consulting, providing strategic advisory to leading investment institutions
Adeel KhanChief Financial Officer
Previously served as Vice President, Controller at MPG Office Trust (NYSE: MPG), at the time the largest owner of class-A office buildings in downtown Los Angeles
14 years of real estate experience and 16 years of public company finance experience including with the Walt Disney Company and Arthur Andersen LLP
Richard Ziman Chairman
Over 40 years of Southern California industrial real estate experience as an investor 12 years of experience at Rexford; co-founded Rexford in 2001 Founder / Chairman / CEO of Arden Realty, Inc. (NYSE: ARI) which he took public in 1996 and then
expanded the portfolio from 4 million square feet to approximately 18.5 million square feet at the time of its sale in 2006
Responsible for ARI’s investment strategy focused on office properties in infill Southern California Markets
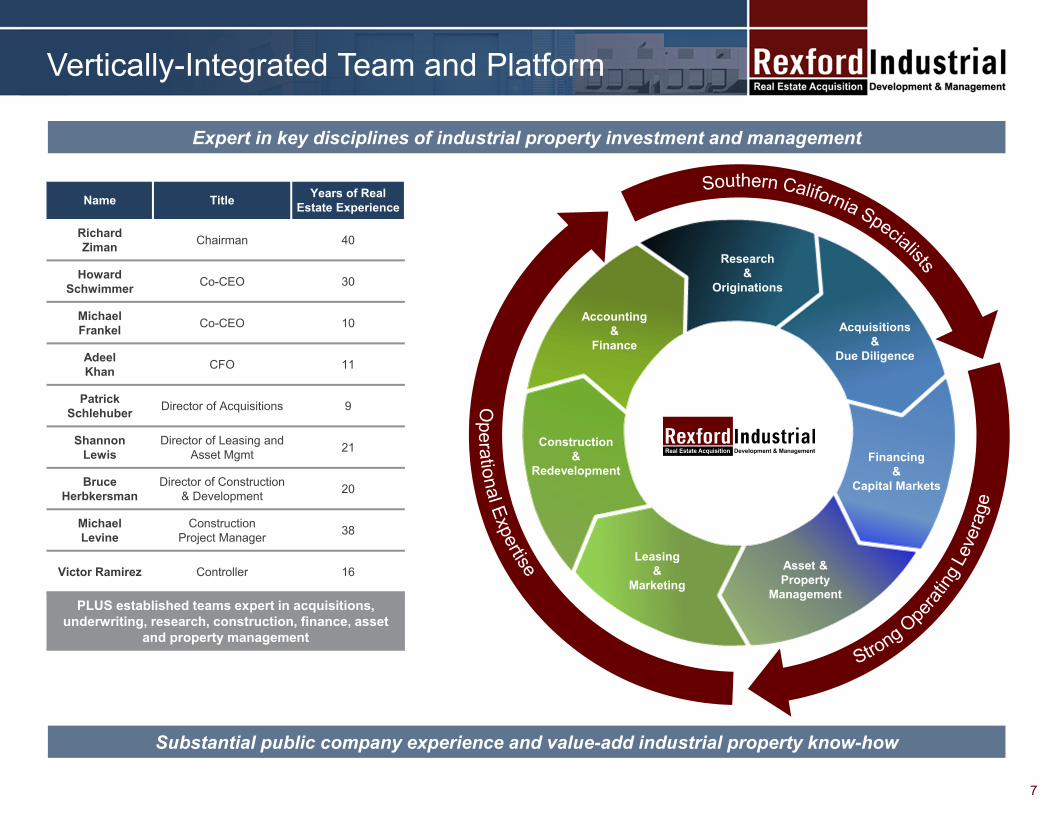
Vertically-Integrated Team and Platform
Expert in key disciplines of industrial property investment and management
Name Title Years of Real Estate Experience
RichardZiman Chairman 40
HowardSchwimmer Co-CEO 30
Michael Frankel Co-CEO 10
Adeel Khan CFO 11
PatrickSchlehuber Director of Acquisitions 9
ShannonLewis
Director of Leasing and Asset Mgmt 21
BruceHerbkersman
Director of Construction & Development 20
MichaelLevine
Construction Project Manager 38
Victor Ramirez Controller 16
PLUS established teams expert in acquisitions, underwriting, research, construction, finance, asset
and property management
Substantial public company experience and value-add industrial property know-how
7
Research &
Originations
Acquisitions &
Due Diligence
Accounting &
Finance
Construction&
Redevelopment
Leasing &
Marketing
Financing&
Capital Markets
Asset & Property
Management
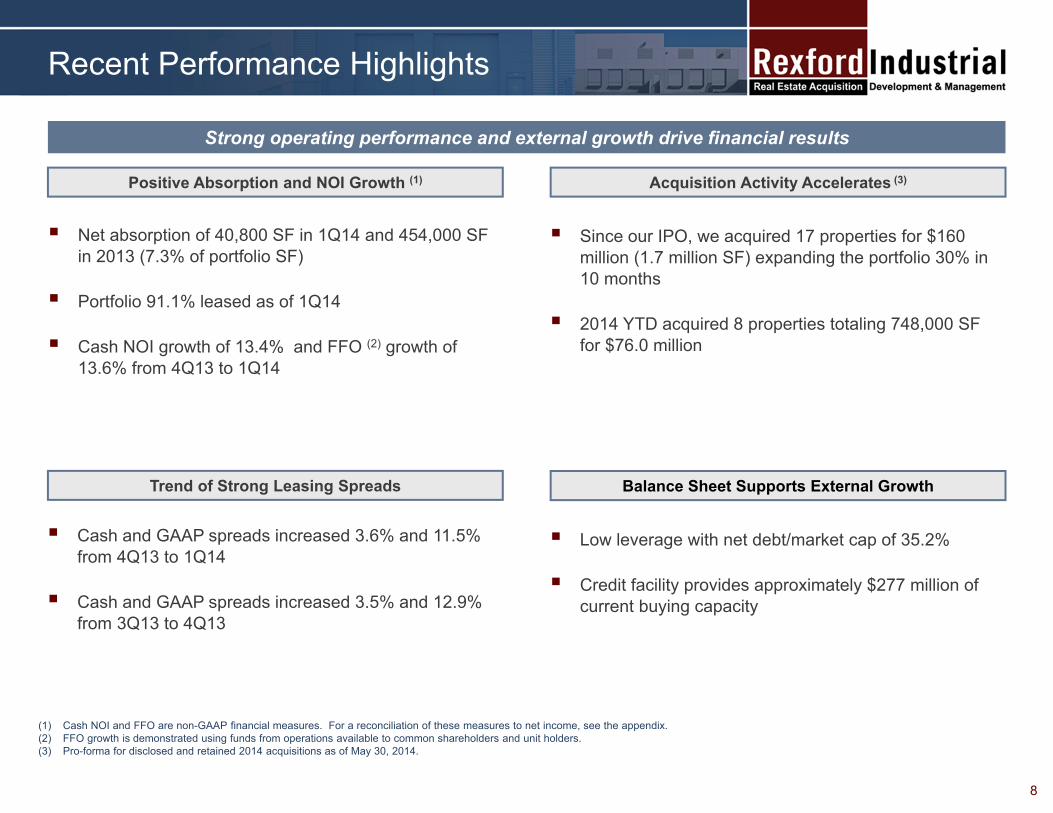
(1) Cash NOI and FFO are non-GAAP financial measures. For a reconciliation of these measures to net income, see the appendix.(2) FFO growth is demonstrated using funds from operations available to common shareholders and unit holders.(3) Pro-forma for disclosed and retained 2014 acquisitions as of May 30, 2014.
Recent Performance Highlights
Net absorption of 40,800 SF in 1Q14 and 454,000 SF in 2013 (7.3% of portfolio SF)
Portfolio 91.1% leased as of 1Q14
Cash NOI growth of 13.4% and FFO (2) growth of 13.6% from 4Q13 to 1Q14
Positive Absorption and NOI Growth (1) Acquisition Activity Accelerates (3)
Balance Sheet Supports External GrowthTrend of Strong Leasing Spreads
Since our IPO, we acquired 17 properties for $160 million (1.7 million SF) expanding the portfolio 30% in 10 months
2014 YTD acquired 8 properties totaling 748,000 SF for $76.0 million
Cash and GAAP spreads increased 3.6% and 11.5% from 4Q13 to 1Q14
Cash and GAAP spreads increased 3.5% and 12.9% from 3Q13 to 4Q13
Low leverage with net debt/market cap of 35.2%
Credit facility provides approximately $277 million of current buying capacity
Strong operating performance and external growth drive financial results
8

Growth Since IPO Last Year (1) (2) (3) (4)
9
5,668 SF6,500 SF 6,712 SF
$7,974 $8,326 $9,047
‐
1,000
2,000
3,000
4,000
5,000
6,000
7,000
8,000
9,000
10,000
3Q13 (1) 4Q13 1Q14
SQFT GAAP NOI
(1) As Rexford’s IPO consummated during the third quarter on July 24, 2013, the full third quarter GAAP NOI and FFO per share data have been quarterized by extrapolating upon financial performance from July 24, 2013 to September 30, 2013.
(2) Square footage and GAAP NOI are in thousands. FFO is per weighted average shares outstanding.(3) FFO growth is demonstrated using funds from operations available to common shareholders and unit holders.(4) FFO is a non-GAAP financial measures. For a reconciliation of FFO to net income, see the appendix.
FFO $0.16/sh
FFO $0.17/sh
FFO $0.19/sh
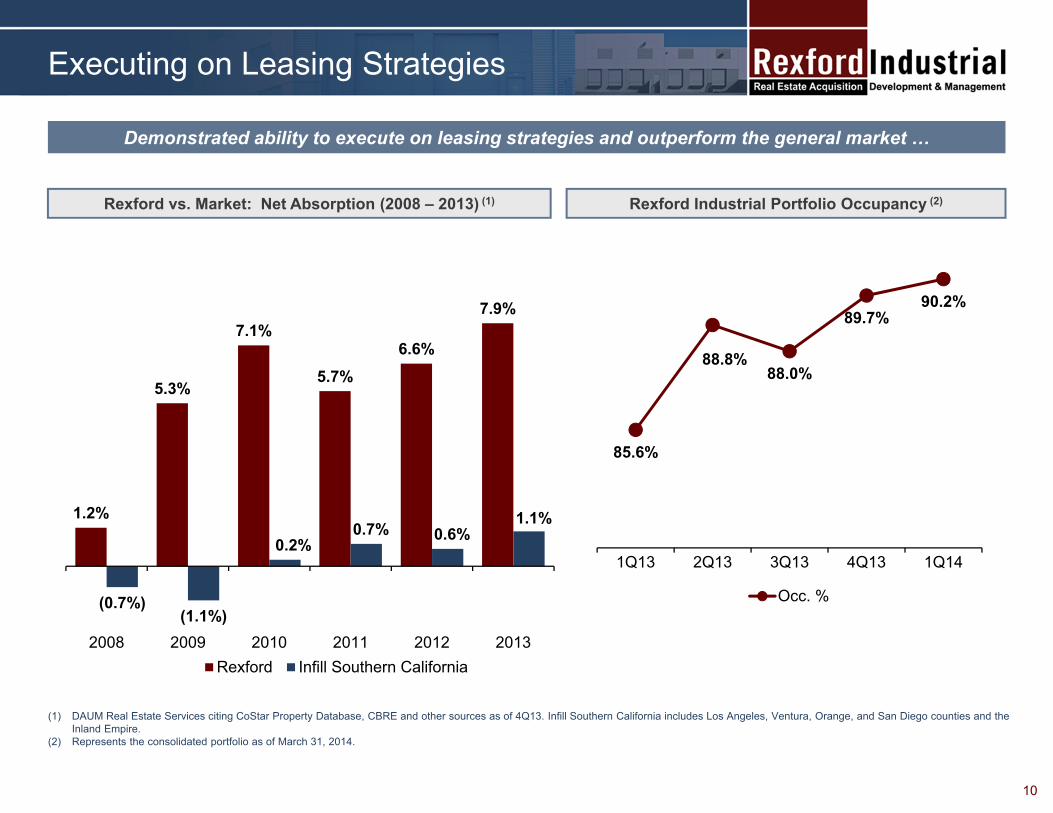
1.2%
5.3%
7.1%
5.7%6.6%
7.9%
(0.7%)(1.1%)
0.2% 0.7% 0.6%
1.1%
2008 2009 2010 2011 2012 2013Rexford Infill Southern California
Executing on Leasing Strategies
(1) DAUM Real Estate Services citing CoStar Property Database, CBRE and other sources as of 4Q13. Infill Southern California includes Los Angeles, Ventura, Orange, and San Diego counties and the Inland Empire.
(2) Represents the consolidated portfolio as of March 31, 2014.
Demonstrated ability to execute on leasing strategies and outperform the general market …
Rexford vs. Market: Net Absorption (2008 – 2013) (1)
10
Rexford Industrial Portfolio Occupancy (2)
85.6%
88.8%88.0%
89.7%90.2%
1Q13 2Q13 3Q13 4Q13 1Q14
Occ. %

Realizing Internal Growth
(1) Cash NOI and FFO are non-GAAP financial measures. For a reconciliation of these measures to net income, see the appendix.(2) Per public company filings as of 1Q 2014 calculated using a straight average. Peers include DCT, EGP, FR, PLD, and TRNO. Growth statistics are across the consolidated portfolio from 4Q 2013
to 1Q 2014.
Positive releasing spreads and cash NOI demonstrate robust internal growth (1)
Rexford Releasing Spreads
11
Opportunity to renew expiring leases at
higher rents.
Rexford vs. Peers: Cash NOI Growth (2)
6.7%
12.9%11.5%
(1.1%)
3.5% 3.6%
3Q13 4Q13 1Q14
GAAP Cash
13.4%
2.9%
1Q14
Rexford Peers

(1) All information is derived from market materials prepared by DAUM Real Estate Services as of 4Q 2013 citing CoStar Property Database, CBRE and other sources.
(25%)
(20%)
(15%)
(10%)
(5%)
0%
5%
10%
15%
2008 2009 2010 2011 2012 2013 2014E 2015E
Multi-Tenant Rent % Change Single Tenant Rent % Change% Change from Peak % Change from Peak
Compelling Rental Rate Growth Profile
Rexford’s portfolio is positioned to capitalize on improving rents (1)
So. California Industrial – Indexed Asking Rents and Annual Rent Changes
Increasing market rents are supporting robust releasing spreads
Rents peaked in early ‘08
Peak to trough decline of roughly 25% Multi-tenant asking rents have
rebounded from trough levels, but remain roughly 15% below
prior peak
12
CBRE projects multi-tenant market rents to increase 8%
annually over the next 2 years
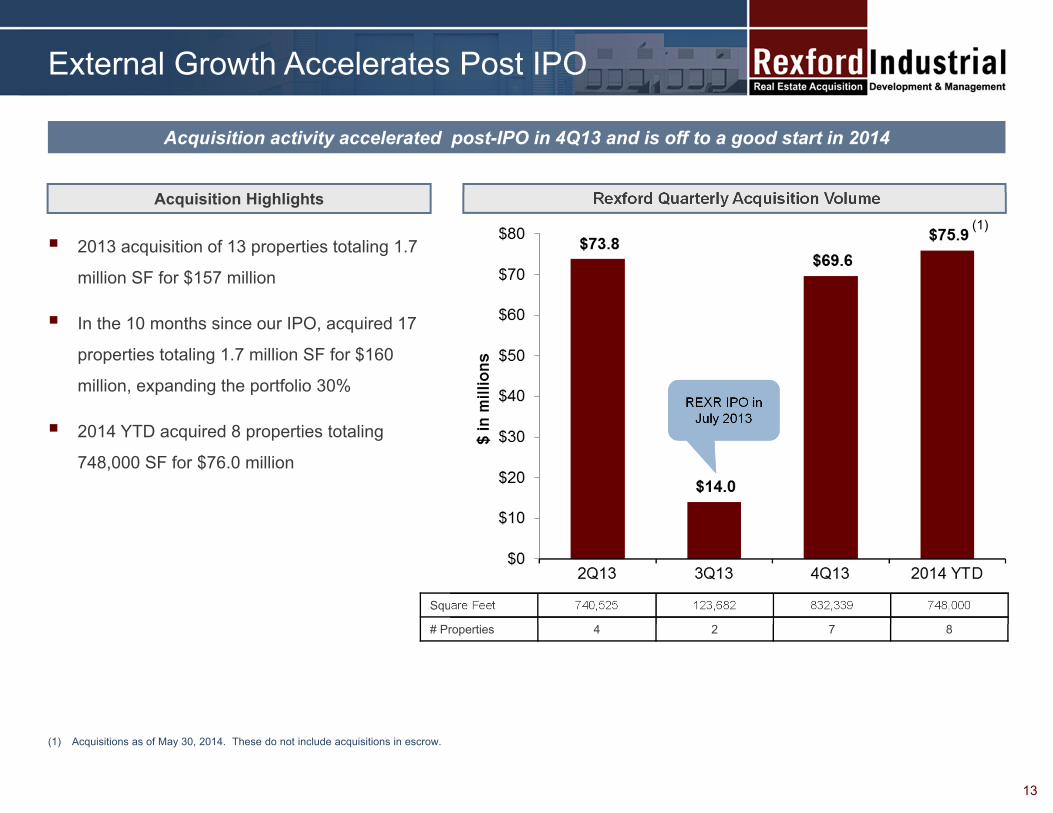
External Growth Accelerates Post IPO
Acquisition activity accelerated post-IPO in 4Q13 and is off to a good start in 2014
Rexford Quarterly Acquisition Volume
13
2013 acquisition of 13 properties totaling 1.7
million SF for $157 million
In the 10 months since our IPO, acquired 17
properties totaling 1.7 million SF for $160
million, expanding the portfolio 30%
2014 YTD acquired 8 properties totaling
748,000 SF for $76.0 million
Acquisition Highlights
Square Feet 740,525 123,682 832,339 748,000
# Properties 4 2 7 8
(1) Acquisitions as of May 30, 2014. These do not include acquisitions in escrow.
REXR IPO in July 2013
(1)
Market Has Significant External Growth Potential
(1) Source: DAUM Real Estate Services as of 4Q 2013 citing CoStar Property Database, CBRE and other sources.(2) Weighted by square feet of public REITs DCT, EGP, FR, PLD and TRNO. Portfolio data as of 4Q13.
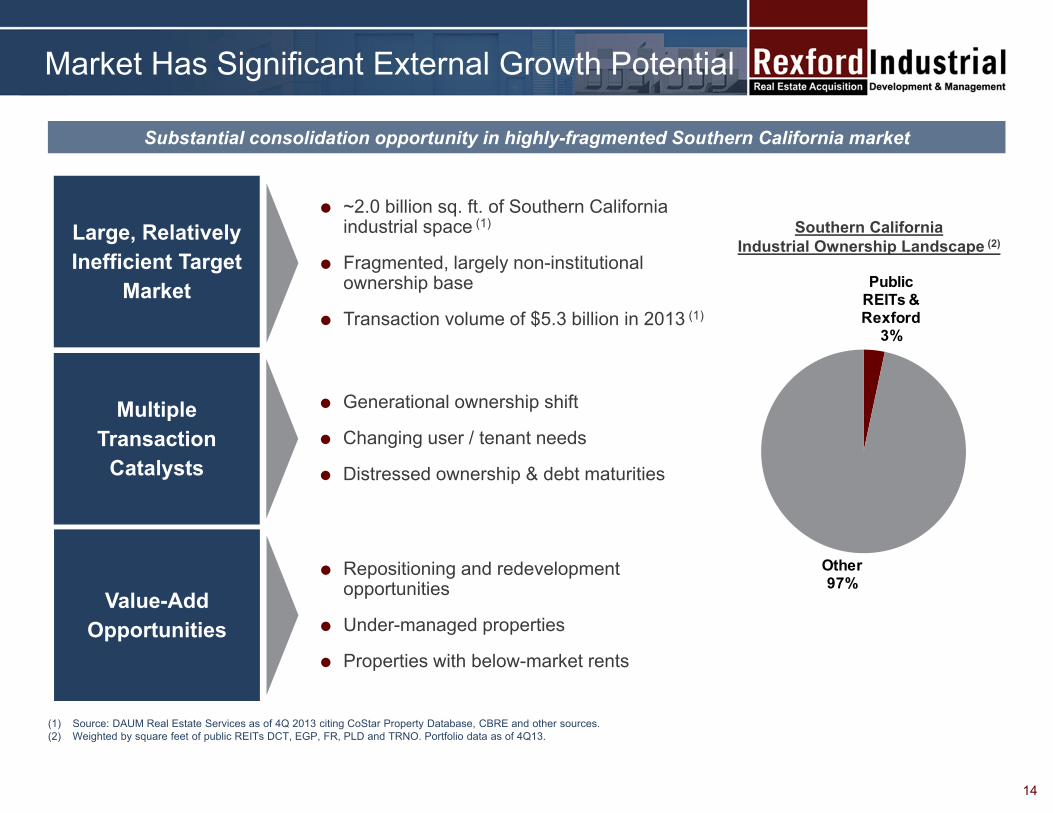
Substantial consolidation opportunity in highly-fragmented Southern California market
~2.0 billion sq. ft. of Southern California industrial space (1)
Fragmented, largely non-institutional ownership base
Transaction volume of $5.3 billion in 2013 (1)
Large, Relatively Inefficient Target
Market
Generational ownership shift
Changing user / tenant needs
Distressed ownership & debt maturities
Multiple Transaction
Catalysts
Southern California Industrial Ownership Landscape (2)
Repositioning and redevelopment opportunities
Under-managed properties
Properties with below-market rents
Value-Add Opportunities
Public REITs & Rexford
3%
Other97%
14

Relationships developed over 30+ years
Extensive broker marketing and incentives
Superior alignment with key market participants
Proprietary Deal Sourcing Capabilities
Extensive database mining of brokers, owners and lenders
Event-driven research & catalysts Debt / distress monitoring Detailed property and transaction
analyses
Favorable access to on- and off-market investment opportunities
Acquired 4.7 million square feet of industrial real estate since 2011
Deep Relationships, Marketing &Premier Rexford Brand
Actively monitoring and pursuing approximately 40 million square feet of opportunities
Approximately 50% of acquisitions since inception were off-market
Proven Research & Analytics
Competitive Sourcing Advantage
15

Proven Origination Methods
(1) Off market or lightly marketed transaction.(2) Excludes one asset in Tempe, AZ and one asset in Glenview, IL totaling 121,377 square feet. 16
Property Sq Ft Price ($mm) PSF Acquisition Date County Transaction Catalyst Off Market (1)
2014
YTD
Crescent Bay Drive 46,178 $6.5 $140 May-14 Orange Generational ownership shift
San Fernando Road 130,800 $15.4 $118 May-14 Los Angeles Fund divestment
Saturn Way 170,865 $21.1 $123 Apr-14 Orange Fund divestment
Frampton 47,903 $3.9 $82 Mar-14 Los Angeles Generational ownership shift
West 228th Street 88,330 $6.6 $74 Feb-14 Los Angeles Generational ownership shift
Ontario Airport Business Park 113,612 $8.6 $75 Feb-14 San Bernardino Fund divestment
Oxnard Street 78,000 $8.9 $114 Jan-14 Los Angeles Generational ownership shift
Rosecrans 72,000 $5.0 $69 Jan-14 Los Angeles Sale-Leaseback / Corporate Surplus
Q4
2013
Vanowen 31,037 $3.4 $109 Dec-13 Los Angeles Near term debt maturity
Madera 199,370 $15.8 $79 Dec-13 Ventura Sale-Leaseback / Corporate Surplus
Bonita Thompson 365,859 $27.2 $74 Dec-13 Los Angeles Fund divestment
The Park 120,313 $10.6 $88 Nov-13 Orange Partnership dissolution
Yorba Linda Business Park 115,760 $12.7 $110 Nov-13 Orange Bank-owned auction
Q1-
Q3
2013
Tarzana & Orion 123,676 $14.0 $113 Aug-13 Los Angeles Generational ownership shift
240th Street 100,851 $5.0 $50 May-13 Los Angeles Corporate Surplus
Benson 88,256 $7.2 $81 Apr-13 San Bernardino Generational ownership shift
Glendale Commerce 473,345 $56.2 $119 Apr-13 Los Angeles Broken portfolio sale
Broadway 78,183 $5.4 $70 Apr-13 Los Angeles Tax-motivated trade
2012
Del Norte 125,514 $9.5 $76 Dec-12 Ventura Generational ownership shift
Calvert 81,282 $5.6 $69 Dec-12 Los Angeles Generational ownership shift
Mission Oaks 1,188,407 $59.1 $50 Jun-12 Ventura Distressed Owner
Campus 107,861 $4.8 $45 Mar-12 San Bernardino Sale-Leaseback
2011
Cornerstone Portfolio (2) 235,292 $16.9 $72 Dec-11 Los Angeles Fund dissolution
Jersey 107,568 $7.6 $71 Nov-11 San Bernardino Generational ownership shift
Golden Valley 58,084 $3.6 $62 Nov-11 Los Angeles Near term debt maturity
Odessa 29,544 $2.8 $93 Aug-11 Los Angeles Generational ownership shift
MacArthur 122,060 $8.5 $70 Aug-11 Orange Sale-Leaseback
Vinedo 48,381 $5.2 $107 May-11 Los Angeles Generational ownership shift

Creating Value at Acquired Properties
17
(1) Value-add acquisitions that demonstrate increases in occupancy.
Track record of increasing cash flow by leasing value-add acquisitions
Property (1) Sq. Ft. Date Acquired Occ. %at Acquisition
Occ. %at 03/31/14
Occ. ppt Change
58,084 Nov-11 70% 99% 29 ppt
107,568 Nov-11 80% 86% 6 ppt
85,950 Dec-11 68% 95% 27 ppt
69,592 Dec-11 91% 100% 9 ppt
49,466 Dec-11 73% 100% 27 ppt
48,388 Jul-13 90% 97% 7 ppt
75,288 Aug-13 81% 90% 9 ppt
Golden Valley
Tarzana
Orion
Normandie
Arrow
Shoemaker
Jersey

(1) Data as of March 31, 2014.(2) Based on diluted basis, including OP units treated as equivalent to outstanding common stock, but excluding unvested shares of restricted stock at March 31, 2014.(3) These are potential options and the company may choose not to pursue a particular source, or that source may be unavailable or undesirable due to market conditions.(4) Data as of March 31, 2014. Amounts are in millions.
Growth-Oriented Capital Structure
Flexible and conservative balance sheet, positioned for growth
Strong Balance Sheet (1)
Net Debt / Market Capitalization (2): 35.2%
Approximately $277 million of current buying capacity
No significant debt maturities until 2016
Diverse Potential Capital Sources (3)
Credit line accordion expansion
Secured & unsecured financing
Unsecured term loan
Potential capital market alternatives
18
$0 $5
$145
$0 $0
$60
$3
2014 2015 2016 2017 2018 2019 Later
Debt Maturity Schedule (4)
Southern California – Unique Combination of FactorsCreate Nation’s Dominant Industrial Market (1)
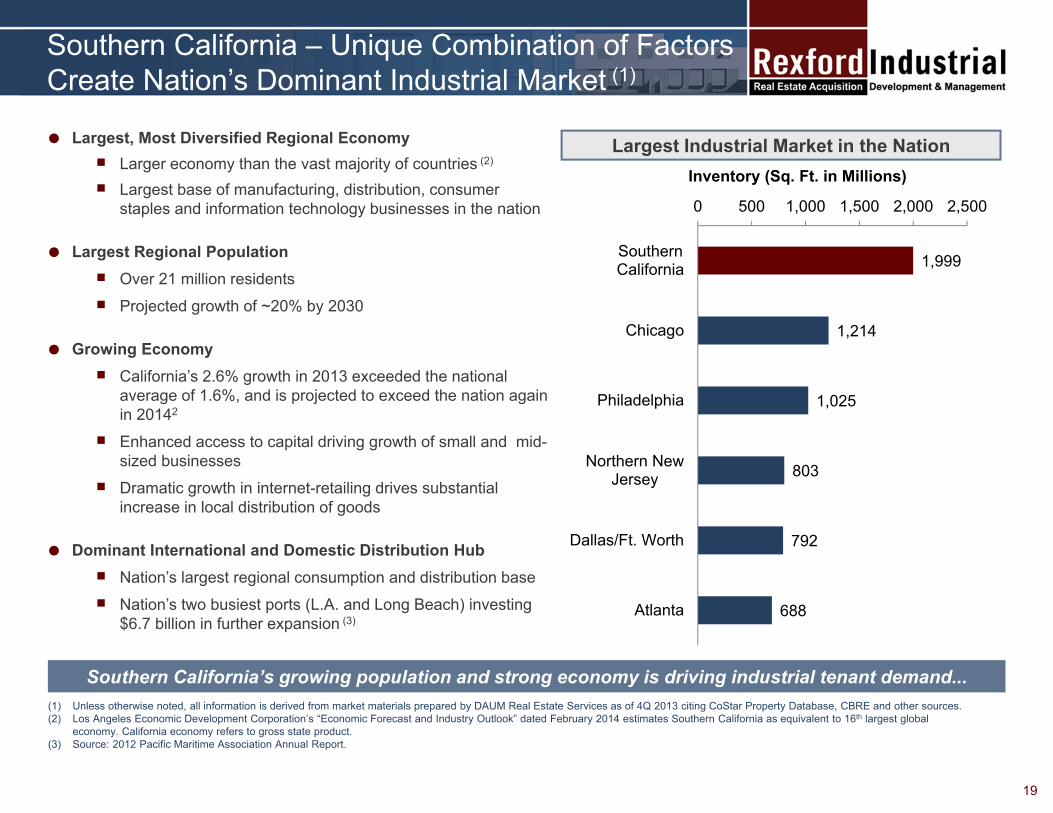
Largest, Most Diversified Regional Economy Larger economy than the vast majority of countries (2)
Largest base of manufacturing, distribution, consumer staples and information technology businesses in the nation
Largest Regional Population Over 21 million residents Projected growth of ~20% by 2030
Growing Economy California’s 2.6% growth in 2013 exceeded the national
average of 1.6%, and is projected to exceed the nation again in 20142
Enhanced access to capital driving growth of small and mid-sized businesses
Dramatic growth in internet-retailing drives substantial increase in local distribution of goods
Dominant International and Domestic Distribution Hub Nation’s largest regional consumption and distribution base Nation’s two busiest ports (L.A. and Long Beach) investing
$6.7 billion in further expansion (3)
Southern California’s growing population and strong economy is driving industrial tenant demand...
Largest Industrial Market in the Nation
(1) Unless otherwise noted, all information is derived from market materials prepared by DAUM Real Estate Services as of 4Q 2013 citing CoStar Property Database, CBRE and other sources.(2) Los Angeles Economic Development Corporation’s “Economic Forecast and Industry Outlook” dated February 2014 estimates Southern California as equivalent to 16th largest global
economy. California economy refers to gross state product.(3) Source: 2012 Pacific Maritime Association Annual Report.
19
1,999
1,214
1,025
803
792
688
0 500 1,000 1,500 2,000 2,500
SouthernCalifornia
Chicago
Philadelphia
Northern NewJersey
Dallas/Ft. Worth
Atlanta
Inventory (Sq. Ft. in Millions)

88%
91%
94%
97%
100%
2001 2003 2005 2007 2009 2011 2013Southern California U.S. Avg. Other Top Market Avg.
0%
1%
2%
3%
4%
5%
2001 2003 2005 2007 2009 2011 2013
Single-Tenant % Change Multi-Tenant % Change
Strong Industrial Market Fundamentals
(1) Unless otherwise noted, all information is derived from market materials prepared by DAUM Real Estate Services as of 4Q 2013 citing CoStar Property Database, CBRE and other sources.(2) Other top market average includes Chicago, Philadelphia, Northern New Jersey, Dallas / Ft. Worth and Atlanta.(3) Values denote rents / occupancies at 4Q 2013.
Physical and economic barriers limit supply, contributing to tight occupancy and high rents
Highest Occupancy in the Nation (1) (2) (3) Highest Rental Rates in the Nation (1) (2) (3)
Limited New Supply (1)
Infill markets with a scarcity of developable land
Substantial geographic and natural barriers
Restrictive entitlement processes requiring significant relationships and expertise to navigate
Lease rates that do not justify the cost of land and new construction
Ongoing conversion of infill industrial to alternative uses reduces supply
% Change of Southern California Existing Industrial Stock
95%
92%91%
$0.67
$0.42$0.40
$0.20
$0.35
$0.50
$0.65
$0.80
2001 2003 2005 2007 2009 2011 2013Southern California U.S. Avg. Other Top Market Avg.
Predominantly non-infill Inland Empire;
73% of total
20

Primary Infill Submarkets
San Fernando Valley172M SF
1.1%$0.67/SF
San Gabriel Valley145M SF
2.2%$0.56/SF
Central LA128M SF
2.3%$0.69/SF
Mid-Counties108M SF
2.6%$0.57/SF
South Bay217M SF
2.3%$0.60/SF
Vernon / Commerce
76M / 85M SF1.7% / 2.6%
$0.54 / $0.49 SF
North OC110M SF
2.3%$0.56/SF
West OC41M SF
3.4%$0.59/SF
OC Airport69M SF
3.0%$0.68/SF
Legend:SubmarketMarket Size
Vacancy RateNNN Asking Rent
Source: All data per CBRE as of 4Q13. Market rents are triple-net (NNN), gross rates not provided.
Ventura County Los Angeles County
San Gabriel Mountains
San Bernardino Mountains
The 120 cities in Los Angeles and Orange County are clustered into 9 primary submarkets
These submarkets range in size from 40 million to 220 million SF
Rexford capitalizes upon its SoCal focus to execute across diverse local dynamics including building codes, taxes, tenant demand and usage requirements
San Bernardino County
Riverside County
Orange County
Santa Ana Mountains
Santa Monica Mountains
Ventura County62M SF
6.0%$0.59/SF
San Diego County(Not Shown)
Warehouse / Light Ind.43M / 67M SF8.7% / 5.8%
$0.67 / $0.74 SF
21
Our High Quality, Infill Industrial Portfolio
Highlights Property Diversification by Square Feet (1)
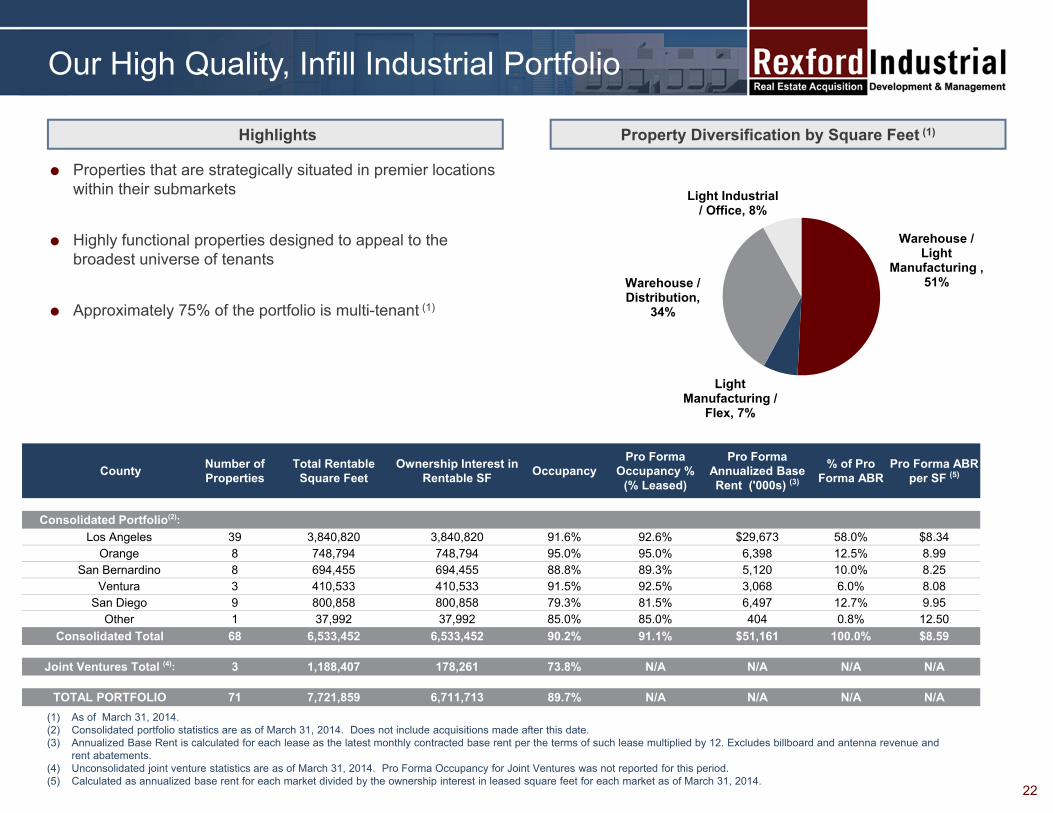
Properties that are strategically situated in premier locations within their submarkets
Highly functional properties designed to appeal to the broadest universe of tenants
Approximately 75% of the portfolio is multi-tenant (1)
(1) As of March 31, 2014.(2) Consolidated portfolio statistics are as of March 31, 2014. Does not include acquisitions made after this date.(3) Annualized Base Rent is calculated for each lease as the latest monthly contracted base rent per the terms of such lease multiplied by 12. Excludes billboard and antenna revenue and
rent abatements. (4) Unconsolidated joint venture statistics are as of March 31, 2014. Pro Forma Occupancy for Joint Ventures was not reported for this period.(5) Calculated as annualized base rent for each market divided by the ownership interest in leased square feet for each market as of March 31, 2014.
22
Warehouse / Light
Manufacturing , 51%
Light Manufacturing /
Flex, 7%
Warehouse / Distribution,
34%
Light Industrial / Office, 8%
County Number of Properties
Total Rentable Square Feet
Ownership Interest in Rentable SF Occupancy
Pro Forma Occupancy %
(% Leased)
Pro Forma Annualized Base Rent ('000s) (3)
% of Pro Forma ABR
Pro Forma ABR per SF (5)
Consolidated Portfolio(2):Los Angeles 39 3,840,820 3,840,820 91.6% 92.6% $29,673 58.0% $8.34
Orange 8 748,794 748,794 95.0% 95.0% 6,398 12.5% 8.99 San Bernardino 8 694,455 694,455 88.8% 89.3% 5,120 10.0% 8.25
Ventura 3 410,533 410,533 91.5% 92.5% 3,068 6.0% 8.08 San Diego 9 800,858 800,858 79.3% 81.5% 6,497 12.7% 9.95
Other 1 37,992 37,992 85.0% 85.0% 404 0.8% 12.50 Consolidated Total 68 6,533,452 6,533,452 90.2% 91.1% $51,161 100.0% $8.59
Joint Ventures Total (4): 3 1,188,407 178,261 73.8% N/A N/A N/A N/A
TOTAL PORTFOLIO 71 7,721,859 6,711,713 89.7% N/A N/A N/A N/A

Adaptable, Feature-Rich Space Is Advantageous
Multi-use, mid-sized space serves market’s largest universe of tenants while minimizing re-tenanting costs
Tenant Diversity Sq. Ft.
1. Freight transportation arrangement 27,113
2. Wholesale ink and toner 23,040
3. Distribution of auto parts and accessories 22,600
4. Plastics distribution 20,761
5. General merchandise distribution 19,391
6. Distribution of infant related items 18,685
7. Freight transportation arrangement 17,186
8. Import / wholesale of metal toolboxes 15,587
9. Import / wholesale of metal toolboxes 15,100
10. Mailing / shipping equipment and services 13,791
11. Imported furnishings distribution 12,793
12. Produce growing / shipping 11,987
13. Computer cases wholesale 11,757
14. Distribution of electronic components 11,457
Don Julian (City of Industry, CA) 241,248 SF 100% leased 14 tenants / businesses Tenant spaces ranging from 11,000 to 27,000 SF
23
Institutional “Big-box” Features Valued by Tenants
Dock-high loading High clear-heights support advanced racking systems ESFR (high pressure) fire sprinklers widens tenant base High-image/signage for smaller businesses
Don Julian
(1) As of March 31, 2014.(2) Calculated on the basis of the gross square feet under all leases at consolidated properties in the Rexford portfolio as of March 31, 2014.(3) Annualized Base Rent is calculated for each lease as the latest monthly contracted base rent per the terms of such lease multiplied by 12. Excludes billboard and antenna revenue and rent
abatements.
Diversified, Stable Tenant Base
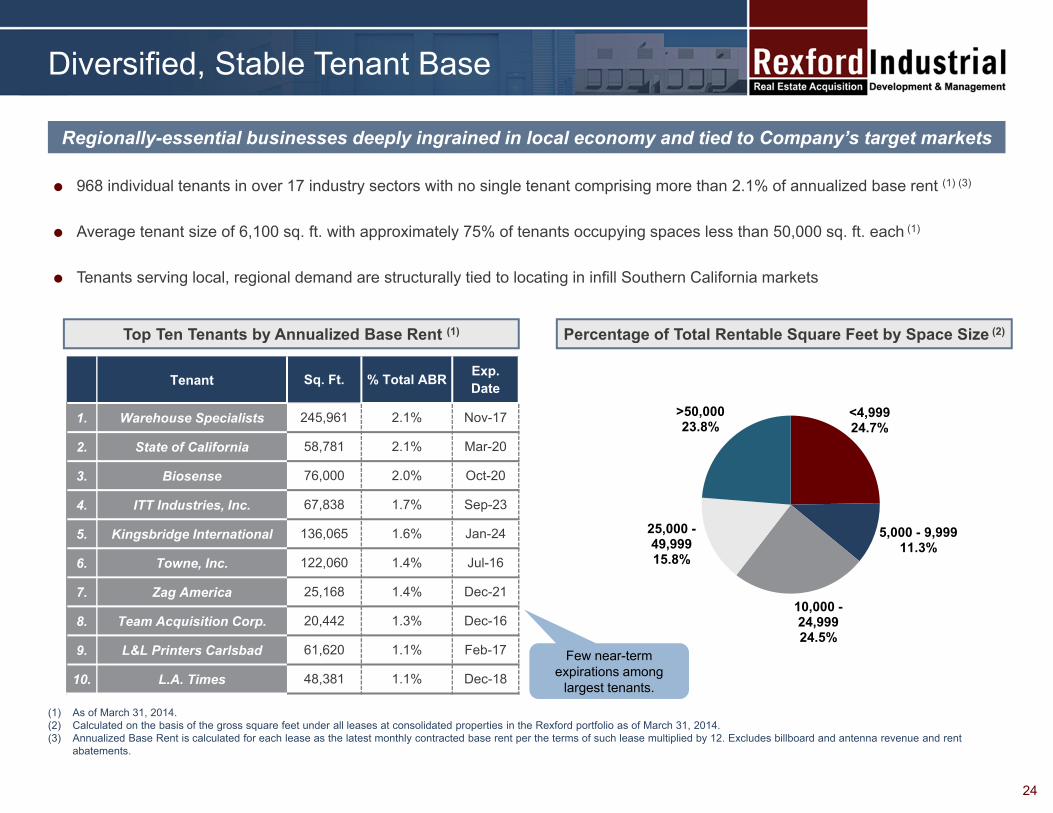
Regionally-essential businesses deeply ingrained in local economy and tied to Company’s target markets
Percentage of Total Rentable Square Feet by Space Size (2)
968 individual tenants in over 17 industry sectors with no single tenant comprising more than 2.1% of annualized base rent (1) (3)
Average tenant size of 6,100 sq. ft. with approximately 75% of tenants occupying spaces less than 50,000 sq. ft. each (1)
Tenants serving local, regional demand are structurally tied to locating in infill Southern California markets
24
Tenant Sq. Ft. % Total ABR Exp. Date
1. Warehouse Specialists 245,961 2.1% Nov-17
2. State of California 58,781 2.1% Mar-20
3. Biosense 76,000 2.0% Oct-20
4. ITT Industries, Inc. 67,838 1.7% Sep-23
5. Kingsbridge International 136,065 1.6% Jan-24
6. Towne, Inc. 122,060 1.4% Jul-16
7. Zag America 25,168 1.4% Dec-21
8. Team Acquisition Corp. 20,442 1.3% Dec-16
9. L&L Printers Carlsbad 61,620 1.1% Feb-17
10. L.A. Times 48,381 1.1% Dec-18
Top Ten Tenants by Annualized Base Rent (1)
Few near-term expirations among
largest tenants.
<4,999 24.7%
5,000 - 9,999 11.3%
10,000 -24,99924.5%
25,000 -49,99915.8%
>50,00023.8%

“Pure-Play” Southern California Industrial Expert
The Rexford Story & Opportunity
Experienced Management Team with Vertically-Integrated Platform
High Quality Properties Located in Superior Infill Locations that Command Premium Rents
Portfolio Well-Positioned to Capitalize on Increasing Occupancy and Rising Rents
Significant External Growth Prospects Driven by Proprietary Deal Sourcing Methods
Growth-Oriented Capital Structure
25
Appendix
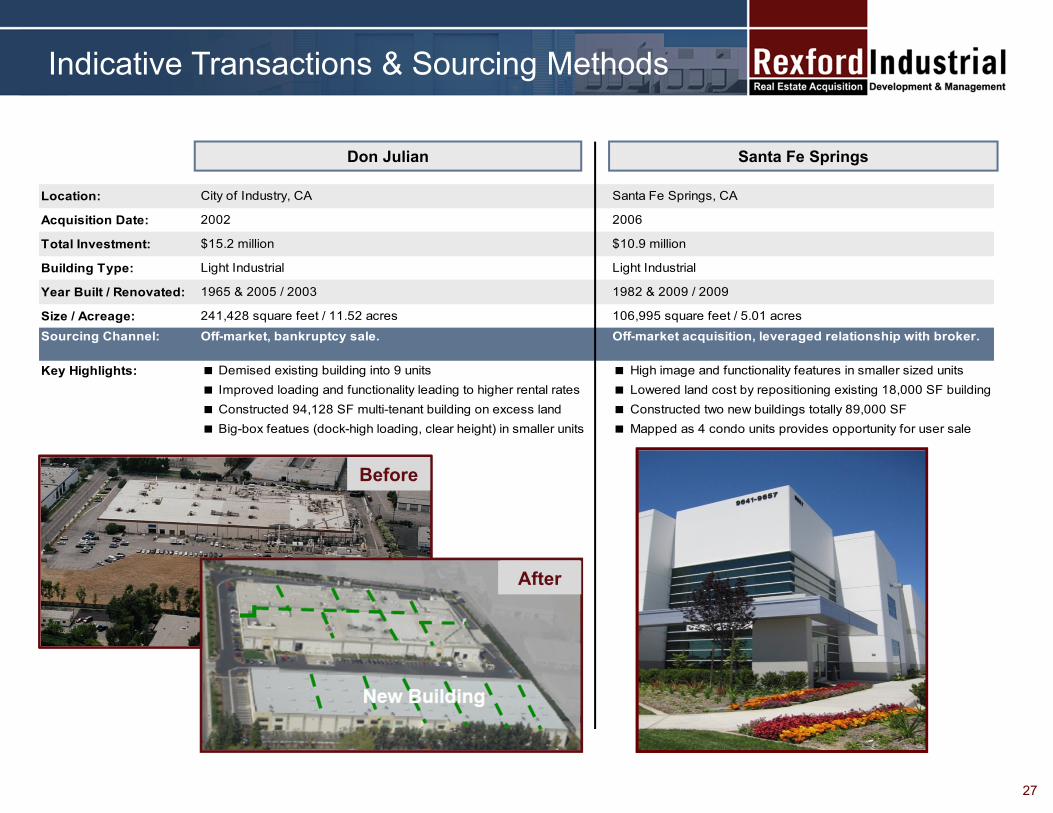
Indicative Transactions & Sourcing Methods
Santa Fe SpringsDon Julian
Before
After
Location: City of Industry, CA Santa Fe Springs, CA
Acquisition Date: 2002 2006
Total Investment: $15.2 million $10.9 million
Building Type: Light Industrial Light Industrial
Year Built / Renovated: 1965 & 2005 / 2003 1982 & 2009 / 2009
Size / Acreage: 241,428 square feet / 11.52 acres 106,995 square feet / 5.01 acresSourcing Channel: Off-market, bankruptcy sale. Off-market acquisition, leveraged relationship with broker.
Key Highlights: Demised existing building into 9 units High image and functionality features in smaller sized units Improved loading and functionality leading to higher rental rates Lowered land cost by repositioning existing 18,000 SF building Constructed 94,128 SF multi-tenant building on excess land Constructed two new buildings totally 89,000 SF Big-box featues (dock-high loading, clear height) in smaller units Mapped as 4 condo units provides opportunity for user sale
27
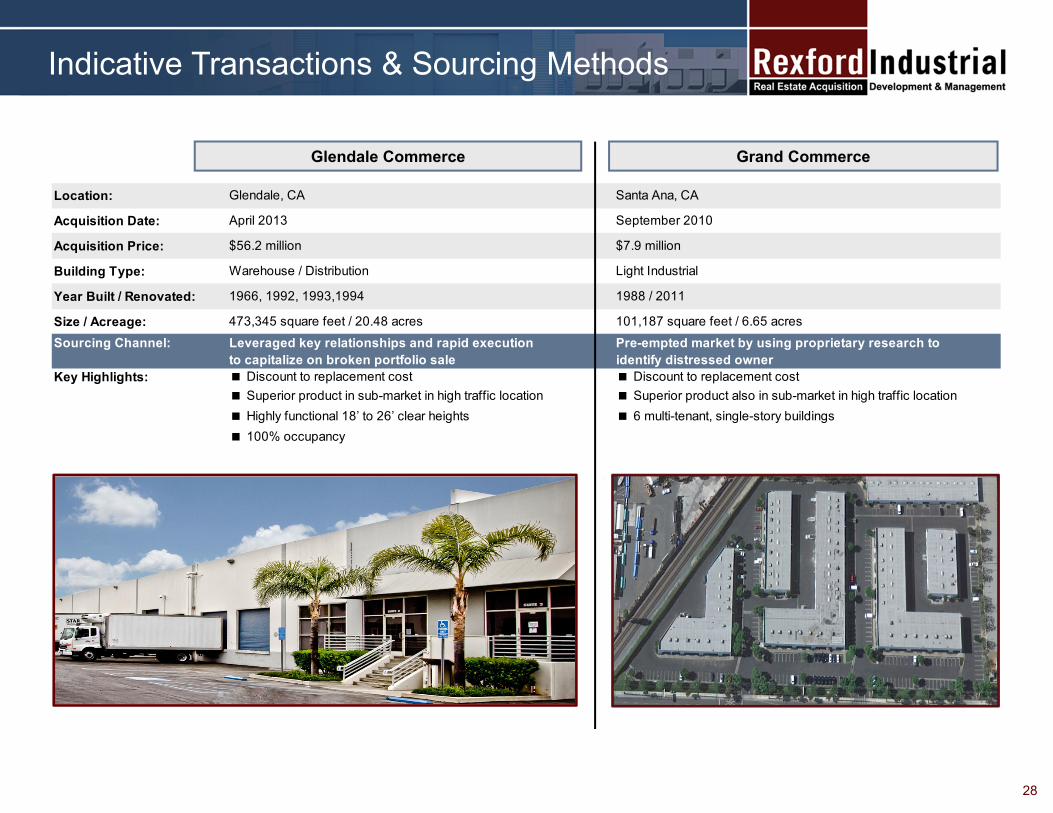
Location: Glendale, CA Santa Ana, CA
Acquisition Date: April 2013 September 2010
Acquisition Price: $56.2 million $7.9 million
Building Type: Warehouse / Distribution Light Industrial
Year Built / Renovated: 1966, 1992, 1993,1994 1988 / 2011
Size / Acreage: 473,345 square feet / 20.48 acres 101,187 square feet / 6.65 acresSourcing Channel: Leveraged key relationships and rapid execution Pre-empted market by using proprietary research to
to capitalize on broken portfolio sale identify distressed ownerKey Highlights: Discount to replacement cost Discount to replacement cost
Superior product in sub-market in high traffic location Superior product also in sub-market in high traffic location Highly functional 18’ to 26’ clear heights 6 multi-tenant, single-story buildings 100% occupancy
Indicative Transactions & Sourcing Methods
Grand CommerceGlendale Commerce
28
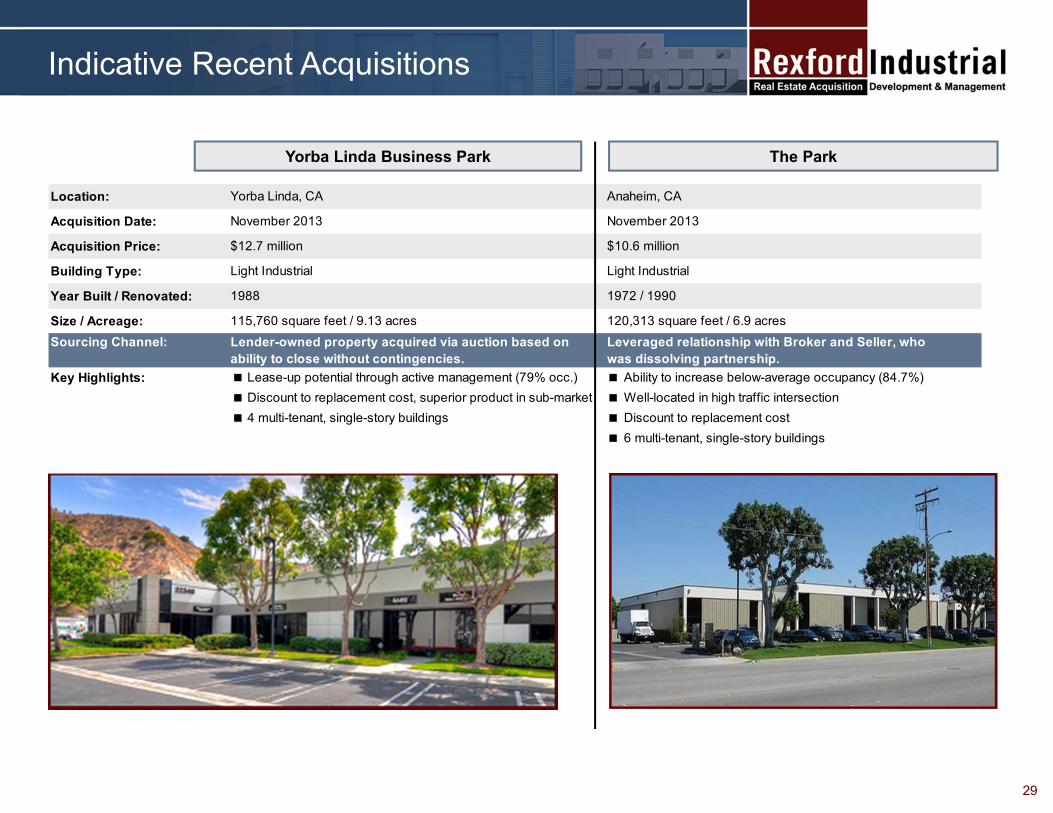
Location: Yorba Linda, CA Anaheim, CA
Acquisition Date: November 2013 November 2013
Acquisition Price: $12.7 million $10.6 million
Building Type: Light Industrial Light Industrial
Year Built / Renovated: 1988 1972 / 1990
Size / Acreage: 115,760 square feet / 9.13 acres 120,313 square feet / 6.9 acresSourcing Channel: Lender-owned property acquired via auction based on Leveraged relationship with Broker and Seller, who
ability to close without contingencies. was dissolving partnership.Key Highlights: Lease-up potential through active management (79% occ.) Ability to increase below-average occupancy (84.7%)
Discount to replacement cost, superior product in sub-market Well-located in high traffic intersection 4 multi-tenant, single-story buildings Discount to replacement cost
6 multi-tenant, single-story buildings
Indicative Recent Acquisitions
The ParkYorba Linda Business Park
29

FFO and NOI Reconciliations
30
(1) Based on weighted average interest in our operating partnership of 10.59% for the three months ended March 31, 2014..ther sources.
Funds From Operations (FFO) 4Q13 1Q14Net income (loss) (1,006)$ 1,429$
Add:Depreciation and amortization, including amounts in discontinued operations 5,716 6,137Depreciation and amortization from unconsolidated joint ventures 153 85
Deduct:Gains on sale of real estate 2,125
FFO available to common shareholders and unitholders 4,863$ 5,526$ Company share of FFO (1) 4,308$ 4,941$
FFO per share - basic and diluted 0.17$ 0.19$
Weighted-average shares outstanding - basic and diluted 25,191,570 25,419,418Weighted-average diluted shares and units 28,436,531 28,428,677
Net Operating Income (NOI) 4Q13 1Q14Net income (loss) (1,006)$ 1,429$
Add:General and administrative 2,827 2,605Depreciation and amortization 5,661 6,130Acquisition expenses 421 333Interest expense 1,046 1,251
Deduct:Management, leasing, and development services 253 234Interest income 190 276Equity in income (loss) from unconsolidated real estate entities 9 45Loss on extinguishment of debt 0 0Income from discontinued operations 171 2,146
NOI 8,326$ 9,047$ Fair value lease revenue 76 81Straight line rent adjustment (515) (184)
Cash NOI 7,887$ 8,944$

Definitions / Discussion of Non-GAAP Financial Measures
31
Annualized Base Rent: Calculated for each lease as the latest monthly contracted base rent per the terms of such lease multiplied by 12. Excludes billboard andantenna revenue and rent abatements.
Cash NOI: Cash basis NOI is a non-GAAP measure, which we calculate by adding or subtracting from NOI i) fair value lease revenue and ii) straight-line rentadjustment. We use Cash NOI, together with NOI, as a supplemental performance measure. Cash NOI should not be used as a measure of our liquidity, nor is itindicative of funds available to fund our cash needs. Cash NOI should not be used as a substitute for cash flow from operating activities computed in accordancewith GAAP. We use Cash NOI to help evaluate the performance of the Company as a whole, as well as the performance of our Same Property Portfolio.
Funds from Operations (FFO): We calculate FFO before non-controlling interest in accordance with the standards established by the National Association ofReal Estate Investment Trusts (“NAREIT”). FFO represents net income (loss) (computed in accordance with GAAP), excluding gains (or losses) from sales ofdepreciable operating property, real estate related depreciation and amortization (excluding amortization of deferred financing costs) and after adjustments forunconsolidated partnerships and joint ventures. Management uses FFO as a supplemental performance measure because, in excluding real estate relateddepreciation and amortization, gains and losses from property dispositions, other than temporary impairments of unconsolidated real estate entities, andimpairment on our investment in real estate, it provides a performance measure that, when compared year over year, captures trends in occupancy rates, rentalrates and operating costs. We also believe that, as a widely recognized measure of performance used by other REITs, FFO may be used by investors as a basisto compare our operating performance with that of other REITs. However, because FFO excludes depreciation and amortization and captures neither the changesin the value of our properties that result from use or market conditions nor the level of capital expenditures and leasing commissions necessary to maintain theoperating performance of our properties, all of which have real economic effects and could materially impact our results from operations, the utility of FFO as ameasure of our performance is limited. Other equity REITs may not calculate or interpret FFO in accordance with the NAREIT definition as we do, and,accordingly, our FFO may not be comparable to such other REITs’ FFO. FFO should not be used as a measure of our liquidity, and is not indicative of fundsavailable for our cash needs, including our ability to pay dividends.
NOI: Includes the revenue and expense directly attributable to our real estate properties calculated in accordance with GAAP. Calculated as total revenue fromreal estate operations including i) rental revenues ii) tenant reimbursements, and iii) other income less property expenses and other property expenses (beforeinterest expense, depreciation and amortization). We use NOI as a supplemental performance measure because, in excluding real estate depreciation andamortization expense and gains (or losses) from property dispositions, it provides a performance measure that, when compared year over year, captures trends inoccupancy rates, rental rates and operating costs. We also believe that NOI will be useful to investors as a basis to compare our operating performance with thatof other REITs. However, because NOI excludes depreciation and amortization expense and captures neither the changes in the value of our properties that resultfrom use or market conditions, nor the level of capital expenditures and leasing commissions necessary to maintain the operating performance of our properties(all of which have real economic effect and could materially impact our results from operations), the utility of NOI as a measure of our performance is limited. Otherequity REITs may not calculate NOI in a similar manner and, accordingly, our NOI may not be comparable to such other REITs’ NOI. Accordingly, NOI should beconsidered only as a supplement to net income as a measure of our performance. NOI should not be used as a measure of our liquidity, nor is it indicative of fundsavailable to fund our cash needs. NOI should not be used as a substitute for cash flow from operating activities in accordance with GAAP. We use NOI to helpevaluate the performance of the Company as a whole, as well as the performance of our Same Property Portfolio.