value chain dynamics and the small-scale sector - policy
TRANSCRIPT

I3630E/1/02.14
ISBN 978-92-5-108178-5
9 7 8 9 2 5 1 0 8 1 7 8 5
ISSN 2070-7010
This technical paper focuses primarily on price transmissions in small-scale and large-scale fishery and aquaculture value chains in 14 developed and developing countries. Although the study is focused on the small-scale sector, both the small-scale and large-scale sectors
were analysed in order to demonstrate differences between the two. The document begins with an overview of the entire project and its global implications, reviewing the importance of fisheries and aquaculture to livelihoods, food security and trade as well as the rationale
for value chain analysis. It then presents detailed and summarized country-specific information on the research and analysis conducted, presenting analysis methodology,
findings and policy recommendations within each country. An additional section focuses on women, summarizing their significant role in fishery and aquaculture value chains in selected
countries. Finally, the document outlines the general findings and policy recommendations that emerged as key themes across all value chains analysed.
Value chain dynamics andthe small-scale sectorPolicy recommendations for small-scale fisheries and aquaculture trade
Valu
e chain
dyn
amics an
d th
e small-scale secto
r581
FAO
581
ISSN 2070-7010
FAOFISHERIES ANDAQUACULTURE
TECHNICALPAPER

Cover photograph:Artisan fishing near Tombouctou, Mali. ©FAO/J.C. Henry.

Value chain dynamics and the small-scale sectorPolicy recommendations for small-scale fisheries and aquaculture trade
Edited by
Trond BjorndalLead ConsultantSNF, Centre for Applied Research at Norwegian School of Economics, BergenAalesund University College, AalesundNorway
Anna ChildFAO Project CoordinatorInternational ConsultantProducts, Trade and Marketing BranchFAO Fisheries and Aquaculture DepartmentRome, Italy
and
Audun LemFAO Project Focal PointBranch ChiefProducts, Trade and Marketing BranchFAO Fisheries and Aquaculture DepartmentRome, Italy
FOOD AND AGRICULTURE ORGANIZATION OF THE UNITED NATIONSRome, 2014
FAOFISHERIES ANDAQUACULTURE
TECHNICALPAPER
581

The designations employed and the presentation of material in this information product do not imply the expression of any opinion whatsoever on the part of the Food and Agriculture Organization of the United Nations (FAO) concerning the legal or development status of any country, territory, city or area or of its authorities, or concerning the delimitation of its frontiers or boundaries. The mention of specific companies or products of manufacturers, whether or not these have been patented, does not imply that these have been endorsed or recommended by FAO in preference to others of a similar nature that are not mentioned.
The views expressed in this information product are those of the author(s) and do not necessarily reflect the views or policies of FAO.
ISBN 978-92-5-108178-5 (print)E-ISBN 978-92-5-108179-2 (PDF)
© FAO, 2014
FAO encourages the use, reproduction and dissemination of material in this information product. Except where otherwise indicated, material may be copied, downloaded and printed for private study, research and teaching purposes, or for use in non-commercial products or services, provided that appropriate acknowledgement of FAO as the source and copyright holder is given and that FAO’s endorsement of users’ views, products or services is not implied in any way.
All requests for translation and adaptation rights, and for resale and other commercial use rights should be made via www.fao.org/contact-us/licence-request or addressed to [email protected].
FAO information products are available on the FAO website (www.fao.org/publications) and can be purchased through [email protected].

iii
Preparation of this document
Consultants prepared and carried out case studies in Africa, Asia, Central and South America, Europe and North America from 2009 to 2012. Using these, the lead consultant and project coordinator prepared this publication, highlighting the importance of the small-scale sector and value chain analysis, and concluding in general policy recommendations across all countries studied.
The document is the final price synthesis and policy recommendations report for the following countries: Bangladesh, Cambodia, Canada, Ghana, Honduras, Iceland, Japan, Kenya, Maldives, Norway, Peru, Spain, Thailand and Uganda. All the information in it is based on extensive country reports (available on the Fisheries and Aquaculture Value Chain web page (www.fao.org/valuechaininsmallscalefisheries/background1/en/). These contain information on the background of each country’s fishery and aquaculture sector, methodology of analysis, price data used, findings, policy implications, and other information.
The following individuals led the analysis, provided inputs and wrote the 14 national case studies and brief on women's involvement used to create this report:
• Dr Ferdous Alam (Bangladesh), • Dr Hap Navy (Cambodia), • Professor D.V. Gordon (Canada), • Mr Theodore-Oboo Antwi-Asare (Ghana), • Ms Claudia Stella Beltrán (Honduras), • Dr Ögmundur H. Knútsson (Iceland), • Mr Hreiðar Þór Valtýssoon (Iceland),• Mr Bjarni Eiríksson (Iceland),• Mr Hörður Sævaldsson (Iceland),• Mr Helgi Gestsson (Iceland),• Dr Nobuyuki Yagi (Japan), • Mr. Julius Manyala (Kenya), • Mr Sinan Hussain (Maldives), • Dr Erik Nesset (Norway), • Mr Bjørn Tore Nystrand (Norway), • Dr Sigbjorn Tveteraas (Peru), • Ms Yvonne del Carmen Cruz Castañeda (Peru), • Dr Jose Manuel Fernandez Polanco (Spain), • Mrs Amporn Laowapong (Thailand), • Mr Maurice Ssebisubi (Uganda),• Dr Madan Dey (Bangladesh, Cambodia and Thailand),• Dr Achini De Silva (Women in global fishery and aquaculture value chains).

iv
Abstract
This technical paper focuses primarily on price transmissions in small-scale and large-scale fishery and aquaculture value chains in 14 developed and developing countries. Although the study is focused on the small-scale sector, both the small-scale and large-scale sectors were analysed in order to demonstrate differences between the two. The document begins with an overview of the entire project and its global implications, reviewing the importance of fisheries and aquaculture to livelihoods, food security and trade as well as the rationale for value chain analysis. It then presents detailed and summarized country-specific information on the research and analysis conducted, presenting analysis methodology, findings and policy recommendations within each country. An additional section focuses on women, summarizing their significant role in fishery and aquaculture value chains in selected countries. Finally, the document outlines the general findings and policy recommendations that emerged as key themes across all value chains analysed.
The main findings across case studies are that, relative to other players in the value chain, small-scale fishers and fish farmers are receiving the smallest economic benefits for their products. Processors and retail markets were found to be receiving more of the distributional benefits of the value chain owing to their stronger bargaining power. Following this, the policy recommendations made aim to safeguard the interests of small-scale fishers and fish farmers by enabling them to obtain prices and margins that let them achieve long-term sustainability from an economic, social and biological resource perspective.
The policy recommendations presented generally relate to increased governmental, NGO and private-sector support, improved organization, consistent pricing methods and making pricing more transparent, the sustainable expansion of small-scale fish farming, an increased focus on promotion and marketing, and the exploration of new markets. However, the report cautions that sustainable resource management and better regulatory framework practices are a necessary condition for small-scale value chains to be sustained. It also highlights the crucial need to always consider and safeguard the impact that increasing trade will have on local food security.
Bjorndal, T., Child, A. & Lem, A. eds. 2014.Value chain dynamics and the small-scale sector: policy recommendations for small-scale fisheries and aquaculture trade. FAO Fisheries and Aquaculture Technical Paper No. 581. Rome, FAO. 112 pp.

v
Contents
Preparation of this document iiiAbstract ivAcknowledgements viiAbbreviations and acronyms viii
1. Introduction and background 1
2. Why study small-scale fisheries and aquaculture value chains 5The importance of the small-scale sector to livelihoods 5
Fish and fishery products – direct contribution to food security 5
Importance of trade to food security 6
Conclusions on the importance of study 8
3. Value chains and supply chains 9What is the difference? 9
4. General methodology of the project 11Steps in analysis 11
Data availability 12
Organizational structure of the project 12
5. Africa 15Ghana 15
Kenya 18
Uganda 25
6. Central and South America 29Honduras 29
Peru 35
7. Asia 43Bangladesh 43
Cambodia 46
Maldives 48
Thailand 52
8. Developed countries 57Canada 57
Iceland 60
Japan 68
Norway 71
Spain 75

vi
9. Women in global fishery and aquaculture value chains 81
10.Summary findings and policy recommendations 83Africa 83
Central and South America 84
Asia 86
Developed countries 88
11.Conclusions 95Overall findings and policy recommendations 95
Areas for further research 101
References 103
Glossary 107
Appendix 1Project contributors 109
National consultants by country 111

vii
Acknowledgements
The main sponsors of the project were the Norwegian Agency for Development Cooperation (Norad) and FAO. Norad provided most of the funding for the project, and FAO provided the professional expertise of its staff, which facilitated its organization and completion. Both organizations maintained sustained participation in the study, coordinated its numerous reviews and provided inputs to its draft and finalization. Iceland, Japan, Norway and Spain provided their own funding for the project at a later stage in order for more developed countries to be included.
The FAO Project Focal Point, Dr Audun Lem and members of the international steering committee (among the leading professionals in fisheries and aquaculture around the world) provided guidance and support in launching the project. They followed its progress and provided helpful inputs throughout.
The team of national consultants undertook the case studies within a limited time frame and budget. The core of this document is based on the information provided by their significant and dedicated work.
The final draft report was reviewed by members of the international steering committee, individuals within the FAO Fisheries and Aquaculture Department, the Norwegian Institute of Food, Fishery and Aquaculture (Nofima) and an independent, anonymous peer reviewer. Their work on reviewing the report to ultimately make it stronger is sincerely appreciated.
At FAO, special thanks are due to Turan Rahimzadeh for creating and maintaining the project’s website, to Gloria Loriente for the layout design of this publication and to Anna Child for her ongoing work on the report. Much appreciation also goes to Professor Dey and Professor Gordon for their consistent aid in providing numerous rounds of inputs to the report.
Finally, many thanks go all the agents in the fisheries and aquaculture value chains, including the fishers and fish farmers, processors, retailers, wholesalers, exporters and importers, for taking time out of their demanding work to allow the national consultants to collect many of the data needed to generate this analysis and final document.
Trond BjorndalLead Consultant

viii
APT asymmetric price transmissionARIMA autoregressive integrated moving averageCAD Canadian dollarCIF cost, insurance and freightCPI Consumer Price IndexDAM Department of Agricultural Marketing (Bangladesh)DHC direct human consumptionESP Economic Stimulus Programme (Kenya)EUR EuroFOB free on boardGHC Ghanaian cediIHC indirect human consumptionIUU illegal, unreported and unregulated (fishing)ITQ individual transferable quota JPY Japanese yenKES Kenyan shillingMCS monitoring, control and surveillance MVR Maldivian rufiyaaNGO non-governmental organizationNOK Norwegian kroneSO sales organizationTAC total allowable catchTHB Thai bahtUGX Ugandan shillingUSD United States dollar
Abbreviations and acronyms
1
1. Introduction and background
FAO1 conducted a comprehensive value chain analysis of international fish trade with an impact assessment for the small-scale fisheries and aquaculture sector in developing countries. The analysis was a follow-up to an FAO study in 20042 on the impact of international fish trade on local food security, with the objective to now achieve a better understanding of the dynamics of small-scale value chains by identifying the current distributional benefits; essentially, how the benefits were being distributed and the linkages between the relative benefits obtained and the design of the chain. In addition, the analysis aimed to recognize opportunities for the small-scale sector to obtain more value for their products.
Findings from the analysis conclude in country-specific as well as general policy recommendations that safeguard the interests of small-scale fishers and fish farmers by enabling them to obtain prices and margins that let them achieve long-term sustainability from an economic, social and biological resource perspective. As value chain research is limited, primarily owing to the unavailability of price data, it is hoped that this nascent research and the findings that have emerged will help to fill a knowledge gap in identifying and addressing existing inequities. Moreover, the policy recommendations presented aim to serve as entry points for national governments and institutions, international governmental bodies and non-governmental organizations (NGOs) to advocate for the rights of small-scale fisheries and fish farms worldwide.
The overall project involved value chains within aquaculture and capture fisheries in both domestic and international markets in 14 countries, of which 9 are developing countries and the remaining 5 are developed countries. The developing countries are Bangladesh, Cambodia, Ghana, Honduras, Kenya, Maldives, Peru, Thailand and Uganda, and they were chosen by the steering committee in consultation with the national consultant advisors and the FAO Focal Point. The developed countries are Japan, Canada, Iceland, Norway and Spain, with consultants from these countries asking to join the project once the analysis had already been initiated, most with their own funding and resources. It was agreed to bring them into the project to serve as a reference of comparison to the developing countries. Furthermore, it was expected that data availability would be better in developed countries. In some cases, lessons learned from developed countries in terms of management systems, regulatory framework and market structure were identified as being of potential use to developing countries, but this was not the focus of the project.
Countries were chosen to achieve global representation, with countries from Asia, Africa, Europe, North America and South America being included. Factors for selecting species as part of certain value chains in each country are discussed further in Section 4 on the general methodology of the project. Although the study is focused on the small-scale sector, both the small-scale and large-scale sectors were analysed in order to demonstrate differences between the two. It is important to note that there is great diversity in the small-scale fisheries and aquaculture sector and no universal definition can be prescribed. Indeed, there is no globally agreed-upon definition for small-scale versus large-scale and, instead, meanings for each term vary widely by country and region. Generally, countries included in this project did not have concrete
1 With funding from the Norwegian Agency for Development Cooperation (Norad).2 Kurien, J. 2005. Responsible fish trade and food security. FAO Fisheries Technical Paper No. 456. Rome,
FAO. 77 pp.

Value chain dynamics and the small-scale sector 2
definitions for their small-scale capture and aquaculture sector, so instead a number of criteria were used when defining what would constitute each sector’s size.
For capture fisheries, FAO’s discussion document “Towards voluntary guidelines on securing sustainable small-scale fisheries” outlines important criteria to define small scale, including: size of fishing craft/vessel/engine, type of craft/vessel, fishing unit, ownership, time commitment, fishing grounds, disposal of catch, utilization of catch, knowledge and technology and integration into the economy (FAO, 2011). Table 1 provides an overview of these general criteria in both small- and large-scale fisheries.
For aquaculture, defining small-scale is dependent on a range of variables such as geography, socio-economics and level of technological innovation (Shrestha and Pant, 2012). Generally, small-scale aquaculture is characterized by low-input and low-output fish farming (Martinez-Espinosa, 1997; Edwards, 1999). Large-scale aquaculture might target profitability, business and employment with usually longer value chains, while small-scale farming is a complex blend of food security, income generation, livelihood strengthening and poverty alleviation (Martinez-Espinosa, 1997). Several definitions of small-scale aquaculture have been proposed based on the level of aquaculture technology and socio-economics of the specific areas, focusing on the capacity of the farmers and families involved to operate the technology. WorldFish Center proposes the following general definition: “small-scale aquaculture is a family-based enterprise, where fish are produced with the involvement of family members of the farm owner in common, leased, private or self-owned property, regardless of the farm size, species reared and volume produced” (Shrestha and Pant, 2012).
Table 1Categories and characteristics of small-scale and large-scale fisheries
Characteristics
Categories of fisheries
Small-scale Large-scaleSubsistence Other small-scale
Size of fishing craft/vessel and engine
None or small (< 12 m), with low-power engine or non-motorized
Small (< 24 m) usually with low-power engine (< 375 kW)
large (≥ 24 m) with high-power engine (≥ 375 kW)
Type of craft/vessel
Undecked wooden boat, such as a canoe or dinghy
Decked or undecked vessel of wood, fibreglass, aluminium or steel
Steel-hull vessel, trawler, factory vessel
Fishing unit Individuals, or family or community groups
Small groups, some specialization and division of labour; importance of household and community
Smaller and larger groups; specialization and division of labour
Ownership Craft/gear owner-operated
Usually owned and operated by senior operator; some absentee ownership
Concentration of ownership, often by non-operators;
cooperative ownership
Time commitment
Mostly part-time/occasional
Full-time or part-time Usually full-time
Fishing grounds On or adjacent to shore; inland or marine
Inshore/coastal; inland or marine
all marine areas
Disposal of catch Primarily household consumption but some local barter and sale
Sales to local, national and international markets; household consumption
Primarily sale to organized markets
Utilization of catch
Fresh or traditionally processed for human consumption
Fresh or processed – generally traditionally – for human consumption
Mostly processed; large share for reduction for non-food products
Knowledge and technology
Premium on skills and local knowledge; manual gear
High skills and knowledge needs; manual and mechanized gear; some electronic equipment
Skills and experience important but supported by technology;
mechanized gear; automation and electronic equipment
Integration into economy
Informal, not integrated Partially integrated Formal, fully integrated
Sources: World bank, FaO and WorldFish Center (2010), adapted from studies by berkes et al. (2001), Chuenpagdee et al. (2006) and Johnson (2006).

3Introduction and background
The purpose of this technical paper is twofold. First, it aims to present detailed and summarized country-specific information on the research and analysis conducted, presenting analysis methodology, findings and policy recommendations within each country. Second, it provides an overview of the entire project and its global implications, outlining the overall approach taken as well as the general findings and policy recommendations that emerged as key themes across all the value chains analysed. These policy recommendations generally relate to increased governmental, NGO and private-sector support, improved organization, consistent pricing methods and making pricing more transparent, the sustainable expansion of small-scale fish farming, an increased focus on promotion and marketing, the exploration of new markets, improved fisheries comanagement and better regulatory frameworks for aquaculture. Finally, with these recommendations, it is crucial to always consider the impact on, and to safeguard as much as possible, local food security.
The document is organized as follows: after the introduction and background, Section 2 provides a rationale for the project, outlining the importance of fisheries and aquaculture to livelihoods, food security and trade. Section 3 discusses the difference between value chains and supply chains, with Section 4 providing a general overview of the overall methodology of the project and indicating some of the data limitations encountered. The subsequent sections (5–8) present a summary of the analysis undertaken in each developing and developed country. Each country subsection includes the following: a background on the country’s fishery and/or aquaculture value chain, the country-specific methodology undertaken for the analysis, key results found, and the subsequent conclusions and policy implications. Section 9 presents a summary on women in global fisheries and aquaculture value chains, highlighting the important role women play. Section 10 provides a brief overview summary by country of the species analysed, findings and policy recommendations. The final section presents the conclusions from the project, with general themes found among the case studies discussed and policy recommendations presented. In addition, this last section outlines areas for further research and analysis. Further reading on the project can be found on the Fisheries and Aquaculture Value Chain web page,3 where all of the country case study reports, presentations and additional documents that were completed as part of the analysis have been posted.
3 www.fao.org/valuechaininsmallscalefisheries/background1/en/


5
2. Why study small-scale fisheries and aquaculture value chains
The ImpOrTanCe Of The SmaLL-SCaLe SeCTOr TO LIveLIhOOdS Globally, 54.8 million people are engaged in capture fisheries and aquaculture, and about three times as many are involved in upstream and downstream activities (e.g. fish processing, selling, net-making and boat building). Women comprise about half of this global fisheries workforce, typically concentrated in the pre-harvest and post-harvest sectors. While employment is stagnating in wild-capture fisheries in most regions, it is increasing in aquaculture, especially in Asia, where employment rose from some 3.7 million people in 1990 to well in excess of 10 million people by the late 2000s. While no definitive statistics exist, it is thought that the small-scale sector employs 90 percent of the world’s fishers, producing almost half of world fish production and supplying most of the fish consumed in the developing world (UN General Assembly, 2012). The sector predominates in developing countries, which also account for most fishing-related employment (FAO and WorldFish Center, 2008).
While industrial boats employ some 200 people for every 1 000 tonnes of fish caught, small-scale fishing methods employ some 2 400 people for the same amount of fish (FAO and WorldFish Center, 2008). Other significant differences between the large-scale and small-scale sectors have been documented by Jacquet and Pauly (2008). Using global statistics adapted from 2006, they not only demonstrated that small-scale fisheries are contributing to significantly more livelihoods, but they also showed how the sector is keeping more value in ecosystems when comparing factors such as fish discarded at sea, annual fuel consumption and catch per tonne of fuel consumed. For the latter, the difference was significant; the large-scale sector catches 1–2 tonnes of fish per tonne of fuel consumed as opposed to the small-scale sector, which catches 4–8. Jacquet and Pauly (2008) also demonstrated the marked contrast in terms of the amount of subsidies received; the large-scale sector is estimated to receive between USD25–27 billion, whereas the small-scale sector receives about USD5–7 billion. This last point demonstrates innate barriers facing the small-scale sector and its value chain – this is discussed further in the conclusions section.
Despite the important contribution by the small-scale fisheries and aquaculture sector to livelihoods and fish production/supply, it is often obscured in national statistics owing to under-reporting, particularly in developing countries. For example, a 2010 study in Mozambique found that the actual catch of the small-scale sector was six times greater than that officially reported by the Government to FAO (Jacquet et al., 2010).
fISh and fIShery prOduCTS – dIreCT COnTrIbuTIOn TO fOOd SeCurITyFAO states that “food security exists when all people, at all times, have physical, social and economic access to sufficient, safe and nutritious food that meets their dietary needs and food preferences for an active and healthy life” (FAO, 2012a). Food insecurity can cause undernutrition, which results in mortality, morbidity, stunting and wasting. It can also cause micronutrient deficiencies, which result in impaired immune functions, cognitive development, growth, reproductive performance and work productivity. The distinction between undernutrition and micronutrient deficiencies is important because while undernourishment can be improved by increasing energy

Value chain dynamics and the small-scale sector 6
intake, the problem of micronutrient deficiencies is of a different nature as it results from an inadequate quality and diversity in diet.
In the period 2010–12, the number of people in the world suffering from undernourishment was estimated to be about 870 million people, which represents 12.5 percent of the global population, or one in eight people. Improved undernourishment estimates for 1990 and onwards, suggests that progress in reducing hunger has been more pronounced than previously believed, although much of the progress was achieved before 2007–08. Since then, global progress in reducing hunger has slowed and levelled off, demonstrating that the number of people suffering from chronic undernourishment is still unacceptably high, with the bulk of undernourishment in Southern and Eastern Asia as well as sub-Saharan Africa (FAO, 2012a). Thus, the eradication of hunger remains a major global challenge.
Direct consumption of fish for food provides a vital source of protein and a variety of essential fatty acids and micronutrients, such as iron, zinc and vitamin A. These micronutrients are particularly rich in smaller-sized fish, which are often more readily available to low-income, at-risk populations owing to their low cost and abundant availability. Fish are an especially important source of food and nutrients owing to the fact their seasonal availability is often different from crops. This means that fish can help to reduce seasonal vulnerability, particularly in rural communities (Kawarazuka, 2010).
The most recent data available show that world per capita fish consumption reached 18.4 kg in 2009, demonstrating an average growth of more than 3 percent annually (FAO, 2012b). However, significant regional differences exist. In low-income food-deficit countries (excluding China), per capita fish consumption stands at about 10 kg, compared with approximately 29 kg in industrialized countries. Africa has the lowest per capita fish consumption of all continents, at 9.1 kg. However, these aggregate figures do mask variations between and within countries as well as the fact that fish represents a higher proportion of dietary animal protein in developing countries than in developed countries (UN General Assembly, 2012). Indeed, globally, fish represents 15 percent of all animal protein consumed by people, whereas in low-income countries the proportion is significantly higher, at about 20 percent (FAO, 2004). Estimates suggest that about one billion people worldwide rely on fish as their primary source of animal protein (FAO, 2000). Even so, although it is clear that fish is a vital food and nutrient source for many low-income countries, it has the potential to be utilized in local diets even more.
ImpOrTanCe Of Trade TO fOOd SeCurITyIndirectly, domestic and international fish trade can increase food security through employment and income generation, which can be utilized to purchase food commodities, including lower-cost staple foods. Domestic trade also makes fish much more available and accessible to local populations for consumption. In terms of international trade, it is known that fish exports are a major source of income for developing countries. Indeed, developing countries now represent almost 50 percent of global fish exports, with annual net export revenues exceeding USD25 billion (FAO, 2012b). These exports can generate foreign exchange as well as create employment and income in the primary and secondary sectors. However, fish exports can also decrease the availability of the traded species for domestic consumption and raise its local price owing to reduced availability. Overall, a society is likely to gain from exports; however, there may be distributional consequences particularly for the most vulnerable populations, as those who gain may not compensate those who lose. With aquaculture, the situation is likely to be different. Exports of farmed products will not have a negative effect on domestic consumers as the product is generally produced with

7Why study small-scale fisheries and aquaculture value chains
export markets in mind. Imports of fish will tend to increase domestic food supply and, if anything, keep prices down.
Another important consideration is that, generally, developing countries mainly export high-value products and import low-value ones. Thus, countries can be both large exporters and importers of fish, as is the case in Thailand, China and, increasingly, Viet Nam. In some instances, the proceeds from exporting more-expensive fish can be used to import less-expensive, but equally or more-nutritious, fish. Africa, for example, despite its positive net export value of fish, remains a net importer in terms of volume, and is therefore dependent on lower-cost fish imports to aid in local food security (UN General Assembly, 2012).
The issue of trade’s contribution to food security is a complex one, with numerous studies attempting to explore the pathways between the economic driver of trade to its impact on food security and undernourishment in local communities. An FAO study led by Dr John Kurien (FAO, 2004) examined how trade affected food security based on evidence from a global assessment as well as from 11 country case studies.4 One of the study’s main findings was that, in most cases, international trade in fishery products has had a positive effect on local food security. In addition, production and trade statistics indicated that international trade had not had a detrimental effect on food security in terms of the availability of fish for food. Instead, increases in production, coupled with the import and export of fishery products, had ensured the continued availability of fish for domestic supply. However, the study did find that trade has placed increased pressure on natural resources and, therefore, preserving resources through effective fisheries management is a necessary condition to increase food security and sustain international trade in the long term. The study concluded that market demand needs to be coupled with a sustainable resource management policy. This includes incentivizing consumers in developed countries to purchase sustainably produced products (FAO, 2004).
A recent study by the WorldFish Center drew more alarmist conclusions. By examining exports and per capita domestic availability of fish in 14 countries5 over a 30-year period,6 it found that increasing trade appears to have compromised domestic fish supplies in countries with high domestic fish consumption, high population growth and persistent poverty. In only half of the countries had fish availability increased along with increases in exports. Moreover, this growth was found to be related to either aquaculture or offshore fisheries, highlighting the important role of aquaculture for future growth. The study also found no data to confirm or deny previous findings related to trade and food security, which claimed that developing countries purchase low-value seafood with export earnings and then had surplus earnings for other uses. Although the study agreed that in general terms, anything that contributes positively to trade balance has the potential to increase food security, it warned that it may also be the case that some fish export revenues are being captured by private-sector and government elites (WorldFish Center, 2011). In turn, these revenues are then spent on luxury imported goods, rather than being used for poverty reduction, as has been suggested for the commercial shrimp export trade in Madagascar (Wilson and Boncoeur, 2008). Some studies (Wilson and Boncoeur, 2008; WorldFish Center, 2011) have recommended that policy options likely to widen inequality in countries with weak governance and poor track records should not be pursued. Rather, they hold it would be better for aquaculture benefits or fisheries rent to be distributed locally instead of revenues increasing but not being effectively spent on national economic development and poverty reduction.
4 Brazil, Chile, Fiji, Ghana, Kenya, Namibia, Nicaragua, Philippines, Senegal, Sri Lanka and Thailand.5 Bangladesh, Cambodia, Gambia, Guyana, Indonesia, Kiribati, Maldives, Myanmar, Philippines, Senegal,
Sierra Leone, Sri Lanka, Solomon Islands and Vanuatu.6 From 1976 to 2007.

Value chain dynamics and the small-scale sector 8
Following this, international trade may not result in gains for the most vulnerable, food-insecure people unless sources of inequity in the fisheries and aquaculture sectors are addressed (WorldFish Center, 2011). Within fisheries and aquaculture, inequities can be found in relation to power, often between producers and buyers, fishers and processors/exporters and between men and women in fishing and fish farming communities. These inequities in power have consequences for the distribution of benefits, as explored in this document. Although the distribution of benefits may be considered inequitable in the short run, the long-run consequences of improved efficiency in terms of increased revenues must also be further explored.
This value chain analysis attempts to explore and address some of these inequities and their implications.
COnCLuSIOnS On The ImpOrTanCe Of STudyThe small-scale sector is vital to livelihoods, income generation, world fish production and supply. In addition, the small-scale sector provides fish that directly contributes to improving food security and nutrition. Although findings on how international fish trade affects food security in developing countries are not conclusive, there is concrete evidence that trade can provide an overall benefit to developing countries. However, distributional consequences, particularly for the most vulnerable populations, need to be further analysed. Moreover, with global value chains becoming a dominant feature of today’s global economy in both developed and developing countries, there is a need to complement conventional trade statistics by measuring the value added by each economy along the chain (OECD, 2012).

9
3. value chains and supply chains
WhaT IS The dIfferenCe?To further discuss value chains in the small-scale fisheries and aquaculture sector, it is beneficial to explore what is meant by the term value chain and how it differs from the often interchangeably used term, supply chain. Although there is not one standardized definition for either term, general characteristics and definitions have been applied to each that can be discussed here. It is important to note that establishing a good supply chain is essential to developing a value chain, as without a supply of products, adding value would never be able to occur.
A supply chain is a network of product-related business enterprises through which products move from the point of production to consumption, including pre-production and post-consumption activities. In supply chains, production is focused on efficient logistics using upstream and downstream businesses aimed mostly at pushing products to market. Supply chains are mostly concerned with costs and how long it takes to present the product for sale. The main objective of supply chain management is to maximize profits by reducing the number of links in the chain and keeping issues such as bottlenecks in supply, costs incurred, and time to market to a minimum. Typically, supply chains are made up of multiple companies that coordinate activities to set themselves apart from the competition. A supply chain has three key parts: supplying raw materials to manufacturing units; manufacturing raw materials into semi-finished or finished products; and distribution to ensure products reach consumers (De Silva, 2011).
On the other hand, a value chain can be seen as a step further in evolution, as it moves beyond just bringing the product to market and aims at providing a more mutually beneficially environment for all stakeholders. Like supply chains, the main objectives of value chain management is to maximize net revenue. However, the method in which value chains seek to maximize net revenue is inherently different. As the name suggests, value chains add incremental value to the product in the nodes of a chain either by value addition or value creation. This value is then realized from higher prices and/or the development of new (niche) or expanded markets. For example, within fisheries and aquaculture, the term value addition is used to characterize adding value in products through some type of processing method – essentially converting raw fish to a resulting finished or semi-finished product that has more value in the market place. Value creation is used to characterize fish and fishery products that have incremental value in the marketplace by differentiating them from similar products based on product attributes such as: geographical location (Mediterranean tuna, Norwegian salmon, Thailand black tiger shrimp, etc.); environmental stewardship (Marine Stewardship Council label, ecolabelling, fair trade); organic products; and food safety (the Hazard Analysis and Critical Control Points [HACCP] system, free from antibiotics and heavy metals, etc.) (De Silva, 2011).
The smooth functioning of value chains requires not only factors of production and technology but also efficient transport, market information systems and management. Value addition can occur at different nodes of the chain, as the initial form of the product changes through steps in processing and manufacturing. Value creation can also occur at different nodes of the chain but focuses on the factors of production and marketing to achieve a higher quality and better branded product.

Value chain dynamics and the small-scale sector 10
The final value-added or value-created product can be a new product in the marketplace that has a competitive advantage over generic products as it satisfies a specific consumer demand and attracts a higher price. Therefore, value chains can be viewed as empowering to the various, usually fragmented, stakeholders as they recognize innovative opportunities to contribute and increase their product value. It is important to note that creating a successful value chain is not without its challenges, and stakeholders must begin with an understanding of a specific consumer demand at the right time and place. As De Silva (2011) notes, a wide range of factors drives consumer demand for fish and fishery products, and these factors should be taken into consideration when creating a new value-added or value-created product. They include price, consumer demographics, convenience, nutritional content, safety, substitutes, tastes, fashion, advertising and expectations of the consumers.
Once a specific demand has been identified, stakeholders must then work to create relationships between production, processing, distribution and marketing stakeholders that can be trusted and in which information is shared freely. It is also important to distinguish between value addition and value creation – recognizing that value addition may require more cost inputs in terms of processing infrastructure but that value creation will take time and funding as well. However, it is important for players in the value chain to think beyond just keeping costs to a minimum. Indeed, one of the main underlying ideas of a value chain is the recognition that consumer choices are not always price driven, as they may be willing to pay more for a value-added product. Supply chains, on the other hand, make assumptions that most consumers want the same product for less money, which generally leads to commodity markets and essentially no or little value added.

11
4. General methodology of the project
STepS In anaLySIS After countries had been selected for the value chain analysis, other important factors were identified in each country, including: government regulations relating to fish production and marketing, the market structure, small-scale fisheries or fish farms within the market structure, and the fish species of interest. Value chains were then divided into international and domestic markets. For the domestic markets, the following price data were investigated: first-hand (for capture fisheries), farmgate (for aquaculture), wholesale and retail. For the international markets, prices included: first-hand, farmgate, wholesale, processor, exporter, importer and retailer. This data investigation was undertaken in each country to identify the type, quality, quantity and time period of data available for each node of the value chain.
Depending on findings from the data investigation and data availability, a methodology strategy was then chosen. Some countries met data demands to undertake a reduced-form analysis of producer to retailer links, which required a long time series of data at different nodes of the value chain with a sufficient number of observations. Others did not meet requirements for analysis owing to there being limited or no data available. For these countries, it was necessary for the project to collect its own primary data. Although these primary data collected were limited in a time series perspective, they were able to provide a cross-section snapshot of price links from first-hand to domestic retail or export markets. Data were collected in the national currency and either kept in this currency or converted into the equivalent in Euros (EUR) or USD. Where exchange rates are listed in this document, rates were obtained from the Central Intelligence Agency’s World Fact Book (CIA, 2013).
Using these data, countries then proceeded with model development in the reduced form, presenting and summarizing data, econometric modelling, estimation and evaluation, and, finally, policy analysis. Consultants measured the relationships among prices at different levels in the value chain, relying on statistical techniques to capture price linkages. Within these models, price linkages were identified that defined the market and allowed for predicting the impact of price and shocks in the value chain.
Depending on the country, various numbers of value chains were analysed. In some cases, as in Norway, only one value chain was analysed, while in others, such as Bangladesh, a variety were investigated. The species and value chains studied were selected by the national consultants and steering committee based on data availability. In addition, species and value chains were chosen with the aim to achieve a balance between wild-caught and farmed fish, freshwater, marine and brackish waters, and domestic, regional and international markets. Some of the developed countries selected their species and value chains independently as they provided their own funding for the project. The number of value chains investigated in each country varied owing to data availability, the experience and background of the local consultants, and funding. While data were available in some countries, in others data had to be collected. Constraints in terms of budget and time also influenced how many products could be included.
Species, value chain data analysed and the time series of price data used to measure price relationship in the value chain are summarized by country near the end of the document (Section 10, Table 13). Value chains for capture and culture fisheries differ

Value chain dynamics and the small-scale sector 12
from product to product and from country to country, as well as within regional areas of countries. Some value chains are completely operated in and for domestic markets with no international market interventions; some are operated in domestic markets for export, while others are operated in both domestic and international markets for export. Generally, international value chains of economically important species for trade, such as tuna, salmon, skipjack, shrimp and tilapia, are composed of several nodes with products passing through longer chains to reach the consumer. In contrast, some of the species that are not economically important but vital to local food security are part of a shorter value chain (De Silva, 2011).
daTa avaILabILITyTo conduct a comprehensive price analysis to determine the distribution of benefits most effectively, price data from fishers, fish farmers, wholesalers, processors, exporters and retailers are needed. Ideally, these data are for a long period and with as much frequency (monthly, weekly, etc.) as possible to obtain the most accurate estimation possible.
As noted above, in some country case studies, data availability was an issue as they were often difficult to obtain, even in developed countries. One way the project attempted to deal with this issue was to over identify countries of interest, with the understanding that some of the value chains might be dropped from the analysis depending on the availability and reliability of appropriate and adequate data to undertake such price link research. Moving forward, more efforts should be undertaken, particularly in developing countries, to collect adequate price data for more comprehensive analysis. Nevertheless, the insights from the analysis, combined with other quantitative and qualitative information, may be used to obtain a better understanding of developments in small-scale value chains over time.
OrGanIzaTIOnaL STruCTure Of The prOjeCTThis project involved a number of different consultants, including the lead consultant, international consultants, national consultants from each country, project consultants, the FAO focal point, and an international steering committee. Figure 1 presents the organization of the project. Appendix 1 provides a full listing of all consultants and steering committee members that were part of the project.

13General methodology of the project
FIg
Ur
e 1
Org
anig
ram
of
the
faO
val
ue
chai
n p
roje
ct
Sou
rce:
©Fa
O (
2012
).


15
5. africa
GhanabackgroundThe key objective of this study was to provide an understanding of the value chain in Ghana for both large-scale and small-scale tilapia and tuna fisheries. This includes an analysis of the linkages between value chain agents and an analysis of pricing and benefits among the agents. The fishing industry in Ghana contributes significantly to livelihoods, supporting about 10 percent of the population. The importance of the fishing industry also stems from its significant contribution to diets, with fish and seafood supplying about 60 percent of the national protein supply. Fish and seafood account for 16 percent of total household spending on food and, in terms of international trade, Ghana reported about USD87 million in seafood exports for 2009.
The two species chosen for this study are farmed and wild-caught Nile tilapia (Oreochromis niloticus) as well as wild-caught tuna, mainly skipjack (Katsuwonus pelamis) and yellowfin (Thunnus albacares). Tuna is of major commercial importance owing to its export revenues and its sustainable availability, which has been estimated at 100 000 tonnes annually by the local Fisheries Commission. Tilapia has large domestic demand for both fresh and locally processed varieties. Prices are stated here in Ghana cedi (GHC), with an estimated exchange rate of GHC1.512 per USD1 for 2011.
resultsTilapiaIn the Ghanaian tilapia sector, there are two value chains: a small-scale capture value chain, and a large-scale aquaculture value chain. Both chains were investigated in this case study for fisheries based on Lake Volta in the Eastern and Volta Regions of Ghana. In the case of the small-scale capture value chain, the fishers mainly catch Nile tilapia in rivers and lakes and sell to wholesalers from urban centres as well as local small-scale processors. Sales are made at the landing sites in the rural areas, and wholesalers and processors in turn sell to the final consumers. A small amount of wild-caught tilapia is also bought by rural residents within the community. In the case of the more large-scale aquaculture value chain, fish farmers produce fish in rural areas and store it through utilization of cold-storage facilities. The fish farmers either sell their production to wholesalers or retailers or have the ability to act as wholesalers and retailers themselves. Wholesalers and/or retailers then sell the products to the final consumers in urban areas, far from the original production site.
The average price of capture tilapia from small-scale fishers was GHC4.58 per standard basket of 10 kg, whereas after processing it was sold at GHC6.55 for the same standard basket. At this stage in the value chain, all monetary transactions are in cash, and fishers agree to prices through oral agreement with both wholesalers and small-scale processors. Although fishers and processors have noted that the demand for tilapia is increasing, they are currently unable to increase their output to meet the demand.

Value chain dynamics and the small-scale sector 16
Table 2Wholesale and retail prices for commercially farmed tilapia
range (g)
Wholesale(GhC/kg)
retail(GhC/kg)
regular 4.9 5.8
Size 1 300–450 5.3 6.5
Size 2 450–600 6.2 7.6
Size 3 600–800 7.3 8.7
Size 4 800+ 9.0 10.0
Source: ©FaO (2011).
The large-scale commercial fish farms sell tilapia in several sizes, and they can act as both retailers and wholesalers. Wholesalers sell tilapia in quantities of 25 kg or in multiples of 25 kg. Ice chips are added to keep the fish fresh although this is not considered as part of the weight of the tilapia. Retail sales are for sales of fish less than 25 kg. Table 2 shows how the price of tilapia differs by size, with the wholesale price ranging from GHC4.9 to 9 per kilogram and the retail price ranging from GHC 5.8 to 10 per kilogram.
For the large-scale farms visited, tilapia in the range of 450–600 g were considered the average size by weight. Male tilapia fingerlings were graded by weight and sold in terms of numbers with free packing and oxygen from the large fish farms. For example, at Tropo Farms, the prices are:
• 0.2 g – GHC0.04 per fingerling;• 2 g – GHC0.06 per fingerling;• 5 g – GHC0.1 per fingerling.
Traders and small-scale processors usually buy at wholesale prices from the various depots, whereas individual buyers buy at the retail prices. Other tilapia farms sell fingerlings at GHC0.1 each, with this price being determined by demand conditions and input costs. Respondents in the small-scale capture sector were not able to give as-detailed cost data owing to poor records.
The average price for wild-caught tilapia in the Ghanaian small-scale value chain is presented in Table 3, with the fishers selling at GHC0.46 per kilogram to processors, and the processors in turn selling it at GHC0.66 per kilogram.
Table 3prices in the small-scale wild-caught tilapia value chain
Item average purchase price (GhC/basket of 10 kg)
average purchase price (GhC/kg)
average sales price (GhC/kg)
Change in price (%)
Small-scale wild-caught fishers
Na Na 0.46 –
Domestic trader / small-scale processors
4.58 0.46 0.66 43.5
Price to final consumer (mainly salted & dried tilapia-koobi)
6.55 0.66
Source: ©FaO (2011).
Table 4 presents the prices involved in the large-scale tilapia value chain, where the wholesale price was GHC6.2 per kilogram and the retail price was GHC7.6 per kilogram. The final consumer’s price (sold in urban areas) was GHC9.5 per kilogram, indicating a 53.2 percent increase from the wholesale price and a 25 percent increase in the case of the retail price.
The price difference between the small-scale capture value chain and the larger-scale aquaculture value chain is significant, with farmed tilapia receiving much higher prices. Although this gives small-scale fishers the ability to undercut prices from fish farms, it

17Africa
demonstrates how much weaker their livelihood earnings currently are. Coupled with the dwindling capture catch, it becomes apparent that fish farming has a much brighter future in terms of livelihoods. However, the significant investment capital required to build proper aquaculture infrastructure and the knowledge needed to run the systems demonstrate that fish farming will be inaccessible to most without proper government intervention and aquaculture training.
Table 4prices in the large-scale farmed tilapia value chain
Item average price (GhC/kg) Change (%)
Fish farmers 6.2 (7.6)* –
Wholesalers/retailers 6.2 (7.6)* –
Price to consumers/hotels/restaurants
9.5 53.2% using wholesale price and 25% using retail prices
* retail prices. Source: ©FaO (2011).
TunaAt the small-scale level, tuna is not a major catch as it is not usually found close to shore and therefore generally outside the range of small-scale fishers. Tuna that are landed and sold are usually of smaller size or juveniles. Small-scale tuna processors smoke landings and sell the fish to women fish traders or retail it themselves. In most cases, tuna is sold by size, and the price depends on the bargaining power between the fishers, processors and traders. The lack of adequate storage facilities leaves fishers with the weakest bargaining power and the traders with the strongest. There are three major commercial processors based in Tema: Pioneer Food Cannery Ltd., Myroc Foods Ltd, and Ghana Agro-Food Company. These companies buy most of the industrial tuna catch and process it into tuna flakes, tuna chunks and tuna mash, which is then canned and mostly exported.
The causal link between the tuna prices of Ghana and its major trading partners can be ascertained by using the Toda and Yamamoto causality testing procedure. The data used were obtained from the Research Department of the Fisheries Commission of the Republic of Ghana and FISHSTAT (available at the FAO website). In particular, the domestic price of tuna for Ghana was converted to United States dollars using the average annual exchange rate for the period under consideration 1989–2010 (only 22 observations; however, the procedure used is suitable for small samples). The tuna prices for other countries were obtained from FISHSTAT. The variables used were the skipjack tuna prices for Ghana, while for the United States of America and the United Kingdom of Great Britain and Northern Ireland, the import prices of skipjack tuna were used for the period 1989–2010.
With the appropriate lags, equations for Ghanaian tuna prices between its major trading partners for the period 1989–2010 were formulated, with linear restrictions suggesting an estimated direction of causality. The results suggest a bi-directional causality between the tuna prices of Ghana and the United States of America but none for other countries such as the United Kingdom of Great Britain and Northern Ireland. This implies that tuna prices in Ghana depend on tuna prices in the United States of America but not those in other countries. In discussions with officials of the Fisheries Commission, they were emphatic that Ghanaian tuna firms base their price quotations on international prices and not necessarily on their cost structure plus a mark-up. This may be one of the reasons for the bi-directional causality between the tuna prices of Ghana and the United States of America, although the reasons for no relationship with prices in other countries cannot be ascertained.

Value chain dynamics and the small-scale sector 18
Conclusions and policy implicationsGhana has great potential to increase both its inland and marine fish production. The stakeholders in the traditional capture value chain are scattered over numerous communities and, as they produce on a small-scale, they are unable to achieve economies of scale. The more large-scale value chain is dominated by exports and includes large companies with international partners as the processors. These value chains coexist but are not mutually exclusive. For example, the small-scale fishers obtain many inputs such as nets, outboard motors and fuel from the large-scale players, thus contributing to the industry’s income. Moreover, small-scale traders and processors also obtain some tuna and tilapia from firms with large-scale commercial fleets.
While the large-scale tuna value chain has strong partnerships with key stakeholders such as the government, Fisheries Commission and Ghana Tuna Association (which helps to deal with the concerns of producers and exporters), the small-scale tuna value chain has no such organizational support. Moreover, the small-scale sector has limited or little access to information about market requirements for the international market, new technology or new production methods.
Furthermore, there is no standard pricing method for fish in the traditional, small-scale value chain, and its price currently depends on many variables, including bargaining power and market conditions. The bargaining power of the small-scale agents depends on the volume of the fresh fish catch, demand and storage ability. It could be beneficial for buyers and sellers to adopt pricing methods according to weight, as is done with meat in the country, rather than only sell fish by estimating its size by eye. Sanitary and hygienic problems are an additional issue in the small-scale value chain. There are no sanitary or health standards enforced in the domestic fish market, although standards do exist under the Food and Drugs Act of 1992. For those companies that export fish, the Ghana Standards Board provides certification for the fish exports to comply with European Union (Member Organization) and other international requirements. Although this ensures a hygienic product, it also prevents access to the international market for small-scale fishers as they do not have the financial means or proper training to obtain certification.
It would be beneficial for the government’s Fisheries Commission, local governance institutions (district assemblies and/or traditional authorities) and local NGOs to provide more support to the small-scale sector. Such support could include:
• education about international market requirements and certification;• researching and finding international niche markets where there is a demand
for small-scale tuna;• establishing institutional arrangements for cooperatives to take up sanitary and
phytosanitary certification for small-scale tuna;• training on pricing methods, safe and hygienic practices and reducing
post-harvest losses;• improving fish farming technology and infrastructure, such as appropriate
storage facilities near fish landing sites and refrigeration at local market sites.
KenyabackgroundFreshwater fisheriesThe fishery sector in Kenya consists of a complex of interwoven activities and value chains: fresh and processed fish, industrial and small-scale processing, domestic and export markets, and food and feed products. Traditionally, Lake Victoria has the largest fishery, producing 143 908 tonnes of fish in 2006 (Government of Kenya, 2007). However, production declined to 111 369 tonnes and 108 934 tonnes in 2008 and 2009, respectively. In addition, it has the largest number (44 263) of fishers operating small

19Africa
craft and small-scale gear (Government of Kenya, 2007). Other major fisheries are: Lakes Naivasha, Baringo, Jipe and Chala, and the Tana River.
Lake Victoria has a multispecies fishery comprising endemic and introduced species. The endemic species include tilapiines and haplochromines, cichlids and more than 20 genera of non-cichlid fish, including Mormyrus, catfish, cyprinids and lungfish. The introduced species, especially Nile perch and Nile tilapia, were responsible for the increase in total annual fish catches in the 1980s and 1990s.
Coastal and marine fisheriesThe Kenyan coastline is 640 km long and forms part of the western border of the Indian Ocean. It consists of 12 nm of territorial waters and an exclusive economic zone extending to 200 nm with a total area of 142 400 km2. The Kenyan marine waters support a wide variety of fish species, which include finfish, both pelagic (king fish, barracuda, mullets, queen fish, etc.) and demersal (rabbit fish, snapper, rock cod, scavenger, etc.), as well as crustaceans (prawns, lobsters, crabs, etc.) and molluscs (squids and octopus). In marine fisheries, there are about 6 500 small-scale fishers operating 1 800 simple fishing crafts with limited access to offshore and the deep-sea fisheries and, therefore, they often land very little catch. These small-scale fishers land about 7 000 tonnes of fish annually, which is about 4 percent of total national fish production. The offshore fisheries zone is mainly exploited by distant-water fishing nations targeting the tunas including skipjack, yellowfin and bigeye tuna (Government of Kenya, 2008).
The capture fisheries activities are managed by the Department of Fisheries under the Ministry of Fisheries Development. The management system currently in place takes into consideration monitoring, control and surveillance (MCS), fisheries development, appraisal, improvement and data collection among other activities. The official fisheries data collection, processing and analysis are the mandate of the Department of Fisheries, and the final summaries are submitted to the Central Bureau of Statistics for the compilation of the Statistical Bulletin. The Kenya Marine and Fisheries Research Institute also collects fisheries data but specifically for research purposes.
AquacultureIn 2009, the country had 6 328 (individuals or groups) fish farmers compared with 4 742 in 2008. They were farming on 9 116 earthen ponds covering an estimated area of 274 ha, compared with 7 530 ponds covering 227 ha in 2008. There were also 331 dams with an area of 547 ha and 161 tanks/races with an area of 2 ha. This translates to 823 ha of surface area used in 2009 in aquaculture fish production (728 ha in 2008). The farmers were found in all the provinces apart from Nairobi and North Eastern.
This increase in production area of farmed fish can be attributed to the Economic Stimulus Programme (ESP), which was funded by the Government in Financial Year 2009/2010. Under the ESP, some 140 constituencies constructed 200 fish ponds each. A total of 1 586 new fish ponds covering 47 ha had been constructed throughout the country by the end of December 2009 under the ESP.
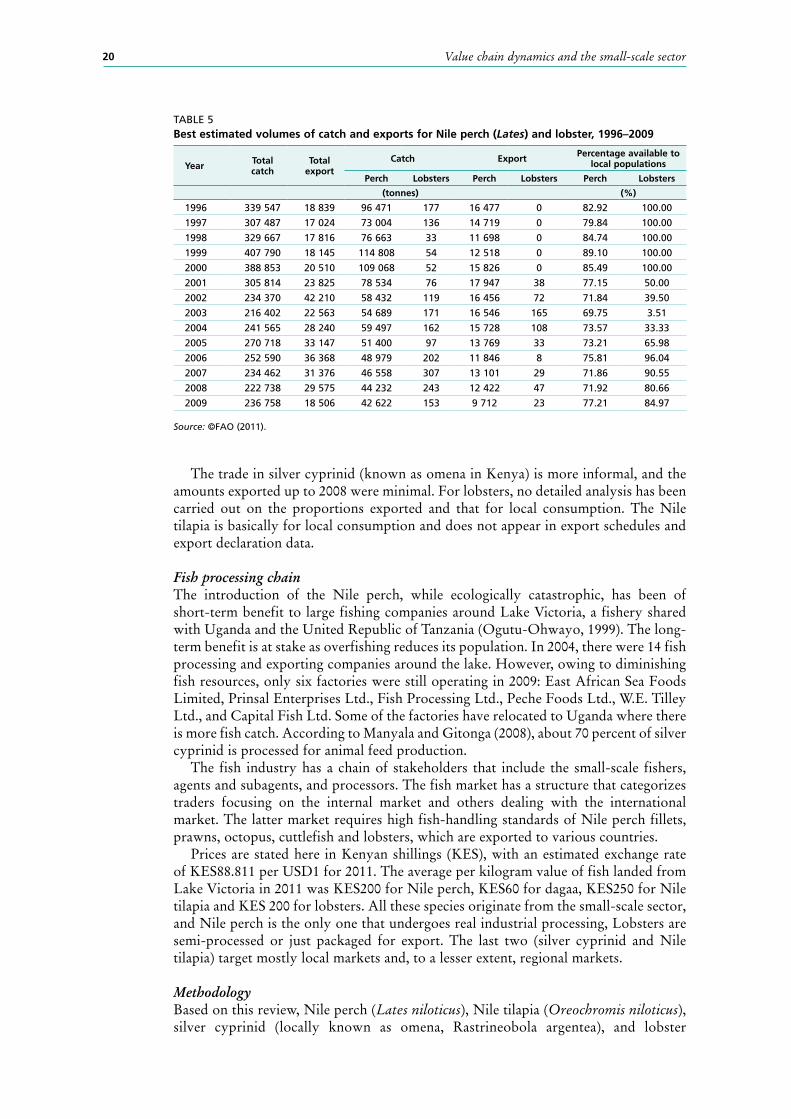
Foreign and domestic fish marketsFor Nile perch exports, Table 5 shows best estimates for the quantity exported from 1996 to 2009, ranging from a low of 9 712 tonnes in 2009 to a high of 17 947 tonnes in 2001, leaving about 70–90 percent for local consumption during this time frame. Table 5 also shows best estimates for lobster exports, ranging from a low of 8 tonnes to a high of 165 tonnes during the same period, leaving about 3.5–90 percent of the catch for domestic consumption. Lobster exports started in 2001 and there were no official exports prior to this period.
Value chain dynamics and the small-scale sector 20
Table 5best estimated volumes of catch and exports for nile perch (Lates) and lobster, 1996–2009
year Total catch
Total export
Catch export percentage available to local populations
perch Lobsters perch Lobsters perch Lobsters
(tonnes) (%)
1996 339 547 18 839 96 471 177 16 477 0 82.92 100.00
1997 307 487 17 024 73 004 136 14 719 0 79.84 100.00
1998 329 667 17 816 76 663 33 11 698 0 84.74 100.00
1999 407 790 18 145 114 808 54 12 518 0 89.10 100.00
2000 388 853 20 510 109 068 52 15 826 0 85.49 100.00
2001 305 814 23 825 78 534 76 17 947 38 77.15 50.00
2002 234 370 42 210 58 432 119 16 456 72 71.84 39.50
2003 216 402 22 563 54 689 171 16 546 165 69.75 3.51
2004 241 565 28 240 59 497 162 15 728 108 73.57 33.33
2005 270 718 33 147 51 400 97 13 769 33 73.21 65.98
2006 252 590 36 368 48 979 202 11 846 8 75.81 96.04
2007 234 462 31 376 46 558 307 13 101 29 71.86 90.55
2008 222 738 29 575 44 232 243 12 422 47 71.92 80.66
2009 236 758 18 506 42 622 153 9 712 23 77.21 84.97
Source: ©FaO (2011).
The trade in silver cyprinid (known as omena in Kenya) is more informal, and the amounts exported up to 2008 were minimal. For lobsters, no detailed analysis has been carried out on the proportions exported and that for local consumption. The Nile tilapia is basically for local consumption and does not appear in export schedules and export declaration data.
Fish processing chain The introduction of the Nile perch, while ecologically catastrophic, has been of short-term benefit to large fishing companies around Lake Victoria, a fishery shared with Uganda and the United Republic of Tanzania (Ogutu-Ohwayo, 1999). The long-term benefit is at stake as overfishing reduces its population. In 2004, there were 14 fish processing and exporting companies around the lake. However, owing to diminishing fish resources, only six factories were still operating in 2009: East African Sea Foods Limited, Prinsal Enterprises Ltd., Fish Processing Ltd., Peche Foods Ltd., W.E. Tilley Ltd., and Capital Fish Ltd. Some of the factories have relocated to Uganda where there is more fish catch. According to Manyala and Gitonga (2008), about 70 percent of silver cyprinid is processed for animal feed production.
The fish industry has a chain of stakeholders that include the small-scale fishers, agents and subagents, and processors. The fish market has a structure that categorizes traders focusing on the internal market and others dealing with the international market. The latter market requires high fish-handling standards of Nile perch fillets, prawns, octopus, cuttlefish and lobsters, which are exported to various countries.
Prices are stated here in Kenyan shillings (KES), with an estimated exchange rate of KES88.811 per USD1 for 2011. The average per kilogram value of fish landed from Lake Victoria in 2011 was KES200 for Nile perch, KES60 for dagaa, KES250 for Nile tilapia and KES 200 for lobsters. All these species originate from the small-scale sector, and Nile perch is the only one that undergoes real industrial processing, Lobsters are semi-processed or just packaged for export. The last two (silver cyprinid and Nile tilapia) target mostly local markets and, to a lesser extent, regional markets.
MethodologyBased on this review, Nile perch (Lates niloticus), Nile tilapia (Oreochromis niloticus), silver cyprinid (locally known as omena, Rastrineobola argentea), and lobster

21Africa
(Pinulurus ornatus / P. homarus) were selected for the analysis. All species chosen for analysis were from wild-caught fisheries. The Nile perch fishery is mainly small-scale, but on a commercial basis, the collection and transportation is organized through agents. Part of the catch is industrially processed while a large proportion is for the domestic market. The Nile tilapia fishery is also small-scale; a small proportion is industrially processed, but currently does not target the export market. The target consumers are the affluent or the upper class through supermarket chains, high-class hotels and the tourism sector. The silver cyprinid fishery again is small-scale and its utilization is split between the animal feed industry and human consumption; it does not target the export market at the moment, although a few attempts to establish export markets have been recorded with low success. The lobster fishery is small-scale with a very well-organized marketing system, agents, processors and exporters.
There is no central fisheries database in Kenya. Most of the data are either in the custody of individual officers or are already highly summarized in statistical bulletins. This situation poses a serious challenge in acquiring the complete datasets for complete value chain analysis.
For this case study, a number of datasets were obtained and compiled. Lake Victoria fish landing data were compiled on an annual basis by species and first-hand value from 1970 to 2007. In addition, data collected and compiled included: fish prices and landings of three main species (Nile perch, Nile tilapia and silver cyprinid) from 140 sites (landing beaches and markets) on a daily basis in 2010; fish export quantities and value by species on an annual basis from 1996 to 2009; and monthly landings and value of lobsters from three landing sites in Lamu District from 2001 to July 2009. Isolated data on prices per kilogram over varying times and places for Nile perch, Nile tilapia, silver cyprinid and lobsters have been compiled, as well as operation costs of fishers, fish processors, and fish traders for silver cyprinid through marketing surveys between 2008 and 2010.
All the data were summarized into total annual values by weight and by value at the first-hand level, as well as at export level. The same values were also summarized into monthly average for the period 2001–2010 and the export value. These summaries facilitated the calculation and estimation of price per unit weight of the selected species.
The results of the price calculations were then plotted on time scales (annual and monthly average) in order to analyse the trends against the foreign exchange rate as one of the factors that could determine fish price variations at national and international markets.
resultsFirst-hand value and price of fishThe study showed that the first-hand price of fish per kilogram was highest or higher for the lobster fishery from 2004 to 2010, with a range of KES430–658 per kilogram. Nile perch and Nile tilapia fetched significantly higher prices from 2008 to 2010 compared with 2004. These data can be seen in Figure 2. Catch volumes for all species are given in Figure 3.

Value chain dynamics and the small-scale sector 22
FIgUre 2export value of silver cyprinid, nile perch, nile tilapia, and lobsters, 2004–2010
FIgUre 3Catch volume of silver cyprinid, nile perch, nile tilapia and lobsters, 2004–2010
Correlations between prices of each species group were analysed through a simple regression that showed no significant influence of foreign exchange rate on the first-hand prices. With this finding, other internal factors are likely to be responsible for price changes, especially the increase in price observed in all species from 2008 onwards. One likelihood is that fish abundance has declined alongside growing demand, thereby driving prices upwards. Inflation and political turmoil in Kenya following the post-election violence could also be responsible for the general increase in consumer prices as this effect has been observed in almost all productive sectors of
Source: Kenya Marine and Fisheries Institute (2010).
Source: Kenya Marine and Fisheries Institute (2010).

23Africa
Kenya’s economy. Moreover, inflation rates, although currently managed within one digit, could also have stimulated price increases for fish as well as food in general.
The price variations for tilapia were found to be significantly correlated to the foreign exchange rate. Why this is so is not fully understood might be a topic for further analysis. It is worth noting that all tilapia produced in Kenya is for the domestic market, with none exported. In addition, tilapia is a premium-choice species for most consumers because of its taste, flavour and texture. The prices of both wet and dry tilapia were found to be stable, except in November for the sun-dried products. Overall, there is not sufficient information available to explain the weak correlation between the price of tilapia in the domestic market and foreign exchange rates.
Wild-caught tilapia and lobster harvests are highly seasonal, and there are months of low production as well as months of high production. In the marine environment, this is caused by adverse weather conditions that prevent small-scale fishers from going out at sea. For tilapia in the freshwater ecosystem, it is seasonal owing to winds, rainfall and productivity shifts in the littoral zones of the lakes. The costs of fishing inputs have increased recently and this fact is reflected in the price of fish.
There has been a concerted effort to organize fishers in Kenya under the new comanagement approach into beach management units. These units have undergone training on fish quality control, organizational development, financial management, marketing and MCS. It is possible that this capacity-building initiative could pay off in terms of increasing bargaining power at the first-hand level in fish production.
As elsewhere, the price of fish in Kenya is determined by the interaction between supply and demand. While quantity consumed depends on price, the income levels of consumers are also important determinants of demand. However, there are no authentic datasets to show these possible relationships between fish prices and demographics such as income level.
Export pricesThe export price per unit of Nile perch and lobster has also increased considerably over the years, although there has recently been a decrease in the price of lobster (Figure 4). The price variation for lobster could be partially due to the fact that the quantities exported are relatively small, thus making price observations less reliable. Even so, if the high price of lobster at KES951 per kilogram is removed, then 67 percent of the variation in prices could be explained by the variations in foreign exchange rates. For Nile perch, price variations for export cannot be explained by the fluctuations in foreign exchange rates.
Export and first-hand earningsAn analysis of the export equivalent of first-hand earnings can be seen in Table 6, which shows that the average earnings for export ranges between 202.8 and 329.4 percent for the first-hand earnings for Nile perch. For lobster, the average earning for export ranges between 114.3 and 181.1 percent compared with first-hand earnings. With the normal mark-up prices for enterprises between 25 and 40 percent from the apex trader to the producer, there is great disparity between the nodes of the value chain in terms of earnings.

Value chain dynamics and the small-scale sector 24
Table 6margin analysis between first-hand and export earnings
2004 2005 2006 2007 2008 2009
export volume (tonnes)
Nile perch fillets 15 728 13 769 11 846 13 101 12 422 9 712
lobster 208 33 8 29 47 23
export earnings (uSd)
Nile perch fillets 4 062 517 3 833 568 3 393 266 3 516 347 3 366 254 3 148 308
lobster 141 146 22 520 5 286 44 711 17 314
fishers earnings (uSd)
Nile perch fillets 1 233 414 1 204 526 1 111 876 1 288 786 1 660 207 1 491 991
lobster 89 493 15 396 4 317 24 688 15 147
Nile perch exporter (%) 329.4 318.3 305.2 272.8 202.8 211.0
lobster exporter (%) 157.7 146.3 122.4 181.1 114.3
Source: ©FaO (2011).
Conclusions and policy implicationsIn terms of pricing of fish at the first-hand level, the lobster fishery provides the highest price to fishers at about KES700 per kilogram as compared with Nile perch (KES170) and Nile tilapia (KES167). In terms of the export market, lobster still receives the highest price (up to KES1 000 per kilogram), which is attributed to the demand for marine crustacea. As most of the species have shown a general trend of declining catches, the most plausible reason for price increases since 2007 for the selected species can be explained by the market forces of demand and supply, as well as the political instability created by the post-election violence in 2007–08. The pricing of fish at the first-hand level continues to pose a significant challenge for the fishers. Although the Government of Kenya has made it illegal to buy fish from fishers at sea, which allows some degree of fair bargaining on landings, it is recommended that fishers become organized into producer groups in order to help create better bargaining opportunities and market access.
FIgUre 4export value (free on board) of nile perch and lobsters, 1996–2009
Source: Kenya Marine and Fisheries Institute (2009).

25Africa
At a broader level, there is a need to harmonize the current institutional framework for fisheries in Kenya and to advocate for a distinct fisheries act or policy. Since Kenya’s independence in 1963, there has never been such legislation. Rather, various ministries have been made responsible for fisheries, with this responsibility moving between eight different ministries over the years, which has fuelled controversy over the use of fish. Moreover, the complicated institutional framework for fisheries has been extremely non-conducive to formalizing the small-scale sector into businesses. Necessary aspects for formal fish and seafood businesses, including food safety licences, fishing permits, health certificates and inspections, are all under various ministries and are expensive and cost-prohibitive for the small-scale sector to obtain. Microfinance institutions, which perhaps could help with low-interest loans in other sectors of the Kenyan economy, do not have experience in fisheries, and thus cannot provide any help. Although creating one ministry to focus on fisheries may be unrealistic in the short term, it is recommended that one group from various ministries be formed, specifically with the mandate to address challenges the small-scale fisheries sector is facing in Kenya and to advocate more equitable prices for fishers. More equitable prices could mean fairer prices based on the going market price, or government subsidies if the market price is low. In addition to forming this group, a framework must be established for how the parties involved will work together.
In terms of markets, it is recommended that efforts be made to develop the domestic and regional markets in particular to cater to high-income consumers. This would provide fishers with attractive outlets in addition to the export market. The domestic and regional fish market is largely unexploited and offers an opportunity for both new product development and enhanced income to fishers and traders. New value-added product development should be supported, and standards must be set for value-added products other than sun-dried, such as salted, spiced or fried.
uGandabackgroundThe Ugandan fisheries sector is not large compared with the agriculture sector but it does contribute about 2.8 percent to the country’s gross domestic product and employs about 4 percent of the total population. The sector plays an important role in employment and poverty reduction in rural areas and provides an important source of food protein for the population. It also provides other industries with fishmeal and other animal feed inputs. In addition, fish exports provide an important source of foreign currency for Uganda.
The purpose of this research was to carry out a statistical investigation of market prices in the fish value chain for Uganda. The data used in the statistical work are the average monthly real prices of five fish species: wild-caught Nile perch (Lates niloticus), wild-caught and farmed African catfish (Clarias gariepinus), wild-caught mukene (the local name for silver cyprinid, Rastrineobola argentea), wild-caught bagrus (the local name of a type of catfish, Bagrus docmac) and wild-caught and farmed tilapia (Oreochromis niloticus). Unless otherwise noted, prices stated here are in Ugandan shillings (UGX), with an estimated exchange rate of UGX2 522.8 per USD1 for 2011. Due to the high inflation in the period covered, all nominal prices in Ugandan shillings were deflated using the consumer price index obtained for food stuff in central Uganda from Uganda Bureau of Statistics. All the species come from Uganda’s wild-caught fisheries, but African catfish and tilapia are also farmed. For African catfish, about 67 percent of total production is farmed, whereas for tilapia about 32 percent is farmed. Together, these farmed fish species add about 50 000 tonnes to a total capture fishery of about 350 000 tonnes annually
Monthly average price data were available for the five fish species with prices in real Ugandan shillings. Nile perch is primarily an export product and price information is

Value chain dynamics and the small-scale sector 26
available for five nodes in the value chain: first-hand, landings, industrial processing, retail and export. Mukene is a dried product destined for local markets and price information was available on three nodes in the value chain: first-hand, wholesale, and retail. The other three species (tilapia, African catfish and bagrus) are mostly destined for the local fresh market, although a considerable amount of tilapia was exported prior to 2009. There is little or no processing involved in these local products, as most fish is sold whole and gutted or whole and ungutted. For tilapia and bagrus, there are prices for three nodes in the value chain: first-hand, landings and retail, whereas for African catfish there are prices for landings, farmed and retail. First-hand prices reflect the actual price the fishermen receive while landing prices are the amount that traders, who collect fish from boats, sell the fish for to other traders or transporters at the landing site.
resultsAs the study is interested in horizontal integration at the first-hand and retail nodes in the value chain, prices are first summarized at this level. Figure 5 indicates monthly trends in the real first-hand price of Nile perch, bagrus, tilapia, African catfish and mukene. Fishers receive the highest value for Nile perch, the species destined for the export market, and the lowest value for mukene, a dried product for local consumption. Nile perch shows a steady rise in price over the period with a sharp increase at the end of 2009. Bagrus, tilapia and African catfish (all sold into the fresh local market) appear to follow a similar rising trend over time. Early on in the data, African catfish received the highest of the three prices but this is reversed by the end of the period. The real first-hand price for mukene has been flat with little variation, although there is a slight increase in price near the end of the data period.
Looking only at trends in the price series, it appears that Nile perch and mukene follow separate and individual trends over the period, whereas bagrus, tilapia and African catfish appear to follow a somewhat similar trend over time. This similarity in trends is important to note as it is a necessary condition for horizontal integration in first-hand prices.
Figure 6 shows real retail prices of whole ungutted Nile perch, bagrus, African catfish and tilapia. Nile perch, bagrus, and African catfish appear to follow a similar trend over time but tilapia experiences several shocks over the period – a positive shock early in the series, a major negative shock late in the period – with relatively flat trends in between. Bagrus follows a slightly steeper trend relative to Nile perch and African catfish and is subject to both positive and negative shocks late in the period. The negative price shock in tilapia in 2009 was probably caused by increased competition from tilapia producers in the European Union (Member Organization) as this reduced Ugandan exports and increased local supply, exerting downward pressure on the price and helping to explain why tilapia is now mostly destined to the local market (Ssewanyana and Bategeka, 2010).
In terms of horizontal integration, it appears that perhaps bagrus and African catfish follow a similar trend to Nile perch. Tilapia seems to follow its own separate trend over the data period.
The summary of price statistics is presented in Table 7, which defines mean prices for each species and node in the value chain. Generally, Nile perch attracts the highest real price in both the first-hand and retail markets whereas mukene receives the lowest.

27Africa
FIgUre 5first-hand prices from january 2006 to december 2010 by species
Source: ©FaO (2010).
FIgUre 6retail price, whole ungutted, from january 2006 to december 2010 by species
Source: ©FaO; Uganda bureau of Statistics (2010).
Table 7price summary statistics, mean value
first-hand retail
(uGX/kg)
Nile perch 1 979.59 5 132.01
bagrus 1 149.31 3 712.55
Tilapia 1 026.02 3 095.91
african catfish 1 251.34 3 148.34
Mukene 292.211 –Landing processing retail – dried export
(uGX/kg)
Nile perch 2 812.89 3 257.13 – 7 913.67
Mukene 521.97 – 2 433.44
Source: ©FaO (2010).

Value chain dynamics and the small-scale sector 28
Conclusions and policy implicationsThe purpose of this case study was to provide a statistical investigation of links in the fish value chain in Uganda. Particular interest was paid to exploring the extent to which first-hand and farmed prices affected links downstream in the fish value chain. These issues were subject to statistical analysis. It was found that markets tend to be integrated, indicating that prices in the value chain move together over time. However, first-hand prices are only weakly related to downstream markets and have limited price leadership.
In terms of policy issues, Uganda has a major challenge in its primary fish production site – Lake Victoria. This is currently an open-access fishery, which leads to unsustainable exploitation of resources, and it is used by Kenya and the United Republic of Tanzania as well, which leads to further complications. Nevertheless, there are examples of fisheries management where different countries share a resource in a sustainable manner and can provide guidance for Lake Victoria. A joint management plan between countries to ensure stock levels that provide the highest possible sustainable yield is vital. What this management plan should be constructed as needs to be further explored. Whereas the setting of total allowable catch (TAC) limits for a TAC-based system in Lake Victoria may not be feasible, it may be more appropriate for the lake to effectively introduce input control measures together with technical requirements such as minimum size of fish that can be caught and landed, protection of breeding grounds, etc. Whatever the management system, proper enforcement is crucial, along with jointly setting the plan by bringing together key stakeholders, in particular the fishers themselves, to ensure buy-in and provide them with incentives for comanagement.
In terms of policy implications, the results show very weak links from the first-hand price to downstream markets. This is particularly evident in the export Nile perch value chain. It is suspected that market power in the export market restricts price variation and value to the first-hand market. There may be two possibilities to improve conditions for fishers; first, increase competition for raw Nile perch product in the export sector and, second, encourage a single selling desk at the first-hand level for export-quality Nile perch. For the former, increasing competition may be difficult because of vested interests. The export sector is characterized by many fishers supplying an export-processing sector of about 20 firms. The export-processing sector is regulated for health and food safety, and regulators may be reluctant to increase the number of processing firms substantially because of the difficulty in maintaining food standards. There may be other issues. In terms of encouraging a single selling desk, the small number of processing firms makes it possible for a single selling desk to represent the interests of fishers. For this to be feasible, the Government must be fully supportive, enact necessary legislation requiring processors to buy from the desk and provide proper enforcement.
Ugandan fisheries policies for non-export fisheries are more difficult given the vast number of fishers, the open-access nature of the fishery, the possibility of fishers avoiding regulations, and the nature of shared resources on Lake Victoria. The Government is aware of these difficulties, and some positive steps towards central governance are under way; examples include the registration of fishers and fishing boats on Uganda’s waters, and continued multicountry talks on regulations and enforcement on Lake Victoria.

29
6. Central and South america
hOnduraSbackgroundValue creation and distribution in seafood trade is reflected by the price of inputs and outputs throughout the value chain. Thus, benefits of seafood trade for the small-scale sector depend on price behaviour in different stages of the value chain. The objective of the case study in Honduras is to shed light on price linkages in the value chains for selected Honduras seafood products using statistical and econometric analysis. A key source of information for this study has been a companion study by Beltrán (2011). Her study provides an overview of the seafood industry in Honduras with special attention to the value chains that small-scale producers have access to. Many of the statistics used in this study originate from Beltran’s report. In addition, the statistics used have been determined appropriate for the type of analyses conducted below and could complement the discussion on Honduran seafood value chains.
The seafood value chains analysed in this case study include farmed shrimp (Litopenaeus vannamei), farmed tilapia (Oreochromis sp.), wild-caught lobster (Panulirus argus) and wild-caught snapper (Lutjanus spp.). These species are part of both the large-scale and small-scale value chains and, thus, both scales were considered in analysis. Aquaculture in Honduras, largely made up of shrimp and tilapia, is a significant contributor to the country’s seafood sector. Indeed, in 2009, aquaculture production was 2.5 times larger than capture fisheries, with respective production volumes of 28 858 tonnes and 11 302 tonnes. This means that shrimp and tilapia are the largest contributors to Honduran seafood production, accounting for 35 percent and 34 percent of total volume in 2009. In the same year, lobster made up 5 percent of total seafood production, while snapper accounted for about 2 percent.
In relative terms, Honduras is a small global seafood exporter. The United States of America is its most important export market, but in terms of volume, no one product dominates. Given the relatively small volumes, Honduran exporters are most likely price takers in the competitive international seafood markets. The only exception could be the market for fresh tilapia where Honduras, together with Ecuador, is the largest exporter. Price formation in these markets are analysed further in this case study.
This case study analysed price differences horizontally and vertically in the value chain between local, regional and international market conditions. The econometric analysis concentrated on analysing price linkages in the international value chains. This analysis provides information about the price formation process in international seafood markets where Honduran exporters already have a significant presence. Access to market data such as prices and transacted volumes in developing countries was often limited, which meant that the analysis involving domestic prices was restricted to basic statistical price comparisons.
resultsShrimpIn Honduras, wild shrimp is caught on a large scale in the Caribbean but on a small scale in the Pacific. Both scales are also visible in terms of farmed product, as shrimp is produced by large-scale industrial farms as well as on a smaller scale in rural communities. As with most shrimp farming industries in smaller countries, the domestic production is mostly intended for export markets. The two main markets for
Value chain dynamics and the small-scale sector 30
Honduran shrimp are the United States of America and the European Union (Member Organization). The price data consisted of the wholesale and import prices for the period 2000–2010.
In terms of the import prices paid for Honduran shrimp in these two main markets, the data demonstrate that exchange rates influence relative prices between the United States of America and the European Union (Member Organization). From 2003 to 2005, average import prices to the European Union (Member Organization) were higher than those to the United States of America, while later the prices appear to be more aligned. This suggests that it takes time for complete pass-through of changes in exchange rates to prices. If transportation costs were included, an impact on prices in the different markets may be seen, with prices in the European Union (Member Organization) likely to be higher with the longer travel distance.
It was found that the domestic wholesale price of shrimp in Honduras is on average slightly higher than the import price, demonstrating that Honduran shrimp obtain higher prices in domestic wholesale compared with export. Indeed, when calculating the average shrimp prices during the period from January 2007 to December 2008, Honduran wholesale prices were 20 percent higher than export prices to the European Union (Member Organization). This is probably because the domestic buyers are dominated by restaurants and hotels, which are willing to pay prices similar to the international market prices. However, the size of these sectors, including those of restaurants and hotels, somewhat limits the potential to increase sales in the domestic market. A shift in the marketing from the international to the domestic market would require a higher penetration of the local consumer market, and this may be worth exploring. An estimate of the domestic demand for shrimp is also crucial.
Honduran seafood producers, which are relatively small in an international context, are likely to have limited influence on fish prices. However, if Honduran seafood exporters dominate a particular market niche or segment for a product with few substitutes, producers could become more empowered. Thus, value-added productions in shrimp coupled with a sustainable and efficient use of resources are vital for the Honduran shrimp industry to continue growing and creating new livelihoods. In order for this to be achieved, small-scale shrimp producers need continued access to training and credit to keep up with the standards of demanding international markets.
TilapiaHonduran farmed tilapia is produced by large-scale industrial producers and also on a smaller-scale in rural communities. This tilapia is mainly destined to the United States market as a fresh filleted product. It is also imported as frozen fillets, but at much lower volumes than fresh. From 2000 to 2008, United States tilapia imports increased, but then fell in 2009 and grew slightly again in 2010.
The price data consist of the wholesale and import prices for the period 2000–2011. As most of Honduran tilapia exports are fresh fillets to the United States of America, this analysis focused on the relationship with the main competitors in this specific market segment. Figure 7 plots the United States import prices of fresh tilapia fillets from Costa Rica, Ecuador and Honduras. In 2008, both Costa Rican and Honduran exporters experienced a price hike while the prices of Ecuadorian tilapia remained more or less constant. Following this, from 2009 to 2011, Honduran tilapia generally obtained higher prices compared with its competitors in Ecuador and Costa Rica. This suggests that fresh tilapia fillets from Costa Rica, Ecuador and Honduras are imperfect substitutes. A probable explanation lies in the different production technology used in Ecuador compared with Honduras and Costa Rica. In Ecuador, the polyculture of tilapia and shrimp together leads to smaller-sized tilapia than in monoculture systems. The United States market prefers the larger-sized tilapia fillets provided by Honduras, and the quality of tilapia meat from Honduras has a high reputation.

31Central and South America
The first aim was to test the relationship between the import prices of Honduran tilapia with Ecuadorian tilapia, which formerly was the market leader in terms of export volumes of fresh filleted tilapia. When formulating a regression model consisting of only the Honduran and the Ecuadorian prices for two periods, no cointegration was found. However, when a dummy was added from July 2008 onwards, the prices appeared to be cointegrated. Justification for adding the dummy variable is related to the reasons given above of a price premium given to Honduran tilapia. However, the timing of the dummy is ad hoc and came from observing that Honduran prices increased relative to Ecuadorian prices in 2008. The timing of this price hike is unknown, but it should reflect that the size and quality of tilapia have become vital marketing factors. This is an interesting result as it gives room for product differentiation.
At first glance, United States import prices of tilapia are higher than Honduran wholesale prices, unlike shrimp. However, domestic prices probably refer to whole tilapia, in which case the price per kilogram is lower than that for fillets. If a reasonable yield rate of 35 percent is used for fillets, then the domestic price is in fact 11 percent higher than the United States import prices. This would suggest that local market prices can be more lucrative than international trade prices, although it is doubtful that this would hold if supply to the domestic market increased. Generally, consumers in Honduras have little tradition for seafood consumption, as they prefer meat and chicken. However, the majority of tilapia sold in the local market is from small-scale producers and their supply is not sufficient to cover the domestic demand. Large-scale producers prefer to export tilapia fresh to the United States of America, which suggests that there is a belief that Honduran consumers are unwilling to pay a price premium for quality. This market preference could also be due to factors such as ease of market access, consistent opportunities on large-scale and established buying relationships.
Spiny lobsterAs other species investigated here, spiny lobster is caught by both the large-scale and small-scale fishing fleets. This type of lobster is another important seafood sector in Honduras that is export oriented. The majority of international shipments are destined for the United States of America; in fact, Honduras is one of the top five exporters of
FIgUre 7united States import prices of fresh tilapia fillets by exporting country
Source: US National Marine Fisheries Service (2012).

Value chain dynamics and the small-scale sector 32
lobster to the country. The lack of domestic wholesale prices for spiny lobster reflects the fact that the bulk of the harvest is exported. As an exclusive product, domestic sales are mainly directed to restaurants and upmarket hotels. Even with a small domestic market, the exclusivity of the product can make lobster harvesting a profitable endeavour for small-scale fishers. The price data for this study includes the import price to the United States of America from 2000 to 2011.
In the following analysis, the focus is on a price comparison between the Bahamas, Honduras and Nicaragua. Figure 8 shows that their prices appear to be closely integrated. A statistical analysis allows testing of this hypothesis by examining the dynamic relationship between the prices.
From the results, Honduran prices seem to have more of a short-run impact on the Bahaman and Nicaraguan prices in the short term than vice versa. An impact response analysis gives additional information on the long-term impact of changes of one price on another, and it appears that Bahaman prices have a stronger influence on Honduran prices than Nicaraguan. This greater influence on price formation can be explained by the larger volumes of imported lobster originating from Bahamas compared with Nicaragua.
FIgUre 8united States lobster import prices as three-month moving average by exporting country
SnapperThe largest fisheries in Honduras are marine fish, shrimp, stromboid conch and spiny lobster. Snapper and grouper make up the largest portion of the marine fish category, in particular snapper, and they are caught on both a large and small scale. The large-scale industrial fisheries of red snapper are export oriented and most fish are shipped fresh and whole to the United States of America. From 2000 to 2009, there was a very weak increasing trend in United States import prices of red snapper from Honduras, while since 2009, United States import prices have increased rapidly. Regardless of these trends, there is also a relatively high volatility in the prices influenced by seasonality in the catches.
The import price of Honduran snapper has lagged behind the price increases of the other large exporters of snapper to the United States of America. However, the
Source: US National Marine Fisheries Service (2012).

33Central and South America
catching up in 2010–2011 signals that these markets are not entirely separated. The findings from the econometric model suggest that Honduran exports to the United States of America are influenced by Panamanian snapper exports in the long run. Given that the total import volume of snapper to the United States of America has stagnated in the last few years and if this reduction is related to lower landings of snapper due to biological constraints of wild stocks, prices are likely to remain firm.
When comparing average prices of Honduran snapper between the United States import market and the Honduran domestic market for the period 2000–2011, it can be concluded that import prices are 11 percent higher than domestic prices. As it is exported fresh, transportation costs are probably substantial for the exports to the United States of America, which can explain some of the price difference. In addition, many of the same limitations for the domestic tilapia market also apply here. The lack of marketing of fish products, as well as the minimal quality control, has prevented the expansion of the domestic market and can explain why most snapper fish is exported.
Conclusions and policy implicationsA large share of the Honduran seafood production is exported to the United States of America, which demonstrates that seafood producers in Honduras participate directly in competitive and demanding international markets. It is useful to reflect on what this implies for price determination of fish products. Globally, seafood is traded more than any agricultural product, with 39 percent of seafood shipped internationally (FAO, 2010). Comparing seafood trade-to-consumption in individual countries allows exposure to competition in seafood markets to be estimate. Tveteras et al. (2012) estimated that 78 percent of global seafood production is exposed to trade competition. In Honduras, a seafood trade-to-consumption ratio of 1.75 is found, which means that the level of seafood imports plus exports is 175 percent higher than domestic seafood consumption. This is in terms of quantity; value comparisons might be different. Nevertheless, this high ratio implies that not only are traded Honduran fish exposed to international competition, but also that non-traded fish could conceivably also have been exported. In other words, if prices of exported fish from Honduras are analysed, this will have a bearing on price formation domestically of the same products.
In international shrimp trade, many exporting countries compete. When competition is strong, price movements tend to be aligned across geographical markets. Accordingly, the analysis shows that import price of Honduran shrimp is very similar in the European Union (Member Organization) and the United States of America, indicating that these two markets are integrated. Moreover, a few other studies have shown that the United States shrimp market is highly competitive (Asche et al., 2011; Keithly and Poudel, 2008).
Despite not influencing international prices, Honduran exporters can still choose where to sell their shrimp. During the data period, the flow of Honduran shrimp exports shifted back and forth between the markets of the European Union (Member Organization) and the United States of America. Changes in the USD–EUR exchange rate have changed relative prices between these two markets and thereby created profitable opportunities for shifting the market back and forth. Thus, even if a Honduran shrimp producer does not have market power, higher revenues can be obtained by being flexible in terms of the product processing and marketing preferred by various markets. However, this requires the ability to monitor markets and to have sufficient processing and marketing capabilities to be able to deliver exactly what the market demands. For both the markets of the European Union (Member Organization) and the United States of America, it seems Honduran exporters have been successful in this ability.
Tilapia is another seafood where the prices are mostly determined in international markets (Norman-Lopez and Asche, 2008; Norman-Lopez and Bjørndal, 2009). In

Value chain dynamics and the small-scale sector 34
the United States market, Asian producers dominate the frozen tilapia segment, while Latin American producers dominate the fresh tilapia segment. When measured in import value, Honduras is in fact the largest exporter of fresh tilapia to the United States of America, followed by Ecuador and Costa Rica as the main competitors. Total imports of fresh tilapia have stagnated in the United States of America, a trend that has been linked to the global economic recession as fresh tilapia is a more exclusive product and many consumers have shifted towards cheaper frozen tilapia. While import prices of fresh tilapia sourced from different countries tend to follow the same price trend, there are some divergences in the price movements. For example, the price level for Honduran tilapia increased significantly in 2009, while Ecuadorian tilapia remained on a lower price level. The most likely explanation is that Honduran producers have better control in their monoculture production process, which results in a larger fish size and higher-quality meat. With a higher-quality perceived product, important opportunities for product differentiation for tilapia originating from Honduras exists.
While Honduran shrimp and tilapia exports mainly come from aquaculture, spiny lobster is a capture fishery product. This is an exclusive product where domestic buyers are high-end restaurants and hotels. However, the larger market is the export market. As with shrimp and tilapia, most exports are directed to the United States of America. In this market, spiny lobster faces competition both with domestic lobster and with imported lobster from many other countries.
The United States market for lobsters is dominated by two different types of lobster, American lobsters, which are produced domestically and imported from Canada, and spiny lobster (also known as rock lobster), which are widely imported from Latin American and Caribbean countries. Although there are some common long-term price trends, it seems that short-term price variation in Honduran spiny lobster exports are more influenced by Bahamian and Nicaraguan spiny lobster imports, rather than say United States imports of Canadian lobster.
Finally, the last analysis involves United States import prices of snapper from Honduras. Like spiny lobster, snapper faces competition from several other Latin American countries that export snapper to the United States of America. Importantly, the analyses show that United States import prices of snapper from Panama appear to have a bearing on Honduran prices. However, snapper seems to be a much more fragmented market than, for example, shrimp, most likely owing to the diversity of snapper species, quality, product format and size. Moreover, the fact that snapper is a capture fishery product means there is less control with production volume and size of individual fish caught. Thus, the heterogeneity of the imported snapper is an important explanation for some of the price trends. United States import prices of Honduran snapper have been lagging behind the price increases observed for snapper from other countries. This indicates that marketing of Honduran snapper could be improved.
The above discussion has concentrated on the international value chains for Honduran seafood. However, one of the concluding recommendations is to improve the domestic marketing of fish, which has good potential. Currently, poor infrastructure, lack of resources to access export markets, lack of trust between buyer and seller and variable product quality are some of the factors that undermine the potential of the domestic market. Local supermarkets are known to have suboptimal storage of fish, which leads to lower-quality products. In addition, 69 percent of the Honduran population are under the poverty line and thus only a small proportion of the population would have enough economic resources to include high-value fish in their diets. Despite these challenges, there is minimal if any effort to market fish for domestic consumption, which could have significant potential to boost domestic consumption of fish, at least slightly. As of now, fish sold domestically are influenced by export prices, especially for those species that are widely exported. However, the size of the local market is constrained by the factors mentioned above and if supply increased to the domestic

35Central and South America
market, the end result could be that local market prices are depressed compared with export prices. Although this is not evident from the domestic wholesale prices reported here, the question remains as to how representative they are for the average small-scale producer.
For aquaculture, an important growth factor is availability of land and water resources suitable for farming shrimp and tilapia, as well as significant means of credit and skilled labour. Land resource constraints could be solved by intensifying aquaculture production while still ensuring environmental sustainability. For example, Asian shrimp producers have gradually shifted towards more-intensive production systems with success. In contrast, semi-intensive production systems dominate Latin American shrimp aquaculture, as is also the case for Honduran shrimp aquaculture (Valderrama and Engle 2001). Semi-intensive systems have advantages in terms of lower production risk and are believed to produce more tasty meat, which is an important quality for fresh product marketing but may be less advantageous in the long term as the highest yields are not achieved. However, intensifying production systems would require capital and training, both of which would need to be provided by government or institutional support. Currently, few if any banks are willing to provide credit for aquaculture investments as this business sector is perceived as being high risk. For now, the shrimp industry in Honduras is aware of the risks associated with rapid expansion and has chosen a cautious growth strategy (Valderrama and Engle, 2002). This appears to be a wise choice given experience with disease outbreaks and the subsequent need for strong control of the production environment.
The growth of Caribbean and Latin American economies opens up new marketing and value-added opportunities for Honduran seafood products. In this respect, maintaining high quality standards is important. Moreover, tourism is another industry that could support the seafood industry through promoting consumption of Honduran seafood during tourists’ stays as well as through fisheries tourism, which would provide diversified income streams to fishers. This could be particularly helpful in fisheries where growth is constrained by overfishing.
In conclusion, sustainable and efficient use of resources together with more value-added products is critical for the Honduran seafood industry to keep growing and to continue to create new and viable livelihoods. None of this will be possible without access to training and credit for the small-scale sector in order to help it achieve the standards of high-value international markets.
perubackgroundThe objective of this case study is to shed light on price linkages in the value chains for the most important Peruvian seafood products using statistical and econometric analysis. The seafood value chains explored here include the following species: farmed shrimp (Penaeus vannamei), farmed scallops (Argopecten purpuratus), farmed trout (Oncorhynchus mykiss) and wild-caught Peruvian anchovy (Engraulis ringens). These seafood products already contribute to the livelihoods of many small-scale producers. However, if access to international markets could be increased, earnings, food security and quality of life could be improved.
This analysis provides information about the price formation process in international seafood markets where Peruvian exporters already have a significant presence. Access to market data such as prices and transacted volumes in developing countries is often limited, and this is no different for Peru. It is possible to obtain a snapshot of domestic producer, wholesale and retail prices in the country but time series data of these price variables are much more difficult to obtain. Thus, the types of analysis undertaken for the different species depended on data availability.

Value chain dynamics and the small-scale sector 36
resultsShrimpThe majority of shrimp produced by small-scale aquaculture farms in Peru is exported. Only in recent years has the domestic market started to receive an increased quantity of domestic shrimp. The full set of prices available for this data analysis represent three different stages in the value chain of Peruvian farmed shrimp: domestic wholesale prices, export prices (free on board – FOB), and import prices (cost, insurance and freight – CIF). In the United States of America, the two largest categories of imported Peruvian shrimp are “peeled frozen” and “shell-on frozen”, while in the European Union (Member Organization) they are “Penaeus frozen” and “other frozen”, where Penaeus is the type of the warm-water shrimp species farmed in Peru.
In the case of exports, it is known that most shrimp products are frozen, even if product format is not recorded. This can be seen from the import data on Peruvian shrimp from the European Union (Member Organization) and the United States of America. This means that in the available trade statistics, the export product category is more aggregated than the import categories. The product formats of shrimp sold in the domestic wholesale markets are not recorded either. Therefore, product format of those shrimp products are marked as “not defined” and could be both for fresh and frozen shrimp.
International shrimp markets are known to be competitive, with prices close to the marginal cost. However, owing to the cyclical behaviour of these markets, one would also expect periods where the price deviates from the competitive price, giving higher or lower returns than predicted in the competitive model. These cycles can be caused by factors such as productivity growth, disease outbreaks and climatic variation. As most Peruvian production is intended for export markets with only a limited degree of value-added processing, it is assumed that the export price is closely correlated with the farmgate producer price.
Most Peruvian shrimp is exported to either the United States of America or the European Union (Member Organization). As import prices to the European Union (Member Organization) and the United States of America are similar in the long run, it is possible to explore what the difference is between international and national prices for Peruvian shrimp. This question is especially relevant for small-scale shrimp producers who, for various reasons, do not target international markets. The mean CIF export price in the period from January 2008 to December 2010 was USD5.62. In comparison, the estimated mean price for Lima wholesale markets was USD4.88 (with average minimum and maximum wholesale prices of USD3.63 and USD9.45). Thus, the export price is on average 15 percent higher than the estimated mean wholesale price (and about 50 percent higher than the average of the recorded minimum wholesale prices; the maximum prices are less interesting as these will more often represent transactions with smaller volumes).
Generally, the import prices for shrimp in the European Union (Member Organization) and the United States of America reflect the fact that there is an integrated international shrimp market for Peruvian shrimp. This is not surprising as international shrimp markets are known to be competitive with many suppliers, especially from Asian countries. Moreover, the traded shrimp products are increasingly based on white leg shrimp species, which is also the one farmed in Peru. The estimated wholesale prices from Lima, Peru, suggest that on average, shrimp producers obtain higher prices when exporting their products compared with selling them in the domestic market. This also probably reflects the limited size of the domestic market. In conclusion, small-scale shrimp producers could gain higher revenues if they were able to access international value chains.

37Central and South America
Trout In contrast to its farmed shrimp production, only a small share of the Peru’s farmed trout production is destined to export markets. Most farmed trout is consumed domestically and often in the same region where production takes place.
In terms of the price series used for analysing the trout value chain, several gaps were identified in the export and import prices series of trout products, which reflects the fact that there are months when no exports or imports take place.
Exports of Peruvian trout are relatively small compared with the total output. Earlier studies for the German market have shown that the portion-sized trout that Peru exports is not part of the wider salmon and trout market. For most uses, portion-sized trout is probably considered a different product to, say, Atlantic salmon and, consequently, its market penetration relies on price competitiveness. The main export market is the European Union (Member Organization) followed by the United States of America, with the predominant product in each market differing – frozen trout in the European Union (Member Organization), and fresh trout in the United States of America. The prices appear to be weakly related based on the estimated model. Fresh trout appears to be a price leader from the estimated model. However, specification tests identify problems with this model and the results should be interpreted with care.
Exports command considerably higher prices than Lima wholesale prices. Some of this price difference can be explained by higher marketing costs associated with certification schemes that must be recouped and higher product quality, among others. Small-scale producers in Puno, the largest region for trout production and also the region where the largest number of small-scale producers are located, are often restricted to selling fish in local markets where prices are even lower than in Lima owing to transportation costs. These producers could gain considerable revenue if they were able to enter export markets but this would require both additional capital investments and training.
Scallops The largest volumes of scallops are destined for the European Union (Member Organization), where France in particular is an important market. The domestic market has traditionally been the most important, but in 2009 exports accounted for about 50 percent of the total production of scallops for the first time.
In the export and import prices to the market of the European Union (Member Organization), there appears to be little difference between the FOB export price and the import price for “other, frozen/dried/salted”. The import price for “Pecten maximum frozen” shows slightly more volatility. The estimated Lima wholesale price is higher than the trade prices of the European Union (Member Organization). However, there is a large span between minimum and maximum Lima wholesale scallop prices, making it even more difficult to determine a representative wholesale price compared with shrimp and trout. In the case of export and import prices of Peruvian scallops to the United States of America as well as Lima wholesale prices, the export price appears strongly correlated with the import price. Again, the Lima wholesale price appears to be slightly higher than the trade prices.
Peruvian scallop exports have been increasing with the European market as its most important market. This is reflected by the statistical model, which suggests that the European import price is a price leader compared with the United States imports of Peruvian scallops. A caveat specification test for the model showed issues with non-normality and autocorrelation of the errors. By observing the price development in these two export markets, it might seem that price movements have become more integrated as the trade flow of scallops to the United States of America has increased. The increased export of scallops is also an indicator of the increasing number of

Value chain dynamics and the small-scale sector 38
aquaculture producers that have control of the biological production process, and that are able to obtain economies of scale in the production.
The domestic wholesale prices for scallops are characterized by large differences between minimum and maximum prices, as recorded by the Ministry of Production. The reasons for this are unknown; however, differences in quality and size may have an impact. This makes it even more difficult to estimate a representative wholesale price. However, it is likely that the wholesale price that was estimated using the same technique as for shrimp and trout is too high. Instead, using the minimum price as a point of comparison, it can be shown that export prices are higher than domestic prices. Once again, this indicates that there are economic benefits of accessing international markets. However, without information about marketing costs, it is difficult to quantify these benefits, and this is an important area that warrants more research.
Peruvian anchoviesThis analysis differs from the previous three species owing to data availability and the particular market structure of Peruvian anchovy. Peruvian anchovy is predominantly reduced into fishmeal and fish oil, two commodities that are mainly used in animal and fish feeds, and in omega-3 products. Only 1–2 percent of the anchovy catches are used for direct human consumption (DHC), meaning that demand for Peruvian anchovy is mostly derived demand. Derived demand is where the purchases of fishmeal and fish oil depend on the demand for the final consumer products such as farmed salmon and omega-3 food supplements. Reduction of Peruvian anchovy to fishmeal and fish oil is also known as indirect human consumption (IHC).
To a large extent, the small-scale sector is excluded from IHC product markets as Peruvian anchovy caught within the five-mile zone is regulated for DHC use. In practice, however, this regulation is sometimes breached by small-scale fishers. One way to bypass this regulation is to let the quality of the fish deteriorate on board so that the only option is to reduce it to fishmeal and fish oil. Such a practice might seem counterintuitive as, presumably, consumer-grade anchovy should obtain higher prices, yet this is not necessarily the case as strong international demand for fishmeal and fish oil has resulted in record high prices for these commodities. Because of these practices, the market for consumption-grade anchovy caught within the five-mile zone is linked to the markets for fishmeal and fish oil. Moreover, large fishmeal producers that have their own industrial fleet also participate in markets for DHC and thereby buy fish directly from small-scale fishers, creating interactions between these markets.
Peruvian anchovy for DHC is mainly used as tinned products that are either exported or sold domestically. In Peru, these tinned products are sold in supermarkets and smaller grocery shops. Neither domestic retail prices nor export prices of tinned anchovy are available. It is therefore necessary to explore the fishmeal market as a proxy for the market for DHC products of anchovy. Wholesale prices from Lima for 2009 allow prices for DHC products to be compared with IHC products, i.e. fishmeal and fish oil. However, it is not possible to examine how relative prices of DHC and IHC products behave over time because wholesale prices have only been recorded for one year, 2009.
Figure 9 shows export prices of fishmeal from Peru and soybean meal from Brazil to Europe. Historically, these two products belonged to the same market, and a study by Asche, Oglend and Tveteras (2013) suggests they still do, although in a weaker sense than before. The strong demand from aquaculture has led to a doubling of fishmeal prices compared with the average price levels in the 1990s. This has also lifted landing prices of Peruvian anchovy, even more after the introduction of individual vessel quotas in 2009, which shifted bargaining power from fishmeal plants to fishing operators. This is also the reason why catches within the five-mile zone, which are regulated for use as DHC, are sometimes used for fishmeal and fish oil.

39Central and South America
An important difference between the small-scale fishing of scallops and anchovy in Peru is scale. Small-scale fishers of Peruvian anchovy sometimes own several large vessels, making these fishing operators seem more like small industrial companies. The more traditionally thought-of small-scale fisher also exists, making it a diverse group whose gear type cannot be generally classified. Non-compliance with the regulation of fishing within the five-mile zone only for DHC use creates price linkages between DHC and IHC products of anchovy. Owing to a lack of data on DHC products and given to the linkages with IHC, this case study examined price formation at the IHC level.
Despite the risk involved in breaking regulations, small-scale fishers prefer to land anchovy for fishmeal owing to its higher profitability compared with landing anchovy for DHC. Even if the wholesale price for anchovies for DHC appears to be 60 percent higher than the observed landing price for Peruvian anchovy for IHC, this does not mean that the actual landing price for DHC is 60 percent higher than that for IHC. The price gap is probably smaller owing to lower distribution costs of bringing IHC fish to wholesale markets and fewer intermediaries. Moreover, operational costs are lower when fishing for IHC as ice is not required and the storage capabilities can be put to better use. An additional constraint for DHC products is that the market is limited, although growing.
In practice, the five-mile regulation would segment the Peruvian anchovy fisheries sector by scale, with the industrial sector fishing for IHC products and the small-scale sector fishing for DHC products. However, in reality, this regulation is often not followed as more profit can be made when selling anchovies for fishmeal and fish oil use. Small-scale fishers want to obtain the highest price for their catch and, therefore, it is important to consider a more equitable regulation across scales that would promote the economic interests of small-scale fishers as well. It is also essential to consider the vital micronutrients that can be provided by anchovies in local diets and, therefore, incentivize fishers to sell anchovies as a nutritious DHC food source. This is particularly important as anchovies are currently underutilized for DHC and abundantly available locally. Incentives involving higher profitability of catching
FIgUre 9Cost, insurance and freight prices of fishmeal and soybean meal destined for europe,
1995–2013
Source: International Fishmeal and Fish Oil Organisation (2013).

Value chain dynamics and the small-scale sector 40
anchovies for DHC would then need to target lowering distribution costs and perhaps providing infrastructure to be utilized for operational and storage capabilities. As the market for DHC products grows, fishers may become more favourable to the idea of selling for DHC as well.
Conclusions and policy implicationsThe objective of this study was to analyse how small-scale fishers and fish farmers can improve their livelihoods by accessing national and international value chains that bring higher revenues.
The results demonstrate that, generally, higher prices are obtained when exporting products than when selling to the domestic market. Indeed, for the four seafood species examined – Peruvian anchovy, scallop, shrimp and trout – export prices were mostly higher than those obtained at local wholesale markets. The difference was significant; it was common for export prices to be 50 percent more than the domestic wholesale price. However, it is important to note that not only international markets offer higher prices. Domestic markets exist in large cities that pay higher prices for the fish compared with markets located adjacent to the aquaculture production centres or fishing ports in more rural areas. For example, prices of farmed trout in Lima tended to be substantially higher than those in Puno, where most production takes place. Nonetheless, much of the trout production is currently sold locally in Puno and, thus, fish farmers are not able to reap the greatest profit for their product.
Another important finding is that price formation in international seafood markets is competitive. Several studies have documented the competitiveness of the international shrimp market and this case study confirms that conclusion by demonstrating that import prices of Peruvian farmed shrimp to the European Union (Member Organization) and the United States of America follow the same price formation process. Moreover, it shows that the prices of the European Union (Member Organization) and the United States of America are interdependent, which means that arbitrage equalizes prices. In the case of scallops, it appears that the market of the European Union (Member Organization) is a price leader, i.e. its prices influence those in the United States of America and not vice versa. This is natural given the relatively larger size of the scallop market in the European Union (Member Organization). There are two markets for trout, with fresh product going to the United States of America and frozen product heading to the European Union (Member Organization). Proximity allows the export of fresh trout to the United States of America, which commands a price premium over frozen trout. However, the largest export volumes are the frozen trout to the market of the European Union (Member Organization), where Peruvian trout faces strong competition from regional trout producers and it is unlikely that Peruvian trout is a price leader. The only exception where Peruvian seafood producers could substantially affect international prices in their favour is the fishmeal and fish oil markets, as the dominant raw material is Peruvian anchovy. Peru could take advantage of its leadership position by influencing prices in a manner that would maximize its profits. However, to achieve this, producers must act in a coordinated manner and this is unlikely with the current industry structure in which several large firms compete.
As prices are determined internationally, Peruvian seafood producers must be able to sell high-quality products at the international price level or below – in other words, they must be competitive. A clear indicator of the competitiveness of the sector is their ability to export most of their production and their rate of expansion. Many producers in Peru are already competitive in the markets for fishmeal / fish oil and shrimp. However, they appear to be less competitive in trout and scallops. In the case of trout, the international market for portion-sized freshwater trout is small and, in most cases, consumers in Europe and North America prefer salmon or large-sized trout. In Germany, the market for portion-sized trout constitutes a submarket that is
41Central and South America
influenced by the prices of farmed salmon and capture fish to a limited extent (Nielsen et al., 2007). This delimitation implies that the size of the international trout market is limited and can be easily saturated. This could explain why only a small share of Peru’s trout production is currently exported. However, another equally likely reason is that Peru’s trout producers lack the resources in terms of expertise and capital to make them competitive and allow them to access international markets.
While trout farmers in the Andes face somewhat different challenges from scallop farmers and fishers along the coast, small-scale producers face a number of common constraints. First, small-scale fish farmers in Peru usually have limited education, training and infrastructure. The same applies to those engaged in scallop farming and harvesting, which are dominated by small-scale producers. Therefore, the production process is often suboptimal in terms of input usage – especially with respect to the feeding regimes. Moreover, the knowledge of production cost and income is not comprehensive, and requirements to access international value chains not properly understood. Second, most small-scale fish farmers face severe financial constraints and often have difficulties covering day-to-day operational costs such as buying feed. Owing to cash-flow constraints, producers must sometimes sell their fish before it has reached optimal marketable size, leading to a lower price per kilogram. The resulting suboptimal growth of fish also raises farmgate costs. Third, lack of access to cold-chain distribution makes it difficult for producers to bring their fish to market where it could fetch a higher price. Finally, small-scale producers lack the scale, financial means and knowledge to spend time on marketing and product promotion, and only have the time and resources to focus on production.
The authorities in Peru provide training and financial support to fishers and fish farmers. However, public funding is modest and the bureaucracy involved limits the extent of these services. For example, there are credits to aquaculture producers, but in practice these are difficult to access. This is both because of red tape and scarcity of the funds. Aquaculture training available to producers focuses only on production issues and has not resolved the marketing challenges facing producers. Although this public support does contribute to the development of fisheries and aquaculture, there is a need for help from the private sector.
Two business strategies appear potentially viable to overcome the resource limitations facing the small-scale sector. The first strategy involves cooperation with larger companies. This appears quite common in shrimp farming and to some extent in scallop farming. There are also interesting examples from trout farming in relation to collaboration between small and large producers. For example, a few large trout companies provide technical assistance and credit to small trout producers; the small companies in return sell their harvest to the large companies. However, the agreements observed in trout farming in Peru are not usually based on formal contracts, but rather on long-term relationships between a buyer (integrated trout producer) and seller (small-scale trout farmer). These types of long-term collaborations can help the small-scale producer obtain technical support and a higher price. For example, Piscifactories Los Andes, Arcofi and Arapa SAC are three companies that, to different degrees, support trout producers with technical advice, credit and commercialization of their products. That said, this strategy should be interpreted with caution as there have been reports of large producers exploiting their buyer power and thus paying low prices. However, there have also been counter examples where long-term relations between small-scale and large-scale producers provide both parties with economic benefits. In these cases, small-scale producers are able to access higher-paying regional or international markets. More research is needed to determine when this kind of collaboration works well. Facilitated meetings between large-scale and small-scale producers could also help build equitable and win-win relationships.

Value chain dynamics and the small-scale sector 42
The second strategy involves small-scale producers forming a cooperative or association in order to pool their resources. In this case, governmental support in the form of technical training and access to loans and credits would be needed to support the cooperative. Specifically, scallop farming could benefit from forming cooperatives as currently only a few companies operate with sophisticated levels of technology. Cooperatives could help pool resources to share this expensive technology, and training could help improve knowledge of production methods, which would help give producers more control over the biological production process.
This study also highlights the importance of international seafood marketing. Owing to limited resources and other factors, commercialization is a side of the business that tends to be neglected by the small-scale producers and supporting institutions. More emphasis on the potential to expand aquaculture production with little concern for the fish market can lead to a boom-and-bust cycle for the new aquaculture industries. However, the issue of marketing is starting to receive more attention and this project attempts to contribute towards raising awareness of marketing challenges.

43
7. asia
banGLadeShbackgroundThe fisheries resources of Bangladesh are classified as inland open waters, inland closed waters and marine waters. The total fish production of the country was 2 563 296 tonnes in the period 2007–08, out of which 41 percent came from inland open waters, 39 percent from inland closed waters (aquaculture), and 19 percent from marine fisheries. Aquaculture has been growing at a much faster rate than the fisheries of the inland open waters and marine waters.
Fisheries and aquaculture value chains in Bangladesh are generally long and complex, with many intermediaries between producers and final consumers of fish products in the country. Fish production/landing points are scattered all over the country and many of them are distant from the final consumer markets. The four main types of domestic seafood markets are: primary markets located near the source of production; secondary markets located usually in the subdistrict (upazila) headquarters; higher secondary markets located in large cities; and terminal markets.
The Bangladesh case study investigated causal and price transmission relationships between wholesale and retail prices for five fish species: wild-caught hilsa (Tenualosa ilish), farmed rohu (Labeo rohita), farmed catla (Catla catla), farmed pangas (Pangasius hypophthalmus), and farmed tilapia (Oreochromis mossambicus/niloticus). Causal relationships between wholesale and retail prices and asymmetries in price transmission were examined using statistical models.
The wholesale and retail monthly price series for the chosen species were taken from October 2005 through to July 2010 for four broad geographic regions (Dhaka, Chittagong, Khulna and Rajshahi). The series were obtained from the Department of Agricultural Marketing (DAM) in the Ministry of Agriculture and are averages of all markets, both wholesale and retail, within the region. A continuous reliable price series for farmers/fishers could not be found. However, wherever this information was available, most wholesale prices were found to be proportional to farmer/fisher prices. This is because most of the wholesale centres (where DAM collects wholesales price data) are located close to the primary markets or production/landing centres.
Although there could be a number of combinations of wholesale and retail price series among different fish species across different subdivisions, this analysis selected only a few of the possible combinations to study price transmission relationships. The selection was based on the important wholesale markets for a particular species chosen by highest production share and the main retail market for that particular species.
The market pairs chosen for studying price transmission were:• Dhaka wholesale and Dhaka retail (pangas); • Khulna wholesale and Dhaka retail (hilsa and tilapia); • Chittagong wholesale and Dhaka retail (hilsa, catla, pangas, rohu and tilapia);• Rajshahi wholesale and Dhaka retail (catla and pangas);• Khulna wholesale and Khulna retail (hilsa and tilapia);• Chittagong wholesale and Chittagong retail (hilsa, catla, rohu and tilapia);• Rajshahi wholesale and Rajshahi retail (catla and pangas).

Value chain dynamics and the small-scale sector 44
resultsIn general, wholesale and retail prices are found to move in a similar fashion. Based on the statistical results for different fish species, for hilsa, the Khulna wholesale price causes the Dhaka retail price. A causal relationship from retail to wholesale price was found in two price series combinations, although no distinct directions of causality were obtained in the remaining hilsa series combinations. Out of four value chains analysed for catla prices, a causal relationship was found from wholesale to retail (Rajshahi wholesale Granger caused Rajshahi retail) and from retail to wholesale (Chittagong retail caused Chittagong wholesale), but no significant causal relationship was found in the other two combinations. For pangas, a causal relationship was found from retail to wholesale price in three pairs of price series out of the four pairs analysed. There was no distinct causal relationship observed between two levels of the value chain for all pairs considered in rohu fish species. Out of four value chains examined in tilapia, there was a causal relationship from retail price to wholesale price in two pairs, from wholesale to retail in one pair, and no relationship in the remaining one.
In most cases, the direction of causal relationship was from the retail to the wholesale market. This might be due to the fact that retailers are more organized than wholesalers in the fish market of Bangladesh. In such situations, retailers would set the price of the commodity and wholesalers would have to follow the set price. This observation would allow the study of the price transmission relationship to take the wholesale price as the dependent variable in the model involving those particular series. Moreover, following the above argument, the wholesale price was analysed as the dependent variable also in the other series that did not demonstrate any significant Granger causality relationships.
Out of 18 pairs of price series analysed (9 intermarket transmissions and 9 intramarket transmissions), 13 cases revealed long-run price asymmetries and there were only 5 cases with short-term price asymmetries. Given the highly perishable nature of fish products marketed in Bangladesh and also the use of monthly price series for this study, it is plausible that the rising and falling price response elasticities are not significantly different in the short term. However, the results indicate that price asymmetries do persist in the long run.
The characteristics of price asymmetries differ substantially across markets and species. Out of nine inter-regional price transmission cases studied, eight cases indicate asymmetric price transmission (APT) in the long run and four cases in the short run. As expected, price transmission within a region tends to be more symmetric. Out of nine intraregional price transmissions studied, five cases show asymmetric transmission in the long run, and only one case in the short run. Various previous studies, including Capps and Sherwell (2007), have emphasized the spatial dimension of APT.
Although changes in retail prices are drivers of change in wholesale prices of fish products in Bangladesh, the APT behaviour varies among the type of products. For hilsa, a capture fisheries product, elasticities of price transmission from retailer to wholesaler were generally greater from decreases in price than from increases in price. A greater pass-through of price changes at the time of falling prices is unfavourable to hilsa wholesalers. However, the results indicate a different pattern for the aquaculture products studied (catla, pangas, rohu and tilapia). Increases in the retail price of most aquaculture products were passed through to the wholesale level more fully than were decreases in retail prices. This phenomenon indicates relatively more bargaining power of wholesalers of aquaculture products compared with wholesalers of captured fish. In addition, the supply of hilsa is more volatile than that of aquaculture products. In the absence of processing facilities, hilsa fishers and wholesalers are often at the receiving end of market negotiations. However, most of the aquaculture products marketed through inter-regional trade come from commercial farmers, who are more organized and able to adjust their harvest depending on market price. Thus, it is likely that the

45Asia
retailers of aquaculture products are not in a position to easily pass falling prices onto wholesalers and farmers.
Conclusions and policy implicationsThe results of the analysis demonstrate that the direction of causality in prices goes from retail to wholesale in many of the value chains, indicating the influence of retail price on wholesale price in the Bangladesh fish sector and that it is possible to conclude that retailers are the price leaders. This finding further implies that these fish are demand driven. The lack of sufficient numbers of wholesalers capable of influencing the transmission of prices to retailers may be attributed to the absence of large-scale wholesale demand from institutional buyers such as supermarkets, hospitals, orphanages, hotels, restaurants and wholesale buyers/firms for external/export markets. The less organized behaviour of the wholesale market as compared with the retail market could also contribute to retailers being the price leaders. Other factors that may influence this retail price leadership could include dispersed production/landing points, poor transportation, perishability of the product and lack of information about retail markets from the wholesale side.
In general, the price transmission was found to be symmetric in the short run and a mix of symmetric and asymmetric in the long run. This APT behaviour indicates that: (i) changes in retail prices are not reflected fully in wholesale prices; and (ii) transmission differs according to whether retail prices are increasing or decreasing. The APT is more common in inter-regional (i.e. between various regions of the country) markets than in intraregional markets. This finding suggests that price transmission studies should be conducted on a spatial basis, either by city or region in lieu of a national analysis.
The results also demonstrate variation in price transmission behaviour between aquaculture and capture fisheries products. For aquaculture products, elasticities of price transmission from retailer to wholesaler were generally greater from increases in price than from decreases in price. However, for the hilsa products studied, wholesale prices were more sensitive to decreases in retail prices than to increases in retail prices. These results indicate that the retailers of aquaculture products, compared with their fisheries counterparts, are less likely to be in a position to easily pass on falling prices to wholesalers and farmers. With the emergence of commercial aquaculture in the country, there might be a change in the price transmission behaviour in favour of farmers, although more case studies are needed to verify this observation.
The results of the study also have important policy implications. Various studies (Dey et al., 2008a; Dey et al., 2008b; Dey, Alam and Paraguas 2011) have indicated that, given income elasticity of demand for fish, there will be a considerable increase in demand for various types of fish in Bangladesh over time owing to population growth and increases in per capita income. A major share of this increased demand is expected to come from poorer households with increasing income. There is a need for commensurate increases in fish supply to maintain fish price and to protect fish consumers (Dey et al., 2008a).
In recent years, almost all increases in fish production have come from the aquaculture sector. However, increasing fish supply from aquaculture will exert downward pressure on the prices of aquaculture products. The findings of APT of retail prices of aquaculture products indicate that increases in the retail price of aquaculture products are likely to pass through to the primary markets more fully than are decreases in retail prices, and could be beneficial to aquaculture farmers in the country. This also reveals that fish farmers are expected to fully receive the price signals of higher market demands. However, if market prices fall due to the expansion of products, retailers might not be able to easily pass on falling prices to farmers, and hence farmers’ revenue might not fall. Thus, the results of this study imply that the

Value chain dynamics and the small-scale sector 46
market forces in Bangladesh will probably provide enabling environments for the aquaculture sector in the country to expand.
In terms of capture fisheries, growing market demand for fish and constant or declining supply of capture fisheries is likely to increase retail prices of capture fisheries products in Bangladesh. A recent projection (Dey et al., 2008a) shows that the retail price of hilsa is expected to increase by about 5–6 percent annually. The results of this case study show that hilsa fishers in Bangladesh are likely to receive some share of the expected increase in the retail price of hilsa, although the elasticities of price transmission of hilsa from retailer to wholesaler are generally greater from decreases in price than from increases in price. Given the APT of hilsa retail prices to primary markets, it is recommended that hilsa fishers become more organized in order to receive more equally this share of expected increase in price. For this to be achieved, attention must be paid to socio-economic factors that impede such organizational behaviour.
This examination of causality and price transmission relationships is the first such attempt in the aquaculture and fisheries sector of Bangladesh and as such it can be expected to fill a knowledge gap. Future research on the existence of market power and distribution of margins across different levels of the value chain is needed and would provide valuable guidance in understanding and managing seafood markets in Bangladesh.
CambOdIabackgroundThe value chain analysis of five key freshwater fish species included farmed and wild-caught Indonesian snakehead (Channa micropeltes), farmed and wild-caught pangas catfish (Pangasius sp.), wild-caught boeseman croaker (Boesemania microlepis), wild-caught kes (the local name for Phalacronotus apogaon) and wild-caught carp (Henicorhynchus sp.). The analysis was intended to describe the situation of agents participating in the value chain of these fisheries in Cambodia, analyse their marketing channels, analyse their potential APT, and propose recommendations for upgrading their value chains.
The study was conducted based on primary and secondary data. Pursat, Kampong Chhnang and Kandal Provinces as well as the city of Phnom Penh were selected as study, with a total of 80 fish traders sampled (20 from each study area). Fish traders were defined as fish collectors, wholesalers, intermediaries or retailers. These study areas were selected based on overall characteristics of the locations where freshwater fish, mainly the five key freshwater fish species, were actively and most significantly traded. Moreover, interviews were conducted with key informant persons. In addition, focus group discussions were conducted with local authorities as well as with relevant and experienced stakeholders.
Concerning the price data for each species, price series along the value chains were used (i.e. first-hand, wholesale and retail prices). These price data were obtained through interviews and monthly series, from January 2005 to December 2010, with a total sample size of 72 months.
results The results of the study indicate that the five key fish species go through many agents before reaching consumers. Agents include fishers, fish farmers, traders and exporters. In addition, service providers such as fishing equipment producers, transporters and marketing managers are indirectly involved in the chain.
On average, 18.8 tonnes of snakehead, 18.8 tonnes of pangas catfish, 8.8 tonnes of croaker, 12.7 tonnes of kes and 31.3 tonnes of carp were traded by all the sampled fish traders in the four study areas, demonstrating that carp was the most highly traded and croaker the least traded of the five key species, regardless of the year. Therefore,

47Asia
it can be implied that carp was the most preferably consumed, whereas croaker was the least, which may be due to price and availability of these species in the areas. However, although the five fish species studied were the most preferred, the average total quantity traded declined dramatically from 90.4 tonnes in 2005 to 46.6 tonnes in 2010. This was mainly a result of the decrease in wild fish stocks in the rivers/lakes and the limitation of aquaculture techniques in the country.
In the marketing channel of the five fish species analysed, wholesalers play an important role in distributing fish from fishers and fish farmers to markets and consumers. In general, for the five fish species, kes was one of the species obtaining the highest commercial value followed by snakehead, croakers and pangas catfish, while carp obtained the lowest commercial value. The price of the five fish species has increased sharply over the last six years. This has partially been caused by the decline in wild fish stocks in rivers (as a result of illegal fishing and increasing pressure of fish extraction), population growth, and the lack of proper aquaculture techniques to meet fish demand.
Generally, wholesale prices are higher than fisher prices, and retail prices are higher than wholesale prices. However, the margins differ among species and stage of the chains. For the fish other than carp, margins and margin ratios between wholesale prices and retail prices are much higher than those between fisher prices and wholesale prices. In the case of carp, the margins and margin ratios are almost the same in both marketing stages. This may indicate that the profits for retailers that sell pangas catfish, snakehead, kes, and croaker are higher than those for wholesalers and those that sell carp, if the cost of delivering such fish is the same as that of carp. However, because the data on transportation costs are not available, this hypothesis is inconclusive.
In terms of price transmission, no asymmetry was found in pangas catfish and kes, while negative asymmetry was found in snakehead and croaker, and positive asymmetry was found for carp. This implies that wholesalers of snakehead and croaker may have less power than retailers, while wholesalers of carp may have more power than retailers. In addition, the study found positive asymmetry in pangas catfish and croaker, whereas no asymmetry was found in carp. This reveals that retailers of pangas catfish and croaker may enjoy excess profits over consumers, while the retailers of carp may not.
Conclusions and policy implicationsThe study has made the following concluding recommendations to sustain the value chains of the five key fish species in Cambodia:
• Manage wild fish stock and other aquatic resources effectively. Specifically, prohibit and put high pressure on all illegal fishing, overfishing, or any activity that harms the resources in an unsustainable manner. Management cannot be effective without the involvement of local fishers, fish farmers, local authorities and government, NGOs and other functional organizations.
• Augment and adopt appropriate technologies for raising snakehead and pangas catfish (including producing fish broods and feed). In addition, instead of using low-value fish, promote the use of pellet feed for fish feed and offer it to fish farmers at an affordable price. These appropriate technologies and methods would serve to reduce fish mortality, improve the quality of fish and avoid the depletion of low-value fish, which is a highly nutritious food product and as such should be promoted for direct human consumption, especially for the poor. By promoting snakehead and pangas catfish farming, these cultured fish could complement or replace depleting stocks of wild fish while also decreasing the price of fish, allowing better access to a nutritious food source to low-income households.

Value chain dynamics and the small-scale sector 48
• Manage fish trade more effectively by making information on fish prices more clearly and broadly accessible to all chain agents. Price transparency is vital to help agents obtain more equitable benefits and to reduce price fluctuations. Prices could be made more accessible by developing a market information network among stakeholders using mobile or radio commerce.
• Improve quality management of fish by introducing proper conservation technologies mainly when transporting fresh fish, which will reduce fish mortality and weight loss during distribution. Moreover, provide training for appropriate processing techniques to develop and sustain key freshwater fish products and increase the opportunities for these products in both the domestic and export markets.
• Provide more opportunities for the establishment of financial organizations that offer more low-interest loans in order to foster investment and start-up businesses in fish farming.
• Limit or restrict unnecessary and informal fees, which all chain agents usually incur during business transactions.
maLdIveS backgroundThe tuna fishery in Maldives is an export industry with about 70–90 percent of the total harvest exported. There are two major companies, the Maldives Industrial Fisheries Company, a state-owned company, and Horizon Fisheries Ltd., a private firm that specializes in exporting tuna. The total value of exports reached USD74 million in 2010.
Wild-caught skipjack (known locally as kalhubilamas) tuna is the most important species in terms of exports and represents 60–70 percent of the total fish catch in Maldives. It is predominantly caught by live-bait pole and line, with the vast amounts of live bait required caught from lagoons and reefs on various islands. Large-scale, industrial longliners also catch skipjack tuna as a bycatch. The main export markets for skipjack tuna are Thailand (frozen), Germany (canned) and the United Kingdom of Great Britain and Northern Ireland (canned). There is also a significant portion of dried or smoked fish exported to Sri Lanka.
Wild-caught yellowfin tuna (known locally as reedhoo uraha kanneli) constitutes about 17 percent of the total fish harvested, and catches have increased substantially in recent years. Live-bait handlining methods for small-scale fishers account for more than 95 percent of the total yellowfin tuna catch with troll vessels and longliners taking the remainder of the harvest (Ministry of Fisheries and Agriculture, 2009).
With the increase in price and demand for yellowfin tuna in the fresh fish markets in Japan, Europe and the United States of America, there has been a shift from supplying skipjack tuna to focusing more on yellowfin tuna. Small-scale fishers also tend to move seasonally between pole and line fishing for skipjack and handline fishing for yellowfin.
There is concern that the stocks of tuna may be declining, which will ultimately result in a lower tuna harvest. However, the Scientific Committee of the Indian Ocean Tuna Commission suggests that stocks of skipjack do not appear threatened, whereas stocks of yellowfin and bigeye are a concern. It is vital to ensure appropriate resource management practices to achieve sustainable stock levels in the long term.
The purpose of this case study is to carry out a statistical investigation of market prices in the fish value chain for Maldives with particular attention to price setting in the first-hand market for fish. The data represent monthly first-hand and export prices for two canneries for the period from January 2005 to December 2010. The two canneries process almost all of the tuna fish harvest in Maldives.

49Asia
resultsFigure 10 shows both historical trends and comparative effects for first-hand prices received by fishers for two canneries (1, 2) between January 2005 and December 2010 in rufiyaa (MVR), with an estimated exchange rate of MVR 12.8 per USD1 in the period 2007–08. The graph shows that the trends in first-hand prices are similar for both canneries and relatively flat over the period, although there is some increase in real first-hand price near the end of the series. Comparatively, first-hand prices received from cannery 2 appear generally higher over the period and less variable.
It is surprising that there are such sustained differences in first-hand prices across canneries as it could be expected that fishers would sell to the highest bidder. The fact that prices consistently deviate suggest that constraints in the market exist restricting the first-hand sale of fish. One potential explanation could be that cannery 2 is small relative to cannery 1 as cannery 2 seldom purchases more than 2 000 tonnes of fish per month, compared with cannery 1, which purchases as much as 12 000 tonnes of fish a month. Harvest has declined over the six-year period and real income to fishers will decline unless the rise in the real price offsets the fall in harvest.
Figure 11 shows both the historical and comparative trends in the export prices received by the two canneries. In the first few years, the prices received by the canneries are similar, with cannery 1 receiving perhaps slightly higher prices. In the latter months of the data, however, substantially more variation in both series can be observed. However, the price variation appears to be to the up-side, indicating better returns to the canneries.
FIgUre 10real first-hand prices received from first-hand 1 (cannery 1) and first-hand 2 (cannery 2)
Source: Maldives Industrial Fisheries Company; Horizon Fisheries ltd (2010).
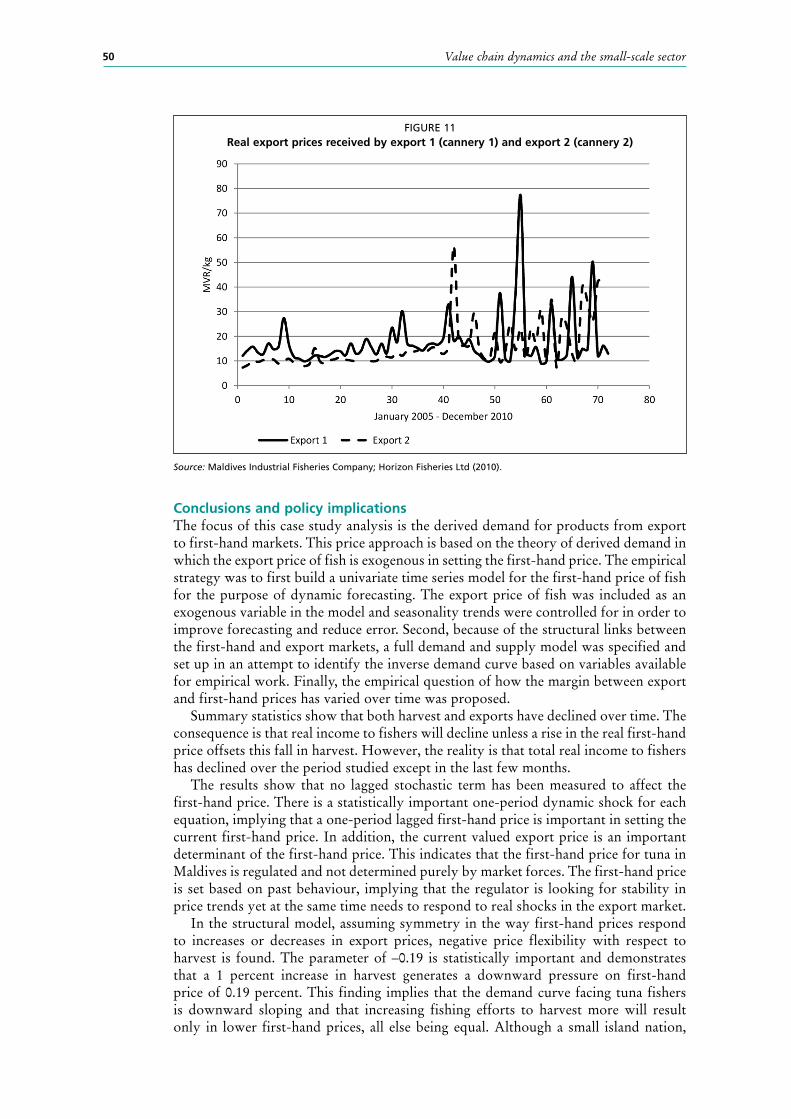
Value chain dynamics and the small-scale sector 50
Conclusions and policy implications The focus of this case study analysis is the derived demand for products from export to first-hand markets. This price approach is based on the theory of derived demand in which the export price of fish is exogenous in setting the first-hand price. The empirical strategy was to first build a univariate time series model for the first-hand price of fish for the purpose of dynamic forecasting. The export price of fish was included as an exogenous variable in the model and seasonality trends were controlled for in order to improve forecasting and reduce error. Second, because of the structural links between the first-hand and export markets, a full demand and supply model was specified and set up in an attempt to identify the inverse demand curve based on variables available for empirical work. Finally, the empirical question of how the margin between export and first-hand prices has varied over time was proposed.
Summary statistics show that both harvest and exports have declined over time. The consequence is that real income to fishers will decline unless a rise in the real first-hand price offsets this fall in harvest. However, the reality is that total real income to fishers has declined over the period studied except in the last few months.
The results show that no lagged stochastic term has been measured to affect the first-hand price. There is a statistically important one-period dynamic shock for each equation, implying that a one-period lagged first-hand price is important in setting the current first-hand price. In addition, the current valued export price is an important determinant of the first-hand price. This indicates that the first-hand price for tuna in Maldives is regulated and not determined purely by market forces. The first-hand price is set based on past behaviour, implying that the regulator is looking for stability in price trends yet at the same time needs to respond to real shocks in the export market.
In the structural model, assuming symmetry in the way first-hand prices respond to increases or decreases in export prices, negative price flexibility with respect to harvest is found. The parameter of –0.19 is statistically important and demonstrates that a 1 percent increase in harvest generates a downward pressure on first-hand price of 0.19 percent. This finding implies that the demand curve facing tuna fishers is downward sloping and that increasing fishing efforts to harvest more will result only in lower first-hand prices, all else being equal. Although a small island nation,
FIgUre 11real export prices received by export 1 (cannery 1) and export 2 (cannery 2)
Source: Maldives Industrial Fisheries Company; Horizon Fisheries ltd (2010).

51Asia
Maldives’ tuna fishery is important in the world market for tuna, and it is found that fishers’ collective behaviour affects first-hand prices. This leads to the recommendation for the formation of cooperatives or collective work to guide prices. The country’s situation is in contrast to other nations, which face a horizontal demand curve for fish, meaning that the collective behaviour of fishers does not affect first-hand prices.
Asymmetry in the export price variable was also investigated. Export price shocks were separated and categorized as either positive or negative and analysed to see if there was an asymmetric response in the first-hand price. Both positive and negative price shocks were found to be important determinants in first-hand price setting. Positive shocks were found to have a measured flexibility of 0.13 percent compared with the negative shock flexibility of 0.15 percent. Thus, the first-hand price of fish was found to be more responsive to negative export price shocks than to positive export price shocks.
With only a very few downstream markets for tuna, price pass-through is stronger for a negative price shock compared with a positive price shock. This is perhaps unsurprising in a market where power rests with the canneries. However, it is surprising that the effect is less significant than expected. A simple test that the positive and negative coefficients are equal can only be rejected at the 0.13 p-value. Consequently, there does appear to be market rigidity in terms of export price shock pass-through, but the degree of monopsony pricing seems limited.
The margin is an interesting variable and shows how much of the rent is captured at the export level relative to the first-hand market. The margin results are as expected, as many players on the harvest-supply side of the market have no impact on the margin. The market control to set the margin is held by the canneries. Moreover, the canneries maintain the margin regardless of positive or negative price shocks at the export level. Finally, and a positive note for fishers, is that the margin has been declining over time, albeit at a decreasing rate.
In terms of efficiency, policy regulators should avoid subsidies. In Maldives, fuel prices are regulated to try and stabilize an important input price to the fishery. Regardless of the merits, subsidies distort the economic incentives facing fishers. For the case at hand, a subsidy that lowers the price of fuel below the market level results in increased fishing effort above the efficient level of harvesting. If fishing effort is defined by the number of fishers, the consequence of the subsidy is to encourage a greater number of fishers than can be maintained efficiently in the fishery. If fishers in Maldives need increased income, it may be best accomplished through direct income transfers or complementary livelihood activities in order to take some pressure off the fishery and sustain its resources for the long term.
Concern for overfishing of tuna stocks is legitimate, with results from this study showing a general decline in harvest levels and export quantities. As a highly migratory fish stock, efforts to sustain tuna stocks near optimal levels will require international cooperation. Such cooperation will take time, and success is currently uncertain. The consequence is that Maldives may face declining tuna stocks for some time. With a measured price flexibility of 0.19 percent, a fall in harvest will generate a first-hand price increase, but the increase will not be sufficient to offset the harvest and revenue decline to fishers. With its small economy, this is a particularly serious problem for the country, as alternative employment from the fishery is limited and it is likely that fishers may experience a decline in their livelihoods and, thus, quality of life.
The structure of the tuna market in Maldives is not unlike other small fishing nations, with many small first-hand suppliers of fish selling to only a few processors. Such a structure gives the buying power to the processors and reduces the resource rent that could go to the fishers. There are two ways to counter this buyer market power. First, the number of processors could be increased, which would increase competition for raw fish and push the first-hand price of fish upwards. Alternatively, a fishers

Value chain dynamics and the small-scale sector 52
cooperative could create a single seller operation where all fish harvested are marketed through a single desk. Single-desk selling could provide an alternative to the buying power of the canneries, and prices could be set in a cooperative manner to benefit both parties.
ThaILandbackgroundThe fisheries and aquaculture sector plays a vital role in the food security and economy of Thailand. In 2009, total fisheries production in the country was 3.78 million tonnes, valued at THB140 000 million (USD4 700 million). The contribution of various subsectors to the total production in terms of quantity included: marine capture (58 percent), inland capture (6 percent), coastal aquaculture (22 percent), and freshwater aquaculture (14 percent). Marine fishery captures are mainly for exports, while the coastal and freshwater aquaculture is used for domestic consumption as well as exports. Vannamei shrimp (Penaeus vannamei) contributes about 60 percent of total coastal aquaculture production.
For finfish, seabass (Lates calcarifer) is the main marine finfish cultured; about 63 percent of all marine finfish farms cultured seabass in 2007. In terms of freshwater aquaculture, tilapia (Oreochromis niloticus) and walking catfish (Clarius sp.) account for 32 percent and 19 percent of total freshwater production, respectively.
Tuna is one of the most valuable seafood commodities from the marine capture sector in Thailand. In 2009, it ranked as the second-highest seafood product in terms of export value (24 percent of total seafood export value) after shrimp (38 percent), when THB224 542 million7 (35 percent of total food export) of seafood were exported. Similarly, tuna is the main seafood imported into Thailand, accounting for about 52 percent of total fish import value (THB35.8 billion in 2009). In fact, Thailand is the world’s leading importer of frozen tuna and exporter of canned tuna.
This case study examines the presence of price transmission asymmetry along the value chain, specifically looking at the price transmission across four main aquaculture species in the Thai fish market. The aquaculture species considered in this analysis are: vannamei shrimp, tilapia, walking catfish and seabass. For wild-caught species, causal relationships were explored between the prices of tuna at two important levels of the value chain (import market of frozen tuna, and export market of canned tuna), with the asymmetry of price transmission relationships also examined.
Different statistical procedures were used to achieve the objectives of the study. For aquaculture species, monthly price data from January 2001 to October 2010 at different levels of the value chain in both small-scale and large-scale fish farms were used. These data were collected by different agencies; data on farmgate price and wholesale-level price of seabass, catfish and tilapia were obtained from Office of Agriculture and Cooperative and Fish Market Organization under the Ministry of Agriculture and Cooperatives in Thailand, while the retail prices were obtained from the Ministry of Commerce. Prices on black tiger shrimp were obtained from a central shrimp wholesale market, Sakot Sarom.
For tuna, monthly time-series data were obtained from FAO GLOBEFISH for prices from January 2005 to May 2010. Two price series were examined, frozen skipjack tuna and canned tuna, both of which came from value chains in Thailand that were not differentiated by scale. The frozen skipjack price averaged USD2.1 per kilogram with a standard deviation of USD0.34, while the canned tuna price averaged USD12.2 per carton8 with a standard deviation of USD4.88.
7 USD1 = THB34.3351 in 2009, THB31.7270 in 2010.8 One carton contained 48 six-ounce-chunks of tuna.

53Asia
resultsResults from the analysis suggest that prices in the Thai aquaculture sector are not determined at one end and then passed down or up along the value chain. That is, pricing patterns in the Thai aquaculture sector are not just cost or demand driven but are influenced by various factors depending on the species. For vannamei shrimp, direction of causality was identified from retail to farm prices and was also found from wholesale to retail prices. For walking catfish, the pricing patterns are both supply and demand driven. In terms of tilapia, the retail market shocks are directly transmitted to farmers, and vice versa. For seabass, wholesale prices adjust to shocks in farm prices; however, shocks in the retail market remain confined to retail.
Walking catfishIn the long term, positive demand shocks in the walking catfish retail market are transmitted at a lower rate than negative shocks to the walking catfish wholesale market. None of the price series data along the value chain and across species (within the same level of the value chain) was found to temporally influence farm and retail prices of walking catfish. The estimated models show very low but positive trends in walking catfish farm and retail prices. Both current farm and retail prices of walking catfish are positively influenced by the previous month’s prices and negatively with the two-month lagged price.
Walking catfish wholesale price series are influenced by its farm and retail prices, and also by vannamei shrimp, seabass and tilapia wholesale prices. Estimates show that walking catfish farm prices do not have any significant influence on its wholesale price, whereas its retail price affects its wholesale price significantly. The walking catfish current month retail price does not affect its current wholesale price, whereas one- and two-month lagged retail price have positive (short-run elasticity = 1.25) and negative (short-run elasticity = –0.97) effects on walking catfish wholesale prices. The two-month lagged vannamei shrimp wholesale price affects the walking catfish current month wholesale price significantly. The current seabass wholesale price has a negative influence while its previous-month price has a positive influence on the walking catfish wholesale price. Only current-month tilapia wholesale prices influence walking catfish wholesale prices significantly. In summary, positive and negative changes in current-month tilapia and seabass wholesale prices lead to a positive change in current-month walking catfish wholesale price. The reverse is true for effects of previous-month wholesale prices of tilapia and seabass on the current-month wholesale price of walking catfish.
Vannamei shrimpThere is an absence of APT in Thai vannamei shrimp markets at the farm, wholesale and retail levels of the value chain. In addition, prices for vannamei shrimp at the farm, wholesale and retail levels are stationary without trend. Walking catfish retail prices, which are trend stationary at levels, temporally influence the vannamei shrimp retail price. At the same level of the value chain, none of the prices for any of the species under study temporally affects vannamei shrimp farm and wholesale prices. The test results demonstrated the absence of APT in the Thai vannamei shrimp market along the value chain. One-month lagged prices of vannamei shrimp have significant influences on its current prices at respective levels of value chain; however, this degree of influence is considerably higher at wholesale and retail levels than at farm level. The vannamei shrimp current wholesale price also affects vannamei shrimp farm price highly; the short-run price transmission elasticity of the vannamei shrimp farm price with respect to its wholesale price is very low (0.30). Current and one-month lagged vannamei shrimp wholesale/retail prices affect current vannamei shrimp retail/wholesale prices significantly.

Value chain dynamics and the small-scale sector 54
SeabassThe seabass farm price temporally influences its wholesale price; the hypothesis of the causality is rejected in other price pairs of seabass along the value chain. The coefficient of current cumulative positive change in seabass retail price is significant; however, the coefficient of current cumulative negative change in retail seabass price is non-significant up to 0.10 levels of significance. The coefficients of lagged (one- and three-month lags) cumulative negative change in retail seabass price are significant as well. This means that if the seabass wholesalers pay higher prices (say, 1 percent) to farmers, they immediately receive higher prices (0.58 percent) from seabass retailers. However, if the wholesalers pay lower prices to the farmers, they do not pass this decrease on to the retailers immediately. Instead, they pass about 20 percent of decreased price to the retailers in the second month and about 26 percent in the third month. Less than 50 percent of the decrease and 70 percent of the increase in wholesalers’ purchase price is passed on to the retailers in the long run. Results indicate a presence of short-run as well as long-run APT between seabass prices in Thailand. Seabass production is mainly based on cage culture, which requires very high investments. Finally, seabass farmers are well organized, and retailers have very low, if any, control over prices.
One-month lagged seabass retail and farm prices influence respective prices. The one-month lagged farm price of walking catfish affects the seabass farm price. The seabass current farm price is the only factor that affects the seabass wholesale price significantly. The three-month lagged walking catfish retail price has a significant influence on the seabass retail price.
TilapiaTilapia wholesale and retail prices are temporally influenced by tilapia farm prices, and similarly, wholesale and farm prices temporally affect its retail price. The results of the APT model show that a six-month lagged cumulative positive change in wholesale price and a five-month lagged cumulative change in retail price affect tilapia farm prices significantly; however, there is no evidence of APT in tilapia markets along the value chain in Thailand.
The estimates of the price transmission model for tilapia retail prices show that the walking catfish retail price influences the tilapia retail price significantly (price transmission elasticity in current month = 0.32, and long-run price transmission elasticity = –0.06). Recent historical prices affect tilapia prices at all levels of the value chain.
Tuna Canned tuna prices temporally influence skipjack tuna prices, but not vice versa. Hence, the causality was unidirectional. Results show that a 1 percent increase in the canned tuna price causes about the same percentage increase in the skipjack prices. This indicates that there is a unitary elastic relationship between these two prices.
Conclusions and policy implicationsThis case study examined the presence of price transmission asymmetry along the value chain and price transmission across species in the Thai aquaculture market. The analysis found unidirectional causation in some cases and bidirectional causation in other cases. However, in some cases, the price at one level of the value chain is temporally influenced by the prices at other levels of the value chain. Therefore, the Houck and Ward APT model was used to consider two regressors, which allowed the researchers to test the hypotheses “whether degree of positive/negative changes in two regressors on the changes in the dependent variable are significantly different from each other or

55Asia
not in the short and long run.” Price transmission relationships were estimated using regressors along the value chain and across species at the same level of the value chain.
There is no evidence of short-run APT from either retail or farm level to wholesale level. There is weak evidence of long-run APT from retail to wholesale price. In addition, there was no evidence of APT in the Thai fish market for vannamei shrimp and tilapia in the short or long run. Short- and long-run price transmission asymmetry was evident in the Thai seabass market, implying that wholesalers do exercise some market power.
In most cases, none of the species considered affect the prices of other species at the same level of the value chain significantly. The exceptions to this are: (i) the walking catfish price affects the tilapia price at retail level in the short as well as long run; (ii) the three-month lagged walking catfish retail price affects the current retail price for seabass; (iii) the one-month lagged walking catfish farm price influences the seabass farm price; and (iv) the vannamei shrimp two-month lagged price, current tilapia price and current and one-month lagged seabass price significantly affect walking catfish prices at the wholesale level. In all these cases, the price transmission elasticities are positive except for the long-run elasticity in case (i) mentioned above (where it is negative but close to zero), and the current-month seabass wholesale price in case (iv) where it is –1.11. These results indicate a lack of competition among different species in the Thai seafood market although walking catfish faces some competition from tilapia in the short run at the wholesale level.
Price transmission relationships along the value chain show that walking catfish retail prices (one-month and two-month lagged) significantly influence its wholesale price in the short run. Vannamei shrimp retail and wholesale prices affect each other in the short run as well as in the long run. Vannamei shrimp’s current wholesale price also influences its current farm price. The seabass current farm price affects its wholesale price. None of the prices along the tilapia value chain affect one another significantly.
The trends and relationships among prices of tuna in Thailand have also been explored in this study. Imported frozen skipjack prices were found to fluctuate relatively less over time when compared with canned tuna prices. Nevertheless, prices in these two series are found to move in a similar fashion. Skipjack tuna showed seasonality in prices, and these were lower from February to July.
A unidirectional Granger causality was observed, where the canned tuna price was found to influence the skipjack tuna price. Moreover, the two price series were cointegrated, depicting a long-run equilibrium relationship. In addition, the price transmission in the tuna value chain of Thailand was found to be symmetric. Thus, the response of the skipjack price to an increase in the price of canned tuna was identical to that of a price decrease.
The results of the study have important policy implications. Various studies (for example, Dey et al., 2008a) indicate that, given income elasticity of demand for fish, there will be considerable increase in demand for various types of fish in Thailand over time owing to population growth and increases in per capita income. Another study by Dey et al. (2008b) also indicates that fish exports from Thailand are expected to rise, particularly for tilapia, cultured shrimp, and high-value marine fish like seabass. It is projected that consumer prices of the various species studied will rise faster than the posited inflation rate of 3.5 percent in the period 2005–2020, except for tilapia (with a yearly rise of 2.6 percent). The findings of no APT in retail prices of aquaculture products indicate that increases in the retail prices of aquaculture products are likely to be passed on in full to the primary markets, and will be beneficial to aquaculture farmers in the country. On the other hand, almost all increases in fish production in recent years have come from the aquaculture sector, and increasing fish supply from aquaculture will exert downward pressure on the prices of aquaculture products. If market prices fall owing to the expansion of products, retailers might also be able

Value chain dynamics and the small-scale sector 56
to easily pass falling prices onto farmers, and hence the farmers’ revenue might fall. Thus, there is a need to monitor the likely effect of aquaculture expansion on farm prices. Aquaculture products should have a favourable market outlook to ensure the economic viability of the farm enterprises concerned.
Aquaculture harvests are seasonal in nature. As in other developing countries, many fish farmers in Thailand are often forced to sell their products during the harvesting season as they have no means of storage. This means that if retail and/or wholesale prices drop owing to some market phenomenon, farmers have to sell their products at that low price. This signifies the importance and need for better storage facilities and transport infrastructure in rural markets. Policies that encourage small-scale farmers to form collective arrangements for marketing could also be helpful.
In terms of tuna, any policy that affects one level of the tuna value chain in Thailand will affect the other level. However, any shock in the system would be adjusted for quickly and the long-term equilibrium maintained. An ongoing fish supply–demand projection analysis (being implemented by the International Food Policy Institute, World Bank, University of Arkansas at Pine Bluff, and FAO) indicates that the retail price of tuna is expected to increase in the next 20 years or so (up to 2030). This estimate and the finding of symmetric price transmission between frozen skipjack tuna and canned tuna in Thailand has a positive implication for tuna fishers in the region. Moreover, the results of the analysis reveal that tuna canneries in Thailand do not have market power in the buyer market; increases in export price of canned tuna are expected to be passed on in full to the import market for frozen skipjack tuna. Given that the volume of frozen imports of tuna is about eight times higher than that of the domestic catch in Thailand, the welfare of tuna fishers in Thailand is expected to improve with an increase in the price of tuna in the global market.

57
8. developed countries
CanadabackgroundThe fisheries and aquaculture sector provides a crucial source of income security in Canada, allowing for an expenditure level and lifestyle consistent with other middle-class Canadians, and generating employment in coastal areas where there are limited opportunities. However, despite the fact that fisheries and aquaculture is a significant source of livelihoods, income levels in the sector are relatively low and, perhaps more alarmingly, are declining.
The purpose of this case study is to investigate empirically the price links in the fish value chain in Canada for seven fish and shellfish species – dogfish (Squalus acanthias), halibut (Hippoglossus stenolepis), herring (Clupeaharengus pallasi), sablefish (Anoplopoma fimbria), sole (Lepidopsetta bilineata), salmon (Oncorhynchus) and lobster (Homarus americanus) – and to provide some recommendations for sustaining livelihoods in the sector. Only the inshore lobster fishery can be considered small-scale in the sense of individual fishers using traditional fishing methods (traps) to work the fishery. All other fisheries are medium to large scale in terms of both modern technology and size of vessel.
For the vast majority of fish harvested in Canada, the fish value chain is defined by three markets: the first-hand market (which sets the fish price for the fishers); the processor market (which sets the processed fish price); and the export market (which sets the end-market price for fish). The export price of fish is set by world supply and demand conditions and is exogenous with respect to price determination in a Canadian setting. On the other hand, the first-hand market price and processed price are endogenous to the fish value chain or, in other words, are determined within the Canadian market setting.
The price of fish is an important factor in the income determination, employment and overall welfare of fishers. Income levels of fishers are also determined by the level of harvest and cost of harvesting within a season. Although to some extent, fishers have some control over their level of harvest and its cost, the price of fish is set by external factors outside the control of fishers. These external factors are dictated by demand and supply forces but may also be influenced by monopoly and strategic pricing behaviour in downstream markets. Strategic pricing can affect the magnitude of price pass-through between the market segments and the length of time to adjust to price shocks. Consequently, it is important to enquire as to the price relationship and links among the first-hand, processing and export markets for fish in Canada.
For the species defined above, weekly first-hand harvest and total value were collected. Harvest is measured in kilograms, and value is measured in Canadian dollars. Export data are available monthly, cover all the species defined above and include all forms of export from fresh, live, frozen, roe and other forms of processed fish. In the 14-year period (1996–2009), the price at the first-hand level refers to a standard commodity (fresh fish), whereas the export price refers to a processed product that has undoubtedly changed over the period of study.
resultsTable 8 shows average real monthly revenue by year for the seven species examined in this report in Canadian dollars (CAD), with an estimated exchange rate of

Value chain dynamics and the small-scale sector 58
CAD1.04–1.14 per USD1 for 2008–09. The table shows some yearly variation in revenue and, with the exception of lobster, all species show serious decline over the 14 years of data.
To statistically measure the importance of seasonality and trend, simple robust (corrected for heteroscedasticity) regressions of each real first-hand price were run on monthly dummies and a trend variable. The results are shown in Table 9.
Based on the information in Table 9, seasonality plays a minimal role in both dogfish and sablefish prices; although a slight negative trend in dogfish prices does exist. On the other hand, halibut, salmon and lobster are seriously affected by seasonality, with significant monthly price changes occurring. Herring and sole show moderate price changes over the season. In terms of price trends, herring, sablefish, sole and dogfish (in order of statistical magnitude) show statistically significant negative price series. This can be contrasted with a very positive trend in lobster prices and, although less, a still positive trend in salmon prices. The only species with no trend in price series is halibut.
The following subsections present the results of the probability structure of prices in the fish value chain. Here the stability of the characteristics of the probability structure was tested and measured. This provides important information for both univariate and multivariate modelling.
Table 8real monthly average revenue by species and year
year dogfish halibut herring Sablefish Sole Salmon Lobster
(Cad thousands)
1996 233 3 190 9 460 2 590 480 9 500 27 100
1997 115 3 760 4 460 3 220 437 10 200 32 200
1998 128 2 900 3 770 2 610 410 5 010 35 500
1999 187 3 650 2 760 3 170 586 2 440 43 800
2000 320 3 560 5 650 3 010 580 4 640 41 500
2001 236 3 280 4 340 2 630 497 3 150 47 600
2002 232 3 510 4 230 2 160 724 4 770 46 700
2003 145 3 970 3 930 1 880 553 3 980 46 300
2004 183 4 620 2 960 1 760 511 4 270 39 700
2005 227 3 790 2 560 2 400 455 2 740 47 200
2006 112 4 200 1 490 2 520 477 4 700 42 700
2007 203 2 630 1 670 1 760 397 2 360 39 100
2008 101 2 030 1 220 1 470 365 1 540 38 600
2009 189 1 650 1 220 1 190 373 1 630 31 800
Source: Prince edward Island Department of Fisheries, aquaculture and rural Development (2009).
Table 9regression results for seasonality and time trend by species
dogfish halibut herring Sablefish Sole Salmon Lobster
Dm1 –0.019 –0.033 0.096 0.024 0.099* 0.117 0.123*
Dm2 –0.042 –0.011 0.248 –0.011 0.062 0.137 0.245*
Dm3 –0.081 0.225* 0.016 –0.021 0.009 0.182 0.335*
Dm4 –0.011 0.223* 1.716* 0.013 –0.041 –0.091 0.184*
Dm5 –0.036 0.220* 1.945* 0.010 –0.064 –0.273* –0.061
Dm6 –0.005 0.215* 1.730 0.021 –0.083* –0.430* –0.053
Dm7 0.029 0.215* 0.380 0.018 –0.046 –1.226* 0.101
Dm8 0.013 0.220* 0.327 0.001 –0.040 –1.405* –0.251*
Dm9 0.029 0.227* 0.388 0.032 –0.064 –1.348* –0.214*
Dm10 0.023 0.227* 0.610 0.049 –0.072 –1.912* –0.018
Dm11 0.047 0.218* –0.425 0.044 –0.085* –1.858* –0.064
Dm12 0.029 1.725* 3.490* 2.695* 0.329* 1.342* –0.002*
Trend –0.002* 0.001 –0.012* –0.003* –0.001* 0.002* 2.961*
* Statistically significant at less than 5% level.Source: ©FaO (2011).

59Developed countries
Processing pricesThe results of the real processing price of finfish, groundfish and salmon from January 1995 to March 2010 indicate that all three species show a negative trend in prices over the period although there appears to be little variation in prices from month to month. From the data, it is also possible to include that price indices for processed prices are stationary in first differences, whereas the marketing cost index and retail demand compiled by Gordon (2010) are stationary in level form.
Export pricesThere are significant differences between species in prices per kilogram. For example, dogfish on average was found to receive CAD3.35 per kilogram compared with frozen lobster at CAD26.47 per kilogram. Within a species, there is also variation. Most significantly, herring export prices show massive variation with a critical value of over 80. On the other hand, halibut and lobster (live) have relatively small variations, with critical values of 15.3 and 14.12, respectively.
All prices except for sablefish demonstrated trend stationary (with three lags), which shows that usually prices can be found with first price difference stationary, but it can be suspected that the trend in the price series dominates and the analysis measures stochastic variation around the trend. For practical purposes, this means that modelling with export prices must be carried out in level form.
First-hand pricesAs with the export prices, the summary statistics for real first-hand prices of the seven fish species indicated a wide variation in mean price, with dogfish selling on average for CAD0.58 per kilogram and lobster for CAD12.60 per kilogram. Similar to the export prices, results demonstrated stationarity in level prices for herring, sablefish, sole, salmon and lobster. Dogfish and halibut show first difference stationary and follow a different stochastic trend relative to corresponding export values.
A combination of autoregressive integrated moving average (ARIMA) and structural modelling was used in this empirical work. ARIMA models are developed for all first-hand prices and provide reasonable short-term price forecasts. For the species examined, summary statistics show that real revenue and first-hand prices have declined in the last ten years, with the only exception being for lobster. Structural modelling for sole and lobster allows calculations of price and quantity elasticities and should be useful in policy analysis.
Conclusions and policy implicationsThe purpose of this case study was to empirically investigate price links in the Canadian fish value chain, with seven fish and shellfish species used in analysis. Three techniques were used to challenge the data. First, standard statistical summary tables showing seasonality, trend and time series properties were used to characterize the data. Second, univariate ARIMA was used for short-run dynamic forecasting for all first-hand prices. Third, a multivariate structural approach was used to define the inverse demand curve for sole and lobster.
The summary statistics show a negative trend in all first-hand prices except salmon. This negative trend continues through to the revenue data for all species except lobster. This trend is not a good sign of the economic health for Canada’s fishery. With revenue falling in most fish value chain sectors, real profits must be falling unless the number of vessels is reduced or the cost of effort is declining.
The dynamic ARIMA models do a reasonable job of forecasting the short-run value of the first-hand price. Although there is no indication of rising first-hand prices in the near future, these models do allow policy-makers to put reasonable bounds on the likely negative trend in prices. The structural models have provided good elasticity

Value chain dynamics and the small-scale sector 60
estimates of harvest, substitute, marketing costs, retail demand variables and export prices.
In terms of policy issues for the Canadian fishery, one important consideration to promote environmental and economic sustainability is for an appropriate TAC to be set for each fishery. Canadian policy-makers have an inconsistent history of implementing the TAC correctly. However, lessons have been learned and there now appears to be evidence of serious efforts to set proper and sustainable TACs. The seven fisheries examined in this case study are all currently managed by a TAC based on sustainability and a precautionary management approach.
Management of the fisheries examined here takes a number of forms. From an economic position of efficiency and effective cost of management, market allocated individual transferable quotas (ITQs) are preferred. However, it is important to be cautious when implementing ITQs as all stakeholders including fishers, government, NGOs and others must be brought into the process to ensure buy-in and long-term sustainability of the management plan. It should also be noted that the most important part for an ITQ programme to be successful is transferability and marketability of the quota.
Of the seven fisheries sectors examined in this case study, four are managed by ITQs: dogfish, halibut, sablefish and sole. Herring, salmon and lobster are managed by limited entry or effort controls. Canada might consider moving some of these fisheries towards ITQ management, as there may be some benefits to both herring and salmon from instituting an ITQ programme. However, in the case of lobster, the current management scheme is successful in both sustainability and profitability of the fishery and there is little incentive to alter the current management programme.
It should be noted that both salmon and halibut are shared stocks that are jointly managed by both Canadian and United States regulation.
For small-scale Canadian fishers, the future does not seem bright, although there are innovative strategies that some fishers in Canada are already pursuing successfully and should be considered. In general, average fishers’ incomes are low and likely to stay that way as the prices for the species examined here show declining trends, with only lobster showing increased revenue over the period of study. Fishing incomes are generally set by a share system of vessel profits earned but, nevertheless, must reflect the cost of labour. As catch prices do not cover the cost of labour, fishers will increasingly leave their lives on the water. With four of the six finfish fisheries managed by ITQs, there is little opportunity for productivity gains resulting in increased fishing income. However, with a move to ITQ regulation, the herring and salmon fisheries have the potential for improved productivity that may be reflected in the returns to labour. That said, a cautionary approach when instituting ITQs should be taken as it is vital to gain consensus from key stakeholders and to develop an effective implementation plan. It is vital to seek out other opportunities for strengthening fishers’ livelihoods and to develop new and alternative approaches in terms of sales, marketing and organization. Possibilities include: direct sales, in which fishers sell directly to the consumer, thus capturing the most value for their catch; marketing strategies such as labelling to promote quality, origin and freshness; and cooperatives, which can promote sharing of costs and resources, help ensure environmental conservation and enable an exchange of best practices.
ICeLandbackgroundThe fishery sector’s development in Iceland has been moving in two main directions. The first is with relatively large-scale vertically integrated firms that practice harvesting, high-tech processing and marketing. The second is with small-scale independent firms that cover only one link in the value chain, either in harvesting, low-tech processing or

61Developed countries
marketing. In Iceland, both large-scale and small-scale companies have had the freedom to position themselves in different strategic positions in the value chain with neither position proving better. Companies thus have the flexibility to select their position and strategy but must be adaptive to whichever position they choose.
A consolidation of fishing companies has occurred in recent years. As an integral part of this consolidation, a large-scale concentration of quota holdings has taken place. In 2007, the 50 largest quota owners had 82 percent of the total quota in all species, compared with 60 percent in 1995. The quota concentration is most pronounced in the classes of the 5 and 10 largest quota owners. The 5 largest had 34 percent of the quota in 2007, compared with 17 percent in 1995. The same development of concentration can be seen among the 10 largest as they had 51 percent of the quota in 2007 but only 26 percent in 1995 (Knútsson, Klemenson and Gestsson, 2008). These consolidation and rationalization measures have resulted in eliminating the largest part of the overcapacity of the fleet although it is to be assumed that overcapacity still prevails in the fleet of small vessels.
The large-scale consolidation of the fisheries companies in the last 8–10 years is probably the most important effect of the changes in the macroenvironment of the fisheries sector. The implementation of the ITQ system contributed significantly and facilitated this consolidation. Of the 20 publicly listed fisheries companies (all but 3 were vertically integrated companies) in 1999, only 9 have survived. The rest have merged with other companies (Einarsson, 2003).
The role and power of the producers’ organizations dwindled gradually in the late 1990s owing to the abolishment of export licensing and the establishment of new large fisheries companies. To counter these changes, the producers’ organizations became limited liability companies. Gradually, after 2000, the large integrated fisheries companies took over most of their exporting and marketing activities, and so did a number of seafood producing companies of frozen and chilled products (Knútsson and Gestsson, 2006). In recent years, a three-tier structure has characterized the exporting and marketing activities in Iceland:
1. two large exporting and marketing companies, Icelandic and Iceland Seafood International, holding a market share of 35–40 percent in frozen and salted products;
2. the fish processing companies’ own marketing divisions;3. independent marketing companies, often in close ties or affiliated with fish
processing plants. This three-tier structure of marketing and exporting activities is an open and flexible
system, which allows ample space to find the most profitable market options. In this case study, a comparative study of Atlantic cod (Gadus morhua), haddock
(Melanogrammus aeglefinus), red fish (Sebastes marinus), Greenland halibut (Reinhardtius hippoglossoides) and herring (Clupea harengus) is presented (Valtýsson, 2013). In Icelandic waters, cod and haddock make up more than half the total value of catches. The Icelandic fishery industry also depends heavily on exports, which have been controlled historically through limited export licences. Until 1994, three cooperative sales and marketing organizations controlled all exports of fish products from the countries. The industry is also characterized by a high degree of vertically integrated companies in terms of both fishing and processing. Generally, these are small and medium-sized companies with 10–300 employees, but there is one company that employs more than 500 people. In addition, there are two large international marketing companies with secondary processing abroad. The largest Icelandic fishing company has operations in at least five countries outside Iceland and 70 percent of its total revenue comes from abroad. There are also a few traditional, small-scale fishing companies with operations in countries outside Iceland.

Value chain dynamics and the small-scale sector 62
Figure 12 shows the net profit in fishing and fish processing of demersal species for the period 1993–2011. The figures for both fishing and processing of demersal species decreased until 1997; after which point the net profit of fishing increased while the net profit of the processing demersal species fluctuated until 2000.
In many aspects, 2000 seemed to be the turning point for the industry. Companies began to make a profit, and publicly traded companies began to de-list, increased their access to capital through the credit market, and heavily invested in production equipment and vessels.
FIgUre 12percentage net profit in fishing and fish processing, using annuity approach
(imputed cost of capital) and 6 percent rate of return
Source: Statistics Iceland (2011).
resultsThe results in this section were obtained from a dataset that consisted of average first-sale prices and export prices of five species (Atlantic cod, haddock, red fish, Greenland halibut and herring) for the period 1999–2010. It is important to note that the first-sale price used in the calculations was based on the annual total value of landed catch according to Statistics of Iceland. Hence, the first-sale price is the weighted average price from all landings in Iceland regardless of whether it is from the fish market or from direct sales. From the beginning of the fish markets in Iceland in 1987, there has been a significant price difference between the fish market prices and the prices of fish in direct sales (internal sales). This should not come as a surprise as the price formation is fundamentally different between these two allocations. The direct sales price is basically an internal pricing, regulated by the semi-official Bureau of Ex-vessel Fish Prices, where the set-price is changed according to changes in the market price, sometimes with a considerable delay. This price is not used in any transactions other than calculating the vessel crews’ wages (based on a share system). It is possible to assume that other important cost factors are not included in this price setting, such as direct or indirect costs of quota (leasing or buying). Other cost factors such as handling, grading, logistics and additional services are included in the fish market price but not in the direct sales price. Buyers on the fish markets are probably ready to pay a higher price for fish in the right quantity and quality according to their most stringent demands. To what extent these differences can explain the price difference is difficult

63Developed countries
On the grounds of economic theory, it can be argued that auctioning as a method of exchange affects the relative power of the buyers and sellers. The number of buyers is much greater than in other mechanisms of exchange, therefore tilting the price setting in favour of the sellers. Indeed, the auction price generally tends to be higher than a contractual price or the internal price used by the Bureau of Ex-Vessel Fish Prices.
FIgUre 13fish market price and direct sales price (inflation adjusted)
Source: Statistics Iceland (2012).
FIgUre 14Cod and oil prices (inflation adjusted)
Sources: McMahon (2013); Statistics Iceland (2012).
to say, but in general, it is evident that it is not straightforward to compare these prices as they are decided in a fundamentally different way.

Value chain dynamics and the small-scale sector 64
The first-sale price of catches is very sensitive to fuel prices, and most changes in prices in the period 1992–2012 can be linked to changes in the price of fuel. Figure 14 shows the first-sale price of cod and the average world market price of oil during this time period. Both sets of data have been adjusted for inflation, and one can see how the average price of cod increased gradually until 2006 and then declined sharply from 2008 to 2009. This trend is also somewhat traceable for the other species except for herring.
CodThe average first-sale and export prices of cod from 1999 to 2012 are presented in Figure 15. Both prices decreased from 1999 to 2001, after which the average price of the first-sale was constant until 2005, while the average price of exported cod increased slowly until 2006. In 2007, the highest average first-sale and export prices were registered but both decreased significantly after this point. However, in 2010 both prices seem to have increased. This trend can be explained by changes in the price of oil.
FIgUre 15average first-sale and export prices of cod (inflation adjusted)
Source: Statistics Iceland (2012).
HaddockHaddock is one of the most important fish species in Iceland. Figure 16 presents the average first-sale and average export prices of this fish from 1999 to 2012. The haddock stock size increased sharply in the period 2000–05, resulting in increased harvests in 2002–07. Therefore, it is interesting to see that the price increased in the same period. That trend can be explained by the decrease in the cod harvest in the North Atlantic. The price also seems to be sensitive to changes in oil prices.

65Developed countries
RedfishFigure 17 presents the average first-sale and export prices of redfish from 1999 to 2012. Between 1999 and 2006, the average price of first-sale did not fluctuate much. As with cod and haddock, the first-sale price reached its highest level around 2007 and decreased afterwards. Also similarly, the average price of first-sale seemed to increase in 2010.
When compared with the average export price of cod and haddock, the average export price of redfish is low. Prices did not fluctuate much until 2004, when the export prices reached their highest levels. Then, the export price decreased until 2008 before beginning to increase slightly.
FIgUre 16average first-sale and export prices of haddock (inflation adjusted)
Source: Statistics Iceland (2012).
FIgUre 17average first-sale and export prices of redfish (inflation adjusted)
Source: Statistics Iceland (2012).

Value chain dynamics and the small-scale sector 66
Greenland halibutFigure 18 indicates the average first-sale and export price of Greenland halibut from 1999 to 2012, in which the average price of exported Greenland halibut reached its highest level around 2011. The average price of first-sale reached its highest point in 2004 and 2011. Like many of the other species analysed, both prices seemed to increase after 2010.
FIgUre 18average first-sale and export prices of Greenland halibut (inflation adjusted)
Source: Statistics Iceland (2012).
HerringFigure 19 presents the average first-sale and export prices of herring in the period 1999–2012. The average export and first-sale prices reached a high level in 2005 and then decreased until 2009. This trend is a bit different from the other fish species because there was a significant increase in the catch that was sold for human consumption in the period 2000–05, and it took the market a while to adjust to this increased input into the market. It is interesting to see how stable the price linkages are.
Conclusions and policy implicationsOne of the main conclusions of Knútsson’s (2001) research was that conflict of interest in value creation in the value chain caused a lack of trust among agents in the value chain. This became more evident and critical with the companies becoming larger owing to the later consolidation and rising demand for further value creation. However, after the demise of three sales organizations in the late 1990s, a temporary trend towards spot market sales of products emerged. In recent years, this has changed so that today spot market sales are avoided when possible. Instead, cooperation and coordination is flourishing with an emphasis on trust and long-term relationships. Direct contacts between producers and retailers in the global value chain seem to have created additional value.
Two key success factors for an efficient/effective market-driven value chain can be pointed out. First, coordination of harvesting, production and marketing of a vertically integrated company results from a pull from its international buyer. In evaluating the quota system, it is necessary to look at the high degree of vertical integration that

67Developed countries
has taken place between the processing and the fishing sectors. Without this vertical integration between these two sectors, it can be suggested that the quota system, especially given the fact that the quota is bound to the fishing vessels, could seriously affect the balance of power in the industry. It can be claimed that the high degree of vertical integration has minimized this negative effect of the quota system and is one of the prime reasons for the success of the quota system in Iceland (Knútsson, 2001).
FIgUre 19average first-sale and export prices of herring (inflation adjusted)
Source: Statistics Iceland (2012).
Knútsson (2001) concludes that a major role of the central firm is to create an environment that is value creating for the participants’ companies. The precondition for value creation is to avoid conflict of interests among agents in the value chain and to establish the uninterrupted transfer of information and knowledge between agents and levels in the value chain. Direct communication supports both better marketing knowledge by the producers and better knowledge and understanding by the marketing sector on the needs and aims of the producers. This is supported by the literature about learning and the importance of knowledge transfer in networks (Badaracco, 1991).
Second, the possibility of specialization and stability is maintained through the operation of fish markets (Knútsson, Klemenson and Gestsson, 2008). Value adding is derived through the specialization in fish species that can easily and steadily be sourced from fish markets and from custom-making products to the retailers’ stringent wishes. The main value-added activities seem to be precipitated in the policy to meet the customers’ wishes and facilitated by the robust technical development in the Icelandic fish industry. Efficiency in the chain is gained through direct ties between producers, foreign wholesalers and secondary processors or retailers with bilateral or trilateral connections and by simplifying or cutting out expendables or links in the value chain. The key success factors are reliability in quality and delivery, stability and efficiency. This means that companies are able to produce the right-quality raw material through high-tech processing with a high material yield, delivering top-quality products that fully meet buyers’ wishes to the right markets.
In the seafood business today, specialization and diversification are the key factors in successful product management and in a sound strategy of product development.

Value chain dynamics and the small-scale sector 68
To make product management effective, the consumers’ requirements must be communicated through the value chain, from the end user to the producer and to the fishers. The communicative relationship upstream and downstream in the value chain is therefore imperative if high value-adding is to be realized.
japan
backgroundJapanese seafood products are traditionally distributed through three markets: producer markets at landing ports for wild-capture fish; wholesale markets (such as the famous Tsukiji Market in Tokyo but also present in other large cities); and retailers. This distribution system has developed to manage a large quantity of diverse seafood products rapidly. Recently, however, several shortcomings of the traditional distribution system have been indicated. Lou (2009) pointed out that restructuring the system is urgent as, increasingly, fishers, wholesales and brokers are leaving the traditional distribution system to create new businesses. While most such arguments are based on qualitative observations, a few quantitative studies also exist but are insufficient to allow significant conclusions to be drawn. The purpose of this study is to analyse the function of Japanese seafood distribution from the view of price formation and see what kind of implications this has in terms of restructuring.
In this study, a time series model is used to analyse the presence of asymmetry in price transmission. Six popular fish species in the Japanese market (part of both the small-scale and large-scale value chain) were chosen for the analysis: wild-caught Japanese sardine (Sardinops melanostictus), wild-caught horse mackerel (Trachurus japonicus), wild-caught Japanese flying squid (Todarodes pacificus), wild-caught skipjack tuna (Katsuwonus pelamis), wild-caught Pacific saury (Cololabis saira), and farmed and wild-caught red seabream (Pagrus major). The price data were collected within three traditional markets, which also represent three stages in the Japanese value chain: (i) producer markets at landing ports; (ii) wholesale markets; and (iii) retailers. Price transmission between (i) and (ii), as well as between (ii) and (iii), was examined using the price data on all six fish species. A time-wise comparison was also conducted using the price data of the fish species on or before 1993 and thereafter.
For some species, prices for both fresh and frozen forms of fish were available. Where this was the case, weighted averages of both prices were used for analysis. Fish that were once frozen but had been thawed were categorized as fresh. Wholesale market prices were found by taking the weighted mean of the prices of the six main wholesale markets in Japan (Tokyo, Yokohama, Nagoya, Osaka, Kyoto and Kobe). The retail price was calculated by taking the simple average of the retail prices in Tokyo, Yokohama, Nagoya, Osaka, Kyoto, and Kobe.
Monthly data taken from January 1976 to December 2009 were used for the analysis of Japanese sardine, horse mackerel, Pacific saury, and common squid. For red seabream, data from January 1976 to December 2006 were used; for skipjack tuna, data were from January 1983 to December 2009.
Table 10 presents some descriptive statistics. Prices are stated here in Japanese yen (JPY), with an estimated exchange rate of JPY103.58–92.57 per USD1 in the period 2008–09. Red seabream generally demonstrated higher prices than other fish, with the average wholesale market price at more than JPY1 000 per kilogram and the average price at retail markets above JPY3 000 per kilogram. Skipjack tuna had the second-highest average price in retail markets at more than JPY2 000 per kilogram. Prices for the other four species were cheaper. Generally, the price of each fish species increased from wholesale to retail markets.

69Developed countries
Table 10descriptive statistics by species
variable (jpy/kg) mean S.d. min max
Sardine
Producer 73.53 112.15 9.00 822.00
Wholesale 248.40 126.50 92.00 666.64
retail 643.61 280.39 281.67 1 326.67
Horse mackerel
Producer 289.60 183.34 34.00 1 030.00
Wholesale 514.68 84.94 292.46 866.88
retail 1 598.48 239.68 915.00 2 356.67
Japanese flying squid
Producer 315.93 138.75 99.19 867.95
Wholesale 467.28 101.69 262.87 790.97
retail 1 027.85 186.52 666.67 1 576.67
Skipjack tuna
Producer 174.09 41.92 91.42 310.09
Wholesale 585.87 185.40 244.00 1 232.74
retail 2 346.15 362.28 1 436.67 3 183.33
Pacific saury
Producer 187.61 211.54 29.00 2 027.00
Wholesale 390.54 155.91 157.23 1 106.70
retail 1 015.48 282.42 566.67 2 606.67
red seabream
Producer 1 287.68 337.35 630.00 2 181.00
Wholesale 1 429.60 414.36 715.62 2 399.00
retail 3 044.80 433.35 2 150.00 3 751.67
Sources: annual Statistics on Marketing of Fishery Products; Ministry of agriculture, Forestry and Fisheries; Ministry of Public Management, Home affairs, Posts and Telecommunications (2009).
resultsThis study analysed the price formation function of the Japanese seafood distribution for the six major fish species through APT analysis. Table 11 shows the summarized results.
In positive APT, sellers have strong power. However, in negative APT, buyers have strong power. In and before 1994, sellers had stronger power in some species and buyers had stronger power in others. However, after 1994, the market power of buyers apparently increased. Saury is unique to this as sellers have had stable market power over the observation period.
Table 11Summary of results by species
period Sardine horse mackerel
japanese flying squid
Skipjack tuna
pacific saury
red seabream
Producer to wholesale
First Pos** - - - Pos*** Neg**
Second Neg** - - Neg*** Pos** Neg*
Wholesale to retail
First Neg** Neg* Neg*** Pos** Pos*** Neg***
Second Neg*** Neg* Neg*** Neg*** Pos*** Neg**
* 10 percent significance level; ** 5 percent significance level; *** 1 percent significance level.Notes: First: the period before 1994; Second: the period in 1994 and thereafter. Pos and Neg show the positive and negative asymmetry, respectively. en dash (–) indicates no asymmetry detected.Source: ©FaO (2012).
Conclusions and policy implicationsThe results indicate that there were several APTs in the market, most likely owing to the combined effect of the perishable nature of fish products, existence of substitute goods, and imperfect completion of the market. First, when the perishable nature of

Value chain dynamics and the small-scale sector 70
fish products is the cause of APTs, negative asymmetry can be observed. Sellers are typically wary of accumulating a highly perishable stockpile of unsold products, which leads to buyers having more power in negotiating prices than sellers, demonstrating negative APT. This is particularly true in the Japanese market, where the popular form of the consumption of fish is sashimi or sushi (i.e. raw fish) and consumers are extremely sensitive to the freshness of the fish products. Indeed, in this study, negative APTs were found in most of the species including sardine, horse mackerel and red seabream.
Second, where the existence of substitute products is the cause of APTs, negative asymmetry can also be observed. The reason is closely related to that of perishable products in that sellers prefer selling their products at lower prices in order to be competitive with substitute products rather than accumulating stockpiles of perishable products that in the end will be wasted. This also leads to buyer power when negotiating prices. However, with some species, the existence of substitute products is not related to the perishability of product. For example, with skipjack tuna, a large proportion is distributed in frozen condition and thus perishability is not a concern. Instead, the negative APTs for skipjack tuna can be explained by the existence of substitutes in the Japanese consumer market (including bluefin tuna, southern bluefin tuna, bigeye tuna, yellowfin tuna, albacore tuna, and swordfish). Moreover, consumer demand for sustainable tuna species has also played a role, with consumers beginning to purchase tuna species that they perceive as being more sustainable in the early 1990s.
Third, where imperfect competition in the market is the cause of an APT, positive asymmetry can be observed when sellers are strong. However, when buyers are strong, negative asymmetry can be observed. In this study, most of the fish have negative APTs. This result suggests the existence of market power on the buyer side. Moreover, the number of species with negative APTs increased in the latter half of the observation period, which corresponds to the fact that, since 1994, supermarkets in Japan have become more important than fishmongers. Thus, supermarkets probably have stronger market power than these more traditional fish retailers.
In summary, other than saury, negative APTs for most of the species can be explained by the three factors discussed above: the perishable nature of fishery products; the existence of substitute goods; and the imperfect competition in the market caused by the increasing dominance of powerful supermarkets.
The positive asymmetry for saury suggests that market power does exist for sellers of this particular fish, and phone interviews were conducted to further investigate the reason for this unique outcome. According to managers and workers in supermarkets and wholesale markets, saury is an exceptionally important fish in terms of promotional marketing activities within supermarkets. Japanese fresh saury is used as an attraction item for consumers to supermarkets, with advertisements for the item placed in local newspapers. While supermarkets usually provide filleting or gutting services for customers of many fish species, saury is generally purchased whole by consumers, meaning that it is an easier and more convenient item to sell from the supermarket’s viewpoint. Thus, even in a situation where retail margins are minimal, there is an impetus from the supermarket to sell saury. These qualitative findings are in conformity with the outcome of this study on APTs.
If similar market conditions continue in Japan, the upstream producer side (fishers) of the value chain will be forced to accept their weak position for these species (except for saury) when compared with their downstream counterparts.
One possibility to reconcile this situation for fishers would be to simplify the fish distribution channel. Currently, the distribution channel consists of five players. These are: (i) sales representative at producers markets at landing sites; (ii) buyers at producers markets who transship fish to the city wholesale markets; (iii) wholesalers at city wholesale markets; (iv) buyers at city wholesale markets; and (v) retailers. One way

71Developed countries
of simplifying the value chain could be through the introduction of e-commerce, which would need to be combined with efficient collection and transportation methods. In fact, some new distribution channels using e-commerce have already been created in Japan under a private-sector initiative. For example, an information technology company has started such a distribution system for small businesses. Initiatives such as these also show promise in strengthening consumer understanding of fishing activities, which could ultimately put fishers in a stronger position in the value chain.
Another option to improve the negative APT in relation to the perishability of products could be through promotion of frozen fish sales. Currently, retailers usually display defrosted fish in their shops, as defrosted products are more preferable and familiar to consumers. However, if a marketing campaign were developed to promote frozen products’ freshness as well as the convenience of defrosting fish at home, the issue of negative APT due to perishability could be mitigated.
It should be noted that although possible determinants of APTs were discussed separately, the reality is that the market is affected by the combined effects and interactions between all of them. The relative magnitude of these elements was not assessed in this study, but it is an important topic for further research.
nOrWaybackgroundThe purpose of this case study is to present a preliminary analysis of both the small-scale and large-scale value chain for salted and dried wild-caught cod produced in Norway and exported to Portugal. Cod (Gadus morhua) is one of the most important demersal fish species in Norwegian fisheries. The total catch in 2010 was 283 312 tonnes, a 16 percent increase compared with 2009. Whitefish fisheries are the second-largest in Norway, with a total catch of 675 000 tonnes in 2010.
Between January 1990 and March 2011, the monthly average price per kilogram for cod was Norwegian krone (NOK) 12.64 (see Figure 20). The lowest price occurred in June 1996 (NOK8.25), while the price peak occurred in February 1999 (NOK19.69), note an estimated exchange rate of NOK5.64–5.88 per USD1 for 2008–2012.
All first-hand sales of demersal fish are regulated by the Raw Fish Act (Act of 14 December 1951 No. 3 on the marketing of raw fish), and are organized by six sales organizations (SOs). These SOs handle the first-hand sales of all commercially caught whitefish in Norway, including cod. Depending on where the fish is landed, different SOs are responsible. For example, the three largest SOs by area are: Norges Råfisklag, from Nordmøre in the southwest to Finnmark in the northeast; Sunnmøre og Romsdal Fiskesalgslag, in Møre og Romsdal county; and Vest-Norges Fiskesalgslag in Sogn og Fjordane and Hordaland counties.
To secure equal competition conditions for participants in the raw fish market, a market-based minimum price is set cooperatively by the SOs and the fisheries industry. By applying minimum prices, fishers’ income is safeguarded. For an example of an SO and the minimum prices they set, one can view information on Norges Råfisklag at www.rafisklaget.no. Table 12 shows the minimum prices set by this SO for cod.
Table 12minimum prices for cod, 19 September – 18 december 2011
Species/size minimum price
NOK
Cod > 6.0 kg 18.50
Cod 2.5–6.0 kg 15.50
Cod 1.0–2.5 kg 13.50
Cod < 1.0 kg 10.00
Source: The Norwegian Fishermen’s Sales Organization (2013).

Value chain dynamics and the small-scale sector 72
Data on first-hand prices from January 1990 to December 1999 are in EUR. From January 2000 to March 2011, prices in NOK were converted to EUR based on exchange rates from the Bank of Norway. Export prices in NOK were converted to EUR based on exchange rates from the Bank of Norway. Retail prices are available, except for the period January 2000 – March 2011.
resultsThe relationship between first-hand price, export price and retail price in Portugal is illustrated in Figure 21. While the first-hand price for cod remains relatively stable throughout the period, the export price fluctuates to a greater extent. Still, the correlation between the two prices is 0.8217 (Spearman’s rho), indicating that there is a fairly close relationship between them. It is important to note the slopes of the regression lines for the first-hand price and export price, with the slope for the export price being far steeper than that for the first-hand price. This indicates that the export price has experienced a relatively larger growth compared with the first-hand price, or in other words, the gap between the two prices has grown larger.
FIgUre 20nominal monthly average first-hand price for cod, january 1990 – march 2011
Sources: Prof. r. Menezes, lisbon University Institute; The Norwegian Directorate of Fisheries; bank of Norway (2011).
FIgUre 21norway-portugal price transmission for salted and dried cod
Note: First-hand NOK and retail price NOK/kg are converted from eUr.Sources: Prof. r. Menezes, lisbon University Institute; The Norwegian Directorate of Fisheries; bank of Norway; Norwegian Seafood Council; Prof. Frank asche, University of Stavanger (2011).

73Developed countries
The correlation between the first-hand price and the export price in NOK is indicated in a scatter diagram (Figure 22). The diagram shows a positive correlation, in that the export price increases in line with the first-hand price. As a perfect relationship is expressed by the straight line, the relationship between the two prices is not perfectly correlated.
All exports are affected by exchange rates. A devaluation of NOK relative to EUR will result in Portuguese importers being able to buy more salted and dried cod measured in NOK for the same amount of EUR. On the other hand, a revaluation of NOK will be followed by a decreasing demand from Portuguese importers as the price for the same amount of salted and dried cod increases relative to EUR. Hence, a rise in the exchange rate of EUR/NOK will result in decreasing demand from Portuguese importers. Figure 23 shows this exchange rate over time, i.e. NOK per EUR.
FIgUre 22Scatter diagram showing relationship between the first-hand price and export price in nOK
FIgUre 23nOK/eur exchange rates, indicative mid rates, and monthly average of daily listings
Note: Jan. 90 – Dec. 98: XeU, Jan. 99 – Mar. 11: eUr.Source: bank of Norway (2011).
Sources: Prof. r. Menezes, lisbon University Institute; The Norwegian Directorate of Fisheries; bank of Norway; Norwegian Seafood Council (2011).
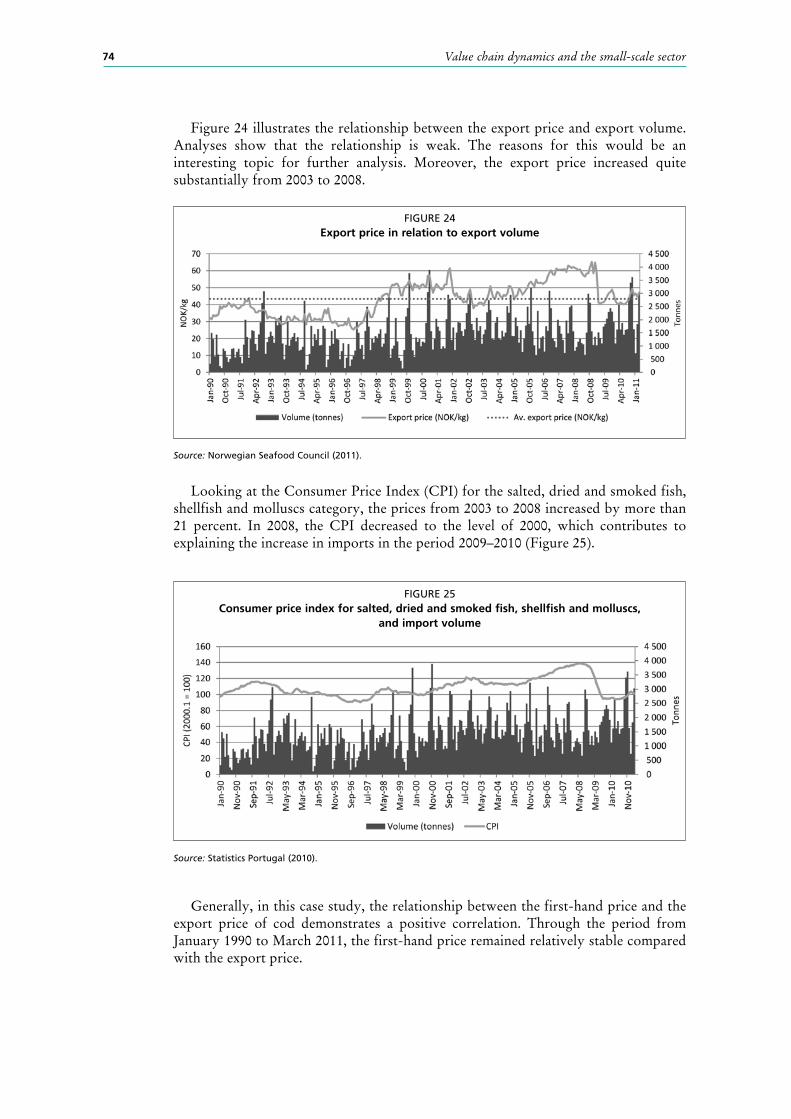
Value chain dynamics and the small-scale sector 74
Figure 24 illustrates the relationship between the export price and export volume. Analyses show that the relationship is weak. The reasons for this would be an interesting topic for further analysis. Moreover, the export price increased quite substantially from 2003 to 2008.
Looking at the Consumer Price Index (CPI) for the salted, dried and smoked fish, shellfish and molluscs category, the prices from 2003 to 2008 increased by more than 21 percent. In 2008, the CPI decreased to the level of 2000, which contributes to explaining the increase in imports in the period 2009–2010 (Figure 25).
FIgUre 24export price in relation to export volume
Source: Norwegian Seafood Council (2011).
FIgUre 25Consumer price index for salted, dried and smoked fish, shellfish and molluscs,
and import volume
Source: Statistics Portugal (2010).
Generally, in this case study, the relationship between the first-hand price and the export price of cod demonstrates a positive correlation. Through the period from January 1990 to March 2011, the first-hand price remained relatively stable compared with the export price.

75Developed countries
SpaInbackgroundFisheries overviewAs in the rest of the countries along the Mediterranean shore, the origins of the fisheries industry in Spain are rooted in the beginnings of history. Seafood consumption, with an annual per capita consumption rate of 30–32 kg, is an important component of the Spanish dietary tradition. Not only is Spain an important consumer country, but it is also an important producer. Today, it is the largest seafood market in Europe in terms of demand volume.
Until the mid-twentieth century, this high consumer demand was satisfied by the catches of local fleets, whether inshore or deep-sea fishing, and focused on the traditionally consumed fish and shellfish species. However, in recent decades, and after the accession of Spain to the European Union (Member Organization), a decrease in local catches and a significant rise in consumption made the Spanish market more dependent on alternative sources of fishery products through imports and aquaculture production. As time has gone on, decreased landings and limited growth from the aquaculture industry have made imports the most important source of seafood in terms of both volume and value. Imports not only contribute to domestic consumption, but also provide raw material for the Spanish processing industry, which is active in local and international markets.
In the last few years, distribution channels in Spain have become more complex at all stages of the value chain. Sources of origin have diversified and increased access to a wider range of customers. Owing to retail concentration and a larger number of independent wholesale companies, the number of wholesale operations outside the traditional platforms has increased. At the retail level, the market share of organized chains has increased at the cost of reducing sales at the traditional outlets, made up of independently owned, small-scale fish markets.
As with many sectors, the seafood market in Spain has been negatively affected by the recent economic crisis. Consumption of fishery products has decreased while the prices have continued to rise, with these trends not expected to change in the short term. The crisis has not only affected consumption in terms of volumes, but it has also caused shifts in preferences toward different species, as well as various preserved and processed products.
Seafood production and supplyTotal seafood supply in Spain, including catches, aquaculture production and imports, was more than 2.5 million tonnes in 2010, with 61.5 percent of this total volume consisting of imported fishery products. Capture fisheries is the main source for local production of seafood, accounting for 28.8 percent of total supply. Lastly, domestic aquaculture production makes up less than 10 percent of the total supply, with 253 841 tonnes produced in 2010.
The vast majority of the Spanish fleet operates in local fishing grounds and in those of the European Union (Member Organization), using generally small-scale gear types. Indeed, more than 95 percent of these boats are less than 11 m long and less than 38 tonnes. Trawling is the most common industrial gear, with 12 percent of the total fleet using this method. Spanish vessels fishing in waters outside the European Union (Member Organization) are usually larger, and represent 26.3 percent of the total employment in capture fisheries. This fleet fishing in waters outside the European Union (Member Organization) is mainly focused on different species of tunas and hake in both the Atlantic and Indian Oceans. In 2010, the catches of the Spanish fleet were 768 691 tonnes. Although this amount is in line with the average landings for the last five years, it is 27.4 percent less than at the beginning of the decade.

Value chain dynamics and the small-scale sector 76
Spanish aquaculture is dominated by mussels, which make up 76.3 percent of the total production of farmed species. The mussels are harvested on rafts. The mussel industry is based mainly in Galicia, the northwest region of Spain, and is composed of a large number of small family-owned businesses. However, mussels are not a high-value species, and the entire volume represents only 28.4 percent of the total value of Spanish aquaculture production. Other relevant farmed species in terms of volume include gilthead seabream, seabass, rainbow trout and turbot, with seabream and seabass the two most important species in terms of value. While production of both fish is only 13.8 percent of Spain’s total volume of aquaculture products, their value accounts for 44.8 percent of the total value for the five main farmed species.
Economic performance varies across industries. Bass and bream production increased until 2008, but then collapsed, and production was reduced with several firms experiencing periods of loss and bankruptcy. Trout production and farmers’ profits have also demonstrated a downward trend since the beginning of the century, with sales decreasing every year. However, mussel production remains stable as it has been bolstered by the Galician government limiting the number of rafts allowed in estuaries. Despite being a low-value species, mussel farming has proved profitable for the families involved in the sector. Turbot also seem to be a profitable sector, with production increasing although some difficult market conditions limit its growth.
The limitations and decreases in domestic production have been balanced in the last two decades by an increase in imports of fishery products. Since the 1990s, the volume of imported seafood rose until reaching a peak of 1.7 million tonnes in 2007. With the onset of the economic crisis, imports decreased significantly; by 8 percent in terms of volume and by 20 percent in terms of value. In 2010, this downward trend stabilized at 1.6 million tonnes. Frozen fish and molluscs are the two most important groups of commodities imported, accounting for 20.6 and 22.9 percent of total imported volumes, respectively. However, in terms of value, frozen fish represents only 11.8 percent of the total. Crustaceans and molluscs are the two most important imports in terms of value, accounting for 22.4 and 20.3 percent of the total value imported, respectively. Over the last five years, imports of fresh and unprocessed seafood have decreased, but the trade in fillets and other processed products has increased in terms of both volume and value.
Market structures and value chainsAs noted above, the distribution channels for seafood in Spain have diversified and undergone several changes in the last decade. Within these changes, retail concentration has had the most impact on national seafood trade. In addition, the marketing chain has increased in complexity. New sources of product and agents are continually evolving, changing the way business in seafood trade is done and creating constant changes in the value chain. The traditional value chain was centralized at the wholesale level in a network known as MERCA, a publicly owned company that concentrates food wholesalers in trading facilities located in every region of the country. However, today, the ability of retailers and other agents to access products directly and the rise of wholesale platforms outside the MERCA network have resulted in alternative value chains, prices and margins.
Seafood can be purchased in first-sale at harbour auctions, at farms, at inland docks (dry docks) or points of entry for seafood imports. Auctions sell landings from local fleets and take place at the harbours. Traditionally, local wholesalers, retailers and restaurateurs were the main buyers at the auctions, but today large wholesalers and retail chains are also present, mostly at all important auctions along the coast. Aquaculture products are sold directly by the farmers or, in the case of mussels, by farmers cooperatives. Wholesalers and large retailers connect to the farmers and set prices and conditions in a business negotiation, instead of having to accept the fixed price at the auctions. Dry docks in harbours or airports are used both as a point of

77Developed countries
entry and as a place for dispatching seafood imports. These dry docks can also be used as a second-sale market between large importers and domestic wholesalers and retailers.
Although the proliferation of new agents and distribution channels has reduced the importance of the MERCA wholesale network, the network still retains an important market share. Indeed, in 2010, 47 percent of total seafood sales that occurred at this stage of the chain took place at its facilities. MERCA provides infrastructures which independent wholesalers can access and run their own businesses from. In addition, MERCA enables proximity between wholesalers, which improves the exchange of information, increases competition and helps to stabilize and make prices more similar across sellers. Although MERCA still plays an important role, the value chain has become more integrated and provided new alternative sources of seafood for retailers and restaurateurs. For example, organized retailers can purchase fishery products directly from the producers or from wholesalers in or out of the MERCA network. Large supermarket chains are also able to operate in the international markets and import their own commodities. Under these conditions, the same species can reach consumers through a variety of value chains, each with a different number of intermediaries. Moreover, each value chain may have its own unique margins and end-consumer price.
Concentration of the sector is most evident at the retail level. The market share of supermarkets and hypermarkets for seafood products went from 62.6 percent in 2004 to 72.8 percent in 2011. Concentration is led by supermarket chains, in which seafood sales increased 29.7 percent in the same period. This growth has displaced all other outlet styles, including other forms of concentrated retailing such as hypermarkets. Competitive pricing, a wider range of products and services, and a common marketing and promotional strategy appear to be the key factors in the supermarket chains’ success against the more traditional retail outlets. Proximity to consumers is an important advantage the supermarkets have over hypermarkets, as hypermarkets are usually located in outlying malls requiring travel time.
Sources of dataThe data used to analyse the seafood value chains in Spain were taken from different official and institutional sources. All of them are available online and periodically updated by the appropriate institutions.
Prices at first-hand, wholesale and retail levels from 2004 until now were collected weekly for eight different fresh seafood species by the Ministry of Food and Agriculture. The eight species selected for analysis are: wild-caught hake (Merlucius merlucius), wild-caught sardines (Sardina pilchardus), wild-caught anchovy (Engraulis encrasicholus), wild-caught blue whiting (Micromesistius poutassou), wild-caught mackerel (Scomber scombrus), farmed rainbow trout (Oncorhynchus mikiss), farmed salmon (Salmo salar) and farmed mussels (Mytilus galloprovincialis). All wild species analysed were caught on both a small and large scale. For aquaculture products, salmon and trout are farmed on a large scale, although trout production is relatively small and fairly fragmented. Mussel farms are small-scale, family owned, and grouped in large cooperatives.
Marketing costs at the wholesale and retail levels were collected in a yearly survey conducted by the Spanish Institute of Statistics. Total labour costs and expenses in services and products other than merchandise were added and decomposed into monthly series using the occupation rate in the food marketing industry. The survey has been collected since 1999 and, currently, the latest year available is 2010.
Different series of economic magnitudes were used to perform an index of a retail demand shifter component. The index was computed in a principal components analysis procedure. Four different CPIs and disposable income were the original

Value chain dynamics and the small-scale sector 78
variables reduced into the new index. The selected CPIs were seafood, meats, overall foods and beverages, and the general CPI excluding foodstuffs.
Monthly traded quantities in MercaMadrid, the largest Spanish wholesale market, for each of the selected species were used in an attempt to have a proxy of landings and imports. The relevance of this market at the national and international level assumes that the quantities traded are strongly related with the total amounts coming into the national market. It can be assumed that they generally follow the same trend as the total supply of the species.
resultsPrices and marginsThe evolution of prices and margins in the seafood value chains in the period between January 2004 and December 2010 shows different patterns across species, level of imports, and depending on whether the species is wild or farmed. All of these factors influence prices and margins in different ways, imposing restrictions on the normal mechanism of price transmission and unequal market power along the chain.
Excluding mussels and anchovy, the changes in the price of each species have followed a similar trend across all stages of the value chain. Increases in first-hand or farmgate prices have been accompanied by increases at wholesale and retail prices. At the first-hand and farmgate level, hake and mussels have decreased in price while the other species (sardine, blue whiting, mackerel, salmon and trout) have all increased in price. However, hake prices have decreased at all stages in the chain, while mussels have experienced a small increase in price at the wholesale and retail levels. The case of anchovy is similar to that of mussels, with prices changing insignificantly, but decreasing at the wholesale level. Thus, six of the eight species have had significant changes in price across the value chain in the last eight years.
The changes in price not only differ in their trends and signs. In addition, some species experience larger variations than others. The most significant variations are due to the origin of the species. However, in the case of hake, the decrease in price is more pronounced at the wholesale level. In contrast, retail prices have experienced the lowest variations. This is a general pattern suggesting that retailers may be absorbing price increases in order to keep demand and sales, while delaying decreases in order to obtain larger profits when possible, as in the case of hake.
Within capture fisheries, the decreasing supply of locally landed species has significantly increased their prices. In contrast, more than 60 percent of the hake and anchovies sold in Spain during the observed period were imported. With the exception of salmon, which had increased prices owing to epidemiological issues in Chile, the variations in the prices in origin of wild species were larger than in farmed. At the retail level, the prices of farmed fish, salmon and trout resulted in the largest increase of all the observed species.
The different evolution in the prices of each species goes on to affect the margins of the traders involved in the value chain, making some products more interesting than others in terms of making a profit. As the gross margin is the quotient between the retailers’/wholesalers’ price and the first-hand/farm price, the implications of shocks in origin on subsequent margins are evident, and follow similar patters to those observed with the prices. Farmed and wild species with large shares of imports have evolved in a separate way from the rest of wild fishery products considered in the analysis. Retailers’ margins have increased for hake and mussels, and remained almost stable for trout and anchovy. Salmon is a unique product as it is a farmed species that has experienced the largest increases in prices. The margins on it have evolved in the same way as the wild local species, with decreases in retailers’ margins. However, the decrease in the gross margin is the lowest, as it is only 15.3 percent compared with blue whiting (40.3 percent), sardines (32.8 percent) and mackerel (23.9 percent).

79Developed countries
Despite the differences in the evolution of prices and margins, the contribution of each stage of the chain to the final value of the product has remained stable across species. Overall, retailers’ contribution to final product value ranges between 45 and 50 percent. Value added by wholesalers ranges from 11 to 28 percent; in case of salmon, it drops to 5 percent. Wholesalers’ contribution to the final value is greater in local wild species than in farmed or imported ones. It is also quite significant in the case of locally farmed species such as trout (15 percent) and mussels (19.1 percent).
Testing price linkages across the value chainPrice transmission in the value chain was tested in Spain using the two alternative models proposed in the methodology.
Results suggest different market conditions for each species. Overall, a competitive framework can be rejected. Only three of the six selected species resulted in significant values for all three equations. At least one equation demonstrated significance in any of the other three species. Supply quantity is the most influential factor in the majority of species and equations. Except for sardines and trout, traded volumes affect prices and/or margins in different ways. Demand shifter influences the retail price for blue whiting, mackerel and hake, but it is not relevant in any other species. Margins and first-hand prices of sardine, as well as the farmgate price of trout, also appear to be affected by this factor. Marketing costs were significant for anchovy, mackerel and sardine in the equations of margin and first-hand price. Parameter signs differ between mackerel and the other two species. Only anchovy satisfies the conditions of perfect competition for all three equations. Mackerel fits the linear restrictions for margins and first-hand price. Perfect competitive conditions could be rejected in any other case.
Reduced form models rely on statistical techniques to capture price linkage, whereas some form of what is termed “cointegration” among the prices defines the market and allows for predicting the consequence of random price shocks in the value chain. If cointegration is proven, perfect competition stands and a shock in the first-hand price will lead to a shock of similar magnitude in the rest of the chain. Otherwise, non-competitive pricing is in effect.
Two models were tested for each of the six species. In the first model, only the local prices at first-hand, along with wholesale and retail, were considered. In the second model, prices for imports were included as a fourth variable in the model. While different levels of cointegration were found when import prices were considered, only blue whiting and trout satisfied perfect transmission when working only with the domestic series. The number of cointegrating vectors increases in all cases when the prices of imports are included in the models.
Conclusions and policy implicationsWhen considering domestic seafood production and retailing, a perfect competitive framework does not fit with the observed data in the majority of the species studied. The inclusion of import prices results in significant cointegration across the prices of the different stages of the value chain for almost all the species considered. In this sense, it can be concluded that imports improve price transmission along the value chain.
Furthermore, imports prevent rises in the prices of wild fishery products. Products with a large ratio of imports decreased or stabilized their prices from the first-hand to the retail levels. This effect may benefit traders and consumers, but will negatively affect fishers’ income.
The prices of all the species have been shown to be less volatile for retailers than for any other participant in the chain. As a consequence, when the prices of local and imported species decrease, there are improved returns. However, for species with significant rises in the first-hand prices, such as the wild and domestic species observed, there are decreasing profits. The value added by wholesalers is larger in species with a

Value chain dynamics and the small-scale sector 80
large dependence on local catches. The value added by retailers has increased in species with large shares of imports and decreased at different rates in species dominated by local catches.
Despite the issues with salmon during the observed period, aquaculture products appear to be more profitable for traders than ones in the wild fishery. More stable and even rising prices allow the transferring of price variations to the following stages in the chain and reduce the impacts on retailers’ margins.
The results observed in Spain have important implications in the long run. The increasing prices of local wild species make these less attractive for retailers, which have been reducing their margins in the observed years. It is not expected that the local supply of capture fisheries will increase significantly in the future, and the maximum yield of the fisheries may almost have been reached, if not already exceeded. With no relevant amounts of imports contributing to a decrease in prices, the current situation is likely to persist. Without a way to increase their profits, retailers, especially those in large chains, will probably replace these species with others that have more stable prices, especially those with lower prices. The demand for species such as blue whiting, sardine and mackerel is at risk of being constrained to local and traditional markets, which in the case of Spain are in recession. This is especially true in the current economic downturn, where the Spanish seafood market is in an accelerated process of retail concentration. In contrast, wild species such as hake and anchovy, which can be substituted with other subspecies from different parts of the world, have stable or decreasing prices and, thus, will be of greater interest for retailers. These species have the potential to either improve retailers’ profits or at least keep them constant.
The case of farmed species is similar to the case for species that are imported in significant amounts. Despite the increase in prices observed in salmon and trout, retailers’ margins did not change much for trout and in fact increased for mussels. The recovery from the Chilean epidemiological crisis is driving salmon prices to lower levels, and the situation described in this research is likely to become more similar to that observed with trout rather than any other wild species. Indeed, the cut in retailers’ margins due to shortages was lower than the cuts observed with the wild species. Potential increases in world aquaculture production will continue to reduce and stabilize the prices in the market, making farmed species increasingly attractive for retailers.

81
9. Women in global fishery and aquaculture value chains
As has been presented in this document, fisheries and aquaculture value chains are diverse, often complex and dynamic. Men and women have different and changing roles in these value chains, with the roles depending on a wide range of factors, including: culture, values, attitudes and norms concerning access to resources and control over them, social mobility, type of technology utilized, the extent of commercialization, and the product involved. Female roles in fisheries are principally designed in terms of ethnicity, religion and socio-economic status.
Building upon the case studies presented in this document, a specific study was undertaken as part of the project to identify and measure women’s involvement in global fishery and aquaculture value chains and to investigate their activity, access and control in these value chains in selected locations in Africa, Asia and Latin America. Primary data were obtained from fisheries and aquaculture operations in Bangladesh, Cambodia, Ghana, Honduras, Kenya, Peru, Sri Lanka, Thailand, Uganda, Viet Nam and Zimbabwe. The full report on women’s involvement is available on the Fisheries and Aquaculture Value Chain web page.9
In general, most women working in the fisheries and aquaculture sector are involved in the processing and marketing nodes of value chains. This is largely a consequence of social and cultural norms, which have generally reduced women’s access to resources and their decision-making power. Processing is done either at the small-scale level using traditional techniques (usually only in developing countries) or at the industrial level as factory workers (common in both developing and developed countries). Financial returns for processing activities are often low and no profit-sharing arrangements such as Fair Trade have been employed. Decision-making at the male-dominated management levels does not allow room for a gender perspective and, thus, female participation rates in trade union activities are low. Female roles in processing factories are also associated with job insecurity, health issues and harassment (De Silva and Yamao, 2006). In terms of job insecurity, the fiercely competitive nature of the sector leads to many processing companies cutting wages or unexpectedly shutting processing plants down, causing large-scale unemployment (Sharma, 2003). Women often work at very low levels of plant temperatures and with dangerous processing equipment, which they have not received adequate training to use. Thus, the work includes both short and long-term health risks (De Silva and Yamao, 2006).
In contrast, women who are more highly educated or have better access to resources can be involved in the higher levels of the value chains, meaning that they can manage and operate fishing enterprises. Although this is not the norm, women can enjoy increased financial benefits and access to resources at this higher level. Generally, men are involved more in production (upstream) activities and invest in fishing vessels, nets, other fishing gear, and pond construction. Women generally invest more in processing equipment and are responsible for fish purchasing, processing and retailing, although that this differs in every fishing area and country.
In addition to gender-role differences that exist in value chains, disparities also exist in terms of socio-economic levels. Both women and men in higher-income groups play dominant roles in the value chain, usually at the processing, import or export level, and
9 www.fao.org/valuechaininsmallscalefisheries/background1/en/

Value chain dynamics and the small-scale sector 82
are able to obtain a higher profit margin. In contrast, lower-income agents have weak bargaining power and little control over resources and prices in the value chain. Thus, these agents are overall more vulnerable and receive the least distributional benefit along the value chain.
Throughout history and across countries, women have been engaged in fishery value chains as a way to support their families and households both directly through food contribution as well as through employment. Today, increased technology in the fisheries and aquaculture sector has caused differing impacts on the role women play, especially in developed countries. On the one hand, improvements in technology have limited women’s roles, particularly in the production side. As capital equipment increased and modern fishing for commercial production grew, the sector became more of an industry, with women becoming excluded. On the other hand, better technology has also allowed women to increase their engagement in fishing operations in some developed countries, such as in Japan and Canada. In addition, increased training has exposed women to important aspects of quality control, management, product development and marketing.
From the study undertaken of gender involvement in fisheries and aquaculture value chains, it is evident that access to and control over resources is vital for enabling agents to survive and be able to gain from ongoing changes in the sector. Resources could include better access to financial capital, processing infrastructure, knowledge of new production systems, human and social capital, skills and collective organizing ability and other factors that enable less-powerful agents to gain a higher distributional benefit in the fishery value chain. With the marketing situation for fish and fish products rapidly changing and with inequalities in the value chain growing, there is a need for some kind of protection against livelihood threats, especially for vulnerable groups such as women and children. However, the modern and complex fishery value chains have mostly opened up new avenues for resource-rich groups, while poor and weaker groups such as women have remained in low-value processing nodes of the value chain. It is recommended that some sort of social protection investment for women be implemented. This could include directly supporting women’s entry into new markets and more profitable enterprises, raising awareness of the dangers of sex-for-fish transactions, and seeking regulatory mechanisms for fishery factories operating in the sector. All of these recommendations appeal to further policy intervention and are fully detailed in the report on women’s roles, available on the Fisheries and Aquaculture Value Chain web page.10
In conclusion, throughout the history of fishery and aquaculture value chains, women have often played a significant but invisible role, finding themselves near the bottom of the value chain with limited opportunities to move up or grow in their role. Common hardships that women have faced include lack of recognition of their contribution, social isolation, cultural barriers, lack of acceptance, being overlooked or ignored by fishery industry managers and policy-makers, pay inequality, poor working conditions and limited access to resources. It is vital that any value chain analysis employ a gender perspective in order to ensure that both men and women are recognized for each of their important roles and to help both sexes receive a more equitable distributional benefit.
10 www.fao.org/valuechaininsmallscalefisheries/background1/en/

83
10. Summary findings and policy recommendations
This section presents the summarized price analysis results, findings and key policy recommendations from each participating country. At the end of the section, Table 13 provides, for each country, information on all species studied, price data used for the analysis and time series of the data.
afrICa
Ghana:• Species included for analysis: wild-caught Nile tilapia (Oreochromis niloticus)
as well as wild-caught tuna, mainly skipjack (Katsuwonus pelamis) and yellowfin (Thunnus albacares).
• Tuna is of major commercial importance owing to its export revenues whereas tilapia has large domestic demand for both fresh and locally processed varieties.
• It is recommended that small-scale buyers and sellers adopt pricing methods according to weight, as is done with meat in the country.
• Large- and small-scale value chains coexist; they are not mutually exclusive and contribute to each other’s efforts. For example, small-scale fishers obtain many inputs such as nets, outboard motors and fuel from the large-scale agents, thus contributing to the industry’s income. Moreover, small-scale traders and processors obtain tuna and tilapia from firms with large-scale commercial fleets.
• In comparing the value chains for tuna, the large-scale chain has significantly more organizational and institutional support and, as such, has a better understanding of how to access international markets. The small-scale value chain for tuna has no access to information from international markets and only limited access to that from domestic institutional markets.
• Support and training for the small-scale sector should target the following areas: international market requirements and certification, pricing methods, safe and hygienic practices, reduced post-harvest losses, and infrastructure such as appropriate storage facilities near fish landing sites and refrigeration at local market sites.
Kenya:• Species included for analysis (all wild-caught): Nile perch (Lates niloticus),
Nile tilapia (Oreochromis niloticus), silver cyprinid (locally known as omena, Rastrineobola argentea), and lobster (Pinulurus ornatus/P. homarus).
• Selected species show a general trend of declining catches, which is probably the reason for their price increases since 2007.
• The margin analysis conducted between first-hand and export earnings found significant disparities. On average, exporters earn 250 percent of the first-hand earnings for Nile perch. The lobster fishery provides the highest price to fishers, but exporters still earn 140 percent of the first-hand earnings.
• Disparities were largely due to fishers’ weak bargaining power and challenges in accessing markets. As such, it is recommended that fishers become organized in producer groups.

Value chain dynamics and the small-scale sector 84
• For markets, domestic and regional markets should be researched and further developed to provide fishers and fish traders with a non-export market.
• There is a need to harmonize the current institutional framework for fisheries and to advocate for a distinct fisheries act or policy in order to support the small-scale sector more effectively.
• A working group from various ministries needs to be formed, specifically with the mandate to address challenges facing the small-scale fisheries sector and to establish a framework for how they will work together.
• New value-added product development should be supported, with standards set for these new product forms.
uganda:• Species included for analysis: wild-caught Nile perch (Lates niloticus),
wild-caught and farmed African catfish (Clarias gariepinus), wild-caught mukene (the local name for silver cyprinid, Rastrineobola argentea), wild-caught bagrus (Bagrus docmac) and wild-caught and farmed tilapia (Oreochromis niloticus).
• Looking at monthly price observations, fishers receive the highest value for Nile perch, which is part of a large-scale value chain destined for the export market, whereas they receive the lowest value for silver cyprinid (mukene), part of a small-scale value chain for local consumption.
• First-hand prices are only weakly related to downstream markets and have limited price leadership. This trend is most significant in the large-scale value chain of Nile perch.
• To help fishers increase their bargaining power and receive more value for Nile perch, fishers need to become more organized into a single selling desk.
• Lake Victoria fisheries are shared between Uganda, Kenya and the United Republic of Tanzania, and they need to be jointly managed and effectively enforced. What this management plan should be needs to be further explored. The setting of TAC limits for a TAC-based system in Lake Victoria may not be feasible, rather, it may be more appropriate to effectively introduce input control measures together with technical measures such as a minimum size of fish that can be caught and landed, protection of breeding grounds, etc. To ensure legal participation of small-scale fishers, control and technical measures should not be biased against them.
CenTraL and SOuTh amerICa
honduras:• Species included for analysis: farmed shrimp (Litopenaeus vannamei),
farmed tilapia (Oreochromis sp.), wild-caught lobster (Panulirus argus) and wild-caught snapper (Lutjanus spp.).
• With each species, comparisons were made between the domestic wholesale price and the export prices to the European Union (Member Organization) and/or the United States of America, demonstrating that the domestic price was often quite competitive.
• For shrimp, Honduran wholesale prices were 20 percent higher than export prices to the European Union (Member Organization).
• For tilapia, when adjustments were made to consider fillets, the domestic price was 11 percent higher than export prices to the United States of America.
• For snapper, export prices to the United States of America were 11 percent higher than domestic prices.

85Summary findings and policy recommendations
• For lobster, the lack of domestic wholesale prices reflects the fact that most of the harvest is exported.
• It is recommended that the local consumer market be developed, as it is currently limited to high-end hotels and restaurants. For this to happen, seafood consumption for local households must be promoted, better standards for quality control must be introduced, infrastructure must be improved and better relationships between buyers and sellers must be developed. Although local market prices will probably be generally lower than export prices if product availability increases domestically, developing a local market is also recommended as a way to improve food and nutrition security. Moreover, transportation costs will be less.
• Tourism is recommended as an avenue to support the seafood industry through promoting consumption of local seafood during tourists’ stays. Moreover, fisheries tourism could provide diversified income streams to fishers, particularly where growth is constrained by overfishing.
peru:• Species included for analysis: farmed shrimp (Penaeus vannamei), farmed
scallops (Argopecten purpuratus), farmed trout (Oncorhynchus mykiss) and wild-caught Peruvian anchovy (Engraulis ringens).
• Price formation in international seafood markets is competitive, with prices of the European Union (Member Organization) and the United States of America found to be interdependent.
• Similar to the analysis conducted in Honduras, comparisons were made between the mean domestic wholesale price and the mean export price. For shrimp, the export price was on average 15 percent higher, indicating that small-scale shrimp farmers could gain higher revenues if they were able to access international value chains, although the full costs of transportation, certification and marketing these products for the international market need to be further explored.
• Export prices for trout and scallops were also found to be higher. However, for producers to enter the export market, additional training, capital investments and marketing expenditure will be required. Without information about these inputs, it is difficult to quantify the economic benefits of accessing international markets, and, thus, more research is needed.
• With significant differences also found between domestic prices owing to transportation costs, it is recommended that better distribution channels to Lima be developed as a way for rural producers to receive more value for their product.
• Considering the vital micronutrients that can be provided by anchovies in local diets, fishers should be provided with incentives to catch and sell anchovies as a nutritious DHC food source. Incentives could include lowering distribution costs, increasing first-hand price and providing infrastructure to be utilized for operational and storage capabilities. Along with this, international and domestic campaigns that promote anchovies for DHC should be continued to aid in increasing consumer demand.
• In terms of the fishmeal industry for anchovies, ways in which more income could accrue to small-scale fishers should be researched and developed.

Value chain dynamics and the small-scale sector 86
• In order to address common constraints facing small-scale fish farmers (including limited education, training and infrastructure and overcoming operational costs), two strategies are suggested. First, small-scale farmers could work in cooperation with larger companies. In addition to selling consistently to these companies, farmers could utilize technical assistance, credit and infrastructure from the companies. Second, small-scale producers could form a cooperative or association in order to pool their resources.
aSIa
bangladesh:• Species included for analysis: wild-caught hilsa (Tenualosa ilish), farmed
rohu (Labeo rohita), farmed catla (Catla catla), farmed pangas (Pangasius hypophthalmus) and farmed tilapia (Oreochromis mossambicus / O. niloticus).
• In most cases, the direction of causal relationship was from the retail to the wholesale market, probably owing to the fact that retailers are more organized than wholesalers.
• Although changes in retail prices are drivers of change in wholesale prices, the APT varies among the type of products.
• In comparing the capture value chain of hilsa with the aquaculture value chains of the other selected species, the analysis indicated different patterns of price transmission elasticities from retailer to wholesaler. With these patterns, it is concluded that wholesalers of aquaculture products have relatively more bargaining power compared with wholesalers of captured fish.
• Aquaculture farmers are better organized when compared with capture fishers and are able to adjust their harvest depending on market price. With the emergence of commercial aquaculture in the country, this finding helps to predict a favourable change in the price transmission behaviour for fish farmers.
• Given the APT of hilsa retail prices to primary markets, it is recommended that hilsa fishers become more organized in order to more equally receive a share of the expected increase in price for this product.
• A considerable increase in demand for various types of fish in Bangladesh over time is expected owing to population growth and increases in per capita income. There is a need for commensurate increases in fish supply to maintain fish price and to protect fish consumers.
Cambodia:• Species included for analysis: wild-caught and farmed Indonesian snakehead
(Channa micropeltes), wild-caught and farmed pangas catfish (Pangasius sp.), wild-caught boeseman croaker (Boesemania microlepis), wild-caught kes (the local name for Phalacronotus apogaon) and wild-caught carp (Henicorhynchus sp.).
• The average total quantity traded of these five species has declined dramatically in the past six years, mainly as a result of the decrease in wild fish stocks in the rivers/lakes, population growth and the limitations of aquaculture techniques in the country. As a consequence, the price of each of the species studies has increased sharply in the last six years.
• Generally, as expected, retail prices are higher than wholesale prices, and wholesale prices are higher than first-hand and farmgate prices. However, the margins differ among species and stages of the chains.
• Wholesalers of snakehead and croaker may have less power than retailers, while wholesalers of carp may have more power than retailers.

87Summary findings and policy recommendations
• Positive asymmetry was found in pangasius and croaker, whereas no asymmetry was found in carp. This means that whenever there was an increase in price at the wholesale level for pangasius and croaker, the retail price increased faster compared with the rate of the decrease in retail price when the wholesale price dropped. This was not the case with carp.
• It is recommended that appropriate technologies for farming snakehead and pangasius be adopted. Pellet feed for fish feed should be used instead of low-value fish, which should be promoted for DHC to improve food and nutrition security. Ingredients for the fish feed must come from sustainable sources.
• Quality management should be improved by introducing proper conservation technologies when transporting fresh fish. In addition, training for appropriate processing techniques to develop and sustain key freshwater fish products should be provided.
• Information on fish prices should be made broadly accessible to all chain agents, as price transparency is vital to help agents obtain more equitable benefits and reduce price fluctuations. Prices could be made more accessible by developing a market information network among stakeholders using mobile or radio commerce.
• Wild fish stocks must be managed effectively by prohibiting all illegal, unreported and unregulated (IUU) fishing or any activity that harms resources in an unsustainable manner.
maldives:• Species included for analysis (both wild-caught): skipjack tuna (known locally
as kalhubilamas) and yellowfin tuna (known locally as reedhoo uraha kanneli).• Summary statistics show that both harvests and exports have declined over
time. Consequently, real income to fishers has fallen and will continue to decline unless a rise in the real first-hand price offsets this fall in harvest.
• Export price is an important determinant of the first-hand price, which indicates that the first-hand prices are regulated and thus not determined purely by market forces. The first-hand price is set based on past behaviour while at the same time responding to real shocks in the export market. First-hand prices were found to be more responsive to negative export price shocks than to positive ones.
• Statistical analysis demonstrates that a 1 percent increase in harvest generates downward pressure on first-hand prices by 0.19 percent, implying increasing fishing effort to harvest more will result in lower first-hand prices, all else being equal.
• A margin analysis demonstrating how much of the rent is captured at the export level relative to the first-hand level found that market control is held by the two main canneries that sell to the export market. However, this margin has been declining over time, albeit at a decreasing rate.
• Policy regulators should avoid subsidies for fuel as this distorts the economic incentives facing fishers and results in increased fishing effort above the efficient level of harvesting.
• Concern about overfishing of tuna stocks is legitimate, as shown from the harvest levels and export quantities collected in this case study. As a highly migratory fish stock, efforts to sustain tuna stocks near optimal levels will require international cooperation. With such cooperation likely to take significant time, Maldives may well face declining tuna stocks for some time.

Value chain dynamics and the small-scale sector 88
• A fall in harvest will generate a first-hand price increase, but the increase will not be sufficient to offset the harvest decline, hence, revenues for fishers will decline. With its small economy, this is a particularly serious problem for the country.
• It is recommended that fishers become organized in a cooperative to sell as a single-seller operation. This could provide an alternative to the buying power of the canneries, and prices could be set in a cooperative manner to better benefit both parties.
• To support fishers long-term, direct income transfers or complementary livelihood activities should be explored. These strategies could reduce pressure on the tuna fishery and sustain its resources for the long term.
Thailand:• Species included for analysis: farmed vannamei shrimp (Penaeus vannamei),
farmed tilapia (Oreochromis niloticus), farmed walking catfish (Clarius sp.), farmed seabass (Lates calcarifer) and wild-caught tuna (frozen and canned).
• Pricing patterns in the Thai aquaculture sector are not just cost or demand driven. Rather, they are influenced by various factors depending on the species. Wholesale and farm prices were found to affect each other for shrimp and seabass. Retail and wholesale prices were found to affect each other for walking catfish and shrimp. None of the prices along the tilapia value chain affects one another significantly.
• Except for tilapia, consumer prices of the farmed species studied are expected to rise faster than the posited inflation rate in the period 2005–2020, meaning that real prices will increase. Increases in the retail prices of farmed products are likely to be passed on in full to the primary markets, and will be beneficial to aquaculture farmers in the country.
• However, there is a need to monitor the effects of aquaculture expansion on farmgate prices, as increasing fish supply from aquaculture may exert a downward pressure on prices. If market prices fall, retailers may easily pass falling prices on to farmers, and hence the farmers’ revenue might fall. Monitoring is especially important to ensure economic viability and growth for new aquaculture enterprises.
• Policies that encourage small-scale farmers to form collective arrangements for marketing could be helpful to achieving equitable revenues for fish farmers.
• There is a need for better storage facilities and transport infrastructure in rural markets for small-scale fish farmers.
• Imported frozen skipjack prices were found to fluctuate relatively less over time when compared with canned tuna prices. Nevertheless, prices in these two series are found to move in a similar fashion.
• With an increase in the price of tuna in the global market, the welfare of tuna fishers in Thailand is expected to improve if stock levels are sustainable.
deveLOped COunTrIeS
Canada:• Species included for analysis (all wild-caught): dogfish (Squalus acanthias),
halibut (Hippoglossus stenolepis), herring (Clupeaharengus pallasi), sablefish (Anoplopoma fimbria), sole (Lepidopsetta bilineata), salmon (Oncorhynchus) and lobster (Homarus americanus).
• Summary statistics show a negative trend in all first-hand prices except salmon. This negative trend continues through to the revenue data for all species except lobster. Unless the cost of effort declines, real profits will continue to fall.

89Summary findings and policy recommendations
• Although dogfish, halibut, sablefish and sole are currently managed by ITQs, it is recommended to consider moving herring to ITQs as well. This could result in improved productivity over time, which may ultimately be reflected in the returns to labour, although the number of fishers may decline.
• Other opportunities for strengthening fishers’ livelihoods and developing new and alternative approaches in terms of sales, marketing and organization should be explored.
• Possibilities include direct sales, in which fishers sell directly to the consumer (thus capturing the most value for their catch); marketing strategies such as labelling to promote quality, origin and freshness; and cooperatives, which can promote sharing of costs and resources, help ensure environmental conservation and enable an exchange of best practices.
Iceland:• Species included for analysis: wild-caught Atlantic cod (Gadus morhua),
wild-caught haddock (Melanogrammus aeglefinus), wild-caught redfish (Sebastes marinus), wild-caught and farmed Greenland halibut (Reinhardtius hippoglossoides) and wild-caught herring (Clupea harengus).
• Concentration in holdings of ITQs has increased over time. In 2007, the 50 largest quota owners had 82 percent of the total quota in all species compared with 60 percent in 1995.
• The large-scale consolidation of the fisheries companies in the last 8–10 years is probably the most important effect of the changes in the macroenvironment of the fisheries sector. The implementation of the ITQ system has contributed to and facilitated this consolidation. Of the 20 publicly listed fisheries companies in 1999, only 9 have survived, with the rest merging with other companies.
• The industry is characterized by a high degree of vertically integrated companies in terms of both fishing and processing. Generally, these are small and medium-sized companies. There are also a few traditional fishing companies with operations in countries outside Iceland.
• It is important to note that the first-sale prices used in the calculations are based on the annual total value of landed catch according to Statistics of Iceland. Hence, the first-sale price is the weighted average price from all landings in Iceland regardless of whether it is from the fish market or from direct sales.
• There has always been a significant difference between the fish market prices and the prices of fish in direct sales (internal sales). The direct sales price is basically an internal pricing, regulated by the semi-official Bureau of Ex-vessel Fish Prices, in which the price is set and changed according to changes in the market price, sometimes with a considerable delay. It is possible to assume that other important cost factors are not included in this price setting, such as direct or indirect costs of quota (leasing or buying). Other cost factors such as handling, grading, logistics and additional services affect the fish market price but not the direct sales price.
• The first-sale price is very sensitive to fuel prices, and most changes in prices from 1993 to 2010 can be linked to fuel prices. Except for herring, a general price trend was traceable for all species in which the price increased gradually until 2006 and then declined sharply from 2008–09.
• The auction price generally tends to be higher than a contractual price or the internal price used by Bureau of Ex-Vessel Fish Prices owing to the fact that the number of buyers is much greater in an auction, which tilts the prices in favour of the sellers.

Value chain dynamics and the small-scale sector 90
• Other lessons learned from the value chains in Iceland include the benefits of direct contact for value creation and efficiency. Direct communication between value chain agents supports better marketing knowledge by the producers and increased understanding of the needs and aims of the producers by the marketing sector.
• Efficiency in the chain is gained through direct ties between producers, foreign wholesalers and secondary processors or retailers with bilateral or trilateral connections and by simplifying or cutting out expendable links in the value chain.
• Key success factors for Iceland’s exports include: reliability in quality and delivery, stability and efficiency, high-tech processing with high material yield, and products targeted to the right markets that meet buyers’ needs.
japan:• Species included for analysis: wild-caught Japanese sardine (Sardinops
melanostictus), wild-caught horse mackerel (Trachurus japonicus), wild-caught Japanese flying squid (Todarodes pacificus), wild-caught skipjack tuna (Katsuwonus pelamis), wild-caught Pacific saury (Cololabis saira), and farmed and wild-caught red seabream (Pagrus major).
• In and before 1994, market power between buyers and sellers depended on the species. After 1994, this dynamic shifted and the market power of buyers increased for all species except saury.
• This shift can be explained by three main factors: the perishable nature of fishery products, the existence of substitute goods, and the imperfect competition in the market caused by the increasing dominance of powerful supermarkets over traditional fishmongers.
• If similar market conditions continue, fishers will be forced to accept their weaker position for these species when compared with their downstream counterparts.
• To reconcile this situation, it is recommended that the fish distribution channel be simplified, with e-commerce suggested as one way, along with efficient collection and transportation methods.
• To address the perishability of products, frozen fish should be promoted more widely. Although defrosted products are more preferable and familiar to consumers, a marketing campaign to promote the freshness of frozen products, as well as the convenience of defrosting fish at home, could help mitigate the concerns.
• Reasons for why market power for saury rests with sellers (supermarkets) were investigated. According to managers and workers in supermarkets and wholesale markets, owing to the significant amount of promotional marketing activities for saury, it is thought of as an attraction item for consumers to supermarkets, and is an easy item to sell. In addition, it is normally purchased as whole product and is convenient for customers to prepare.
norway:• Species included for analysis: wild-caught cod (Gadus morhua) that is salted
and dried for export to Portugal.• Between January 1990 and March 2011, the monthly average price per kilogram
of cod was NOK12.64. The lowest price occurred in June 1996 (NOK8.25), while the price peak occurred in February 1999 (NOK19.69).

91Summary findings and policy recommendations
• While the first-hand price for cod has remained relatively stable since 1994, the export price has fluctuated to a greater extent. However, there is a fairly close relationship between them. The export price has experienced a relatively larger increase compared with the first-hand price, and as such the gap between the two prices has grown larger.
• Analysis of the relationship between the export price and export volume found a weak relationship.
• Generally, in this case study, the relationship between the first-hand price and export price of cod demonstrates a positive correlation.
• In terms of consumer prices in Portugal for value-added fish (salted, dried and smoked fish, shellfish and molluscs), the prices from 2003 to 2008 increased by more than 21 percent. In 2008, consumer prices decreased to the level of 2000, which contributes to explaining the increase in imports in 2009–2010.
Spain:• Species included for analysis: wild-caught hake (Merlucius merlucius),
wild-caught sardines (Sardina pilchardus), wild-caught anchovy (Engraulis encrasicholus), wild-caught blue whiting (Micromesistius poutassou), wild-caught mackerel (Scomber scombrus), farmed rainbow trout (Oncorhynchus mikiss), farmed salmon (Salmo salar) and farmed mussels (Mytilus galloprovincialis).
• The vast majority of the Spanish fleet operates in local fishing grounds and those of the European Union (Member Organization), mostly small-scale. Indeed, more than 95 percent of these boats are less than 11 m long and less than 38 tonnes. Trawling is the most common industrial gear, with 12 percent of the total fleet using this method.
• Increased retail concentration and marketing chain complexity have had the most impact on national seafood trade. In addition, new sources of product and agents are continually evolving, changing the way seafood trade is done and creating constant changes in the value chain.
• The traditional value chain was centralized at the wholesale level in a network known as MERCA, a publicly owned company that concentrates food wholesalers in trading facilities located in every region of the country. However, this has now changed, with retailers and other agents directly accessing products themselves through wholesale platforms outside MERCA.
• Increases in first-hand or farmgate prices have led to increases in wholesale and retail prices. At the first-hand and farmgate level, hake and mussels have decreased in price while the other species (sardine, blue whiting, mackerel, salmon and trout) have all increased in price.
• Six of the eight species (hake, sardines, blue whiting, mackerel, trout, and salmon) have had significant changes in price in the last eight years, with some species experiencing larger variations than others. The most significant variations are due to the origin of the species.
• Despite the differences in the evolution of prices and margins, the contribution of each stage of the chain to the final value of the product has remained stable across species.
• Overall, retailers’ contribution to final product value ranges between 45 and 50 percent. Value added by wholesalers ranges from 11 to 28 percent, although in the case of salmon it drops to 5 percent. Wholesalers’ contribution to the final value is greater in local wild species than in farmed or imported ones. It is also significant in the case of locally farmed species such as trout (15 percent) and mussels (19.1 percent).

Value chain dynamics and the small-scale sector 92
• Imports play an important role by improving price transmission of domestic seafood along the value chain and by preventing price rises in wild-caught fishery products. Domestic fishery or farmed products with a large ratio of imports decreased or stabilized their prices from the first-hand to the retail levels. Although this may benefit traders and consumers, it has negatively affected fishers’ income and will continue to do so.
• Retail prices have experienced the lowest variations in price, which suggests that retailers may be absorbing price increases in order to keep demand and sales, while delaying decreases in order to obtain larger profits when possible.
• Increasing prices of the local wild species make these less attractive for retailers, which have been reducing their margins in the observed years. Without a way to increase their profits, the retailers, especially those in large chains, will probably replace these species with others that have more stable prices, especially those with lower prices.
• In contrast, wild species such as hake and anchovy, which can be supplied with other subspecies from different parts of the world, have stable or decreasing prices and thus will be of greater interest for retailers. These species have the potential to either improve retailers’ profits or at least keep them constant.
• Potential increases in world aquaculture production will continue to reduce and stabilize the prices in the market, making farmed species increasingly attractive for retailers.

93Summary findings and policy recommendations
Tab
le 1
3Su
mm
ary
of
spec
ies
and
pri
ce d
ata
anal
ysed
by
cou
ntr
y
Co
un
try
Spec
ies
Wild
-cau
gh
t (C
) o
r aq
uac
ult
ure
(a
)v
alu
e ch
ain
dat
aTi
me
seri
es o
f p
rice
dat
a
ban
gla
des
hH
ilsa
CW
ho
lesa
le, r
etai
lO
ct 2
005–
Jul 2
010
(mo
nth
ly)
ro
hu
aW
ho
lesa
le, r
etai
lO
ct 2
005–
Jul 2
010
(mo
nth
ly)
Cat
laa
Wh
ole
sale
, ret
ail
Oct
200
5–Ju
l 201
0 (m
on
thly
)
Pan
gas
aW
ho
lesa
le, r
etai
lO
ct 2
005–
Jul 2
010
(mo
nth
ly)
Tila
pia
aW
ho
lesa
le, r
etai
lO
ct 2
005–
Jul 2
010
(mo
nth
ly)
Cam
bo
dia
Ind
on
esia
n s
nak
ehea
dC
/aFi
rst-
han
d, w
ho
lesa
le, r
etai
lJa
n 2
005–
Dec
201
0 (m
on
thly
)
Pan
gas
cat
fish
C/a
Firs
t-h
and
, wh
ole
sale
, ret
ail
Jan
200
5–D
ec 2
010
(mo
nth
ly)
bo
esem
an c
roak
erC
Firs
t-h
and
, wh
ole
sale
, ret
ail
Jan
200
5–D
ec 2
010
(mo
nth
ly)
Kes
CFi
rst-
han
d, w
ho
lesa
le, r
etai
lJa
n 2
005–
Dec
201
0 (m
on
thly
)
Car
pC
Firs
t-h
and
, wh
ole
sale
, ret
ail
Jan
200
5–D
ec 2
010
(mo
nth
ly)
Can
ada
Do
gfi
shC
Firs
t-h
and
, pro
cess
or,
exp
ort
Jan
199
5–M
ar 2
010;
Jan
199
5–D
ec 2
009
(wee
kly/
mo
nth
ly)
Hal
ibu
tC
Firs
t-h
and
, pro
cess
or,
exp
ort
Jan
199
5–M
ar 2
010;
Jan
199
5–D
ec 2
009
(wee
kly/
mo
nth
ly)
Her
rin
gC
Firs
t-h
and
, pro
cess
or,
exp
ort
Jan
199
5–M
ar 2
010;
Jan
199
5–D
ec 2
009
(wee
kly/
mo
nth
ly)
Sab
lefi
shC
Firs
t-h
and
, pro
cess
or,
exp
ort
Jan
199
5–M
ar 2
010;
Jan
199
5–D
ec 2
009
(wee
kly/
mo
nth
ly)
Sole
CFi
rst-
han
d, p
roce
sso
r, e
xpo
rtJa
n 1
995–
Mar
201
0; J
an 1
995–
Dec
200
9 (w
eekl
y/m
on
thly
)
Salm
on
CFi
rst-
han
d, w
ho
lesa
le, p
roce
sso
r, e
xpo
rtJa
n 1
995–
Mar
201
0; J
an 1
995–
Dec
200
9 (w
eekl
y/m
on
thly
)
lob
ster
CFi
rst-
han
d, p
roce
sso
r19
96–2
009
(mo
nth
ly)
gh
ana
Tila
pia
C
/aFi
rst-
han
d, w
ho
lesa
le, r
etai
lN
/a
Tun
aC
Imp
ort
1989
–201
0 (a
nn
ual
)
Ho
nd
ura
sSh
rim
pC
/aW
ho
lesa
le, i
mp
ort
2000
–201
0 (m
on
thly
)
Tila
pia
aW
ho
lesa
le, i
mp
ort
2000
–201
1 (m
on
thly
)
lob
ster
CIm
po
rt20
00–2
011
(3-m
on
th a
vera
ge)
Snap
per
CIm
po
rt20
00–2
011
Icel
and
C
od
CFi
rst-
sale
, dir
ect
sale
, fis
h m
arke
t, e
xpo
rt19
97–2
009
Had
do
ckC
Firs
t-sa
le, d
irec
t sa
le, f
ish
mar
ket,
exp
ort
1997
–200
9
red
fish
CFi
rst-
sale
, dir
ect
sale
, fis
h m
arke
t, e
xpo
rt19
97–2
009
gre
enla
nd
hal
ibu
tC
/aFi
rst-
sale
, dir
ect
sale
, fis
h m
arke
t, e
xpo
rt19
97–2
009
Her
rin
gC
Firs
t-sa
le, d
irec
t sa
le, f
ish
mar
ket,
exp
ort
1997
–200
9
Jap
anJa
pan
ese
sard
ine
CFi
rst-
han
d, w
ho
lesa
le, r
etai
lJa
n 1
976–
Dec
200
9 (m
on
thly
)
Ho
rse
mac
kere
lC
Firs
t-h
and
, wh
ole
sale
, ret
ail
Jan
197
6–D
ec 2
009
(mo
nth
ly)
Paci
fic
sau
ryC
Firs
t-h
and
, wh
ole
sale
, ret
ail
Jan
197
6–D
ec 2
009
(mo
nth
ly)
Flyi
ng
sq
uid
CFi
rst-
han
d, w
ho
lesa
le, r
etai
lJa
n 1
976–
Dec
200
9 (m
on
thly
)
red
sea
bre
amC
/aFi
rst-
han
d, w
ho
lesa
le, r
etai
lJa
n 1
976–
Dec
200
9 (m
on
thly
)
Skip
jack
tu
na
CFi
rst-
han
d, w
ho
lesa
le, r
etai
lJa
n 1
983–
Dec
200
9 (m
on
thly
)

Value chain dynamics and the small-scale sector 94
Tab
le 1
3 (c
on
tin
ued
)
Co
un
try
Spec
ies
Wild
-cau
gh
t (C
) o
r aq
uac
ult
ure
(a
)v
alu
e ch
ain
dat
aTi
me
seri
es o
f p
rice
dat
a
Ken
yaN
ile p
erch
CFi
rst-
han
d, e
xpo
rt19
96–2
010
Silv
er c
ypri
nid
C
Firs
t-h
and
, exp
ort
1996
–201
0
Nile
tila
pia
CFi
rst-
han
d, e
xpo
rt19
96–2
010
lob
ster
CFi
rst-
han
d20
01–2
009
(mo
nth
ly)
Mal
div
esTu
na
CFi
rst-
han
d, e
xpo
rtJa
n 2
005–
Dec
201
0 (m
on
thly
)
No
rway
C
od
CFi
rst-
han
d, e
xpo
rt, r
etai
lJa
n 1
990–
Mar
201
1 (m
on
thly
)
Peru
Sh
rim
pa
Wh
ole
sale
, exp
ort
, im
po
rt20
08–2
010;
200
0–20
10 (
mo
nth
ly)
Scal
lop
sa
Wh
ole
sale
, exp
ort
, im
po
rt20
00–2
010
Tro
ut
aW
ho
lesa
le, e
xpo
rt, i
mp
ort
2000
–201
0
Peru
vian
an
cho
vyC
N/a
N/a
Spai
nH
ake
CFi
rst-
han
d, w
ho
lesa
le, r
etai
l20
04–2
011
(mo
nth
ly)
Sard
ines
CFi
rst-
han
d, w
ho
lesa
le, r
etai
l20
04–2
011
(mo
nth
ly)
an
cho
vyC
Firs
t-h
and
, wh
ole
sale
, ret
ail
2004
–201
1 (m
on
thly
)
blu
e w
hit
ing
CFi
rst-
han
d, w
ho
lesa
le, r
etai
l20
04–2
011
(mo
nth
ly)
Mac
kere
lC
Firs
t-h
and
, wh
ole
sale
, ret
ail
2004
–201
1 (m
on
thly
)
rai
nb
ow
tro
ut
aFi
rst-
han
d, w
ho
lesa
le, r
etai
l20
04–2
011
(mo
nth
ly)
Salm
on
aFi
rst-
han
d, w
ho
lesa
le, r
etai
l20
04–2
011
(mo
nth
ly)
Mu
ssel
sa
Firs
t-h
and
, wh
ole
sale
, ret
ail
2004
–201
1 (m
on
thly
)
Thai
lan
dV
ann
amei
sh
rim
pa
Farm
gat
e, w
ho
lesa
le, r
etai
l20
05–2
010
(mo
nth
ly)
Tila
pia
aFa
rmg
ate,
wh
ole
sale
, ret
ail
2003
–201
0 (m
on
thly
)
Wal
kin
g c
atfi
sha
Farm
gat
e, w
ho
lesa
le, r
etai
l20
03–2
010
(mo
nth
ly)
Seab
ass
aFa
rmg
ate,
wh
ole
sale
, ret
ail
2005
–201
0 (m
on
thly
)
Tun
aC
exp
ort
, im
po
rt20
05–2
010
(mo
nth
ly)
Ug
and
aN
ile p
erch
CFi
rst-
han
d, w
ho
lesa
le, p
roce
sso
r, e
xpo
rt, r
etai
lJa
n 2
006–
Dec
201
0 (m
on
thly
)
Mu
ken
eC
Firs
t-h
and
, wh
ole
sale
, pro
cess
or,
ret
ail
Jan
200
6–D
ec 2
010
(mo
nth
ly)
bag
rus
CFi
rst-
han
d, w
ho
lesa
le, p
roce
sso
r, r
etai
lJa
n 2
006–
Dec
201
0 (m
on
thly
)
Tila
pia
C/a
Firs
t-h
and
, wh
ole
sale
, pro
cess
or,
ret
ail
Jan
200
6–D
ec 2
010
(mo
nth
ly)
afr
ican
cat
fish
C/a
Firs
t-h
and
, wh
ole
sale
, pro
cess
or,
ret
ail
Jan
200
6–D
ec 2
010
(mo
nth
ly)
Sou
rce:
©Fa
O (
2013
).

95
11. Conclusions
OveraLL fIndInGS and pOLICy reCOmmendaTIOnSAlthough the sections above provide findings and policy implications that are country-specific, many of the conclusions were found to be common across nations. Thus, in this section, overall recurring themes and policy recommendations that emerged as similar and even consistent across countries are presented and discussed. Although many of these policy recommendations are not directly related to food security, they all have the potential to improve food security indirectly through increased income and improved livelihoods. Differences between developed and developing countries are also included for general discussion.
As 14 countries were included in the overall project, with geographic locations spanning Asia, Africa, Europe, Latin America and North America, each value chain differed significantly. While some value chains were solely export driven, others were only for domestic consumption and still others targeted both. Moreover, production methods were on a wide spectrum of scales and employed a range of gear types, from traditional canoes to modern industrial trawlers. Similarly, for aquaculture, production systems ranging from very small-scale to commercial large-scale operations were included. Although there was some overlap in terms of species analysed, most species were unique to their country. Last, each country had its own data limitations, which led the depth of findings to vary.
Despite these innate differences in the value chains themselves and the distinct datasets available for the countries, recurring themes related to distributional benefits in the small-scale value chain emerged. First and foremost, the case studies found that, relative to other players in the value chain, small-scale fishers and fish farmers are receiving the least economic benefits in terms of amount of money earned for their products. Processors and retail markets were found to be receiving more of the distributional benefits of the value chain owing to their stronger bargaining power. In some cases, the disparities in terms of earnings were considerable. In Kenya for example, the average earnings for exporters of Nile perch were found to be an average of 250 percent more than the fishers’ earnings.
Following this overall finding, policy recommendations focused on how to provide more support for small-scale fishers and fish farmers and how to help them obtain more value for their product. Several policy recommendations were consistent or similar across a number of countries, and these are presented below. For more country-specific policy recommendations, readers may refer to the above country specific sections or visit the Fisheries and Aquaculture Value Chain web page11 to download in-depth country case study reports.
Policy recommendation 1: Increased governmental, NGO and private-sector support is a prerequisite for the small-scale fisheries and aquaculture sector to achieve more equitable distribution of benefits. Although general, this recommendation is a requirement for all other policy recommendations to be feasible. It should be targeted in four main areas: technical training, infrastructure needs, finance, and research and development. In terms of training and infrastructure, some examples of needs can be seen in Ghana and Thailand. In Ghana, it was recommended that national and local government as well as NGOs should provide support for educational training on
11 www.fao.org/valuechaininsmallscalefisheries/background1/en/

Value chain dynamics and the small-scale sector 96
international market requirements and certification, hygienic practices and reduced post-harvest losses. Appropriate storage facilities were also noted as being needed. In Thailand, this need for better storage facilities was highlighted as well, particularly for rural markets. With the current lack of storage, fish farmers in rural Thailand often have to sell their products in an unfavourable market owing to their inability to keep fish preserved until conditions become more favourable.
In terms of financing, the case study in Peru found the need to increase financial support for small-scale fish farmers to help deal with cash-flow constraints and support the development of a comprehensive cold-chain distribution system as well as a marketing agenda. Although there is currently some governmental training and financial support available, it was found to be a modest amount of public funding that, coupled with the bureaucracy involved, limited its accessibility. Research and development for new value-added and/or created products was also an important need, especially in countries where growing economies are opening up new opportunities for seafood products. For example, in Honduras, the analysis found that producing more value-added products with high-quality standards would be key to keep the sector growing and creating new livelihoods. Part of governmental support may also lie in limiting or reducing unnecessary fee systems. In Cambodia, the analysis found that all chain agents usually incur some type of fee during business transactions, which reduces profit margins and restricts access for the most vulnerable.
Policy recommendation 2: Organizational models and agreements should be introduced and supported to help the small-scale sector increase its price negotiation power and share resources. In order to achieve this, support from governments, protection by legislation and incentivizing (or even mandating) participation in organizational models such as selling desks, private/public partnerships and cooperatives should be considered. This recommendation should be led by national governments and international agencies. Examples of successful organization models could be borrowed from other countries, such as how first-hand markets were previously organized in Norway and Spain, and how sales organizations have developed and functioned in different market situations. The case studies presented a range of models that could be used for the sector to become more organized, including: cooperatives, single seller desks, and cooperation between agents in the value chain. The type of model to be adopted was seen as dependent on what would be most beneficial and adaptable to the local context, noting that organizational models may not be feasible in all environments.
For example, in Maldives, the existing structure of the tuna fishery is such that many small-scale fishers are selling to only two processors, which gives buying power to the latter and allows them to increase their share of profits at the expense of the fishers. It was recommended that the small-scale fishers create a single seller operation where all fish harvested is marketed through a single desk, with prices set in a cooperative manner to benefit both parties. In addition, trade-offs between fuel subsidies and the first-hand price offered by the government-owned processor should be explored. Similarly, in Uganda’s small-scale Nile perch sector, the small number of processing firms makes it possible for a single selling desk to represent the interests of the fishers. Even when fish prices were expected to increase owing to growing market demand, case studies predicted that fishers/farmers would still receive the least benefits, due in part to this disorganization. One example of this was in the capture value chain in Bangladesh, where the analysis projected that the retail price of a local fish (hilsa) was expected to increase by about 5–6 percent annually. However, instead of fishers realizing this price gain, retailers were the ones most likely to benefit. Again, it was recommended that hilsa fishers become organized in order to more equally receive their fair share of expected price increase. Small-scale fish farmers in Bangladesh were

97Conclusions
found to receive a higher price for their fish than their fisher counterparts, probably due in part to their better organization.
In Kenya, where a notable disparity was found for income received from Nile perch when comparing first-hand with export prices, it was recommended that fish action centres be developed, which could provide organizational training for fishers to help them increase their bargaining power as well as provide necessary infrastructure for them, so they are not reliant on a third party. The Kenya case study also had a unique recommendation regarding organization; that is, all agents in the value chain should be engaged in order to address the concept of benefit sharing, which is central to the concept of value chains themselves. What form this engagement would take remains to be seen, but the concept of bringing all agents together may be an important prerequisite to obtaining fairer pricing for fishers and fish farmers.
One example of this type of engagement that could possibly be replicated is in Peru, where success has been documented in engaging small-scale and industrial agents in the shrimp, scallop and trout farming sectors. A few large trout companies have provided technical assistance and credit to small producers, with the small companies then selling their harvest to the large companies for a higher price than they would have been able to obtain otherwise. Agreements observed between them have not been based on formal contracts, but rather on long-term relationships between a buyer (integrated trout producer) and seller (small-scale trout farmer). As demonstrated in this case of Peru, becoming more organized could also help fishers and fish farmers to access new markets. In addition, cooperatives and single seller desks could help the sector participants aggregate their catch regularly, allowing them to sell to supermarket chains and institutional markets with a consistent supply of product. However, for organization to be feasible and successful, there will need to be effective governance at the local, regional and national level.
Many other themes related to achieving fairer pricing for small-scale fishers and fish farmers emerged from the analysis. Some of the main themes are: adopting standard pricing methods, improving technology capabilities, and marketing.
Policy recommendation 3: Fishers, fish farmers and small-scale traders should be assisted in adopting more consistent pricing methods and documenting expenses and net profit. In addition, prices need to be made more transparent and accessible to all chain agents. This recommendation could be driven by national governments and institutions such as agricultural extension, as well as NGOs, international organizations and development agencies. In many of the developing country case studies, it was found that fish price is dependent on a wide range of variables beyond the control of fishers, such as bargaining power and market conditions. This is especially problematic as the most vulnerable populations have the least control over these variables and are left feeling disempowered by their livelihoods.
Adopting standard pricing methods locally or even regionally could be one step to help producers know how to set a fair price for their products, help establish more consistency in profits over time and achieve more equal negotiating power between sellers and buyers. Pricing methods could be by weight, bags, hands, or whatever measurement is most accessible to local stakeholders. Training in consistent pricing methods and supplies such as weight-scales or other measurement devices could help provide an initial first step. Although market variables beyond the control of fishers or fish farmers will continue to be present, training to promote documentation of expenses and net profit could help fishers and fish farmers become aware of seasonal patterns and market trends over time. Moreover, where possible, more transparent pricing could lead to a better functioning market with reduced price fluctuations, as this information can be used as leverage for agents in their price negotiations. One example of a method for disseminating information on prices is through the radio,

Value chain dynamics and the small-scale sector 98
as there has been success documented in Mozambique, where the local radio station broadcast fish prices every Friday.
Policy recommendation 4: Provide a policy and financial environment conducive to establishing new small-scale fish farms and adopting appropriate and sustainable farming methods. Case studies found that this will be crucial to the small-scale aquaculture sector’s long-term sustainability and further development. This environment should be provided by national governments and international governmental bodies such as FAO as well as NGOs. For example, in Cambodia, it was recommended that appropriate aquaculture technologies for raising snakehead and pangasius be adopted. It was also found that fish farmers need to move towards using sustainably sourced pellet feed for fish food instead of low-value fish. Adopting these practices would reduce fish mortality rates, improve the quality of fish and avoid the depletion of low-value fish, which are highly nutritious and could be promoted for DHC use instead. In addition, the case study pointed out that more opportunities to establish start-up farms are needed. Indeed, it is vital that aquaculture not only supports a highly consolidated industry, but also maintains room for small-scale, diversified fish farms. This recommendation could be partially enabled by providing low-interest loans, access to credit and/or microgrants to foster investment and start-up farms while encouraging sustainable farming methods by providing funds to help supplement the cost. However, careful research is needed when deciding to establish new fish farms. Land and water availability must be ensured, and thorough consideration must be given to analysing how the proposed increased competition will affect existing aquaculture farms.
Policy recommendation 5: There is a need for an increased focus on the promotion and marketing of fish and fishery products, especially in countries that currently have low domestic consumption rates. Promotion of domestic markets should be based on estimates for domestic demand of fish and fish products. Where no reliable estimates exist, market surveys are an important first step for this recommendation. Again, national governments could play an important role here as well as local universities, NGOs and FAO. This recommendation stems from a major case study finding indicating that marketing is crucial not only to developing a domestic market for small-scale producers but also to helping countries achieve improved food security and nutrition. For many developing countries, marketing is something that has not been developed at all and has been difficult given the lack of perceived buying power in the domestic market as well as the lack of infrastructure, such as cold-chain distribution, storage, etc. However, the perception of a lack of buying power may be false; in Honduras, the case study found the local market to have significant potential, and as such recommended that fish be domestically promoted. The study found that the lack of marketing might be one of the major reasons why the domestic market has been unable to expand and explains why most snapper fish is exported. Some marketing and promotion techniques should be employed by the fishers and fish farmers themselves and only in countries where marketing infrastructure is already well founded, such as with labelling strategies to denote quality and origin. In addition, governments should undertake campaigns targeted at increasing local consumption. Careful research on successful marketing strategies and the costs and benefits to fishers and fish farmers must be conducted. This recommendation must be coherent with policy recommendation 1, especially regarding securing proper infrastructure and training to supply local or domestic markets with fish of good quality.
Policy recommendation 6: New markets for the small-scale sector should be researched and developed. In particular, domestic markets in developing countries need to be explored. Factors influencing exports and the cost of the domestic market need to be researched and taken into account. In some countries, it can be easier to export to a foreign country than to market fish and fish products within

99Conclusions
national boundaries, especially where infrastructure and distribution systems are poor or absent. However, the case studies did find that domestic markets had strong potential. Although the analysis demonstrated that international market prices for export products are usually higher than domestic market prices for local consumption, the difference was often substantially less significant than the authors presupposed. In fact, in some cases, the domestic market price was equal to or more lucrative than the international market price. This finding underlies the significant expense of transportation and transaction costs when exporting to international markets, making domestic markets at times more profitable. For example, in Honduras, wholesale prices for shrimp were 20 percent higher than export prices to the European Union (Member Organization) from January 2007 to December 2008. This was also found with tilapia fillets, as the domestic market gave a price that was 11 percent higher than the United States import price. The finding was probably due to the fact that domestic buyers in the country are dominated by restaurants and hotels, which are willing to pay prices similar to the international market prices. The analysis concluded that this finding should be interpreted with caution as the small size of the domestic market limits the potential for increased sales in the short term, so that producers need to find the most profitable balance in terms of supplies to the domestic and the export markets. However, it is a vital finding for the future, as growth in fish consumption is expected to be driven largely by domestic markets in developing countries.
In the analysis on Peru, findings demonstrated that although domestic prices are generally less than export prices, they vary widely within the country. The analysis reported that export prices for anchovies, scallops, shrimp and trout were sometimes 50 percent higher for export prices than domestic wholesale price; however, this difference was found for rural, domestic markets close to aquaculture production centres or fishing ports. Further research found that domestic markets in large cities could actually pay significantly higher prices compared with these rural markets, prices that are much closer to the export price. Nonetheless, much of the production is currently sold in these rural areas as fishers and fish farmers face distributional barriers and thus cannot reap the greatest profit for their catch. Therefore, developing and improving distribution channels is vital in supporting the development of a domestic market. However, lower prices in the rural market may secure fish at affordable prices for the rural population. The creation of a more functional market, without securing growth in wealth for the rural population or a fair distribution of profits in the value chain, could lead to a worsened food security situation in rural communities. Hence, food security should be monitored in these rural areas when efforts to develop markets are planned and carried out.
In Kenya, where it was found that small-scale fishers of Nile perch and lobster received a small fraction of the proceeds compared with what exporters received, the development of a non-export value chain was also encouraged as a way to enhance income for small-scale fishers and traders. It was noted that the potential for a domestic and regional fish market is largely unexploited and could also offer an opportunity for new product development. Overall, the potential for producers to better penetrate domestic markets also highlights the need to market and promote local fish consumption.
Policy recommendation 7: Improved national and international management regimes should be developed and implemented to protect marine, river and lake ecosystems. Management should be aimed at achieving optimal sustainable yields from fish stocks and identifying areas suitable for sustainable aquaculture. Good practices for fisheries comanagement should be developed, implemented, evaluated and documented by national governments in order to sustain the small-scale value chain in the long term. Securing sustainable fisheries and aquaculture production at an optimal level are necessary to secure long-term supply in the value chain and

Value chain dynamics and the small-scale sector 100
ultimately food security. Examples of well-functioning national management plans, regulatory frameworks for aquaculture and international cooperation for managing shared stocks should be described and made available to developing countries to aid in the development of suitable models, which could be adapted to the local context. Compared with utilizing a top-down management approach, comanagement is suggested as including fishers has been an indicator of success in numerous countries. In Cambodia, it was recommended that wild fish stock and other aquatic resources be managed effectively by prohibiting and putting high pressure on all IUU fishing or any activity that harms natural resources in an unsustainable manner. In Uganda, the analysis clearly pointed to the importance of shared fishery resources in Lake Victoria being managed cooperatively with Kenya and the United Republic of Tanzania. Management recommendations also included subsidy reduction and exploring the potential for complementary livelihood activities. In Maldives, the analysis found that subsidies for fuel should be reduced or avoided as they are currently distorting the economic incentives facing fishers and result in increased fishing effort above the efficient level of harvesting. Instead, the analysis suggested that it may be prudent to investigate possible complementary livelihood activities there in order to take pressure off the fishery and sustain its resources for the long term. Complementary activities were also suggested in Honduras by promoting fisheries tourism, which could provide diversified income streams and help fisheries where growth is constrained by overfishing. Similar considerations apply to aquaculture in terms of ensuring a sustainable development of the industry, and it is important to include fish farmers as stakeholders in this development.
Policy recommendation 8: Local food security should be a major consideration in developing markets for fish and fish products as well as management plans and regulatory frameworks for fish stocks and aquaculture. Initiatives taken to develop markets might deprive locals from affordable food in the short run. Sustainable management schemes often require regulatory measures to rebuild fish stocks that could negatively affect fishers’ income. However, this may be compensated by higher catches in the future. Under these circumstances, rural communities dependent on subsistence fisheries should be protected, in the short run as well as the long run.
In the long term, both the development of value chains and rebuilding of fish stocks should benefit the local population, both in terms of livelihoods and food security. However, in the short term, management measures or bringing fish to national and/or international markets might cause shortages in the local food supply. It is probable that parts of the population will not have sufficient buying power to purchase alternative food at world market prices or prices obtained in the more affluent part of the domestic market. Therefore, securing sufficient nutrition for the most vulnerable parts of the population must be considered in order to ensure local support and legitimacy for initiatives regarding market development and management plans.
Similarities and differences between the small-scale sector in developing countries and the large-scale sector in developed countries were found when comparing case studies. Even given the innate differences between countries and value chains, there were many similarities. Both types of markets are composed of a mix of local and imported fish and fishery products and are made up of a complex array of agents, enterprises and institutions, although they vary in scale and scope. Retail chains or supermarkets play an important role in fish and seafood retailing in developed countries while direct fishers’ markets or individual fishmongers are vital for markets in developing countries. Institutional markets (hospitals, the armed forces, schools, etc.) and the hospitality sector play an important role in most countries, both developed and developing. Finally, it is vital that fisheries in both developed and developing countries are based on sound resource management.

101Conclusions
Many differences were also found, particularly the fact that developing countries lack many of the institutions found in developed countries, such as a relatively well-functioning market, anti-trust authority, regulations, hygiene, standardized contracts, market information, and a well-functioning banking system. Developing countries have significantly less of a focus on processing and marketing, explaining in part the fact that they are mostly exporting raw commodity products. The domestic market is also often less developed, particularly because restaurant and institutional markets are less developed owing to lower disposable income. Moreover, certification and quality assurance requirements for the domestic markets have been poorly applied in many developing countries.
areaS fOr furTher reSearChOverall, this project provides the international development, research, academic, governmental and NGO sectors with a wealth of information. Data collected and findings are particularly significant for small-scale value chains in developing countries, where previously little to no information on their functional mechanisms or price transmission relationships existed.
At the outset, it is appropriate to point out that limited data availability imposed severe restrictions on what kind of price analyses could be undertaken. FAO, in collaboration with its Members, may wish to consider whether, in the future, systematic price data should be collected for a representation of value chains.
Lessons learned from the analysis demonstrate excellent entry points for national governments and organizations such as FAO, the International Fund for Agricultural Development, and the World Bank to provide policy support, technical trainings and/or infrastructure. However, the findings also highlight a range of areas where further research and analysis are needed. These areas include: the role of trade in local food security and sovereignty; the viability of domestic markets; possibilities for innovative value chains; the costs and benefits of certification schemes and other marketing tools; organizational models for organizing the value chain with an emphasis on the first-hand market; institutional models to support and monitor sustainable fisheries and aquaculture production; and methods of good governance in national and international management of fish stocks and areas for aquaculture, including methods and models for comanagement. A final recommendation for future research includes a strategic comparison of value chains in developed and developing countries. This should also be supplemented with analyses of good practices for transfer of knowledge both to national institutions as well as local organizations and communities.
First and foremost, although the analysis provided an important look at how the small-scale fisheries and aquaculture sector can improve local food security, more overall research is needed. While literature on the impact of international trade on food security does exist, it would be helpful for future research to focus more specifically on small-scale value chains in fisheries and aquaculture, particularly because seafood is one of the most highly traded food commodities in the world with the small-scale sector providing about half of world fish production.
In terms of other areas, more research is needed to explore the potential profitability of the local and regional markets in developing countries as well as the level of investment needed to promote domestic production and consumption. Instead of focusing solely on international trade, further analysis could build upon this research to demonstrate specific entry points for fishers and fish farmers in their own domestic markets. Identifying viable domestic opportunities is also highly needed in developed countries, where the small-scale fisheries sector is often portrayed as suffering under pressure from cheaper low-value imports, rising fuel prices and increased regulations. However, it is vital for participants in the small-scale sector to move beyond focusing on the negative and instead recognize ways in which they can bring more value to their

Value chain dynamics and the small-scale sector 102
products. Research in developed countries should then focus on exploring innovative value chains, in which fishers could create, add and market a unique value in order to obtain higher prices and thereby protect their livelihoods. Currently, some methods that are already being conducted but warrant further research include: labelling strategies, certification schemes, local direct sales and promotion of underutilized species. Research should also examine prerequisites needed for such marketing methods to have the desired impact.
Additional research is needed to strengthen three other recommendations made in the analysis. First, although a major finding stated a need for an increased focus on marketing in the small-scale sector, it is crucial that further analysis is conducted on its costs, benefits and overall trade-offs. This is especially true where developing countries aim to access international markets through certification or using other marketing schemes. If the costs of the schemes are unknown, it is difficult to quantify realistically the economic benefits of accessing these markets. Second, although a recommendation focused on the need to introduce more organizational models for small-scale fishers and fish farmers, analysis is needed to determine which types of models would be most effective in a given culture or business environment. This analysis will be needed at the national, regional or even local level, as there is no “one size fits all” approach. Although cooperatives are often cited as a successful organizational model, other arrangements such as cooperation between the large-and small-scale sectors should also be explored. Analysis of various models could provide examples of best practices, in which success stories where equitable and win-win relationships are highlighted. Moreover, these success stories could serve as examples to be replicated elsewhere.
In terms of the comanagement recommendation to sustain the small-scale sector in the long term, effective methods of comanagement need to be explored at the subnational level to determine which can best manage and protect natural fishery resources while involving local stakeholders as well as ensuring a sustainable development of aquaculture. Comanagement is especially essential as working with local communities and stakeholders thereby transfers part of the burden of management, control and enforcement to the communities themselves. These communities have an impetus to act as they are dependent on these resources for their livelihoods. Although transitioning from top-down management approaches to a new model will take time, political will and resources, it is crucial for the long-term viability of both domestic and international seafood production and trade, regardless of the size of scale.
Finally, although the project provided an overall comparison of small-scale value chains in developed and developing countries, further analysis could be strategic about identifying successes in management systems, regulatory frameworks and market structures that have benefited small-scale fishers and fish farmers in developed countries and could be applied in a developing country setting. Moreover, lessons learned in terms of policies and practices that have negatively affected fishers and fish farmers should be discussed as well. This comparison analysis should particularly focus on the relations among agents in the value chain within the market structure as a critical indicator of success. Special attention needs to be paid to sustainability. Many fish stocks are currently overexploited. This implies that harvests need to be reduced in a transitional period to allow stocks to rebuild. The interests of the small-scale sector must be safeguarded in this process. Another area where this is the case is in terms of distribution of benefits. This is becoming of ever greater importance owing to the increased level of concentration at the retail level in important consumer countries.
103
references
Asche, F., Oglend, A. & Tveteras, S. 2013. Regime shifts in the fish meal/soybean meal price ratio. Journal of Agricultural Economics, 64(1): 97–111.
Asche, F., Bennear, L.S., Oglend, A. & Smith, M.D. 2011. U.S. shrimp market integration. Marine Resource Economics, 27(2): 181–192.
Badaracco, J. 1991. The knowledge link: how firms compete through strategic alliances. Boston, USA, Harvard Business School Press.
Beltrán, C. 2011. Value chain analysis of international fish trade and food security in the Republic of Honduras. FAO Value Chain Project Reports. Rome, FAO. 74 pp. (also available at www.fao.org/valuechaininsmallscalefisheries/participatingcountries/honduras1/en/).
Berkes, F., Mahon, R., McConney, P., Pollnac, R. & Pomeroy, R. 2001. Managing small-scale fisheries. Alternative directions and methods. Ottawa, International Development Research Centre.
Capps, O. & Sherwell, P. 2007. Alternative approaches in detecting asymmetry in farm-retail price transmission of fluid milk. Agribusiness, 23(3): 313–331.
Central Intelligence Agency (CIA). 2013. The World Factbook. In: CIA [online]. Washington DC. [Cited 22 April 2013]. https://www.cia.gov/library/publications/the-world-factbook/index.html
Chuenpagdee, R., Liguori, L., Palomares, M.L.D. & Pauly, D. 2006. Bottom-up, global estimates of small-scale marine fisheries catches. Fisheries Centre Research Reports 14(8). Canada, University of British Colombia.
De Silva, D. 2011. Value chain of fish and fishery products: origin, functions and application in developed and developing country markets. FAO Value Chain Project Reports. Rome, FAO. 63 pp. (also available at www.fao.org/valuechaininsmallscalefisheries/projectreports/en/).
De Silva, D.A.M. & Yamao, M. 2006. The involvement of female labor in seafood processing in Sri Lanka: impact of organizational fairness and supervisor evaluation on employee commitment. In: Proceedings of the seventh Asian Fisheries Forum, December 1-2, 2004, Penang, Malaysia: First World Symposium on Gender and Fisheries. Selangor, Malaysia, Asian Fisheries Society. 14 pp.
Dey, M.M., Alam, M.F., Ferdinand, J. & Paraguas, F.J. 2011. A multistage budgeting approach to the analysis of demand for fish: an application to inland areas of Bangladesh. Marine Resources Economics, 26(1): 35–38.
Dey, M.M., Briones, R.M., Garcia, Y.T., Nissapa, A., Rodriguez, U.P., Talukder, R.K., Senaratne, A., Omar, I.H., Koeshendrajana, S., Khiem, N.T., Yew, T.S., Weimin, M., Jayakody, D.S., Kumar, P., Bhatta, R., Haque, M.S., Rab, M.A., Chen, O.L., Luping, L. & Paraguas, F.J. 2008a. Strategies and options for increasing and sustaining fisheries and aquaculture production to benefit poorer households in Asia. Studies and Reviews No. 1823. Penang, Malaysia, WorldFish Center.
Dey, M.M., Garcia, Y.T., Kumar, P., Piumsombun, S., Haque, M.S., Li, L., Adam, A., Senaratne, A., Khiem, N.T. & Koeshendrajana, S. 2008b. Demand for fish in Asia: a cross-country analysis. Australian Journal of Agriculture and Resource Economics, 52(3): 321–228.
Edwards, P. 1999. Aquaculture and poverty: past, present and future prospects of impact. Discussion paper prepared for the 5th Fisheries Development Donor Consultation, Rome, Italy, February 22-24, 1999. Pathumthani, Thailand, Aquaculture and Aquatic Resources Management, Asian Institute of Technology.

Value chain dynamics and the small-scale sector 104
Einarsson, Á. 2003. Íslenskur sjávarútvegur – Breytingar síðustu áratugi og afkomumælingar. In I. Hannibaldsson, ed. Rannsóknir í Félagsvísindum (IV). Reykjavík, Félagsvísindastofnun Háskóla Íslands, Háskólaútgáfan.
FAO. 2000. The State of World Fisheries and Aquaculture 2000. Rome. 142 pp. (also available at www.fao.org/docrep/003/X8002E/x8002e00.htm).
FAO. 2004. Responsible fish trade and food security: toward understanding the relationship between international fish trade and food security. FAO report of the study on the impact of international trade in fishery products on food security. Rome. 109 pp. (also available at www.tradefoodfish.org/images/iitfpfs2.PDF).
FAO. 2010. The State of World Fisheries and Aquaculture 2010. Rome. 197 pp. (also available at www.fao.org/docrep/013/i1820e/i1820e.pdf).
FAO. 2011. Discussion document: towards voluntary guidelines on securing sustainable small-scale fisheries 2011. Rome. 49 pp. (also available at ftp://ftp.fao.org/Fi/DOCUMENT/ssf/SSF_guidelines/DiscussionDocumentSSFGuidelinesJune2011.pdf).
FAO. 2012a. The State of Food Insecurity in the World 2012. Rome. 61 pp. (also available at www.fao.org/docrep/016/i3027e/i3027e00.htm).
FAO. 2012b. The State of World Fisheries and Aquaculture 2012. Rome. 209 pp. (also available at www.fao.org/docrep/016/i2727e/i2727e00.htm).
FAO & WorldFish Center. 2008. Small-scale capture fisheries: a global overview with emphasis on developing countries: a preliminary report of the Big Numbers Project. The WorldFish Center Working Paper, No. 37, 878. Penang, Malaysia. 38 pp. (also available at www.worldfishcenter.org/resource_centre/WF_1085.pdf).
Gordon, D.V. 2010. The retail demand shift variable and marketing cost index: fish supply chain in Canada: FAO Value Chain Project Reports. Rome, FAO. 15 pp. (also available at www.fao.org/valuechaininsmallscalefisheries/participatingcountries/canada/en/).
Government of Kenya. 2007. Fisheries Statistical Bulletin. Kenya, Ministry of Fisheries Development.
Government of Kenya. 2008. National Oceans and Fisheries Policy. Kenya, Ministry of Fisheries Development.
Jacquet, J. & Pauly, D. 2008. Funding priorities: big barriers to small-scale fisheries. Conservation Biology, 22(4): 832–835.
Jacquet, J., Fox, H., Motta, H., Ngusaru, A & Zeller, D. 2010. Few data but many fish: marine small scale fisheries catches for Mozambique and Tanzania. African Journal of Marine Science, 32(2): 97–106.
Johnson, D.S. 2006. Category, narrative and value in the governance of small-scale fisheries. Marine Policy, 30: 747–756.
Kawarazuka, N. 2010. The contribution of fish intake, aquaculture, and small-scale fisheries to improving nutrition: a literature review. Working Paper, No. 2106. Penang, Malaysia, WorldFish Center.
Keithly, W.R. & Poudel, P. 2008. The Southeast U.S.A. shrimp industry: issues related to trade and antidumping duties. Marine Resource Economics, 23(4): 439–463.
Knútsson, Ö. 2001. Strategic alliances; The role of central firm in governing strategic alliances between small and medium size companies; the case in the Icelandic fish industry [online]. University of Edinburgh. [Cited 22 April 2013]. http://staff.unak.is/hreidar/Skjol/Ogmundur_Phd_Thesis.pdf
Knútsson, Ö. & Gestsson, H. 2006. The Icelandic fishing industry: a comprehensive overview until the end of 2001. Working Paper, 06:01. Akureyri, Iceland, University of Akureyri.
105References
Knútsson, Ö., Klemensson, Ó. & Gestsson, H. 2008. Structural changes in the Icelandic fisheries sector - a value chain analysis. In A.L. Shriver, comp. Proceedings of the Fourteenth Biennial Conference of the International Institute of Fisheries Economics & Trade, July 22-25, 2008, Nha Trang, Vietnam: Achieving a Sustainable Future: Managing Aquaculture, Fishing, Trade and Development. Corvallis, USA, International Institute of Fisheries Economics & Trade. 12 pp.
Lou, S. 2009. Changes in fresh seafood distribution system and supply chain building. Food Systems Research, 16(2): 59–73.
Manyala, J.O. & Gitonga, N. 2008. Omena marketing study in the major urban centres in Kenya. Kenya, GTZ-PSDA Commissioned Study Report.
Martínez-Espinosa, M. 1997. Expert Consultation on Small-Scale Rural Aquaculture 1997. FAO Fisheries Report No. 548. Rome, FAO. (also available at www.fao.org/docrep/005/w5171e/W5171e22.htm).
McMahon, T. 2013. Oil prices 1946-present. In: Inflationdata.com [online]. [Cited 20 April 2013]. www.inflationdata.com/inflation/inflation_rate/historical_oil_prices_table.asp
Ministry of Fisheries and Agriculture. 2009. Basic fisheries statistics. Maldives. Nielsen, M., Setala, J., Laitinen, J., Saarni, K., Virtanen J. & Honkanen, A. 2007. Market
integration of farmed trout in Germany. Marine Resource Economics, 22(2): 195–213.Norman-López, A. & Asche, F. 2008. Competition between imported tilapia and US
catfish in the US market. Marine Resource Economics, 23: 199–214.Norman-López, A. & Bjørndal, T. 2009. Is tilapia the same product worldwide or are
markets segmented? Aquaculture Economics and Management, 13: 138–154.Ogutu-Ohwayo, R. 1999. Deterioration in length–weight relationships of Nile perch,
Lates niloticus L. in lakes Victoria, Kyoga and Nabugabo. Hydrobiologia, 403: 81–86.Organisation for Economic Co-operation and Development (OECD). 2012. Making
global value chains accessible to all. Paris. (also available at www.oecd.org/dac/aft/MakingGlobalValueChainsAccessible_Web_USB.pdf).
Sharma, C. 2003. The impact of fisheries development and globalization processes on women of fishing communities in the Asian region. Asia-Pacific Research Network Journal, 8: 1–12.
Shrestha, M.K. & Pant, J., eds. 2012. Small-scale Aquaculture for Rural Livelihoods: Proceedings of the National Symposium on Small-scale Aquaculture for Increasing Resilience of Rural Livelihoods in Nepal. Rampur, Chitwan, Nepal, Institute of Agriculture and Animal Science, Tribhuvan University, and Penang, Malaysia, WorldFish Center. 191 pp.
Ssewanyana, S. & Bategeka, L. 2010. Uganda Phase 2. Global Financial Crisis Discussion Series, Paper 21. London, Overseas Development Institute. (also available at www.odi.org.uk/resources/docs/5823.pdf).
Tveteras, S., Asche, F., Bellemare, M., Smith, M., Guttormsen, A.G., Lem, A., Lien, K. & Vannuccini, S. 2012. Fish is food – the FAO’s fish price index. PLoS ONE 7(5): e36731 [online]. [Cited 21 April 2013]. www.plosone.org/article/info:doi/10.1371/journal.pone.0036731
UN General Assembly. 2012. Fisheries and the right to food. Note by the Secretary-General, 30 October 2012, A/67/268 [online]. [Cited 21 April 2013]. www.srfood.org/images/stories/pdf/officialreports/20121030_fish_en.pdf
Valderrama, D. & Engle, C.R. 2001. Risk analysis of shrimp farming in Honduras. Aquaculture Economics and Management, 5: 49–68.
Valderrama, D. & Engle, C.R. 2002. Economic optimization of shrimp farming in Honduras. Journal of the World Aquaculture Society, 33: 398–409.
Valtýsson, H.Þ. 2013. The main species. In: Icelandic Fisheries [online]. [Cited 21 April 2013]. www.fisheries.is/main-species

Value chain dynamics and the small-scale sector 106
Wilson, J.R. & Boncoeur, J. 2008. Microeconomic efficiencies and macroeconomic inefficiencies: on sustainable fisheries policies in very poor countries. Oxford Development Studies, 36(4): 339–460.
World Bank, FAO & WorldFish Center. 2010. The hidden harvests – the global contribution of capture fisheries. Conference edition, June 2010. 111 pp.
WorldFish Center. 2011. Aquaculture, fisheries, poverty and food security [online]. Penang, Malaysia. [Cited 21 April 2013]. www.worldfishcenter.org/resource_centre/WF_2971.pdf

107
Glossary
Asymmetric price transmission (APT): Pricing phenomenon occurring when downstream prices react in a different manner to upstream price changes, depending on the characteristics of upstream prices or changes in those prices.Downstream activities: Activities related to handling the products from the core activities, i.e. the output of the core activities, such as harvesting, live transport, processing, exporting and distribution.Farmgate price: Price received by fish farmers for fish, shellfish or other farmed aquatic plants or animals.First-hand price: Price received by fishers for fish, shellfish and other aquatic plants and animals landed at the dock. Horizontal integration: The acquisition of additional business activities that are at the same level of the value chain in similar or different industries. This can be achieved by internal or external expansion. Hypermarkets: A large nationwide or international supermarket chain with stores over 5 000 m2 located in malls in the peripheries of the urban areas.Monoculture: The cultivation of a single species in aquaculture.Monopsony: A market similar to a monopoly except that a large buyer controls a large proportion of the market and drives the prices down. Retail price: Price received at the retail level.Single seller operation: A monopoly operation.Wholesale price: The price for goods sold in large quantities, many times for resale by a retailer.


109
appendIX 1
project contributors
FAO Project Focal Point:Dr Audun LemBranch ChiefSenior Fishery Industry OfficerProducts, Trade and Marketing BranchFisheries and Aquaculture DepartmentFood and Agriculture OrganizationRome, ItalyE-mail: [email protected]
Lead Consultant: Dr Trond BjorndalProfessorSNF, Centre for Applied Research at Norwegian School of Economics, BergenAalesund University College, AalesundNorwayE-mail: [email protected]
FAO Project Coordinator:Anna ChildInternational ConsultantProducts, Trade and Marketing BranchFisheries and Aquaculture DepartmentFood and Agriculture OrganizationRome, ItalyE-mail: [email protected]
International Steering Committee Members: Dr Richard AbilaMarine and Fisheries Research Institute, KenyaE-mail: [email protected]
Ms Kirsten BjoruNorwegian Agency for Development Cooperation, NorwayE-mail: [email protected]
Dr Rune CastbergNorwegian Agency for Development Cooperation, NorwayE-mail: [email protected]
Dr Madan DeyUniversity of Arkansas, United States of AmericaE-mail: [email protected]

Value chain dynamics and the small-scale sector 110
Dr Achini De SilvaSabaragamuwa University, Sri LankaE-mail: [email protected]
Dr Blessing MapfumoINFOSA, NamibiaE-mail: [email protected]
Mr Sebastian MathewInternational Collective in Support of Fish Workers, IndiaE-mail: [email protected]

111Appendix 1
national consultants by country
Developing countries Consultant
Bangladesh Dr Ferdous AlamE-mail: [email protected]
Cambodia Dr Hap Navy, Ministry of FisheriesE-mail: [email protected]
Ghana Mr Theodore-Oboo Antwi-AsareUniversity of GhanaE-mail: [email protected]
Honduras Ms Claudia Stella BeltránE-mail: [email protected]
Kenya Mr Julius ManyalaE-mail: [email protected]
Maldives Mr Sinan HussainMinistry of FisheriesE-mail: [email protected]
Peru Dr Sigbjorn TveteraasPontificia Universidad Católica del PerúE-mail: [email protected]
Ms Yvonne del Carmen Cruz CastañedaE-mail: [email protected]
Thailand Mrs Amporn LaowapongDepartment of FisheriesE-mail: [email protected]
Uganda Mr Maurice SsebisubiAquaculture Management Consultants Ltd.E-mail: [email protected]

Value chain dynamics and the small-scale sector 112
Developed countries Consultant
Canada Professor D.V. GordonUniversity of CalgaryE-mail: [email protected]
Iceland Dr Ögmundur H. KnútssonUniversity of AkureyriE-mail: [email protected]
Mr Hreiðar Þór ValtýssoonUniversity of Akureyri and Fisheries ScienceCentreE-mail: [email protected]
Mr Bjarni EiríkssonUniversity of AkureyriE-mail: [email protected]
Mr Hörður SævaldssonUniversity of AkureyriE-mail: [email protected]
Mr Helgi GestssonUniversity of AkureyriE-mail: [email protected]
Japan Dr Nobuyuki YagiThe University of TokyoE-mail: [email protected]
Norway Dr Erik NessetAalesund University CollegeE-mail: [email protected]
Mr Nystrand Bjørn ToreMøreforsking ASE-mail: [email protected]
Spain Dr Jose Manuel Fernandez PolancoUniversity of Cantabria SantanderE-mail: [email protected]

This technical paper focuses primarily on price transmissions in small-scale and large-scale fishery and aquaculture value chains in 14 developed and developing countries. Although the study is focused on the small-scale sector, both the small-scale and large-scale sectors
were analysed in order to demonstrate differences between the two. The document begins with an overview of the entire project and its global implications, reviewing the importance of fisheries and aquaculture to livelihoods, food security and trade as well as the rationale
for value chain analysis. It then presents detailed and summarized country-specific information on the research and analysis conducted, presenting analysis methodology,
findings and policy recommendations within each country. An additional section focuses on women, summarizing their significant role in fishery and aquaculture value chains in selected
countries. Finally, the document outlines the general findings and policy recommendations that emerged as key themes across all value chains analysed.
Value chain dynamics andthe small-scale sectorPolicy recommendations for small-scale fisheries and aquaculture trade
Valu
e chain
dyn
amics an
d th
e small-scale secto
r581
FAO
581
ISSN 2070-7010
FAOFISHERIES ANDAQUACULTURE
TECHNICALPAPER