validity of the hogan personality inventory and the ... tech... · validity of the hogan...
TRANSCRIPT

Validity of the Hogan Personality Inventory and the Motives, Values, Preferences Inventory for Selecting Sales
Representatives at ABC Company
Documentation of Evidence for Job Analysis, Validity Generalization, and
Criterion-Related Validity
June 2009
T E C H N I C A L R E P O R T
2 Copyright Hogan Assessment Systems, Inc. 2014. All rights reserved.
EXECUTIVE SUMMARY This report summarizes the research procedures Hogan used to establish the validity of the Hogan Personality Inventory (HPI) and the Motives, Values, Preferences Inventory (MVPI) for selecting employees into the Sales Representative job at ABC Company. This report details the methods used to (a) identify the job’s key requirements, (b) accumulate validity evidence, and (c) select scales to predict performance in the Sales Representative job.
The research study began with a personality-based job analysis to collect data from individuals familiar with the job requirements. Hogan collected information from focus groups, job descriptions, and Hogan’s job evaluation tool (JET). Hogan aligned this information with predictor scales on the HPI and MVPI.
Hogan used multiple techniques to accumulate validity evidence. First, Hogan identified historically valid predictors of job performance using a job family meta-analysis approach. Next, Hogan identified valid predictors of key job elements using a synthetic/job component validation approach. Finally, Hogan established criterion-referenced validity evidence by classifying incumbent Sales Representatives based on (a) subjective measures of their performance and (b) their HPI results.
Hogan’s validation findings support the predictive validity of the HPI Adjustment, Prudence, and Learning Approach scales. Hogan recommends using these scales as the basis for the Moderate Fit candidate screening guidelines, which identify candidates who possess at least a minimal degree of the personal characteristics associated with successful Sales Representative performance. Analyses using a simulated applicant pool indicate that the recommended Moderate Fit cutoff scores should result in no adverse impact. Hogan also recommends High Fit candidate-screening guidelines comprised of more stringent HPI requirements with the addition of a minimum scoring requirement on the HPI Inquisitive scale and the MVPI Commerce and Science scales.
Hogan recommends the completion of a local validation study and accumulation of business utility data (when feasible) to evaluate the effectiveness of Sales Representative assessment results at ABC Company. Until sufficient company-specific assessment and performance data are available, we recommend that ABC Company use these results in conjunction with other applicant information to drive selection decisions.
3 Copyright Hogan Assessment Systems, Inc. 2014. All rights reserved.
CONTENTS 1 – INTRODUCTION 8
1.1 Foundation ............................................................................................................. 8
1.2 Overview ................................................................................................................ 8
1.3 User, Location(s), and Dates of Study ................................................................ 8
1.4 Problem and Setting ............................................................................................. 9
2 – DESCRIPTION OF SELECTION PROCEDURES 10
2.1 Approach and Rationale ................................................................................... 10
2.2 What to Measure and Why ............................................................................... 10
2.3 The Hogan Personality Inventory. .................................................................. 12
2.4 Hogan Personality Inventory Description and Development ..................... 15
2.5 The Motives, Values, Preferences Inventory .................................................. 17
2.6 Motives, Values, Preferences Inventory Description and Development ... 17
3 – JOB ANALYSIS 20
3.1 Job Description .................................................................................................... 20
3.2 Job Analysis Survey ............................................................................................ 20
3.3 Performance Improvement Characteristics .................................................... 20
3.4 PIC Results ........................................................................................................... 22
3.5 Motivational Improvement Characteristics .................................................... 23
3.6 MIC Results ......................................................................................................... 24
3.7 Competency Evaluation Tool ............................................................................ 26
4 Copyright Hogan Assessment Systems, Inc. 2014. All rights reserved.
3.8 CET Results .......................................................................................................... 27
3.9 Job Analysis Summary ....................................................................................... 28
4 – META-ANALYSIS RESULTS FOR EVALUATING VALIDITY GENERALIZATION OF PERSONALITY MEASURES 30
4.1 The Five-Factor Model and Job Performance ................................................. 32
4.2 Personality-Based Validity Coefficient Benchmarking ................................. 34
4.3 Summary of Meta-Analysis Results for Generalizing Validity of Five-Factor Model Personality Measures ....................................................................... 36
4.4 Meta-Analysis Evidence for Generalizing Validity of the HPI at the Job Family Level .............................................................................................................. 36
4.5 Meta-Analysis Using the MVPI ........................................................................ 38
5 – TRANSPORTABILITY OF VALIDITY 39
5.1 Transportability Results. .................................................................................... 40
6 – SYNTHETIC/JOB COMPONENT VALIDITY 41
6.1 Critical Performance Dimensions ..................................................................... 42
6.2 Validity of the HPI for Predicting Job Performance ...................................... 43
7 – CRITERION-RELATED VALIDITY EVIDENCE 45
7.1 Criterion-Related Validity Sample ................................................................... 46
8 – RECOMMENDATIONS 50
8.1 Recommended Cutoff Scores ............................................................................ 52
8.2 Adverse Impact ................................................................................................... 52
8.3 Pass-Plus Decision Guidelines .......................................................................... 55
8.4 Uses and Applications ....................................................................................... 56
8.5 Accuracy and Completeness ............................................................................. 57
5 Copyright Hogan Assessment Systems, Inc. 2014. All rights reserved.
9 –APPLICATION OF SELECTION PROFILE TO INCUMBENT DATA 58
9.1 Correlation Results. ............................................................................................ 58
9.2 Mean Differences. ............................................................................................... 58
9.3 Odds Ratios.......................................................................................................... 60
9.4 Odds Ratios - Moderate Fit Profile. .................................................................. 60
9.5 Odds Ratios - High Fit Profile. .......................................................................... 61
REFERENCES 63
APPENDIX A: Sales Representative Job Description 76
APPENDIX B: The Job Evaluation Tool (JET) 82
APPENDIX C: Supervisor Rating Form 87
APPENDIX D: Archival Appraisal Rating Form 89
6 Copyright Hogan Assessment Systems, Inc. 2014. All rights reserved.
TABLES & FIGURES Table 2.1 Correlations between Goldberg’s Big-Five Markers and the HPI Scales .......................................................................................................................................... 13
Table 2.2 Correlations between the PCI Primary Scales and the HPI Scales ......... 13
Table 2.3 Correlations between the IP/5F and the HPI Scales ................................ 13
Table 2.4 Correlations between the NEO-PI-R and the HPI Scales ......................... 13
Figure 2.1 Relationships between FFM Inventories and the HPI Scales ................ 14
Table 3.1 HPI and PIC Scale Definitions ..................................................................... 21
Table 3.2 Raw Score PIC Means and Standard Deviations ...................................... 22
Figure 3.1 PIC Profile for the Sales Representative Job ............................................ 23
Table 3.3 MVPI and MIC Scale Definitions ................................................................ 24
Table 3.4 Raw Score MIC Means and Standard Deviations ..................................... 24
Figure 3.2 MIC Profile for the Sales Representative Job ........................................... 25
Table 3.5 Raw Score CET Means and Standard Deviations ..................................... 27
Table 4.1 FFM Meta-Analysis Results: Uncorrected Validity Estimates ................ 32
Table 4.2 Meta-Analysis Results for HPI Scales with Construct-Aligned Criteria33
Table 4.3 Comparative Validity of Assessments for Predicting Overall Job Performance .................................................................................................................... 35
Table 4.4 Meta-Analysis Results from HPI-Performance Correlations for Sales Representatives and Specialists Jobs ........................................................................... 38
Table 6.1 Definitions of Critical Job Competencies ................................................... 42
Table 6.2 HPI Correlations with Critical Job Competencies .................................... 43
Table 7.1 HPI and MVPI Means and Standard Deviations of Incumbent Sales Representatives .............................................................................................................. 47

7 Copyright Hogan Assessment Systems, Inc. 2014. All rights reserved.
Table 7.2 Criterion Means and Standard Deviations of Incumbent Sales Representatives .............................................................................................................. 47
Table 7.3 Observed Correlations between HPI Scales and Job Performance Indicators ......................................................................................................................... 48
Table 7.4 Observed Correlations between MVPI Scales and Job Performance Indicators ......................................................................................................................... 48
Table 8.1 Summary of Job Analysis and Validation Results .................................... 50
Table 8.2 Combined Validity Generalization Results ............................................... 51
Table 8.3 Recommended HPI Cutoff Scores............................................................... 52
Table 8.4 Effects of Applying Recommended HPI Cutoff Scores to the Incumbent Sample—Selection Rates and Adverse Impact Ratios by Demographic Group ... 54
Table 8.5 Effects of Applying Recommended HPI Cutoff Scores to the Archival Sample—Selection Rates and Adverse Impact Ratios by Demographic Group ... 54
Table 8.6 Recommended Pass-Plus Cutoff Scores ..................................................... 56
Table 9.1 Recommended Profile Correlations with Criterion ................................. 58
Figure 9.1 Overall Performance by Fit Level.............................................................. 58
Figure 9.2 2008 Archival Appraisal by Fit Level ....................................................... 59
Figure 9.3 Culture by Fit Level ..................................................................................... 59
Table 9.2 Application of Moderate Fit Profile on Overall Job Performance .......... 60
Table 9.3 Application of Moderate Fit Profile on 2008 Archival Appraisals ......... 61
Table 9.4 Application of Moderate Fit Profile on Culture ........................................ 61
Table 9.5 Application of High Fit Profile on Overall Job Performance .................. 62
Table 9.6 Application of High Fit Profile on 2008 Archival Appraisals ................. 62
Table 9.7 Application of High Fit Profile on Culture ................................................ 62
8 Copyright Hogan Assessment Systems, Inc. 2014. All rights reserved.
1 – INTRODUCTION
1.1 Foundation. This report provides a technical summary of research conducted to evaluate the validity of the Hogan Personality Inventory (R. Hogan & J. Hogan, 2007; hereafter “HPI”) and the Motives, Values, Preferences Inventory (J. Hogan & R. Hogan, 1996; hereafter “MVPI”) at ABC Company Sensor Systems (ABC Company). ABC Company sought to use these assessments to predict performance in the Sales Representative job. The research conforms to standards outlined in the Uniform Guidelines on Employee Selection Procedures (Equal Employment Opportunity Commission, 1978; hereafter “Uniform Guidelines”), The Principles for the Validation and Use of Personnel Selection Procedures (Society for Industrial and Organizational Psychology, 2003; hereafter “Principles”), and the Standards for Educational and Psychological Testing (American Educational Research Association, 1999; hereafter “Standards”). In areas where the Uniform Guidelines, Principles and/or Standards proved vague or inapplicable, the research approach relied on the broader scientific/professional literature for guidance.
1.2 Overview
• Introduction – project overview
. We organized this document in the following sections:
• Description of Selection Procedures – review of predictors
• Job Analysis – review of job requirements
• Meta-Analysis Results for Evaluating Validity Generalization of Personality Measures – review of meta-analysis literature
• Transportability of Validity – research on similar jobs
• Synthetic/Job Component Validity – research on jobs with similar components
• Criterion Related Validity – research on matching predictors and criterion
• Recommendations – application recommendations
1.3 User, Location(s), and Dates of Study. ABC Company is a leading supplier of RF, microwave, and millimeter wave products for the defense and space industry. ABC Company is headquartered in San Diego, CA and has state-of-the-art engineering and manufacturing facilities throughout the country.
9 Copyright Hogan Assessment Systems, Inc. 2014. All rights reserved.
Hogan conducted research described in this report between November 2008 and May 2009. The job analysis process relied on input collected from Subject Matter Experts (hereafter SMEs) – individuals highly familiar with the target job(s) and how they should ideally be performed. SMEs included supervisors, managers, and experienced Sales Representatives.
1.4 Problem and Setting
A review of alternative candidate selection techniques prompted ABC Company to conclude that an assessment of personality characteristics could enhance the current procedures used to screen and select candidates into Sales Representative jobs.
. ABC Company’s selection process is critical for identifying talented employees who will contribute to the long-term success of the company. The complexities of recruiting and the dynamic job market warrant continuous evaluation and improvement of ABC Company’s selection process.
ABC Company contacted Hogan and initiated research to evaluate the validity of the HPI and MVPI for predicting Sales Representative job performance. If the inventory scales demonstrated validity, ABC Company planned to use the assessments to screen Sales Representative applicants.
10 Copyright Hogan Assessment Systems, Inc. 2014. All rights reserved.
2 – DESCRIPTION OF SELECTION PROCEDURES
2.1 Approach and Rationale
Assigning numbers in a systematic fashion to characteristics is a critical, but not a wholly sufficient, requirement of any pre-employment selection tool. Every selection tool should also provide evidence to support (a) the reliability of the instrument and (b) the relations between scores on the instrument and job-relevant behaviors or outcomes (Equal Employment Opportunity Commission, 1978). At a minimum, the reliability of pre-employment assessments should be evaluated in terms of the degree to which (a) items or questions on a scale relate to one another (internal item consistency) and (b) results or scores remain stable over time (test-retest reliability).
. Validating selection instruments relies on accurate measurement. In accordance with Ghiselli, Campbell, and Zedeck (1981), we define measurement as any procedure that assigns numbers systematically to characteristic features of people according to explicit rules. Researchers and practitioners can use these numbers to make predictions or forecast future behavior(s).
The ability of a pre-employment instrument to predict job-relevant behaviors or outcomes should be documented in credible scientific sources. The supporting evidence should include significant and interpretable relations between scores on the pre-employment instrument and indices of job performance. Moreover, evidence should also demonstrate that scores on the pre-employment instrument predict job performance criteria critical to success in the job of interest.
Pre-employment instruments should be fair assessments, in that they should not discriminate unfairly on the basis of gender, age, or race/ethnicity (Equal Employment Opportunity Commission, 1978). Researchers must validate selection procedures that result in adverse impact in accordance with the Uniform Guidelines. Unfortunately, many instruments currently used in pre-employment screening processes fail to meet the criteria outlined above (R. Hogan, J. Hogan, & Trickey, 1999).
2.2 What to Measure and Why. Based on ABC Company desire to evaluate the validity of personality inventories for assisting in the Sales Representative selection process, the following summary briefly describes measurement issues that have influenced the current effort. The most important question in personality assessment is “What should we measure?” Historically, the answer depended on an author’s personal interests (e.g., Locus of Control; Rotter, 1966), practical concerns (e.g., Minnesota Multiphasic Personality Inventory; Hathaway
11 Copyright Hogan Assessment Systems, Inc. 2014. All rights reserved.
& McKinley, 1943), or theory (e.g., Myers-Briggs Type Indicator; Briggs-Meyers, McCaulley, Quenk, & Hammer, 1998; Thematic Apperception Test; Morgan & Murray, 1935). Multi-dimensional personality inventories developed during the 1940s and 1950s measured traits, or hypothetical structures believed to underlie differences in social behavior (cf. Allport, 1937). Early approaches to personality inventory construction led to more advanced test development strategies and improved the quality and interpretability of the instruments.
Current thinking in personality assessment converges on the idea that most personality characteristics can be described in terms of five personality dimensions. The Five-Factor Model (FFM; cf. Digman, 1990; Goldberg, 1992; John, 1990, p. 72; McCrae & Costa, 1987), which emerged from fifty years of factor analytic research on the structure of observer ratings (cf. Norman, 1963; Thurstone, 1934; Tupes & Christal, 1961), suggests that we think about and describe others and ourselves (Goldberg, 1990) in terms of five themes:
I. Surgency/Extraversion - the degree to which a person is outgoing and talkative.
II. Agreeableness - the degree to which a person is rewarding to deal with and pleasant.
III. Conscientiousness - the degree to which a person complies with rules, norms, and standards.
IV. Emotional Stability - the degree to which a person appears calm and self-accepting.
V. Intellect/Openness to Experience - the degree to which a person seems creative and open-minded.
The FFM provides the starting point for several prominent personality inventories constructed within the last twenty years (e.g., NEO-PI: Costa & McCrae, 1992; HPI: R. Hogan & J. Hogan, 1995, 2007; Personal Characteristics Inventory: Mount & Barrick, 2001). The five dimensions provide a useful taxonomy for classifying individual differences in social behavior (i.e., reputation). Evidence suggests that all existing multidimensional personality inventories can be described, with little difficulty, in terms of these five dimensions (Wiggins & Pincus, 1992). Consequently, the FFM is the paradigm for current research in personality assessment (De Raad & Perugini, 2002; R. Hogan & J. Hogan, 1995, 2007).
12 Copyright Hogan Assessment Systems, Inc. 2014. All rights reserved.
Observer’s descriptions of others serve as the foundation of the FFM. These descriptions form the basis of one’s reputation – i.e., how people describe coworkers or peers (R. Hogan, 1983). Reputations grow from social consensus regarding consistencies in a person's behavior, and develop from behavior during social and occupational interaction. These behaviors consist, at least in part, of actions designed to establish, defend, or enhance that person's identity – i.e., a person’s view of him or herself (cf. Goffman, 1958). Reputations are public, tell us about observable tendencies in the others’ behaviors, can be measured reliably, and can be used to forecast future behavior (cf. Emler, 1990). A person’s reputation represents an invaluable source of information about work-related strengths and shortcomings and influences the direction of careers.
Personality assessment samples self-presentational behavior – i.e., how a person portrays him or herself to others on the job. An assessment instrument allows us to aggregate these behavioral samples, assign them numbers according to certain agreed-upon rules, and then use these numbers or scores to make predictions about a person's future behavior. Research shows that personality is predictive of both work and non-work related outcomes, such as job performance, leadership, health related behaviors, life satisfaction, and job satisfaction (Hough & Oswald, 2008; Ozer & Benet-Martinez, 2005; Roberts, Kuncel, Shiner, Caspi, & Goldberg, 2007).
2.3 The Hogan Personality Inventory
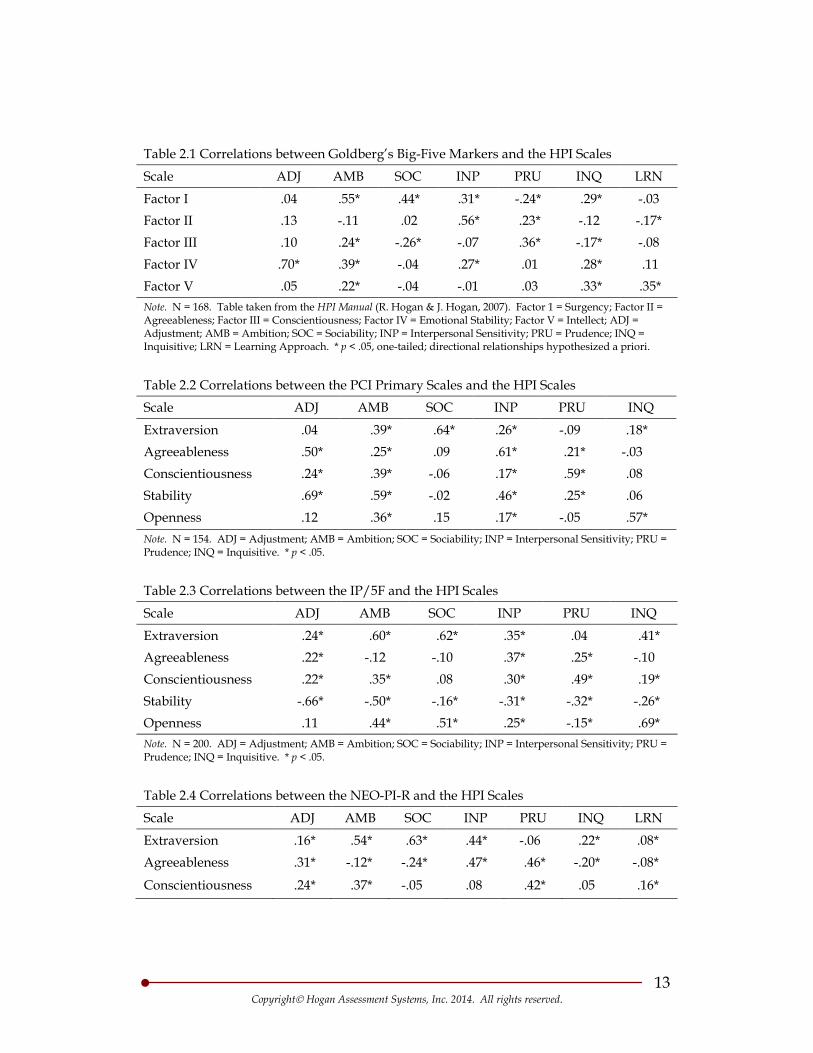
. The HPI was the first measure of normal personality based on the FFM and designed to predict occupational performance. The measurement goal of the HPI is to predict real-world outcomes. As such, it is an original and well-known measure of the FFM and is considered a marker instrument, not only in English, but for personality measures in other languages as well. Tables 2.1 through 2.4 present correlations between the HPI and other assessments of the FFM. Figure 2.1 shows median correlation coefficients that summarize HPI relations with Goldberg’s (1992) Big-Five Markers (R. Hogan & J. Hogan, 2007), the Personal Characteristics Inventory (Mount & Barrick, 1995), the Inventario de Personalidad de Cinco Factores (IP/5F: Salgado & Moscoso, 1999), and the NEO PI-R (Goldberg, 2000).
13 Copyright Hogan Assessment Systems, Inc. 2014. All rights reserved.
Table 2.1 Correlations between Goldberg’s Big-Five Markers and the HPI Scales
Scale ADJ AMB SOC INP PRU INQ LRN
Factor I .04 .55* .44* .31* -.24* .29* -.03 Factor II .13 -.11 .02 .56* .23* -.12 -.17* Factor III .10 .24* -.26* -.07 .36* -.17* -.08 Factor IV .70* .39* -.04 .27* .01 .28* .11 Factor V .05 .22* -.04 -.01 .03 .33* .35* Note. N = 168. Table taken from the HPI Manual (R. Hogan & J. Hogan, 2007). Factor 1 = Surgency; Factor II = Agreeableness; Factor III = Conscientiousness; Factor IV = Emotional Stability; Factor V = Intellect; ADJ = Adjustment; AMB = Ambition; SOC = Sociability; INP = Interpersonal Sensitivity; PRU = Prudence; INQ = Inquisitive; LRN = Learning Approach. * p < .05, one-tailed; directional relationships hypothesized a priori.
Table 2.2 Correlations between the PCI Primary Scales and the HPI Scales
Scale ADJ AMB SOC INP PRU INQ
Extraversion .04 .39* .64* .26* -.09 .18* Agreeableness .50* .25* .09 .61* .21* -.03 Conscientiousness .24* .39* -.06 .17* .59* .08 Stability .69* .59* -.02 .46* .25* .06 Openness .12 .36* .15 .17* -.05 .57* Note. N = 154. ADJ = Adjustment; AMB = Ambition; SOC = Sociability; INP = Interpersonal Sensitivity; PRU = Prudence; INQ = Inquisitive. * p < .05.
Table 2.3 Correlations between the IP/5F and the HPI Scales
Scale ADJ AMB SOC INP PRU INQ
Extraversion .24* .60* .62* .35* .04 .41* Agreeableness .22* -.12 -.10 .37* .25* -.10 Conscientiousness .22* .35* .08 .30* .49* .19* Stability -.66* -.50* -.16* -.31* -.32* -.26* Openness .11 .44* .51* .25* -.15* .69* Note. N = 200. ADJ = Adjustment; AMB = Ambition; SOC = Sociability; INP = Interpersonal Sensitivity; PRU = Prudence; INQ = Inquisitive. * p < .05. Table 2.4 Correlations between the NEO-PI-R and the HPI Scales
Scale ADJ AMB SOC INP PRU INQ LRN
Extraversion .16* .54* .63* .44* -.06 .22* .08* Agreeableness .31* -.12* -.24* .47* .46* -.20* -.08*
Conscientiousness .24* .37* -.05 .08 .42* .05 .16*
14 Copyright Hogan Assessment Systems, Inc. 2014. All rights reserved.
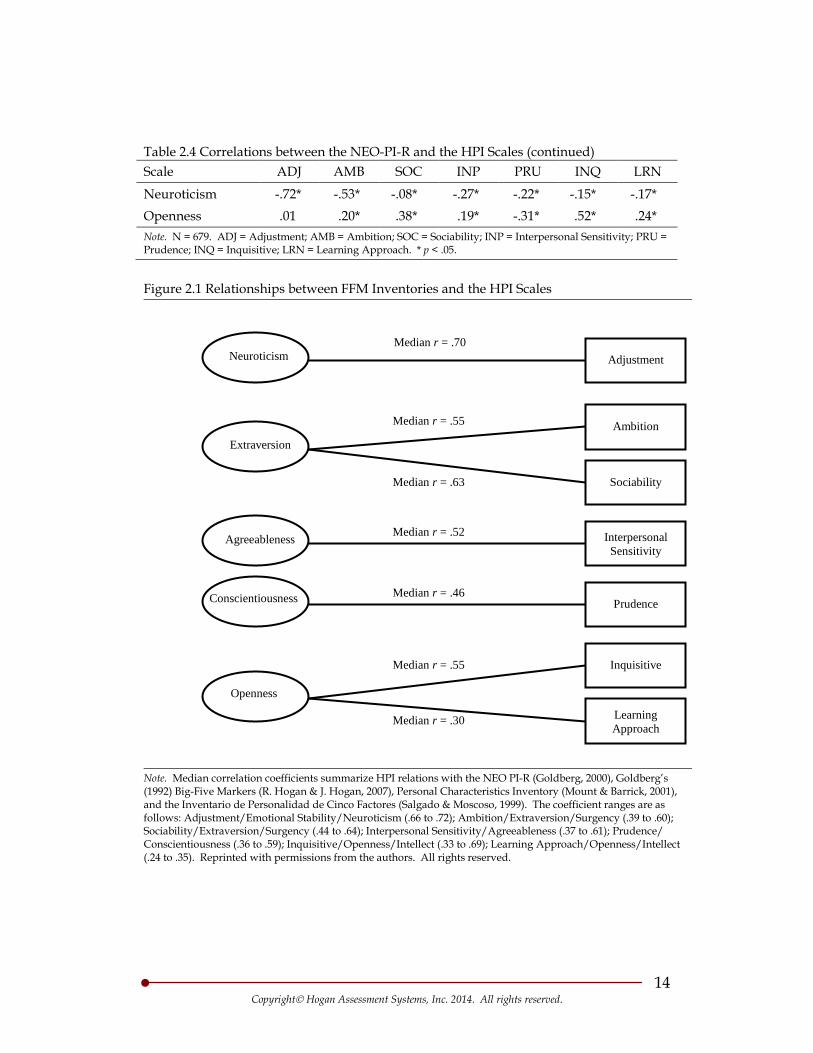
Table 2.4 Correlations between the NEO-PI-R and the HPI Scales (continued) Scale ADJ AMB SOC INP PRU INQ LRN
Neuroticism -.72* -.53* -.08* -.27* -.22* -.15* -.17* Openness .01 .20* .38* .19* -.31* .52* .24* Note. N = 679. ADJ = Adjustment; AMB = Ambition; SOC = Sociability; INP = Interpersonal Sensitivity; PRU = Prudence; INQ = Inquisitive; LRN = Learning Approach. * p < .05. Figure 2.1 Relationships between FFM Inventories and the HPI Scales
Note. Median correlation coefficients summarize HPI relations with the NEO PI-R (Goldberg, 2000), Goldberg’s (1992) Big-Five Markers (R. Hogan & J. Hogan, 2007), Personal Characteristics Inventory (Mount & Barrick, 2001), and the Inventario de Personalidad de Cinco Factores (Salgado & Moscoso, 1999). The coefficient ranges are as follows: Adjustment/Emotional Stability/Neuroticism (.66 to .72); Ambition/Extraversion/Surgency (.39 to .60); Sociability/Extraversion/Surgency (.44 to .64); Interpersonal Sensitivity/Agreeableness (.37 to .61); Prudence/Conscientiousness (.36 to .59); Inquisitive/Openness/Intellect (.33 to .69); Learning Approach/Openness/Intellect (.24 to .35). Reprinted with permissions from the authors. All rights reserved.
Extraversion
Agreeableness
Neuroticism
Conscientiousness
Openness
Median r = .70
Median r = .55
Median r = .63
Median r = .52
Median r = .46
Median r = .55
Median r = .30
Adjustment
Ambition
Sociability
Interpersonal Sensitivity
Prudence
Inquisitive
Learning Approach
15 Copyright Hogan Assessment Systems, Inc. 2014. All rights reserved.
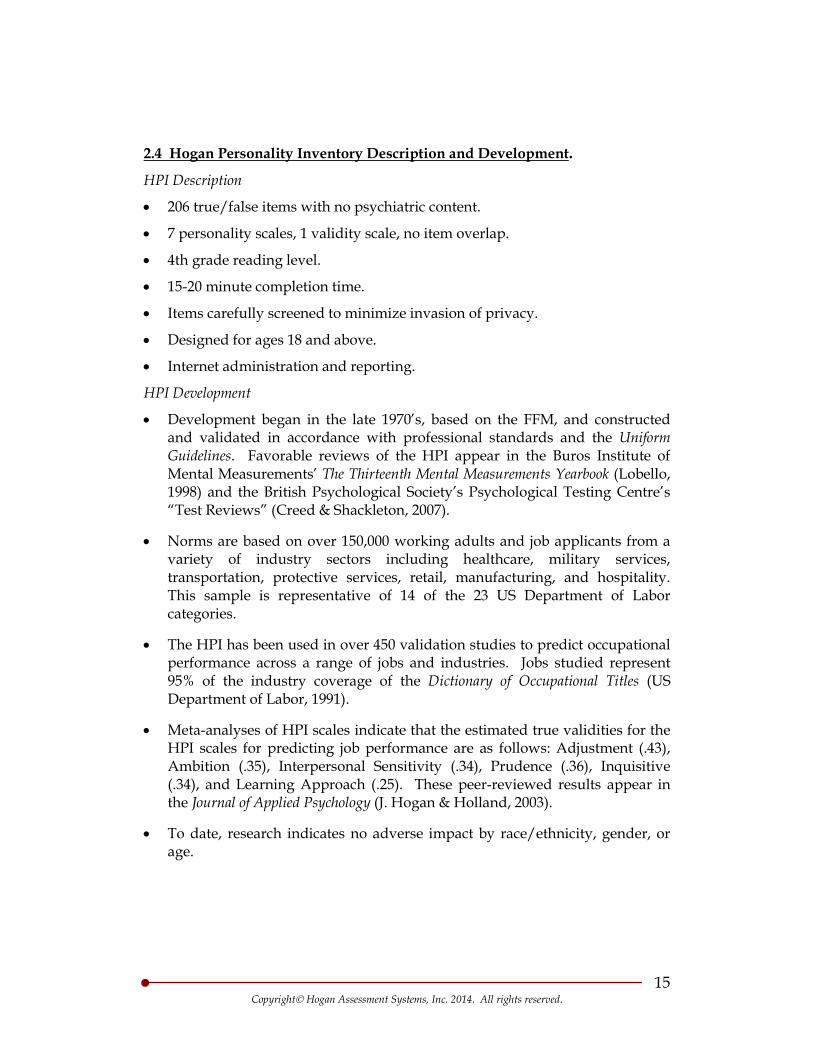
2.4 Hogan Personality Inventory Description and Development.
HPI Description
• 206 true/false items with no psychiatric content.
• 7 personality scales, 1 validity scale, no item overlap.
• 4th grade reading level.
• 15-20 minute completion time.
• Items carefully screened to minimize invasion of privacy.
• Designed for ages 18 and above.
• Internet administration and reporting.
HPI Development
• Development began in the late 1970’s, based on the FFM, and constructed and validated in accordance with professional standards and the Uniform Guidelines. Favorable reviews of the HPI appear in the Buros Institute of Mental Measurements’ The Thirteenth Mental Measurements Yearbook (Lobello, 1998) and the British Psychological Society’s Psychological Testing Centre’s “Test Reviews” (Creed & Shackleton, 2007).
• Norms are based on over 150,000 working adults and job applicants from a variety of industry sectors including healthcare, military services, transportation, protective services, retail, manufacturing, and hospitality. This sample is representative of 14 of the 23 US Department of Labor categories.
• The HPI has been used in over 450 validation studies to predict occupational performance across a range of jobs and industries. Jobs studied represent 95% of the industry coverage of the Dictionary of Occupational Titles (US Department of Labor, 1991).
• Meta-analyses of HPI scales indicate that the estimated true validities for the HPI scales for predicting job performance are as follows: Adjustment (.43), Ambition (.35), Interpersonal Sensitivity (.34), Prudence (.36), Inquisitive (.34), and Learning Approach (.25). These peer-reviewed results appear in the Journal of Applied Psychology (J. Hogan & Holland, 2003).
• To date, research indicates no adverse impact by race/ethnicity, gender, or age.
16 Copyright Hogan Assessment Systems, Inc. 2014. All rights reserved.
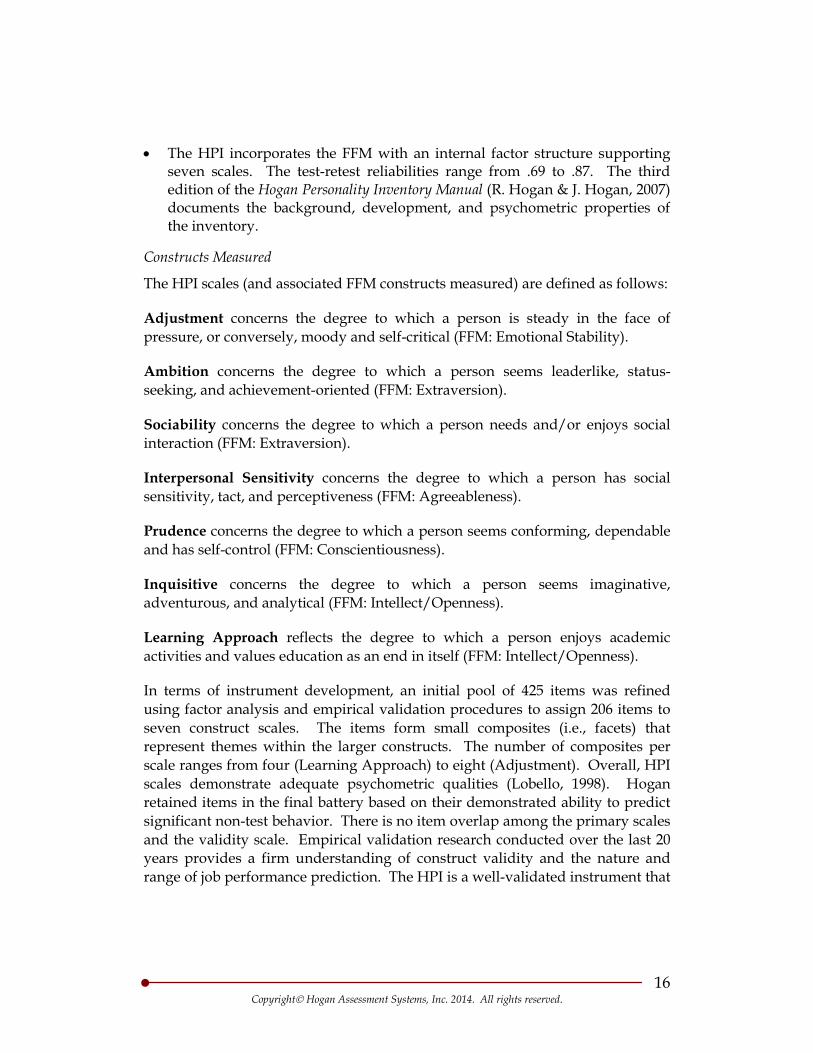
• The HPI incorporates the FFM with an internal factor structure supporting seven scales. The test-retest reliabilities range from .69 to .87. The third edition of the Hogan Personality Inventory Manual (R. Hogan & J. Hogan, 2007) documents the background, development, and psychometric properties of the inventory.
Constructs Measured
The HPI scales (and associated FFM constructs measured) are defined as follows:
Adjustment concerns the degree to which a person is steady in the face of pressure, or conversely, moody and self-critical (FFM: Emotional Stability).
Ambition concerns the degree to which a person seems leaderlike, status-seeking, and achievement-oriented (FFM: Extraversion).
Sociability concerns the degree to which a person needs and/or enjoys social interaction (FFM: Extraversion).
Interpersonal Sensitivity concerns the degree to which a person has social sensitivity, tact, and perceptiveness (FFM: Agreeableness).
Prudence concerns the degree to which a person seems conforming, dependable and has self-control (FFM: Conscientiousness).
Inquisitive concerns the degree to which a person seems imaginative, adventurous, and analytical (FFM: Intellect/Openness).
Learning Approach reflects the degree to which a person enjoys academic activities and values education as an end in itself (FFM: Intellect/Openness).
In terms of instrument development, an initial pool of 425 items was refined using factor analysis and empirical validation procedures to assign 206 items to seven construct scales. The items form small composites (i.e., facets) that represent themes within the larger constructs. The number of composites per scale ranges from four (Learning Approach) to eight (Adjustment). Overall, HPI scales demonstrate adequate psychometric qualities (Lobello, 1998). Hogan retained items in the final battery based on their demonstrated ability to predict significant non-test behavior. There is no item overlap among the primary scales and the validity scale. Empirical validation research conducted over the last 20 years provides a firm understanding of construct validity and the nature and range of job performance prediction. The HPI is a well-validated instrument that
17 Copyright Hogan Assessment Systems, Inc. 2014. All rights reserved.
predicts job performance across occupations and organizations (Axford, 1998; J. Hogan & Holland, 2003).
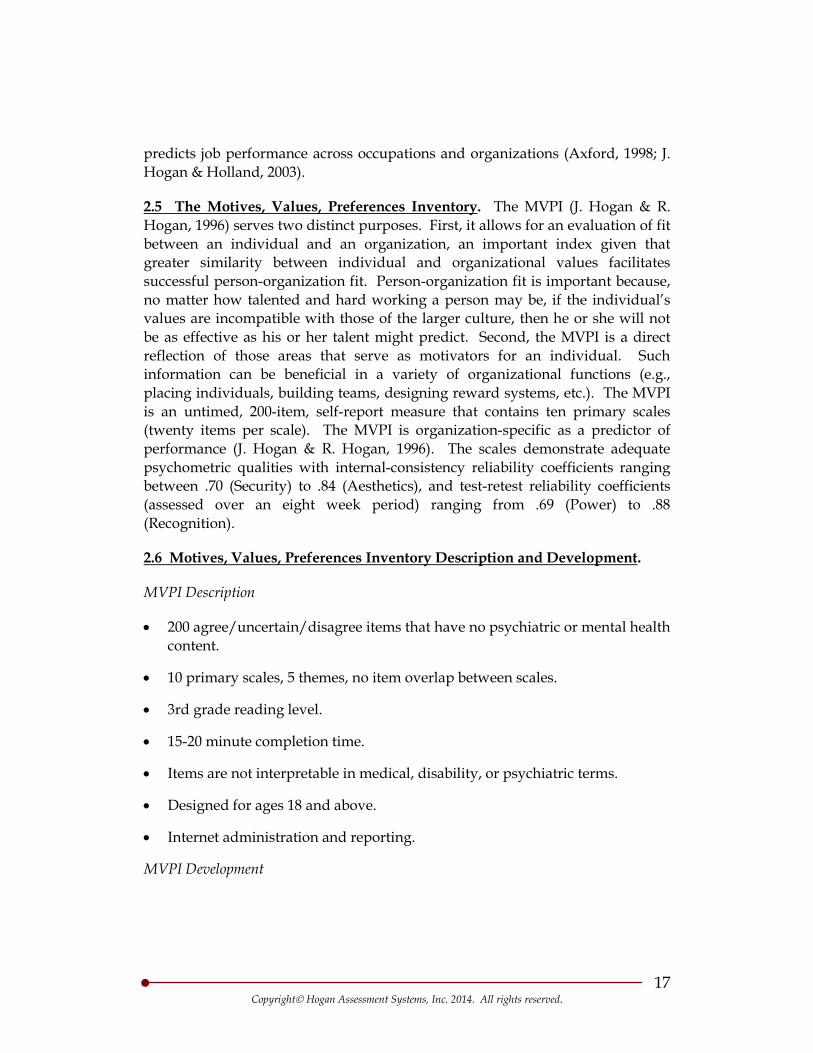
2.5 The Motives, Values, Preferences Inventory. The MVPI (J. Hogan & R. Hogan, 1996) serves two distinct purposes. First, it allows for an evaluation of fit between an individual and an organization, an important index given that greater similarity between individual and organizational values facilitates successful person-organization fit. Person-organization fit is important because, no matter how talented and hard working a person may be, if the individual’s values are incompatible with those of the larger culture, then he or she will not be as effective as his or her talent might predict. Second, the MVPI is a direct reflection of those areas that serve as motivators for an individual. Such information can be beneficial in a variety of organizational functions (e.g., placing individuals, building teams, designing reward systems, etc.). The MVPI is an untimed, 200-item, self-report measure that contains ten primary scales (twenty items per scale). The MVPI is organization-specific as a predictor of performance (J. Hogan & R. Hogan, 1996). The scales demonstrate adequate psychometric qualities with internal-consistency reliability coefficients ranging between .70 (Security) to .84 (Aesthetics), and test-retest reliability coefficients (assessed over an eight week period) ranging from .69 (Power) to .88 (Recognition).
2.6 Motives, Values, Preferences Inventory Description and Development
MVPI Description
.
• 200 agree/uncertain/disagree items that have no psychiatric or mental health content.
• 10 primary scales, 5 themes, no item overlap between scales.
• 3rd grade reading level.
• 15-20 minute completion time.
• Items are not interpretable in medical, disability, or psychiatric terms.
• Designed for ages 18 and above.
• Internet administration and reporting.
MVPI Development
18 Copyright Hogan Assessment Systems, Inc. 2014. All rights reserved.
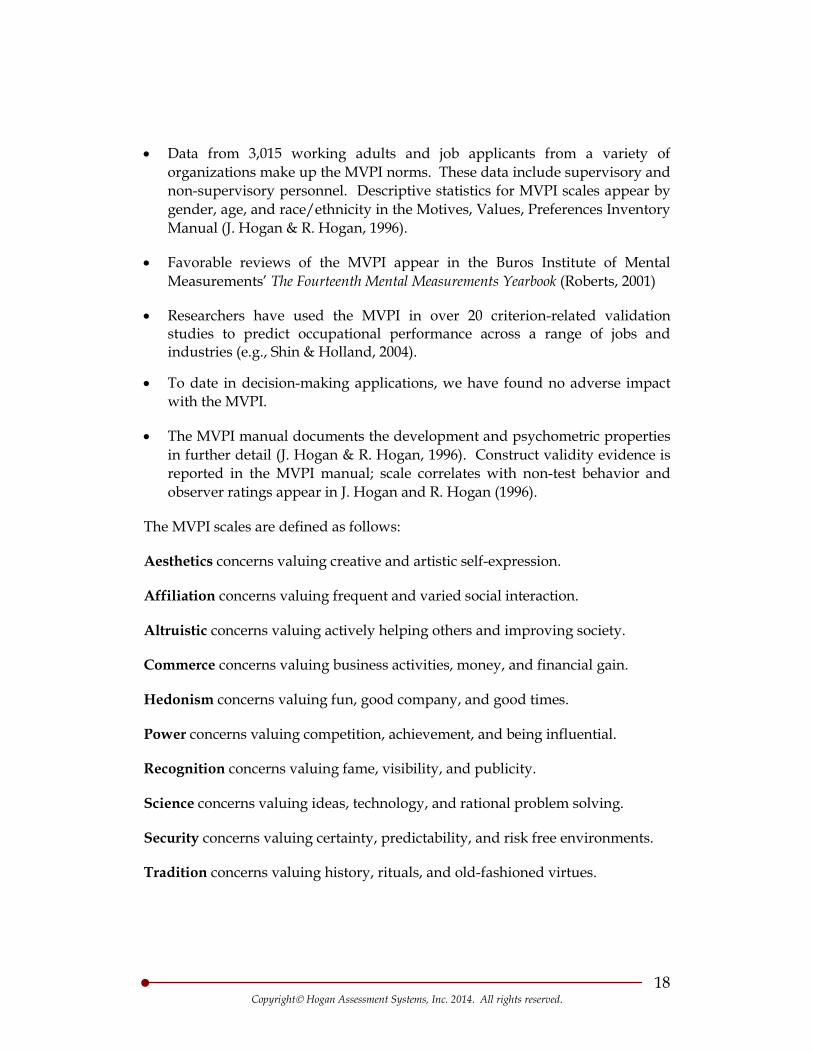
• Data from 3,015 working adults and job applicants from a variety of organizations make up the MVPI norms. These data include supervisory and non-supervisory personnel. Descriptive statistics for MVPI scales appear by gender, age, and race/ethnicity in the Motives, Values, Preferences Inventory Manual (J. Hogan & R. Hogan, 1996).
• Favorable reviews of the MVPI appear in the Buros Institute of Mental Measurements’ The Fourteenth Mental Measurements Yearbook (Roberts, 2001)
• Researchers have used the MVPI in over 20 criterion-related validation studies to predict occupational performance across a range of jobs and industries (e.g., Shin & Holland, 2004).
• To date in decision-making applications, we have found no adverse impact with the MVPI.
• The MVPI manual documents the development and psychometric properties in further detail (J. Hogan & R. Hogan, 1996). Construct validity evidence is reported in the MVPI manual; scale correlates with non-test behavior and observer ratings appear in J. Hogan and R. Hogan (1996).
The MVPI scales are defined as follows:
Aesthetics concerns valuing creative and artistic self-expression.
Affiliation concerns valuing frequent and varied social interaction.
Altruistic concerns valuing actively helping others and improving society.
Commerce concerns valuing business activities, money, and financial gain.
Hedonism concerns valuing fun, good company, and good times.
Power concerns valuing competition, achievement, and being influential.
Recognition concerns valuing fame, visibility, and publicity.
Science concerns valuing ideas, technology, and rational problem solving.
Security concerns valuing certainty, predictability, and risk free environments.
Tradition concerns valuing history, rituals, and old-fashioned virtues.
19 Copyright Hogan Assessment Systems, Inc. 2014. All rights reserved.
In terms of instrument development, the MVPI is comprised of items derived rationally from hypotheses about the likes, dislikes, and aversions of the “ideal” exemplar of each motive. Each scale is composed of five themes: (a) Lifestyles, which concern the manner in which a person would like to live; (b) Beliefs, which involve “shoulds”, ideals, and ultimate life goals; (c) Occupational Preferences, which include the work an individual would like to do, what constitutes a good job, and preferred work materials; (d) Aversions, which reflect attitudes and behaviors that are either disliked or distressing; and (e) Preferred Associates, which include the kind of persons desired as coworkers and friends. There are no correct or incorrect responses for the MVPI scales; therefore, there is no need for validity or faking keys. There is no item overlap among the 10 scales.
20 Copyright Hogan Assessment Systems, Inc. 2014. All rights reserved.
3 – JOB ANALYSIS
The Uniform Guidelines emphasizes the importance of conducting a complete job analysis for all content and construct validation studies. The guidelines require documentation of (a) work behaviors and/or outcomes, (b) the criticality of work behaviors or outcomes, and if applicable (c) the supporting evidence and rationale for grouping together two or more jobs [Section 15, B, (3)]. The remainder of this section describes the collaborative steps taken by Hogan and ABC Company to comply with these technical guidelines.
3.1 Job Description
A review of the Sales Representative job description provided the basis for determining (a) the degree to which personal characteristics are important for the job, (b) the Department of Labor (DOL) and Occupational Information Network (O*NET, http://online.onetcenter.org) job codes, and (c) the degree to which the job is similar to other jobs in the Hogan archive for which prior validation research has been conducted. Hogan’s expert review revealed that personal characteristics make up a significant proportion of the important characteristics of Sales Representatives, which provides support for using a personality-based job analysis method. DOL and O*NET codes that were identified for the job are 17-3023 and 17-3023.01, respectively.
. Hogan experts’ content review of the job description revealed that Sales Representatives are responsible for electrical design, manufacturing, and production. Specifically, Sales Representatives tune, optimize, and prototype RF/Microwave circuits. (see Appendix A for a complete Sales Representative job description).
3.2 Job Analysis Survey. Hogan designed a standardized on-line job analysis survey to identify the critical worker-oriented requirements of Sales Representatives in terms of the key personal requirements and critical competencies required for effective performance. The Job Evaluation Tool (“JET”) consists of three components: (a) the Performance Improvement Characteristics (PIC) survey, (b) the Motivational Improvement Characteristics (MIC) survey, and (c) the Competency Evaluation Tool (CET). A copy of the JET appears in Appendix B.
3.3 Performance Improvement Characteristics. The PIC job analysis identifies (a) the personal characteristics needed to successfully execute the requirements of a job and (b) the degree to which possession of these personal characteristics improves job performance (Foster, Gaddis, & J. Hogan, 2009; J. Hogan & Rybicki,
21 Copyright Hogan Assessment Systems, Inc. 2014. All rights reserved.
1998). SMEs rated the PIC items using a scale ranging from “0” (Does Not Improve Performance) to “3” (Substantially Improves Performance).
The PIC is not intended for use in pre-employment decision-making. It is a job analysis tool designed solely to help identify the personal characteristics that are critical for success in a given job. Regardless, job analysis tools such as the PIC should provide documentation supporting the reliability and accuracy of scores. Results reported in the manual indicate that PIC scales’ internal consistency reliability estimates range between .76 (Adjustment) and .87 (Interpersonal Sensitivity); average internal consistency is .83. Test-retest reliability estimates based on at least a 1-month interval, range between .60 (Learning Approach) and .84 (Inquisitive); the average test-retest reliability is .71. Research indicates that the PIC differentiates between jobs, and scores on the PIC scales correspond to scales on the Hogan Personality Inventory (HPI; R. Hogan & J. Hogan, 1995, 2007) that predict successful job performance (Foster et al., 2009; Meyer & Foster, 2007; Rybicki, 1997).
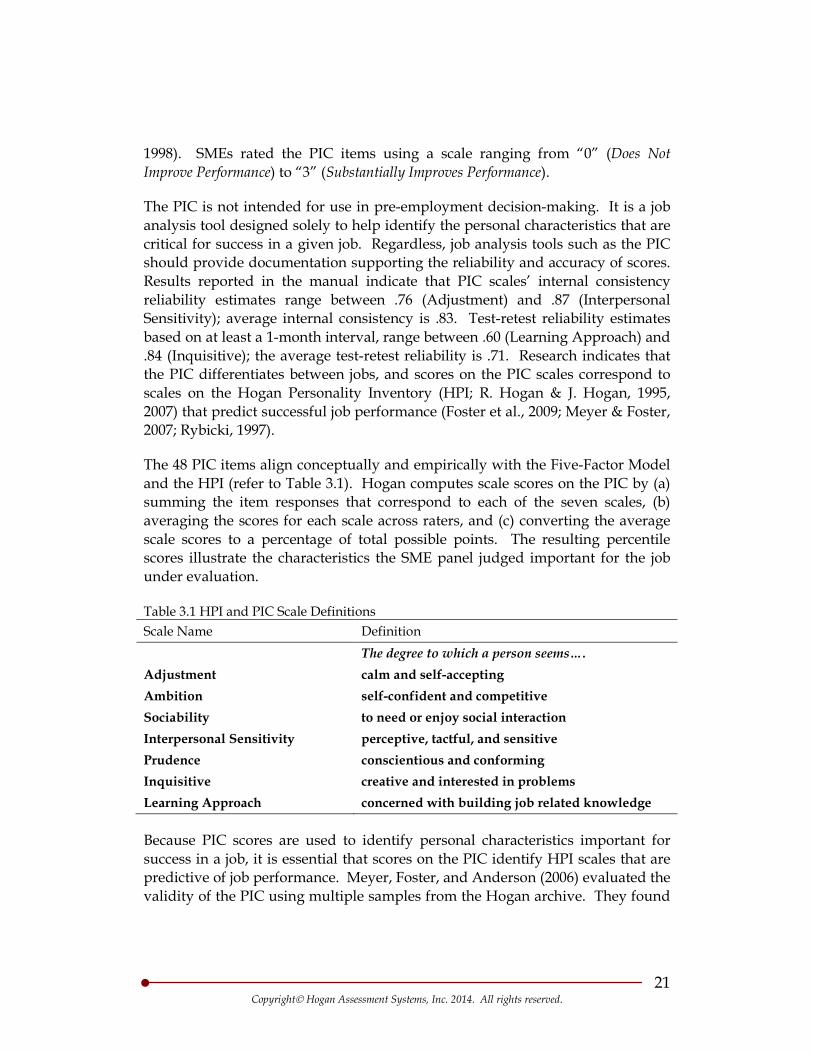
The 48 PIC items align conceptually and empirically with the Five-Factor Model and the HPI (refer to Table 3.1). Hogan computes scale scores on the PIC by (a) summing the item responses that correspond to each of the seven scales, (b) averaging the scores for each scale across raters, and (c) converting the average scale scores to a percentage of total possible points. The resulting percentile scores illustrate the characteristics the SME panel judged important for the job under evaluation.
Table 3.1 HPI and PIC Scale Definitions Scale Name Definition The degree to which a person seems…. Adjustment calm and self-accepting Ambition self-confident and competitive Sociability to need or enjoy social interaction Interpersonal Sensitivity perceptive, tactful, and sensitive Prudence conscientious and conforming Inquisitive creative and interested in problems Learning Approach concerned with building job related knowledge
Because PIC scores are used to identify personal characteristics important for success in a job, it is essential that scores on the PIC identify HPI scales that are predictive of job performance. Meyer, Foster, and Anderson (2006) evaluated the validity of the PIC using multiple samples from the Hogan archive. They found
22 Copyright Hogan Assessment Systems, Inc. 2014. All rights reserved.
that HPI profiles created using PIC results were more effective at predicting performance for target jobs than for other jobs. This research indicates that the PIC differentiates between jobs, and scores on PIC scales identify the HPI scales that predict job performance.
Providing validation results for a job analysis technique surpasses the guidelines and requirements described in either the Uniform Guidelines or Principles. In fact, the scientific literature contains virtually no discussion concerning empirical validation of a job analysis tool. A copy of the PIC appears as the Job Characteristics section of the JET in Appendix B.
3.4 PIC Results
Table 3.2 Raw Score PIC Means and Standard Deviations
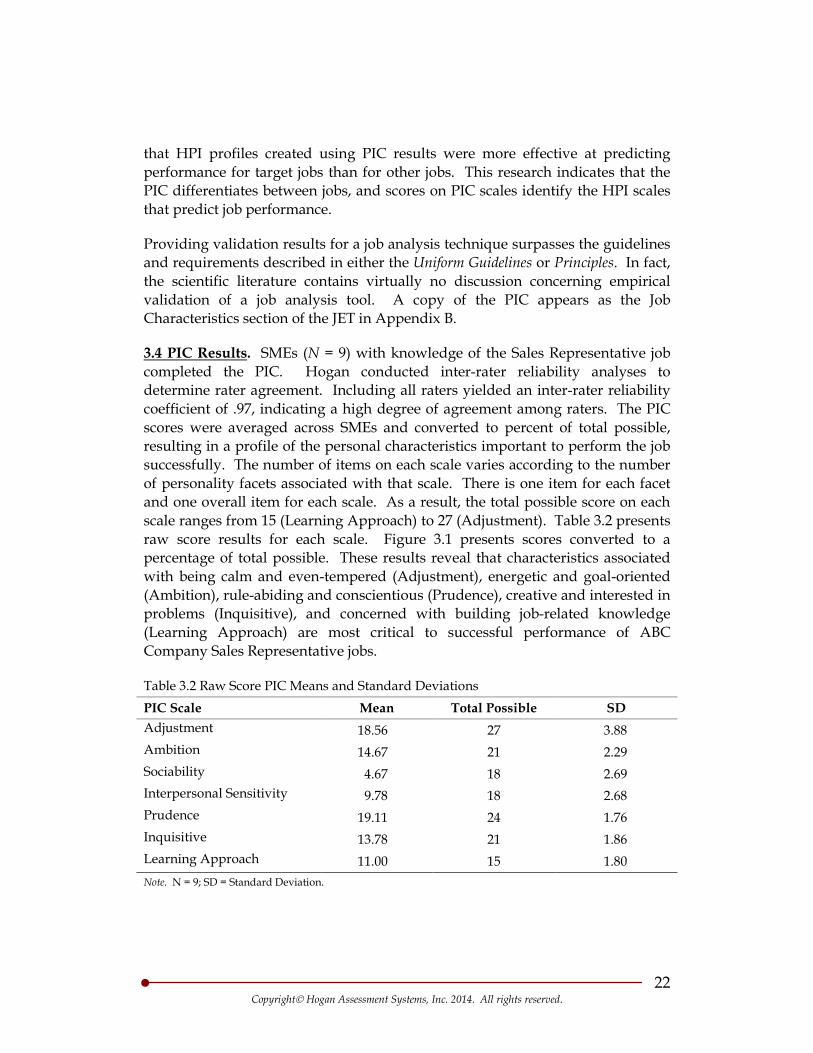
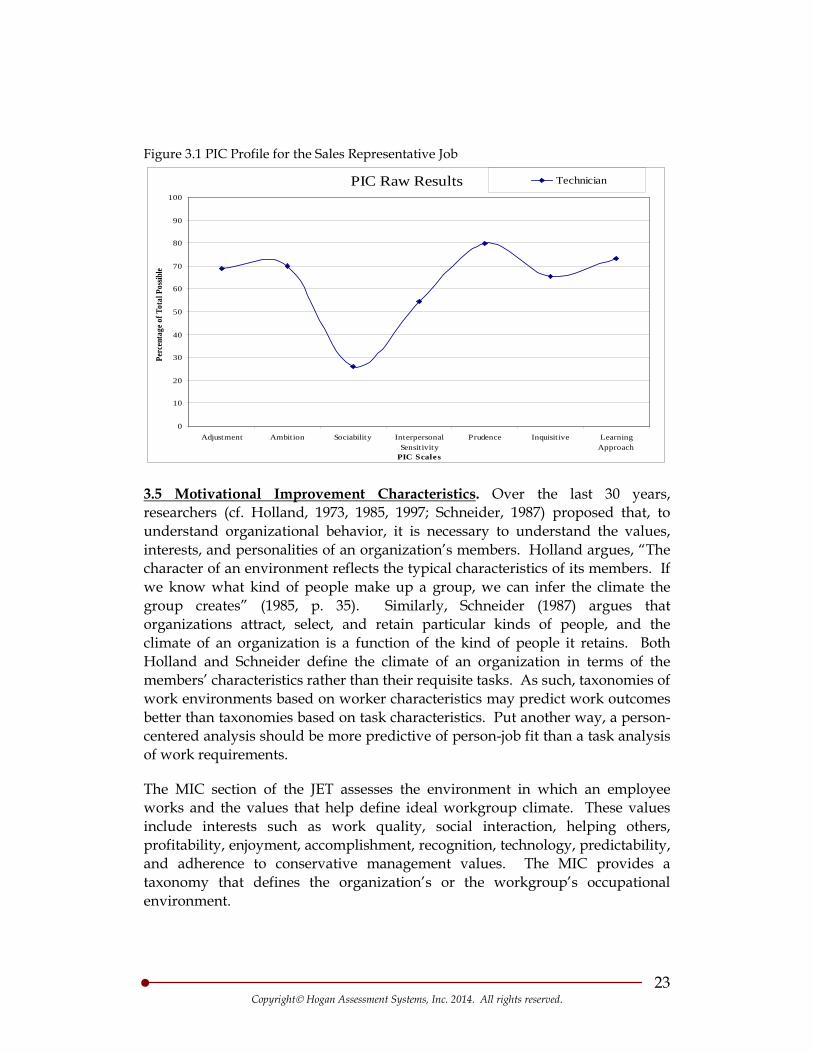
. SMEs (N = 9) with knowledge of the Sales Representative job completed the PIC. Hogan conducted inter-rater reliability analyses to determine rater agreement. Including all raters yielded an inter-rater reliability coefficient of .97, indicating a high degree of agreement among raters. The PIC scores were averaged across SMEs and converted to percent of total possible, resulting in a profile of the personal characteristics important to perform the job successfully. The number of items on each scale varies according to the number of personality facets associated with that scale. There is one item for each facet and one overall item for each scale. As a result, the total possible score on each scale ranges from 15 (Learning Approach) to 27 (Adjustment). Table 3.2 presents raw score results for each scale. Figure 3.1 presents scores converted to a percentage of total possible. These results reveal that characteristics associated with being calm and even-tempered (Adjustment), energetic and goal-oriented (Ambition), rule-abiding and conscientious (Prudence), creative and interested in problems (Inquisitive), and concerned with building job-related knowledge (Learning Approach) are most critical to successful performance of ABC Company Sales Representative jobs.
PIC Scale Mean Total Possible SD Adjustment 18.56 27 3.88 Ambition 14.67 21 2.29 Sociability 4.67 18 2.69 Interpersonal Sensitivity 9.78 18 2.68 Prudence 19.11 24 1.76 Inquisitive 13.78 21 1.86 Learning Approach 11.00 15 1.80 Note. N = 9; SD = Standard Deviation.
23 Copyright Hogan Assessment Systems, Inc. 2014. All rights reserved.
Figure 3.1 PIC Profile for the Sales Representative Job
PIC Raw Results
0
10
20
30
40
50
60
70
80
90
100
Adjustment Ambition Sociability InterpersonalSensitivity
Prudence Inquisitive LearningApproach
PIC Scales
Perc
enta
ge o
f Tot
al P
ossib
le
Technician
3.5 Motivational Improvement Characteristics
The MIC section of the JET assesses the environment in which an employee works and the values that help define ideal workgroup climate. These values include interests such as work quality, social interaction, helping others, profitability, enjoyment, accomplishment, recognition, technology, predictability, and adherence to conservative management values. The MIC provides a taxonomy that defines the organization’s or the workgroup’s occupational environment.
. Over the last 30 years, researchers (cf. Holland, 1973, 1985, 1997; Schneider, 1987) proposed that, to understand organizational behavior, it is necessary to understand the values, interests, and personalities of an organization’s members. Holland argues, “The character of an environment reflects the typical characteristics of its members. If we know what kind of people make up a group, we can infer the climate the group creates” (1985, p. 35). Similarly, Schneider (1987) argues that organizations attract, select, and retain particular kinds of people, and the climate of an organization is a function of the kind of people it retains. Both Holland and Schneider define the climate of an organization in terms of the members’ characteristics rather than their requisite tasks. As such, taxonomies of work environments based on worker characteristics may predict work outcomes better than taxonomies based on task characteristics. Put another way, a person-centered analysis should be more predictive of person-job fit than a task analysis of work requirements.
24 Copyright Hogan Assessment Systems, Inc. 2014. All rights reserved.
The MIC contains 40 items across 10 dimensions that are rated using a scale ranging from “0” (Does Not Describe the Work Group) to “3” (Substantially Describes the Work Group), resulting in a total possible raw score of 12 for each dimension. The names and descriptions of the scales comprising the MIC appear in Table 3.3. Hogan computes scale scores on the MIC by (a) summing the item responses that correspond to each of the eleven scales, (b) averaging the scores for each scale across raters, and (c) converting the average scale scores to a percentage of total possible points. The resulting percentile scores illustrate the characteristics the SME panel judged important for the job under evaluation. A copy of the MIC appears as the Work Preferences section of the JET in Appendix B. The 40 items align with the ten MVPI scales, as shown in Table 3.3.
Table 3.3 MVPI and MIC Scale Definitions Scale Name Definition The degree to which a person values… Aesthetics work quality and artistic endeavors Affiliation friendship and social interaction Altruistic helping and caring for others Commerce business and financial matters Hedonism fun and having a good time Power accomplishment and competition Recognition praise and recognition Science the pursuit of knowledge Security certainty and predictability in life Tradition history and old-fashioned virtues
3.6 MIC Results
Table 3.4 Raw Score MIC Means and Standard Deviations
. SMEs (N = 9) rated the 40 MIC items. Including all raters in subsequent reliability analyses yielded an inter-rater reliability coefficient of .82, indicating a good degree of agreement among raters. Table 3.4 presents raw score results for each scale. Figure 3.2 presents scores converted to a percentage of total possible.
MIC Scales Mean Standard Deviation
Aesthetics 4.89 1.90 Affiliation 5.00 2.35 Altruistic 6.11 2.42
25 Copyright Hogan Assessment Systems, Inc. 2014. All rights reserved.
Table 3.4 Raw Score MIC Means and Standard Deviations (continued) MIC Scales Mean Standard Deviation
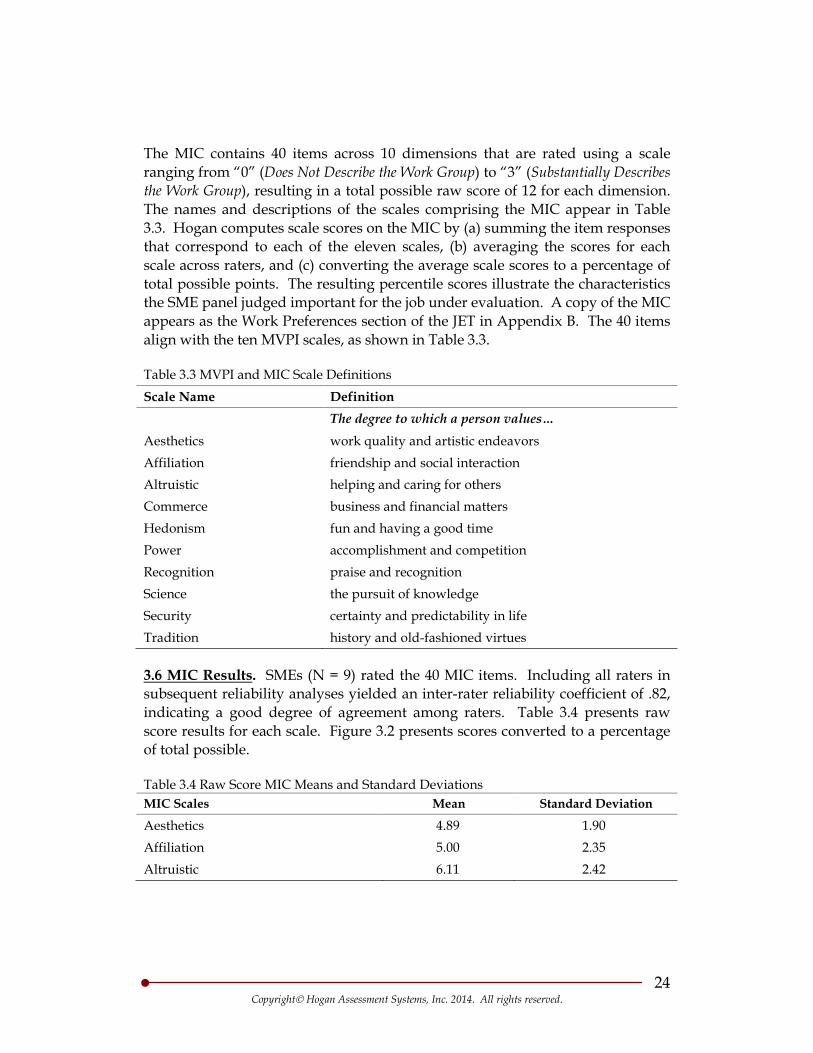
Commerce 5.11 2.42 Hedonism 3.78 2.28 Power 9.00 2.78 Recognition 2.22 1.39 Science 5.44 2.19 Security 6.56 1.94 Tradition 5.67 2.87 Note. N = 9.
As shown in Table 3.4 and Figure 3.2, SMEs rated values associated with Power, as defining ideal environmental characteristics. This pattern of scores suggests an environment characterized by achievement and influence (Power). Conversely, SMEs rated characteristics associated with fun and pleasure (Hedonism) and acknowledgement (Recognition) as being the least relevant to ABC Company Sales Representative performance.
Figure 3.2 MIC Profile for the Sales Representative Job
MIC Raw Results
0
10
20
30
40
50
60
70
80
90
100
Aesthetic
Affiliati
on
Altruisti
c
Commerce
Hedonis
ticPower
Recognitio
nScie
nce
Security
Traditio
n
MICScales
Perc
enta
ge of
Tot
al Po
ssible
Technician
26 Copyright Hogan Assessment Systems, Inc. 2014. All rights reserved.
3.7 Competency Evaluation Tool
Bartram (2005) analyzed the structure of the universe of competencies, which he defined as “sets of behaviors that are instrumental to the delivery of desired results” (Bartram, Robertson, & Callinan, 2002, p. 7). He began with two metaconcepts that corresponded with “getting along” and “getting ahead.” He expanded the metaconcepts to include eight broad competency factors—the “Great Eight.” Competencies that promote getting along include Supporting and Cooperating, Interacting and Presenting, Organizing and Executing, and Adapting and Coping; competencies that promote getting ahead included Leading and Deciding, Analyzing and Interpreting, Creating and Conceptualizing, and Enterprising and Performing. Bartram’s competencies overlap with the generalized work activities that Jeanneret, Borman, Kubisiak, and Hanson (1999) proposed as a comprehensive taxonomy of work behaviors required in the US economy.
. McClelland and his colleagues (e.g., Boyatzis, 1982) introduced the concept of competency, which they defined as performance capabilities that distinguish effective from ineffective personnel. McClelland defined competencies empirically in terms of the requirements of particular jobs in particular contexts. This rigorous approach is rare in a field characterized by ad hoc competency models. The Principles recognize that competency modeling is used by many organizations as a means for describing broad requirements for a wide range of jobs. Every existing competency model can be organized in terms of a “domain model” first proposed by Warrenfeltz (1995). The model includes four domains: (a) Intrapersonal skills, (b) Interpersonal skills, (c) Technical skills, and (d) Leadership skills. R. Hogan and Warrenfeltz (2003) argued that these four domains form a natural, overlapping developmental sequence, with development of the later skills depending on the appropriate development of the earlier skills. These domains also form a hierarchy of trainability, in which the earlier skills are harder to train than the later skills.
The CET is designed to serve as a comprehensive list of competencies that appear in (or can be translated from) the major taxonomic sources, including the Great Eight. The CET asks SMEs to indicate the degree to which each of 56 listed competencies is related to successful performance in the job or job family under study. Each listed competency is accompanied by a brief definition. Raters are asked to evaluate each competency using a five-point scale ranging from “0” (Not associated with job performance) to “4” (Critical to job performance). Generally, competencies considered critical are those that receive mean ratings greater than “3,” where the scale anchor is labeled “Important to performance.” The SME ratings provide a basis for structural models to examine comparability of job
27 Copyright Hogan Assessment Systems, Inc. 2014. All rights reserved.
domains and their competencies across jobs within and across families (J. Hogan, Davies, & R. Hogan, 2007).
3.8 CET Results
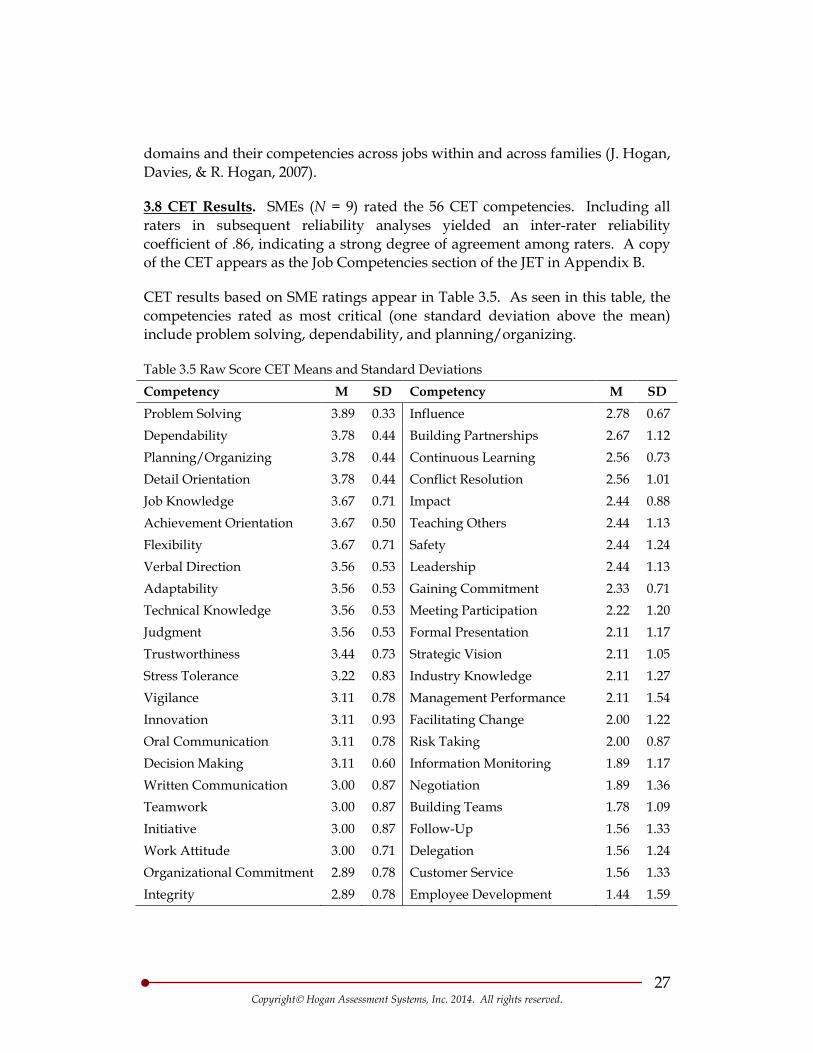
CET results based on SME ratings appear in Table 3.5. As seen in this table, the competencies rated as most critical (one standard deviation above the mean) include problem solving, dependability, and planning/organizing.
. SMEs (N = 9) rated the 56 CET competencies. Including all raters in subsequent reliability analyses yielded an inter-rater reliability coefficient of .86, indicating a strong degree of agreement among raters. A copy of the CET appears as the Job Competencies section of the JET in Appendix B.
Table 3.5 Raw Score CET Means and Standard Deviations Competency M SD Competency M SD Problem Solving 3.89 0.33 Influence 2.78 0.67 Dependability 3.78 0.44 Building Partnerships 2.67 1.12 Planning/Organizing 3.78 0.44 Continuous Learning 2.56 0.73 Detail Orientation 3.78 0.44 Conflict Resolution 2.56 1.01 Job Knowledge 3.67 0.71 Impact 2.44 0.88 Achievement Orientation 3.67 0.50 Teaching Others 2.44 1.13 Flexibility 3.67 0.71 Safety 2.44 1.24 Verbal Direction 3.56 0.53 Leadership 2.44 1.13 Adaptability 3.56 0.53 Gaining Commitment 2.33 0.71 Technical Knowledge 3.56 0.53 Meeting Participation 2.22 1.20 Judgment 3.56 0.53 Formal Presentation 2.11 1.17 Trustworthiness 3.44 0.73 Strategic Vision 2.11 1.05 Stress Tolerance 3.22 0.83 Industry Knowledge 2.11 1.27 Vigilance 3.11 0.78 Management Performance 2.11 1.54 Innovation 3.11 0.93 Facilitating Change 2.00 1.22 Oral Communication 3.11 0.78 Risk Taking 2.00 0.87 Decision Making 3.11 0.60 Information Monitoring 1.89 1.17 Written Communication 3.00 0.87 Negotiation 1.89 1.36 Teamwork 3.00 0.87 Building Teams 1.78 1.09 Initiative 3.00 0.87 Follow-Up 1.56 1.33 Work Attitude 3.00 0.71 Delegation 1.56 1.24 Organizational Commitment 2.89 0.78 Customer Service 1.56 1.33 Integrity 2.89 0.78 Employee Development 1.44 1.59
28 Copyright Hogan Assessment Systems, Inc. 2014. All rights reserved.
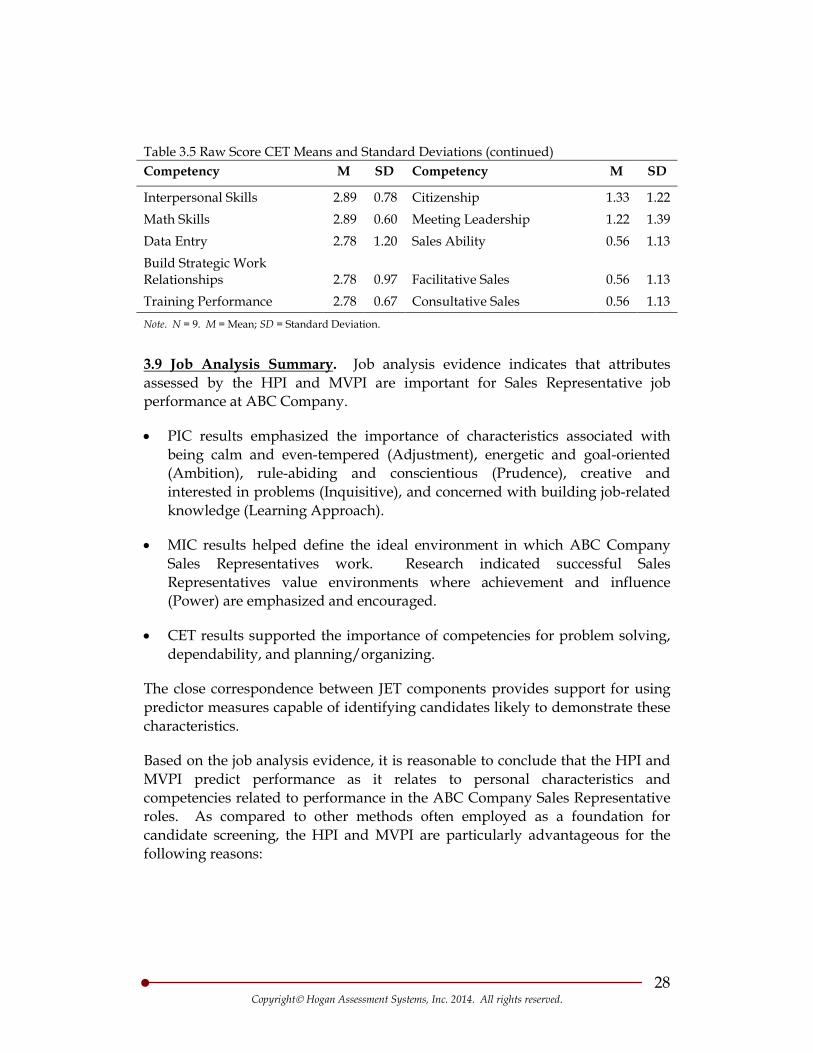
Table 3.5 Raw Score CET Means and Standard Deviations (continued) Competency M SD Competency M SD
Interpersonal Skills 2.89 0.78 Citizenship 1.33 1.22 Math Skills 2.89 0.60 Meeting Leadership 1.22 1.39 Data Entry 2.78 1.20 Sales Ability 0.56 1.13 Build Strategic Work Relationships 2.78 0.97 Facilitative Sales 0.56 1.13 Training Performance 2.78 0.67 Consultative Sales 0.56 1.13 Note. N = 9. M = Mean; SD = Standard Deviation.
3.9 Job Analysis Summary
• PIC results emphasized the importance of characteristics associated with being calm and even-tempered (Adjustment), energetic and goal-oriented (Ambition), rule-abiding and conscientious (Prudence), creative and interested in problems (Inquisitive), and concerned with building job-related knowledge (Learning Approach).
. Job analysis evidence indicates that attributes assessed by the HPI and MVPI are important for Sales Representative job performance at ABC Company.
• MIC results helped define the ideal environment in which ABC Company Sales Representatives work. Research indicated successful Sales Representatives value environments where achievement and influence (Power) are emphasized and encouraged.
• CET results supported the importance of competencies for problem solving, dependability, and planning/organizing.
The close correspondence between JET components provides support for using predictor measures capable of identifying candidates likely to demonstrate these characteristics.
Based on the job analysis evidence, it is reasonable to conclude that the HPI and MVPI predict performance as it relates to personal characteristics and competencies related to performance in the ABC Company Sales Representative roles. As compared to other methods often employed as a foundation for candidate screening, the HPI and MVPI are particularly advantageous for the following reasons:

29 Copyright Hogan Assessment Systems, Inc. 2014. All rights reserved.
• Besides overall job performance, personality measures predict counterproductive work behaviors (Berry, Ones, & Sackett, 2007), team performance (Bell, 2007; Peeters, Van Tuijl, Rutte, & Reyman, 2006), and expatriate performance (Mol, Born, Willemsen, & Van Der Molen, 2005).
• Including personality measures within traditional selection batteries is one way to decrease the likelihood of adverse impact against minority groups (Campbell, 1996); using personality results in smaller group differences than those found for ability measures (Foldes, Duehr, & Ones, 2008).
• Cognitive ability measures tend to predict technical performance, not interpersonal skills or initiative. Moreover, these tools tend to discriminate in terms of gender, age, and race/ethnicity (Hausdorf, LeBlanc, & Chawla, 2003).
• Biodata measures tend to be custom-developed tools (Bliesener, 1996), not readily available in an off-the-shelf form, and tend to lack the structure and interpretability necessary to enable professional development.
• Work sample measures and assessment centers, while valid, tend to discriminate in terms of race and ethnicity much more than previously thought (Dean, Roth, & Bobko, 2008; Roth, Bobko, McFarland, & Buster, 2008).
• Integrity tests predict counterproductive work behaviors, yet appear highly related to existing FFM measures and begs the question: “what is left in integrity beyond the Big Five?” (Berry, Sackett, & Wiemann, 2007, p. 278).
• Although face valid, interviews tend to be subjective and need structure in order to be a strong predictor of job performance (McDaniel, Whetzel, Schmidt, & Mauer, 1994).
30 Copyright Hogan Assessment Systems, Inc. 2014. All rights reserved.
4 – META-ANALYSIS RESULTS FOR EVALUATING VALIDITY GENERALIZATION OF PERSONALITY MEASURES
Prior to 1977, criterion-related validity research involved testing the hypothesis that a particular predictor variable (e.g., a cognitive ability measure) covaried reliably with a particular criterion variable (e.g., performance in training). Researchers then repeated this test using different samples, predictors, and criterion measures. Not surprisingly, results from these studies often differed between locations with similar jobs, and this variability made firm generalizations difficult. More importantly, this variability challenged the scientific integrity of the entire enterprise of personnel selection.
Researchers often explained the differences in study results in terms of situational specificity, the view that the validity of a measure is specific to the contexts and jobs under study (Gatewood & Feild, 1994; Ghiselli, 1966; Ghiselli & Brown, 1955); these differences required conducting separate validation studies for each organization, job, or group of employees. Using a large database, Schmidt and Hunter (1977) presented evidence showing that the variability in validity coefficients in single-location studies was due to statistical and procedural factors (Guion, 1998, p. 368)—idiosyncratic factors that could be ignored or statistically corrected.
Many psychologists now agree that “validity” is a unitary concept, not a type of method or an attribute of a test. Guion and Highouse (2006, p. 134) define validity as “a property of the inferences drawn from test scores.” In addition, many psychologists now agree that more ways exist to assess the validity of inferences from test scores than a specific local study of their relationship with job relevant criteria (McPhail, 2007). When available, researchers may use Validity Generalization (VG) evidence in place of local validation studies to support the use of a selection procedure (Gatewood & Feild, 1994; Society for Industrial and Organizational Psychology, 2003). As indicated by the Principles:
At times, sufficient accumulated validity evidence is available for a selection procedure to justify its use in a new situation without conducting a local validation research study. In these instances, use of the selection procedure may be based on demonstration of the generalized validity inferences from that selection procedure, coupled with a compelling argument for its applicability to the current situation. Although neither mutually exclusive nor exhaustive, several
31 Copyright Hogan Assessment Systems, Inc. 2014. All rights reserved.
strategies for generalizing validity evidence have been delineated: (a) transportability, (b) synthetic validity/job component validity, and (c) meta-analytic validity generalization (p. 27).
Schmidt and Hunter (1977) introduced meta-analysis to psychometric research. Meta-analysis is a methodology for aggregating correlation coefficients from independent studies testing the same hypothesis. They argued that differences in a test’s validity across studies reflect statistical artifacts (e.g., sampling deficiency) and measurement problems (e.g., predictor/criterion unreliability, range restriction) and not unique jobs or situations. Subsequent research suggests that the correlations between performance measures and cognitive ability tests (Hunter, 1980; Schmidt & Hunter, 1977), biographical data inventories (Schmidt & Rothstein, 1994), personality inventories (Barrick & Mount, 1991; Barrick, Mount, & Gupta, 2003; Berry et al., 2007; Dudley, Orvis, Lebiecki, & Cortina, 2006; J. Hogan & Holland, 2003; Judge, Bono, Ilies, & Gerhardt, 2002; Salgado, 1997, 1998; Tett, Jackson, & Rothstein, 1991), assessment center exercises (Arthur, Day, McNelly, & Edens, 2003; Meriac, Hoffman, Woehr, & Fleisher, 2008), and situational judgment tests (McDaniel, Morgeson, Finnegan, Campion, & Braverman, 2001) generalize across studies.
The Principles recognize meta-analysis as a method “that can be used to determine the degree to which predictor-criterion relationships are specific to the situations in which the validity data have been gathered or are generalizable to other situations, as well as to determine the sources of cross-situation variability” (Aguinis & Pierce, 1998, p. 28). Of the three VG methods, meta-analysis provides the most generalizable results, but relies exclusively on criterion-related validity studies. Transportability and synthetic/job component validity research is less generalizable, but can use either content or criterion-related research as source data. J. Hogan et al. (2007) demonstrate the use of all three methods in combination.
Meta-analysis averages findings from multiple studies of the same relationship to provide a best estimate of ρ (i.e., the population correlation) by controlling for error due to sampling, measurement range restriction, and unreliability in predictor and criterion measures (Smith & Glass, 1977). In addition, meta-analyses include carefully developed criteria for deciding what studies to include, what variables to code, effect size comparisons, and moderator identification. Ideally, a meta-analysis includes all relevant studies. However, this is often impossible because researchers are less likely to publish studies with insignificant results. Rosenthal (1979) notes that such omissions are problematic
32 Copyright Hogan Assessment Systems, Inc. 2014. All rights reserved.
for meta-analysis research as they produce results based on too few studies, small sample sizes, and an atheoretical base.
According to the Principles, “reliance on meta-analysis results is more straightforward when they are organized around a construct or set of constructs” (p. 30). Schmidt and Hunter (1977) used a construct orientation in their well-known meta-analysis of cognitive ability measures. J. Hogan and Holland (2003) did the same using a domain skills model as the basis for a meta-analysis of the validity of personality predictors (see Table 4.2). A construct driven approach has two advantages. First, theory drives professional judgment, which is unavoidable when compiling data from multiple studies. Second, a theory-driven approach provides a framework for interpreting the results.
The next section reviews evidence accumulated from large-scale meta-analyses and empirical studies that support the proposition that personality measures are valid predictors of job performance across occupational groups.
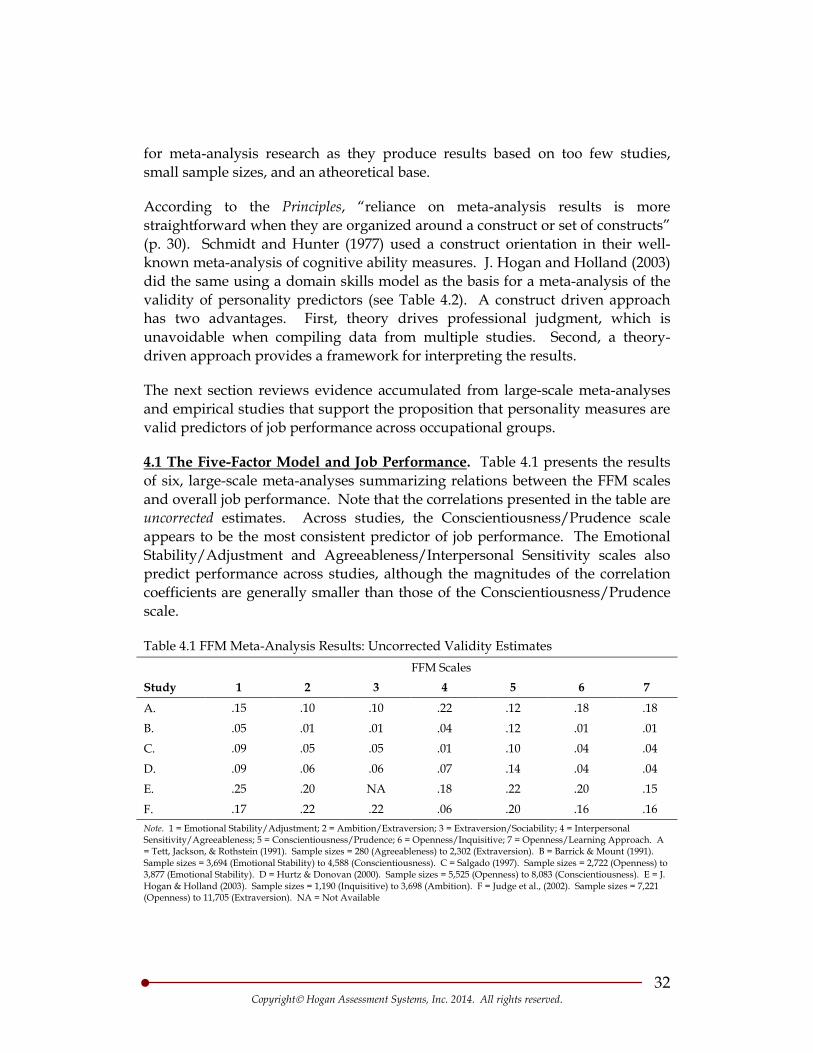
4.1 The Five-Factor Model and Job Performance
Table 4.1 FFM Meta-Analysis Results: Uncorrected Validity Estimates
. Table 4.1 presents the results of six, large-scale meta-analyses summarizing relations between the FFM scales and overall job performance. Note that the correlations presented in the table are uncorrected estimates. Across studies, the Conscientiousness/Prudence scale appears to be the most consistent predictor of job performance. The Emotional Stability/Adjustment and Agreeableness/Interpersonal Sensitivity scales also predict performance across studies, although the magnitudes of the correlation coefficients are generally smaller than those of the Conscientiousness/Prudence scale.
FFM Scales Study 1 2 3 4 5 6 7
A. .15 .10 .10 .22 .12 .18 .18
B. .05 .01 .01 .04 .12 .01 .01
C. .09 .05 .05 .01 .10 .04 .04
D. .09 .06 .06 .07 .14 .04 .04
E. .25 .20 NA .18 .22 .20 .15
F. .17 .22 .22 .06 .20 .16 .16 Note. 1 = Emotional Stability/Adjustment; 2 = Ambition/Extraversion; 3 = Extraversion/Sociability; 4 = Interpersonal Sensitivity/Agreeableness; 5 = Conscientiousness/Prudence; 6 = Openness/Inquisitive; 7 = Openness/Learning Approach. A = Tett, Jackson, & Rothstein (1991). Sample sizes = 280 (Agreeableness) to 2,302 (Extraversion). B = Barrick & Mount (1991). Sample sizes = 3,694 (Emotional Stability) to 4,588 (Conscientiousness). C = Salgado (1997). Sample sizes = 2,722 (Openness) to 3,877 (Emotional Stability). D = Hurtz & Donovan (2000). Sample sizes = 5,525 (Openness) to 8,083 (Conscientiousness). E = J. Hogan & Holland (2003). Sample sizes = 1,190 (Inquisitive) to 3,698 (Ambition). F = Judge et al., (2002). Sample sizes = 7,221 (Openness) to 11,705 (Extraversion). NA = Not Available
33 Copyright Hogan Assessment Systems, Inc. 2014. All rights reserved.
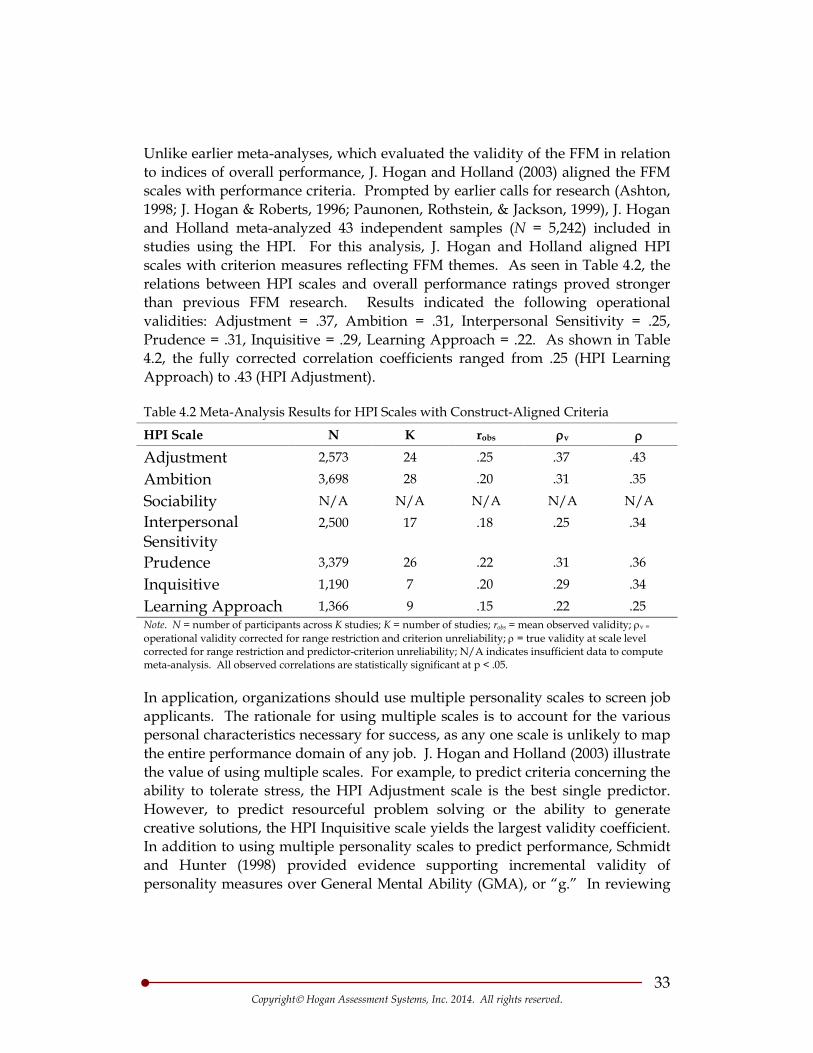
Unlike earlier meta-analyses, which evaluated the validity of the FFM in relation to indices of overall performance, J. Hogan and Holland (2003) aligned the FFM scales with performance criteria. Prompted by earlier calls for research (Ashton, 1998; J. Hogan & Roberts, 1996; Paunonen, Rothstein, & Jackson, 1999), J. Hogan and Holland meta-analyzed 43 independent samples (N = 5,242) included in studies using the HPI. For this analysis, J. Hogan and Holland aligned HPI scales with criterion measures reflecting FFM themes. As seen in Table 4.2, the relations between HPI scales and overall performance ratings proved stronger than previous FFM research. Results indicated the following operational validities: Adjustment = .37, Ambition = .31, Interpersonal Sensitivity = .25, Prudence = .31, Inquisitive = .29, Learning Approach = .22. As shown in Table 4.2, the fully corrected correlation coefficients ranged from .25 (HPI Learning Approach) to .43 (HPI Adjustment).
Table 4.2 Meta-Analysis Results for HPI Scales with Construct-Aligned Criteria
HPI Scale N K robs ρv ρ
Adjustment 2,573 24 .25 .37 .43
Ambition 3,698 28 .20 .31 .35
Sociability N/A N/A N/A N/A N/A Interpersonal Sensitivity
2,500 17 .18 .25 .34
Prudence 3,379 26 .22 .31 .36
Inquisitive 1,190 7 .20 .29 .34
Learning Approach 1,366 9 .15 .22 .25 Note. N = number of participants across K studies; K = number of studies; robs = mean observed validity; ρv =
operational validity corrected for range restriction and criterion unreliability; ρ = true validity at scale level corrected for range restriction and predictor-criterion unreliability; N/A indicates insufficient data to compute meta-analysis. All observed correlations are statistically significant at p < .05.
In application, organizations should use multiple personality scales to screen job applicants. The rationale for using multiple scales is to account for the various personal characteristics necessary for success, as any one scale is unlikely to map the entire performance domain of any job. J. Hogan and Holland (2003) illustrate the value of using multiple scales. For example, to predict criteria concerning the ability to tolerate stress, the HPI Adjustment scale is the best single predictor. However, to predict resourceful problem solving or the ability to generate creative solutions, the HPI Inquisitive scale yields the largest validity coefficient. In addition to using multiple personality scales to predict performance, Schmidt and Hunter (1998) provided evidence supporting incremental validity of personality measures over General Mental Ability (GMA), or “g.” In reviewing
34 Copyright Hogan Assessment Systems, Inc. 2014. All rights reserved.
over 85 years of selection research, Schmidt and Hunter showed that adding a measure of Conscientiousness to GMA tests improved validity by 18%. Furthermore, the addition of an integrity measure to GMA improved validity by 27%, the largest increment across 18 other selection measures (e.g., work sample tests, interviews, job knowledge, biographical data, and assessment centers).
Across studies represented in Tables 4.1 and 4.2, the meta-analysis results support the generalizability of the Conscientiousness/Prudence, Emotional Stability/Adjustment, and Agreeableness/Interpersonal Sensitivity measures across occupations and industries. Moreover, the results from J. Hogan and Holland (2003) support the generalizability of every scale on the HPI except Sociability for predicting personality-saturated criteria. Empirical evidence supports validity generalization of three FFM measures (Conscientiousness, Emotional Stability, and Agreeableness) in general, and six of the seven HPI scales in particular.
4.2 Personality-Based Validity Coefficient Benchmarking
The assessment literature includes many studies that evaluate the validity of the FFM personality measures across jobs, organizations, and industry types. Hough and Oswald (2008) summarize some of the major findings. These studies reflect the appropriate benchmark from which to evaluate the validity of the FFM scales. By comparing validity coefficients found in this technical report to the validity coefficients reported in the peer-reviewed literature, it is possible to derive some general conclusions about the validity and utility of potential personality predictors of job performance.
. Criteria used to designate a “meaningful” predictor-criterion correlation remain poorly defined. Consequently, researchers define the meaningfulness of a correlation solely on its magnitude, which is reasonable but not sufficient. Interpreting the usefulness of a correlation coefficient based solely on magnitude is one strategy, since the percentage of variance accounted for in the criterion increases with the magnitude of the correlation. However, at what point does the magnitude of a correlation become “meaningful”? Is it .10, .20, .30, or .70? Rather than focus exclusively on the magnitude of observed correlation coefficients, a benchmarking strategy is more appropriate.
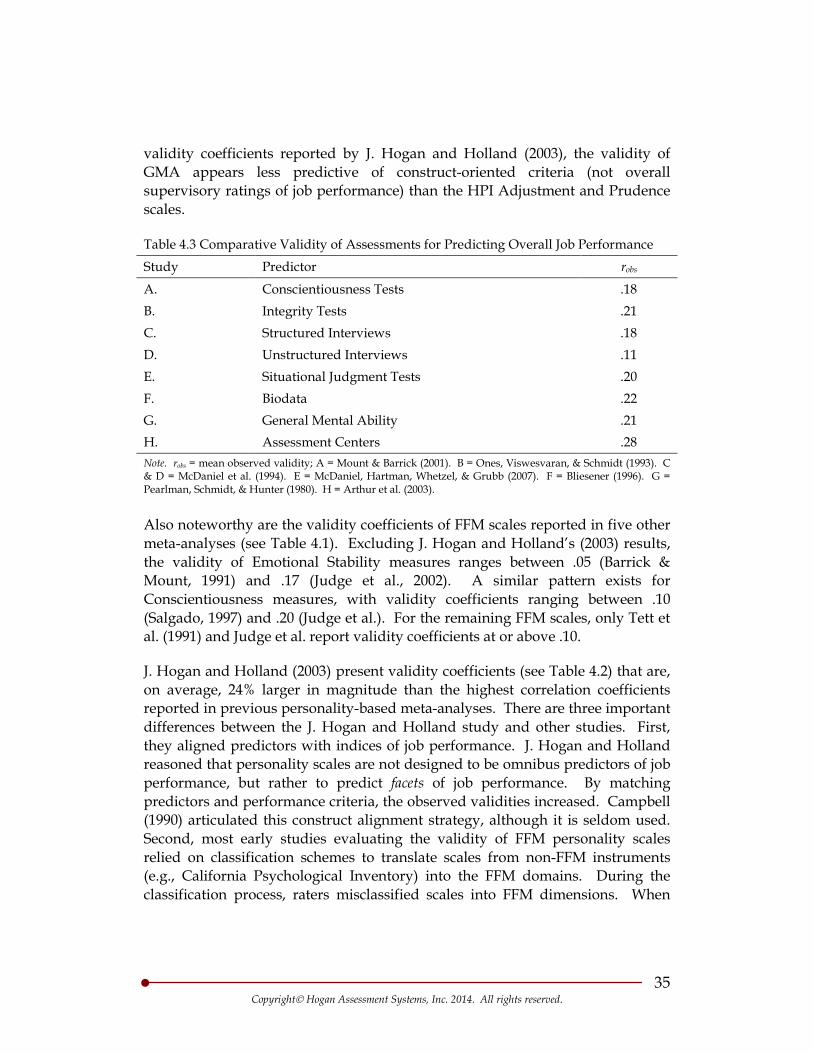
To establish a benchmark from which to compare the generalized validity coefficients presented in this report, Table 4.3 summarizes the sample-weighted validity coefficients of various predictors reported in the scientific literature. The sample-weighted validity of GMA tests, which are widely regarded as the “best” predictors of job performance, is only r = .21. Relative to the sample-weighted
35 Copyright Hogan Assessment Systems, Inc. 2014. All rights reserved.
validity coefficients reported by J. Hogan and Holland (2003), the validity of GMA appears less predictive of construct-oriented criteria (not overall supervisory ratings of job performance) than the HPI Adjustment and Prudence scales.
Table 4.3 Comparative Validity of Assessments for Predicting Overall Job Performance
Study Predictor robs
A. Conscientiousness Tests .18 B. Integrity Tests .21 C. Structured Interviews .18 D. Unstructured Interviews .11 E. Situational Judgment Tests .20 F. Biodata .22 G. General Mental Ability .21 H. Assessment Centers .28 Note. robs = mean observed validity; A = Mount & Barrick (2001). B = Ones, Viswesvaran, & Schmidt (1993). C & D = McDaniel et al. (1994). E = McDaniel, Hartman, Whetzel, & Grubb (2007). F = Bliesener (1996). G = Pearlman, Schmidt, & Hunter (1980). H = Arthur et al. (2003).
Also noteworthy are the validity coefficients of FFM scales reported in five other meta-analyses (see Table 4.1). Excluding J. Hogan and Holland’s (2003) results, the validity of Emotional Stability measures ranges between .05 (Barrick & Mount, 1991) and .17 (Judge et al., 2002). A similar pattern exists for Conscientiousness measures, with validity coefficients ranging between .10 (Salgado, 1997) and .20 (Judge et al.). For the remaining FFM scales, only Tett et al. (1991) and Judge et al. report validity coefficients at or above .10.
J. Hogan and Holland (2003) present validity coefficients (see Table 4.2) that are, on average, 24% larger in magnitude than the highest correlation coefficients reported in previous personality-based meta-analyses. There are three important differences between the J. Hogan and Holland study and other studies. First, they aligned predictors with indices of job performance. J. Hogan and Holland reasoned that personality scales are not designed to be omnibus predictors of job performance, but rather to predict facets of job performance. By matching predictors and performance criteria, the observed validities increased. Campbell (1990) articulated this construct alignment strategy, although it is seldom used. Second, most early studies evaluating the validity of FFM personality scales relied on classification schemes to translate scales from non-FFM instruments (e.g., California Psychological Inventory) into the FFM domains. During the classification process, raters misclassified scales into FFM dimensions. When
36 Copyright Hogan Assessment Systems, Inc. 2014. All rights reserved.
errors like this occur, validity decreases. Finally, J. Hogan and Holland relied on a single personality tool (HPI), which eliminated the possibility of coding or classification errors. Together these three factors help untangle the personality literature and establish the appropriate benchmark from which to evaluate the validity of personality scales in occupational settings.
4.3 Summary of Meta-Analysis Results for Generalizing Validity of Five-Factor Model Personality Measures
Based on meta-analysis results for personality measures, we conclude that an assessment of Conscientiousness, Emotional Stability, and Agreeableness should generalize and predict performance for Sales Representatives. The next section reviews evidence accumulated from a meta-analysis conducted at the job family level based on the Hogan archive.
. Researchers are skeptical about the merits of some procedures used in meta-analyses. In particular, they believe corrections can be used inappropriately to overestimate predictor-criterion relationships. Nonetheless, the meta-analyses described above provide lower bound estimates of the validity of personality measures for predicting job performance. Reviewing the research on meta-analysis evidence permits certain conclusions. First, meta-analysis results strongly support the validity of Conscientiousness measures for predicting various job criteria, including overall job performance. Second, evidence to support the generalized validity of Emotional Stability and Agreeableness for job performance is moderate to strong, particularly as the criterion becomes more saturated with requirements for interpersonal skill(s). Lastly, the validity coefficients for Extraversion/Surgency measures (particularly the HPI Ambition scale) are strong for predicting criteria associated with achieving results and leading others. The remaining Five Factor dimension—Intellect/Openness to Experience—is not as generalizable as the others because it is relevant for a smaller range of jobs and criteria.
4.4 Meta-Analysis Evidence for Generalizing Validity of the HPI at the Job Family Level. The Hogan archive contains hundreds of studies examining jobs classified into seven job families. Based on studies within each job family, we meta-analyzed validity coefficients for each HPI scale. Hogan used the procedures specified by Hunter and Schmidt (1990) to accumulate results across studies and assess effect sizes. All studies used zero-order product-moment correlations, which eliminated the need to convert alternative statistics to values of r. We report operational validities, which we have corrected for sampling error, unreliability in the criterion measure, and range restriction. We did not correct correlation coefficients for predictor unreliability to estimate validity at the construct level. Although some (e.g., Mount & Barrick, 1995; Ones,
37 Copyright Hogan Assessment Systems, Inc. 2014. All rights reserved.
Viswesvaran, & Schmidt, 1993) argue this is a relevant artifact that can be corrected, Hogan believes it is premature to estimate the validity of a perfect construct when there is no firm agreement on the definition of the construct itself. Results, therefore, represent relationships between HPI scales and job performance.
Hunter and Schmidt (1990) argue that samples should contribute the same number of correlations to meta-analysis results to avoid bias. Hogan averaged correlations within studies so that each sample contributed only one point estimate per predictor scale. For example, if more than one criterion was available for any study, we averaged the correlations between each predictor scale and those criteria to derive a single point estimate of the predictor-criterion relationship. Note that this procedure uses both negative and positive correlations rather than mean absolute values for averaging correlations. This is the major computational difference between the current analyses and those presented by Tett et al. (1991, p. 712).
Hogan also computed a range restriction index for HPI scales. Following procedures described by Hunter and Schmidt (1990), Hogan divided each HPI scale’s within-study standard deviation by the standard deviation reported by R. Hogan and J. Hogan (1995). This procedure produced an index of range restriction for each HPI scale for each study. We used mean replacement within job family to estimate range restriction correction factors when within study standard deviation was unavailable.
Although some researchers (e.g., Murphy & De Shon, 2000) argue against the use of rater-based reliability estimates, Hogan followed procedures outlined by Barrick and Mount (1991) and Tett et al. (1991), and used the .508 reliability coefficient proposed by Rothstein, Schmidt, Erwin, Owens, and Sparks (1990) to estimate the reliability of supervisory ratings of job performance. Using job analysis information, we classified the ABC Company Sales Representative job into the “Sales Representatives and Specialists” job family, encompassing those jobs that require individuals to combine specialized knowledge and manual skills to perform specific, vital functions within the organization. Hogan has accumulated a number of criterion-related studies for this job family.
Hogan identified 17 relevant criterion-related studies in the Hogan archive that served as a foundation for establishing meta-analysis evidence of the validity of the HPI for predicting job performance. Table 4.4 contains the operational validities between overall performance and each HPI scale. Consistent with previous research (see section 4.3), the HPI Adjustment, Ambition, Interpersonal
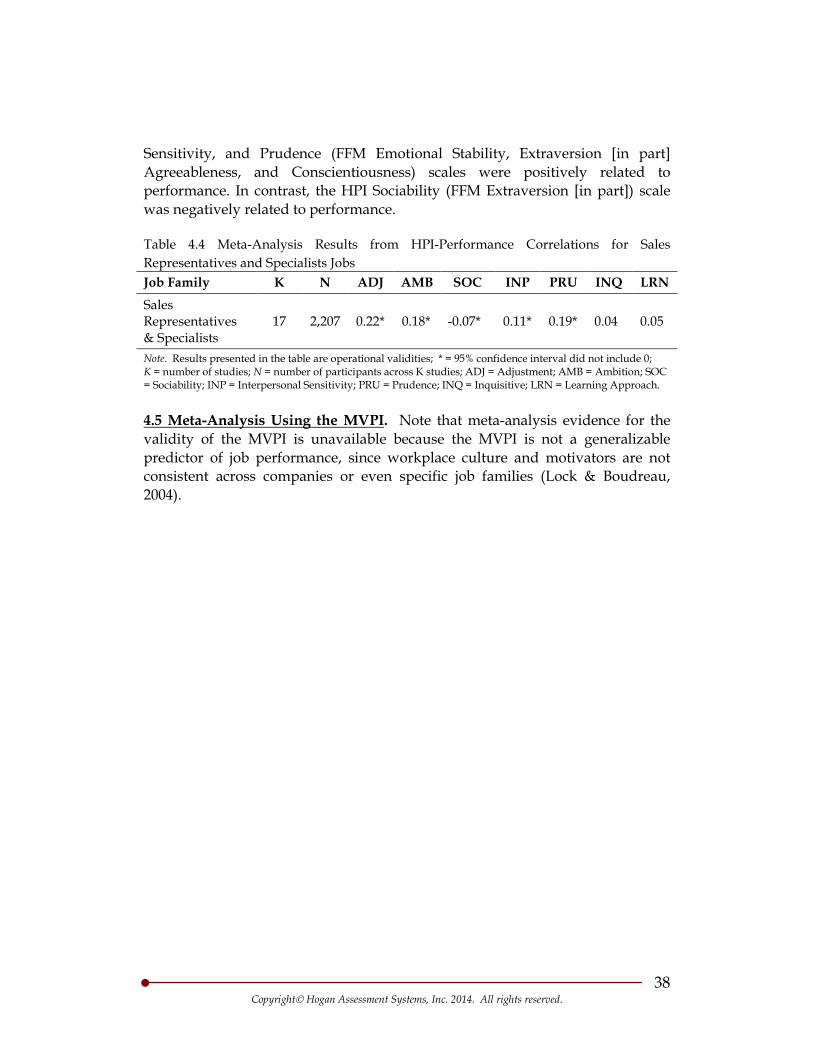
38 Copyright Hogan Assessment Systems, Inc. 2014. All rights reserved.
Sensitivity, and Prudence (FFM Emotional Stability, Extraversion [in part] Agreeableness, and Conscientiousness) scales were positively related to performance. In contrast, the HPI Sociability (FFM Extraversion [in part]) scale was negatively related to performance.
Table 4.4 Meta-Analysis Results from HPI-Performance Correlations for Sales Representatives and Specialists Jobs Job Family K N ADJ AMB SOC INP PRU INQ LRN
Sales Representatives & Specialists
17 2,207 0.22* 0.18* -0.07* 0.11* 0.19* 0.04 0.05
Note. Results presented in the table are operational validities; * = 95% confidence interval did not include 0; K = number of studies; N = number of participants across K studies; ADJ = Adjustment; AMB = Ambition; SOC = Sociability; INP = Interpersonal Sensitivity; PRU = Prudence; INQ = Inquisitive; LRN = Learning Approach.
4.5 Meta-Analysis Using the MVPI
. Note that meta-analysis evidence for the validity of the MVPI is unavailable because the MVPI is not a generalizable predictor of job performance, since workplace culture and motivators are not consistent across companies or even specific job families (Lock & Boudreau, 2004).
39 Copyright Hogan Assessment Systems, Inc. 2014. All rights reserved.
5 – TRANSPORTABILITY OF VALIDITY
The next step in the validity generalization process involves transporting validity evidence established for one job and using it as a foundation for candidate screening in a similar job. The Uniform Guidelines supports transportability of validity and is the primary reference for determining when it is appropriate to transport validity evidence from one job to another. In addition, Hoffman, McPhail, and colleagues (Hoffman & McPhail, 1998; Tippins, McPhail, Hoffman, & Gibson, 1999) discuss the technical requirements that should be satisfied before transporting validity evidence in situations that preclude local validation. Finally, Johnson and Jolly (2000) provide an empirical demonstration of the method and note the lack of guidance for its appropriate use.
The Principles considers transportability of validity as one of three VG strategies capable of justifying the appropriateness and applicability of a selection procedure. This assumes that the original validation study is technically sound and the target and referent jobs can be described as “closely related” (Bernard v. Gulf Oil Corp., 1981). Situations where transportability might apply include those in which organizations must choose a selection procedure for the same job across multiple locations and different companies or for different jobs with similar requirements. It might also be a useful strategy for validating screening guidelines for different job titles within a single job family (see Gibson & Caplinger, 2007).
The Uniform Guidelines, the Standards, and the Principles all recognize transportability of selection procedures (cf. Tippins, 2003). Although employment discrimination experts distinguish between these three documents, Hogan focuses on their common themes. For example, all three require that the original research be technically adequate. The Uniform Guidelines emphasize the need for evidence regarding fairness, validity, and job similarity as criteria for transportability. Personality-based selection procedures typically yield no adverse impact, satisfying requirements set by the Uniform Guidelines and precedents set in many courts (Lindemann & Grossman, 1996). However, fairness is considered a social rather than a psychometric issue.
The Standards emphasize the need for good cumulative research (e.g., meta-analysis) and discourage reliance on a single local validation study as a foundation for transportability of validity unless the referent study is “exceptionally sound.” Interestingly, the original design for transportability of a selection procedure relies on a single referent validation study. The Principles emphasize the importance of establishing similarity between the original
40 Copyright Hogan Assessment Systems, Inc. 2014. All rights reserved.
(referent) and target jobs. Researchers can establish evidence of similarity based on job requirements, job context, and job applicants. For personality-based selection systems, demonstrating job similarity has been challenging because few personality-related job analysis methods were available. Notable exceptions are Raymark, Schmit, and Guion (1997) and Hogan’s JET methodology (Foster et al., 2009). Hogan estimates similarity using converging evidence and professional judgment.
5.1 Transportability Results.
In the present study, Hogan did not identify a specific job in the Hogan archive that met the stringent requirements of single-study transportability. Alternatively, Hogan could nominate jobs in the archive that are similar enough to the target job to be used as a hybrid form of transportability validity evidence (i.e., very similar in respect to the tasks and responsibilities associated with performing the job, but not close enough for single-study transportability). However, in the present case, we defer to the meta-analysis and the synthetic/job component validation sections within this report.
Hogan conducts transportability of validity research by analyzing the current target job in qualitative and quantitative terms. First, Hogan identifies a marker job for which a criterion-related validity study already exists in the Hogan archive. Next, Hogan establishes similarity between the target and marker jobs through close alignment of job descriptions, O*NET codes, and JET profiles. The O*NET typology provides a standard external metric for rating job similarity.
41 Copyright Hogan Assessment Systems, Inc. 2014. All rights reserved.
6 – SYNTHETIC/JOB COMPONENT VALIDITY
The most specific validity generalizability evidence results from synthetic validity/job component validity research. Mossholder and Arvey (1984) noted that, where meta-analysis relies on global evaluations of job similarity, synthetic validity requires a more detailed examination of the work. The strategy is criterion driven and involves finding the best set of predictors comprehensively representative of the criterion space.
Lawshe (1952) introduced synthetic validity over 50 years ago. With a few notable exceptions (e.g., Guion, 1965; McCormick, DeNisi, & Shaw, 1979; Primoff, 1959), early researchers largely ignored the approach because they believed that assessment validity was specific to situations. The interpretive review and demonstration by Mossholder and Arvey (1984) is a rare exception. Mossholder and Arvey defined synthetic validity as “the logical process of inferring test-battery validity from predetermined validities of the tests for basic work components” (p. 323). If we know the key components of a job, we can review prior criterion-related studies predicting those components. We then “synthesize” the valid predictors of the key job components into an assessment battery for the new job (Balma, 1959; Lawshe, 1952). Brannick and Levine (2002) point out that synthetic validity approaches allow us to build up validity evidence from small samples with common job components. Although not popular at its inception, synthetic validity research has become increasing more studied (e.g., Hoffman, Holden, & Gale, 2000; Jeanneret & Strong, 2003; Johnson, Carter, Davison, & Oliver, 2001; McCloy, 1994, 2001; Scherbaum, 2005).
The Uniform Guidelines are vague about technical requirements and documentation for synthetic/job component validity, but the Principles explicitly include this strategy. Synthetic validation involves (a) identifying the important components of a job or jobs comprising a job family, (b) reviewing prior research on the prediction of each component, and (c) aggregating correlations across multiple studies for each component of the job to form a test battery (Scherbaum, 2005). Mossholder and Arvey (1984) summarized these requirements as follows:
“When test battery validity is inferred from evidence showing that tests measure broad characteristics necessary for job performance, the process resembles a construct validation strategy. When scores are correlated with component performance measures, the process involves criterion-related validation. The nature of the tests used in
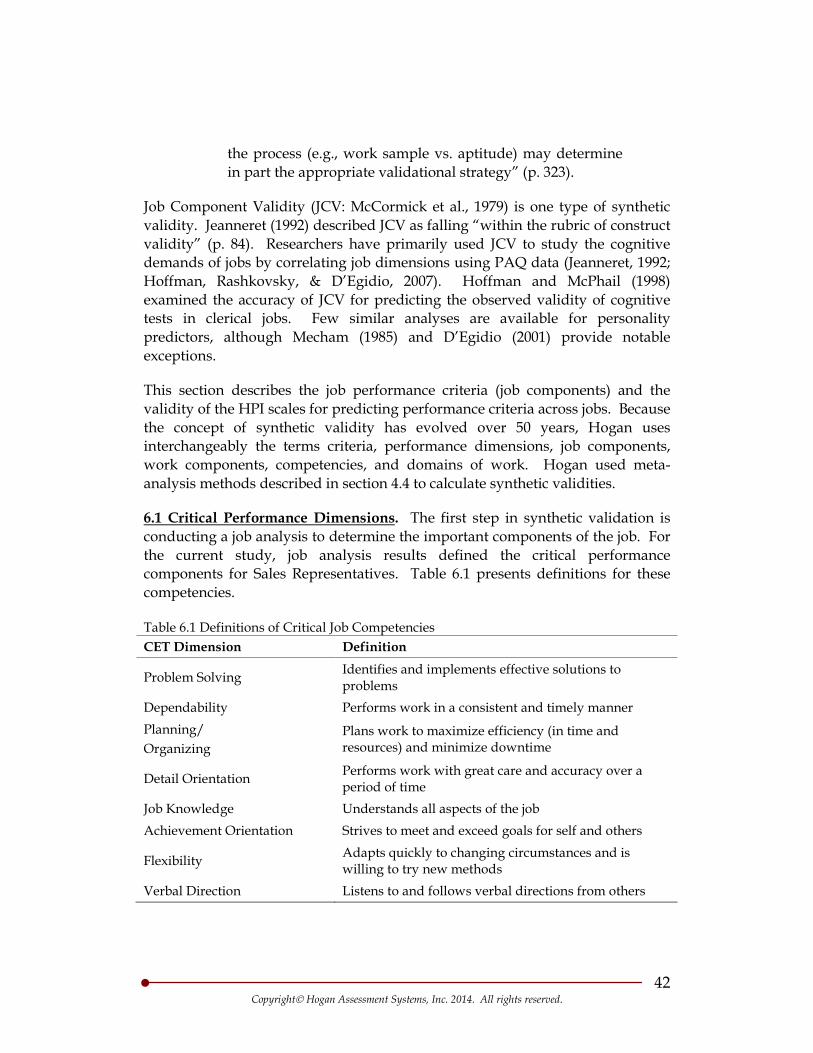
42 Copyright Hogan Assessment Systems, Inc. 2014. All rights reserved.
the process (e.g., work sample vs. aptitude) may determine in part the appropriate validational strategy” (p. 323).
Job Component Validity (JCV: McCormick et al., 1979) is one type of synthetic validity. Jeanneret (1992) described JCV as falling “within the rubric of construct validity” (p. 84). Researchers have primarily used JCV to study the cognitive demands of jobs by correlating job dimensions using PAQ data (Jeanneret, 1992; Hoffman, Rashkovsky, & D’Egidio, 2007). Hoffman and McPhail (1998) examined the accuracy of JCV for predicting the observed validity of cognitive tests in clerical jobs. Few similar analyses are available for personality predictors, although Mecham (1985) and D’Egidio (2001) provide notable exceptions.
This section describes the job performance criteria (job components) and the validity of the HPI scales for predicting performance criteria across jobs. Because the concept of synthetic validity has evolved over 50 years, Hogan uses interchangeably the terms criteria, performance dimensions, job components, work components, competencies, and domains of work. Hogan used meta-analysis methods described in section 4.4 to calculate synthetic validities.
6.1 Critical Performance Dimensions
Table 6.1 Definitions of Critical Job Competencies
. The first step in synthetic validation is conducting a job analysis to determine the important components of the job. For the current study, job analysis results defined the critical performance components for Sales Representatives. Table 6.1 presents definitions for these competencies.
CET Dimension Definition
Problem Solving Identifies and implements effective solutions to problems
Dependability Performs work in a consistent and timely manner Planning/ Organizing
Plans work to maximize efficiency (in time and resources) and minimize downtime
Detail Orientation Performs work with great care and accuracy over a period of time
Job Knowledge Understands all aspects of the job Achievement Orientation Strives to meet and exceed goals for self and others
Flexibility Adapts quickly to changing circumstances and is willing to try new methods
Verbal Direction Listens to and follows verbal directions from others
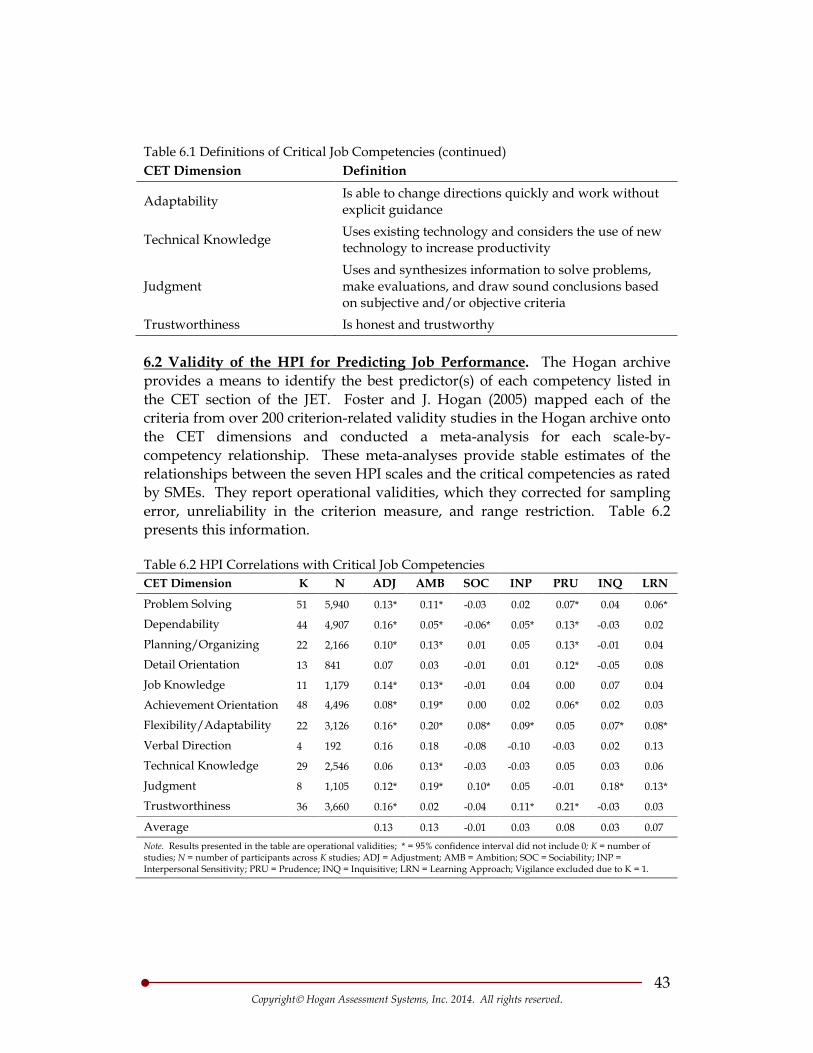
43 Copyright Hogan Assessment Systems, Inc. 2014. All rights reserved.
Table 6.1 Definitions of Critical Job Competencies (continued) CET Dimension Definition
Adaptability Is able to change directions quickly and work without explicit guidance
Technical Knowledge Uses existing technology and considers the use of new technology to increase productivity
Judgment Uses and synthesizes information to solve problems, make evaluations, and draw sound conclusions based on subjective and/or objective criteria
Trustworthiness Is honest and trustworthy
6.2 Validity of the HPI for Predicting Job Performance
Table 6.2 HPI Correlations with Critical Job Competencies
. The Hogan archive provides a means to identify the best predictor(s) of each competency listed in the CET section of the JET. Foster and J. Hogan (2005) mapped each of the criteria from over 200 criterion-related validity studies in the Hogan archive onto the CET dimensions and conducted a meta-analysis for each scale-by-competency relationship. These meta-analyses provide stable estimates of the relationships between the seven HPI scales and the critical competencies as rated by SMEs. They report operational validities, which they corrected for sampling error, unreliability in the criterion measure, and range restriction. Table 6.2 presents this information.
CET Dimension K N ADJ AMB SOC INP PRU INQ LRN
Problem Solving 51 5,940 0.13* 0.11* -0.03 0.02 0.07* 0.04 0.06*
Dependability 44 4,907 0.16* 0.05* -0.06* 0.05* 0.13* -0.03 0.02
Planning/Organizing 22 2,166 0.10* 0.13* 0.01 0.05 0.13* -0.01 0.04
Detail Orientation 13 841 0.07 0.03 -0.01 0.01 0.12* -0.05 0.08
Job Knowledge 11 1,179 0.14* 0.13* -0.01 0.04 0.00 0.07 0.04
Achievement Orientation 48 4,496 0.08* 0.19* 0.00 0.02 0.06* 0.02 0.03
Flexibility/Adaptability 22 3,126 0.16* 0.20* 0.08* 0.09* 0.05 0.07* 0.08*
Verbal Direction 4 192 0.16 0.18 -0.08 -0.10 -0.03 0.02 0.13
Technical Knowledge 29 2,546 0.06 0.13* -0.03 -0.03 0.05 0.03 0.06
Judgment 8 1,105 0.12* 0.19* 0.10* 0.05 -0.01 0.18* 0.13*
Trustworthiness 36 3,660 0.16* 0.02 -0.04 0.11* 0.21* -0.03 0.03
Average 0.13 0.13 -0.01 0.03 0.08 0.03 0.07
Note. Results presented in the table are operational validities; * = 95% confidence interval did not include 0; K = number of studies; N = number of participants across K studies; ADJ = Adjustment; AMB = Ambition; SOC = Sociability; INP = Interpersonal Sensitivity; PRU = Prudence; INQ = Inquisitive; LRN = Learning Approach; Vigilance excluded due to K = 1.
44 Copyright Hogan Assessment Systems, Inc. 2014. All rights reserved.
The correlations presented in Table 6.2, averaged for each of the seven HPI scales across the critical competencies, show that the Adjustment (.13) and Ambition (.13) scales provide stable predictors of the most important competencies associated with the Sales Representative job. The Prudence (.08) and Learning Approach (.07) scales were also positively related to the critical competencies. Note that these scales more effectively predict those performance dimensions with a common underlying construct (e.g., Flexibility/Adaptability and Adjustment; Achievement Orientation and Ambition; Trustworthiness and Prudence; Judgment and Learning Approach). This finding is important because it underscores (a) the usefulness of aligning predictors and criteria and (b) the importance of using job components rather than overall ratings of performance as criterion measures.
45 Copyright Hogan Assessment Systems, Inc. 2014. All rights reserved.
7 – CRITERION-RELATED VALIDITY EVIDENCE
The next step in the research process involved collecting performance data from Sales Representative incumbents at ABC Company. Aguinis, Henle, and Ostroff (2001) described criterion-related validity in terms of the relationship between the predictor (e.g., HPI Scales) and some criterion measure (e.g., job performance), with the goal of answering the basic question: how accurate are test scores in predicting criterion performance? The Uniform Guidelines state “evidence of the validity of a test or other selection procedure by a criterion-related validity study should consist of empirical data demonstrating that the selection procedure is predictive of or significantly correlated with important elements of job performance” (29 C.F.R. § § 1607.5 (B)).
Although there are many organizational and logistical constraints that limit the usefulness of criterion-related validity studies (McPhail, 2007), the Uniform Guidelines and Principles suggest considering this approach when a) there is an adequate, representative sample of job incumbents willing to participate, and b) development of reliable, unbiased measures of job performance is possible. The Principles also recommends using a relevant criterion measure, one that “reflects the relative standing of employees with respect to important work behavior(s) or outcome measures(s)” (p. 14).
Additional factors should be taken into account and used as a guide when determining whether a criterion-related validity study is appropriate to use in any given selection situation. First, practitioners should consider the design when planning the study. A predictive design predicts scores on a criterion measured at some future occurrence. For example, job applicants complete the assessment before being hired and provide measures of performance after being on the job for some time. Concurrent designs are more practical because they do not require a time delay; instead, the organization collects job performance information at the same time job incumbents
For example, the Principles note that this observed validity coefficient “may underestimate the predictor-criterion relationship due to the effects of range
complete the assessment battery. Only one empirical study has examined the effects of these two strategies on criterion-related validity using personality measures. Van Iddekinge and Ployhart’s (2008) review of criterion study design revealed that predictive designs produce slightly lower validity estimates than concurrent designs. Yet regardless of the strategy employed, the predictive value of the assessment is established by correlating assessment scores and job performance data, and other factors beyond study design may still influence this validity coefficient.
46 Copyright Hogan Assessment Systems, Inc. 2014. All rights reserved.
restriction and unreliability in the predictors and/or criterion.” As a result, adjustments are available to account for these artificial reductions in variance. For instance, researchers often correct for criterion unreliability to estimate operational validity (Van Iddekinge & Ployhart, 2008). Note that Hogan corrects for measurement error and range restriction where appropriate and reports both the observed and corrected validity coefficients in our technical documentation.
Another decision researchers face is whether to use a single criterion or multiple criteria during the data collection phase of the criterion study. The literature recommends that researchers “develop criterion measures that are conceptually aligned with the latent criterion constructs and that maximize the potential use of multiple criteria for predictor validation” (Van Iddekinge & Ployhart, 2008, p. 906). Furthermore, Hogan and Holland (2003) provide strong support for using specific criteria to estimate the validity of specific predictors in operational use. Although support for using narrow criteria is growing, collecting overall performance composites still provide the best approach to estimating validity of global predictors (Guion, 1961). Researchers should continue using global criteria in the design of their performance rating forms, yet should strongly consider using specific dimensions when practical and made available.
7.1 Criterion-Related Validity Sample
Next, supervisors provided ratings for each participant on several performance dimensions, which included problem solving, job knowledge, planning/ organizing, achievement orientation, flexibility, verbal direction, detail orientation, judgment, dependability, engagement, job satisfaction, culture, and overall job performance. In addition, ABC Company provided averaged archival performance appraisal ratings from 2008. Hogan used both sets of ratings in their analyses.
. Hogan conducted a concurrent criterion-related validity study by collecting assessment (i.e., HPI and MVPI) and job performance data (i.e., supervisor and performance ratings).
Subjective ratings of job performance used a Likert-type scale ranging from 1 “Almost Never” to 5 “Always” and the archival appraisal rating used a Likert-type scale ranging from 1 “Requires Improvement” to 6 “Exceeds Expectations”. See Appendix C and Appendix D for the supervisor rating form and the archival appraisal rating form, respectively.
Table 7.1 presents the HPI and MVPI percentile score means and standard deviations for the incumbent sample. Table 7.2 provides the criterion score means and standard deviations for the incumbent sample.
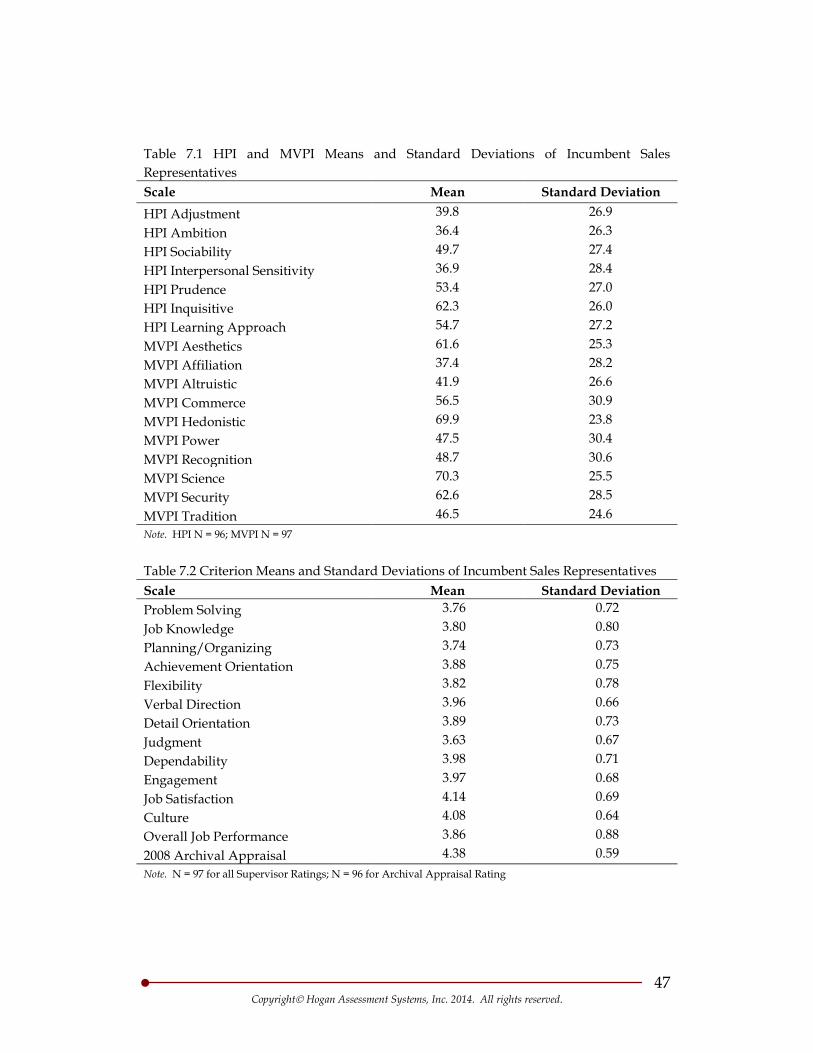
47 Copyright Hogan Assessment Systems, Inc. 2014. All rights reserved.
Table 7.1 HPI and MVPI Means and Standard Deviations of Incumbent Sales Representatives Scale Mean Standard Deviation HPI Adjustment 39.8 26.9 HPI Ambition 36.4 26.3 HPI Sociability 49.7 27.4 HPI Interpersonal Sensitivity 36.9 28.4 HPI Prudence 53.4 27.0 HPI Inquisitive 62.3 26.0 HPI Learning Approach 54.7 27.2 MVPI Aesthetics 61.6 25.3 MVPI Affiliation 37.4 28.2 MVPI Altruistic 41.9 26.6 MVPI Commerce 56.5 30.9 MVPI Hedonistic 69.9 23.8 MVPI Power 47.5 30.4 MVPI Recognition 48.7 30.6 MVPI Science 70.3 25.5 MVPI Security 62.6 28.5 MVPI Tradition 46.5 24.6 Note. HPI N = 96; MVPI N = 97
Table 7.2 Criterion Means and Standard Deviations of Incumbent Sales Representatives Scale Mean Standard Deviation Problem Solving 3.76 0.72 Job Knowledge 3.80 0.80 Planning/Organizing 3.74 0.73 Achievement Orientation 3.88 0.75 Flexibility 3.82 0.78 Verbal Direction 3.96 0.66 Detail Orientation 3.89 0.73 Judgment 3.63 0.67 Dependability 3.98 0.71 Engagement 3.97 0.68 Job Satisfaction 4.14 0.69 Culture 4.08 0.64 Overall Job Performance 3.86 0.88 2008 Archival Appraisal 4.38 0.59 Note. N = 97 for all Supervisor Ratings; N = 96 for Archival Appraisal Rating
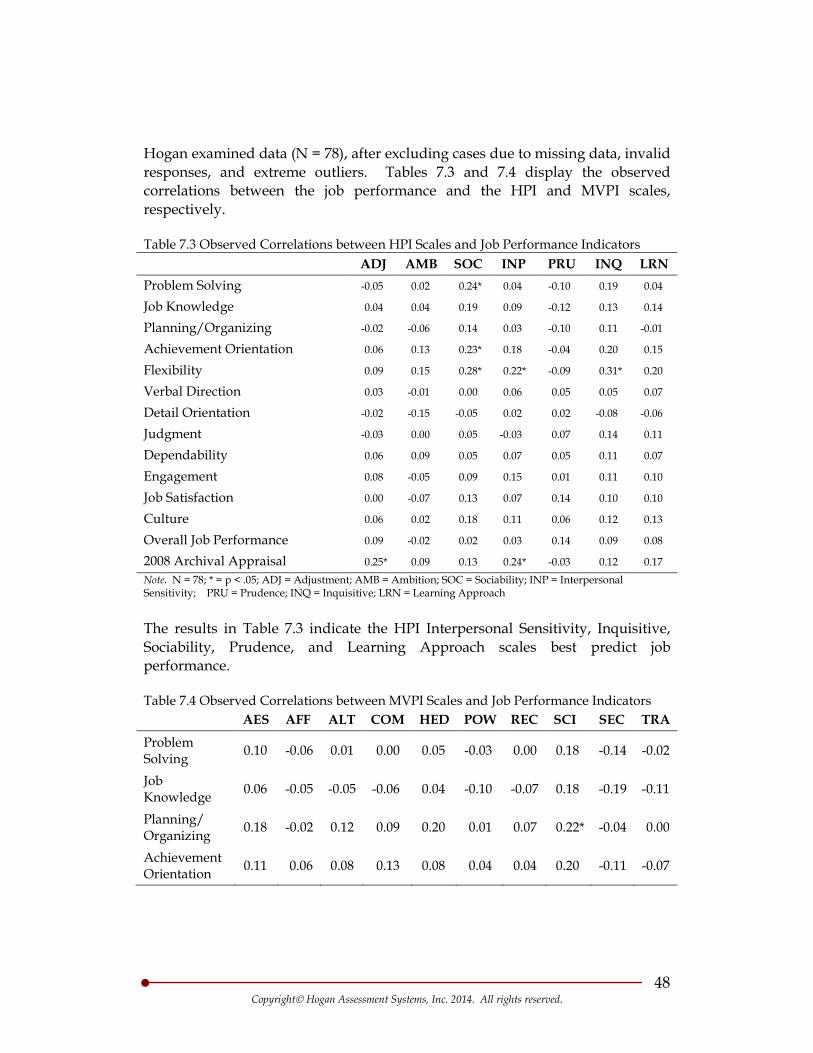
48 Copyright Hogan Assessment Systems, Inc. 2014. All rights reserved.
Hogan examined data (N = 78), after excluding cases due to missing data, invalid responses, and extreme outliers. Tables 7.3 and 7.4 display the observed correlations between the job performance and the HPI and MVPI scales, respectively.
Table 7.3 Observed Correlations between HPI Scales and Job Performance Indicators ADJ AMB SOC INP PRU INQ LRN
Problem Solving -0.05 0.02 0.24* 0.04 -0.10 0.19 0.04
Job Knowledge 0.04 0.04 0.19 0.09 -0.12 0.13 0.14
Planning/Organizing -0.02 -0.06 0.14 0.03 -0.10 0.11 -0.01
Achievement Orientation 0.06 0.13 0.23* 0.18 -0.04 0.20 0.15
Flexibility 0.09 0.15 0.28* 0.22* -0.09 0.31* 0.20
Verbal Direction 0.03 -0.01 0.00 0.06 0.05 0.05 0.07
Detail Orientation -0.02 -0.15 -0.05 0.02 0.02 -0.08 -0.06
Judgment -0.03 0.00 0.05 -0.03 0.07 0.14 0.11
Dependability 0.06 0.09 0.05 0.07 0.05 0.11 0.07
Engagement 0.08 -0.05 0.09 0.15 0.01 0.11 0.10
Job Satisfaction 0.00 -0.07 0.13 0.07 0.14 0.10 0.10
Culture 0.06 0.02 0.18 0.11 0.06 0.12 0.13
Overall Job Performance 0.09 -0.02 0.02 0.03 0.14 0.09 0.08
2008 Archival Appraisal 0.25* 0.09 0.13 0.24* -0.03 0.12 0.17 Note. N = 78; * = p < .05; ADJ = Adjustment; AMB = Ambition; SOC = Sociability; INP = Interpersonal Sensitivity; PRU = Prudence; INQ = Inquisitive; LRN = Learning Approach
The results in Table 7.3 indicate the HPI Interpersonal Sensitivity, Inquisitive, Sociability, Prudence, and Learning Approach scales best predict job performance.
Table 7.4 Observed Correlations between MVPI Scales and Job Performance Indicators AES AFF ALT COM HED POW REC SCI SEC TRA
Problem Solving 0.10 -0.06 0.01 0.00 0.05 -0.03 0.00 0.18 -0.14 -0.02
Job Knowledge 0.06 -0.05 -0.05 -0.06 0.04 -0.10 -0.07 0.18 -0.19 -0.11
Planning/ Organizing 0.18 -0.02 0.12 0.09 0.20 0.01 0.07 0.22* -0.04 0.00
Achievement Orientation 0.11 0.06 0.08 0.13 0.08 0.04 0.04 0.20 -0.11 -0.07
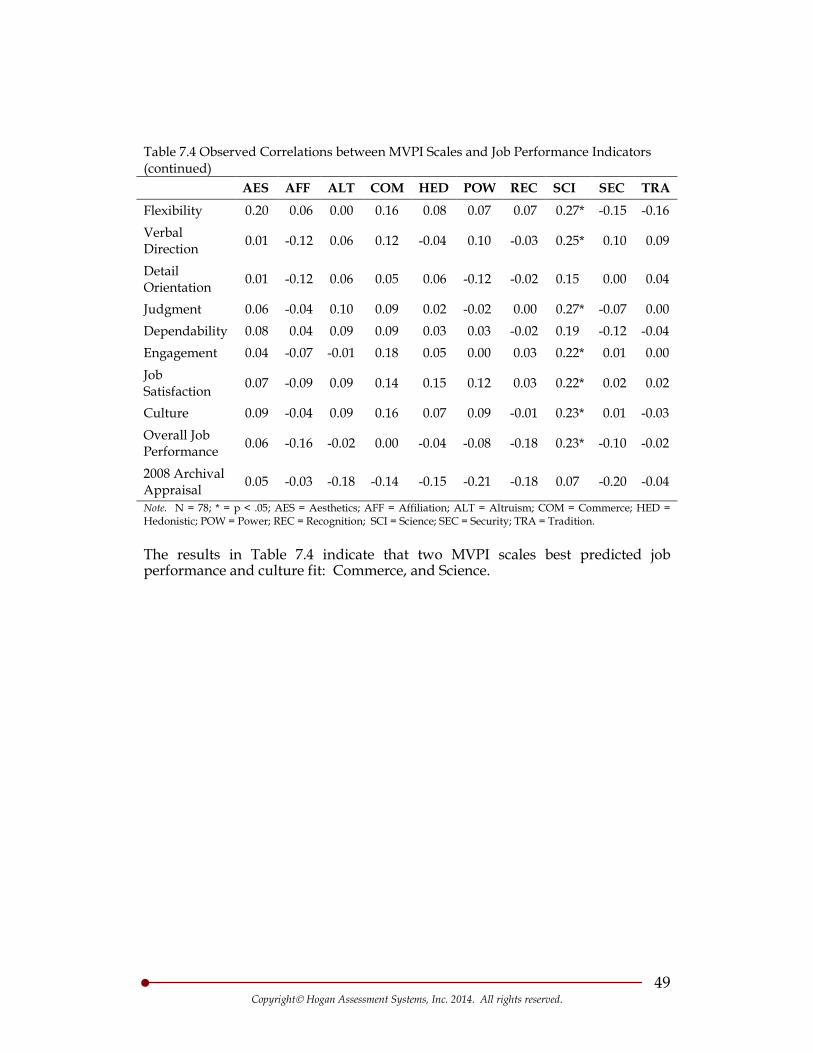
49 Copyright Hogan Assessment Systems, Inc. 2014. All rights reserved.
Table 7.4 Observed Correlations between MVPI Scales and Job Performance Indicators (continued) AES AFF ALT COM HED POW REC SCI SEC TRA
Flexibility 0.20 0.06 0.00 0.16 0.08 0.07 0.07 0.27* -0.15 -0.16 Verbal Direction 0.01 -0.12 0.06 0.12 -0.04 0.10 -0.03 0.25* 0.10 0.09
Detail Orientation 0.01 -0.12 0.06 0.05 0.06 -0.12 -0.02 0.15 0.00 0.04
Judgment 0.06 -0.04 0.10 0.09 0.02 -0.02 0.00 0.27* -0.07 0.00 Dependability 0.08 0.04 0.09 0.09 0.03 0.03 -0.02 0.19 -0.12 -0.04 Engagement 0.04 -0.07 -0.01 0.18 0.05 0.00 0.03 0.22* 0.01 0.00 Job Satisfaction 0.07 -0.09 0.09 0.14 0.15 0.12 0.03 0.22* 0.02 0.02
Culture 0.09 -0.04 0.09 0.16 0.07 0.09 -0.01 0.23* 0.01 -0.03 Overall Job Performance 0.06 -0.16 -0.02 0.00 -0.04 -0.08 -0.18 0.23* -0.10 -0.02
2008 Archival Appraisal 0.05 -0.03 -0.18 -0.14 -0.15 -0.21 -0.18 0.07 -0.20 -0.04
Note. N = 78; * = p < .05; AES = Aesthetics; AFF = Affiliation; ALT = Altruism; COM = Commerce; HED = Hedonistic; POW = Power; REC = Recognition; SCI = Science; SEC = Security; TRA = Tradition.
The results in Table 7.4 indicate that two MVPI scales best predicted job performance and culture fit: Commerce, and Science.
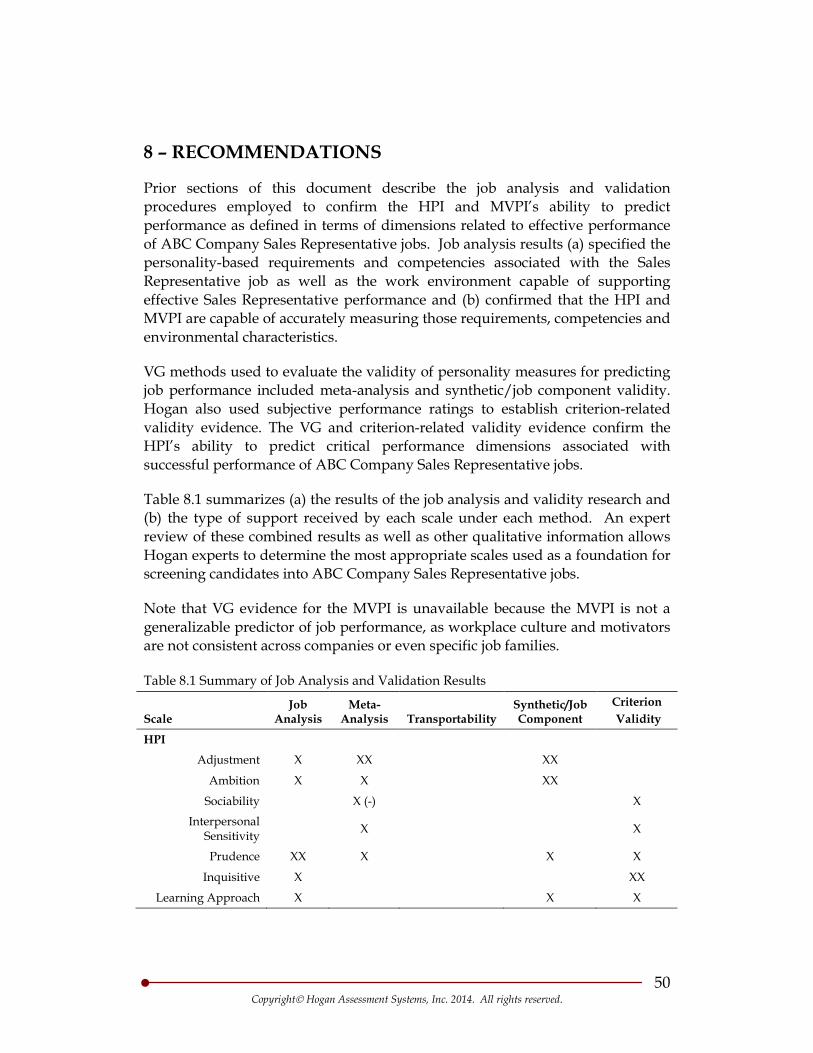
50 Copyright Hogan Assessment Systems, Inc. 2014. All rights reserved.
8 – RECOMMENDATIONS
Prior sections of this document describe the job analysis and validation procedures employed to confirm the HPI and MVPI’s ability to predict performance as defined in terms of dimensions related to effective performance of ABC Company Sales Representative jobs. Job analysis results (a) specified the personality-based requirements and competencies associated with the Sales Representative job as well as the work environment capable of supporting effective Sales Representative performance and (b) confirmed that the HPI and MVPI are capable of accurately measuring those requirements, competencies and environmental characteristics.
VG methods used to evaluate the validity of personality measures for predicting job performance included meta-analysis and synthetic/job component validity. Hogan also used subjective performance ratings to establish criterion-related validity evidence. The VG and criterion-related validity evidence confirm the HPI’s ability to predict critical performance dimensions associated with successful performance of ABC Company Sales Representative jobs.
Table 8.1 summarizes (a) the results of the job analysis and validity research and (b) the type of support received by each scale under each method. An expert review of these combined results as well as other qualitative information allows Hogan experts to determine the most appropriate scales used as a foundation for screening candidates into ABC Company Sales Representative jobs.
Note that VG evidence for the MVPI is unavailable because the MVPI is not a generalizable predictor of job performance, as workplace culture and motivators are not consistent across companies or even specific job families.
Table 8.1 Summary of Job Analysis and Validation Results
Scale Job
Analysis Meta-
Analysis Transportability Synthetic/Job Component
Criterion Validity
HPI Adjustment X XX XX
Ambition X X XX
Sociability X (-) X
Interpersonal Sensitivity X X
Prudence XX X X X
Inquisitive X XX
Learning Approach X X X
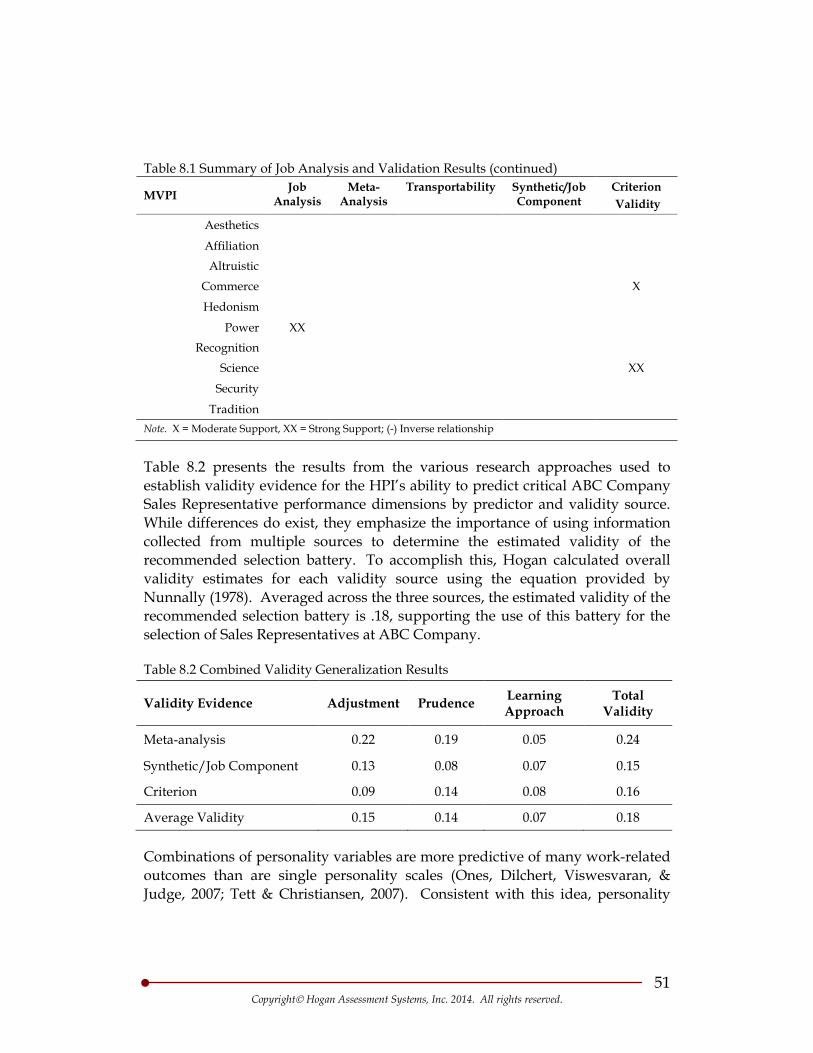
51 Copyright Hogan Assessment Systems, Inc. 2014. All rights reserved.
Table 8.1 Summary of Job Analysis and Validation Results (continued)
MVPI Job
Analysis Meta-
Analysis Transportability Synthetic/Job
Component Criterion Validity
Aesthetics
Affiliation Altruistic
Commerce X
Hedonism
Power XX Recognition
Science XX
Security
Tradition Note. X = Moderate Support, XX = Strong Support; (-) Inverse relationship
Table 8.2 presents the results from the various research approaches used to establish validity evidence for the HPI’s ability to predict critical ABC Company Sales Representative performance dimensions by predictor and validity source. While differences do exist, they emphasize the importance of using information collected from multiple sources to determine the estimated validity of the recommended selection battery. To accomplish this, Hogan calculated overall validity estimates for each validity source using the equation provided by Nunnally (1978). Averaged across the three sources, the estimated validity of the recommended selection battery is .18, supporting the use of this battery for the selection of Sales Representatives at ABC Company.
Table 8.2 Combined Validity Generalization Results
Validity Evidence Adjustment Prudence Learning Approach
Total Validity
Meta-analysis 0.22 0.19 0.05 0.24
Synthetic/Job Component 0.13 0.08 0.07 0.15
Criterion 0.09 0.14 0.08 0.16
Average Validity 0.15 0.14 0.07 0.18
Combinations of personality variables are more predictive of many work-related outcomes than are single personality scales (Ones, Dilchert, Viswesvaran, & Judge, 2007; Tett & Christiansen, 2007). Consistent with this idea, personality
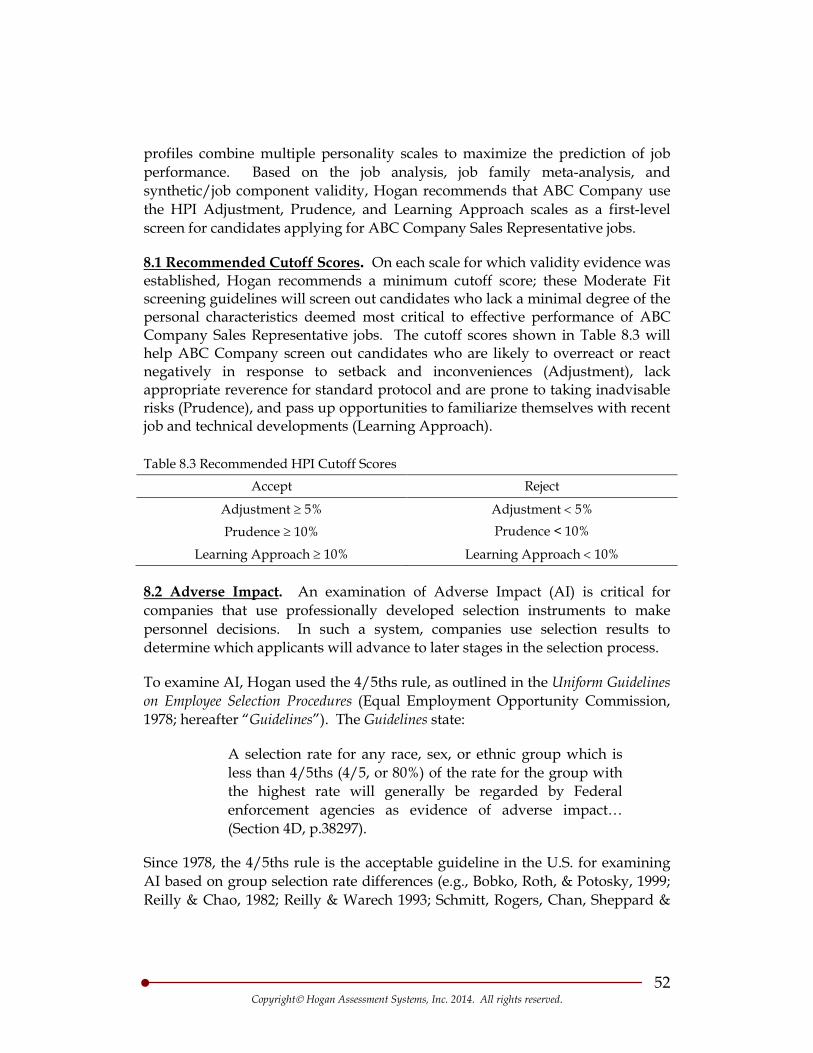
52 Copyright Hogan Assessment Systems, Inc. 2014. All rights reserved.
profiles combine multiple personality scales to maximize the prediction of job performance. Based on the job analysis, job family meta-analysis, and synthetic/job component validity, Hogan recommends that ABC Company use the HPI Adjustment, Prudence, and Learning Approach scales as a first-level screen for candidates applying for ABC Company Sales Representative jobs.
8.1 Recommended Cutoff Scores. On each scale for which validity evidence was established, Hogan recommends a minimum cutoff score; these Moderate Fit screening guidelines will screen out candidates who lack a minimal degree of the personal characteristics deemed most critical to effective performance of ABC Company Sales Representative jobs. The cutoff scores shown in Table 8.3 will help ABC Company screen out candidates who are likely to overreact or react negatively in response to setback and inconveniences (Adjustment), lack appropriate reverence for standard protocol and are prone to taking inadvisable risks (Prudence), and pass up opportunities to familiarize themselves with recent job and technical developments (Learning Approach). Table 8.3 Recommended HPI Cutoff Scores
Accept Reject
Adjustment ≥ 5% Adjustment < 5%
Prudence ≥ 10% Prudence < 10%
Learning Approach ≥ 10% Learning Approach < 10%
8.2 Adverse Impact
To examine AI, Hogan used the 4/5ths rule, as outlined in the Uniform Guidelines on Employee Selection Procedures (Equal Employment Opportunity Commission, 1978; hereafter “Guidelines”). The Guidelines state:
. An examination of Adverse Impact (AI) is critical for companies that use professionally developed selection instruments to make personnel decisions. In such a system, companies use selection results to determine which applicants will advance to later stages in the selection process.
A selection rate for any race, sex, or ethnic group which is less than 4/5ths (4/5, or 80%) of the rate for the group with the highest rate will generally be regarded by Federal enforcement agencies as evidence of adverse impact… (Section 4D, p.38297).
Since 1978, the 4/5ths rule is the acceptable guideline in the U.S. for examining AI based on group selection rate differences (e.g., Bobko, Roth, & Potosky, 1999; Reilly & Chao, 1982; Reilly & Warech 1993; Schmitt, Rogers, Chan, Sheppard &
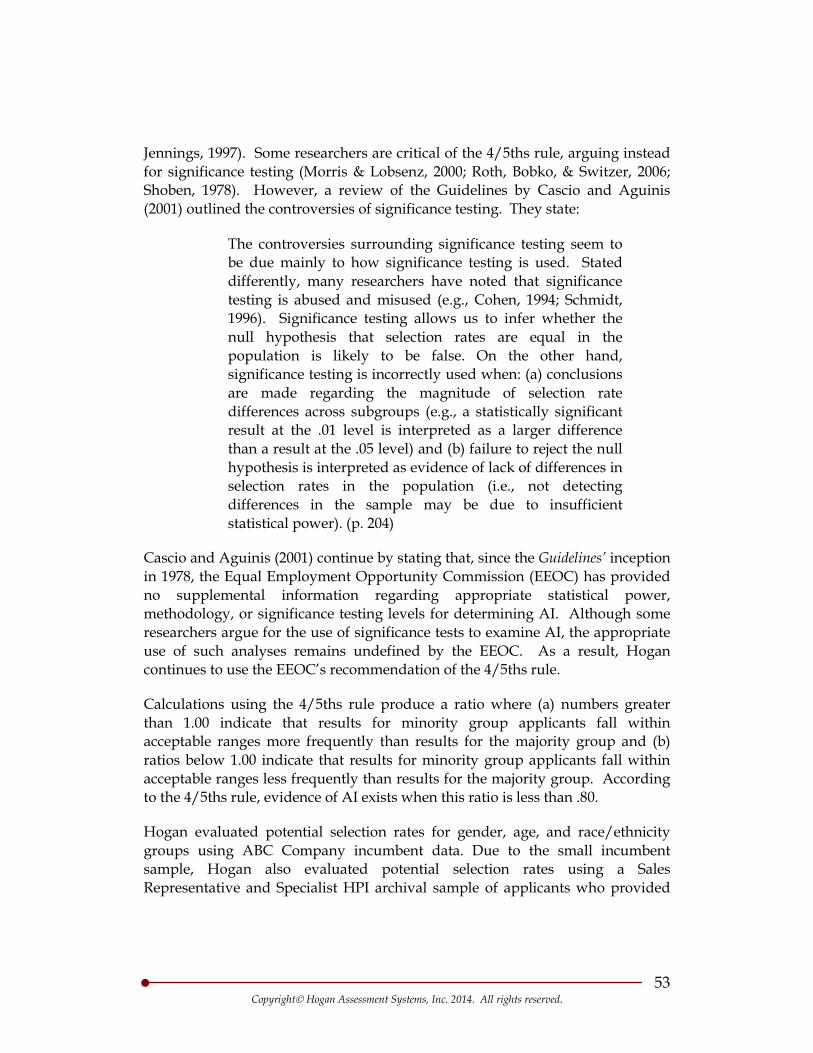
53 Copyright Hogan Assessment Systems, Inc. 2014. All rights reserved.
Jennings, 1997). Some researchers are critical of the 4/5ths rule, arguing instead for significance testing (Morris & Lobsenz, 2000; Roth, Bobko, & Switzer, 2006; Shoben, 1978). However, a review of the Guidelines by Cascio and Aguinis (2001) outlined the controversies of significance testing. They state:
The controversies surrounding significance testing seem to be due mainly to how significance testing is used. Stated differently, many researchers have noted that significance testing is abused and misused (e.g., Cohen, 1994; Schmidt, 1996). Significance testing allows us to infer whether the null hypothesis that selection rates are equal in the population is likely to be false. On the other hand, significance testing is incorrectly used when: (a) conclusions are made regarding the magnitude of selection rate differences across subgroups (e.g., a statistically significant result at the .01 level is interpreted as a larger difference than a result at the .05 level) and (b) failure to reject the null hypothesis is interpreted as evidence of lack of differences in selection rates in the population (i.e., not detecting differences in the sample may be due to insufficient statistical power). (p. 204)
Cascio and Aguinis (2001) continue by stating that, since the Guidelines’ inception in 1978, the Equal Employment Opportunity Commission (EEOC) has provided no supplemental information regarding appropriate statistical power, methodology, or significance testing levels for determining AI. Although some researchers argue for the use of significance tests to examine AI, the appropriate use of such analyses remains undefined by the EEOC. As a result, Hogan continues to use the EEOC’s recommendation of the 4/5ths rule.
Calculations using the 4/5ths rule produce a ratio where (a) numbers greater than 1.00 indicate that results for minority group applicants fall within acceptable ranges more frequently than results for the majority group and (b) ratios below 1.00 indicate that results for minority group applicants fall within acceptable ranges less frequently than results for the majority group. According to the 4/5ths rule, evidence of AI exists when this ratio is less than .80.
Hogan evaluated potential selection rates for gender, age, and race/ethnicity groups using ABC Company incumbent data. Due to the small incumbent sample, Hogan also evaluated potential selection rates using a Sales Representative and Specialist HPI archival sample of applicants who provided
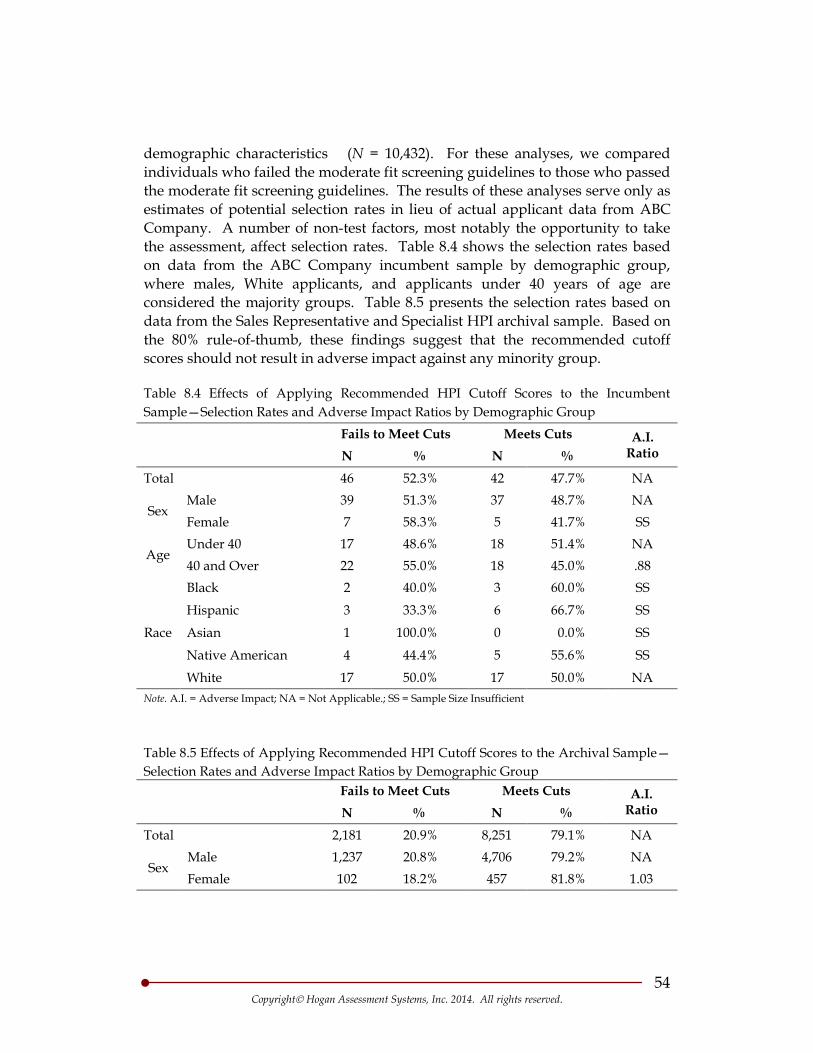
54 Copyright Hogan Assessment Systems, Inc. 2014. All rights reserved.
demographic characteristics (N = 10,432). For these analyses, we compared individuals who failed the moderate fit screening guidelines to those who passed the moderate fit screening guidelines. The results of these analyses serve only as estimates of potential selection rates in lieu of actual applicant data from ABC Company. A number of non-test factors, most notably the opportunity to take the assessment, affect selection rates. Table 8.4 shows the selection rates based on data from the ABC Company incumbent sample by demographic group, where males, White applicants, and applicants under 40 years of age are considered the majority groups. Table 8.5 presents the selection rates based on data from the Sales Representative and Specialist HPI archival sample. Based on the 80% rule-of-thumb, these findings suggest that the recommended cutoff scores should not result in adverse impact against any minority group.
Table 8.4 Effects of Applying Recommended HPI Cutoff Scores to the Incumbent Sample—Selection Rates and Adverse Impact Ratios by Demographic Group
Fails to Meet Cuts Meets Cuts A.I.
Ratio N % N % Total 46 52.3% 42 47.7% NA
Sex Male 39 51.3% 37 48.7% NA Female 7 58.3% 5 41.7% SS
Age Under 40 17 48.6% 18 51.4% NA 40 and Over 22 55.0% 18 45.0% .88
Race
Black 2 40.0% 3 60.0% SS
Hispanic 3 33.3% 6 66.7% SS
Asian 1 100.0% 0 0.0% SS
Native American 4 44.4% 5 55.6% SS
White 17 50.0% 17 50.0% NA Note. A.I. = Adverse Impact; NA = Not Applicable.; SS = Sample Size Insufficient
Table 8.5 Effects of Applying Recommended HPI Cutoff Scores to the Archival Sample—Selection Rates and Adverse Impact Ratios by Demographic Group
Fails to Meet Cuts Meets Cuts A.I.
Ratio N % N % Total 2,181 20.9% 8,251 79.1% NA
Sex Male 1,237 20.8% 4,706 79.2% NA Female 102 18.2% 457 81.8% 1.03
55 Copyright Hogan Assessment Systems, Inc. 2014. All rights reserved.
Table 8.5 Effects of Applying Recommended HPI Cutoff Scores to the Archival Sample—Selection Rates and Adverse Impact Ratios by Demographic Group (continued)
Fails to Meet Cuts Meets Cuts A.I.
Ratio N % N %
Age Under 40 905 19.5% 3,735 80.5% NA 40 and Over 329 24.5% 1,016 75.5% .94
Race
Black 202 14.5% 1,191 85.5% 1.11 Hispanic 60 16.0% 314 84.0% 1.09 Asian 34 21.1% 127 78.9% 1.02 Native American 41 18.4% 182 81.6% 1.06 White 810 22.9% 2,724 77.1% NA
Note. A.I. = Adverse Impact; NA = Not Applicable.
8.3 Pass-Plus Decision Guidelines
Collectively, the pass-plus (High Fit) guidelines will help ABC Company identify applicants who are likely to possess greater levels of characteristics most closely related to overall successful performance within Sales Representative jobs
. In addition to offering Moderate Fit candidate screening guidelines, Hogan also recommends pass-plus decision guidelines for selecting strong potential candidates into the Sales Representative job, as shown in Table 8.6. These High Fit candidate screening guidelines involve more stringent requirements on the scales comprising the Moderate Fit candidate screening guidelines as well as minimum requirements on scales identified as (a) predictive of specific Sales Representative performance domains and (b) capable of identifying candidates possessing work-related values consistent with ABC Company’s idealized Sales Representative work environment.
plus
Note that the recommendations shown in Table 8.6 reflect guidelines only and should be used in conjunction with other available relevant information to screen otherwise qualified candidates.
(a) characteristics related to being imaginative and resourceful problem solvers (Inquisitive) and (b) work-related values most consistent with ABC Company’s idealized work environment, which includes financial considerations (MVPI Commerce) and use and appreciation of concrete, measurable data (MVPI Science
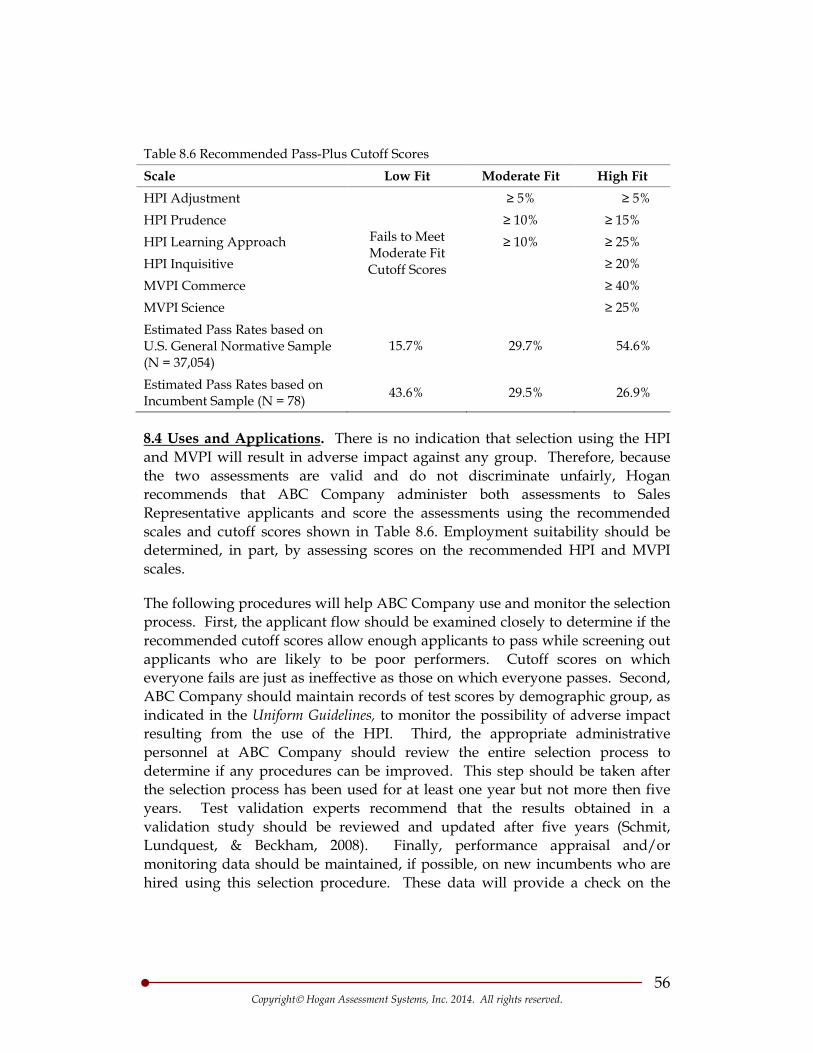
56 Copyright Hogan Assessment Systems, Inc. 2014. All rights reserved.
Table 8.6 Recommended Pass-Plus Cutoff Scores Scale Low Fit Moderate Fit High Fit HPI Adjustment
Fails to Meet Moderate Fit Cutoff Scores
≥ 5% ≥ 5% HPI Prudence ≥ 10% ≥ 15% HPI Learning Approach ≥ 10% ≥ 25% HPI Inquisitive ≥ 20% MVPI Commerce ≥ 40% MVPI Science ≥ 25% Estimated Pass Rates based on U.S. General Normative Sample (N = 37,054)
15.7% 29.7% 54.6%
Estimated Pass Rates based on Incumbent Sample (N = 78) 43.6% 29.5% 26.9%
8.4 Uses and Applications
The following procedures will help ABC Company use and monitor the selection process. First, the applicant flow should be examined closely to determine if the recommended cutoff scores allow enough applicants to pass while screening out applicants who are likely to be poor performers. Cutoff scores on which everyone fails are just as ineffective as those on which everyone passes. Second, ABC Company should maintain records of test scores by demographic group, as indicated in the Uniform Guidelines, to monitor the possibility of adverse impact resulting from the use of the HPI. Third, the appropriate administrative personnel at ABC Company should review the entire selection process to determine if any procedures can be improved. This step should be taken after the selection process has been used for at least one year but not more then five years. Test validation experts recommend that the results obtained in a validation study should be reviewed and updated after five years (Schmit, Lundquest, & Beckham, 2008). Finally, performance appraisal and/or monitoring data should be maintained, if possible, on new incumbents who are hired using this selection procedure. These data will provide a check on the
. There is no indication that selection using the HPI and MVPI will result in adverse impact against any group. Therefore, because the two assessments are valid and do not discriminate unfairly, Hogan recommends that ABC Company administer both assessments to Sales Representative applicants and score the assessments using the recommended scales and cutoff scores shown in Table 8.6. Employment suitability should be determined, in part, by assessing scores on the recommended HPI and MVPI scales.
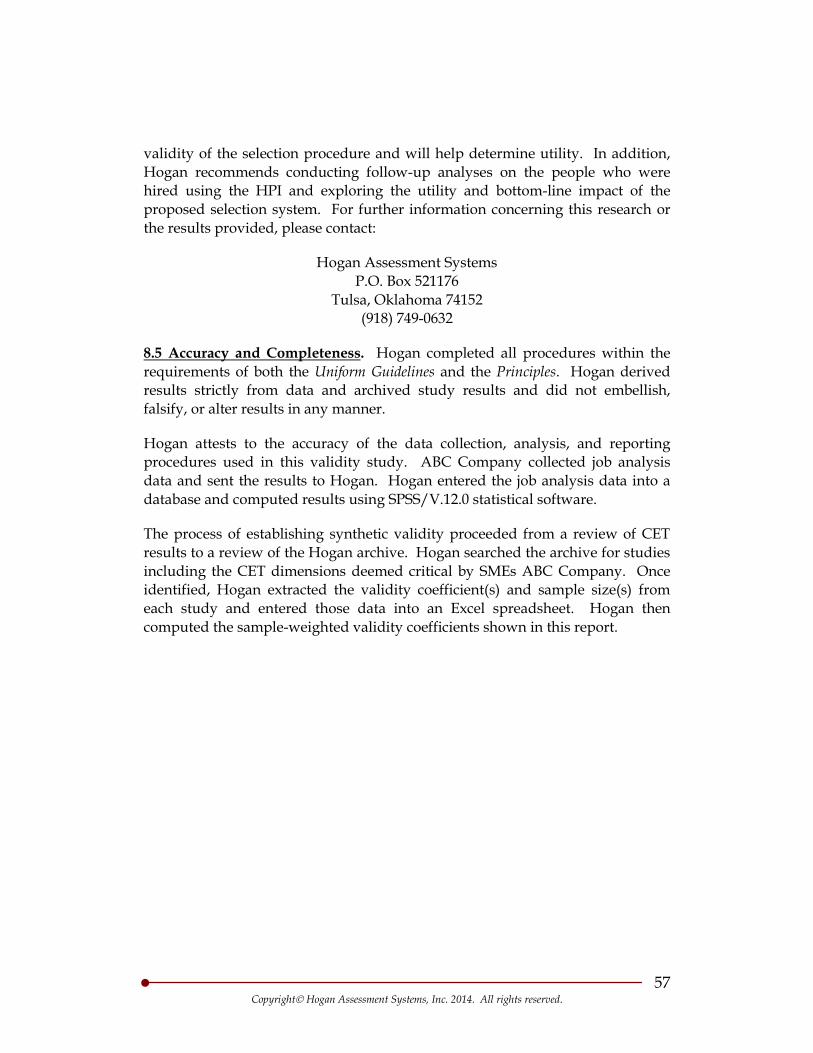
57 Copyright Hogan Assessment Systems, Inc. 2014. All rights reserved.
validity of the selection procedure and will help determine utility. In addition, Hogan recommends conducting follow-up analyses on the people who were hired using the HPI and exploring the utility and bottom-line impact of the proposed selection system. For further information concerning this research or the results provided, please contact:
Hogan Assessment Systems P.O. Box 521176
Tulsa, Oklahoma 74152 (918) 749-0632
8.5 Accuracy and Completeness
Hogan attests to the accuracy of the data collection, analysis, and reporting procedures used in this validity study. ABC Company collected job analysis data and sent the results to Hogan. Hogan entered the job analysis data into a database and computed results using SPSS/V.12.0 statistical software.
. Hogan completed all procedures within the requirements of both the Uniform Guidelines and the Principles. Hogan derived results strictly from data and archived study results and did not embellish, falsify, or alter results in any manner.
The process of establishing synthetic validity proceeded from a review of CET results to a review of the Hogan archive. Hogan searched the archive for studies including the CET dimensions deemed critical by SMEs ABC Company. Once identified, Hogan extracted the validity coefficient(s) and sample size(s) from each study and entered those data into an Excel spreadsheet. Hogan then computed the sample-weighted validity coefficients shown in this report.
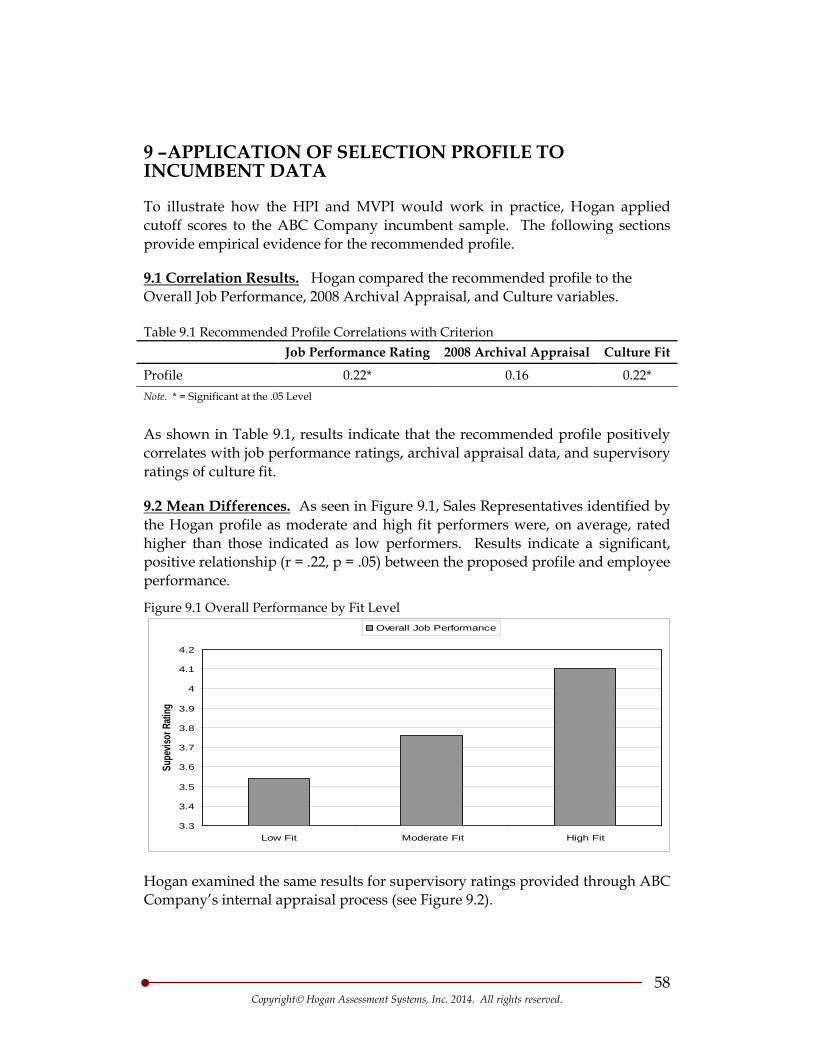
58 Copyright Hogan Assessment Systems, Inc. 2014. All rights reserved.
9 –APPLICATION OF SELECTION PROFILE TO INCUMBENT DATA
To illustrate how the HPI and MVPI would work in practice, Hogan applied cutoff scores to the ABC Company incumbent sample. The following sections provide empirical evidence for the recommended profile.
9.1 Correlation Results. Hogan compared the recommended profile to the Overall Job Performance, 2008 Archival Appraisal, and Culture variables.
Table 9.1 Recommended Profile Correlations with Criterion Job Performance Rating 2008 Archival Appraisal Culture Fit
Profile 0.22* 0.16 0.22* Note. * = Significant at the .05 Level
As shown in Table 9.1, results indicate that the recommended profile positively correlates with job performance ratings, archival appraisal data, and supervisory ratings of culture fit.
9.2 Mean Differences.
Figure 9.1 Overall Performance by Fit Level
As seen in Figure 9.1, Sales Representatives identified by the Hogan profile as moderate and high fit performers were, on average, rated higher than those indicated as low performers. Results indicate a significant, positive relationship (r = .22, p = .05) between the proposed profile and employee performance.
3.3
3.4
3.5
3.6
3.7
3.8
3.9
4
4.1
4.2
Low Fit Moderate Fit High Fit
Supe
visor
Rati
ng
Overall Job Performance
Hogan examined the same results for supervisory ratings provided through ABC Company’s internal appraisal process (see Figure 9.2).
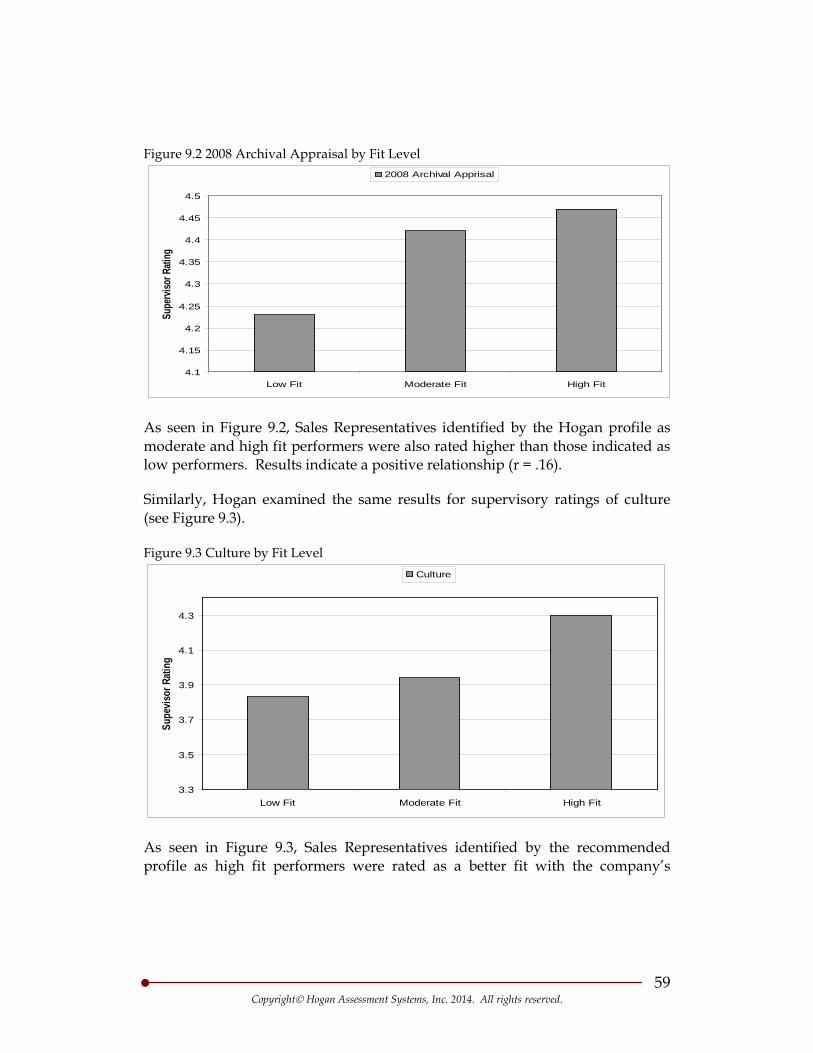
59 Copyright Hogan Assessment Systems, Inc. 2014. All rights reserved.
Figure 9.2 2008 Archival Appraisal by Fit Level
4.1
4.15
4.2
4.25
4.3
4.35
4.4
4.45
4.5
Low Fit Moderate Fit High Fit
Supe
rviso
r Rati
ng2008 Archival Apprisal
As seen in Figure 9.2, Sales Representatives identified by the Hogan profile as moderate and high fit performers were also rated higher than those indicated as low performers. Results indicate a positive relationship (r = .16).
Similarly, Hogan examined the same results for supervisory ratings of culture (see Figure 9.3).
Figure 9.3 Culture by Fit Level
3.3
3.5
3.7
3.9
4.1
4.3
Low Fit Moderate Fit High Fit
Supe
visor
Rati
ng
Culture
As seen in Figure 9.3, Sales Representatives identified by the recommended profile as high fit performers were rated as a better fit with the company’s
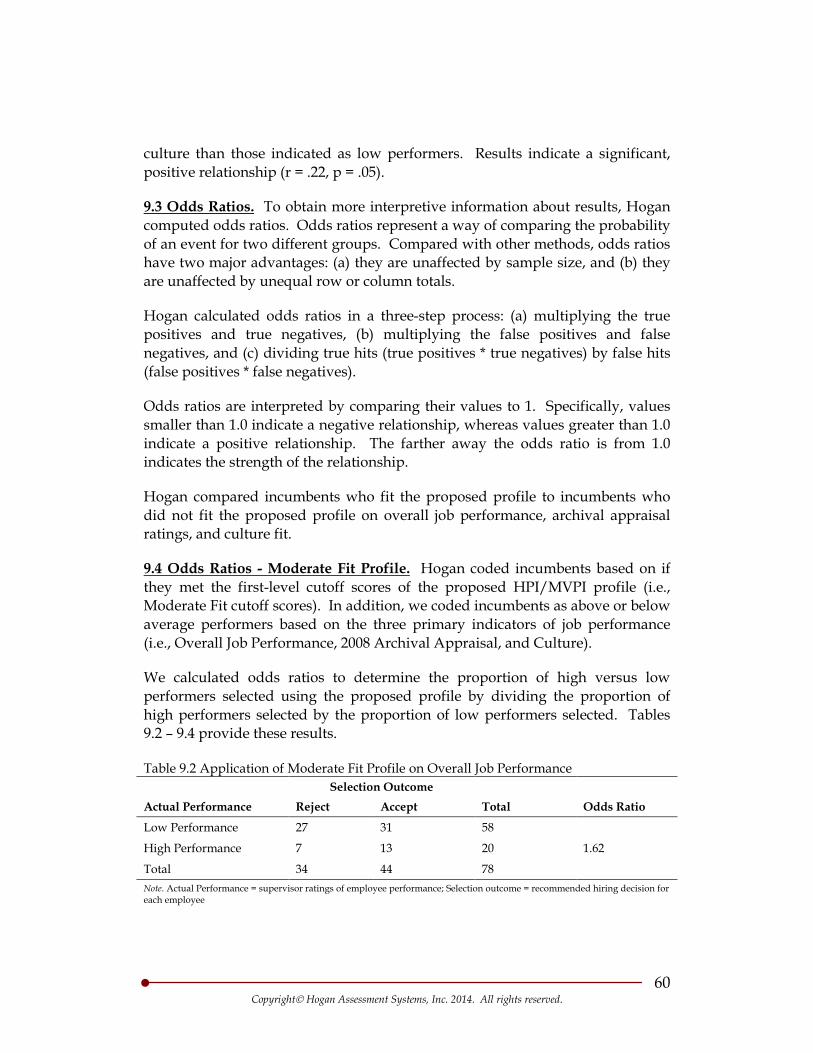
60 Copyright Hogan Assessment Systems, Inc. 2014. All rights reserved.
culture than those indicated as low performers. Results indicate a significant, positive relationship (r = .22, p = .05).
9.3 Odds Ratios.
Hogan calculated odds ratios in a three-step process: (a) multiplying the true positives and true negatives, (b) multiplying the false positives and false negatives, and (c) dividing true hits (true positives * true negatives) by false hits (false positives * false negatives).
To obtain more interpretive information about results, Hogan computed odds ratios. Odds ratios represent a way of comparing the probability of an event for two different groups. Compared with other methods, odds ratios have two major advantages: (a) they are unaffected by sample size, and (b) they are unaffected by unequal row or column totals.
Odds ratios are interpreted by comparing their values to 1. Specifically, values smaller than 1.0 indicate a negative relationship, whereas values greater than 1.0 indicate a positive relationship. The farther away the odds ratio is from 1.0 indicates the strength of the relationship.
Hogan compared incumbents who fit the proposed profile to incumbents who did not fit the proposed profile on overall job performance, archival appraisal ratings, and culture fit.
9.4 Odds Ratios - Moderate Fit Profile.
We calculated odds ratios to determine the proportion of high versus low performers selected using the proposed profile by dividing the proportion of high performers selected by the proportion of low performers selected. Tables 9.2 – 9.4 provide these results.
Hogan coded incumbents based on if they met the first-level cutoff scores of the proposed HPI/MVPI profile (i.e., Moderate Fit cutoff scores). In addition, we coded incumbents as above or below average performers based on the three primary indicators of job performance (i.e., Overall Job Performance, 2008 Archival Appraisal, and Culture).
Table 9.2 Application of Moderate Fit Profile on Overall Job Performance
Actual Performance Selection Outcome
Odds Ratio Reject Accept Total
Low Performance 27 31 58
1.62 High Performance 7 13 20
Total 34 44 78 Note. Actual Performance = supervisor ratings of employee performance; Selection outcome = recommended hiring decision for each employee
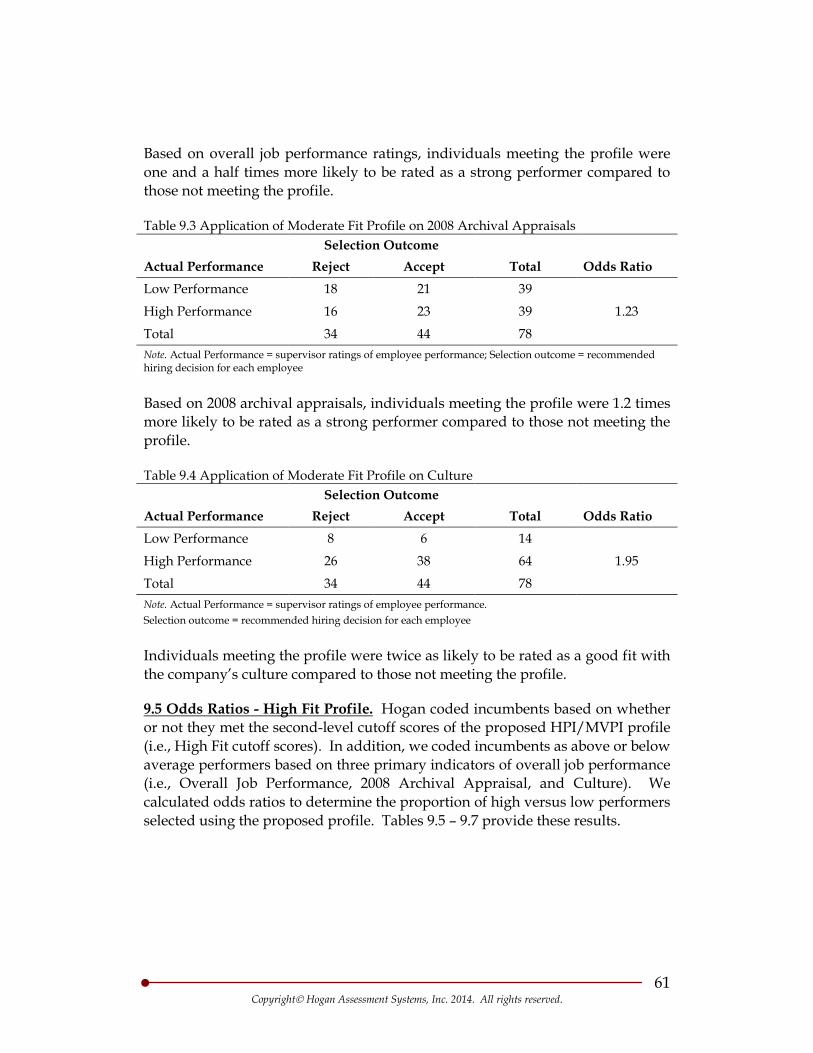
61 Copyright Hogan Assessment Systems, Inc. 2014. All rights reserved.
Based on overall job performance ratings, individuals meeting the profile were one and a half times more likely to be rated as a strong performer compared to those not meeting the profile.
Table 9.3 Application of Moderate Fit Profile on 2008 Archival Appraisals
Actual Performance Selection Outcome
Odds Ratio Reject Accept Total Low Performance 18 21 39
1.23 High Performance 16 23 39
Total 34 44 78 Note. Actual Performance = supervisor ratings of employee performance; Selection outcome = recommended hiring decision for each employee
Based on 2008 archival appraisals, individuals meeting the profile were 1.2 times more likely to be rated as a strong performer compared to those not meeting the profile.
Table 9.4 Application of Moderate Fit Profile on Culture
Actual Performance Selection Outcome
Odds Ratio Reject Accept Total Low Performance 8 6 14
1.95 High Performance 26 38 64
Total 34 44 78 Note. Actual Performance = supervisor ratings of employee performance. Selection outcome = recommended hiring decision for each employee
Individuals meeting the profile were twice as likely to be rated as a good fit with the company’s culture compared to those not meeting the profile.
9.5 Odds Ratios - High Fit Profile.
Hogan coded incumbents based on whether or not they met the second-level cutoff scores of the proposed HPI/MVPI profile (i.e., High Fit cutoff scores). In addition, we coded incumbents as above or below average performers based on three primary indicators of overall job performance (i.e., Overall Job Performance, 2008 Archival Appraisal, and Culture). We calculated odds ratios to determine the proportion of high versus low performers selected using the proposed profile. Tables 9.5 – 9.7 provide these results.
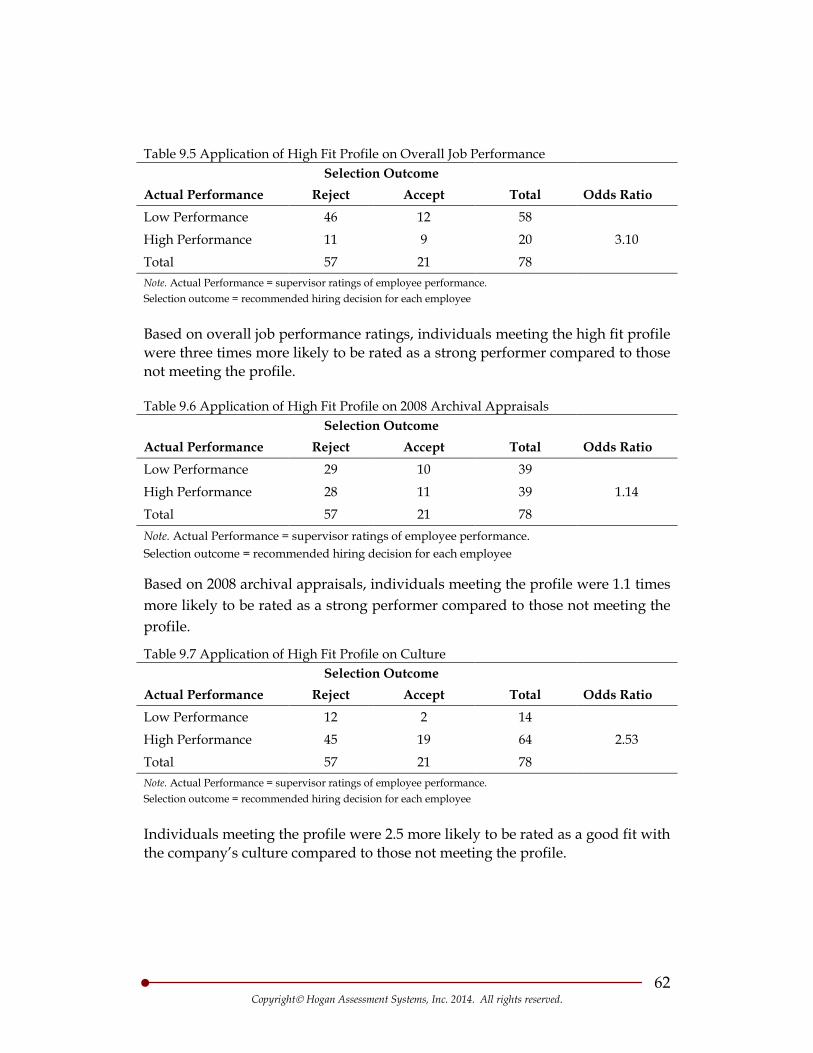
62 Copyright Hogan Assessment Systems, Inc. 2014. All rights reserved.
Table 9.5 Application of High Fit Profile on Overall Job Performance
Actual Performance Selection Outcome
Odds Ratio Reject Accept Total Low Performance 46 12 58
3.10 High Performance 11 9 20
Total 57 21 78 Note. Actual Performance = supervisor ratings of employee performance. Selection outcome = recommended hiring decision for each employee
Based on overall job performance ratings, individuals meeting the high fit profile were three times more likely to be rated as a strong performer compared to those not meeting the profile.
Table 9.6 Application of High Fit Profile on 2008 Archival Appraisals
Actual Performance Selection Outcome
Odds Ratio Reject Accept Total Low Performance 29 10 39
1.14 High Performance 28 11 39
Total 57 21 78 Note. Actual Performance = supervisor ratings of employee performance. Selection outcome = recommended hiring decision for each employee
Based on 2008 archival appraisals, individuals meeting the profile were 1.1 times more likely to be rated as a strong performer compared to those not meeting the profile.
Table 9.7 Application of High Fit Profile on Culture
Actual Performance Selection Outcome
Odds Ratio Reject Accept Total Low Performance 12 2 14
2.53 High Performance 45 19 64
Total 57 21 78 Note. Actual Performance = supervisor ratings of employee performance. Selection outcome = recommended hiring decision for each employee
Individuals meeting the profile were 2.5 more likely to be rated as a good fit with the company’s culture compared to those not meeting the profile.
63 Copyright Hogan Assessment Systems, Inc. 2014. All rights reserved.
REFERENCES
Aguinis, H., Henle, C.A., & Ostroff, C. (2001). Measurement in work and organizational psychology. In N. Anderson, D.S. Ones, H.K. Sinangil, and C. Viswesvaran (Eds.), Handbook of Industrial, Work and Organizational Psychology, (Vol. 1, pp. 27-50). London, U.K.
Aguinis, H., & Pierce, C. A. (1998). Testing moderator variable hypotheses meta-
analytically. Journal of Management, 24, 577–592.
Allport, G. W. (1937). Personality: A psychological interpretation. New York: Holt.
American Educational Research Association, American Psychological Association, & National Council on Measurement in Education (1999). Standards for Educational and Psychological Testing. Washington, DC: American Psychological Association.
Arthur, W., Jr., Day, E. A., McNelly, T. L., & Edens, P. S. (2003). A meta-analysis of the criterion-related validity of assessment center dimensions. Personnel Psychology, 56, 125-154.
Ashton, M. C. (1998). Personality and job performance: The importance of narrow traits. Journal of Organizational Behavior, 19, 289-303.
Axford, S. N. (1998). Review of the Hogan Personality Inventory (Revised). In J. C. Impara & B. S. Plake (Eds.), The thirteenth Mental Measurements Yearbook. Lincoln, NE: Buros Institute of Mental Measurements.
Balma, M. J. (1959). The development of processes for indirect or synthetic validity. Personnel Psychology, 12, 395-396.
Barrick, M. R., & Mount, M. K. (1991). The Big Five personality dimensions and job performance: A meta-analysis. Personnel Psychology, 44, 1-26.
Barrick, M. R., Mount, M. K., & Gupta, R. (2003). Meta-analysis of the relationship between the Five-Factor Model of personality and Holland’s occupational types. Personnel Psychology, 56, 45-74.
Bartram, D. (2005). The great eight competencies: A criterion-centric approach to validation. Journal of Applied Psychology, 90, 1185-1203.
64 Copyright Hogan Assessment Systems, Inc. 2014. All rights reserved.
Bartram, D., Robertson, I. T., & Callinan, M. (2002). Introduction: A framework for examining organizational effectiveness. In I. T. Robertson, M. Callinan, & D. Bartram (Eds.), Organizational effectiveness: The role of psychology (pp. 1-10). Chichester, UK: Wiley.
Bell, S. T. (2007). Deep-level composition variables as predictors of team performance: A meta-analysis. Journal of Applied Psychology, 92, 595-615.
Bernard v. Gulf Oil Co., 619 F.2d 495, 470 (5th Cir. 1980), aff _d, 452 U.S. 89 (1981).
Berry, C. M., Ones, D. S., & Sackett, P. R. (2007). Interpersonal deviance, organizational deviance, and their common correlates. Journal of Applied Psychology, 92, 410-424.
Berry, C. M., Sackett, P. R., & Wiemann, S. (2007). A review of recent developments in integrity test research. Personnel Psychology, 60, 271-301.
Bliesener, T. (1996). Methodological moderators in validating biographical data in personnel selection. Journal of Occupational and Organizational Psychology, 69, 107-120.
Bobko, P., Roth, P. L., & Potosky, D. (1999). Derivation and implications of a meta-analytic matrix incorporating cognitive ability, alternative predictors, and job performance. Personnel Psychology, 52, 561–589.
Boyatzis, R. E. (1982). The competent manager: A model for effective performance. New York: Wiley.
Brannick, M. T., & Levine, E. L. (2002). Doing a job analysis study. In Job analysis: Methods, research, and applications for human resource management in the new millennium (pp. 265-294). Thousand Oaks, CA: Sage.
Briggs-Meyers, I., McCaulley, M. H., Quenk, N. L., & Hammer, A. L. (1998). MBTI manual. Palo Alto, CA: Consulting Psychologists Press.
Campbell, J. P. (1990). Modeling the performance prediction problem in industrial and organizational psychology. In M. D. Dunnette & L. M. Hough (Eds.), Handbook of industrial and organizational psychology (Vol. 1, 2nd ed., pp. 39-74). Palo Alto, CA: Consulting Psychologists Press.
Campbell, J. P. (1996). Group differences and personnel decisions: Validity, fairness, and affirmative action. Journal of Vocational Behavior, 49, 122-158.
65 Copyright Hogan Assessment Systems, Inc. 2014. All rights reserved.
Cascio, W. F., & Aguinis, H. (2001). The Federal Uniform Guidelines on Employee Selection Procedures (1978): An update on selected issues. Review of Public Personnel Administration, 21, 200-218.
Costa, P. T., Jr., & McCrae, R. R. (1992). Revised NEO Personality Inventory (NEO-PI-R) and NEO Five-Factor Inventory (NEO-FFI): Professional manual. Odessa, FL: Psychological Assessment Resources.
Creed, P., & Shackleton, V. (2007). Hogan Personality Inventory (HPI). In P. A. Lindley (Ed.), British Psychological Society Psychological Testing Centre test reviews. London: British Psychological Society.
D’Egidio, E. L. (2001). Building a job component validity model using job analysis data from the Occupational Information Network. Unpublished doctoral dissertation. University of Houston, Houston, TX.
De Raad, B., & Perugini, M. (Eds.) (2002). Big Five Assessment. Cambridge, MA: Hogrefe & Huber Publishing.
Dean, M. A., Roth, P. L., & Bobko, P. (2008). Ethnic and gender subgroup differences in assessment center ratings: A meta-analysis. Journal of Applied Psychology, 93, 685-691.
Digman, J. M. (1990). Personality structure: Emergence of the five-factor model. Annual Review of Psychology, 41, 417-440.
Dudley, N. M., Orvis, K. A., Lebiecki, J. E., & Cortina, J. M. (2006). A meta-analytic investigation of Conscientiousness in the prediction of job performance: Examining the intercorrelations and the incremental validity of narrow traits. Journal of Applied Psychology, 91, 40-57.
Emler, N. P. (1990). A social psychology of reputation. European Review of Social Psychology, 1, 173-193.
Equal Employment Opportunity Commission (1978). Uniform guidelines on employee selection procedures. Federal Register, 43, 38,290-38,315.
Foldes, H. J., Duehr, E. E., & Ones, D. S. (2008). Group differences in personality: Meta-analyses comparing five U.S. racial groups. Personnel Psychology, 61, 579-616.
66 Copyright Hogan Assessment Systems, Inc. 2014. All rights reserved.
Foster, J., Gaddis, B., & Hogan, J. (2009). Personality-based job analysis. In M. A. Wilson, R. J. Harvey, G. Alliger, & W. Bennett, Jr. (Eds.), Handbook of work analysis. London: Taylor & Francis.
Foster, J., & Hogan, J. (2005). Validity of the Hogan Personality Inventory for job family profiles. Tulsa, OK: Hogan Assessment Systems.
Gatewood, R. D., & Feild, H. S. (1994). Human resource selection (3rd Ed.). Orlando, FL: The Dryden Press.
Ghiselli, E. E. (1966). The validity of occupational aptitude tests. New York: Wiley.
Ghiselli, E. E., & Brown, C. H. (1955). Personnel and industrial psychology (2nd ed.). New York: McGraw-Hill.
Ghiselli, E. E., Campbell, J. P., & Zedeck, S. (1981). Measurement theory for the behavioral sciences. San Francisco: W. H. Freeman.
Gibson, W. M., & Caplinger, J. A. (2007) Transportation of validation risks. In S. M. McPhail (Ed.), Alternative validation strategies (pp. 29-81). San Francisco: Jossey-Bass.
Goffman, E. (1958). The presentation of self in everyday life. New York: Doubleday.
Goldberg, L. R. (1990). An alternative “description of personality”: The Big-Five factor structure. Journal of Personality and Social Psychology, 59, 1216-1229.
Goldberg, L. R. (1992). The development of markers for the Big Five factor structure. Psychological Assessment, 4, 26-42.
Goldberg, L. R. (2000). [Hogan Personality Inventory and NEO PI-R correlation coefficients]. Unpublished raw data based on International Personality Item Pool Project.
Gough, H. G. (1987) Manual for the California Psychological Inventory. Palo Alto, CA: Consulting Psychologists Press.
Guion, R. M. (1961). Criterion measurement and personnel judgments. Personnel Psychology, 14, 141-149.
Guion, R. M. (1965). Synthetic validity in a small company: A demonstration. Personnel Psychology, 18, 40-63.
67 Copyright Hogan Assessment Systems, Inc. 2014. All rights reserved.
Guion, R. M. (1998). Assessment, measurement, and prediction for personnel decisions. Mahwah, NJ: Lawrence Erlbaum.
Guion, R. M., & Highhouse, S. (2006). Essentials of personnel assessment and selection. Mahwah, NJ: Lawrence Erlbaum.
Hathaway, S. R., & McKinley, J. C. (1943). Manual for the Minnesota Multiphasic Personality Inventory. New York: Psychological Corporation.
Hausdorf, P. A., LeBlanc, M. M., & Chawla, A. (2003). Cognitive ability testing and employment selection: Does test content relate to adverse impact? Applied H.R.M. Research, 7, 41-48.
Hoffman, C. C., Holden, L. M., & Gale, E. (2000). So many jobs, so little “n”: Applying expanded validation models to support generalization of cognitive ability. Personnel Psychology, 53, 955–991.
Hoffman, C. C., & McPhail S. M. (1998). Exploring options for supporting test use in situations precluding local validation. Personnel Psychology, 51, 987–1003.
Hoffman, C. C., Rashkovsky, B., & D’Egidio, E. (2007). Job component validity: Background, current research, and applications. In S. M. McPhail (Ed.), Alternative validation strategies (pp. 82-121). San Francisco: Jossey-Bass.
Hogan, J., Davies, S., & Hogan, R. (2007). Generalizing personality-based validity evidence. In S. M. McPhail (Ed.), Alternative validation strategies (pp. 181-229). San Francisco: Jossey-Bass.
Hogan, J., & Hogan, R. (1996). Motives, Values, Preferences Inventory manual. Tulsa, OK: Hogan Assessment Systems.
Hogan, J., & Holland, B. (2003). Using theory to evaluate personality and job-performance relations: A socioanalytic perspective. Journal of Applied Psychology, 88, 100-112.
Hogan, J., & Roberts, B. W. (1996). Issues and non-issues in the fidelity-bandwidth trade-off. Journal of Organizational Behavior, 17, 627-637.
Hogan, J., & Rybicki, S. (1998). Performance Improvement Characteristics job analysis manual. Tulsa, OK: Hogan Assessment Systems.
68 Copyright Hogan Assessment Systems, Inc. 2014. All rights reserved.
Hogan, R. (1983). A socioanalytic theory of personality. In M. M. Page (Ed.), 1982 Nebraska symposium on motivation (pp. 55-89). Lincoln, NE: University of Nebraska Press.
Hogan, R., & Hogan, J. (1995). Hogan Personality Inventory manual (2nd ed.). Tulsa, OK: Hogan Assessment Systems.
Hogan, R., & Hogan, J. (2007). Hogan Personality Inventory manual (3rd ed.). Tulsa, OK: Hogan Assessment Systems.
Hogan, R., Hogan, J., & Trickey, J. (1999). Goodbye mumbo jumbo: The transcendental beauty of a validity coefficient. Selection Development Review, 15, 3-9.
Hogan, R., & Warrenfeltz, W. (2003). Educating the modern manager. Academy of Management Learning and Education, 2, 74-84.
Holland, J. (1973). Making vocational choices: A theory of careers. Englewood Cliffs, NJ: Prentice-Hall.
Holland, J. (1985). Making vocational choices: A theory of vocational personalities and work environments (2nd ed.). Englewood Cliffs, NJ: Prentice-Hall.
Holland, J. (1997). Making vocational choices: A theory of vocational personalities and work environments (3rd ed.). Odessa, FL: Psychological Assessment Resources.
Hough, L. M., & Oswald, F. L. (2008). Personality testing and industrial-organizational psychology: Reflections, progress, and prospects. Industrial Organizational Psychologist, 1, 272-290.
Hunter, J. E. (1980). Validity generalization for 12,000 jobs: An application of synthetic validity and validity generalization to the General Aptitude Test Battery (GATB). Washington, DC: U.S. Department of Labor, Employment Service.
Hunter, J. E., & Schmidt, F. L. (1990). Methods of meta-analysis. Newbury Park, CA: Sage.
Hurtz, G. M., & Donovan, J. J. (2000). Personality and job performance: The big five revisited. Journal of Applied Psychology, 85, 869-879.

69 Copyright Hogan Assessment Systems, Inc. 2014. All rights reserved.
Jeanneret, P. R. (1992). Applications of job component/synthetic validity to construct validity. Human Performance, 5, 81-96.
Jeanneret, P. R., Borman, W. C., Kubisiak, U. C., & Hanson, M. A. (1999). Generalized work activities. In N. G. Peterson, M. D. Mumford, W. C. Borman, P. R. Jeanneret, & E. A. Fleishman (Eds.), An occupational information system for the 21st century: The development of the O*NET (pp. 105-125). Washington, DC: American Psychological Association.
Jeanneret, P. R., & Strong, M. H. (2003). Linking O*NET job analysis information to job requirement predictors: An O*NET application. Personnel Psychology, 56, 465-492.
John, O. P. (1990). The “Big-Five” factor taxonomy: Dimensions of personality in the natural language and in questionnaires. In L. A. Pervin (Ed.), Handbook of personality theory and research (pp. 66-100). New York: Guilford.
Johnson, J. W., Carter, G. W., Davison, H. K., & Oliver, D. H. (2001). A synthetic validity approach to testing differential prediction hypotheses. Journal of Applied Psychology, 86, 774-780.
Johnson, M. A., & Jolly, J. P. (2000). Extending test validation results from one plant location to another: Application of transportability evidence. Journal of Behavioral and Applied Management, 1, 127–136.
Judge, T. A., Bono, J. E., Ilies, R., & Gerhardt, M. W. (2002). Personality and leadership: A qualitative and quantitative review. Journal of Applied Psychology, 87, 765-780.
Lawshe, C. H. (1952). What can industrial psychology do for small business? (A symposium). Personnel Psychology, 5, 31-34.
Lindemann, B., & Grossman, P. (1996). Employment discrimination law (3rd ed.). Washington, DC: American Bar Association.
Lobello, S. G. (1998). Review of the Hogan Personality Inventory (Revised). In J. C. Impara & B. S. Plake (Eds.), The thirteenth Mental Measurements Yearbook. Lincoln, NE: Buros Institute of Mental Measurements.
Lock, J. D., & Boudreau, N. (2004, April). Same job different values: Comparing similar jobs across organizations. Paper presented at the 19th Annual
70 Copyright Hogan Assessment Systems, Inc. 2014. All rights reserved.
Conference of the Society for Industrial and Organizational Psychology, Chicago.
McCloy, R. A. (1994). Predicting job performance scores without performance data. In B. F. Green & A. S. Mavor (Eds.), Modeling cost and performance for military enlistment: Report of a workshop. Washington, DC: National Academy Press.
McCloy, R. A. (2001, April). Predicting job performance scores in jobs lacking criterion data. In J. Johnson & G. Carter (Chairs), Advances in the application of synthetic validity. Symposium conducted at the 16th Annual Conference of the Society for Industrial and Organizational Psychology, San Diego, CA.
McCormick, E. J., DeNisi, A. S., & Shaw, J. B. (1979). Use of the Position Analysis Questionnaire for establishing the job component validity of tests. Journal of Applied Psychology, 64, 51-56.
McCrae, R. R., & Costa, P. T., Jr. (1987). Validity of the five-factor model of personality across instruments and observers. Journal of Personality and Social Psychology, 52, 81-9.
McDaniel, M. A., Hartman, N. S., Whetzel, D. L., & Grubb, W. L. (2007). Situational judgment test, response instructions, and validity: A meta-analysis. Personnel Psychology, 60, 63-91.
McDaniel, M. A., Morgeson, F. P., Finnegan, E. B., Campion, M. A., & Braverman, E. P. (2001). Use of situational judgment tests to predict job performance: A clarification of the literature. Journal of Applied Psychology, 84, 730-740.
McDaniel, M. A., Whetzel, D. L., Schmidt, F. L., & Maurer, S. D. (1994). The validity of employment interviews: A comprehensive review and meta-analysis. Journal of Applied Psychology, 79, 599-616.
McPhail, S. M. (2007). Alternative validation strategies. San Francisco: Jossey-Bass.
Mecham, R. C. (1985, August). Comparative effectiveness of situational, generalized, and job component validation methods. In P. R. Jeanneret (Chair), Job component validity: Job requirements, estimates, and validity generalization comparisons. Symposium conducted at the 92nd Annual Convention of the American Psychological Association, Los Angeles.
71 Copyright Hogan Assessment Systems, Inc. 2014. All rights reserved.
Meriac, J. P., Hoffman, B. J., Woehr, D. J., & Fleisher, M. S. (2008). Further evidence for the validity of assessment center dimensions: A meta-analysis of the incremental criterion-related validity of dimension ratings. Journal of Applied Psychology, 93, 1042-1052.
Meyer, K. D., & Foster, J. (2007, April). Exploring the utility of three approaches to validating a job analysis tool. In M. Anderson (Chair), Worker-oriented job analysis tools: Development and validation. Symposium conducted at the 22nd Annual Conference of the Society for Industrial and Organizational Psychology, New York.
Meyer, K. D., Foster, J., & Anderson, M. G. (2006, May). Assessing the predictive validity of the Performance Improvement Characteristics job analysis tool. In J. Foster (Chair), Standardized job analysis tools: State of the science. Symposium conducted at the 21st Annual Conference of the Society for Industrial and Organizational Psychology, Dallas, Texas.
Mol, S. T., Born, M. P. H., Willemsen, M. E., &Van Der Molen, H. T. (2005). Predicting expatriate job performance for selection purposes: A quantitative review. Journal of Cross-Cultural Psychology, 36, 590-620.
Morgan, C. D., & Murray, H. A. (1935). A method for investigating fantasies: The Thematic Apperception Test. Archives of Neurology and Psychiatry, 34, 289-306.
Morris, S., & Lobsenz, R. E. (2000). Significance tests and confidence-intervals for the adverse impact ratio. Personnel Psychology, 53, 89–111.
Mossholder, K. W., & Arvey, R. D. (1984). Synthetic validity: A conceptual and comparative review. Journal of Applied Psychology, 69, 322-333.
Mount, M. K., & Barrick, M. R. (1995). The big five personality dimensions: Implications for research and practice in human resources management. In G. R. Ferris (Ed.), Research in Personnel and Human Resources Management, 13, 153-200.
Mount, M. K., & Barrick, M. R. (2001). Personal Characteristics Inventory manual. Libertyville, IL: Wonderlic.
Murphy, K. R., & De Shon, R. (2000). Interrater correlations do not estimate the reliability of job performance ratings. Personnel Psychology, 53, 873-900.
72 Copyright Hogan Assessment Systems, Inc. 2014. All rights reserved.
Norman, W. T. (1963). Toward an adequate taxonomy of personality attributes: Replicated factor structure in peer nomination personality ratings. Journal of Abnormal and Social Psychology, 66, 574-583.
Nunnally, J.C. (1978). Psychometric Theory (2nd ed.). New York: McGraw-Hill.
Ones, D. S., Dilchert, S., Viswesvaran, C., & Judge, T. A. (2007). In Support of personality assessment in organizational settings. Personnel Psychology, 60, 995-1027.
Ones, D. S., Viswesvaran, C., & Schmidt, F. L. (1993). Comprehensive meta-analysis of integrity test validation: Findings and implications for personnel selection and theories of job performance. Journal of Applied Psychology, 78, 679-703.
Ozer, D. J., & Benet-Martinez, V. (2005). Personality and the prediction of consequential outcomes. Annual Review of Psychology, 57, 8.1-8.21.
Paunonen, S. V., Rothstein, M. G., & Jackson, D. N. (1999). Narrow reasoning about the use of broad measures for personnel selection. Journal of Organizational Behavior, 17, 639-655.
Pearlman, K., Schmidt, F. L, & Hunter, J. E. (1980). Validity generalization results for tests used to predict job proficiency and training success in clerical occupations. Journal of Applied Psychology, 65, 373-406.
Peeters, A. G. M., Van Tuijl, H. F. J. M., Rutte, C. G., & Reymen, I. M. M. J. (2006). Personality and team performance: A meta-analysis. European Journal of Personality, 20, 377-396.
Primoff, E. S. (1959) Empirical validation of the J-coefficient. Personnel Psychology, 12, 413-418.
Raymark, P. H., Schmit, M. J., & Guion, R. M. (1997). Identifying potentially useful personality constructs for employee selection. Personnel Psychology, 50, 723-736.
Reilly, R. R., & Chao, G. (1982). Validity and fairness of some alternative employee selection procedures. Personnel Psychology, 35, 1–62.
73 Copyright Hogan Assessment Systems, Inc. 2014. All rights reserved.
Reilly, R. R., & Warech, M. A. (1993). The validity and fairness of alternatives to cognitive ability tests. In L. Wing & B. Gifford (Eds.), Policy issues in employment testing (pp. 131–224). Boston: Kluwer.
Roberts, B. (2001). Review of the Motives, Values, Preferences Inventory. The fourteenth mental measurements yearbook. Lincoln, NE: Buros Institute of Mental Measurements.
Roberts, B. W., Kuncel, N. R., Shiner, R., Caspi, A., & Goldberg, L. R. (2007). The
power of personality: The comparative validity of personality traits, socioeconomic status, and cognitive ability for predicting important life outcomes. Perspectives on Psychological Science, 2, 313-345.
Rosenthal, R. (1979). The file drawer problem and tolerance for null results.
Psychological Bulletin, 86, 638-641.
Roth, P., Bobko, P., McFarland, L., & Buster, M. (2008). Work sample tests in personnel selection: A meta-analysis of black-white differences in overall and exercise scores. Personnel Psychology, 61, 637-662.
Roth, P. L., Bobko, P., Switzer, F. S. (2006). Modeling behavior of 4/5ths rule for determining adverse impact: Reasons for caution. Journal of Applied Psychology, 91, 507-522.
Rothstein, H. R., Schmidt, F. L., Erwin, F. W., Owens, W. A., & Sparks, C. P. (1990). Biographical data in employment selection: Can validities be made generalizable? Journal of Applied Psychology, 75, 175-184.
Rotter, J. (1966). Generalized expectancies for internal vs. external control of reinforcement. Psychological Monographs, 80 (Whole No. 609).
Rybicki, S. (1997). Validity of personality measures for entry level jobs. Technical Report. Tulsa, OK: Hogan Assessment Systems.
Salgado, J. F. (1997). The five factor model of personality and job performance in the European community. Journal of Applied Psychology, 82, 30-43.
Salgado, J. F. (1998). Big Five personality dimensions and job performance in Army and civil occupations: A European perspective. Human Performance, 11, 271-288.
74 Copyright Hogan Assessment Systems, Inc. 2014. All rights reserved.
Salgado, J. F., & Moscoso, S. (1999, May). Construct validity of two personality inventories based upon the five-factor model (FFM). Paper presented at the 14th Annual Conference of the Society for Industrial and Organizational Psychology, Atlanta, GA.
Scherbaum, C. A. (2005). Synthetic validity: Past, present, and future. Personnel Psychology, 58, 481-515.
Schmidt, F. L., & Hunter, J. E. (1977). Development of a general solution to the problem of validity generalization. Journal of Applied Psychology, 62, 529-54.
Schmidt, F. L., & Hunter, J. E. (1998). The validity and utility of selection methods in personnel psychology: Practical and theoretical implications of 85 years of research. Psychological Bulletin, 124, 262-274.
Schmidt, F. L., & Rothstein, H. R. (1994). Applications of validity generalization methods of meta-analysis to biographical data scores in employees’ selection. In G. S. Stokes, M. D. Mumford, & W. A. Owens (Eds.), The biodata handbook: Theory, research, and applications (pp. 237-260). Palo Alto, CA: Consulting Psychologists Press.
Schmit, M. J., Lundquist, K. K., & Beckham, S. K. (2008, April). Expert opinions on the “shelflife” of a validation study. Poster session presented at the 23rd Annual Conference of the Society for Industrial Organizational Psychology, San Francisco.
Schmitt, N., Rogers, W., Chan, D., Sheppard, L., & Jennings, D. (1997). Adverse impact and predictive efficiency of various predictor combinations. Journal of Applied Psychology, 82, 719–730.
Schneider, B. (1987). The people make the place. Personnel Psychology, 40, 437-453.
Shin, H., & Holland, B. (2004, April). P-O fit as a moderator of personality-job performance relations. Paper presented at the 19th Annual Conference of the Society for Industrial and Organizational Psychology, Chicago.
Shoben, E. W. (1978). Differential pass rates in employment testing: Statistical proof under Title VII. Harvard Law Review, 91, 793-81.
Smith, M. L., & Glass, G. V. (1977). Meta-analysis of psychotherapy outcome studies. American Psychologist, 32, 752-760.
75 Copyright Hogan Assessment Systems, Inc. 2014. All rights reserved.
Society for Industrial and Organizational Psychology (2003). Principles for the validation and use of personnel selection procedures (4th ed.). Bowling Green, OH: Author.
Tett, R. P., & Chistiansen, N. D. (2007). Personality tests at the crossroads: A response to Morgeson, Campion, Dipboye, Hollenbeck, Murphy, and Schmitt. Personnel Psychology, 60, 967-993.
Tett, R. P., Jackson, D. N., & Rothstein, M. (1991). Personality measures as predictors of job performance: A meta-analytic review. Personnel Psychology, 44, 703-742.
Thurstone, L. L. (1934). The vectors of mind. Psychological Review, 41, 1-32.
Tilton, J. W. (1937). The measurement of overlapping. Journal of Educational Psychology, 28, 656-662.
Tippins, N. T. (2003, October). Transporting the validity of assessments. Presentation at the annual meeting of International Assessment Congress, Atlanta, GA.
Tippins, N. T., McPhail, S. M., Hoffman, C., & Gibson, W. (1999, April). Transporting validity in the real world. Continuing Education Workshop presented at the 14th Annual Conference of the Society of Industrial and Organizational Psychology, Atlanta, GA.
Tupes, E. C., & Christal, R. E. (1961). Recurrent personality factors based on trait ratings (ASD-TR-61-97). Lackland Air Force Base, TX: Aeronautical Systems Division, Personnel Laboratory.
US Department of Labor (1991). Dictionary of occupational titles. Washington, DC: U.S. Government Printing Office.
Van Iddekinge, C. H., & Ployhart, R. E. (2008). Developments in the criterion-related validation of selection procedures: A critical review and recommendations for practice. Personnel Psychology, 61, 871-925.
Warrenfeltz, R. B. (1995, May). An executive-level validation of the Borman and Brush
taxonomy. Paper presented at the 10th Annual Conference of the Society for Industrial and Organizational Psychology, Orlando, FL.
Wiggins, J. S., & Pincus, A. L. (1992). Personality structure and assessment. Annual Review of Psychology, 43, 473-504.
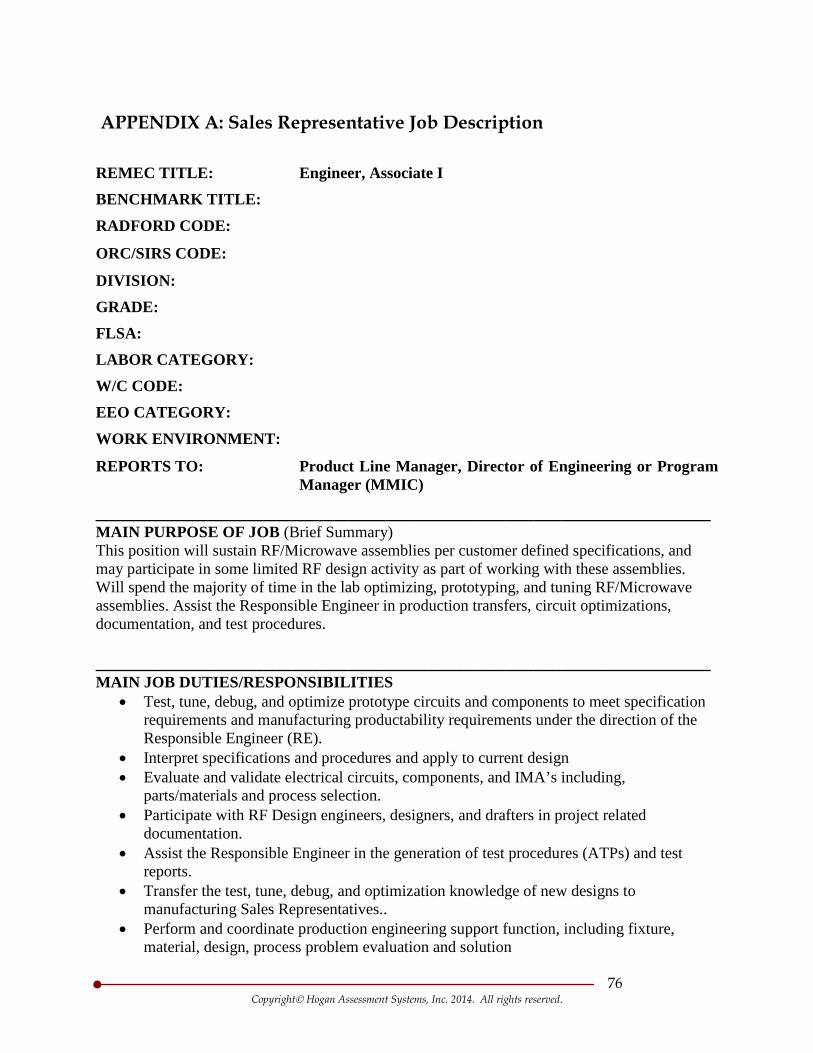
76 Copyright Hogan Assessment Systems, Inc. 2014. All rights reserved.
APPENDIX A: Sales Representative Job Description
REMEC TITLE: Engineer, Associate I BENCHMARK TITLE:
RADFORD CODE:
ORC/SIRS CODE:
DIVISION: GRADE: FLSA: LABOR CATEGORY: W/C CODE: EEO CATEGORY:
WORK ENVIRONMENT:
REPORTS TO: Product Line Manager, Director of Engineering or Program Manager (MMIC)
__________________________________________________________________ MAIN PURPOSE OF JOB (Brief Summary) This position will sustain RF/Microwave assemblies per customer defined specifications, and may participate in some limited RF design activity as part of working with these assemblies. Will spend the majority of time in the lab optimizing, prototyping, and tuning RF/Microwave assemblies. Assist the Responsible Engineer in production transfers, circuit optimizations, documentation, and test procedures. __________________________________________________________________ MAIN JOB DUTIES/RESPONSIBILITIES
• Test, tune, debug, and optimize prototype circuits and components to meet specification requirements and manufacturing productability requirements under the direction of the Responsible Engineer (RE).
• Interpret specifications and procedures and apply to current design • Evaluate and validate electrical circuits, components, and IMA’s including,
parts/materials and process selection. • Participate with RF Design engineers, designers, and drafters in project related
documentation. • Assist the Responsible Engineer in the generation of test procedures (ATPs) and test
reports. • Transfer the test, tune, debug, and optimization knowledge of new designs to
manufacturing Sales Representatives.. • Perform and coordinate production engineering support function, including fixture,
material, design, process problem evaluation and solution
77 Copyright Hogan Assessment Systems, Inc. 2014. All rights reserved.
APPENDIX A: Sales Representative Job Description (Continued)
• Participate in safety training and actively comply with safety policies and practices. • Actively support Lean initiatives by attending training where applicable, participating in
Lean activities (5S, Kaizen, problem solving, error proofing), making suggestions for improvements and sustaining improvements implemented.
• Actively participate in team meetings and activities, including SET team support as appropriate.
__________________________________________________________________ KNOWLEDGE/SKILLS/ABILITIES
• Communication skills sufficient to read and interpret documents such as detailed technical specifications, procedural instructions and task lists. Ability to write routine reports and correspondence. Ability to speak effectively to employees of the organization during departmental meetings and required training classes
• Math skills sufficient to calculate figures and amounts such as discount, interest, commissions, proportions, percentages, area, circumference, and volume. Ability to apply concepts of basic algebra and geometry.
• Reasoning skills sufficient to apply common sense understanding to carry out instructions furnished in written, oral, or diagram form. Ability to deal with problems involving several concrete variables in standardized situations.
• Must be able to work as part of a team and coordinate with other employees as required • Familiar with the theoretical and mathematical aspects of electrical engineering • Good RF/Microwave circuit trouble shooting skills • Good working knowledge of RF/Microwave test equipment and procedures.
__________________________________________________________________ EDUCATION
• Associates Degree or equivalent military training in Electronics or Engineering or related field
__________________________________________________________________ JOB EXPERIENCE
• Knowledge and skills typically gained through 7 - 10 years as an RF/Microwave Sales Representative, preferably in a military products environment; or equivalent combination of education and experience.
__________________________________________________________________ CERTIFICATIONS AND TRAINING REQUIREMENTS: Required to posses following certifications:
• N/A
Required to obtain the following: • LEAN Energizing Attendance
78 Copyright Hogan Assessment Systems, Inc. 2014. All rights reserved.
APPENDIX A: Sales Representative Job Description (Continued)
• ESD Awareness
May be required to obtain the following: • PS618, PS1725, PS130
Required to obtain at least 1 of the following
• N/A __________________________________________________________________ SECURITY
• Required to obtain and maintain a security clearance, which requires US Citizenship.
The above information on this description has been designed to indicate the general nature and level of work performed by employees within this classification. It is not designed to contain or be interpreted as a comprehensive inventory of all duties, responsibilities and qualifications required of employees assigned to this job. The accuracy of this document is not guaranteed unless obtained through the Human Resources Department or their resources (i.e. HR sites on CREW). Copies obtained through other sources may not be the most current version.
79 Copyright Hogan Assessment Systems, Inc. 2014. All rights reserved.
APPENDIX A: Sales Representative Job Description (Continued) REMEC TITLE: Engineer, RF I BENCHMARK TITLE:
RADFORD CODE:
ORC/SIRS CODE:
DIVISION: GRADE: FLSA: LABOR CATEGORY: W/C CODE: EEO CATEGORY:
WORK ENVIRONMENT:
REPORTS TO: Product Line Manager
__________________________________________________________________ MAIN PURPOSE OF JOB (Brief Summary) This position serves as entry level into the REMEC RF/Microwave electrical design field in which critical experience is gained through comprehensive support roles in all areas of design, manufacturing and production. Primary role will be to support sustaining engineering of basic through medium-complexity of integrated microwave assemblies through the tuning/testing/optimization of RF/Microwave circuits, assisting in electrical and mechanical design, and generating complete drawing packages, including testing procedures.
__________________________________________________________________ MAIN JOB DUTIES/RESPONSIBILITIES
• Evaluate specifications and generate testing procedures. • Assist in the design of RF/Microwave circuits including amplifiers, mixers, switches,
filters and oscillators, component identification, and subsystem definition including computer/mathematical modeling, part/material/process selection and mechanical layout and packaging.
• Perform circuit and reliability analysis • Coordinate with mechanical engineers, designers, and drafters to produce mechanical
design and drawing packages under guidance of the Responsible Engineer. • Test, tune, debug, and optimize prototype circuits and components to meet specification
requirements and manufacturing producibility requirements • Guides Sales Representatives on test, tune, debug, and optimization of prototype circuits
and components •
80 Copyright Hogan Assessment Systems, Inc. 2014. All rights reserved.
APPENDIX A: Sales Representative Job Description (Continued)
• Assist in the organization and scheduling of development projects, including the following activities: process development, fixture design and implementation, material procurement and customer interface meetings (design reviews)
• Perform and coordinate production engineering support function, including fixture, material, design, process problem evaluation and solution
• Participate in safety training and actively comply with safety policies and practices. • Actively support Lean initiatives by attending training where applicable, participating in
Lean activities (5S, Kaizen, problem solving, error proofing), making suggestions for improvements and sustaining improvements implemented.
• Actively participate in team meetings and activities, including SET team support as appropriate.
__________________________________________________________________ KNOWLEDGE/SKILLS/ABILITIES
• Must have excellent oral and written English communication skills sufficient enough to understand verbal and written instructions, communicate with other employees, customers, and suppliers, follow prescribed directions and tasks lists, and participate in departmental team meetings and required training classes
• Able to work as part of a team and coordinate with other employees as required • Theoretical and mathematical electrical engineering knowledge • Strong analytical and problem-solving skills • Experience with the use of RF circuit simulators (MWO preferred) • Experience with the use of Microsoft Office (Excel, Word, Powerpoint)
__________________________________________________________________ EDUCATION
• Bachelor’s Degree in Electrical Engineering (BSEE) or related field • Must have taken RF/Microwave and electromagnetism courses and labs
__________________________________________________________________ JOB EXPERIENCE
• Knowledge typically gained through 0 to 2 years of related experience __________________________________________________________________ CERTIFICATIONS AND TRAINING REQUIREMENTS: Required to posses following certifications (or obtain within 3 months of hire if new employee):
• PS618, PS130, PS1725
Required to obtain the following: • LEAN Energizing Attendance • ESD Awareness

81 Copyright Hogan Assessment Systems, Inc. 2014. All rights reserved.
APPENDIX A: Sales Representative Job Description (Continued) May be required to obtain the following:
•
Required to obtain at least 1 of the following • Re Training Course
__________________________________________________________________ SECURITY
• Required to obtain and maintain a security clearance, which requires US Citizenship.
The above information on this description has been designed to indicate the general nature and level of work performed by employees within this classification. It is not designed to contain or be interpreted as a comprehensive inventory of all duties, responsibilities and qualifications required of employees assigned to this job.
82 Copyright Hogan Assessment Systems, Inc. 2014. All rights reserved.
APPENDIX B: The Job Evaluation Tool (JET)
Introduction
The Job Evaluation Tool (JET) is a job analysis system designed to identify personal characteristics and competencies required by jobs. Different jobs require different personality characteristics, work preferences, and competencies for successful performance. The JET provides a systematic way for job experts to describe a job and to compare it to other jobs. The four sections of this job analysis are worker-based with a focus on identifying specific personality, motivational, and behavioral competencies necessary for job success. Results from the JET are used for a variety of human resource purposes including identifying and developing job-related assessments, matching people to jobs and work groups, and defining the personal characteristics needed for jobs of the future. Subject Matter Expert Qualifications Please provide the information requested below. Your qualifications and responses are confidential. All data are for research purposes only. Your responses will be combined with other experts’ responses to create an overall job profile for the job in question.
About your organization: 1. TITLE OF THE JOB YOU ARE EVALUATING:____________________________________ 2. Your organization’s name: ______________________________________________________ About you:
1. Your current job title: __________________________________________________________ 2. Your name: __________________________________________________________________ 3. ID number: __________________________________________________________________ 4. Race/Ethnicity: ___White ___African American __Hispanic ___Other (specify)_________ 5. Gender: _____Male _____Female 6. Have you worked in the job you are evaluating as a(n): Position Yes/No Years of Experience
Incumbent ______ ________________ Supervisor/Manager ______ ________________ Trainer ______ ________________ Recruiter ______ ________________ HR Specialist ______ ________________ Other (specify) ___________ ______ ________________
7. How confident are you in the level of knowledge you have about the job you are evaluating? _____Not at all _____Not very _____Somewhat _____Very _____Extremely
Please complete the sections of the JET, which appear on the following pages.
Thank you for your participation.
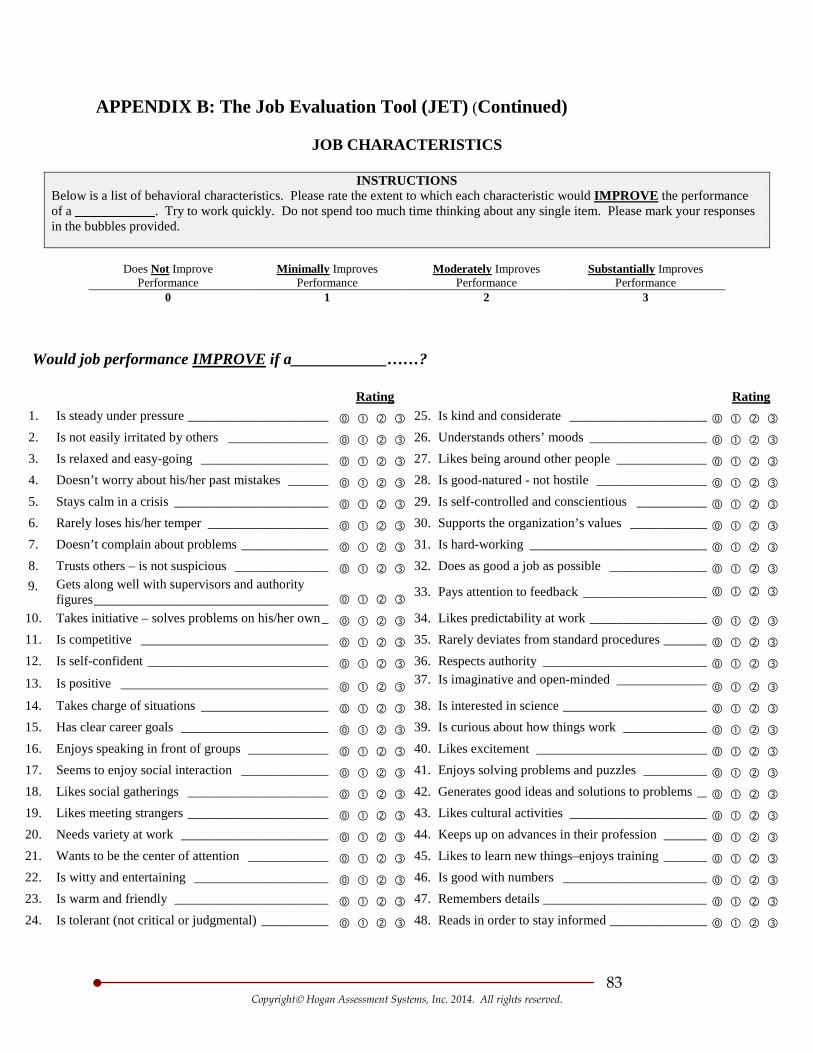
83 Copyright Hogan Assessment Systems, Inc. 2014. All rights reserved.
APPENDIX B: The Job Evaluation Tool (JET) (Continued)
JOB CHARACTERISTICS
INSTRUCTIONS Below is a list of behavioral characteristics. Please rate the extent to which each characteristic would IMPROVE the performance of a ____________. Try to work quickly. Do not spend too much time thinking about any single item. Please mark your responses in the bubbles provided.
Does Not Improve
Performance Minimally Improves
Performance Moderately Improves
Performance Substantially Improves
Performance 0 1 2 3
Would job performance IMPROVE if a____________……?
Rating Rating
1. Is steady under pressure _____________________ 25. Is kind and considerate _____________________ 2. Is not easily irritated by others _______________ 26. Understands others’ moods __________________ 3. Is relaxed and easy-going ___________________ 27. Likes being around other people ______________ 4. Doesn’t worry about his/her past mistakes ______ 28. Is good-natured - not hostile _________________ 5. Stays calm in a crisis _______________________ 29. Is self-controlled and conscientious ___________ 6. Rarely loses his/her temper __________________ 30. Supports the organization’s values ____________ 7. Doesn’t complain about problems _____________ 31. Is hard-working ___________________________ 8. Trusts others – is not suspicious ______________ 32. Does as good a job as possible _______________ 9. Gets along well with supervisors and authority
figures ___________________________________ 33. Pays attention to feedback ___________________
10. Takes initiative – solves problems on his/her own _ 34. Likes predictability at work __________________ 11. Is competitive ____________________________ 35. Rarely deviates from standard procedures _______ 12. Is self-confident ___________________________ 36. Respects authority _________________________ 13. Is positive _______________________________ 37. Is imaginative and open-minded ______________
14. Takes charge of situations ___________________ 38. Is interested in science ______________________ 15. Has clear career goals ______________________ 39. Is curious about how things work _____________ 16. Enjoys speaking in front of groups ____________ 40. Likes excitement __________________________ 17. Seems to enjoy social interaction _____________ 41. Enjoys solving problems and puzzles __________ 18. Likes social gatherings _____________________ 42. Generates good ideas and solutions to problems __ 19. Likes meeting strangers _____________________ 43. Likes cultural activities _____________________ 20. Needs variety at work ______________________ 44. Keeps up on advances in their profession _______ 21. Wants to be the center of attention ____________ 45. Likes to learn new things–enjoys training _______ 22. Is witty and entertaining ____________________ 46. Is good with numbers ______________________ 23. Is warm and friendly _______________________ 47. Remembers details _________________________ 24. Is tolerant (not critical or judgmental) __________ 48. Reads in order to stay informed _______________
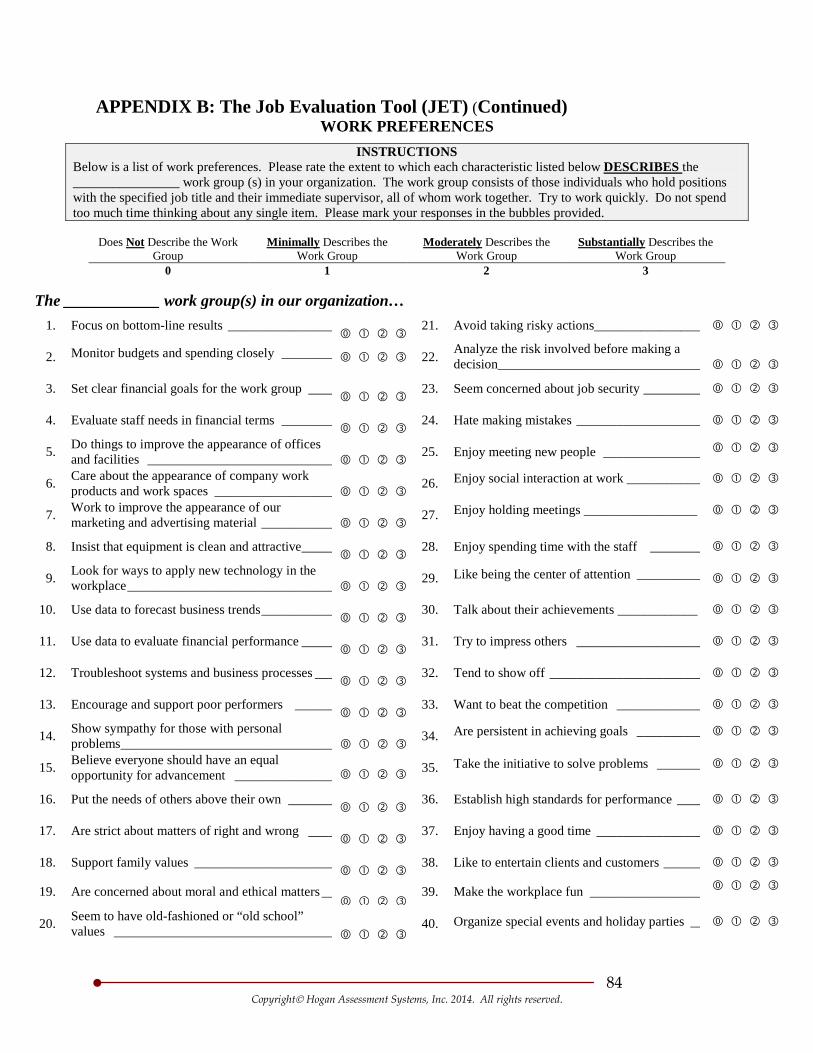
84 Copyright Hogan Assessment Systems, Inc. 2014. All rights reserved.
APPENDIX B: The Job Evaluation Tool (JET) (Continued) WORK PREFERENCES
INSTRUCTIONS Below is a list of work preferences. Please rate the extent to which each characteristic listed below DESCRIBES the ________________ work group (s) in your organization. The work group consists of those individuals who hold positions with the specified job title and their immediate supervisor, all of whom work together. Try to work quickly. Do not spend too much time thinking about any single item. Please mark your responses in the bubbles provided.
Does Not Describe the Work Group
Minimally Describes the Work Group
Moderately Describes the Work Group
Substantially Describes the Work Group
0 1 2 3
The ____________ work group(s) in our organization… 1. Focus on bottom-line results ________________
21. Avoid taking risky actions________________
2. Monitor budgets and spending closely ________ 22. Analyze the risk involved before making a decision_______________________________
3. Set clear financial goals for the work group ____ 23. Seem concerned about job security _________
4. Evaluate staff needs in financial terms ________ 24. Hate making mistakes ___________________
5. Do things to improve the appearance of offices and facilities ____________________________
25. Enjoy meeting new people _______________
6. Care about the appearance of company work products and work spaces __________________
26. Enjoy social interaction at work ___________
7. Work to improve the appearance of our marketing and advertising material ___________
27. Enjoy holding meetings _________________
8. Insist that equipment is clean and attractive _____ 28. Enjoy spending time with the staff ________
9. Look for ways to apply new technology in the workplace _______________________________
29. Like being the center of attention __________
10. Use data to forecast business trends ___________ 30. Talk about their achievements ____________
11. Use data to evaluate financial performance _____ 31. Try to impress others ___________________
12. Troubleshoot systems and business processes ___ 32. Tend to show off _______________________
13. Encourage and support poor performers ______ 33. Want to beat the competition _____________
14. Show sympathy for those with personal problems ________________________________ 34. Are persistent in achieving goals __________
15. Believe everyone should have an equal opportunity for advancement _______________
35. Take the initiative to solve problems _______
16. Put the needs of others above their own _______ 36. Establish high standards for performance ____
17. Are strict about matters of right and wrong ____ 37. Enjoy having a good time ________________
18. Support family values _____________________ 38. Like to entertain clients and customers ______
19. Are concerned about moral and ethical matters __
39. Make the workplace fun _________________
20. Seem to have old-fashioned or “old school” values _________________________________
40. Organize special events and holiday parties __
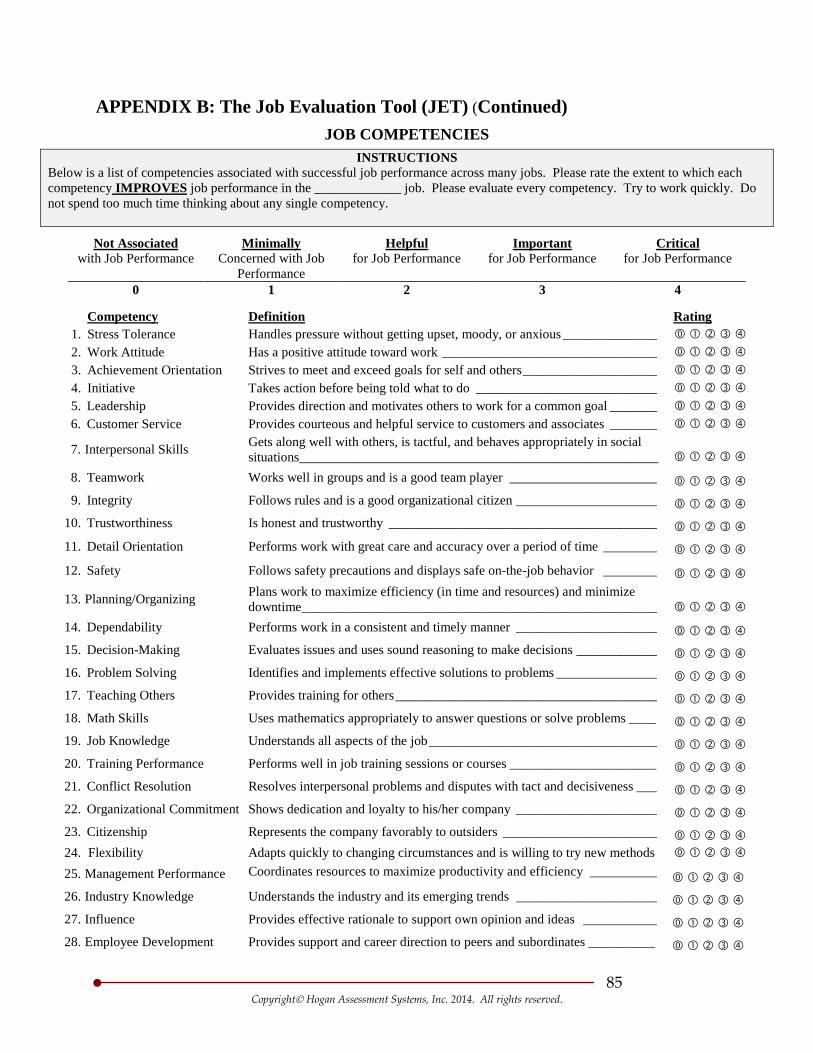
85 Copyright Hogan Assessment Systems, Inc. 2014. All rights reserved.
APPENDIX B: The Job Evaluation Tool (JET) (Continued) JOB COMPETENCIES
Not Associated with Job Performance
Minimally Concerned with Job
Performance
Helpful for Job Performance
Important for Job Performance
Critical for Job Performance
0 1 2 3 4
Competency Definition Rating 1. Stress Tolerance Handles pressure without getting upset, moody, or anxious ______________ 2. Work Attitude Has a positive attitude toward work ________________________________ 3. Achievement Orientation Strives to meet and exceed goals for self and others ____________________ 4. Initiative Takes action before being told what to do ___________________________
5. Leadership Provides direction and motivates others to work for a common goal _______ 6. Customer Service Provides courteous and helpful service to customers and associates _______
7. Interpersonal Skills Gets along well with others, is tactful, and behaves appropriately in social situations______________________________________________________
8. Teamwork Works well in groups and is a good team player ______________________ 9. Integrity Follows rules and is a good organizational citizen _____________________
10. Trustworthiness Is honest and trustworthy ________________________________________ 11. Detail Orientation Performs work with great care and accuracy over a period of time ________ 12. Safety Follows safety precautions and displays safe on-the-job behavior ________
13. Planning/Organizing Plans work to maximize efficiency (in time and resources) and minimize downtime _____________________________________________________
14. Dependability Performs work in a consistent and timely manner _____________________ 15. Decision-Making Evaluates issues and uses sound reasoning to make decisions ____________ 16. Problem Solving Identifies and implements effective solutions to problems _______________ 17. Teaching Others Provides training for others _______________________________________ 18. Math Skills Uses mathematics appropriately to answer questions or solve problems ____ 19. Job Knowledge Understands all aspects of the job __________________________________ 20. Training Performance Performs well in job training sessions or courses ______________________ 21. Conflict Resolution Resolves interpersonal problems and disputes with tact and decisiveness ___ 22. Organizational Commitment Shows dedication and loyalty to his/her company _____________________ 23. Citizenship Represents the company favorably to outsiders _______________________ 24. Flexibility Adapts quickly to changing circumstances and is willing to try new methods 25. Management Performance Coordinates resources to maximize productivity and efficiency __________ 26. Industry Knowledge Understands the industry and its emerging trends _____________________ 27. Influence Provides effective rationale to support own opinion and ideas ___________ 28. Employee Development Provides support and career direction to peers and subordinates __________
INSTRUCTIONS Below is a list of competencies associated with successful job performance across many jobs. Please rate the extent to which each competency IMPROVES job performance in the _____________ job. Please evaluate every competency. Try to work quickly. Do not spend too much time thinking about any single competency.
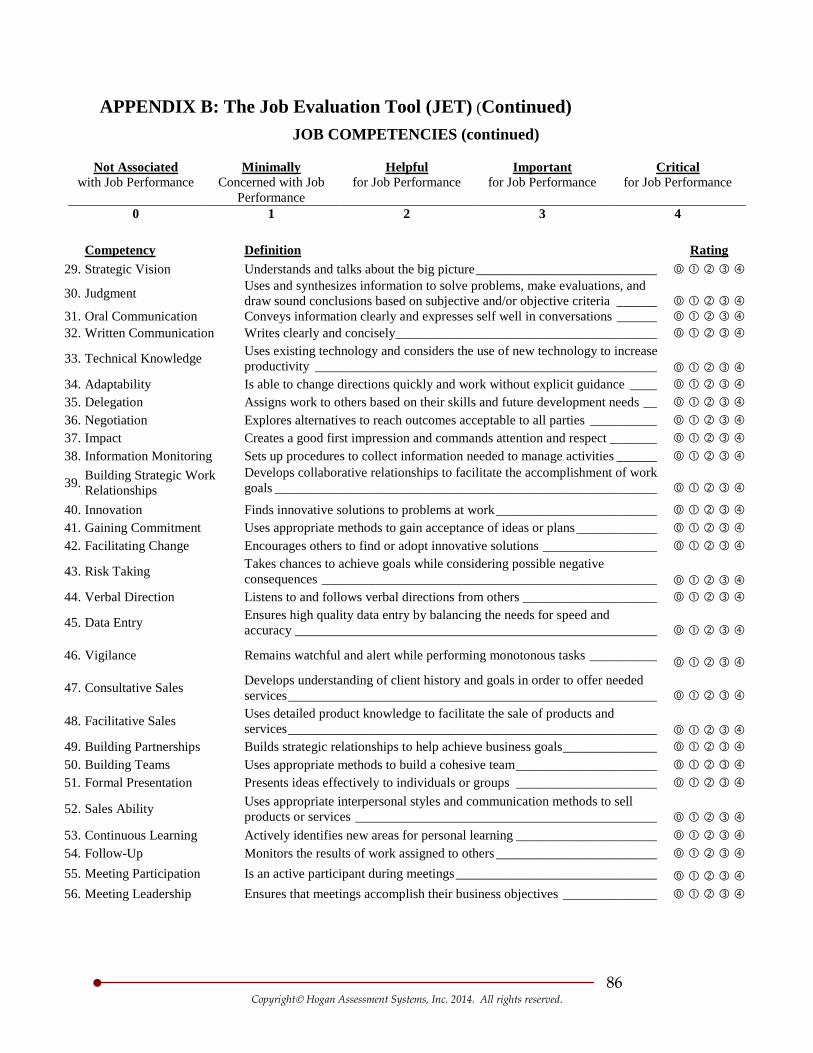
86 Copyright Hogan Assessment Systems, Inc. 2014. All rights reserved.
APPENDIX B: The Job Evaluation Tool (JET) (Continued) JOB COMPETENCIES (continued)
Not Associated with Job Performance
Minimally Concerned with Job
Performance
Helpful for Job Performance
Important for Job Performance
Critical for Job Performance
0 1 2 3 4
Competency Definition Rating 29. Strategic Vision Understands and talks about the big picture ___________________________
30. Judgment Uses and synthesizes information to solve problems, make evaluations, and draw sound conclusions based on subjective and/or objective criteria ______
31. Oral Communication Conveys information clearly and expresses self well in conversations ______ 32. Written Communication Writes clearly and concisely _______________________________________
33. Technical Knowledge Uses existing technology and considers the use of new technology to increase productivity ___________________________________________________
34. Adaptability Is able to change directions quickly and work without explicit guidance ____ 35. Delegation Assigns work to others based on their skills and future development needs __ 36. Negotiation Explores alternatives to reach outcomes acceptable to all parties __________ 37. Impact Creates a good first impression and commands attention and respect _______ 38. Information Monitoring Sets up procedures to collect information needed to manage activities ______
39. Building Strategic Work Relationships
Develops collaborative relationships to facilitate the accomplishment of work goals _________________________________________________________
40. Innovation Finds innovative solutions to problems at work ________________________ 41. Gaining Commitment Uses appropriate methods to gain acceptance of ideas or plans ____________ 42. Facilitating Change Encourages others to find or adopt innovative solutions _________________
43. Risk Taking Takes chances to achieve goals while considering possible negative consequences __________________________________________________
44. Verbal Direction Listens to and follows verbal directions from others ____________________
45. Data Entry Ensures high quality data entry by balancing the needs for speed and accuracy ______________________________________________________
46. Vigilance Remains watchful and alert while performing monotonous tasks __________
47. Consultative Sales Develops understanding of client history and goals in order to offer needed services _______________________________________________________
48. Facilitative Sales Uses detailed product knowledge to facilitate the sale of products and services _______________________________________________________
49. Building Partnerships Builds strategic relationships to help achieve business goals ______________ 50. Building Teams Uses appropriate methods to build a cohesive team _____________________ 51. Formal Presentation Presents ideas effectively to individuals or groups _____________________
52. Sales Ability Uses appropriate interpersonal styles and communication methods to sell products or services _____________________________________________
53. Continuous Learning Actively identifies new areas for personal learning _____________________ 54. Follow-Up Monitors the results of work assigned to others ________________________ 55. Meeting Participation Is an active participant during meetings ______________________________ 56. Meeting Leadership Ensures that meetings accomplish their business objectives ______________
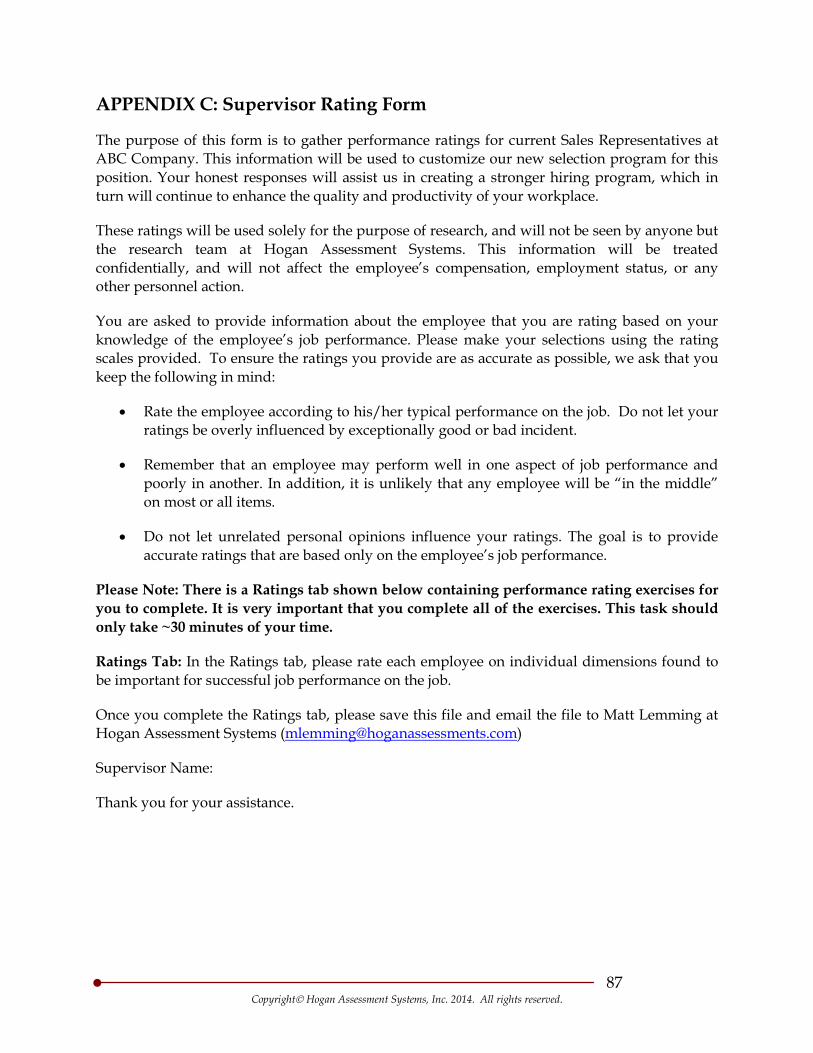
87 Copyright Hogan Assessment Systems, Inc. 2014. All rights reserved.
APPENDIX C: Supervisor Rating Form
The purpose of this form is to gather performance ratings for current Sales Representatives at ABC Company. This information will be used to customize our new selection program for this position. Your honest responses will assist us in creating a stronger hiring program, which in turn will continue to enhance the quality and productivity of your workplace.
These ratings will be used solely for the purpose of research, and will not be seen by anyone but the research team at Hogan Assessment Systems. This information will be treated confidentially, and will not affect the employee’s compensation, employment status, or any other personnel action.
You are asked to provide information about the employee that you are rating based on your knowledge of the employee’s job performance. Please make your selections using the rating scales provided. To ensure the ratings you provide are as accurate as possible, we ask that you keep the following in mind:
• Rate the employee according to his/her typical performance on the job. Do not let your ratings be overly influenced by exceptionally good or bad incident.
• Remember that an employee may perform well in one aspect of job performance and poorly in another. In addition, it is unlikely that any employee will be “in the middle” on most or all items.
• Do not let unrelated personal opinions influence your ratings. The goal is to provide accurate ratings that are based only on the employee’s job performance.
Please Note: There is a Ratings tab shown below containing performance rating exercises for you to complete. It is very important that you complete all of the exercises. This task should only take ~30 minutes of your time.
Ratings Tab: In the Ratings tab, please rate each employee on individual dimensions found to be important for successful job performance on the job.
Once you complete the Ratings tab, please save this file and email the file to Matt Lemming at Hogan Assessment Systems ([email protected])
Supervisor Name:
Thank you for your assistance.
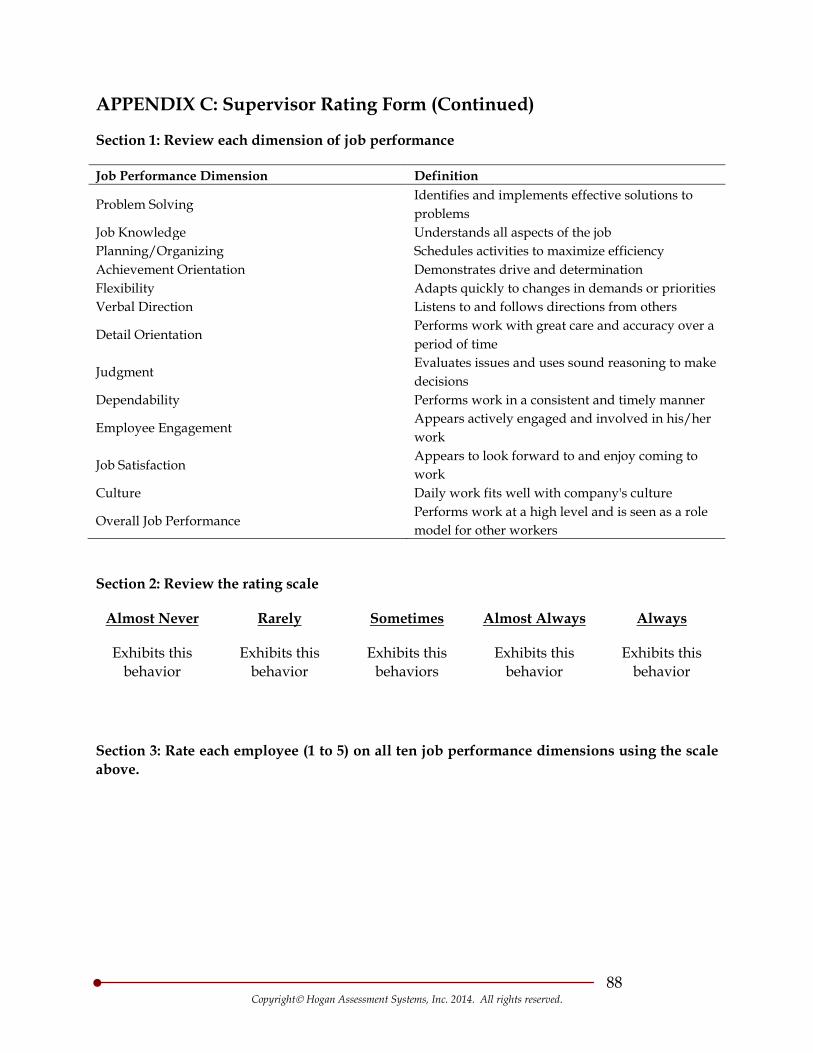
88 Copyright Hogan Assessment Systems, Inc. 2014. All rights reserved.
APPENDIX C: Supervisor Rating Form (Continued)
Section 1: Review each dimension of job performance
Job Performance Dimension Definition
Problem Solving Identifies and implements effective solutions to problems
Job Knowledge Understands all aspects of the job Planning/Organizing Schedules activities to maximize efficiency Achievement Orientation Demonstrates drive and determination Flexibility Adapts quickly to changes in demands or priorities Verbal Direction Listens to and follows directions from others
Detail Orientation Performs work with great care and accuracy over a period of time
Judgment Evaluates issues and uses sound reasoning to make decisions
Dependability Performs work in a consistent and timely manner
Employee Engagement Appears actively engaged and involved in his/her work
Job Satisfaction Appears to look forward to and enjoy coming to work
Culture Daily work fits well with company's culture
Overall Job Performance Performs work at a high level and is seen as a role model for other workers
Section 2: Review the rating scale
Almost Never Rarely Sometimes Almost Always
Exhibits this behavior
Always
Exhibits this behavior
Exhibits this behaviors
Exhibits this behavior
Exhibits this behavior
Section 3: Rate each employee (1 to 5) on all ten job performance dimensions using the scale above.
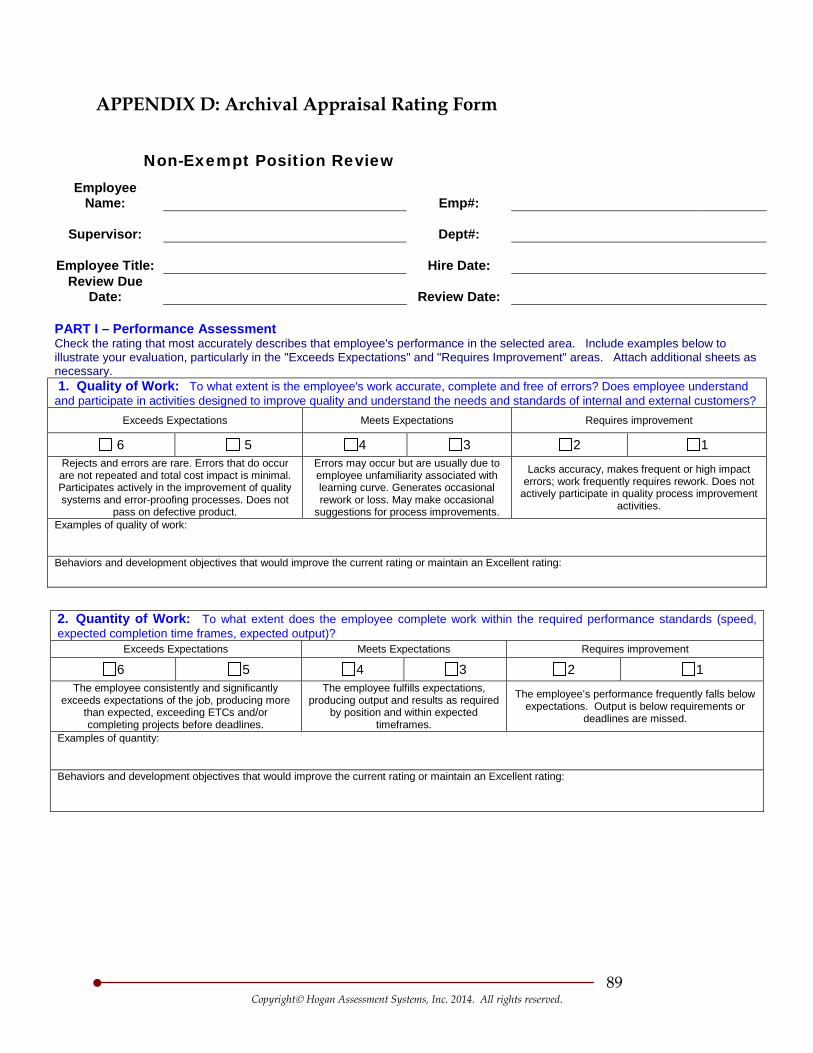
89 Copyright Hogan Assessment Systems, Inc. 2014. All rights reserved.
APPENDIX D: Archival Appraisal Rating Form
Non-Exempt Position Review
Employee Name: Emp#:
Supervisor:
Dept#:
Employee Title: Hire Date:
Review Due Date: Review Date:
PART I – Performance Assessment Check the rating that most accurately describes that employee's performance in the selected area. Include examples below to illustrate your evaluation, particularly in the "Exceeds Expectations" and "Requires Improvement" areas. Attach additional sheets as necessary. 1. Quality of Work: To what extent is the employee's work accurate, complete and free of errors? Does employee understand and participate in activities designed to improve quality and understand the needs and standards of internal and external customers?
Exceeds Expectations Meets Expectations Requires improvement
6 5 4 3 2 1 Rejects and errors are rare. Errors that do occur are not repeated and total cost impact is minimal. Participates actively in the improvement of quality systems and error-proofing processes. Does not
pass on defective product.
Errors may occur but are usually due to employee unfamiliarity associated with learning curve. Generates occasional rework or loss. May make occasional
suggestions for process improvements.
Lacks accuracy, makes frequent or high impact errors; work frequently requires rework. Does not
actively participate in quality process improvement activities.
Examples of quality of work: Behaviors and development objectives that would improve the current rating or maintain an Excellent rating:
2. Quantity of Work: To what extent does the employee complete work within the required performance standards (speed, expected completion time frames, expected output)?
Exceeds Expectations Meets Expectations Requires improvement
6 5 4 3 2 1 The employee consistently and significantly
exceeds expectations of the job, producing more than expected, exceeding ETCs and/or completing projects before deadlines.
The employee fulfills expectations, producing output and results as required
by position and within expected timeframes.
The employee’s performance frequently falls below expectations. Output is below requirements or
deadlines are missed.
Examples of quantity: Behaviors and development objectives that would improve the current rating or maintain an Excellent rating:
90 Copyright Hogan Assessment Systems, Inc. 2014. All rights reserved.
APPENDIX D: Archival Appraisal Rating Form (Continued)
3. Job Knowledge: To what extent does the employee understand the principles, methods, processes and procedures used in assignment; is able to apply them and make good decisions and accomplish job responsibilities; and can transfer knowledge to new assignments or environments?
Exceeds Expectations Meets Expectations Requires improvement
6 5 4 3 2 1 Thoroughly understands all aspects of the job
and makes the most of knowledge and experience. Makes sound and resourceful
decisions in the absence of detailed instructions. Adjusts quickly to new conditions. Needs little
direction and is willing and able to share knowledge with others.
Understands the basic job objectives and demonstrates knowledge of most practices and
procedures. Can make sound decisions as needed. Sometimes needs instruction on new
assignments and activities.
Insufficient knowledge of job; requires frequent help or repeated directions. Has
trouble adjusting to new conditions or transferring knowledge to new tasks. May
make poor judgment calls due to insufficient job understanding.
Examples of job knowledge:
Behaviors and development objectives that would improve the current rating or maintain an Excellent rating:
4. Accountability, Focus and Consistency: To what extent does the employee meet commitments, deadlines, and adherence to company guidelines? Is the employee accountable and rises above circumstance to achieve results? To what extent does employee’s attendance impact his/her ability to meet commitments and deadlines as required.
Exceeds Expectations Meets Expectations Requires improvement
6 5 4 3 2 1 Can always be counted on to be meet deadlines
and commitments. Proactive in addressing barriers to on-time completion. Rises above
circumstances to produce extraordinary results.
Generally meets due dates or takes appropriate action if deadline may be missed.
Takes responsibility for actions without excuses, and moves forward with solutions.
Misses due dates on projects without appropriate actions taken. Tends to focus on
old explanations and excuses, react to problems and fails to take full responsibility.
Examples of accountability, focus and consistency:
Behaviors and development objectives that would improve the current rating or maintain an Excellent rating:
5. Teamwork and Cooperation: To what extent does the employee support team goals, establish effective working relationships, interact positively with peers and avoid downward spirals. Consider optional activities such as SET team leadership, participation in employee services, employee recognition, Excellence ambassadors or other team activities.
Exceeds Expectations Meets Expectations Requires improvement
6 5 4 3 2 1 Very positive team player, follows “Mine the
Gold” Excellence principle to bring out the best in self and others; recognizes the value in every
person’s contribution.
Cooperates fully and supports team goals. Makes suggestions and constructively
participates in team meetings.
May be uncooperative or negative when working with others. Does not participate
actively in team meetings. Does not follow Excellence principles and Code of Conduct.
Examples of teamwork and cooperation:
Behaviors and development objectives that would improve the current rating or maintain an Excellent rating:
91 Copyright Hogan Assessment Systems, Inc. 2014. All rights reserved.
APPENDIX D: Archival Appraisal Rating Form (Continued)
6. Communication: To what extent is the employee able to convey information to colleagues, supervisor, customer or others on a timely basis with quality, integrity and respect. Consider also the extent to which the employee actively listens and comprehends information.
Employee’s written or verbal messages are consistently understood. Uses words wisely and
avoids downward spirals; comments are insightful, inspired and focused on the intent and end result
with minimal loss of productivity. Listens and comprehends well and uses body language
appropriately.
Generally able to communicate as required. Asks questions for clarity and follows written
and oral instructions. Effectively communicates issues to supervisor promptly and without pointing blame. Written communication is
consistent with job requirements.
Has difficulty communicating effectively; messages are often unclear and does not exhibit understanding of work instructions.
May get into downward spiral conversations, participating in gossip or blame-laying. Written communications
require improvement to meet job requirements.
Exceeds Expectations Meets Expectations Requires improvement
6 5 4 3 2 1 Examples of communication:
Behaviors and development objectives that would improve the current rating or maintain an Excellent rating:
7. Compliance: To what extent does the employee follow policies and procedures? What efforts were made to help others gain awareness of safety & security issues?
Exceeds Expectations Meets Expectations Requires improvement
6 5 4 3 2 1
Employee sets a good example by consistently and enthusiastically adhering to company policies AND
reminds others of safety and security issues.
Can be counted on to set a good example by following safety and security protocols.
Asks for clarification if unsure.
Employee fails to follow company safety rules or security protocols. Makes
adjustments in order to comply when supervision is present.
Does NOT consistently set an example for others.
Examples of compliance:
Behaviors and development objectives that would improve the current rating or maintain an Excellent rating:
PART II – Performance Summary
Total evaluation scores and divide by seven for overall rating: Supervisor: Summary comments on performance. Significant accomplishments, as applicable, and areas requiring improvement or development.
General development objectives and behaviors that would improve the current rating or prepare employee for advancement:
92 Copyright Hogan Assessment Systems, Inc. 2014. All rights reserved.
APPENDIX D: Archival Appraisal Rating Form (Continued)
PART III - Approvals – all approvals are required before discussing appraisal with employee
Supervisor Signature Date
Next Level Manager Date
Next Level Manager (optional) Date
Human Resources Date
PART V - Employee Acknowledgment Employee comments (optional)
Employee Signature
Date