validation of the quality of life in childhood epilepsy questionnaire in american epilepsy patients
TRANSCRIPT
Epilepsy&
Epilepsy & Behavior 4 (2003) 680–691
Behavior
www.elsevier.com/locate/yebeh
Validation of the Quality of Life in ChildhoodEpilepsy Questionnaire in American epilepsy patients
Mark Sabaz,a,b John A. Lawson,b,c,d David R. Cairns,a Michael S. Duchowny,c
Trevor J. Resnick,c Patricia M. Dean,c and Ann M.E. Byeb,d,*
a Department of Psychology, Macquarie University, Sydney, NSW 2109, Australiab School of Women’s and Children’s Health, University of New South Wales, Sydney, NSW 2052, Australia
c Comprehensive Epilepsy Center, Miami Children’s Hospital, Miami, FL, USAd Department of Paediatric Neurology, Sydney Children’s Hospital, Randwick, NSW 2031, Australia
Received 21 May 2003; revised 14 August 2003; accepted 19 August 2003
Abstract
The aim of this study was to adapt the Australian Quality of Life in Childhood Epilepsy Questionnaire (QOLCE) and determine
its psychometric properties in a North American population. Participants were North American families with children diagnosed
with epilepsy. Parents were asked to complete the American QOLCE (USQOLCE) and the Child Health Questionnaire (CHQ).
Seventy-one families completed the USQOLCE. The internal consistency reliability of the subscales was good. USQOLCE subscales
correlated highly with theoretically similar subscales contained in the CHQ. Theoretically dissimilar subscales on the two instru-
ments did not correlate as well. USQOLCE correlated significantly with a parental rating of seizure severity and an independent
measure of degree of postoperative seizure control. This study demonstrated that the USQOLCE is suitable for a North American
population with evidence of its reliability and validity including its sensitivity to seizure burden.
� 2003 Elsevier Inc. All rights reserved.
Keywords: Children; Epilepsy; Surgery; Quality of life; Validation; America
1. Introduction
The clinical management of epilepsy involves much
more than control of seizures and requires recognition
of potential adverse effects on all aspects of life. In ep-
ilepsy research, there is a clear and growing recognitionthat health-related quality of life (HRQOL) measure-
ment adds new and important information to other
traditional health outcome measures such as seizure
control and cognitive improvement [1–11].
To date most childhood epilepsy studies utilise sur-
rogate measures of HRQOL which evaluate limited
domains of life function [12–14]. These surrogate mea-
sures include generic instruments such as the Child Be-haviour Checklist [12], Developmental Behaviour
Checklist [13], and Child Health Questionnaire [14].
Recently we have seen the development of disease-
* Corresponding author. Fax: +61-2-9382-1580.
E-mail address: [email protected] (A.M.E. Bye).
1525-5050/$ - see front matter � 2003 Elsevier Inc. All rights reserved.
doi:10.1016/j.yebeh.2003.08.012
specific instruments of HRQOL for children with epi-
lepsy. These instruments are a useful addition to the
questionnaires presently available to the practitioner, as
they are more sensitive to the condition of interest [15].
However, some still offer a limited evaluation. The Ha-
gue Restrictions in Childhood Epilepsy Scale is re-stricted to assessment of a child�s physical function [16].
The Impact of Paediatric Epilepsy Scale focuses on the
psychosocial impact of epilepsy on the family [17]. The
recently developed and validated Quality of Life in
Epilepsy Inventory for Adolescents is a valuable tool
measuring a number of life domains such as cognition,
physical function, social function, behaviour, health
perceptions and attitudes [18,19]. However, it is limitedto those aged 11–17 years. Ronen et al. [20] have de-
veloped a HRQOL instrument for younger children but
it has yet to be validated.
Our Australian centre was the first to construct
and publish a multifaceted epilepsy-specific scale for
evaluating the HRQOL of children aged 4–18 years
M. Sabaz et al. / Epilepsy & Behavior 4 (2003) 680–691 681
(Quality of Life in Childhood Epilepsy Questionnaire,QOLCE) [10]. The QOLCE was developed from an ori-
ginal questionnaire containing 91 items. Item analysis
and validation led to a final questionnaire containing 76
items with 16 subscales covering five domains of life
function: physical function, social function, cognition,
emotional and behavioural well-being. Each QOLCE
subscale demonstrated a high level of internal consistency
reliability. The QOLCE subscales correlated stronglywith similar subscales in an existing generic health out-
comemeasure, theChildHealthQuestionnaire (CHQ). In
addition, 12 of 16 subscales of the QOLCE correlated
with a measure of seizure severity. However, this measure
of seizure severity was rated by parents, and, therefore,
was not independent from the ratings obtained from the
QOLCE. The validity of an instrument is better estab-
lished by correlating it with an independent measure ofseizure burden. We recently demonstrated that the
QOLCE was sensitive to the impact of localisation-re-
lated epilepsy syndromes comparedwith relatively benign
syndromes such as childhood absence epilepsy and be-
nign rolandic epilepsy [21].
The primary aim of the present study was to adapt
the original Australian QOLCE for use in the American
population. This involved examining the original pool of91 items from which the QOLCE was developed to de-
termine if translation was required from Australian to
U.S. English. This is important because there are re-
cognised conceptual and semantic differences in the
English language depending on the country [22–24]. The
validity of the adapted instrument was then evaluated by
investigating internal consistency reliability, construct
validity, and clinical sensitivity. The validation wasbased on the methodology used for the Australian val-
idation study so that equivalence of the two forms could
be considered. The validation sample was recruited from
one of the largest paediatric epilepsy surgical centres in
the world: the Miami Children�s Hospital (MCH),
Florida, USA. Therefore, we also recruited a subset of
families that had children who have undergone epilepsy
surgery to assess the sensitivity of the QOLCE to post-operative seizure outcome.
2. Method
2.1. Patients
Children with epilepsy and their parents were drawnfrom inpatient and outpatient services of the Compre-
hensive Epilepsy Center based at the Miami Children�sHospital (MCH), Florida, USA. The MCH is one of the
largest paediatric surgical centers in North America with
a wide referral base throughout the United States. In-
clusion criteria for the primary research sample required
children aged 4–18 years who had their seizure disorder
diagnosed by a neurologist (M.S.D., T.J.R., or J.A.L.)and had at least one partial or generalised seizure during
the past 2 years. English was required as the primary
language of the household. Children who had under-
gone epilepsy surgery in the past were excluded from the
primary research sample. A second sample of families
with children (aged 4–18 years) who had undergone
epilepsy surgery was identified to assess the sensitivity of
the QOLCE to clinical outcome. From the two samplesthose children with a progressive neurodegenerative
disorder, severe to profound mental retardation, or vi-
sual/hearing impairment were excluded from the study.
The MCH human research ethics committee approved
the study and written consent to participate was ob-
tained from each patient�s family.
2.2. Measures
2.2.1. Questionnaire package
Parents were asked to complete a questionnaire
package during the period of hospitalisation if the child
was an inpatient. For outpatients, parents were given a
questionnaire package and asked to return it using a
supplied stamped, addressed envelope. The question-
naire package included the:
2.2.1.1. a. Child epilepsy questionnaire (CEQ). The CEQ
is a parent-rating instrument designed to assess children
with epilepsy aged 4–18 years. It contains two parts: the
Child Seizure Profile (CSP) and the Quality of Life in
Childhood Epilepsy Questionnaire (QOLCE). Details of
the contents of the CEQ and how it was developed are
described in the Australian validation study [25]. TheCSP contains a series of questions pertaining to seizure
characteristics and antiepileptic drugs (AEDs) taken and
their side effects. In the Australian validation study 15
items were eliminated from the QOLCE, reducing it from
a 91- to a 76-item scale. Instead of adapting the validated
76-item Australian QOLCE into American English, the
original 91-item QOLCE was translated. This offered the
opportunity to determine if the same item and subscalestructure could be achieved in a sample independent of
that used in the Australian study. Translation of the
QOLCE involved converting Australian spelling to
American spelling and minor changes in expression for
12 items. Examples of changes in expression included:
‘‘stayed out overnight (with family and friends)’’ to
‘‘slept away from home (with friends or family)’’; ‘‘limited
his/her social activities (visiting friends, close relatives, orneighbours)’’ to ‘‘been restricted in their social activities
(visiting friends, close relatives or neighbours)’’; and
‘‘helped him/her to make friends’’ to ‘‘made friends
easily.’’ Finally, a focus group of American epilepsy
outpatients and health care professionals reviewed the
questionnaire for its content and clarity. This latter stage
did not lead to the addition or removal of any items.
682 M. Sabaz et al. / Epilepsy & Behavior 4 (2003) 680–691
2.2.1.2. b. Child health questionnaire (CHQ). The CHQparent form (PF50) contains 50 items assessing 14 do-
mains of health status in children aged 5 years and older.
It is a normed instrument with established reliability and
validity [26]. The CHQ has been used as a surrogate
HRQOL measure in children with epilepsy [13,26]. It
was used in the original validation study of the Aus-
tralian QOLCE and its administration in the present
study allows direct comparability of the psychometricproperties of the QOLCE in both Australia and the
United States.
2.2.2. Clinical and demographic variables
A number of clinical and demographic variables were
collected for each subject. Age, gender, age of epilepsy
onset, and racial origin were obtained from clinical hi-
story. Intellectual ability was determined either by for-mal neuropsychological assessment or by an educational
assessment. Socioeconomic data were obtained by re-
questing parent respondents to indicate their highest
level of education completed (<high school, high school,
college, graduate school), estimated annual income
(< $25K, $25–$50K, > $50), and family structure (dual
parent, birth and stepparents, single parent). Finally,
seizure severity during the past 6 months (1¼ very se-vere, 2¼ severe, 3¼moderate, 4¼mild, 5¼ very mild,
6¼ no seizures) and the number AEDs taken during the
past 4 weeks were obtained from the CSP.
A subset of families recruited (sample 2) were chil-
dren who had undergone epilepsy surgery. The postop-
erative seizure status at the time of latest follow-up was
recorded, according to Engel�s classification [27] (sei-
zure-free, >90% reduction, >50% reduction, <50% re-duction). Time since surgery (in months) and duration
of seizure freedom (in months) were also recorded.
2.3. Data collection and response rate
One-hundred and thirty-one of 137 families invited
agreed to participate in the study. Of the 131, 51 were
families whose children had undergone epilepsy surgery.The remaining 80 families thus became the primary re-
search sample to determine the psychometric properties
of the USQOLCE. Forty-three families completed
the questionnaires whilst their child was an inpatient,
the remaining families were outpatients and returned the
questionnaires by mail. If required, a reminder phone
call was made at 2–3 weeks. No further attempts were
made to recover the questionnaires if this reminder wasunsuccessful.
2.4. Statistical analysis
All analyses were conducted using the Statistical
Package for the Social Sciences (SPSS) Version 10
[28].
2.4.1. Response rate and description of the sample
The response rate of the American epilepsy sam-
ple was determined by calculating the percentage of
families who returned the questionnaire. The demo-
graphic and clinical variables of the final sample
have been summarised using the mean, standard
deviation, and frequency of observations, where ap-
propriate.
2.4.2. Missing data
Mean imputation was used to replace missing sub-
scale scores resulting from respondents either not indi-
cating a response or answering ‘‘not applicable’’ to at
least one question. All the following data analyses were
rerun excluding mean imputed values to confirm results.
2.4.3. USQOLCE descriptive statistics
Mean score, standard deviation, and observed mini-
mum and percentage of subjects scoring at the ceiling
were calculated for each subscale of the USQOLCE.
Subscale scores were calculated using the average score
of items making up a subscale. The overall quality of life
score was the unweighted average of the USQOLCE
subscale scores.
2.4.4. Item analysis and subscale reliabilities
Each item was correlated with the USQOLCE sub-
scales to assess item convergent and discriminant va-
lidity. Item discriminant success was operationalised as
the number of times an item correlated more highly with
its hypothesised subscale than with competing subscales.
Items that did not correlate at least 0.3 with their hy-
pothesised subscale were eliminated; this cutoff level hasbeen used to validate other quality-of-life scales and the
original Australian QOLCE [25]. Cronbach�s a was used
to determine the internal consistency reliabilities of the
USQOLCE subscales.
2.4.5. Construct validity
Firstly, a correlation matrix for the 16 QOLCE
subscales was examined. Subscales were expected tocorrelate positively with one another, indicating that
the subscales measure a similar construct (‘‘quality of
life’’). In addition, correlations between theoretically
dissimilar subscales were not expected to be high, in-
dicating that each measures a unique aspect of
HRQOL. To be consistent with the validation of the
Australian QOLCE high correlations were defined as
those falling at or above 0.68 (i.e., more than 45%shared variance) [25].
The construct validity of the USQOLCE was also
determined by correlating USQOLCE subscales with
CHQ subscales. High correlations between theoretically
similar subscales from the two independent question-
naires provide evidence for convergent validity. Rela-
tively lower correlations between theoretically dissimilar
M. Sabaz et al. / Epilepsy & Behavior 4 (2003) 680–691 683
subscales from the two independent questionnairesprovide evidence for discriminant validity.
2.4.6. Relationship between HRQOL and seizure severity
and number of AEDs taken
The relationship between USQOLCE scores and the
clinical variables, seizure severity, and number of AEDs
taken was analysed by partial correlation controlling for
the effects of important clinical and demographic vari-ables. Important clinical and demographic variables
were defined as those having a significant relationship
(P < 0:05) with the independent variables (seizure se-
verity or number of AEDs) and/or the dependent vari-
ables (USQOLCE scores).
2.4.7. QOLCE acceptability: analysis of missing data
The frequency of missing data for each of theQOLCE subscales was documented. The relationship
of missing data to demographic and clinical variables
was determined. The relationship between continuous
variables (age, age of epilepsy onset, and number of
AEDs taken) and missing data (coded absent or pres-
ent) was determined using ANOVA. The relationship
between categorical variables (gender, seizure severity,
race, parental education, and family income) and ab-sence/presence of missing data was determined using
the Fisher exact v2 statistic. Due to the large number of
comparisons, the criteria for significance was set at
0.01.
2.4.8. Sensitivity of the USQOLCE to postoperative
seizure freedom
Analysis of variance was used to determine the effectof postoperative seizure outcome on USQOLCE scores
using data collected from families with children who had
undergone epilepsy surgery. In addition, the significance
of relationships between postoperative USQOLCE
scores and other clinical variables (age, age of epilepsy
onset, gender, age at surgery, time since surgery, dura-
tion of seizure freedom, pre- and postoperative seizure
frequency, absence/presence of intellectual impairment)was determined using regression-based or group-com-
parison techniques.
3. Results
3.1. Response rate and description of primary research
sample
Of the 80 families who agreed to participate, 89%
returned the questionnaire package. Therefore, the pri-
mary study sample was 71 parents of children with ep-
ilepsy (45 boys and 26 girls). Approximately 50% of
families required a reminder phone call before returning
the questionnaire package. The ages of the children
ranged from 4 to 18 years inclusive (mean¼ 11.17,SD¼ 4.08), with the mean age of epilepsy onset being
5.13 years (SD¼ 3.72). The severity of the seizures
during the past 6 months was severe to very severe for
29.0% of children, moderately severe for 30.4%, and
mild to very mild for 23.2%; 17.4% of children did not
experience seizures during the past 6 months. The
number of medications taken by the children ranged
from 0 to 5 (mean¼ 1.90, SD¼ 1.01). Sixty-six percentof families were Anglo-American, 10% were African-
American, 20% were Hispanic, and 4% were Asian in
origin. Of the parents who responded to the question-
naire package, 76.0% were mothers, 8.5% were fathers,
and 15.5% were both parents. Fifty-two percent of re-
spondents had at least completed college education and
the remaining respondents had high school education or
less. Fifty-two percent of respondents earned more thanUS$50K per annum and the remaining respondents
earned less than this amount. Seventy-four percent of
families consisted of both biological parents, 19% had a
single parent, and 7% had one biological and one step-
parent.
3.2. Item analysis
Table 1 summarises the evidence pertaining to the
convergent and discriminant validity of the USQOLCE
items. Seventy-nine of the 91 items had corrected item–
scale correlations greater than 0.30. The 12 items that
correlated less than 0.30 with theoretically relevant
subscales were eliminated from further analysis. They
included one item expected to fall in the other cognitive
processes subscale, one item expected to fall in theanxiety subscale, three items expected to fall into the
social interactions subscale, and seven items expected
to fall in the behaviour subscale. These 12 items were
not included in the summaries presented in Table 1.
The discriminant validity of the remaining 79 US-
QOLCE items is shown in Table 1. These items cor-
related higher with their hypothesised USQOLCE
subscale than competing subscales 85–100%(mean¼ 96%) of the time.
3.3. Reliability
Table 1 shows that the internal consistency reliabili-
ties of the multi-item scales fell between 0.76 and 0.97.
This level of internal consistency reliability is above the
criterion generally accepted as adequate when makinggroup comparisons (i.e., 0.70) [29].
3.4. Descriptive statistics
The means of the USQOLCE subscales generally fell
approximately equidistant from basal and ceiling levels
and ranged from 44.72 to 71.07. Basal level scores
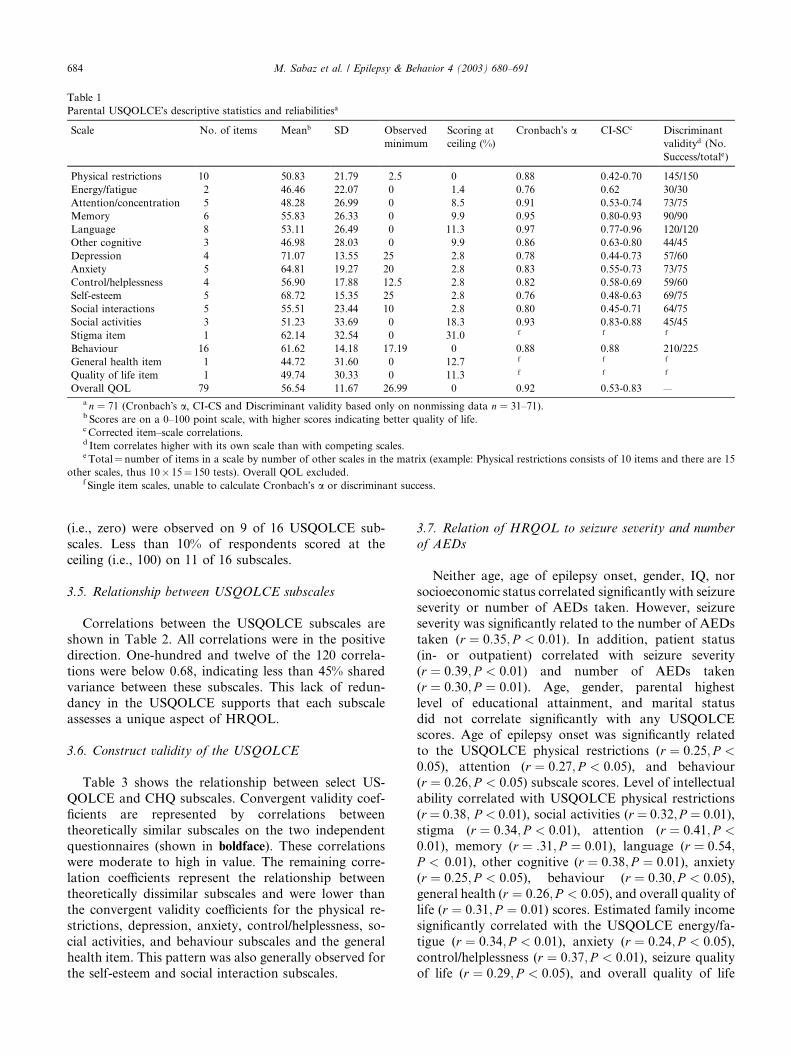
Table 1
Parental USQOLCE�s descriptive statistics and reliabilitiesa
Scale No. of items Meanb SD Observed
minimum
Scoring at
ceiling (%)
Cronbach�s a CI-SCc Discriminant
validityd (No.
Success/totale)
Physical restrictions 10 50.83 21.79 2.5 0 0.88 0.42-0.70 145/150
Energy/fatigue 2 46.46 22.07 0 1.4 0.76 0.62 30/30
Attention/concentration 5 48.28 26.99 0 8.5 0.91 0.53-0.74 73/75
Memory 6 55.83 26.33 0 9.9 0.95 0.80-0.93 90/90
Language 8 53.11 26.49 0 11.3 0.97 0.77-0.96 120/120
Other cognitive 3 46.98 28.03 0 9.9 0.86 0.63-0.80 44/45
Depression 4 71.07 13.55 25 2.8 0.78 0.44-0.73 57/60
Anxiety 5 64.81 19.27 20 2.8 0.83 0.55-0.73 73/75
Control/helplessness 4 56.90 17.88 12.5 2.8 0.82 0.58-0.69 59/60
Self-esteem 5 68.72 15.35 25 2.8 0.76 0.48-0.63 69/75
Social interactions 5 55.51 23.44 10 2.8 0.80 0.45-0.71 64/75
Social activities 3 51.23 33.69 0 18.3 0.93 0.83-0.88 45/45
Stigma item 1 62.14 32.54 0 31.0 f f f
Behaviour 16 61.62 14.18 17.19 0 0.88 0.88 210/225
General health item 1 44.72 31.60 0 12.7 f f f
Quality of life item 1 49.74 30.33 0 11.3 f f f
Overall QOL 79 56.54 11.67 26.99 0 0.92 0.53-0.83 —
a n ¼ 71 (Cronbach�s a, CI-CS and Discriminant validity based only on nonmissing data n ¼ 31–71).b Scores are on a 0–100 point scale, with higher scores indicating better quality of life.c Corrected item–scale correlations.d Item correlates higher with its own scale than with competing scales.e Total¼ number of items in a scale by number of other scales in the matrix (example: Physical restrictions consists of 10 items and there are 15
other scales, thus 10� 15¼ 150 tests). Overall QOL excluded.f Single item scales, unable to calculate Cronbach�s a or discriminant success.
684 M. Sabaz et al. / Epilepsy & Behavior 4 (2003) 680–691
(i.e., zero) were observed on 9 of 16 USQOLCE sub-
scales. Less than 10% of respondents scored at the
ceiling (i.e., 100) on 11 of 16 subscales.
3.5. Relationship between USQOLCE subscales
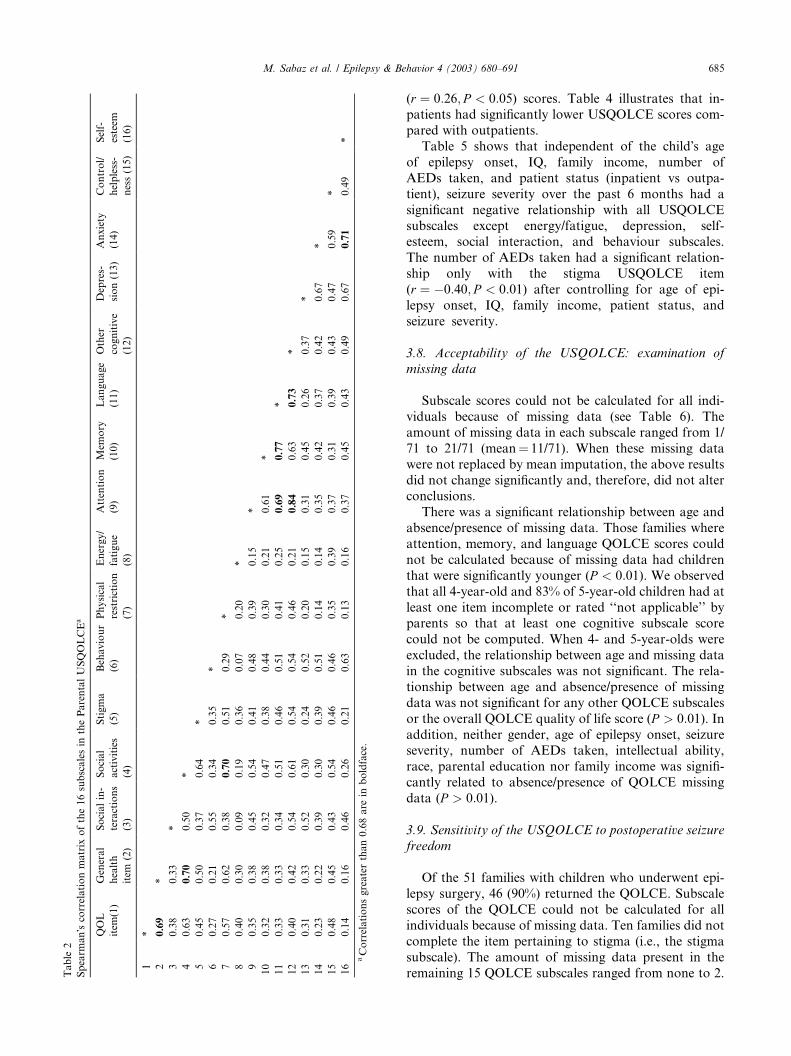
Correlations between the USQOLCE subscales are
shown in Table 2. All correlations were in the positive
direction. One-hundred and twelve of the 120 correla-
tions were below 0.68, indicating less than 45% shared
variance between these subscales. This lack of redun-
dancy in the USQOLCE supports that each subscale
assesses a unique aspect of HRQOL.
3.6. Construct validity of the USQOLCE
Table 3 shows the relationship between select US-
QOLCE and CHQ subscales. Convergent validity coef-
ficients are represented by correlations between
theoretically similar subscales on the two independent
questionnaires (shown in boldface). These correlationswere moderate to high in value. The remaining corre-
lation coefficients represent the relationship between
theoretically dissimilar subscales and were lower than
the convergent validity coefficients for the physical re-
strictions, depression, anxiety, control/helplessness, so-
cial activities, and behaviour subscales and the general
health item. This pattern was also generally observed for
the self-esteem and social interaction subscales.
3.7. Relation of HRQOL to seizure severity and number
of AEDs
Neither age, age of epilepsy onset, gender, IQ, nor
socioeconomic status correlated significantly with seizureseverity or number of AEDs taken. However, seizure
severity was significantly related to the number of AEDs
taken (r ¼ 0:35; P < 0:01). In addition, patient status
(in- or outpatient) correlated with seizure severity
(r ¼ 0:39; P < 0:01) and number of AEDs taken
(r ¼ 0:30; P ¼ 0:01). Age, gender, parental highest
level of educational attainment, and marital status
did not correlate significantly with any USQOLCEscores. Age of epilepsy onset was significantly related
to the USQOLCE physical restrictions (r ¼ 0:25; P <0:05), attention (r ¼ 0:27; P < 0:05), and behaviour
(r ¼ 0:26; P < 0:05) subscale scores. Level of intellectualability correlated with USQOLCE physical restrictions
(r ¼ 0:38; P < 0:01), social activities (r ¼ 0:32;P ¼ 0:01),stigma (r ¼ 0:34; P < 0:01), attention (r ¼ 0:41; P <0:01), memory (r ¼ :31; P ¼ 0:01), language (r ¼ 0:54;P < 0:01), other cognitive (r ¼ 0:38; P ¼ 0:01), anxiety(r ¼ 0:25; P < 0:05), behaviour (r ¼ 0:30; P < 0:05),general health (r ¼ 0:26; P < 0:05), and overall quality of
life (r ¼ 0:31; P ¼ 0:01) scores. Estimated family income
significantly correlated with the USQOLCE energy/fa-
tigue (r ¼ 0:34; P < 0:01), anxiety (r ¼ 0:24; P < 0:05),control/helplessness (r ¼ 0:37; P < 0:01), seizure quality
of life (r ¼ 0:29; P < 0:05), and overall quality of life
Table
2
Spearm
an�scorrelationmatrix
ofthe16subscalesin
theParentalUSQOLCEa
QOL
item
(1)
General
health
item
(2)
Socialin-
teractions
(3)
Social
activities
(4)
Stigma
(5)
Behaviour
(6)
Physical
restriction
(7)
Energy/
fatigue
(8)
Attention
(9)
Mem
ory
(10)
Language
(11)
Other
cognitive
(12)
Depres-
sion(13)
Anxiety
(14)
Control/
helpless-
ness(15)
Self-
esteem
(16)
1*
20.69
*
30.38
0.33
*
40.63
0.70
0.50
*
50.45
0.50
0.37
0.64
*
60.27
0.21
0.55
0.34
0.35
*
70.57
0.62
0.38
0.70
0.51
0.29
*
80.40
0.30
0.09
0.19
0.36
0.07
0.20
*
90.35
0.38
0.45
0.54
0.41
0.48
0.39
0.15
*
10
0.32
0.38
0.32
0.47
0.38
0.44
0.30
0.21
0.61
*
11
0.33
0.33
0.34
0.51
0.46
0.51
0.41
0.25
0.69
0.77
*
12
0.40
0.42
0.54
0.61
0.54
0.54
0.46
0.21
0.84
0.63
0.73
*
13
0.31
0.33
0.52
0.30
0.24
0.52
0.20
0.15
0.31
0.45
0.26
0.37
*
14
0.23
0.22
0.39
0.30
0.39
0.51
0.14
0.14
0.35
0.42
0.37
0.42
0.67
*
15
0.48
0.45
0.43
0.54
0.46
0.46
0.35
0.39
0.37
0.31
0.39
0.43
0.47
0.59
*
16
0.14
0.16
0.46
0.26
0.21
0.63
0.13
0.16
0.37
0.45
0.43
0.49
0.67
0.71
0.49
*
aCorrelationsgreaterthan0.68are
inboldface.
M. Sabaz et al. / Epilepsy & Behavior 4 (2003) 680–691 685
(r ¼ 0:26; P < 0:05) scores. Table 4 illustrates that in-patients had significantly lower USQOLCE scores com-
pared with outpatients.
Table 5 shows that independent of the child�s age
of epilepsy onset, IQ, family income, number of
AEDs taken, and patient status (inpatient vs outpa-
tient), seizure severity over the past 6 months had a
significant negative relationship with all USQOLCE
subscales except energy/fatigue, depression, self-esteem, social interaction, and behaviour subscales.
The number of AEDs taken had a significant relation-
ship only with the stigma USQOLCE item
(r ¼ �0:40; P < 0:01) after controlling for age of epi-
lepsy onset, IQ, family income, patient status, and
seizure severity.
3.8. Acceptability of the USQOLCE: examination of
missing data
Subscale scores could not be calculated for all indi-
viduals because of missing data (see Table 6). The
amount of missing data in each subscale ranged from 1/
71 to 21/71 (mean¼ 11/71). When these missing data
were not replaced by mean imputation, the above results
did not change significantly and, therefore, did not alterconclusions.
There was a significant relationship between age and
absence/presence of missing data. Those families where
attention, memory, and language QOLCE scores could
not be calculated because of missing data had children
that were significantly younger (P < 0:01). We observed
that all 4-year-old and 83% of 5-year-old children had at
least one item incomplete or rated ‘‘not applicable’’ byparents so that at least one cognitive subscale score
could not be computed. When 4- and 5-year-olds were
excluded, the relationship between age and missing data
in the cognitive subscales was not significant. The rela-
tionship between age and absence/presence of missing
data was not significant for any other QOLCE subscales
or the overall QOLCE quality of life score (P > 0:01). Inaddition, neither gender, age of epilepsy onset, seizureseverity, number of AEDs taken, intellectual ability,
race, parental education nor family income was signifi-
cantly related to absence/presence of QOLCE missing
data (P > 0:01).
3.9. Sensitivity of the USQOLCE to postoperative seizure
freedom
Of the 51 families with children who underwent epi-
lepsy surgery, 46 (90%) returned the QOLCE. Subscale
scores of the QOLCE could not be calculated for all
individuals because of missing data. Ten families did not
complete the item pertaining to stigma (i.e., the stigma
subscale). The amount of missing data present in the
remaining 15 QOLCE subscales ranged from none to 2.
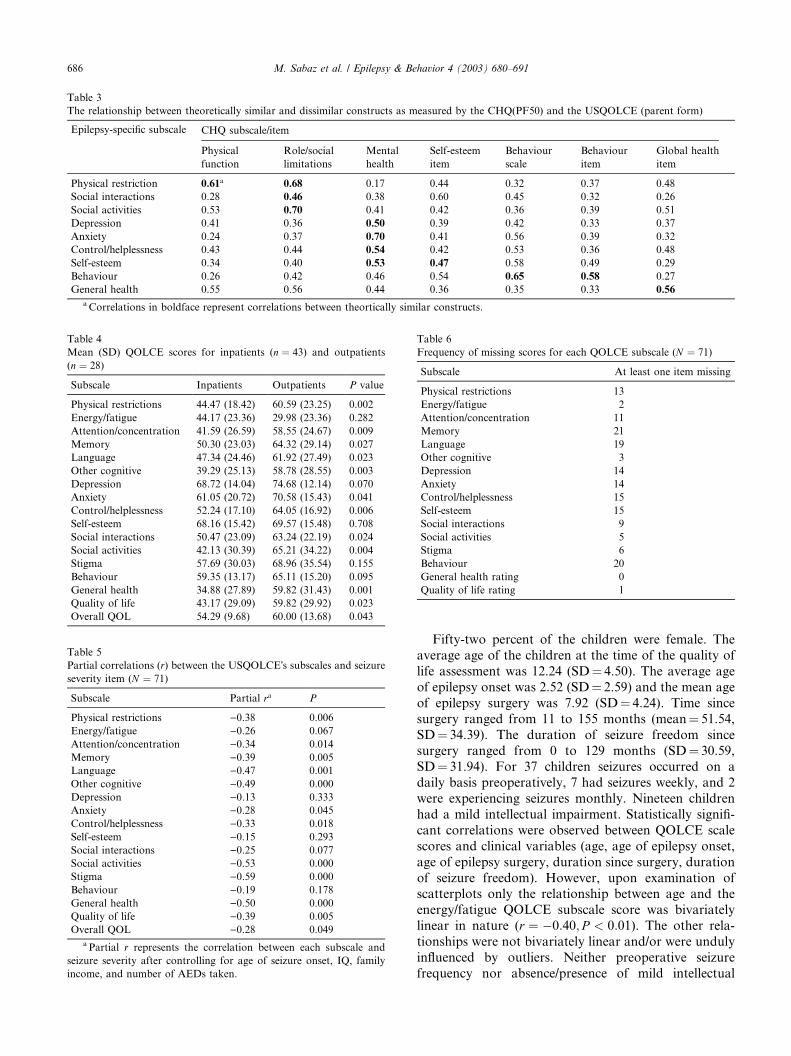
Table 3
The relationship between theoretically similar and dissimilar constructs as measured by the CHQ(PF50) and the USQOLCE (parent form)
Epilepsy-specific subscale CHQ subscale/item
Physical
function
Role/social
limitations
Mental
health
Self-esteem
item
Behaviour
scale
Behaviour
item
Global health
item
Physical restriction 0.61a 0.68 0.17 0.44 0.32 0.37 0.48
Social interactions 0.28 0.46 0.38 0.60 0.45 0.32 0.26
Social activities 0.53 0.70 0.41 0.42 0.36 0.39 0.51
Depression 0.41 0.36 0.50 0.39 0.42 0.33 0.37
Anxiety 0.24 0.37 0.70 0.41 0.56 0.39 0.32
Control/helplessness 0.43 0.44 0.54 0.42 0.53 0.36 0.48
Self-esteem 0.34 0.40 0.53 0.47 0.58 0.49 0.29
Behaviour 0.26 0.42 0.46 0.54 0.65 0.58 0.27
General health 0.55 0.56 0.44 0.36 0.35 0.33 0.56
a Correlations in boldface represent correlations between theortically similar constructs.
Table 4
Mean (SD) QOLCE scores for inpatients (n ¼ 43) and outpatients
(n ¼ 28)
Subscale Inpatients Outpatients P value
Physical restrictions 44.47 (18.42) 60.59 (23.25) 0.002
Energy/fatigue 44.17 (23.36) 29.98 (23.36) 0.282
Attention/concentration 41.59 (26.59) 58.55 (24.67) 0.009
Memory 50.30 (23.03) 64.32 (29.14) 0.027
Language 47.34 (24.46) 61.92 (27.49) 0.023
Other cognitive 39.29 (25.13) 58.78 (28.55) 0.003
Depression 68.72 (14.04) 74.68 (12.14) 0.070
Anxiety 61.05 (20.72) 70.58 (15.43) 0.041
Control/helplessness 52.24 (17.10) 64.05 (16.92) 0.006
Self-esteem 68.16 (15.42) 69.57 (15.48) 0.708
Social interactions 50.47 (23.09) 63.24 (22.19) 0.024
Social activities 42.13 (30.39) 65.21 (34.22) 0.004
Stigma 57.69 (30.03) 68.96 (35.54) 0.155
Behaviour 59.35 (13.17) 65.11 (15.20) 0.095
General health 34.88 (27.89) 59.82 (31.43) 0.001
Quality of life 43.17 (29.09) 59.82 (29.92) 0.023
Overall QOL 54.29 (9.68) 60.00 (13.68) 0.043
Table 5
Partial correlations (r) between the USQOLCE�s subscales and seizure
severity item (N ¼ 71)
Subscale Partial ra P
Physical restrictions )0.38 0.006
Energy/fatigue )0.26 0.067
Attention/concentration )0.34 0.014
Memory )0.39 0.005
Language )0.47 0.001
Other cognitive )0.49 0.000
Depression )0.13 0.333
Anxiety )0.28 0.045
Control/helplessness )0.33 0.018
Self-esteem )0.15 0.293
Social interactions )0.25 0.077
Social activities )0.53 0.000
Stigma )0.59 0.000
Behaviour )0.19 0.178
General health )0.50 0.000
Quality of life )0.39 0.005
Overall QOL )0.28 0.049
a Partial r represents the correlation between each subscale and
seizure severity after controlling for age of seizure onset, IQ, family
income, and number of AEDs taken.
Table 6
Frequency of missing scores for each QOLCE subscale (N ¼ 71)
Subscale At least one item missing
Physical restrictions 13
Energy/fatigue 2
Attention/concentration 11
Memory 21
Language 19
Other cognitive 3
Depression 14
Anxiety 14
Control/helplessness 15
Self-esteem 15
Social interactions 9
Social activities 5
Stigma 6
Behaviour 20
General health rating 0
Quality of life rating 1
686 M. Sabaz et al. / Epilepsy & Behavior 4 (2003) 680–691
Fifty-two percent of the children were female. The
average age of the children at the time of the quality of
life assessment was 12.24 (SD¼ 4.50). The average age
of epilepsy onset was 2.52 (SD¼ 2.59) and the mean age
of epilepsy surgery was 7.92 (SD¼ 4.24). Time since
surgery ranged from 11 to 155 months (mean¼ 51.54,
SD¼ 34.39). The duration of seizure freedom since
surgery ranged from 0 to 129 months (SD¼ 30.59,SD¼ 31.94). For 37 children seizures occurred on a
daily basis preoperatively, 7 had seizures weekly, and 2
were experiencing seizures monthly. Nineteen children
had a mild intellectual impairment. Statistically signifi-
cant correlations were observed between QOLCE scale
scores and clinical variables (age, age of epilepsy onset,
age of epilepsy surgery, duration since surgery, duration
of seizure freedom). However, upon examination ofscatterplots only the relationship between age and the
energy/fatigue QOLCE subscale score was bivariately
linear in nature (r ¼ �0:40; P < 0:01). The other rela-
tionships were not bivariately linear and/or were unduly
influenced by outliers. Neither preoperative seizure
frequency nor absence/presence of mild intellectual
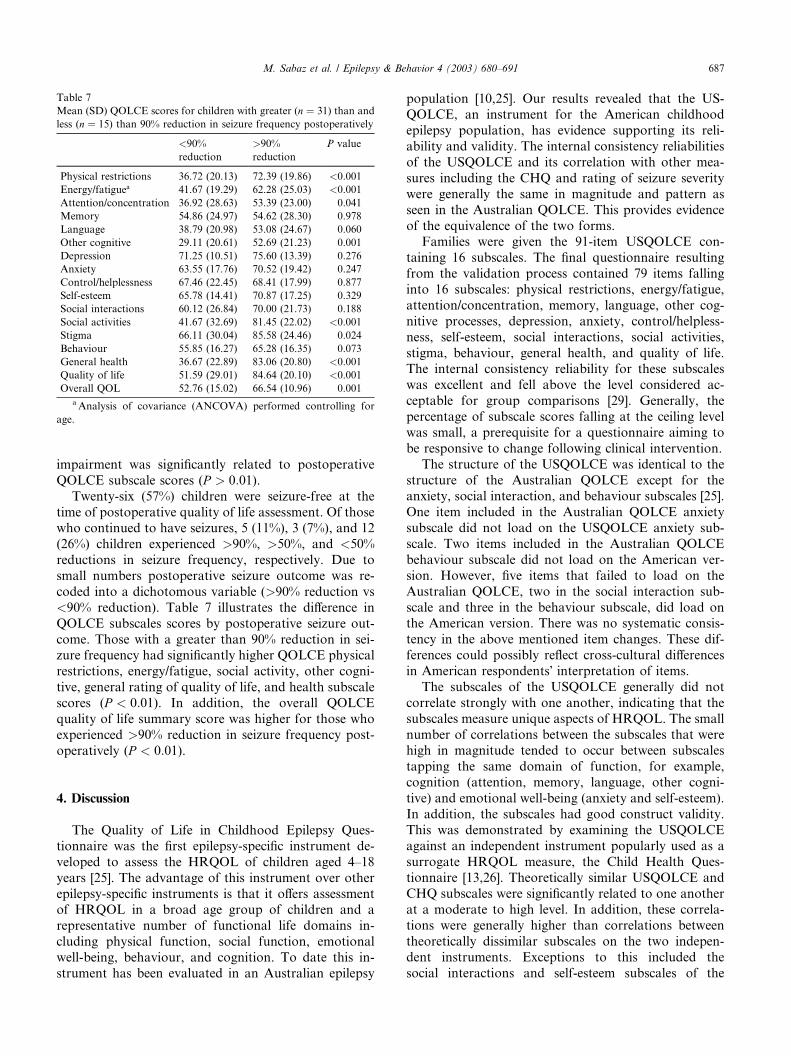
Table 7
Mean (SD) QOLCE scores for children with greater (n ¼ 31) than and
less (n ¼ 15) than 90% reduction in seizure frequency postoperatively
<90%
reduction
>90%
reduction
P value
Physical restrictions 36.72 (20.13) 72.39 (19.86) <0.001
Energy/fatiguea 41.67 (19.29) 62.28 (25.03) <0.001
Attention/concentration 36.92 (28.63) 53.39 (23.00) 0.041
Memory 54.86 (24.97) 54.62 (28.30) 0.978
Language 38.79 (20.98) 53.08 (24.67) 0.060
Other cognitive 29.11 (20.61) 52.69 (21.23) 0.001
Depression 71.25 (10.51) 75.60 (13.39) 0.276
Anxiety 63.55 (17.76) 70.52 (19.42) 0.247
Control/helplessness 67.46 (22.45) 68.41 (17.99) 0.877
Self-esteem 65.78 (14.41) 70.87 (17.25) 0.329
Social interactions 60.12 (26.84) 70.00 (21.73) 0.188
Social activities 41.67 (32.69) 81.45 (22.02) <0.001
Stigma 66.11 (30.04) 85.58 (24.46) 0.024
Behaviour 55.85 (16.27) 65.28 (16.35) 0.073
General health 36.67 (22.89) 83.06 (20.80) <0.001
Quality of life 51.59 (29.01) 84.64 (20.10) <0.001
Overall QOL 52.76 (15.02) 66.54 (10.96) 0.001
aAnalysis of covariance (ANCOVA) performed controlling for
age.
M. Sabaz et al. / Epilepsy & Behavior 4 (2003) 680–691 687
impairment was significantly related to postoperative
QOLCE subscale scores (P > 0:01).Twenty-six (57%) children were seizure-free at the
time of postoperative quality of life assessment. Of thosewho continued to have seizures, 5 (11%), 3 (7%), and 12
(26%) children experienced >90%, >50%, and <50%
reductions in seizure frequency, respectively. Due to
small numbers postoperative seizure outcome was re-
coded into a dichotomous variable (>90% reduction vs
<90% reduction). Table 7 illustrates the difference in
QOLCE subscales scores by postoperative seizure out-
come. Those with a greater than 90% reduction in sei-zure frequency had significantly higher QOLCE physical
restrictions, energy/fatigue, social activity, other cogni-
tive, general rating of quality of life, and health subscale
scores (P < 0:01). In addition, the overall QOLCE
quality of life summary score was higher for those who
experienced >90% reduction in seizure frequency post-
operatively (P < 0:01).
4. Discussion
The Quality of Life in Childhood Epilepsy Ques-
tionnaire was the first epilepsy-specific instrument de-
veloped to assess the HRQOL of children aged 4–18
years [25]. The advantage of this instrument over other
epilepsy-specific instruments is that it offers assessmentof HRQOL in a broad age group of children and a
representative number of functional life domains in-
cluding physical function, social function, emotional
well-being, behaviour, and cognition. To date this in-
strument has been evaluated in an Australian epilepsy
population [10,25]. Our results revealed that the US-QOLCE, an instrument for the American childhood
epilepsy population, has evidence supporting its reli-
ability and validity. The internal consistency reliabilities
of the USQOLCE and its correlation with other mea-
sures including the CHQ and rating of seizure severity
were generally the same in magnitude and pattern as
seen in the Australian QOLCE. This provides evidence
of the equivalence of the two forms.Families were given the 91-item USQOLCE con-
taining 16 subscales. The final questionnaire resulting
from the validation process contained 79 items falling
into 16 subscales: physical restrictions, energy/fatigue,
attention/concentration, memory, language, other cog-
nitive processes, depression, anxiety, control/helpless-
ness, self-esteem, social interactions, social activities,
stigma, behaviour, general health, and quality of life.The internal consistency reliability for these subscales
was excellent and fell above the level considered ac-
ceptable for group comparisons [29]. Generally, the
percentage of subscale scores falling at the ceiling level
was small, a prerequisite for a questionnaire aiming to
be responsive to change following clinical intervention.
The structure of the USQOLCE was identical to the
structure of the Australian QOLCE except for theanxiety, social interaction, and behaviour subscales [25].
One item included in the Australian QOLCE anxiety
subscale did not load on the USQOLCE anxiety sub-
scale. Two items included in the Australian QOLCE
behaviour subscale did not load on the American ver-
sion. However, five items that failed to load on the
Australian QOLCE, two in the social interaction sub-
scale and three in the behaviour subscale, did load onthe American version. There was no systematic consis-
tency in the above mentioned item changes. These dif-
ferences could possibly reflect cross-cultural differences
in American respondents� interpretation of items.
The subscales of the USQOLCE generally did not
correlate strongly with one another, indicating that the
subscales measure unique aspects of HRQOL. The small
number of correlations between the subscales that werehigh in magnitude tended to occur between subscales
tapping the same domain of function, for example,
cognition (attention, memory, language, other cogni-
tive) and emotional well-being (anxiety and self-esteem).
In addition, the subscales had good construct validity.
This was demonstrated by examining the USQOLCE
against an independent instrument popularly used as a
surrogate HRQOL measure, the Child Health Ques-tionnaire [13,26]. Theoretically similar USQOLCE and
CHQ subscales were significantly related to one another
at a moderate to high level. In addition, these correla-
tions were generally higher than correlations between
theoretically dissimilar subscales on the two indepen-
dent instruments. Exceptions to this included the
social interactions and self-esteem subscales of the

688 M. Sabaz et al. / Epilepsy & Behavior 4 (2003) 680–691
USQOLCE, which correlated higher with theoreticallydissimilar CHQ subscales than with theoretically similar
CHQ subscales.
In the Australian validation study the QOLCE sub-
scales were shown to be sensitive to seizure severity.
However, this was demonstrated without controlling for
the effect of socioeconomic factors. Devinsky et al. [19]
showed that lower socioeconomic status in children with
epilepsy was a risk factor for poor overall HRQOL. Weshowed that estimated family income, but not level of
parental education or family status (single/dual parent),
was related to HRQOL. In addition, we confirmed re-
sults from a previous investigation [10] showing that age
of epilepsy onset and IQ also impact on HRQOL. In-
patients were also shown to have poorer HRQOL
compared with outpatients, most likely because of the
acuteness of their condition. After controlling for theeffects of these variables and the number of AEDs taken,
11 of the 16 USQOLCE scores correlated with seizure
severity at a moderate to high degree. It is possible that
this significant relationship was a product of lack of
independence between these measures (i.e., parents rated
both their child�s seizure severity and quality of life).
However, by retrospectively identifying families with
children who had undergone epilepsy surgery, this studywas able to evaluate the sensitivity of the USQOLCE to
an independent measure of seizure burden (postopera-
tive seizure frequency). Children with a greater than
90% reduction in their seizure frequency had higher
scores on all QOLCE subscales, reaching statistical
significance on seven, and the overall QOLCE quality of
life score compared with children with less than 90%
reduction in seizure frequency. This study is consistentwith longitudinal investigations demonstrating that re-
duction in seizure frequency postoperatively improved
quality of life [30–34].
The acceptability of the QOLCE was tested by ex-
amining the number of respondents whose subscale
scores could not be calculated because of the return of
incomplete questionnaires. Depending on the subscale,
zero to 28% of families provided insufficient data tocalculate scores. In addition, a relationship was found
between age and missing data. The presence of missing
data was associated with younger children with epilepsy.
However, this relationship held true only for the atten-
tion, memory, and language QOLCE subscales, those
subscales assessing the cognitive domain of function.
This result indicates that caution is needed when using
the QOLCE to assess cognitive problems in the youngerage groups. Others have found less agreement between
proxy, parental, and child ratings of psychological do-
mains of quality of life, like cognition, compared with
more observable domains, like physical functioning [35].
Together these findings indicate that parents may find it
more difficult to make ratings about cognition in youn-
ger offspring. We recommend that the cognitive subscale
scores not be interpreted for children below 6 years ofage. The USQOLCE overall quality-of-life score can still
be calculated for 4- and 5-year-old children by averaging
across the remaining USQOLCE subscales. However,
this total score can be meaningfully interpreted only with
reference to another comparative 4- and 5-year-old age
group. Furthermore, the issue of how to deal with
missing data is rarely mentioned in the quality-of-life
literature. The ILAE subcommittee on outcome mea-surement recommends checking all questionnaires as
soon as they are handed back by respondents to ensure
the completeness of data collected [30]. When this does
not occur or when anonymity needs to be ensured, then
we consider it reasonable to calculate scores on the basis
of the remaining items if they are of a sufficient number
and if the scales have high levels of internal consistency
reliability. The CHQ requires that at least 50% of itemsbe rated for the calculation of CHQ subscale scores [26].
The Spearman–Brown prophecy formula [29] can be
used to estimate the maximum amount of missing data
before the internal consistency reliabilities of the US-
QOLCE subscales become unacceptable. Given that the
lowest level of internal consistency reliability for the
USQOLCE is 0.8, approximately 60% of items need to be
rated so that internal consistency reliabilities do not fallbelow 0.7. If this 60% criterion were applied in the cur-
rent study, then the amount of missing data for each
subscale would be significantly reduced.
A recent report published by the ILAE subcommittee
on outcome measurement outlined criteria to establish
the validity of quality-of-life instruments [30]. The
strength of the current study is that the QOLCE dem-
onstrates high levels of internal consistency reliabilityand content-, construct-, and criterion-related validity,
criteria listed in the ILAE subcommittee report. How-
ever, there are important weaknesses of the current
study. Firstly, the stability of individuals� QOLCE
scores over time, when no change would be expected
(i.e., test–retest reliability), has yet to be established.
Test–retest reliability is important to establish because
individual scores that change indiscriminately overtime cannot be valid measures of a construct. Second,
we have yet to demonstrate the responsiveness of
the QOLCE in a prospective, well-controlled study. We
currently continue to collect data for a prospective
surgical study with a matched control group to deter-
mine changes in quality of life postoperatively control-
ling for preoperative quality-of-life ratings. This future
study will also assess the test–retest reliability of theQOLCE subscales and overall QOLCE quality-of-life
score. Lastly, it is well recognised that older children and
adolescents are capable of making judgments about
their own quality of life [35]. It must be remembered that
the QOLCE is a parent-rated instrument that provides
additional insights into a child�s well-being but does not
substitute for a child�s self-evaluation.
M. Sabaz et al. / Epilepsy & Behavior 4 (2003) 680–691 689
Acknowledgments
This research was supported by the National Health
and Medical Research Council (NHMRC) and the
Movement Disorder Foundation. Dr. Lawson was
supported by the Bushell Travelling Fellowship from the
Royal Australasian College of Physicians.
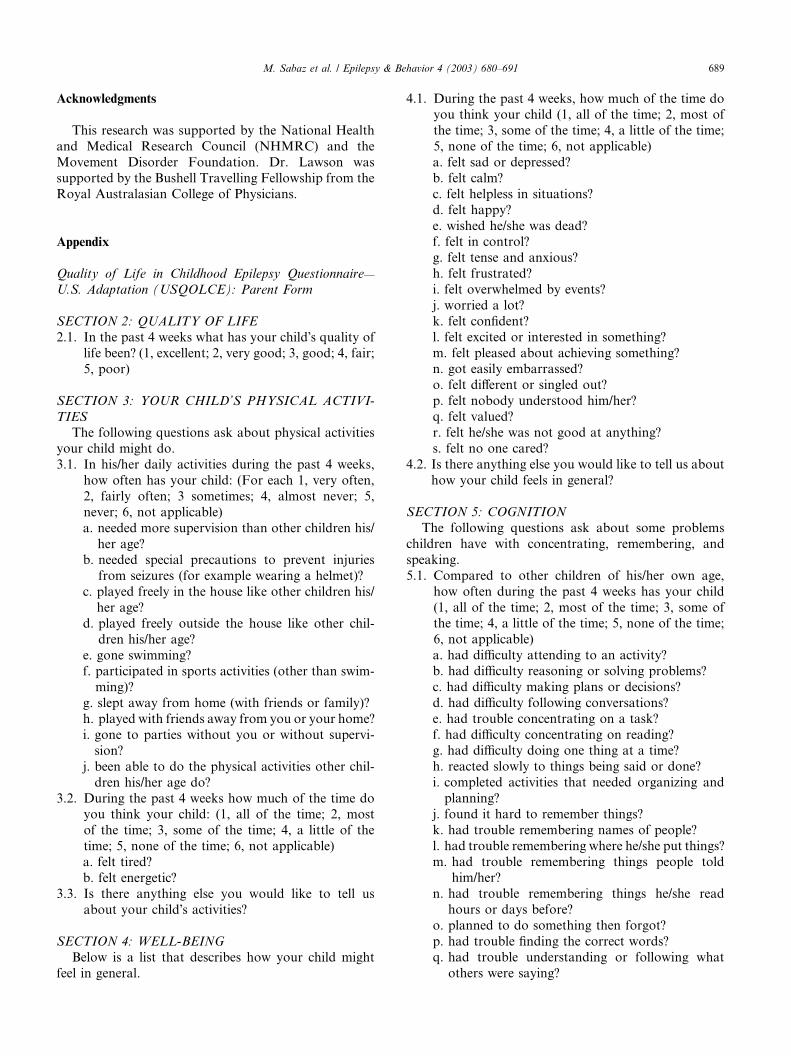
Appendix
Quality of Life in Childhood Epilepsy Questionnaire—
U.S. Adaptation (USQOLCE): Parent Form
SECTION 2: QUALITY OF LIFE
2.1. In the past 4 weeks what has your child�s quality of
life been? (1, excellent; 2, very good; 3, good; 4, fair;
5, poor)
SECTION 3: YOUR CHILD’S PHYSICAL ACTIVI-
TIES
The following questions ask about physical activities
your child might do.
3.1. In his/her daily activities during the past 4 weeks,
how often has your child: (For each 1, very often,
2, fairly often; 3 sometimes; 4, almost never; 5,
never; 6, not applicable)
a. needed more supervision than other children his/
her age?b. needed special precautions to prevent injuries
from seizures (for example wearing a helmet)?
c. played freely in the house like other children his/
her age?
d. played freely outside the house like other chil-
dren his/her age?
e. gone swimming?
f. participated in sports activities (other than swim-ming)?
g. slept away from home (with friends or family)?
h. played with friends away from you or your home?
i. gone to parties without you or without supervi-
sion?
j. been able to do the physical activities other chil-
dren his/her age do?
3.2. During the past 4 weeks how much of the time doyou think your child: (1, all of the time; 2, most
of the time; 3, some of the time; 4, a little of the
time; 5, none of the time; 6, not applicable)
a. felt tired?
b. felt energetic?
3.3. Is there anything else you would like to tell us
about your child�s activities?
SECTION 4: WELL-BEING
Below is a list that describes how your child might
feel in general.
4.1. During the past 4 weeks, how much of the time doyou think your child (1, all of the time; 2, most of
the time; 3, some of the time; 4, a little of the time;
5, none of the time; 6, not applicable)
a. felt sad or depressed?
b. felt calm?
c. felt helpless in situations?
d. felt happy?
e. wished he/she was dead?f. felt in control?
g. felt tense and anxious?
h. felt frustrated?
i. felt overwhelmed by events?
j. worried a lot?
k. felt confident?
l. felt excited or interested in something?
m. felt pleased about achieving something?n. got easily embarrassed?
o. felt different or singled out?
p. felt nobody understood him/her?
q. felt valued?
r. felt he/she was not good at anything?
s. felt no one cared?
4.2. Is there anything else you would like to tell us about
how your child feels in general?
SECTION 5: COGNITION
The following questions ask about some problems
children have with concentrating, remembering, and
speaking.
5.1. Compared to other children of his/her own age,
how often during the past 4 weeks has your child
(1, all of the time; 2, most of the time; 3, some ofthe time; 4, a little of the time; 5, none of the time;
6, not applicable)
a. had difficulty attending to an activity?
b. had difficulty reasoning or solving problems?
c. had difficulty making plans or decisions?
d. had difficulty following conversations?
e. had trouble concentrating on a task?
f. had difficulty concentrating on reading?g. had difficulty doing one thing at a time?
h. reacted slowly to things being said or done?
i. completed activities that needed organizing and
planning?
j. found it hard to remember things?
k. had trouble remembering names of people?
l. had trouble remembering where he/she put things?
m. had trouble remembering things people toldhim/her?
n. had trouble remembering things he/she read
hours or days before?
o. planned to do something then forgot?
p. had trouble finding the correct words?
q. had trouble understanding or following what
others were saying?
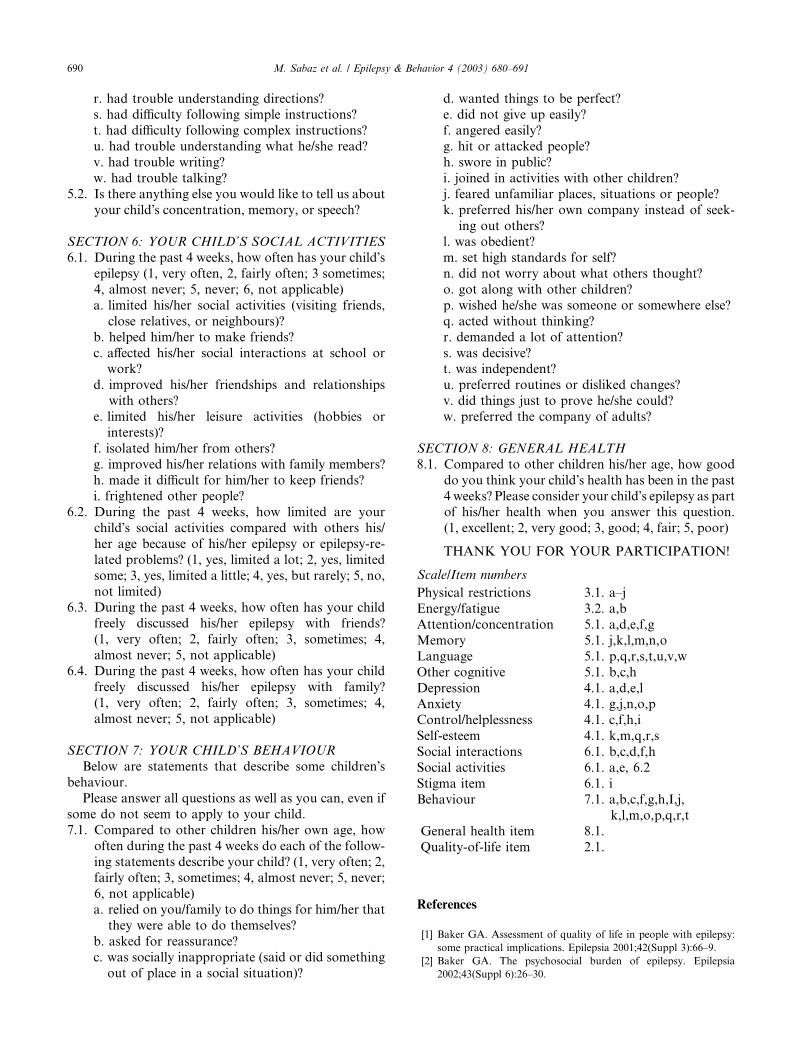
690 M. Sabaz et al. / Epilepsy & Behavior 4 (2003) 680–691
r. had trouble understanding directions?s. had difficulty following simple instructions?
t. had difficulty following complex instructions?
u. had trouble understanding what he/she read?
v. had trouble writing?
w. had trouble talking?
5.2. Is there anything else you would like to tell us about
your child�s concentration, memory, or speech?
SECTION 6: YOUR CHILD’S SOCIAL ACTIVITIES
6.1. During the past 4 weeks, how often has your child�sepilepsy (1, very often, 2, fairly often; 3 sometimes;
4, almost never; 5, never; 6, not applicable)
a. limited his/her social activities (visiting friends,
close relatives, or neighbours)?
b. helped him/her to make friends?
c. affected his/her social interactions at school orwork?
d. improved his/her friendships and relationships
with others?
e. limited his/her leisure activities (hobbies or
interests)?
f. isolated him/her from others?
g. improved his/her relations with family members?
h. made it difficult for him/her to keep friends?i. frightened other people?
6.2. During the past 4 weeks, how limited are your
child�s social activities compared with others his/
her age because of his/her epilepsy or epilepsy-re-
lated problems? (1, yes, limited a lot; 2, yes, limited
some; 3, yes, limited a little; 4, yes, but rarely; 5, no,
not limited)
6.3. During the past 4 weeks, how often has your childfreely discussed his/her epilepsy with friends?
(1, very often; 2, fairly often; 3, sometimes; 4,
almost never; 5, not applicable)
6.4. During the past 4 weeks, how often has your child
freely discussed his/her epilepsy with family?
(1, very often; 2, fairly often; 3, sometimes; 4,
almost never; 5, not applicable)
SECTION 7: YOUR CHILD’S BEHAVIOUR
Below are statements that describe some children�sbehaviour.
Please answer all questions as well as you can, even if
some do not seem to apply to your child.
7.1. Compared to other children his/her own age, how
often during the past 4 weeks do each of the follow-
ing statements describe your child? (1, very often; 2,fairly often; 3, sometimes; 4, almost never; 5, never;
6, not applicable)
a. relied on you/family to do things for him/her that
they were able to do themselves?
b. asked for reassurance?
c. was socially inappropriate (said or did something
out of place in a social situation)?
d. wanted things to be perfect?e. did not give up easily?
f. angered easily?
g. hit or attacked people?
h. swore in public?
i. joined in activities with other children?
j. feared unfamiliar places, situations or people?
k. preferred his/her own company instead of seek-
ing out others?l. was obedient?
m. set high standards for self?
n. did not worry about what others thought?
o. got along with other children?
p. wished he/she was someone or somewhere else?
q. acted without thinking?
r. demanded a lot of attention?
s. was decisive?t. was independent?
u. preferred routines or disliked changes?
v. did things just to prove he/she could?
w. preferred the company of adults?
SECTION 8: GENERAL HEALTH
8.1. Compared to other children his/her age, how good
do you think your child�s health has been in the past
4 weeks? Please consider your child�s epilepsy as partof his/her health when you answer this question.
(1, excellent; 2, very good; 3, good; 4, fair; 5, poor)
THANK YOU FOR YOUR PARTICIPATION!
Scale/Item numbers
Physical restrictions
3.1. a–jEnergy/fatigue
3.2. a,bAttention/concentration
5.1. a,d,e,f,gMemory
5.1. j,k,l,m,n,oLanguage
5.1. p,q,r,s,t,u,v,wOther cognitive
5.1. b,c,hDepression
4.1. a,d,e,l Anxiety 4.1. g,j,n,o,pControl/helplessness
4.1. c,f,h,iSelf-esteem
4.1. k,m,q,r,sSocial interactions
6.1. b,c,d,f,hSocial activities
6.1. a,e, 6.2Stigma item
6.1. iBehaviour
7.1. a,b,c,f,g,h,I,j,k,l,m,o,p,q,r,t
General health item 8.1.Quality-of-life item
2.1.References
[1] Baker GA. Assessment of quality of life in people with epilepsy:
some practical implications. Epilepsia 2001;42(Suppl 3):66–9.
[2] Baker GA. The psychosocial burden of epilepsy. Epilepsia
2002;43(Suppl 6):26–30.
M. Sabaz et al. / Epilepsy & Behavior 4 (2003) 680–691 691
[3] Collings JA. Epilepsy and well-being. Social Sci Med 1990;31:
165–70.
[4] Dunn DW, Austin JK, Huster GA. Behavioural problems in
children with new-onset epilepsy. Seizure 1997;6:283–7.
[5] Dunn DW, Austin JK, Huster GA. Symptoms of depression in
adolescents with epilepsy. J Am Acad Child Adolesc Psychiatry
1999;38:1132–8.
[6] Hermann BP. Quality of life in epilepsy. J Epilepsy 1992;5:153–65.
[7] Jacoby A. Impact of epilepsy on employment status: findings from
a study of people with well-controlled epilepsy. Epilepsy Res
1995;21:125–32.
[8] Jacoby A, Baker G, Steen N, Potts P, Chadwick D. The clinical
course of epilepsy and its psychosocial correlates. Epilepsia
1996;37:148–61.
[9] Perrine K, Hermann BP, Meador KJ. The relationship of
neuropsychological functioning to quality of life in epilepsy. Arch
Neurol 1995;52:997–1003.
[10] Sabaz M, Cairns DR, Lawson JA, Bleasel AF, Bye AME. The
health-related quality of life of children with refractory epilepsy: a
comparison of those with and without intellectual disability.
Epilepsia 2001;42:621–8.
[11] Wilson SJ, Saling MM, Lawrence J, Bladin PF. Outcome of
temporal lobectomy: expectations and the prediction of perceived
success. Epilepsy Res 1999;36:1–14.
[12] Austin JK, Huster GA, Dunn DW, Risinger MW. Adolescents
with active or inactive epilepsy or asthma: a comparison of quality
of life. Epilepsia 1996;37:1228–38.
[13] Gilliam F, Wyllie E, Kashden J, et al. Epilepsy surgery outcome:
comprehensive assessment in children. Neurology 1997;48:1368–
74.
[14] Lewis JN, Tonge BJ, Mowat DR, Einfeld SL, Siddons HM,
Rees VW. Epilepsy and associated psychopathology in young
people with intellectual disability. J Paediatr Child Health
2000;36:172–5.
[15] Birbeck GL, Kim S, Hays RD, Vickrey BG. Quality of life
measures in epilepsy: how well can they detect change over time.
Neurology 2000;54:1822–7.
[16] Carpay HA, Vermeulen J, Stroink H, et al. Disability due to
restrictions in childhood epilepsy. Dev Med Child Neurol
1997;39:521–6.
[17] Camfield C, Breau L, Camfield P. Impact of pediatric epilepsy on
the family: a new scale for clinical and research use. Epilepsia
2001;42:104–12.
[18] Cramer JA, Westbrook LE, Devinsky O, Perrine K, Glassman
MB, Camfield C. Development of the quality of life in epilepsy
inventory for adolescents: the QOLIE-AD-48. Epilepsia 1999;40:
1114–21.
[19] Devinsky O, Westbrook L, Cramer J, Glassman M, Perrine K,
Camfield C. Risk factors for poor health-related quality of life in
adolescents with epilepsy. Epilepsia 1999;40:1715–20.
[20] Ronen GM, Rosenbaum P, Law M, Streiner DL. Health-related
quality of life in childhood epilepsy: the results of children�sparticipation in identifying the components. Dev Med Child
Neurol 1999;41:554–9.
[21] Sabaz M, Cairns DR, Bleasel AF, et al. The health-related quality
of life (HRQoL) profile of different childhood epilepsy syndromes.
J Paediatr Child Health, in press.
[22] French DJ, Carroll A, Christie MJ. Health-related quality of life
in Australian children with asthma: lessons for the cross-cultural
use of quality of life instruments. Qual Life Res 1998;7:409–19.
[23] Guillemin F, Bombardier C, Beaton D. Cross-cultural adaptation
of health-related quality of life measures: literature review and
proposed guidelines. J Clin Epidemiol 1993;46:1417–32.
[24] Orley J, Kuyken W. Quality of life assessment: international
perspectives. Berlin: Springer-Verlag; 1994.
[25] Sabaz M, Cairns DR, Lawson JA, Nheu N, Bleasel AF, Bye
AME. Validation of a new quality of life measure for children
with epilepsy. Epilepsia 2000;41:765–74.
[26] Landgraf JM, Abetz L, Ware JE. Child Health Questionnaire
(CHQ): a user�s manual. New England Medical Center, Boston:
The Health Institute; 1996.
[27] Engel Jr J, VanNessPC,RasmussenTB, et al.Outcomewith respect
to epileptic seizures. In: Engel Jr J, editor. Surgical treatment of the
epilepsies. 2nd ed. New York: Raven Press; 1993. p. 609–21.
[28] Bryman A, Cramer D. Quantitative data analysis with SPSS
Release 10 for Windows. London: Routledge; 2001.
[29] Nunnally J. Psychometric theory. 3rd ed. New York: McGraw-
Hill; 1994.
[30] Cramer JA. Principles of health-related quality of life: assessment
in clinical trials. Epilepsia 2002;43:1084–95.
[31] Kellett MW, Smith DF, Baker GA, Chadwick DW. Quality of life
after epilepsy surgery. J Neurol Neurosurg Psychiatry 1997;63:
52–8.
[32] Rose KJ, Derry PA, Wiebe S, McLachlan RS. Determinants of
health-related quality of life after temporal lobe epilepsy surgery.
Qual Life Res 1996;5:395–402.
[33] Lendt M, Helmstaedter C, Kuczaty S, Schramm J, Elger CE.
Behavioural disorders in children with epilepsy: early improvement
after surgery. J Neurol Neurosurg Psychiatry 2000;69:739–44.
[34] Selai CE, Elstner K, Trimble MR. Quality of life pre and post
epilepsy surgery. Epilepsy Res 2000;38:67–74.
[35] Eiser C, Morse R. Can parents rate their child�s health-related
quality of life? Results of a systematic review. Qual Life Res
2001;10:347–57.