validation and comparison of different techniques for the derivation
TRANSCRIPT
International Journal of Remote Sensing, vol.23, issue 22, pp. 4783-4800
Validation and comparison of different techniques for the derivation of digital elevation models and volcanic monitoring (Vulcano island, Italy) P. Baldi a , S. Bonvalot b,c, P. Briole c, M. Coltelli d, K. Gwinner e, M. Marsella f,, G. Puglisi d, D. Rémy b
a Dipartimento di Fisica, Università di Bologna, V.le B. Pichat 8, 40127 Bologna, Italy, tel.+39-051-2095011, Fax.:+39-051-2095058, E-mail: [email protected] b IRD, Laboratoire de Géophysique, 32 avenue H. Varagnat, 93143 Bondy, France c CNRS-UMR7580, Dpt. de Sismologie, Institut de Physique du Globe de Paris, 4 place Jussieu, 75005 Paris, France, Tel. +33-01-44277342, Fax. +33-01-44277340, E-mail: [email protected] d C.N.R. - International Institute of Volcanology (IIV), Piazza Roma 2, 95123 Catania, Italy, Tel. +39-095-448084, Fax. +39-095-435801, E-mail: [email protected] e DLR, Institute of Space Sensor Technology and Planetary Exploration, Rutherford str. 2, 12489 Berlin, Germany, E-mail: [email protected] f DITS, Università di Roma "La Sapienza", Via Eudossiana 18, 00184 Roma, Italy, Tel. +39-0644585098, Fax: +39-06-44585515, E-mail: [email protected]
Abstract
High accurate Digital Elevation Models (DEM) acquired periodically over volcanic area can be used for monitoring crustal deformations. Airborne stereoscopic photography is a powerful tool to derive high resolution DEM, especially when combined with Global Positioning System (GPS). We analyze data acquired on Vulcano Island (Italy) to assess the performance of two photogrammetry methods for DEM generation. The first method is based on automatic digital processing of scanned airborne stereo images from a film camera (Wild RC20). In the second method digital stereo data from the multi-spectral High Resolution Stereo Camera – Airborne (HRSC-A) are used. Accuracy assessment through comparison with kinematic GPS height profiles shows that both DEMs have accuracy on the order of few decimeters. Direct comparison of the two DEMs on the La Fossa volcanic cone provides a standard deviation of the residuals of 78 cm. Residuals greater than 2 meters between the two DEMs acquired at one year interval are locally evidenced in unstable areas with uneven morphology. The application of photogrammetric DEMs is also discussed within a SAR interferometry study carried out on Vulcano Island to evaluate the potentialities of such techniques for ground deformation monitoring. Although accuracy better than 1 or 2m is not required for satellite SAR interferometry, we show how the precise photogrammetric DEMs improves significantly SAR interferograms of Vulcano Island.
Keywords: Remote Sensing, Digital Elevation Model, GPS, Photogrammetry, SAR Interferometry, Volcanic areas
1. INTRODUCTION
Until a few years ago, deformation studies on seismic and volcanic areas were based on geodetic techniques such as spirit leveling, electronic distance measurements (EDM), Global Positioning System (GPS) and on continuous monitoring of sensors like tiltmeters and strainmeters. In a given active area, these various methods allow sampling the deformation field at only a few ten to a few hundred points, and local or complex deformation fields could not be accurately observed nor modeled.
Remote sensing, by its nature, represents an advantageous method to observe dangerous and inaccessible areas such as volcanoes in safety. The progress of this technique in the last decade allows using it as a tool for ground deformation studies of seismic and volcanic areas. In the early nineties, the technique of Interferometry on satellite SAR images made remote sensing method popular for the study of ground deformations. However, this very powerful technique is presently limited by the periodicity of the passes over a given area (35 days in the case of ERS satellites) and by the pixel size (20 m at best), both often inadequate for detailed studies on the summit area of most volcanoes. Nevertheless, optical
observations made from low altitude airborne platforms as well as the future generation of civil high resolution satellites could still significantly improved ground deformation studies and monitoring on several active volcanoes and seismic areas.
2. TECHNIQUES AND TEST SITE
Recent progress in digital photogrammetry
Recent technological advances in photogrammetry have made possible to process high resolution aerial and satellite imagery in a digital format. Airborne images may be acquired by means of film cameras and further digitized using high-resolution scanners. It is also possible now to acquire airborne stereo imagery directly in digital cameras. Accurate referencing of images is performed using differential GPS positioning during data acquisition. With respect to the situation one decade ago (dominated by analog images analysis), photogrammetry as a whole is thus being revolutionized by those new digital data and the associated development of numerical tools like 'Softcopy Photogrammetry' or 'Digital Photogrammetry' (Heipke, 1995; Muller et al., 1995). The development of these digital recording techniques and data processing, allows a faster and higher resolution result delivery, at lower costs with respect
to the analytical approach (Heipke, 1995).
Many applications of digital photogrammetry concern mapping and monitoring projects and the research is particularly focused on the production of three-dimensional reconstruction of the surface in the form of digital elevation model (DEM). DEMs may be used to determine morphological characteristics such as slopes, volumes, or drainage patterns and integrated with multi-spectral remote sensing imagery for a large number of applications (geology, agriculture, urban planning, etc.). The comparison of DEMs relative to different epochs is potentially useful to detect and describe morphological changes on a three dimensional basis, such as ground deformations related to volcanic activity or determination of thickness of volcanic materials produced by new eruptions.
High Resolution Stereo Camera (HRSC)
The High Resolution Stereo Camera (HRSC, Neukum et al., 1995, Neukum 1999, Wewel et al. 2000) is one of the first digital stereo push-broom cameras for photogrammetric data acquisition. The application of stereo scanners for photogrammetric mapping is based on substantial technical developments of the last decades (Albertz, 1998), and the first cameras are now available also on a commercial base.
HRSC is a digital multiple stereo camera acquiring nine superimposed image swaths simultaneously (along-track) by geometrically calibrated CCD line sensors mounted in parallel and behind one single optics. Five of these are panchromatic sensors arranged at specific viewing angles and provide the stereo capabilities of the instrument, while the remaining CCD lines are covered with filters for the acquisition of multi-spectral images.
An airborne version of the camera, HRSC-A (Table. 1), has been developed at the DLR Institute of Space Sensor Technology and Planetary Exploration and has been operated in a wide range of Earth observation applications since 1997 (Neukum, 1999). It fulfils all radiometric and geometric requirements of a photogrammetric camera system and is equipped with an automated photogrammetric processing system (Wewel et al., 2000).
The exterior orientation of each image line is computed using Differential GPS and Inertial Navigation System (INS) data recorded continuously during flight navigation. Remaining unknowns (angular offsets between the INS and camera axes or boresight offsets) are estimated based on identical points derived from the different stereo channels and from overlapping image swaths. Therefore, when using an integrated GPS/INS navigation system including a GPS receiver and a strap-down INS (Hutton and Lithopoulos, 1998), with parallel image tracks no ground control point (GCP) information is needed. However, where possible, a small number of GCP as well as perpendicular image tracks are used to stabilize the results. When using a conventional INS-system instead, the boresight offsets as well as the IMU-gyro drift parameters are modeled by an iterative optimization of the ray intersection accuracy for some few control points.
Through automatic multiple-image matching sub-pixel coordinates for conjugate image points in each of the five stereo channels are determined (Wewel, 1996). Thus, object points can be derived by the intersection of up to five rays, defined by the set of corresponding image coordinates, together with the orientation and calibration data. This allows for estimating point accuracy and to use these estimates for the detection and elimination of blunders. Moreover, parallel projection in flight direction and the presence of a constantly nadir-looking stereo channel provide very favorable visibility conditions over steep terrain. The final products of the photogrammetric processing line are DEM derived from the set of object points and the combined multi-spectral orthoimages generated by differential rectification based on the DEM (Scholten, 1996; Wewel et al., 2000).
Use of kinematic GPS
Expected high resolution DEMs can be controlled through the results of kinematic GPS surveys. This technique consists in the simultaneous operation of a fix GPS station and a rover one (carried either on a vehicle or by a walking operator). The sampling rate is fixed as a low value (1 or 3 s instead of 30 s in static mode) enabling to sample a large number of points along track, typically 1 point per meter for an operator walking on a steep slopes. This sampling rate is comparable with the pixel size of the DEMs produced from airborne photogrammetry and allows a robust spatial coverage. The accuracy of the restitution of the elevation of the ground surface from kinematic GPS observations is on the order of a few centimeters when the antenna is carried by a car (Deplus et Briole, 1997) or by a walking operator (Baldi et al., 2000).
Importance of DEMs for SAR interferometry
Within the last few years, differential Synthetic Aperture Radar (SAR) interferometry has proved to be a useful tool to detect deformations in seismic or volcanic areas (Massonnet and Feigl, 1998). Processing of SAR data by the two-pass method as used in most commercial or scientific software, requires the use of a DEM to remove the topography contribution. DEM inaccuracies will produce "artifactual" fringes and a greater level of noise in the resulting interferograms. If the DEM accuracy is not required to be better than 1 to a few meters, it is still often difficult to get such relatively good DEM on most of the Earth surface. Trials to make DEM directly from SAR interferometry data indicated that the resulting resolution is about 10 m, that remains far above that achieved by aerial digital photogrammetry (Zebker et Rosen, 1997). Use of intermediate to high accuracy aerial photogrammetry DEM is thus important for SAR interferometry. This is particularly the case in coherent areas, when the noise of surface backscattering is low enough to detect one tenth of a fringe or better (for instance areas of recent lava flows on volcanoes). In such cases and when using interferograms of typical altitude of ambiguity of 50 m a DEM accuracy of 2 m is required to warrant the 1/10 of fringe resolution leading to ground deformation mapping with a sub-centimeter accuracy along the line of sight radar to ground.
The test site of La Fossa volcano, Vulcano Island (Italy)
With the aim to discuss the application of remote sensing (digital photogrammetry, SAR Interferometry) and GPS techniques to ground deformation for volcanic modeling, a test site on the Island of Vulcano located in the Aeolian Islands (Southern Tyrrhenian Sea, Italy) has been selected. In the northern part of this island is located the large La Fossa volcanic cone that last erupted in 1888-1890. Many evidences of persisting activity were recently observed on the crater of La Fossa cone, like variation of chemical composition of fumarole gases, low seismic activity and opening of new fractures (Frazzetta and La Volpe, 1991). Moreover, in April 1988 a quite large landslide moved from the eastern steep side of the cone to the sea (Tinti et al., 1999), making flank instability hazard of La Fossa cone a real problem. The deformation processes on the Island are systematically monitored using permanent ground sensors, like GPS and tiltmeters, repeated geodetic terrestrial surveys and microgravimetric measurements (Villari, 1994).
The presence of different morphological features and land coverages in a small region (very corrugated and fractured surfaces alternating with smooth ones, sudden changes of terrain slopes, highly vegetated, dry and urban areas) (figure 1), offers good possibilities for testing the effect of different terrain characteristics on the performance of remote sensing techniques. Though the experimented technologies cover a wide range of accuracy requirements from few centimeters to few meters, a comparison analysis has been attempted in order to assess limitations and advantages of the different methodologies.
3. DATA
Aerial film photogrammetry data (1996 survey)
In 1996 an aerial photogrammetric survey with a WILD RC20 film camera was carried out on Vulcano Island (Achilli et al., 1997). For this aerial survey differential GPS was used to determine aerial 3D coordinates of the camera positions at the instants of exposure (Baldi et al, 1998). This technique allowed to reduce the required ground control points, an important benefit on the volcano where a homogeneous ground target network was impossible to install (Achilli et al., 1998).
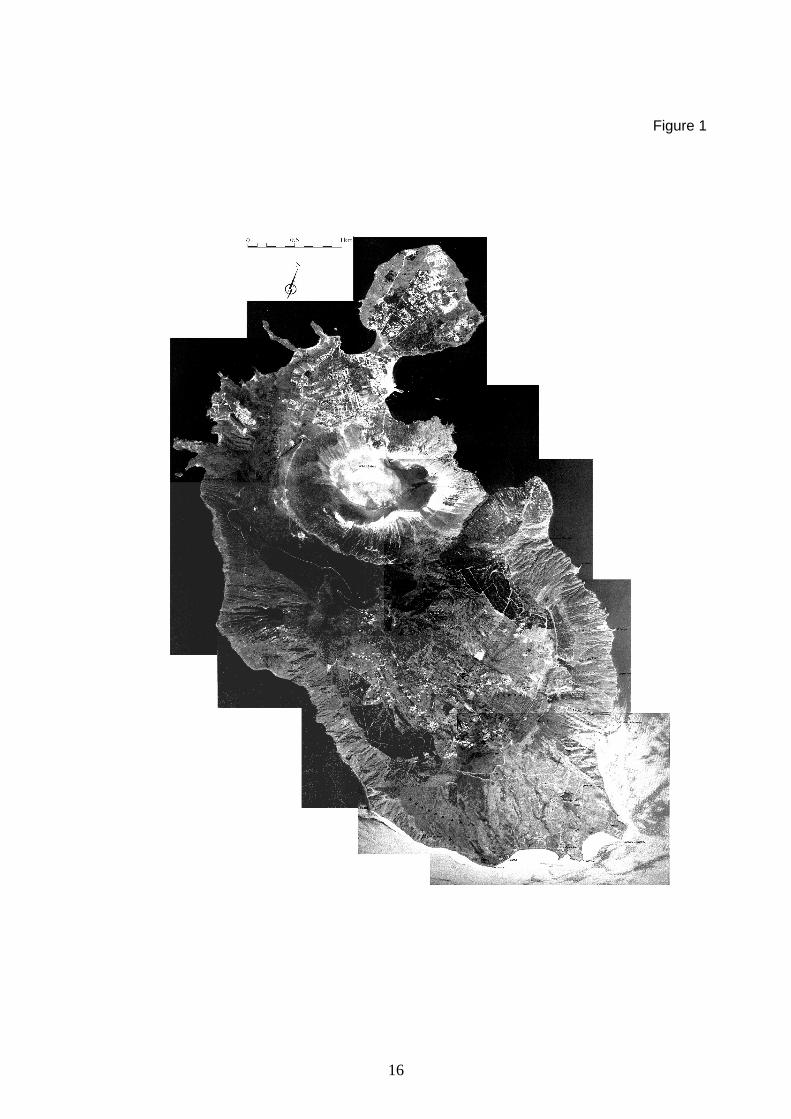
The stereo images, acquired at 1:5000 scale, were digitized at 1000 dpi resolution to obtain a pixel size on the ground of about 12 cm. Then, they were automatically processed with the Helava system (DPW710) (Muller et al., 1995). A 1-meter grid Digital Elevation Model (DPW_DEM_5000) was generated with a digital image matching procedure based on well-defined shape comparison techniques and gray level correspondence. In Figure 2a a shaded relief image of the derived DEM is shown. The internal accuracy of the elevations has been evaluated comparing two DEM derived by the processing of two stereo pairs obtained in different epochs (1993-1996), adopting the same automatic image correlation module. The differences between the two DEMs, estimated by the root mean square (r.m.s.) of
residuals, range from few centimeters in the smooth terrain around the summit of La Fossa cone to 5-15 centimeters in the more corrugated northern slopes of the cone. Larger differences (20-40 cm), probably due to real topography changes, appeared in the northeastern side of the crater, where a landslide has occurred in 1988 (Baldi et al., 2000).
HRSC data (1997 survey)
In one of the first airborne applications of HRSC-A (Gwinner et al., 1999), Vulcano Island was covered by 7 image tracks from a flight altitude of 5000 m. The corresponding ground pixel sizes (25 cm for the nadir channel, 50 cm for the stereo channels and 100 cm for the multi-spectral channels) are suitable for the production of topographic image maps at scale 1:5000 and larger (Gwinner et al., 2000). Orientation data have been measured by means of differential GPS and a conventional INS system. 2-3 GCP per image track have been measured with a portable GPS receiver. The INS data have been filtered with a phase correct FFT filter and a piecewise linear drift and offset correction based on the GCP and kinematic in-flight GPS data was applied.
Automatic image correlation has been performed on an 80-cm search grid for La Fossa cone and a 160-cm grid for the remaining parts of the island. A total of 32.4 million object points were used for DEM interpolation. In Figure 2b a shaded relief perspective view derived from the DEM is shown.
Kinematic GPS data (1997 survey)
A field GPS survey was carried out on Vulcano from 4 to 8 June 1997 with the aim to evaluate fast kinematic procedures for ground deformation studies and topography modeling. The differential GPS measurements were performed with full wavelength data using dual frequencies Ashtech Z12 receivers. During the survey, we acquired a series of kinematic profiles (without benchmarks) on La Fossa cone using three mobile receivers operating continuously at a frequency rate of 3 seconds. The measurements were acquired with antennas mounted on the operator’s backpacks in reference to a remote station located at the volcanological observatory (baseline lower than 4 km). A total of about 6000 GPS measurements at ground level were acquired around and on La Fossa cone. The internal accuracy of this kinematic dataset has been estimated from the analysis of crossover errors along the various GPS tracks. The resulting standard deviation of the differences in height determinations at almost 5000 intersection points of track lines is 4.3 cm (R.M.S. error). A complete description of the data acquisition and processing is given in Baldi et al. (2000).
Summary of the available data
A general overview of the main characteristics of the techniques adopted for data acquisition, the respective parameters chosen for the Vulcano Island campaigns, and the applications that can be supported is summarized in Table 2.
4. DEM validation and Comparison
Internal comparison between the two DEM
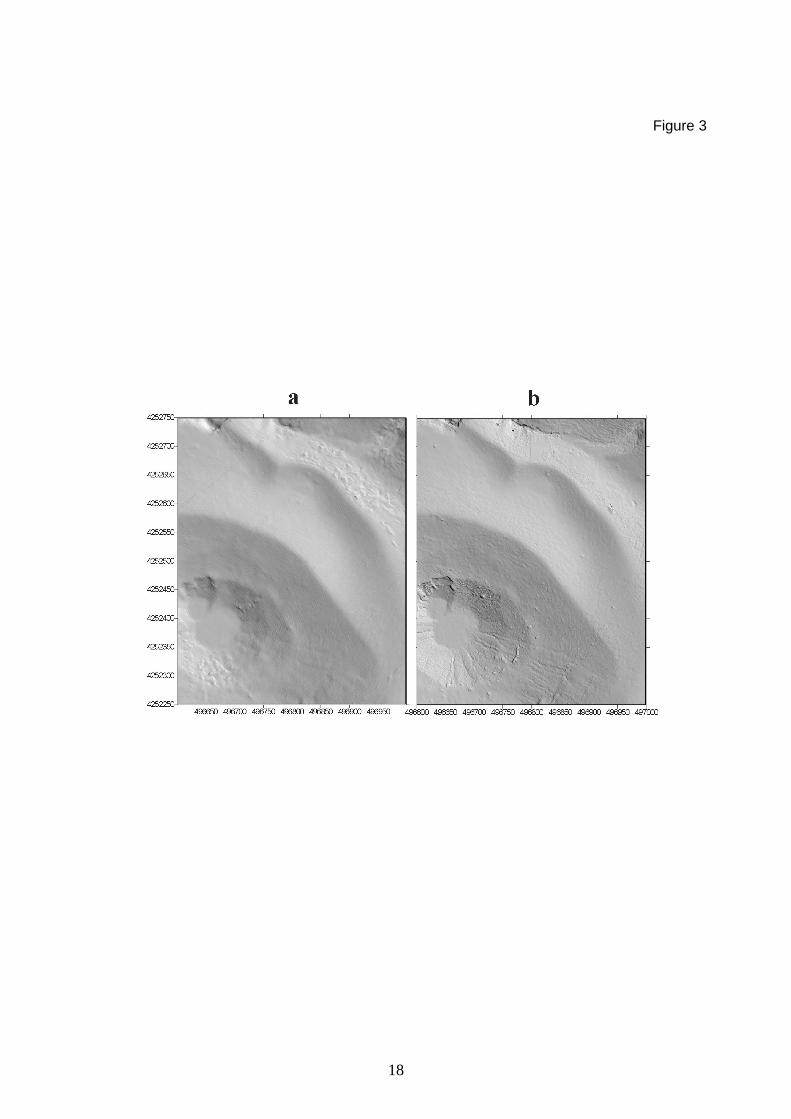
Initially a qualitative comparison was performed over a small area of about 0.2 km2 including the bottom and part of the rim of the La Fossa crater. Figure 3 represents a shaded relief image obtained under the same conditions starting from the two original DEM (1x1 m grid). Here the difference in the ground pixel resolution of the stereo images is evident since the HRSC-A DEM appears smoother than the photogrammetric one. As a matter of fact the mean HRSC-A ground resolution of the channels used for DEM generation is (4x50+25)/5=45 cm (50 cm for the stereo channels, 25 cm for the nadir channel). The ground pixels therefore are by a factor 3.6 larger than for the DPW_DEM.
In order to perform a quantitative comparison of different DEMs, the same reference system should be adopted. For this reason, a two-dimensional similarity transformation for the horizontal coordinates (in UTM mapping projection) has been applied; the translation parameters were estimated minimizing the standard deviation of the differences in the vertical component. This computation has been performed on a 5x5 meters interpolated grid.
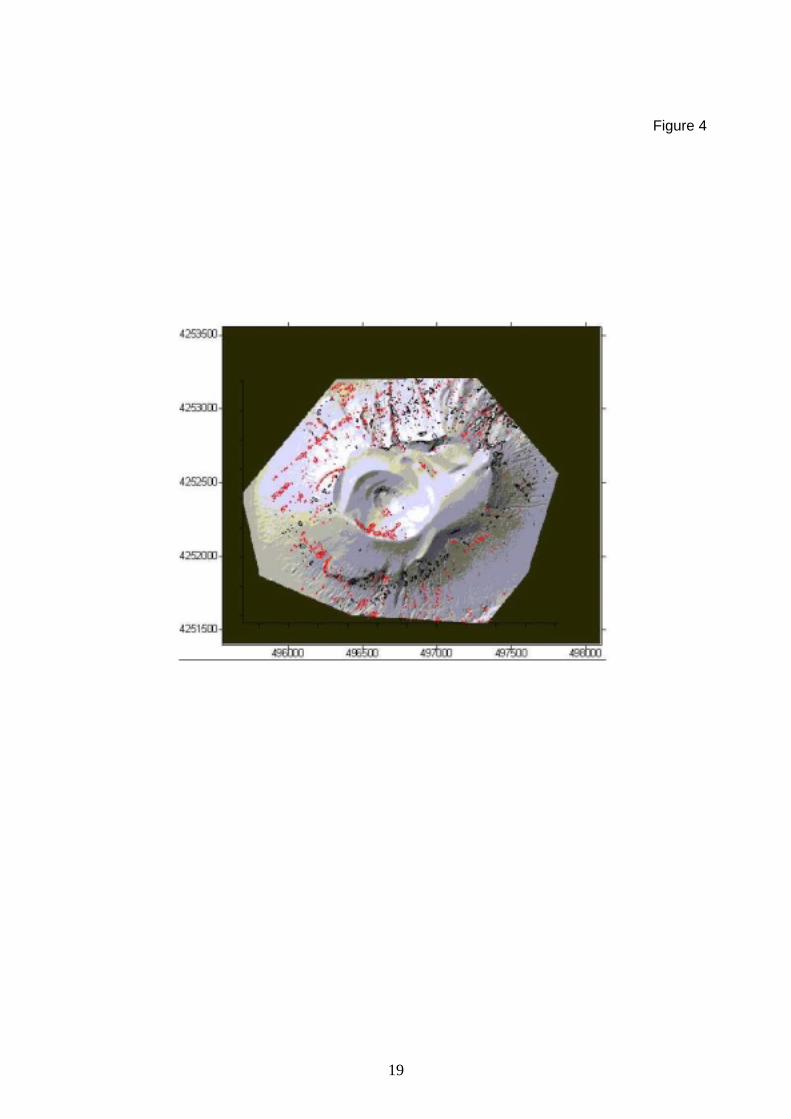
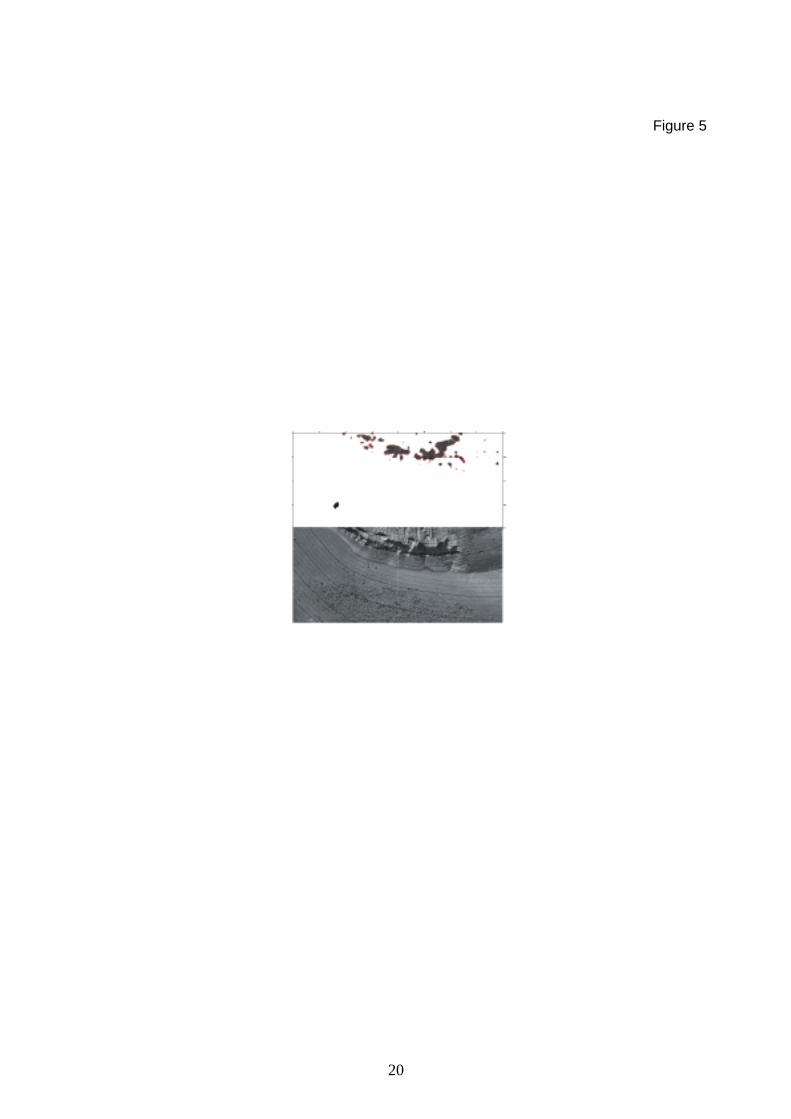
The comparison of the two DEM, performed over on an area of about 4 km2 covering the whole La Fossa cone, provided a standard deviation of the residuals of about 1 m, which reduces to 0.78 m if we consider only the central part of the cone. In Figure 4, the location of residuals greater than 2 meters are shown on the shaded relief image of the volcano: greater residuals are present in escarpment area (Figure 5) or, in general, where the morphology is uneven (crater walls, deeply carved gullies and footpath in wet surges, landslides, etc.)
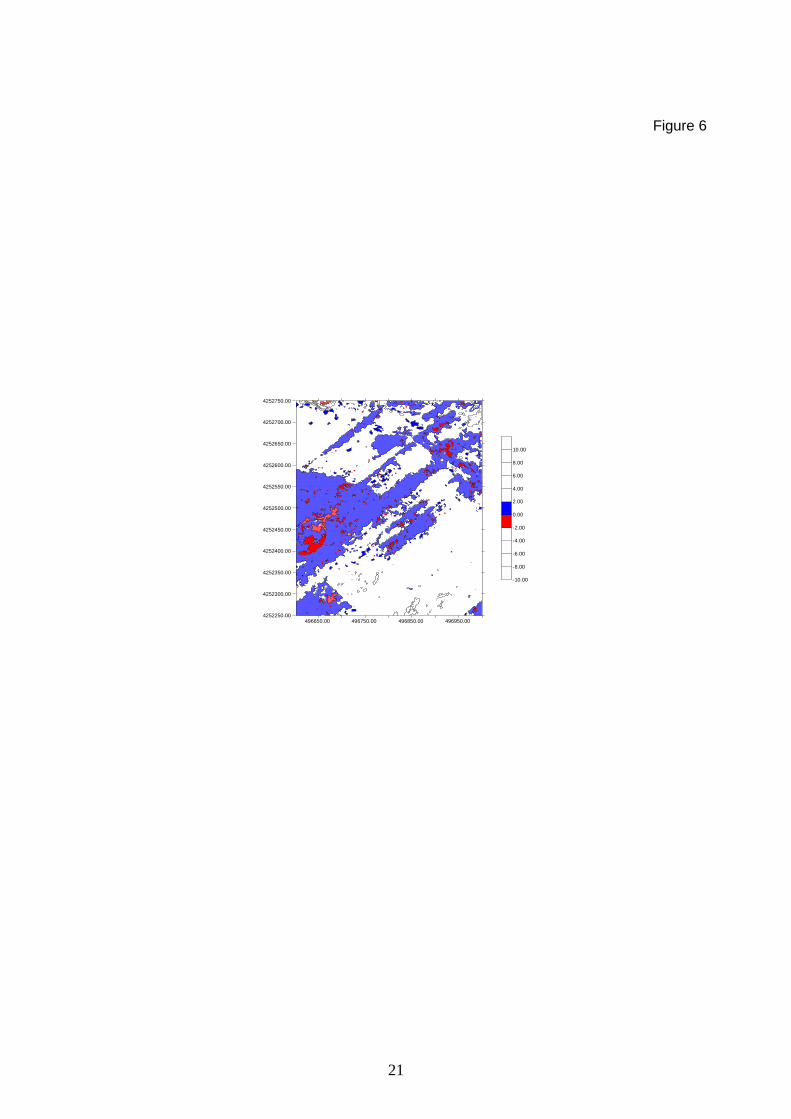
The occurrence of localized large residuals may be mainly attributed to shading and shadowing effects (concerning both illumination and visibility conditions) caused by small-scale irregularities of the terrain. Secondarily, other effects can be induced by the residual differences between the reference systems, which are more effective on corrugated and sloping areas. Figure 6 shows an enlarged view of the residual map corresponding to the northeastern part of the cone, where the residuals are mainly lower than � 2 m. Here it is clear the presence of a systematic effect along straight lines approximately orthogonal to the trajectory of the HRSC-A flight. This effect could be related to a noise signal present in the INS data with frequency components below the cut-off frequency of the high-pass filter. This effect does not appear again in the data acquired in campaigns performed after changes to the INS hardware.
External validation using kinematic GPS data
The kinematic GPS dataset collected during the 1997 survey data was adopted for controlling by means of independent field measurements the accuracy of the Digital Photogrammetry DEMs. The numeric comparison between the DPW_DEM and the HRSC-A_DEM (grid size of 1 m) with the GPS data was performed applying the method described in Baldi et al. (2000) and it confirms on the overall a good agreement. In the first case, about 6000 points mainly
distributed around the top of the La Fossa cone were selected and compared by interpolating the DEM heights at the GPS points: the observed residuals are in the range of +/- 50 cm with a standard deviation of 18 cm for DPW_DEM and 71 cm for HRSC-A_DEM.
The comparison between the two DEMs resulted in a standard deviation of 78 cm which equals the RMS sum of the two individual comparisons with the kinematic data, 18 cm for DPW_DEM and 71 cm for the HRSC_DEM, respectively. It should be noted that the respective standard deviations of the two DEM relative to the kinematic GPS data are consistent with the pixel sizes of the images used for DEM generation: the ratio of the mean pixel sizes is 3.6, while the ratio of the standard deviations for the two DEM, estimated from the cinematic GPS data, is 3.9. The slight deviation from strict proportionality may be partly attributed to the low-pass characteristics of DEM derived from smoother image data: in areas with uneven morphology, high frequency surface elements represented in the high-resolution GPS data will not be represented in the DEM, but average surface heights are provided instead. This is also supported by the higher internal accuracy estimates given by intersection accuracy (±40-±50 cm for the different image tracks).
The obtained standard deviations relative to the kinematic GPS data are 0.23 parts per thousand of the mean flight altitude above ground for the Wild camera (800 m) and 0.15 parts per thousand of the flight altitude for HRSC-A (4800 m). In later campaigns, using a high-end integrated GPS/INS navigation system, a thorough geometric validation of the HRSC-A has been performed: the results achieved from a flight altitude of 3000 m were compared to independent control points measured by ground based GPS and by aerotriangulation, using images acquired by a conventional aerial surveying camera (Wewel and Brand, 1999). A mean absolute accuracy of better than ±25 cm has been achieved (corresponding to 0.08 parts per thousand of the flight altitude), with mean vertical and horizontal accuracies of ±18 cm and ±13 cm. Thus, direct orientation measurement using a high-end GPS/INS navigation system applied in the recent configuration of HRSC is clearly considered more efficient than the GCP-based GPS/INS integration method applied in the Vulcano Island campaign.
5. Application to volcanic monitoring
The results obtained from the project on Vulcano Island demonstrates that large scale aerial photogrammetry can provide DEM at decimeter accuracy which can be employed for observing large deformation processes over volcanic areas. Techniques such as the one based on HRSC images applying digital data acquisition together with automated processing can also be used to observe very large areas (in the order of several hundreds of squared kilometers).
As previously mentioned, such high resolution DEM may have a major interest in the quantification of temporal topographic changes related with the volcanic activity and then in the understanding and modeling of volcanic processes.
Differential DEM
An interesting application of Digital Photogrammetry is its Differential use (DDP): for example, by comparison of DEMs relevant to two successive epochs, a matrix of height variations occurred in the observed area can be obtained. These result is representative for the vertical component of the deformation field, which can be also addressed to horizontal movements; in order to discriminate the two components, either artificial permanent targets or well shaped natural objects should be visible in the images (Zlotnicki et al., 1990).
Photogrammetric surveys can be frequently repeated allowing the observation of surface displacements caused by volcanic activities. Nevertheless, applications of differential photogrammetry on volcanic areas reported in the literature are still very few, as a consequence of the high effort previously required for the necessary fieldwork and data processing. The availability of direct sensor positioning and orientation systems, based on GPS and INS, has made this technique more easily applicable on volcanic areas. The possibility of defining the parameters of the deformation source/s is generally limited to those cases in which the sources are shallow and affect small areas.
With respect to the maps of ground movements obtained using DInSAR techniques, the DDP is candidate both as a method for its validation and as a tool to integrate SAR results.
On the Vulcano test area, the differential DEM method performed from the 1996 and 1997 airborne surveys, revealed that large residuals are mainly distributed in unst able areas. Considering that time interval between the two image flights is about one year, mass movements that could have occurred in between may be considered as a possible source for these large residuals. In Figure 6, where a detail of the southern rim of the La Fossa crater is shown, the location of greater height differences in an escarpment area is evident.
Application to SAR interferometry
We recently conducted a SAR interferometry study on Vulcano with the aim to evaluate the conditions of application of this technique for ground deformation studies (Rémy, 1999). Twelve ERS-1 and ERS-2 ascending orbits images acquired between 1992 to 1997 were used and 66 interferograms (Table 3) were generated using the Diapason software (CNES, 1996). In order to indicate the relevancy of the computed interferograms, we determined a quality code (1 to 4) based on the level of coherency between two epochs (i.e. amount and distribution of visible coherent pixels in the differential interferograms). Most of the combinations with low altitude of ambiguity (typically less than 30 meters) or with time interval greater than 6 months were not enough coherent to be further analyzed and only fourteen interferograms (with quality code greater than 1) can be considered as relevant for an interferometric study
In order to evaluate the improvement of DEM accuracy in the generation of interferograms, we
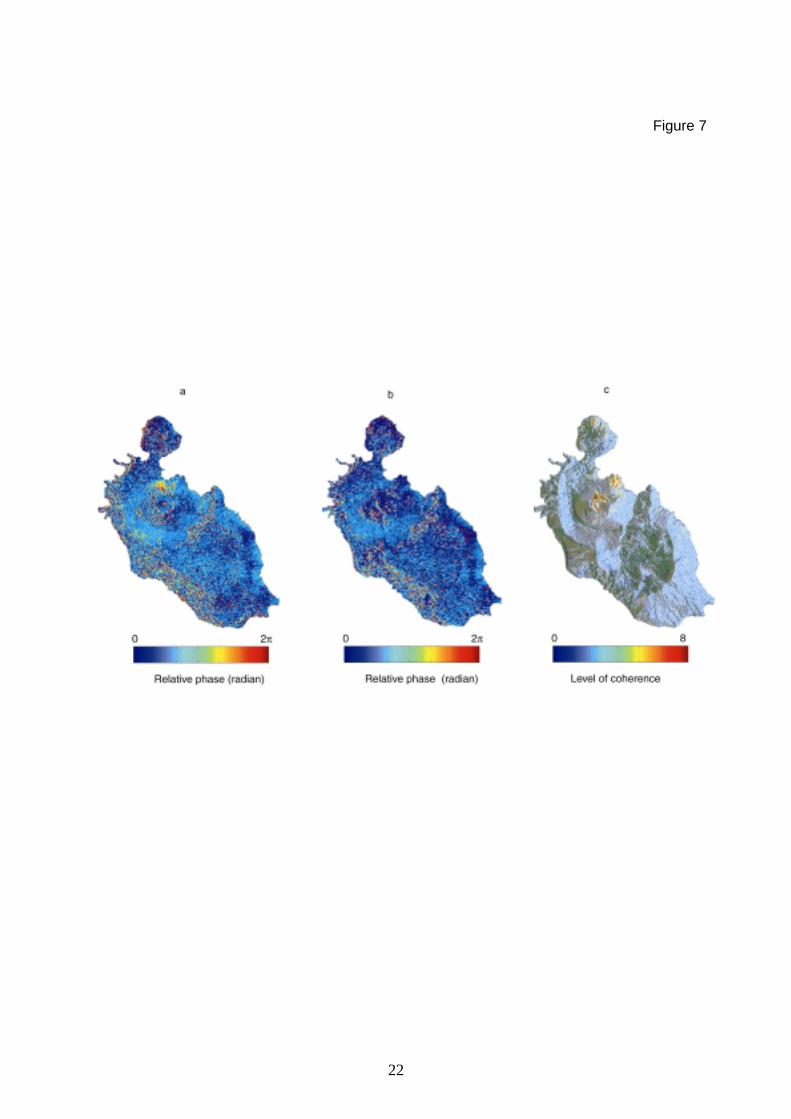
retained the best combination characterized by the highest quality code (4) and the shorter time interval (1-day). Using this tandem pair (ERS-1_25167 and ERS-2_05494), we synthesized two interferograms using two distinct DEMs: the first derived from the digitalization of contour lines on a 1:25000 scale map and the second obtained by the photogrammetric data described above. Both DEMs were interpolated with the same spatial resolution of 20 m for the interferometric processing. The resulting interferograms are shown on figures 7a and 7b.
The image of phase residuals computed with the accurate DEM (figure 7b) is characterized by a flatter response and a lower level of noise compared to figure 7a. In order to quantify the magnitude of this improvement, we computed the images of coherence, using the gradient method proposed by Beauducel et al. (2000). It consists in computing within a 3x3-pixel square the phase differences between the central pixel and the eight contiguous ones. By comparing with a threshold value of phase difference, it led to define a level of coherence to each pixel of the interferogram (ranged between 0 to 8 from low to high coherence). On Table 4 are summarized the results of the coherence distribution computed from figures 7a and 7b. It can be observed that the highest coherent area (levels 7 and 8) slightly increases when using the precise photogrammetric DEM. In addition, one can see that a short wavelength residual effect pointed out north of La Fossa crater on figure 7a does not appear on figure 7b. This signal can be unambiguously related with local differences between the two DEMs: this area corresponds to landslide (Forgia Vecchia crater) which occurred after the production of the digitized map. This example highlights the importance of using precise DEM at large and local scales to obtain differential phase images relevant for ground deformation studies.
Such accuracy is especially required to detect low amplitude deformations occurring over long time periods. With the aim to investigate the areas where such technique could be applied on Vulcano Island, we processed the 14 selected interferograms using the accurate HRSC photogrammetric DEM. By stacking the individual image of coherence as previously defined, we computed a coherence map of the whole island (figure 7c). This map provides the distribution of pixels keeping the same level of coherence over various periods of time. The yellow and red colors (good and very good coherence respectively) indicate the areas where the coherence is maintained during the 1992-1997 period. It can be noted that the coherence is quite low compared to other sites were such analysis was performed as for instance on Etna in Italy (Briole et al., 1997; Beauducel et al, 2000) or on Cotopaxi in Ecuador (Remy, 1999). This result can be explained by the presence on the island of a large amount of areas were the coherency between images cannot be maintained with time (presence of vegetation, steep slope, etc.). The map points out three fairly coherent zones: the rim of the La Fossa crater, the north east seaward part of La Fossa volcanic cone and the north part of the island (Vulcanello). They define the areas where further investigations using remote sensing techniques and ground deformation networks might be successfully combined.
6. Conclusions
The performance of two distinct photogrammetric techniques for DEM generation has been analyzed and compared over a test area on Vulcano. The results show that sub-meter accuracy, controlled by independent GPS observations, can be easily assessed by applying digital image processing. Automatic procedures for data processing that are provided by digital photogrammetric workstations have significantly reduced the needs for interactive processing. The results obtained from digitized images and from the HRSC-A camera are comparable at large scale, but the digitized images provide better resolution at local scale. Digital mapping products, like DEMs and orthoimages, provide a valuable tool for monitoring geodynamic active areas such as volcanoes. Thanks to capacity of acquiring repeated observations in time with such high resolution, they offers new potentialities in volcano monitoring especially to remotely control dangerous areas, where ground based measurements can be greatly reduced by means of GPS/INS platform operating on the aircraft. Applied to the calculation and analysis of SAR interferograms, our study points out that the use of high resolution DEM improves significantly the quality of the interferograms by increasing the number of coherent pixels in the scene.
Acknowledgments
Concerning HRSC-A data acquisition and data processing, the contributions of the HRSC-A team at DLR Berlin, specifically Matthias Brand, Sergej Sujew, Thomas Roatsch, Joachim Flohrer, and Frank Scholten are gratefully acknowledged. The Italian Gruppo Nazionale Vulcanologia supported the Vulcano Photogrammetry Project. The SAR data were provided by the European Space Agency (ESA) through the Istituto Nazionale di Geofisica, Roma. We thank François Beauducel (IPGP) and Nadine Pouthier (CNES) for helpful discussions on the SAR interferometry data processing and analysis and Christine Deplus and Germinal Gabada for constructive discussions about kinematic GPS data analysis. This study was supported by the French "programme national de prevention des risques naturels (PNRN)" and by the Département Milieux et Environnement of IRD. We benefited of the help of the Research Group on SAR interferometry (CNRS-GDR InSar).
REFERENCES
ACHILLI, V., ANZIDEI, M., BALDI, P., MARSELLA, M., MORA, P., TARGA, G., VETTORE, A., and VITTUARI, L., 1997. GPS and Digital Photogrammetry: an Integrated Approach for Monitoring Ground Deformations on a Volcanic Area Proceedings of ISPRS WG VI/3 "International Cooperation & Technology Transfer" Meeting - Padova, 1-5.
ACHILLI, V., BALDI, P., BARATIN, L., BONINI, C., ERCOLANI, E., GANDOLFI, S., ANZIDEI, M., and RIGUZZI, F., 1998, Digital photogrammetry survey on the island of Vulcano, Acta Vulcanologica, 10,1,1-5.
ALBERTZ, J., 1998, The Geometric Restitution of Line Scanner Imagery Three Decades of Technical Development, Wissenschaftliche Arbeiten der Fachr. Vermessungswesen Univ. Hannover, 227, 25-34.
BALDI, P., MARSELLA, M., and VITTUARI, L., 1998, Airborne GPS Performance during a Photogrammetric Project. IAG Scientific Assembly - Rio de Janeiro 3-9 September. IAG Proceedings series, Springer Verlag, 118, 343-348.
BALDI, P., BONVALOT, S., BRIOLE, P. and MARSELLA, M., 2000, Digital photogrammetry and kinematic GPS for monitoring volcanic areas. Geophysics J. Int., 142, 3, 801-811.
BEAUDUCEL, F., BRIOLE, P. and FROGER, J.L., 2000, Volcano wide fringes in ERS synthetic aperture radar interferograms of Etna. Journal of Geophysical Research, 105,B7, 16391-16402.
COLOMINA, I., 1993, A note on the Analytic of Aerial Triangulation with GPS Aerial Control. Photogrammetric Engineering & Remote Sensing, 59, 1619-1624.
CNES (Centre National d’études Spatiales), 1996, Philosophie et mode d’emploi de la chaîne logicielle interférométrique DIAPASON, Toulouse, France.
DEPLUS, C. and BRIOLE, P., 1997, Mesure de profils par GPS cinématiques. Résultat d’un test effectué en Crête en Octobre 1996. Internal report IPG Paris.
FRAZZETTA, G. and LA VOLPE, L., 1991, Volcanic history and maximum expected eruption at "La Fossa Vulcano" (Aeolian Islands, Italy). Acta Vulcanol., 1, 107-115.
GWINNER, K., HAUBER, E., HOFFMANN, H., SCHOLTEN, F., JAUMANN, R., NEUKUM, G., COLTELLI, M. and PUGLISI, G., 1999, The HRSC-A Experiment on High Resolution Imaging and DEM Generation at the Aeolian Islands. Proc. 13th Int. Conf. Applied Geologic Remote Sensing, Vancouver, Canada, I, 560-569.
GWINNER, K., LEHMANN, H. and . ALBERTZ., 2000, The Topographic Image Map Fossa di Vulcano 1: 5000 – A Digital Mapping Approach based on High Resolution Stereo Camera-Airborne Imagery. International Archives of Photogrammetry and Remote Sensing, 23, B4, 63-69.
HEIPKE, C., 1995. State-of-the-art of Digital Photogrammetric Workstations for Topographic Applications. Photogrammetric Engineering and Remote sensing, 61, 49-56.
HUTTON, J. and LITHOPOULOS, E., 1998, Airborne Photogrammetry using Direct Camera Orientation Measurements. Photogrammetrie-Fernerkundung-Geoinformation, E. Schweizerbart’sche Verlagsbuchhandlung, Stuttgart, Germany, 6, 363-370.
MASSONNET, D., and FEIGL, K.L., 1998, Radar interferometry and its application to changes in the Earth’s surface. Reviews of Geophysics, 36,441-500.
MULLER, S., HELAVA, U.V. and DEVENECIA K., 1995, Softcopy photogrammetric workstations, Photogrammetric Engineering & Remote Sensing, 61, 1, 49-56.
NEUKUM, G., OBERST, J., SCHWARZ, G., FLOHRER, J., SEBASTIAN, I., JAUMANN, R., HOFFMANN, H., CARSENTY, U., EICHENTOPF and K., PISCHEL R., 1995, The Multiple Line Scanner Camera Experiment for the Russian Mars96 Mission: Status Report and Prospect for the Future. Photogrammetric Week ´95 (Eds. Fritsch and Hobbie), Wichmann, Heidelberg, 45-61.
NEUKUM, G, 1999 The Airborne HRSC-A: Performance Results and Application Potential, in: Photogrammetric Week, Eds. Fritsch, D. and Spiller, R., Stuttgart.
REMY, D., 1999, Application de l’interferometrie radar à l’étude de volcans actifs. Rapport de DEA, Université de Marne la Vallée, ENSG/ENST, pp.1-50.
SCHOLTEN, F., 1996, Automated Generation of Coloured Orthoimages and Image Mosaics Using HRSC and WAOSS Image Data of the Mars96 Mission. International Archives of Photogrammetry and Remote Sensing, 31, B2, 351-356.
TINTI, S., BORTOLUCCI, E. and ARMIGLIATO, A., 1999, Numerical simulation of the landslide-induced tsunami of 1988 on Vulcano Island, Italy. Bull. Volcanol., 61, 121-137.
VILLARI, L., 1994, Data related to eruptive activity, unrest phenomena and other observations on the Italian active Volcanoes. Acta Vulcanologica, 6, 51-63.
WEWEL, F. and BRAND, M., 1999, Geometrische Validierung des hochauflösenden multispektralen Mehrzeilen-Stereoscanners HRSC-A. Publikationen der Deutschen Gesellschaft für Photogrammetrie und Fernerkundung (Berlin), 7, 245-252.
WEWEL, F., SCHOLTEN, F., and GWINNER, K., 2000, High Resolution Stereo Camera – Multispectral 3D - Data Acquisition and Photogrammetric Data Processing. Canadian Journ. Remote Sensing, 26, 5.
WEWEL, F., 1996, Determination of Conjugate Points of Stereoscopic Three Line Scanner Data of Mars96 Mission. International Archives of Photogrammetry and Remote Sensing, 31, B3, 936-939.
ZEBKER, H.A., ROSEN, P.A., and HENSLEY, S., 1997. Atmospheric effects in interferometric synthetic aperture radar surface deformation and topographic maps. Journal of Geophys. Res., 102, B4, 7547-7563.
ZLOTNICKI, J., RUEGG, J.C., BACHELEY and P., BLUM, P., 1990, Eruptive mechanism on Piton de la Fornaise volcano associated with the December 4, 1983, and January 18, 1984 eruption from ground deformation monitoring and photogrammetric surveys. Journal of Volcanology and Geothermal Res., 40,197-217.
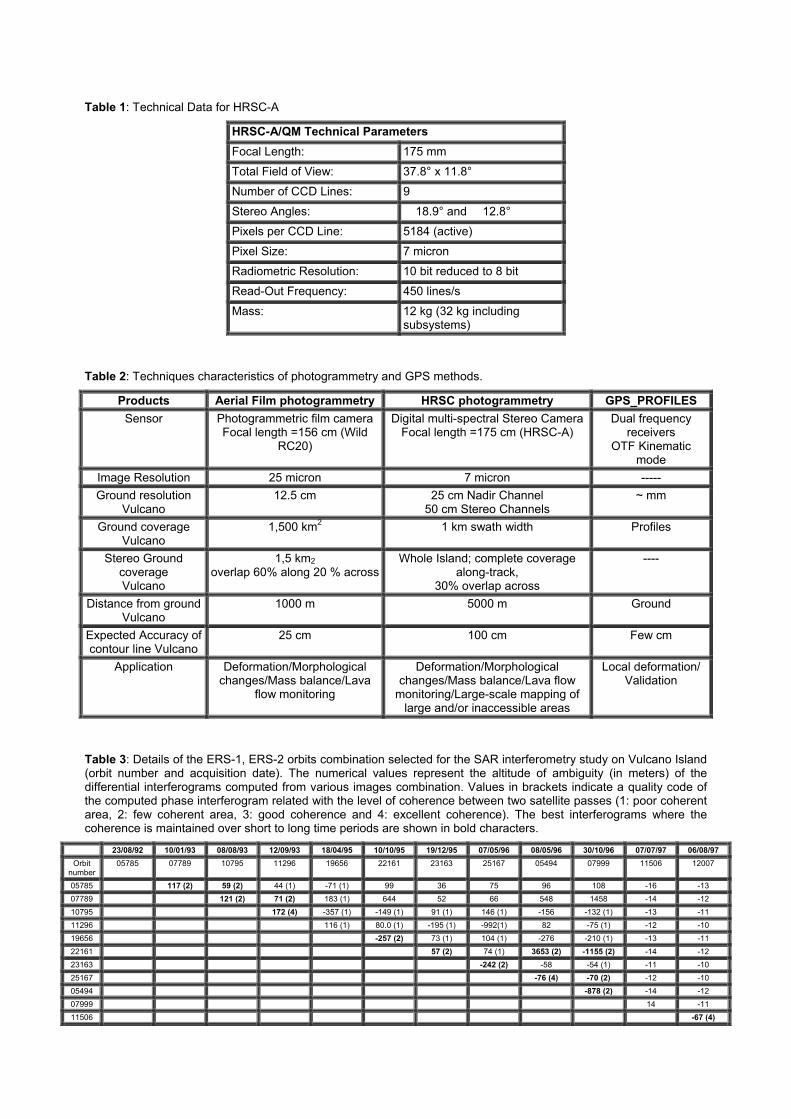
Table 1: Technical Data for HRSC-A
HRSC-A/QM Technical Parameters Focal Length: 175 mm Total Field of View: 37.8° x 11.8° Number of CCD Lines: 9 Stereo Angles: � 18.9° and � 12.8° Pixels per CCD Line: 5184 (active) Pixel Size: 7 micron Radiometric Resolution: 10 bit reduced to 8 bit Read-Out Frequency: 450 lines/s Mass: 12 kg (32 kg including
subsystems)
Table 2: Techniques characteristics of photogrammetry and GPS methods.
Products Aerial Film photogrammetry HRSC photogrammetry GPS_PROFILES Sensor Photogrammetric film camera
Focal length =156 cm (Wild RC20)
Digital multi-spectral Stereo Camera Focal length =175 cm (HRSC-A)
Dual frequency receivers
OTF Kinematic mode
Image Resolution 25 micron 7 micron ----- Ground resolution
Vulcano 12.5 cm 25 cm Nadir Channel
50 cm Stereo Channels ~ mm
Ground coverage Vulcano
1,500 km2 1 km swath width Profiles
Stereo Ground coverage Vulcano
1,5 km2 overlap 60% along 20 % across
Whole Island; complete coverage along-track,
30% overlap across
----
Distance from ground Vulcano
1000 m 5000 m Ground
Expected Accuracy of contour line Vulcano
25 cm 100 cm Few cm
Application Deformation/Morphological changes/Mass balance/Lava
flow monitoring
Deformation/Morphological changes/Mass balance/Lava flow
monitoring/Large-scale mapping of large and/or inaccessible areas
Local deformation/ Validation
Table 3: Details of the ERS-1, ERS-2 orbits combination selected for the SAR interferometry study on Vulcano Island (orbit number and acquisition date). The numerical values represent the altitude of ambiguity (in meters) of the differential interferograms computed from various images combination. Values in brackets indicate a quality code of the computed phase interferogram related with the level of coherence between two satellite passes (1: poor coherent area, 2: few coherent area, 3: good coherence and 4: excellent coherence). The best interferograms where the coherence is maintained over short to long time periods are shown in bold characters.
23/08/92 10/01/93 08/08/93 12/09/93 18/04/95 10/10/95 19/12/95 07/05/96 08/05/96 30/10/96 07/07/97 06/08/97 Orbit
number 05785 07789 10795 11296 19656 22161 23163 25167 05494 07999 11506 12007
05785 117 (2) 59 (2) 44 (1) -71 (1) 99 36 75 96 108 -16 -13 07789 121 (2) 71 (2) 183 (1) 644 52 66 548 1458 -14 -12 10795 172 (4) -357 (1) -149 (1) 91 (1) 146 (1) -156 -132 (1) -13 -11 11296 116 (1) 80.0 (1) -195 (1) -992(1) 82 -75 (1) -12 -10 19656 -257 (2) 73 (1) 104 (1) -276 -210 (1) -13 -11 22161 57 (2) 74 (1) 3653 (2) -1155 (2) -14 -12 23163 -242 (2) -58 -54 (1) -11 -10 25167 -76 (4) -70 (2) -12 -10 05494 -878 (2) -14 -12 07999 14 -11 11506 -67 (4)
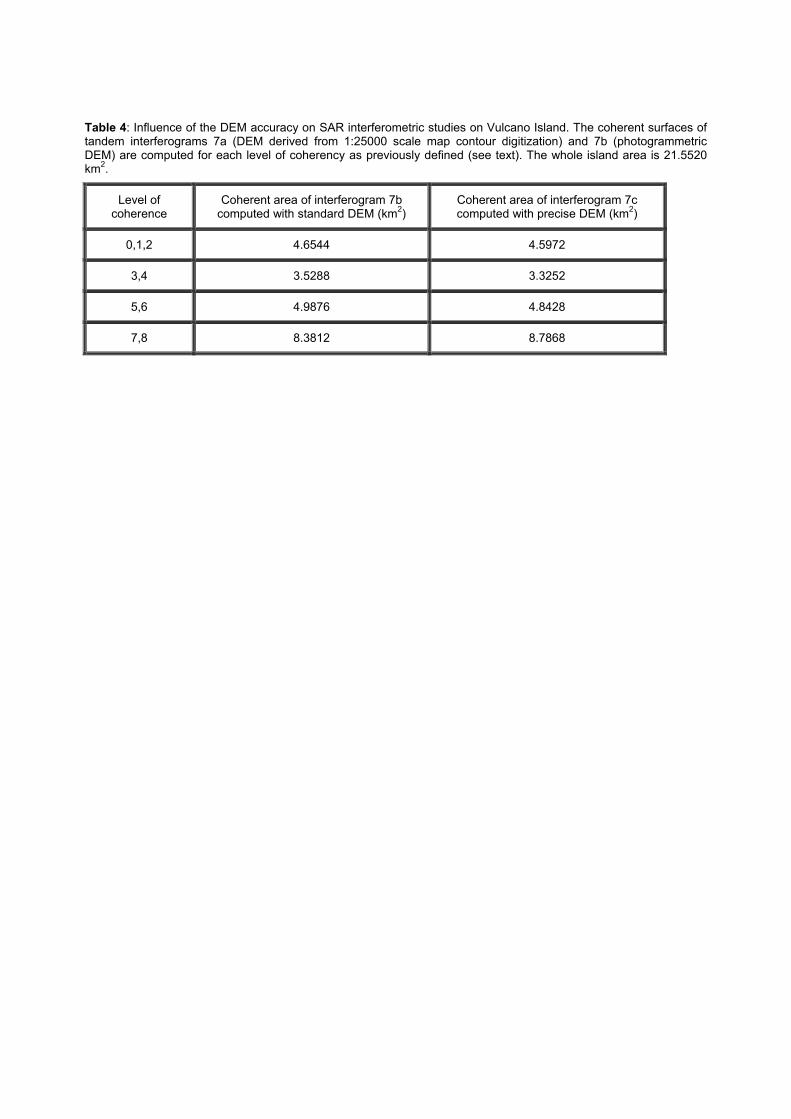
Table 4: Influence of the DEM accuracy on SAR interferometric studies on Vulcano Island. The coherent surfaces of tandem interferograms 7a (DEM derived from 1:25000 scale map contour digitization) and 7b (photogrammetric DEM) are computed for each level of coherency as previously defined (see text). The whole island area is 21.5520 km2.
Level of coherence
Coherent area of interferogram 7b computed with standard DEM (km2)
Coherent area of interferogram 7c computed with precise DEM (km2)
0,1,2 4.6544 4.5972
3,4 3.5288 3.3252
5,6 4.9876 4.8428
7,8 8.3812 8.7868
Figure captions
Figure 1: An aerial view of the Vulcano Island obtained combining 1:10000 photographs acquired during the Photogrammetric Project in 1996.
Figure 2: (a) shaded relief view of the DEM obtained by processing with the Helava DPW the digitized film-camera images (DPW_DEM); (b) view of the DEM obtained with the HRSC (HRSC_DEM).
Figure 3: Comparison between the shaded relief image of a small test area obtained starting from the two original DEM (1x1m) derived by HRSC-A (a) and film camera photogrammetry (b)
Figure 4: Location of residuals greater than 2 meters (residuals -2 m (red) or greater than +2 m (black))
Figure 5: An enlarged view of the southern rim of the La Fossa crater showing a more detailed description of the location of residuals greater of 2 m.
Figure 6: Evidence of the distribution of residual along lines approximately orthogonal to the trajectory of the HRSC flight.
Figure 7a: Tandem phase interferogram computed with ERS-1 and ERS-2 orbits: 25167 (07/05/96) and 05494 (08/05/1996) respectively. The topographic contribution has been removed using a low resolution DEM generated by contour map digitalization (and interpolated with a spatial resolution of 20 meters). The short wavelength signal north of the active crater corresponds to inaccuracies in the DEM in the area of Forgia Vecchia crater where recent topographic changes related to a landslide event that occurred (not visible on figure 7b).
Figure 7b: Same as figure 7b using the accurate HRSC-A photogrammetric DEM (this paper). The image of phase residuals exhibits a flat response with a low level of noise in comparison with figure 7a.
Figure 7c: Image of coherent areas resulting from the stacking of the 14 best interferograms selected on Vulcano Island on a total number of 66 interferograms (see table 3 for details). The color scale indicates the degree of stability with time of coherent pixels. Yellow and red areas delimitate zones where high coherence is maintained during times (up to five years).
16
Figure 1
17
Figure 2
18
Figure 3
19
Figure 4
20
Figure 5
21
Figure 6
496650.00 496750.00 496850.00 496950.004252250.00
4252300.00
4252350.00
4252400.00
4252450.00
4252500.00
4252550.00
4252600.00
4252650.00
4252700.00
4252750.00
-10.00
-8.00
-6.00
-4.00
-2.00
0.00
2.00
4.00
6.00
8.00
10.00
22
Figure 7